Embed Size (px)
Citation preview

The capabilities and limitations of conductance-basedcompartmental neuron models with reduced branchedor unbranched morphologies and active dendrites
Eric B. Hendrickson & Jeremy R. Edgerton &
Dieter Jaeger
Received: 8 April 2010 /Revised: 24 May 2010 /Accepted: 22 June 2010 /Published online: 10 July 2010# The Author(s) 2010. This article is published with open access at Springerlink.com
Abstract Conductance-based neuron models are frequentlyemployed to study the dynamics of biological neuralnetworks. For speed and ease of use, these models areoften reduced in morphological complexity. Simplifieddendritic branching structures may process inputs differentlythan full branching structures, however, and could thereby failto reproduce important aspects of biological neuralprocessing. It is not yet well understood which processingcapabilities require detailed branching structures. Therefore,we analyzed the processing capabilities of full or partiallybranched reduced models. These models were created bycollapsing the dendritic tree of a full morphological model of aglobus pallidus (GP) neuron while preserving its total surfacearea and electrotonic length, as well as its passive and activeparameters. Dendritic trees were either collapsed into singlecables (unbranched models) or the full complement of branchpoints was preserved (branched models). Both reductionstrategies allowed us to compare dynamics between allmodels using the same channel density settings. Fullmodel responses to somatic inputs were generallypreserved by both types of reduced model while dendritic
input responses could be more closely preserved bybranched than unbranched reduced models. However,features strongly influenced by local dendritic inputresistance, such as active dendritic sodium spike generationand propagation, could not be accurately reproduced by anyreduced model. Based on our analyses, we suggest thatthere are intrinsic differences in processing capabilitiesbetween unbranched and branched models. We alsoindicate suitable applications for different levels ofreduction, including fast searches of full model parameterspace.
Keywords Simulation . Computational modeling .
Conductance .Morphology . Globus pallidus .
Synaptic integration
1 Introduction
Single cell computer models can provide important insightsinto the mechanisms of neuronal processing. ‘Full models’possessing morphologically complete dendritic trees havehelped to elucidate many key functions of dendriticcomputation, for example by showing that the extent ofaction potential back propagation depends on the degree ofdendritic branching (Schaefer et al. 2003). Furthermore,dendritic sub-branches have been shown to independentlyregulate channel densities (Losonczy et al. 2008). Due tohigh computational requirements, full models are frequentlyreplaced in network simulations and even in the explorationof single neuron properties by ‘reduced’ models possessingfewer compartments and simplified dendritic branchingstructures (Herz et al. 2006). For example, reduced modelswere used to study the control of burst firing by dendriticNMDA receptor activation (Kuznetsov et al. 2006) and the
Action Editor: Frances K. Skinner
Electronic supplementary material The online version of this article(doi:10.1007/s10827-010-0258-z) contains supplementary material,which is available to authorized users.
E. B. HendricksonBiomedical Engineering Department, Georgia Inst of Tech,313 Ferst Dr,Atlanta, GA 30332, USA
E. B. Hendrickson : J. R. Edgerton :D. Jaeger (*)Department of Biology, Emory University,1510 Clifton Rd. NE,Atlanta, GA 30322, USAe-mail: [email protected]
J Comput Neurosci (2011) 30:301–321DOI 10.1007/s10827-010-0258-z

reliance on dendritic T-currents for low-threshold Ca2+
spiking (Destexhe et al. 1998). Computationally efficientreduced models are also particularly useful for thesimulation of large networks of neurons and have beenused, for example, to study gamma-frequency synchroni-zation through dendro-dendritic gap junctions (Traub et al.2001).
While cable theory has shown that many features ofproperly constrained passive models can be analyticallypreserved by reduced structures (Burke 2000; Rall et al.1992), some features of full passive models cannot bepreserved by reduced morphologies. For instance, non-uniform synaptic distributions are by definition impossibleto implement in reduced morphologies with a singledendritic compartment but have been shown to providevariation in both the resting membrane potential and theeffectiveness of distal synaptic inputs (Holmes and Woody1989). With the addition of voltage and calcium gatedconductances in activemodels, the potential to lose processingcapabilities when reducing morphological complexity onlyincreases (Rall et al. 1992). Therefore, a clear understandingof the limitations of reduced active models with and withoutthe preservation of the detailed branching structure of a fullmodel is highly desirable in order to reach biologically validconclusions regarding network computation.
In the present study, we used a previously characterizedfull GP neuron model (Gunay et al. 2008) to conduct adetailed analysis of the limitations of two types of modelreduction strategies. The full GP model has extended thindendrites with multiple active conductances, which makesit a good test case for possible limitations resulting frommodel reduction. We compared two principled strategies ofmodel reduction that can be applied to full morphologies ofall cell types. The first strategy preserved the detailedbranching structure of the full model, while the secondstrategy only preserved the surface area and electroniclength of each major dendritic branch by collapsing sub-branches. We found that both branched and unbranchedmodel morphologies could retain many properties such asspike waveforms and fI curves of the full model withoutadjusting channel densities. However, when the morphologywas reduced to a small number of compartments, detailedspike waveforms showed pronounced mismatches due todifferences in axial current flow. Model properties dependenton local dendritic interactions between inputs and activeconductances could not be fully maintained even in modelswith branched dendrites due to unavoidable local inputimpedance mismatches between full and reduced models.Overall, our analysis provides clear guidelines to thelimitations of reduced models and highlights specific aspectsof synaptic processing requiring full branching structures.Furthermore, we show that our reduced models can success-fully reproduce many integrative properties of full models.
Indeed, given the reduction strategies that we used,identical channel density settings can be used in bothfull and reduced morphologies to produce the similardynamics. In particular, we show that our unbranchedreduced models with >10 compartments can reproducefull model somatic input output dynamics, which allowsthem to be used as fast search engines of the full modelparameter space.
2 Methods
2.1 Full morphological GP neuron model
Previously, we have described the construction and validationof a database of full GP models (Gunay et al. 2008). Modelswere constructed with three dendritic morphologies, whichwere obtained using Neurolucida (MicroBrightField, Inc.,Williston, VT) reconstructions of biocytin filled rat GPneurons in slice. One of these morphologies (s34 in Gunayet al. 2008) was selected for the full GP model used in thisstudy: this morphology contained a soma and 511 dendriticcompartments. The passive parameters for this morphologywere optimized in a previous study of ours in order to fit theresponses of the recorded cell (s34 in Gunay et al. 2008) tobrief somatic current injection pulses (Hanson et al. 2004).As in Hanson et al. 2004 and Gunay et al. 2008, thepassive properties in all compartments were set to theiroptimized values for this morphology: Rm (specificmembrane resistance)=1.47 Ω-m2, Cm (specific membranecapacitance)=0.024 F/m2, and Ra (specific axial resistance)=1.74 Ω-m. Each somatic and dendritic compartment of the fullmodel also contained 11 different voltage and calcium gatedion channels: these were fast sodium (NaF), persistent sodium(NaP), slow activating delayed rectifier (Kv2), fast activatingincompletely inactivating potassium (Kv3), low voltageactivated potassium (Kv4fast and Kv4slow), KCNQ familypotassium (KCNQ), calcium activated potassium (SK), highvoltage activated calcium (CaHVA), and H-current (HCNfast
and HCNslow). All dendritic compartments were given thesame conductance density for each channel (i.e. no gradients).A full description of channel kinetics is given in supplementalTables S1 and S2 (Online Resource 1). See Gunay et al.2008 for the process of parameter tuning.
Axons are generally not reconstructed from neuronsrecorded in brain slices, because the slicing procedure oftensevers the axon close to the soma. This was the case in ourGP reconstructions as well, and therefore our study of fullGP model properties employed a default axon comprised ofmultiple nodal and internodal segments (Gunay et al. 2008).Here, we replaced this artificial axon with a single axonalcompartment so that it could be directly transferred to thereduced models without greatly increasing morphological
302 J Comput Neurosci (2011) 30:301–321

complexity. This replacement required a recalibration ofaxonal and somatic channel densities (SupplementalTable S3, Online Resource 1) in order to preserve theoriginal model activity that was tuned to match slicerecordings.
The tuned parameter set used for most of this studycontained a medium level of dendritic sodium conductance(gNa consisting of 40 S/m2NaF and 1 S/m2NaP) which wasnot sufficient to support dendritic spike initiation. However,dendritic spike initiation has been recorded in GP (Hansonet al. 2004) and other neuron types, and represents animportant possible mode of synaptic integration in vivo.Therefore, dendritic spike initiation and other responseswere compared between the full and reduced models usingan alternative to the tuned parameter set which contained ahigh level of dendritic gNa (800 S/m2 of dendritic NaF and1 S/m2 of dendritic NaP). This dendritic gNa densityallowed frequent spike initiation with appropriate dendriticstimulation (Supplemental Fig. S3, Online Resource 1). Toassess the contribution of both levels of dendritic gNa tomismatches between the full and reduced models, a secondalternative parameter set was used which contained nodendritic gNa. Model responses with both alternativeparameter sets were described in the text or shown insupplemental figures when there were important differenceswith the results using the tuned parameter set.
2.2 Morphological reductions
We collapsed the dendritic tree of the full GP model inorder to study which full model activities could be matchedby morphologically reduced models. Morphological reduc-tion could lead to functional mismatches with the fullmodel for two main reasons: first, by definition, morpho-logical reduction must cause a decrease in the number ofcompartments and an increase in average compartment sizethat may not adequately represent voltage gradients incylinders; second, morphological reduction could cause aloss of the detailed branching structure of the full model. Todistinguish between these two possible causes of activitychanges, two types of reduced models were created. Thefirst type required dozens of compartments in order topreserve the detailed branching structure of the full model(Fig. 1(b), ‘branched’ reduced models), while the secondtype required only a few compartments because it did notpreserve the detailed branching structure (Fig. 1(c),‘unbranched’ reduced models).
To create the branched reduced models, groups of fullmodel dendritic compartments which did not span branchpoints were identified: there were 39 such groups. Eachgroup of compartments was converted into a singlecompartment such that the total surface area (TSA) andend to end electrotonic length (L) were preserved. TSAwas
(a)
(c)
(b)
Fig. 1 Methods of morphological reduction. To aid visualization,dendritic diameters are multiplied by 5 while soma diameters aremultiplied by 2. Mean and maximum compartment electrotoniclengths (L) are provided for each model to facilitate comparisons ofstructure across model types. (a) The full GP model (green) has 513compartments: these include 511 dendritic compartments, an axoncompartment, and a soma. (b) To create the simplest ‘branched’reduced model (41comp, orange), the soma and axon compartmentwere unaltered while each group of compartments in the full model’sdendritic tree not containing any branch points was collapsed into onedendritic compartment with the same total surface area and totalelectrotonic length (see Methods). The dendrites of the 41comp modelwere then divided lengthwise into equal parts until no dendritic
compartment in the model was longer than 0.2 L (59comp, magenta)or 0.1 L (93comp, red). (c) To create the first ‘unbranched’ reducedmodel (5comp, cyan), each major branch of the full model’s dendritictree was collapsed into a single dendritic compartment whichpreserved the total surface area and average soma-to-tip electrotonicdistance for that major branch (see Methods). To create the 14comp(turquoise), 50comp (purple), and 98comp (blue) models, eachdendritic compartment of the 5comp model was divided lengthwiseinto 4, 16, and 32 pieces, respectively. All conductance densities andpassive parameters were preserved in each reduced model. The colorscheme used in this figure was consistently applied to all remainingfigures
J Comput Neurosci (2011) 30:301–321 303

preserved in order to maintain active current densities andcell input resistance (Destexhe 2001; Tobin et al. 2006),while L was preserved because the electrotonic structure ofa neuron strongly affects the integration of synaptic inputand dendritic attenuation of somatic voltage signals (Burke2000; Destexhe 2001). Holding all passive parametersincluding Rm and Ra fixed, the TSA and L for a givengroup were used to calculate the length (l) and radius (r) ofthe corresponding reduced model compartment using thefollowing two equations:
L ¼ l
ffiffiffiffiffiffiffiffiffiffiffi
2»Ra
Rm»r
r
ð1Þ
TSA ¼ 2»p»r»l ð2Þ
Including the soma, the axon compartment, and the 39dendritic compartments generated this way, the simplestbranched reduced model had 41 compartments (Fig. 1(b),‘41comp’ orange model). The 41comp model possessedsome compartments that were quite electrotonically extendedand could prevent the 41comp model from matching certainfull model responses. Therefore, the 41comp model’sextended dendritic compartments were divided such thatnone was longer than 0.2 L (Fig. 1(b), ‘59comp’ model) or0.1 L (Fig. 1(b), ‘93comp’ model).
While the branched reduced models maintained the TSAand L of all detailed branches of the full model, theunbranched reduced models only maintained the TSA andL of each of the three major branches. It is possible tomaintain most passive electrical characteristics of a fullmodel when reducing its branching structure if the dendritictree meets two criteria: 1) dendrites must follow the 3/2power branching rule and 2) all paths from the soma todendritic tips must have equal electrotonic lengths (Rall1959, 1964). However, as for most real dendritic trees,these strict criteria were not satisfied by the GP full model.Therefore, we were forced to choose which aspects of thefull model’s morphology to preserve when reducing themorphology to produce the unbranched reduced models.We chose to preserve the TSA and average tip to tip L ofeach major branch for the same reasons that we preservedTSA and L for each branch in the branched reducedmodels.
For the unbranched reduced models, the TSA of eachmajor branch was calculated by summing its compartmentsurface areas; the L of each major branch was estimated asthe mean soma-to-tip L for all the tips in that major branch.Using Eqs. (1) and (2) and these values for TSA and L, wereduced each major branch of the full GP model into asingle compartment to create a 5-compartment unbranchedreduced model (Fig. 1(c), ‘5comp’ model). Because each
dendritic compartment of the 5comp model was greaterthan 0.5 L, we progressively divided each dendriticcompartment lengthwise to be able to analyze whichfeatures of the full model were lost due to altered branchingstructure and which were due to increased compartmentsize: each compartment of the 5comp model was dividedlengthwise into 4, 16 and 32 equal pieces to form the‘14comp’, ‘50comp’ and ‘98comp’ models, respectively(Fig. 1(c)).
2.3 Synaptic inputs
General features In several simulations, randomly timedsynaptic events were applied to dendritic compartments.Excitatory synaptic inputs consisted of mixed AMPA(Crise=1 ms, Cfall=3 ms, Esyn=0 mV) and NMDA (Crise=10 ms, Cfall=30 ms, Esyn=0 mV) conductances, whileinhibitory inputs used solely GABA-A (Crise=1 ms, Cfall=12 ms, Esyn=−80 mV) conductance. All synapses had amaximal conductance of 0.25 nS and were distributed in thefull model such that each dendritic compartment receivedone AMPA, one NMDA and one GABA-A synapse. In thebranched reduced models, synapses were directly mappedfrom the full model and preserved both their locations inthe detailed branching structure and their exact activationtimes. In the unbranched reduced models, synapses couldonly be approximately mapped: synapses were placed incompartments such that the electrotonic span and majorbranch location of each compartment determined howmany synaptic inputs it received. For example, the mostproximal dendritic compartment in the 14comp model’s(Fig. 1(c)) first branch spanned from 0 to 0.14 L. In the fullmodel’s first major branch, this electrotonic span contained20 compartments; therefore, the most proximal dendriticcompartment in the 14comp model’s first branch receivedthe synapses contained in those 20 compartments. Somefull model dendritic compartments were more electrotoni-cally distal than any compartment in the unbranchedreduced models. These synapses were shifted to the mostdistal compartment in the unbranched reduced model;shifting synapses in this way did not cause a large shift inthe average synapse position for the unbranched reducedmodels (Table 1).
Cluster distributions for synchronous excitation To studythe effect of synchronous synaptic input, excitatory synap-ses were grouped into clusters according to their approxi-mate electrotonic distances from the soma. Each clustercontained 13 compartments (from different branches), andtwo of eight total clusters resided at each of the followingapproximate distances: 0.175 L, 0.35 L, 0.525 L and 0.7 L.In order to be able to directly compare synchronous andasynchronous activation, clusters were activated using
304 J Comput Neurosci (2011) 30:301–321
common event timetables which maintained the averageasynchronous activation rates of their synapses. To allowfor direct comparisons with full model responses, clusterpositions were directly mapped to their correspondinglocations in the branched reduced models. In contrast,cluster positions could not be directly mapped into theunbranched reduced models due to the loss of the detailedbranching structure. However, clusters in the unbranchedreduced models did maintain major branch locations andapproximate electrotonic positions. Furthermore, clusters inthe unbranched reduced models included the number ofcompartments that most closely approximated the TSA ofthat cluster’s compartments in the full model.
2.4 Simulations
Simulations were performed using GENESIS 2.3 (http://www.genesis-sim.org/GENESIS/) on Linux workstations.Simulation data were analyzed in Matlab (The Mathworks,Inc, Natick, MA).
2.5 Statistics
For statistical analyses, data set normality was assessedwith the Lilliefors test, which showed that all of oursampled data sets were not normally distributed. Thenon-parametric Mann-Whitney U test was therefore usedfor statistical comparisons. To correct for multiplesimultaneous comparisons, the Mann-Whitney U testsignificance level was decreased from α=0.05 using theBonferroni correction. All statistical tests were performedin Matlab.
2.6 Data sharing
Upon publication, all models along with all currentinjection and synaptic input patterns used in this study will
be made available on the ModelDB public database (http://senselab.med.yale.edu/ModelDB/default.asp).
3 Results
3.1 Matching passive somatic and dendritic responses
The passive properties of a neuron model strongly influenceits responses in the presence of active conductances (Rallet al. 1992). Therefore, we compared the passive responsesbetween the full model and our branched or unbranchedreduced models with different numbers of compartments(Fig. 2). Both 0 Hz (DC) and 1,000 Hz current injectionswere applied because the passive response properties of aneuron model depend on the frequency of inputs (Johnstonand Wu 1995). Despite the use of the same soma and axoncompartments for all models as well as the preservation ofcertain dendritic morphological properties (see Methods),passive responses to somatic current injection were affectedby dendritic properties due to axial current flow and variedby model. Mismatches between the somatic input resistance(RIN) of the reduced and full models ranged from 1% forthe 98comp unbranched model to 23% for the 5compunbranched model (Fig. 2(a)). In contrast, the 1,000 Hzinput impedance (ZIN) was a more challenging measure forreduced models with few compartments: the mismatchesbetween reduced and full model somatic ZIN ranged fromonly 2% for the 98comp unbranched model to 67% for the5comp unbranched model (Fig. 2(d)). The quality of thematch was greater for reduced models with mean compart-ment lengths which were more similar to that of the fullmodel, whether or not the branching structure waspreserved (Table 1, Fig. 2(a)). The increased RIN and ZIN
of the models with the largest trunk compartments near thesoma (5comp unbranched and 41comp branched models) isexplained by the decreased axial current that can exit thesoma because of the high axial resistance (RA) of the first
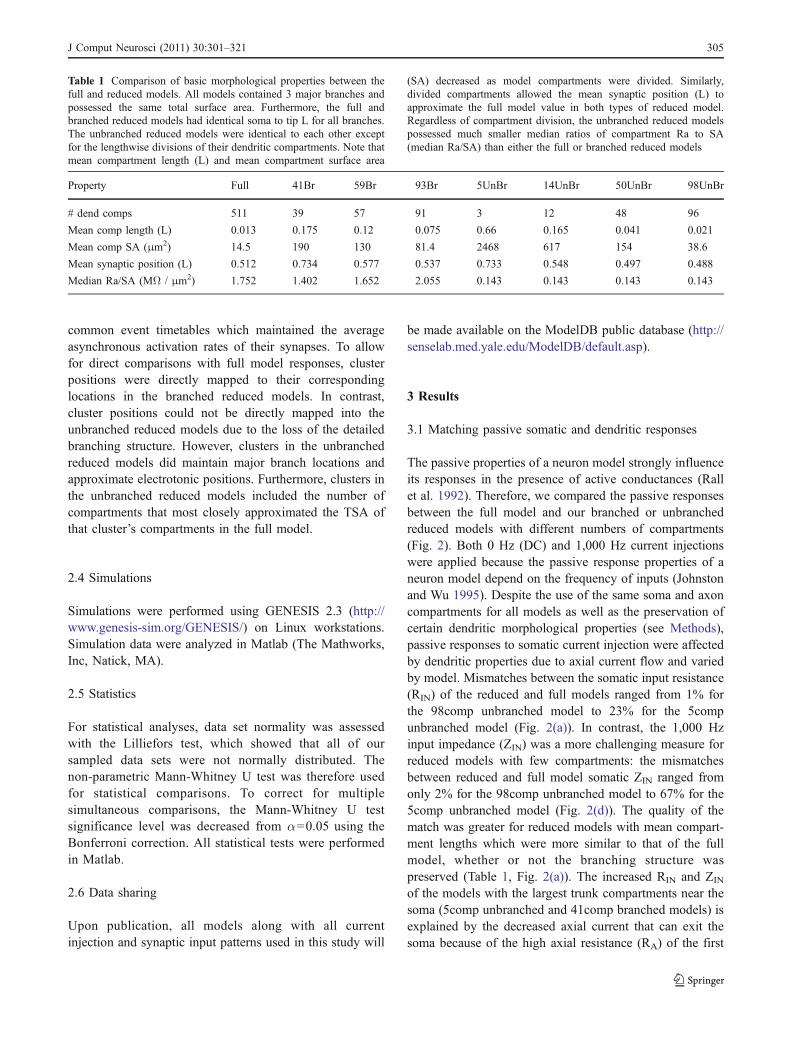
Table 1 Comparison of basic morphological properties between thefull and reduced models. All models contained 3 major branches andpossessed the same total surface area. Furthermore, the full andbranched reduced models had identical soma to tip L for all branches.The unbranched reduced models were identical to each other exceptfor the lengthwise divisions of their dendritic compartments. Note thatmean compartment length (L) and mean compartment surface area
(SA) decreased as model compartments were divided. Similarly,divided compartments allowed the mean synaptic position (L) toapproximate the full model value in both types of reduced model.Regardless of compartment division, the unbranched reduced modelspossessed much smaller median ratios of compartment Ra to SA(median Ra/SA) than either the full or branched reduced models
Property Full 41Br 59Br 93Br 5UnBr 14UnBr 50UnBr 98UnBr
# dend comps 511 39 57 91 3 12 48 96
Mean comp length (L) 0.013 0.175 0.12 0.075 0.66 0.165 0.041 0.021
Mean comp SA (μm2) 14.5 190 130 81.4 2468 617 154 38.6
Mean synaptic position (L) 0.512 0.734 0.577 0.537 0.733 0.548 0.497 0.488
Median Ra/SA (MΩ / μm2) 1.752 1.402 1.652 2.055 0.143 0.143 0.143 0.143
J Comput Neurosci (2011) 30:301–321 305

dendritic compartment, which lumps together the RA ofseveral compartments in the full model. Therefore thedendritic trunk is charged less and the soma more bysomatic current injection. This effect is larger for 1,000 Hzinput to the soma (Fig. 2(d)), and thus fast somatic currentssuch as those during an action potential (AP) can beexpected to create larger somatic voltage deflections with adifferent time course in models with high RA values in theinitial trunk compartments. This dependence of fasttransients on all axial currents in a neuron should be keptin mind, for example when examining the interactionbetween ion channel kinetics and morphology to producesmooth or kinky action potential onsets, an issue that hasrecently gathered much interest (McCormick et al. 2007;Naundorf et al. 2006).
Next we examined the reproduction of somatic responsesto dendritic input in our reduced models. We found that the
match to the median passive somatic response amplitude ofthe full model to dendritic current injections in all compart-ments (one by one) ranged from 2% for the 93compbranched model to 14% for the 5comp unbranched model(Fig. 2(b)). In contrast, with 1,000 Hz injection, we foundthat median response amplitude of the closest matchingbranched reduced model (93comp) was 15% smaller thanthat of the full model while the closest matchingunbranched reduced model’s median response amplitudewas 174% larger than that of the full model (Fig. 2(e)). Thishigher median response amplitude is due to the fact thatmany fewer compartments are located at distal positions inthe unbranched models.
In contrast to the small differences between the somaticpassive responses of the full, branched and unbranchedreduced models to dendritic input, the local dendriticresponses diverged between branched and unbranched
(a) (b) (c)
(d) (e) (f)
Fig. 2 Passive somatic responses to DC or 1,000 Hz current injectioninto the soma or individual dendritic compartments. For panels C, Eand F, a log scale was used for the y-axis to facilitate comparisonsbetween models. (a) Voltage deflections (top, selected models) andRIN (bottom, all models) are plotted for 50 pA current injections intothe soma. RIN was calculated by dividing the steady state voltagechange by the DC amplitude. Note the slight increase in RIN for themost reduced branched or unbranched models. (b) Each dendriticcompartment was separately injected with 50 pA of DC. The box andwhisker plots show the amplitudes of the resulting somatic voltagedeflections: the middle horizontal bar represents the median while theupper and lower horizontal bars represent the 75th and 25thpercentiles, respectively; the whiskers identify the most extremevalues found. Box and whisker plots, bar graphs, and raster plots
present the models in the same order consistently throughout thepaper. Note that the median somatic voltage change for injection intodifferent dendritic compartments was comparable for all models, butthat branched reduced models showed slightly larger variability insomatic responses than the full model, whereas unbranched reducedmodels showed slightly lower variability. (c) Distributions of localdendritic RIN values for each model. The median and quartile valuesbut not whisker extents were similar between the branched reducedmodels and the full model, whereas the unbranched reduced modelshad lower median dendritic RIN and showed much less variabilitybetween compartments. (d–f) Same plots as (a–c), except the injectedcurrent was a 1,000 Hz sinusoidal input with a peak-to-peak (P2P)amplitude of 50 pA. Input impedance (ZIN) was calculated as P2Pvoltage deflection divided by 50 pA
306 J Comput Neurosci (2011) 30:301–321

model reductions. Indeed, mismatches between the medianlocal dendritic DC RIN of the branched reduced and fullmodels ranged from only 7% to 12% while mismatches forthe unbranched reduced models ranged from 40% to 52%(Fig. 2(c)). For the more challenging measure of medianlocal dendritic ZIN with 1,000 Hz input, the mismatchesbetween the branched reduced and full models ranged fromonly 10% to 41% while unbranched reduced modelmismatches ranged from 71% to 93% (Fig. 2(f)). Theunbranched reduced models possessed lumped brancheswhich were thicker than those of the full or branchedreduced models and therefore exhibited smaller local RINsand ZINs because their dendritic compartments possessedmuch smaller median RA relative to surface area (Table 1).Due to this unavoidable characteristic of unbranchedmodels, current flowed away from the injection site moreeasily and did not charge the membrane locally as much asin the full or branched reduced models. This differencebetween branched and unbranched models could be quiteimportant for modeling studies of excitatory postsynapticpotential (EPSP) amplification, for instance, because theamount of amplification depends non-linearly on thedendritic voltage reached (Golding and Spruston 1998).
Despite matching the median dendritic RIN and ZIN ofthe full model, the branched reduced models lackeddendritic RINs or ZINs as large as some present in the fullmodel. Indeed, the full model possessed maximumdendritic DC RINs and 1,000 Hz ZINs which wererespectively about twice and four times as large as anypossessed by a branched reduced model (box plotwhiskers in Fig. 2(c,f)). Furthermore, the full modelpossessed 105 compartments which had larger 1,000 HzZINs than any exhibited by a branched reduced modelcompartment. The unbranched reduced models showedeven less variability in local dendritic RINs and ZINs, dueto their lack of small side branches.
In conclusion, the unbranched reduced models matchedthe full model’s passive somatic responses but failed tomatch its dendritic RINs and ZINs. In contrast, the branchedreduced models matched both the somatic and mediandendritic passive responses of the full model to currentinjection. However, the branched reduced models lacked apopulation of dendritic RINs or ZINs as large as manypresent in the full model. These similarities and differencesin passive properties between the reduced and full modelsprovide much of the basis for emerging similarities anddifferences in the active models.
3.2 Using ‘mock’ action current injection to predictdifferences in AP size
The detailed spike shape is a frequently studied electro-physiological feature (Bean 2007) which can depend on a
neuron’s morphology (McCormick et al. 2007). It istherefore an interesting question whether reduced computermodels should be expected to faithfully reproduce thisfeature of the experimental data. The results shown abovesuggest that purely passive differences in axial current flowbetween full and reduced models could confound studies ofhow active conductances determine the detailed spikeshape. Unfortunately, isolating differences in spike shapedue to axial current flow in the presence of voltage-gatedconductances is complicated due to the non-linear inter-actions between the membrane voltage trajectory andconductance activation. The injection of a fixed ‘mock APcurrent’ into the passive models allowed us to determinewhich differences in the active AP should be expectedbased on passive properties alone. For a mock AP, we useda square current pulse injection with 5 nA amplitude and0.5 ms duration, which produced a voltage spike with anamplitude and rise time similar to a Na+ action potential.We found that the mock AP voltage deflection was within1% of the full model’s value for the 98 comp unbranchedmodel; however, as the average electrotonic size ofcompartments increased, the closeness of reduced modelvoltage deflections to that of the full model decreased(Table 1, Fig. 3(a)). Indeed, the mock AP voltage deflectionshowed a steeper onset and was 55% larger in the 5compunbranched model than in the full model due to the reducedaxial currents flowing into the high Ra dendritic trunk ofthe 5comp model (Fig. 3(b)). For the same reason, themock action current led to a much decreased voltagedeflection in the dendrites of this model (Fig. 3(c)). Notethat the same factors contributed to dendritic mock AP sizedifferences between the 14comp unbranched model and fullmodel, and that even the branched reduced models showedsmaller dendritic mock AP sizes due to larger Ra values ofthe trunk dendritic compartments. Overall, our results withmock AP current injection show that large dendritic trunkcompartments can lead to differences in AP size. Addition-ally, decreased passive back propagation of the AP couldinfluence the activation of dendritic voltage gated currentsand therefore could further exacerbate differences inintegrative properties for the most reduced models. Never-theless, both branched reduced models and unbranchedmodels with >10 compartments generally exhibited closematches to full model somatic mock AP size.
3.3 Analysis of detailed somatic shape of sodium APsfor different levels of model reduction
After isolating the influence of reduced model architectureson voltage transients for fixed current injection pulses, weadded the full complement of ion channels back in tocompare Na+ AP shapes between the full and reducedmodels. This set of simulations allowed us to determine the
J Comput Neurosci (2011) 30:301–321 307

influence of the described passive mismatches on voltage-gated channel activation, which could further exacerbatespike shape mismatches.
Using the same active conductance parameter set thatwas shown to reproduce physiological GP neuron activityin the full model (see Methods) for all models, the activefull and reduced models each exhibited tonic, regularspontaneous spiking (Fig. 4(a)). Spikes were alwaysinitiated in the axon compartment due to its high NaFconductance. Despite identical conductance densities, spikeshapes differed somewhat depending on each model’smorphology. As predicted by the mock AP comparisons,the somatic spikes of the 5comp model were taller thanthose of the full model (by 7.9 mV). Spikes in the otherreduced models were also taller than those in the fullmodel, but not by as much, and they followed the samepattern as for the height of the mock AP (Fig. 4(b) leftinset). It should be kept in mind, however, that the amountof variability in spike height between the full and reducedmodels was not large relative to the variability seenbetween different GP cells in vitro (standard deviation=10.8 mV) (Gunay et al. 2008). Note that AP heightdepended on the average dendritic compartment lengthrather than on the preservation of the detailed dendriticbranching structure (see Table 1). Spike height differenceswere due to variations in the amount of axial currentleaving the soma during a spike (Fig. 4(d), left inset):models with less axial current exiting the soma during aspike (Fig. 4(d), compare positive peaks) possessed talleraction potentials (Fig. 4(b), left inset) because more currentremained in the soma to charge the somatic membrane.Models with less axial current flow also exhibited slightlymore hyperpolarized spike initiation thresholds (Fig. 4(c),left inset) because less positive driving current was able to
exit the soma into the dendrites during spike onset. Themedium dendritic gNa level in our default full model wastoo low to propagate active dendritic APs, but a parameterset with high dendritic gNa allowing active dendriticspiking showed quite similar results for the dependence ofspontaneous spike shape on model reduction (SupplementalFig. S1, Online Resource 1), indicating that these findingsgeneralize to spiking and non-spiking dendrites.
A direct consequence of smaller axial current flows intothe dendrites during a mock AP was less depolarization ofthe dendrites (Fig. 3(c), passive case). Less depolarizedproximal dendrites contributed less positive axial currentback to the soma immediately following the spike duringthe fast afterhyperpolarization (fAHP) (Fig. 4(d), rightinset). Indeed, fAHPs were deeper in models with smalleraxial current flows back into the soma immediatelyfollowing a spike (e.g. the 5comp model, Fig. 4(b) rightinset, Fig. 4(d) inset). In contrast to the small spike heightdifferences, the difference between the full and 5compmodel fAHPs was 17.3 mV, about six times larger than theexperimental variability for this measure (Gunay et al.2008). Deeper fAHPs in the 5comp model lasted formany milliseconds following a spike (Fig. 4(c), rightinset). In sum, axial current flow was a key determinantof spike shape differences: the reduced models thatexhibited axial current flows most similar to those ofthe full model (e.g. the 50 and 98comp unbranchedmodels) also provided the closest matches to the fullmodel’s spike shape as measured by the mean absoluteerror (MAE, defined as the mean point by point absolutevalue difference between reduced and full model traces)(Fig. 4(e)). Branched model MAEs were large relative tothose of the unbranched models with similar numbers ofcompartments. This was due to the fact that branched
(a) (b) (c)
Fig. 3 The passive somatic response amplitude to a mock actioncurrent depended on dendritic axial resistance. The stimulus was abrief (0.5 ms) large (5 nA) somatic current pulse which caused avoltage response in the passive soma that mimicked the amplitude andrise-time of an AP in the absence of voltage gated conductances(mock AP). (a) The mock AP was smallest in the full model and themost subdivided (50comp and 98comp) unbranched reduced models.
The ability of the reduced models to match the full model mock APresponse improved as compartments were divided. (b) Models withmore finely-divided compartments allowed larger axial currents to exitthe soma into the dendrites during the mock AP. (c) Models withlarger axial currents exiting the soma exhibited larger average voltagedeflections in their most proximal dendritic compartments (thosedirectly connected to the soma)
308 J Comput Neurosci (2011) 30:301–321

reduced model trunk dendritic compartments were stillelectrotonically longer than those of the unbranchedmodels since a large number of compartments wasnecessary simply to reflect the entire branching structure
of the full model (see Table 1). Indeed, we observed astrong positive correlation (r=0.97, Pearson correlationcoefficient) between spike shape MAE and mean com-partment electrotonic length (Fig. 4(e), inset).
(a)
(b) (c)
(d) (e)
Fig. 4 Shape analysis of spontaneous somatic APs in fully active models.Models at all levels of reduction possessed identical somatic, axonal anddendritic conductance densities. (a) Spontaneous spiking is shown for thefull and reduced models. (b) The relative spike heights in the activemodels (left inset) corresponded directly to the relative mock APresponse amplitudes shown in Fig. 3(a). Models with shorter spikeheights possessed shallower fast afterhyperpolarizations (fAHPs) as well(right inset). (c) Expanded time scale shows steeper rise time to spikeonset in the most reduced models (left inset) and extended differences infAHP potential (right inset). (d) Axial current between soma anddendritic trunk compartments. The spike depolarization led to a largepositive current into the dendrites; somatic spike size was increased in
models with less axial current due to high Ra values. During the somaticfAHP, the axial current reversed, and current flowing back into the somafrom the depolarized dendrites led to a decrease in fAHP amplitude.Therefore fAHP was largest in the most reduced models because theyhad the highest Ra values into the dendritic trunk compartments directlyconnected to the soma. (e) The quality of the match to the full modelspontaneous spike shape shown in (b) was calculated for each model asthe MAE of the voltage traces from 2 ms before to 6 ms after the spikepeak. To calculate MAE, spikes were aligned so that they crossed 0 mVat the same time. MAE was highly correlated with mean compartmentelectrotonic length (‘mean comp L’; r=0.97, Pearson correlationcoefficient; see inset)
J Comput Neurosci (2011) 30:301–321 309

We considered the possibility that manipulation ofconductance densities in the 5comp model could allow acloser match to the full model’s spike shape. The fullmodel’s spike was shorter (by 7.9 mV) and its fAHPshallower (by 17.3 mV) than that of the 5comp model. Byhand-tuning the 5comp model’s conductance densities,these mismatches in spike height and fAHP depth respec-tively could be decreased by 97% and 77%. This level oferror reduction was achieved through a 4-fold decrease inthe somatic and axonal NaF conductance densities and a16-fold decrease in Kv2, Kv3, and Kv4fast/slow. While ourhand-tuning allowed a much closer match of spike heightand fAHP depth, these conductance density changes alsocaused the spike width at −20 mV to increase from 0.53 msto 0.88 ms (the full model spike width was 0.58 ms).Because spike width was a key determinant of calciumentry through HVA channels in the model, increasing thespike width lead to an increase in SK channel activationthat secondarily altered multiple model properties. Overall,hand-tuning conductance densities in reduced models awayfrom the full model parameter set always produced trade-offs in our experience, and it was not possible to fullycompensate for mismatches incurred by morphologicaldifferences. In addition, the channel densities that madethe 5comp model spike shapes most similar to electrophys-iological recordings were several-fold different from theoriginal channel densities in the full morphology, and thusthe biological interpretation of such highly reduced modelswith channel densities adjusted to match physiologicalrecordings would need to take this fact into consideration.
3.4 Analysis of back propagating APs (bAPs) at differentlevels of model reduction
A neuron model’s bAP amplitudes have important consequen-ces for the modeling of spike time dependent synaptic plasticity(Caporale and Dan 2008). If a reduced model’s bAPamplitudes were appreciably different from those in a fullmodel, coincident bAPs and EPSPs in the dendrites would failto evoke similar local responses. To examine the effect ofmodel reduction on bAP amplitudes during fast spikingactivity as may be expected for GP neurons in vivo, 75 Hzspiking was elicited in each model by somatic DC injection.We normalized bAP amplitudes to somatic AP height so thatmodels with taller somatic spikes did not mistakenly appear tohave more effective back propagation. In most dendriticcompartments of the full and reduced models, bAP amplitudesdecayed at about the same rate with electrotonic distance fromthe soma (Fig. 5(a)). However, in the most highly reducedmodels even the trunk dendritic compartments were at aconsiderable electrotonic distance from the soma (Fig. 5(a)),and therefore the initial decrease in bAP amplitude was muchmore pronounced. A further difference between the reduced
and full models was that variability in bAP amplitude fordifferent dendritic branches at a given electrotonic distancefrom the soma was much larger in the full model. Inparticular, one full model branch had a greatly increasedbAP amplitude (Fig. 5(a1), black arrow). Indeed, the bAPamplitude at the end of this branch (L≈0.5) was 49% of thesomatic AP height, while the largest bAP amplitudes observedat this electrotonic position in any branched or unbranchedreduced models were respectively only 13% or 16% ofsomatic AP height. This large bAP disappeared in the fullmodel without dendritic gNa (Supplemental Fig. S2A, OnlineResource 1), which meant that the large amplitude was dueto local amplification by gNa. Thus even when the branchingstructure of the full morphology was maintained, morpho-logical reduction still resulted in significant functionalchanges in the presence of active conductances.
The primary cause of bAPs lies in the propagation ofaxial current. The peak axial current during a bAP quicklydecayed with electrotonic distance at about the same rate inthe full and reduced models (Fig. 5(b)) such that only asmall fraction of the initial axial current at the somaboundary even reached intermediate dendritic positions at0.5 L (Fig. 5(b1)). The peak axial current reaching distallocations (e.g. 1.0 L) was quite variable between dendriticbranches (Fig. 5(c)) though the variability was diminishedby either removing dendritic gNa or setting it to a highdensity that supported active spike back propagation(Supplemental Fig. S2, Online Resource 1). However, thepeak axial current reaching any given compartment did notdetermine the local bAP amplitude. Instead, the amplitudewas primarily determined by the local ZIN at each location.For example, in the full model at 0.54 L, the branch with thelargest bAP amplitude (1,000 Hz ZIN of 304 MΩ) receivedonly 35% of the axial current received by the branch with thesmallest bAP (1,000 Hz ZIN of 76 MΩ). Such a large spreadin 1,000 Hz ZIN was not observed in any of the reducedmodels, explaining the smaller spread of bAP amplitudes(Fig. 5(a)). While the branched reduced models possessedthe same branches as in the full model, their 1,000 Hz ZINswere smaller due to their larger compartment sizes, leadingto the observed mismatches in bAP amplitudes. Thesedifferences between the full model, branched reduced modelsand unbranched reduced models should be considered whenusing modeling to study bAPs or employing them to studyspike dependent plasticity rules.
3.5 Effects of model reduction on the somatic spikefrequency vs. current Injection (fI) curves
The somatic fI curve is a basic neuronal input-output functionwhich is frequently recorded by cellular electrophysiologistsdue to the important information that it yields about neuronalexcitability. Possible mismatches in the somatic fI curve due
310 J Comput Neurosci (2011) 30:301–321

to model reduction could result in consequential changes withrespect to excitability in the presence of synaptic input. Toassess the extent of such mismatches, we compared somatic fIcurves between the full model and the branched orunbranched reduced models (Fig. 6(a)). All models exhibitedspontaneous spiking which could be eliminated by injectingbetween −31 pA and −41 pA of DC into the soma. Forpositive current injection amplitudes between 0 pA and500 pA, the full and reduced models exhibited nearly linearincreases in spike rate. However, the somatic fI curve wassteeper in some of the reduced models than in the full model.This slope mismatch was related to differences in somaticRIN between the full and reduced models (compare Figs. 2(a)
with 6(a)). Models with larger somatic RIN allowed moresomatically-injected current to charge the somatic and axonalmembranes instead of flowing into the dendrites. Thisdifference was most pronounced for the 5comp unbranchedmodel, since this model had by far the highest somatic RIN
(Fig. 2(a)). Overall, the differences in spike rate between thefull and reduced models were small (e.g. spontaneous ratevaried by only 2.4 Hz) relative to the variability that isobserved between different GP cells recorded in vitro(standard deviation for spontaneous rate=5.9 Hz) (Gunayet al. 2008). Therefore our data indicate that somatic fI curvemismatches are not one of the important limitations ofreduced models, with the possible exception of highly
(a1) (a2) (a3)
(b1) (b2) (b3)
(c1) (c2) (c3)
Fig. 5 Back propagating AP (bAP) amplitudes can be much larger inthe full model than in the reduced models due to larger local dendritichigh frequency ZINs. All models were driven to fire at 75 Hz+ −0.1%with DC somatic injection. (a) The bAP amplitude in eachcompartment was normalized to the soma spike amplitude and plottedagainst the electrotonic distance from the soma for the full model (a1),branched models (a2) and unbranched models (a3). Most modelsshowed a similar decay in bAP amplitude with electrotonic distance.However, the 5comp and 14comp unbranched models showed muchsmaller bAP sizes in their proximal dendrites because these compart-
ments were already electrotonically quite distant from the soma. Inaddition, the full model showed more variable bAP amplitudes indifferent branches (see black arrow) than even the most detailedbranched reduced models. (b) The maximum amount of axial currentflowing into each compartment during a spike (referred to simply asaxial current) is plotted against electrotonic distance from the soma.(c) Log scale representation of the plots shown in (b). Note that thedecay of axial current with electrotonic distance is approximately log-linear and is quite similar between the full and reduced models
J Comput Neurosci (2011) 30:301–321 311

reduced models with severely limited axial currents such asour 5comp model.
We again considered the possibility that the somatic fIcurve of the 5comp model could be improved relative tothat of the full model by hand-tuning its conductancedensities. Indeed, by decreasing axonal NaP by 12.5% andincreasing somatic SK by 50%, the 5comp model’s somaticfI curve closely matched that of the full model. However,these manipulations did not appreciably decrease thediscrepancy between the 5comp model’s spike rateresponses to dendritic current injection relative to those ofthe full model: this discrepancy will be addressed in thenext section.
3.6 Effects of model reduction on fI curves for dendriticcurrent injection
While the somatic fI curve is an important measure of theexcitability of a neuron, it does not take into account inputprocessing taking place in active dendrites. Active dendritesare capable of many types of input processing, dependingon their precise morphology and their complement of ionchannels (London and Hausser 2005). As a first steptowards characterizing the influence of model reductionon dendritic processing, we recorded the spike frequencywith different dendritic DC injection amplitudes at arelatively distal location (~0.8 λ) in each model. As shownin Fig. 6(b), the dendritic fI curves were much steeper in theunbranched reduced models than in the full or branchedreduced models. To test whether mismatches in dendritic fI
curves depended on the particular dendritic locationchosen, we injected 200 pA of DC into every dendriticcompartment of each model and compared the distribu-tion of spike frequencies between models (Fig. 6(c)). Forall dendritic compartments, the median spike frequenciesof the unbranched reduced models were about twice aslarge as those in the full or branched reduced models(Fig. 6(c)). In addition, the minimum spike frequencywas much larger in the unbranched reduced models thanin the full or branched reduced models (Fig. 6(c)).However, this difference was sensitive to the dendriticgNa level: with high dendritic gNa, the full modelresponded to dendritic current injection with high spikefrequencies that matched the unbranched models, althoughthe spread of spike frequency responses remained muchhigher in the full model (Supplemental Fig. S4C, OnlineResource 1). Overall, these results showed that differencesbetween full and reduced models in their dendritic fIcurves were quite large, and furthermore depended on thecomplement of ion channels.
Next, we sought to understand more fully the relation-ship between dendritic current injection and somatic spikerate. To examine the possibility that different spikefrequency responses were simply related to the electrotonicdistance of each injected compartment to the soma, wecompared the spike rate response during 200 pA DCdendritic injection to the electrotonic position of eachinjected dendritic compartment. Perhaps surprisingly, therewas considerable variability between spike rate responses tocurrent injections at matching electrotonic positions in
(a) (b) (c) (d)
Fig. 6 The spike frequency response to somatic and dendritic DCinjection (fI curve) at different levels of model reduction. DC injectionamplitudes ranged from −100 pA to +500 pA to elicit the fullphysiological range of spike rates. (a) fI curve of each model forsomatic current injections. Models with higher somatic RINs (seeFig. 2(a)) exhibited steeper somatic fI curves. Note that subdividingthe compartments of the reduced models allowed closer matches to thesomatic fI curve of the full model. (b) fI curve of each model for DCinjection into a sample dendritic compartment at an electrotonicdistance of 0.83 L from the soma. The injected compartment waspositioned on the same sub-branch in the full and branched reducedmodels and on the same major branch in the unbranched reducedmodels. Note that the branched reduced models closely matched the
dendritic fI curve of the full model while the unbranched reducedmodels did not provide close matches. (c) Box plots for distributionsof spike frequency responses for 200 pA DC injections into eachdendritic compartment of each model. The median spike frequencyresponse to dendritic injection was much higher in the unbranchedreduced models than in either the full model or the branched reducedmodels. The minimum spike frequency response to dendritic injectionwas also much higher in the unbranched reduced models than in eitherthe full model or the branched reduced models. (d) Same as (c) exceptthat all channels were removed from the dendrites. Note the muchcloser match between all models and the strong correspondence to therelationships shown in Fig. 2(b)
312 J Comput Neurosci (2011) 30:301–321

different branches of each model (Fig. 7(a)). Becauseelectrotonic position need not be directly correlated to localRIN, we hypothesized that local dendritic RIN could be astronger predictor of spike frequency responses. Indeed, wefound a very close relationship between high values of localdendritic RIN at the site of current injection and low valuesof somatic spike frequency regardless of model reductionlevel (Fig. 7(b)). Since the unbranched models lackedcompartments with high local RINs due to their collapsedbranching structures (Fig. 2(c)), their minimum spikefrequency responses to dendritic current injections werehigher (Fig. 6(c)).
To determine whether dendritic conductances wereresponsible for the differences in spike rates with dendriticDC injection, we removed all dendritic conductances andmeasured spike rates in response to the same stimuli usedfor Fig. 6(c). We found that passive dendrites allowedclose matches between all models regarding spike rateresponses to dendritic DC injections (Fig. 6(d)). Thespike rates achieved with current injection into passivedendrites were much higher than those with activedendrites, indicating that activation of outward currentsduring dendritic depolarization primarily determined slowspike responses. Because dendritic depolarization withinput is directly dependent on the local RIN, theunavoidable reduction of local dendritic RIN whenmultiple dendritic branches are collapsed in unbranchedmodels leads to significant mismatches in the response toinput when active conductances are present. Thesemismatches can lead to either decreased or increasedspiking based on the relative predominance of inward oroutward dendritic currents.
3.7 Comparison of spike frequency response to synapticinputs at a range of input frequencies across models
The integration of distributed synaptic inputs into spikingoutput is one of the fundamental computational functions ofa neuron (Destexhe et al. 2003; Gulledge et al. 2005).Accurate synaptic integration relative to a full model orbiological neuron is particularly important for a reducedmodel that will be incorporated into network simulations. Afirst order approximation of the input/output function of aneuron model is frequently represented by fF curves, whichcompare spike frequency vs. input frequency at differentmixes of inhibition and excitation. We generated fF curvesfor all models by recording the spike frequencies forincreasing rates of asynchronous excitatory input to alldendritic compartments at three levels of inhibition. Weapplied identical synaptic conductance activation patternsbetween all models (see Methods). We found that the fFcurves of all reduced models matched the full model moreclosely than the fI curves for dendritic current injection hadsuggested (Fig. 8(a), compare to Fig. 6(b,c)). Nevertheless,the unbranched models showed a somewhat larger spikefrequency increase with increasing excitatory input rates assuggested by the dendritic fI curves, whereas the 59compand 93comp branched reduced models presented a closeapproximation to the fF curves of the full model. As weobserved with dendritic fI curves, the degree to which thefF curves matched between the models was sensitive to thedendritic gNa level. With high dendritic gNa, no reducedmodel was able to match the steep fF curves of the fullmodel due to differences in dendritic spike initiation andpropagation (Supplemental Fig. S5, Online Resource 1).
To better understand the fF curve mismatches of theunbranched models with medium dendritic gNa, we studiedthe somatic and dendritic voltage fluctuations of the93comp, 98comp and full models after removing theirsomatic and axonal active conductances (Fig. 8(b–d)). Thesomatic voltages were shifted relative to one another in amanner consistent with the relative firing rates in the fFcurves. However, the magnitude of somatic voltagefluctuations was quite similar between the full and reducedmodels (Fig. 8(b)). In contrast, the dendritic voltagefluctuations in the unbranched 98comp model were muchsmaller than in the full or branched 93comp model at eachlevel of inhibition (Fig. 8(c,d); note the close similaritybetween the local fluctuations of the full and 93compbranched models). We hypothesized that these differentdendritic voltage fluctuations influenced dendritic conduc-tances in a complex manner and prevented the 98compmodel from precisely matching the fF curves of the fullmodel. To test this, we removed all dendritic conductancesfrom each model and reproduced the fF curves. As wepredicted, the fF curves of the full and reduced models
(a) (b)
Fig. 7 RIN was a stronger predictor than electrotonic position of thespike rate response to dendritic injection. The RIN of a dendriticcompartment was calculated as for Fig. 2. (a) The spike rate responseduring 200 pA DC injection into each dendritic compartment dependedweakly on electrotonic distance from soma (L). (b) In contrast, the spikerate response during 200 pA DC injection into a dendritic compartmentdepended strongly on the injected compartment’s RIN
J Comput Neurosci (2011) 30:301–321 313

(a1)
(b1)
(c1)
(d1)
(e1)
(a2)
(b2)
(c2)
(d2)
(e2)
(a3)
(b3)
(c3)
(d3)
(e3)
Fig. 8 The spike frequency (f) responses of the full model to differentevent frequencies (F) of synaptic input (fF curves) were well matched bythe divided branched reduced models but less well matched by the otherreduced models. (a) With asynchronous excitation, the divided branchedreduced models consistently provided the closest match to the fF curves ofthe full model (59comp model responses not shown, but similar to those ofthe 93compmodel). Note that the fF curves of the unbranchedmodels weregenerally steeper than those of the full model, but that the mismatchdepended on the precise combination of excitation and inhibition. ‘No’,‘Medium’, and ‘High’ inhibition respectively refer to average rates for eachinhibitory synapse of 0, 10, and 20 Hz. Each fF curve was constructed from100 s simulations for each data point. (b–d), somatic and axonalconductances were removed to prevent spiking. Event frequencies circlein panels a1–3 were used for panels (b–d). (b) Short somatic voltage tracesare shown in each type of model. Note that the full and branched somaticvoltages were practically identical while the unbranched 98comp model
exhibited slightly different fluctuations with no or medium inhibition.Further note the correspondence of these somatic voltage fluctuations to therelative firing rates of each model. (c) Short voltage traces are shown froman example dendritic compartment at approximately the same electrotonicposition and branching structure (if possible) in each type of model. Thefull and branched dendritic compartments experienced larger voltagefluctuations than did the compartment in the unbranched model. Note theclose correspondence of the full and 93comp branched reduced model’sdendritic voltage fluctuations. (d) The probability that a particular voltagewas reached by any dendritic compartment at any time during synapticinput is plotted for each model. The ranges of voltages reached by thedendrites of the full and branched models were larger than the range ofvoltages reached by the dendrites of the unbranched model. (e) Afterremoving all active dendritic conductances, the fF curves were reproduced.Note the much closer fF curve matches, particularly between the 98compunbranched reduced model and the full model
314 J Comput Neurosci (2011) 30:301–321

without dendritic conductances were much more similar toeach other than in the case with dendritic conductances(Fig. 8(e)).
3.8 Many of the precise spike times of the full model werepreserved by the branched and unbranched reduced models
While synaptic rate coding is used for many neuralcomputations, some circuits such as those involved withprocessing transient sensory inputs must use the informa-tion contained in the timing of the first spike (VanRullenet al. 2005). In network models of circuits employingprecise spike timing as a coding mechanism, the exactfiring times of the component neuron models thereforebecome important. If the spike times of a reduced branchedor unbranched model differ from those of a biologicalneuron or full model, the degree of spike time preservationshould be understood before a particular morphologicalreduction method is used to construct neurons for suchnetworks. Therefore, we evaluated the preservation ofprecise full model spike times by branched or unbranchedreduced models in the presence of identical synaptic inputs.
To study the precision of spike timing with synapticinputs, we constructed a set of asynchronous distributedinputs where each of the 511 excitatory synapses wasrandomly activated with a mean rate of 5 Hz, and each of511 inhibitory synapses with a mean rate of 10 Hz. Aftercarefully examining the spike time preservation of eachreduced model at each point on the fF curves shown inFig. 8(a), we found that this combination of excitation andinhibition displayed a degree of spike time preservation thatwas representative of the range of synaptic backgroundsthat we studied (e.g. Fig 8(a)). Therefore, we present thespecifics of spike time preservation by the reducedmodels with this one synaptic background to avoidintroducing redundant detail. Because input synchroniza-tion is generally thought to be an important aspect inneural coding and occurs naturally for example due tooscillatory activity (Ward 2003), we also constructed asynaptic stimulus in which clusters of synapses were activatedsynchronously (see Methods). Spike time preservation wasdefined as the percentage of the full model’s spikes that weregenerated by the reduced model within ±5 ms of the fullmodel’s spike time, a method we previously employed indynamic clamp studies to examine spiking precision (Gauckand Jaeger 2000). In our previous dynamic clamp study, weshowed that about 60% of precise spike times werepreserved within ±5 ms when repeatedly applying the sameconductance activation pattern to neurons in slice. Weconsider this degree of preservation to be the limit of spiketime accuracy due to intrinsic neural noise and thus anyreduced models matching this level of precision presentsufficient replication of full model activity.
We found that preservation of ±5 ms spike timing did notvary widely between the branched and unbranched reducedmodels (Fig. 9(a1–3)). Preservation was generally about 50%with asynchronous excitation (Fig. 9(a1–3)), and from 50% to75% with synchronous excitation (Fig. 9(b1–3)), forbranched or unbranched reduced models. Coincidentexcitatory inputs increased spike time preservationbecause powerful events were more likely to overcomesmall differences in activity between the models to drivespikes at a precise time. With spike time preservation, aswith the other functional measures analyzed in this study,the dendritic gNa level was an important determinant ofhow well the reduced models matched the full model.Preservation of spike timing was greatly diminished by highdendritic gNa whether inputs were asynchronous or synchro-nous. With 10 Hz inhibition and 5 Hz excitation, spike timepreservation for the high-dendritic-gNa models was often lessthan 20% due to differences in dendritic spike propagation andinitiation with the full model (data not shown). Conversely,removing dendritic gNa altogether caused spike time preser-vation to improve by 5% relative to the case with mediumdendritic gNa for the 93compmodel, suggesting that dendriticsodium was amplifying coincident EPSPs differently in thedifferent models (data not shown). Removing the remainingdendritic conductances did not further improve spike timepreservation for the 93comp branched model, most likelybecause close somatic voltage fluctuation matches wereobserved even with all dendritic conductances present (e.g.Fig. 8(b)).
To understand why the 93comp model did not preserve100% of precise full model spike times despite the lack ofnoise, identical synaptic activation patterns, and directmapping of synaptic positions, we compared the somaticvoltage responses of both models under two conditions. In,the first condition, somatic and axonal conductances wereremoved from both models, leaving just dendritic con-ductances (“nonspiking” in Fig. 9(c)). We observed a closematch between the somatic responses of the full and93comp models in the nonspiking case (Fig. 9(c), dashedtraces). In the second condition, both models possessed thefull complement of somatic, axonal, and dendritic con-ductances (“spiking” in Fig. 9(c)). In the spiking models,one model occasionally fired a spike while the other modeldid not quite reach threshold (e.g. Fig. 9(c), black arrow). Ifa spike-triggering synaptic event occurred for both modelsimmediately after this event, then the model that just fired aspike did not fire again, while the other one did (e.g. Fig. 9(c),blue arrow). This kind of sequence tended to cause spikes inthe subsequent few hundred milliseconds to be misalignedbetween the two models and accounted for most of theunpreserved spike times. Indeed, due to the fact that near-threshold events can lead to spike initiation in one conditionbut fail to cause spike initiation in a closely parallel
J Comput Neurosci (2011) 30:301–321 315

condition, a fully precise control of spike timing by synapticinput may be impossible.
Overall, in the absence of dendritic spiking, the degreeof precise full model spike time preservation by the reducedmodels was similar to the spike time preservation that wehave observed between multiple applications of identicalconductance activation patterns to slice neurons (Gauck andJaeger 2000).
3.9 Conductance parameter sets yielding disparate outputcan be used in the full and reduced models to producesimilar output
Researchers using full models commonly face the problemof hand-tuning conductance densities to match targetoutput: this is always a laborious task and dissatisfying inthat only a single—possibly arbitrary—solution is found.
(a1) (a2) (a3)
(b1)
(c)
(b2) (b3)
Fig. 9 Precise full model spike times were often preserved by thereduced models in the presence of synaptic input. (a) Spike timepreservation during asynchronous synaptic bombardment. a1, Somaticvoltage traces for the full model and 93comp branched reduced modelare shown along with the time-varying combined synaptic reversalpotential (Vsyn). As we have done previously (Gauck and Jaeger2000), Vsyn was calculated by multiplying the reversal potential ofeach synaptic conductance type (AMPA, NMDA, and GABA) by themomentary whole cell synaptic conductance for that type and thendividing by the total synaptic conductance for all three types. Vsyn wasshifted down by 20 mV relative to voltage traces for easiervisualization. a2, Raster plot showing the spike times for each modelduring the simulation segment in a1. a3, The percent of preservedspikes was generally about 50% for all the reduced models. (b) Sameas (a), but with synchronous excitation. Note the improved preserva-tion percentages for each reduced model. Further note that none of thereduced models preserved more than about 75% of full model spike
times. (c) Somatic voltage traces are shown in the full and 93compmodels during a short period when precise full model spike times werenot preserved. The dashed traces represent the somatic voltages of themodels without somatic or axonal conductances (nonspiking, shifteddown by 20 mV to aid visualization), while the solid traces are fromthe active models. Note the extremely close match of the nonspikingsomatic voltage fluctuations, the point when the full model spikes butthe 93comp model does not (black arrow), and the 93comp spikewhich follows soon after (blue arrow). Synaptic input distributionswere identical to those used for Fig. 8. Medium excitation (5 Hz) andmedium inhibition (10 Hz) were used for all panels of this figure.Preservation of full model spike times was calculated as thepercentage of the full model’s spikes that were generated by thereduced model within ±5 ms of the full model’s spike time. The colorsused in the raster plots in this figure were the same as those used forthe rest of the figures
316 J Comput Neurosci (2011) 30:301–321

Therefore, there has been great interest in finding algorithmsto optimize the conductance densities of a model automati-cally (Huys et al. 2006; Vanier and Bower 1999) and todetermine the parameter space of similar solutions withdatabase approaches (Gunay et al. 2008; Prinz et al. 2003;Prinz et al. 2004). However, even with such algorithms it isstill demanding to find a suitable parameter set for a fullmodel because of the long simulation times required to runthousands of parameter combinations in such models. Thistime requirement can be drastically decreased by applyingthe search algorithm to a reduced model, as long as the
resulting conductance densities can be used in the full modelto produce similar output.
To examine which reduction strategy could be used toefficiently search the parameter space of the full model, 100random parameter sets were generated by varying eachconductance density independently between 25% and 400%of its default value. These parameter sets produced widelyvarying spike shapes as well as somatic and dendritic fIcurves (Fig. 10). Of these parameter sets, two that yieldeddifferent somatic and dendritic fI curves and spike shapeswere chosen to illustrate a comparison of the output of the
(a1) (a2) (a3) (a4)
(b1) (b2) (b3) (b4)
(c1) (c2) (c3) (c4)
Fig. 10 Different model activity patterns generated by many randomconductance density sets were matched between the full and reducedmodels. One hundred conductance density parameter sets wererandomly generated by varying each conductance density between25% and 400% of its original value. Two of these parameter sets thatproduced very different model outputs were selected to illustrate theresponses of the different models with identical conductance densities(colored solid or dashed lines). The remaining 98 random parametersets are displayed as solid light gray lines. Model spike shapes werecompared during 500 pA somatic DC injection because this level ofcurrent injection caused every morphology to spike with each random
parameter set tested. (a1,b1,c1), Each random parameter set wasinserted into the full model. For each parameter set, the somatic spikeshape (a1), somatic fI curve (b1) and dendritic fI curve (c1) aredisplayed. Note the wide range of spike shapes and fI curve gains. (a2,b2,c2), Same as the first column but for the 41comp branchedmorphology. (a3,b3,c3), Same as the first two columns but for the14comp unbranched morphology. (a4,b4,c4), Box plots of thedistribution of MAEs calculated for the 100 random parameter setsare shown for each reduced model. Note that dendritic fI curve MAEswere smaller for the branched reduced models than for the unbranchedmodels
J Comput Neurosci (2011) 30:301–321 317

full and reduced models (Fig. 10, ‘RandSet1’ (colored solidlines) and ‘RandSet2’ (colored dashed lines); for conductancedensities see Supplemental Table S3, Online Resource 1).This comparison showed that the distinct differences in themodel output between the two parameter sets were generallypreserved in both branched and unbranched models(Fig. 10). For instance, the somatic fI curves and spikeshapes were closely preserved when these two parameter setswere used in the full, 41comp branched and 14compunbranched models (Fig. 10(a,b)). Note that even the 5 msISI doublet firing of the full model with RandSet1 (coloredsolid lines) was preserved by both reduced models (Fig. 10(a)). In contrast, the dendritic fI curves were closelypreserved by the 41comp branched model but not by the14comp unbranched model, which generally fired faster withthe same current injection input (Fig. 10(c)).
To quantify the ability of the reduced and full models toproduce similar output with the same densities across all 100parameter sets, we calculated the MAE between the full andreduced model output for each measure (6 rate points for eachfI curve and 801 voltage points for each spike shape). Thisyielded a set of 100 MAEs for each measure in each reducedmodel. We observed that increasing the number of compart-ments provided significantly smaller somatic spike shape andsomatic fI MAEs (p<0.05 with Bonferroni correction usingthe Mann-Whitney U test) for both branched and unbranchedreduced models in most cases (Fig. 10(a4,b4)) see Supple-mental Table S4 for all statistical comparisons, OnlineResource 1). In contrast, increasing the number of compart-ments while keeping the reduced model type fixed signifi-cantly decreased the median dendritic fI MAE in only oneinstance (from 59comp to 93comp branched reduced,Supplemental Table S4, Online Resource 1). Instead of acompartment number relationship, we observed that pre-served branching structure allowed much smaller MAEs forthe branched reduced models than for the unbranchedreduced models regarding the dendritic fI curve. Forexample, the median dendritic fI curve MAE exhibited bythe 93comp branched reduced model was significantly (p=1.9e-11, Mann-Whitney U test) smaller by 4.9 Hz than thatexhibited by the 98comp unbranched reduced model, despitehaving fewer compartments (Supplemental Table S4, OnlineResource 1). The differing ability of the branched andunbranched reduced models to reproduce full model dendriticresponses with identical conductance densities was verysimilar to the differing ability of the two types of reducedmodels to match the dendritic responses of the full model withthe tuned parameter set (Fig. 6). The similar deviationsbetween models for these 100 randomly generated parametersets support the general validity of our analysis tracing thesedifferences back to axial current and dendritic RIN mismatches.
Overall, we found that identical conductance densitiesallowed our unbranched reduced models to produce
somatic input output dynamics similar to those of the fullmodel, while the branched reduced models additionallyreproduced the dendritic input driven somatic outputdynamics of the full model.
4 Discussion
We developed a principled strategy to construct branched orunbranched reduced dendritic neuron models with fewcompartments and multiple active conductances that allowedus to keep the same channel densities as used in a fullmorphological model. Using thesemodels, we demonstrate thatfull model responses to somatic stimuli can be closely matchedby both branched and unbranched reduced models. In contrast,because of unavoidable differences in the local dendritic inputresistance of unbranched reducedmodel dendrites, responses todendritic input are less closely matched by this type of model ifdendrites contain voltage-gated currents, even if the remainingmajor dendrites are subdivided into many compartments. Somefull model properties could not be fully matched even bybranched reduced models, in particular when it came tomatching either bAP amplitudes with medium dendritic gNaor spiking responses to synaptic input with high dendritic gNa.We found that particular aspects of the passive structure ofreduced models explained particular unavoidable mismatcheswith full model activity. Specifically, the lumping of axialresistances in models with few compartments led to mis-matches in spike shapes and fI curves, while local dendritic RIN
and ZIN differences led to mismatches in responses todendritic stimuli and bAP amplitudes.
Despite these remaining mismatches, we show that manyaspects of full model activity, including rate and time codingwith dendritic inputs, can be well replicated by principledmodel reduction strategies and that different sets of voltagegated conductances result in similar activity patterns for eachtype of model.
4.1 Principles of morphological reduction
In passive models, many precise input responses can bemaintained if the dendritic tree of a full model meets twocriteria: 1) all branches follow the 3/2 power branching ruleand 2) there is equal electrotonic length from the soma toeach dendritic tip (Rall 1959, 1964). Like most biologicaldendritic trees, the dendritic tree of the full GP model didnot meet either of these criteria. The passive properties ofthis type of full model cannot be entirely preserved bymorphologically reduced models with altered electrotonicstructure (Holmes and Rall 1992). Preservation of dynamicsbecomes even more complicated with the addition ofvoltage and time dependent conductances to the membrane(Rall et al. 1992). Despite the need for a clear understanding of
318 J Comput Neurosci (2011) 30:301–321
active reduced model capabilities due to their widespreadadoption by modelers, it is not yet clear which active propertiescan and cannot be maintained following morphologicalreduction. Because an analysis of active model reductions isnot amenable to purely mathematical techniques, compartmen-tal modeling presents the best tool to explore relationshipsbetween the dynamics of full and reduced morphologies.
To understand the extent to which active full modeldynamics can be preserved by morphologically reducedmodels, we chose to examine the consequences of twoparticular morphological reductionmethods to create simplifieddendritic neuron models, one that preserved detailed dendriticbranching structure and one that did not. Different strategieshave been employed among previously used dendritic mor-phological reduction methods, usually without a detailedexamination of the consequences. Some studies use reducedmodels that maintain only a qualitative relationship betweenfull and reduced morphologies without preserving any partic-ular morphological features (Davison et al. 2000; Traub et al.1991; Wilson and Bower 1992). Another study examined thereduction of a full model with somatic but not dendriticconductances carefully, and described a method that conservesthe full model Ra at the expense of TSA (Bush and Sejnowski1993). More recent studies have employed reduction methodsthat preserve the TSA and RIN of the full model whileignoring its Ra (Destexhe 2001; Tobin et al. 2006). Wemaintained this strategy as our reduced models preserved fullmodel TSA and approximated somatic RIN when compart-ments of the most reduced models were sequentiallysubdivided. In addition, we preserved the electrotonic lengthof major dendritic branches (our unbranched models) or ofevery dendritic branchlet (our branched models). Our method,as with the methods of Tobin and Destexhe, can be used toconstruct reduced models both from previously existing fullmodels, but also to construct reduced models directly fromreconstructed morphologies and electrophysiological data.Furthermore, our method, like that of Tobin et al, allowschannel densities to be used in both full and reduced modelsto produce similar electrophysiological activity with somaticstimulation provided that there are a sufficient number ofreduced model compartments. This capability allows ourreduced models with >10 compartments to be used as fastsearch engines of full model parameter space.
4.2 The suitability of different levels of model reductionfor different applications
4.2.1 If complex dendritic processing is not required,then unbranched reduced models suffice
Computational efficiency is an important considerationwhen choosing which neuron models to incorporate intolarge networks, and in this respect unbranched reduced
models are preferable to branched reduced models becausefar fewer compartments are needed to yield satisfactorymatches to somatic input-output functions. For example,the unbranched reduced models presented here, particularlythe 14comp model, could be incorporated into existing GPnetwork models which currently use single compartment orsimpler models (Rubchinsky et al. 2003; Terman et al.2002). These models replicated the rate coding function forsomatic current injection well without altering the channeldensities of the full morphological model. Thus, they wouldallow the study of how individual voltage-gated conduc-tances may contribute to important features of somaticprocessing. Of course, if mathematical tractability ofanalyzing network activity patterns is desired, then evenmore simplified neuron models such as exponentialintegrate and fire neurons or low dimensional dynamicalsystem models are preferable (Herz et al. 2006; Izhikevich2004).
4.2.2 Network models in need of accurate synaptic codingwith active dendritic conductances can employ branchedreduced models
We showed that branched reduced models can closelymatch the spiking responses of the full model to dendriticcurrent injection or synaptic input, while the unbranchedreduced models provided less precise matches. However,the matches even of branched reduced models becamesignificantly worse if a high level of dendritic gNa alloweddendritic spike initiation. Overall, we found no reducedmodel that could accurately reproduce the pattern ofdendritic spike initiation shown by the full model, sincethis response is highly sensitive to the amplitude of localdendritic voltage fluctuations, which are not generallymatched by reduced models due to unavoidable deviationsin local input resistances. In contrast, bAPs could be closelymatched in branched reduced models, although in aparticular regime of intermediate dendritic gNa densitiessome branches showed increased amplification of bAPsonly in the full model. The interaction of bAPs is oftenconsidered important for spike time dependent plasticityrules (Gulledge et al. 2005; Letzkus et al. 2006), whichcould therefore generally be employed in network modelsusing branched reduced models, while unbranched modelswould be less suitable (though not completely inaccurate).
4.2.3 Applications that involve locally non-linear dendriticprocessing should only use full models
Our analysis of the dendritic properties of reduced and fullmodels revealed that dendritic RINs, and especially ZINs forbrief or fast-changing signals, cannot be matched for allregions of the dendrite in any model reduction. The local
J Comput Neurosci (2011) 30:301–321 319
dendritic ZINs determine the local voltage response tosynaptic input and therefore directly influence the amountof activation of voltage-gated conductances. This isparticularly apparent in models that allow dendritic spikeinitiation due to a high dendritic gNa, but also becomesimportant for fast transient events like bAPs.
4.2.4 Using reduced models to search the channel densityparameter space
Several studies have shown that it is of significant interestto explore the parameter space of full morphologicalmodels through evolutionary algorithms (Achard and DeSchutter 2006) or database methods (Gunay et al. 2008;Prinz et al. 2003). A large number of simulation runs arealso required to determine the sensitivity of a model tochannel density variations (Weaver and Wearne 2008).These methods are computationally expensive to carry outin full morphological models. Because our model reductionmethod was designed so that full model channel densitiescan be used to produce similar dynamics in the reducedmodel, it can increase the efficiency of parameter spaceexploration by 10–100 fold.
5 Conclusion
Reduced models are widely used, particularly in networksimulations due to their computational efficiency. Carefulvalidation of dendritic activity in reduced models is likelyimportant to achieve biologically realistic processing inlarge network simulations. Our findings indicate thatcarefully constructed reduced models with 10–50 timesfewer compartments than a full morphological model canaccurately reproduce somatic spontaneous and most synap-tically driven activities, while extremely simplified 1–5compartment models cannot. While some deviations fromfull morphological models were found for all reducedmodels, these were generally no larger than the biologicalvariability of the same features in the same cell type. Thedetailed dendritic branch structure made important contri-butions to processing only in the presence of strongdendritic non-linearities, such as local Na+ spike initiation,and should be considered in models employing suchmechanisms.
Acknowledgements This project was supported by National Instituteof Neurological Disorders and Stroke (NINDS) grant R01-NS039852 toDJ and National Science Foundation (NSF) DGE-0333411 IGERTfellowship to EBH.
Conflict of Interest Notification To the best of our knowledge, noconflicts of interests exist related to the work we present here.
Open Access This article is distributed under the terms of theCreative Commons Attribution Noncommercial License whichpermits any noncommercial use, distribution, and reproduction inany medium, provided the original author(s) and source arecredited.
References
Achard, P., & De Schutter, E. (2006). Complex parameter landscapefor a complex neuron model. PLoS Computational Biology, 2,794–804.
Bean, B. P. (2007). The action potential in mammalian centralneurons. Nature Reviews. Neuroscience, 8, 451–465.
Burke, R. E. (2000). Comparison of alternative designs for reducingcomplex neurons to equivalent cables. Journal of ComputationalNeuroscience, 9, 31–47.
Bush, P. C., & Sejnowski, T. J. (1993). Reduced compartmental-models of neocortical pyramidal cells. Journal of NeuroscienceMethods, 46, 159–166.
Caporale, N., & Dan, Y. (2008). Spike timing-dependent plasticity: aHebbian learning rule. Annual Review of Neuroscience, 31, 25–46.
Davison, A. P., Feng, J. F., & Brown, D. (2000). A reducedcompartmental model of the mitral cell for use in network modelsof the olfactory bulb. Brain Research Bulletin, 51, 393–399.
Destexhe, A. (2001). Simplified models of neocortical pyramidal cellspreserving somatodendritic voltage attenuation. Neurocomputing,38, 167–173.
Destexhe, A., Neubig, M., Ulrich, D., & Huguenard, J. (1998).Dendritic low-threshold calcium currents in thalamic relay cells.The Journal of Neuroscience, 18, 3574–3588.
Destexhe, A., Rudolph, M., & Pare, D. (2003). The high-conductancestate of neocortical neurons in vivo. Nature Reviews. Neuroscience,4, 739–751.
Gauck, V., & Jaeger, D. (2000). The control of rate and timing ofspikes in the deep cerebellar nuclei by inhibition. The Journal ofNeuroscience, 20, 3006–3016.
Golding, N. L., & Spruston, N. (1998). Dendritic sodium spikes arevariable triggers of axonal action potentials in hippocampal CA1pyramidal neurons. Neuron, 21, 1189–1200.
Gulledge, A. T., Kampa, B. M., & Stuart, G. J. (2005). Synapticintegration in dendritic trees. Journal of Neurobiology, 64,75–90.
Gunay, C., Edgerton, J. R., & Jaeger, D. (2008). Channel densitydistributions explain spiking variability in the globus pallidus: acombined physiology and computer simulation database approach.The Journal of Neuroscience, 28, 7476–7491.
Hanson, J. E., Smith, Y., & Jaeger, D. (2004). Sodium channels anddendritic spike initiation at excitatory synapses in globus pallidusneurons. The Journal of Neuroscience, 24, 329–340.
Herz, A. V. M., Gollisch, T., Machens, C. K., & Jaeger, D. (2006).Modeling single-neuron dynamics and computations: a balanceof detail and abstraction. Science, 314, 80–85.
Holmes, W. R., & Rall, W. (1992). Estimating the electrotonicstructure of neurons with compartmental-models. Journal ofNeurophysiology, 68, 1438–1452.
Holmes, W. R., & Woody, C. D. (1989). Effects of uniform andnon-uniform synaptic activation-distributions on the cableproperties of modeled cortical pyramidal neurons. BrainResearch, 505, 12–22.
Huys, Q. J.M., Ahrens, M. B., & Paninski, L. (2006). Efficient estimationof detailed single-neuron models. Journal of Neurophysiology, 96,872–890.
Izhikevich, E. M. (2004). Which model to use for cortical spikingneurons? IEEE Transactions on Neural Networks, 15, 1063–1070.
320 J Comput Neurosci (2011) 30:301–321

Johnston, D., & Wu, S. M. S. (1995). Foundations of cellularneurophysiology. Cambridge: MIT.
Kuznetsov, A. S., Kopell, N. J., & Wilson, C. J. (2006). Transient high-frequency firing in a coupled-oscillator model of the mesencephalicdopaminergic neuron. Journal of Neurophysiology, 95, 932–947.
Letzkus, J. J., Kampa, B. M., & Stuart, G. J. (2006). Learning rules forspike timing-dependent plasticity depend on dendritic synapselocation. The Journal of Neuroscience, 26, 10420–10429.
London, M., & Hausser, M. (2005). Dendritic computation. AnnualReview of Neuroscience, 28, 503–532.
Losonczy, A., Makara, J. K., & Magee, J. C. (2008). Compartmentalizeddendritic plasticity and input feature storage in neurons. Nature,452, 436–U433.
McCormick, D. A., Shu, Y. S., & Yu, Y. G. (2007). Hodgkin andHuxley model—still standing? Nature, 445, E1–E2.
Naundorf, B.,Wolf, F., &Volgushev,M. (2006). Unique features of actionpotential initiation in cortical neurons. Nature, 440, 1060–1063.
Prinz, A. A., Billimoria, C. P., & Marder, E. (2003). Alternative tohand-tuning conductance-based models: construction and analysisof databases of model neurons. Journal of Neurophysiology, 90,3998–4015.
Prinz, A. A., Bucher, D., & Marder, E. (2004). Similar networkactivity from disparate circuit parameters. Nature Neuroscience,7, 1345–1352.
Rall, W. (1959). Branching dendritic trees and motoneuron membraneresistivity. Experimental Neurology, 1, 491–527.
Rall, W. (1964). Theoretical significance of dendritic trees for neuronalinput-output relations. In R. F. Reiss (Ed.), Neural theory andmodeling (pp. 73–97). Stanford: Stanford University Press.
Rall, W., Burke, R. E., Holmes, W. R., Jack, J. J. B., Redman, S. J., &Segev, I. (1992). Matching dendritic neuron models toexperimental-data. Physiological Reviews, 72, S159–S186.
Rubchinsky, L. L., Kopell, N., & Sigvardt, K. A. (2003). Modelingfacilitation and inhibition of competing motor programs in basal
ganglia subthalamic nucleus-pallidal circuits. Proceedings of theNational Academy of Sciences of the United States of America,100, 14427–14432.
Schaefer, A. T., Larkum, M. E., Sakmann, B., & Roth, A. (2003).Coincidence detection in pyramidal neurons is tuned by theirdendritic branching pattern. Journal of Neurophysiology, 89,3143–3154.
Terman, D., Rubin, J. E., Yew, A. C., & Wilson, C. J. (2002). Activitypatterns in a model for the subthalamopallidal network of thebasal ganglia. The Journal of Neuroscience, 22, 2963–2976.
Tobin, A. E., Van Hooser, S. D., & Calabrese, R. L. (2006). Creationand reduction of a morphologically detailed model of a leechheart interneuron. Journal of Neurophysiology, 96, 2107–2120.
Traub, R. D., Kopell, N., Bibbig, A., Buhl, E. H., LeBeau, F. E. N., &Whittington, M. A. (2001). Gap junctions between interneurondendrites can enhance synchrony of gamma oscillations indistributed networks. The Journal of Neuroscience, 21, 9478–9486.
Traub, R. D., Wong, R. K. S., Miles, R., &Michelson, H. (1991). Amodelof a CA3 hippocampal pyramidal neuron incorporating voltage-clamp data on intrinsic conductances. Journal of Neurophysiology,66, 635–650.
Vanier, M. C., & Bower, J. M. (1999). A comparative survey ofautomated parameter-search methods for compartmental neuralmodels. Journal of Computational Neuroscience, 7, 149–171.
VanRullen, R., Guyonneau, R., & Thorpe, S. J. (2005). Spike timesmake sense. Trends in Neurosciences, 28, 1–4.
Ward, L. M. (2003). Synchronous neural oscillations and cognitiveprocesses. Trends in Cognitive Sciences, 7, 553–559.
Weaver, C. M., & Wearne, S. L. (2008). Neuronal firing sensitivity tomorphologic and active membrane parameters. PLoS ComputationalBiology, 4, e11.
Wilson, M., & Bower, J. M. (1992). Cortical oscillations and temporalinteractions in a computer-simulation of piriform cortex. Journalof Neurophysiology, 67, 981–995.
J Comput Neurosci (2011) 30:301–321 321