Embed Size (px)
Citation preview

THE BUSINESS CASE FOR DIABETES DISEASE
MANAGEMENT AT TWO MANAGED CARE ORGANIZATIONS:
A CASE STUDY OF HEALTHPARTNERS AND
INDEPENDENT HEALTH ASSOCIATION
Nancy Dean Beaulieu
Harvard Business School
David M. Cutler and Katherine E. Ho
Harvard University
Dennis Horrigan
Independent Health Association
George Isham
HealthPartners
FIELD REPORT
April 2003 Support for this research was provided by The Commonwealth Fund. The views
presented here are those of the authors and should not be attributed to The Commonwealth
Fund or its directors, officers, or staff.
Copies of this report are available from The Commonwealth Fund by calling our toll-free
publications line at 1-888-777-2744 and ordering publication number 610. The report
can also be found on the Fund’s website at www.cmwf.org.

iii
CONTENTS
List of Tables and Figures................................................................................................ iv
About the Authors ........................................................................................................... v
Executive Summary....................................................................................................... vii
Diabetes: The Disease and Treatments .............................................................................1
The Business Environment for Diabetes Care ..................................................................6
Costs and Benefits of Diabetes Care ............................................................................... 11
Diabetes Disease Management at HealthPartners ............................................................ 17
Diabetes Disease Management at Independent Health .................................................... 35
Differences Between Independent Health Association and HealthPartners ...................... 51
Appendix....................................................................................................................... 56

iv
LIST OF TABLES AND FIGURES
Table ES-1 Projected Benefits and Costs of HealthPartners Diabetes Disease Management over 10 Years............................................................... vii
Table 1 Costs and Benefits of Diabetes Management Programs ............................ 14
Table 2 Projected Benefits and Costs of HealthPartners Diabetes Disease Management over 10 Years............................................................... 32
Table A-1 Component Listing of HealthPartners’ Diabetes Care Management and Prevention Programs .................................................................. 56
Table A-2 Description of Independent Health Disease Management Program.......... 57
Table A-3 Independent Health: Program and Population Statistics by Year and Line of Business.......................................................................... 60
Table A-4 Independent Health: Average Annual Utilization by Line of Business ..... 63
Table A-5 Independent Health: Decomposition of Total Claims by Site of Service and Evidence of HbA1c Test................................. 65
Table A-6 Independent Health: Time Pattern of Total Non-Prescription Claims..... 68
Figure 1 HEDIS Comprehensive Diabetes Care Rates: Unweighted Plan Averages, 2000............................................................................5
Figure 2 HealthPartners: Diabetes Program Timeline............................................ 24
Figure 3 Mean HbA1c Levels of HealthPartners Medical Group Diabetic Patients ............................................................................... 30
Figure 4 Mean LDL Levels of HealthPartners Medical Group Diabetic Patients .... 30
Figure 5 Percent of Tested Diabetic Patients with HbA1c Levels Less than 9.5% and Less than 8% ...................................................................... 31
Figure 6 Change in HealthPartners Net Benefits from Diabetes Program over Time......................................................................................... 33
Figure 7 Mean HbA1c Levels Among IHA Diabetic Members, 1998–2000 .......... 45
Figure 8 Mean LDL Levels Among IHA Diabetic Members, 1998–2000 .............. 46
Figure 9 Frequency of HbA1c Testing Among IHA Diabetic Members, 1998–2000........................................................................................ 46
Figure 10 Percent of IHA Diabetic Members with HbA1c Levels Less than 9.5% ... 47
Figure 11 Percent of IHA Diabetic Members with HbA1c Levels Less than 8.0% ... 47
Figure 12 Percent of IHA Diabetic Members with HbA1c Levels Less than 7.0% ... 48
Figure 13 IHA Commercial Population Total Non-Prescription Claims, 1997–2000........................................................................................ 50
Figure 14 IHA Medicaid Population Total Non-Prescription Claims, 1997–2000........................................................................................ 50

v
ABOUT THE AUTHORS
Nancy Dean Beaulieu is an assistant professor of business administration at Harvard
Business School, David Cutler is professor of economics at Harvard University, and
Katherine Ho is a doctoral candidate in business economics at Harvard University.
Dennis Horrigan and George Isham were the key team members at Independent
Health and HealthPartners, respectively.

vii
EXECUTIVE SUMMARY
Diabetes is one of the most common—and most costly—chronic diseases. Lack of
proper treatment can lead to blindness, end-stage renal disease, nerve damage and
amputations, heart disease, or stroke. Diabetes care is often poorly managed, and the
disease exacts a high toll on society in terms of health costs and lost productivity. Analysis
of two health plans with established diabetes programs shows that the business case for
diabetes disease management is weak. The initial costs for such programs are substantial,
and plans may not be able to reap the potential savings until 10 years after a health plan
member is enrolled in the program.
The authors estimated that net savings under the HealthPartners diabetes
management program would be only about $75 per patient. Although the economic
returns to health plans would be minimal, there would be substantial potential gains to
society. For example, a diabetic patient who spent 10 years in the program would
experience a benefit of $31,000 in improved length and quality of life.1 At Independent
Health, researchers found that diabetes testing rates and some results improved after the
initiation of the plan’s disease management program, but they failed to find proof of
substantial short-term medical cost savings attributable to the program.
Table ES-1. Projected Benefits and Costs of HealthPartners Diabetes Disease Management over 10 Years
Benefits* Costs** Patient Improved length/quality of life
$31,000 patient
Higher premium for health insurance Out-of-pocket expenses (e.g., copayments) $0 per patient
Plan/Provider Potential long-run cost savings due to lower use of acute services over time $405 per patient Higher premium for DM program $0 per patient
Operating costs $330 per patient
* Dollar benefits are total discounted benefits that would accrue over the patient’s lifetime. ** Dollar costs are total discounted costs assuming the patient’s participation in the program for 10 years. Source: Authors’ analysis.
1 Based on a conventional attributed economic value for a quality-adjusted life year of $100,000. Data for 1994 and 2001–04 are estimates formed in discussion with HealthPartners analysts.

viii
Program Design
The diabetes management programs at HealthPartners, an HMO in Minneapolis,
Minnesota, and Independent Health Association, an HMO in Buffalo, New York,
emphasize patient and physician education, adherence to clinical guidelines, and nurse case
management. Among other activities, HealthPartners identifies and alerts physicians to
members at risk of developing diabetes, measures and reports physician performance and
offers bonuses for above-average performance, and uses diabetes educators as liaisons
between physicians and endocrinologists. The plan operates a telephone information line
and programs about weight control and other lifestyle changes for members. In a similar
program, the Independent Health Association tracks members according to risk, charts
medication and tests, and disseminates educational information about diabetes. The plan
also holds educational programs for clinical office staff and sends performance information
to physicians.
Potential Savings and Costs
In creating diabetes management programs, health plans and providers incur set-up and
operating costs, and possibly costs related to adverse selection should the plan attract more
diabetic enrollees without being reimbursed. On the other hand, plans and providers may
experience lower costs through reduced use of acute services and higher reimbursement
for the disease management program (assuming that consumers/employers would pay
higher premiums and/or copayments). Employers would likely reap substantial benefits
from improved care for diabetics in the form of reduced medical care costs over the long
term, reduced disability payments, reduced absenteeism, and enhanced productivity.
Fewer diabetes-related complications and illnesses would also mean savings for the
Medicare and Medicaid programs.
Challenges
There are several explanations for the weak business case for diabetes disease management.
High rates of patient turnover in health plans mean that plans may pay the up-front costs
of diabetes management but fail to reap the long-term cost savings from averted
complications and improved patient health. In addition, a plan or provider known for
good diabetes care may attract more diabetic enrollees and lose profitability on these
higher-cost patients.
There are additional challenges related to the organization of provider networks.
Physicians often serve patients with many different health plans, and it may be difficult for
an individual plan to enlist physicians in its disease management program. Should a
physician make improvement in care delivery as a result of a health plan’s encouragement,

ix
it may be difficult for the plan to reap the cost savings for itself. Coordinating diabetes
management care among providers, specialists, and nurses, and between providers and
health plans, is also difficult.
Implementing quality-based reimbursement runs afoul of the usual problems of
quality measurement and risk adjustment. Health plans may be unable to convince payers
to reimburse them for providing high-quality diabetes care, even if patients benefit greatly
from it. Providers, meanwhile, are limited by fee-for-service reimbursement systems,
which provide minimal, if any, payments for such disease management services as
reminder systems, group management visits, and electronic communications. It is also
difficult to convince physicians—who traditionally focus on delivery of acute care
services—to partner with patients in the management of their disease. Similarly, it is
difficult to encourage patients, who are accustomed to being on the receiving end of care,
to take responsibility for their own care.
Policy Recommendations
To make diabetes management more attractive to health plans, a financing system that
pays plans and providers on the basis of quality of services would need to be put into
place. For example, fee-for-service payments could add reimbursement for group visits
and electronic communications. Moreover, the institutions that benefit from improved
diabetes care, including Medicare, Medicaid, and employers, could contribute to the
financing of diabetes disease management. Payments to health plans and providers could
also be adjusted to compensate for adverse selection.

1
THE BUSINESS CASE FOR DIABETES DISEASE MANAGEMENT AT
TWO MANAGED CARE ORGANIZATIONS: A CASE STUDY OF
HEALTHPARTNERS AND INDEPENDENT HEALTH ASSOCIATION
DIABETES: THE DISEASE AND TREATMENTS
Description of the Disease and Health Consequences
Diabetes is a disease in which the body fails to produce or properly use insulin and
therefore cannot adequately break down sugars and starches. It is one of the most common
and costly of all chronic diseases. Its cause is unknown, although both genetics and
environmental factors such as obesity and lack of exercise predispose individuals to the
disease. There are two major types of diabetes:
• Type 1 diabetes, in which the body does not produce any insulin, occurs most
frequently in children and young adults. The only effective treatment is through
daily insulin injections. Type 1 diabetes accounts for between 5 and 10 percent of
diabetes.
• Type 2 diabetes is a metabolic disorder resulting from the body’s inability to make
enough, or properly use, insulin. It accounts for 90 to 95 percent of all cases of
diabetes. Incidences of blindness, end-stage renal disease, amputations, and heart
disease related to this type of diabetes are nearing epidemic proportions due to
greater numbers of older Americans and greater prevalence of obesity and
sedentary lifestyles.
Diabetes is the leading cause of blindness in people ages 20 to 74 (between 12,000
and 24,000 cases of blindness annually due to diabetes, according to the American
Diabetes Association, and the leading cause of end-stage renal disease (ESRD), accounting
for around 40 percent of new cases (for example, roughly 28,000 people began treatment
for ESRD because of diabetes in 1995).2 In addition, about 60 to 70 percent of people
with diabetes have mild to severe forms of diabetic nerve damage; in severe cases, this
nerve damage can lead to lower limb amputations. Each year, more than 56,000
amputations are performed among people with diabetes. Finally, people with diabetes are
two to four times more likely to have heart disease or suffer a stroke than individuals
without diabetes. Heart disease is present in 75 percent of diabetes-related deaths (77,000
deaths among diabetics due to heart disease annually).
2 All general diabetes statistics are from American Diabetes Association website, www.diabetes.org.

2
Treatment Programs
Treatment protocols for diabetics depend on the severity of the illness. For mild cases,
patients are counseled on diet and exercise regimens that will delay the onset of more
severe disease. In addition, patients are encouraged to have regular blood tests to monitor
disease progression. For patients with more severe cases, physicians prescribe a variety of
medications. Type 2 patients are generally prescribed oral medications such as Glipizide,
Glyburide, or a relatively new drug, metformin (also known as glucophage). The drugs
either cause the patient’s pancreas to produce more insulin or enhance sensitivity to the
insulin he naturally produces. Type 1 patients, and Type 2 patients whose diabetes is not
controlled by oral agents, are prescribed daily insulin injections. In addition to taking the
prescribed medications, patients are counseled to have blood sugar levels tested biannually,
and to undergo a variety of other examinations to monitor for complications from diabetes.
Guidelines
There are two types of guidelines for diabetes management. The first, issued to physicians
and by physicians to individual patients, focuses on day-to-day lifestyle choices. For
example, the American Diabetes Association website tells patients: “In addition to taking
your diabetes medicine, you can have a positive impact on your blood sugar and your health
by choosing foods wisely, staying active and reducing your stress level.”3 However, not
surprisingly, many patients have difficulties implementing these fundamental lifestyle changes.
The second type of guideline, for physicians only, recommends processes for
managing the care delivered to diabetic patients. While they do not cover detailed issues
such as specific drug regimens, they do set out target test frequencies and control levels for
the different variables tested:
• Twice annual testing of Hemoglobin A1c levels (the proportion of red blood cells
that are attached to glucose molecules; a measure of average blood sugar over the
previous two to three months)
• Daily patient self-monitoring of blood sugar levels
• Annual blood pressure tests
• Annual testing of cholesterol (LDL) levels
• Annual examination of patients’ eyes and feet
Sources: ADA and National Committee for Quality Assurance.
3 www.diabetes.org

3
Prevalence and Patient Populations
In 1997, 10.3 million Americans reported being treated for diabetes, according to the
Centers for Disease Control and Prevention, and an additional 5.4 million are believed to
have had undiagnosed diabetes. The American Diabetes Association estimates that the
incidence of diabetes was about the same in 2001. Diabetes is the seventh-leading cause of
death (sixth-leading cause of death by disease) in the United States and is also a big
contributor to other diseases. For example, people with diabetes have a twofold to
fourfold increased risk for cardiovascular disease and stroke.
According to the medical literature, between 3 and 10 percent of a typical health
plan’s members have diabetes; the exact proportion depends on the number of Medicare
patients in the plan. According to the Center for the Advancement of Health, 6 percent of
the population had diabetes in May 2000; Type 2 diabetes alone affects more than 3
percent of all adults and more than 10 percent of those older than 65 years.
Review of Cost-Effectiveness Literature
There is considerable literature suggesting that diabetes and other chronic disease
management programs can generate net cost savings within six to 10 years. Numerous
papers provide evidence that diabetes management programs lead to reductions in blood
glucose levels.4 The Diabetes Control and Complications Trial, which tracked patients
over 6.5 years, produced evidence that these reduced blood glucose levels effectively
delayed the onset and slowed the progression of complications in Type 1 diabetic patients,
thereby significantly reducing costs of care.5 The U.K. Prospective Diabetes Study Group
tracked Type 2 diabetics over 10 years and led to similar results.6
However, the evidence on benefits in the short- to medium-term is less
conclusive. Several papers give evidence that diabetes programs have the potential to
reduce costs within one year, not through reductions in complications but through lower
4 Trento M et al. Group Visits Improve Metabolic Control in Type 2 Diabetes: A 2-Year Follow-Up.
Diabetes Care June 2001; Wagner E D et al. Quality Improvements in Chronic Illness Care. Journal on Quality Improvement 27, 2001; Sidorov J et al. Disease Management for Diabetes Mellitus: Impact on Hemoglobin A1c. The American Journal of Managed Care, 2000; Aubert R E et al. Nurse Case Management to Improve Glycemic Control in Diabetic Patients in an HMO. Annals of Internal Medicine 129, 1988:605–612.
5 The Diabetes Control and Complications Trial Research Group. The Effect of Intensive Treatment of Diabetes on the Development and Progression of Long-term Complications in Insulin-Dependent Diabetes Mellitus. The New England Journal of Medicine, 1993.
6 U.K. Prospective Diabetes Study Group. Intensive Blood-Glucose Control with Sulphonylureas or Insulin Compared with Conventional Treatment and Risk of Complications in Patients with Type 2 Diabetes. The Lancet 352, 1998.

4
utilization.7 At least one carve-out disease management vendor, a private vendor that
assumes full financial risk for patients, has provided similar evidence.8 Two other studies
suggest that reduced HbA1c levels result in reduced health care utilization costs within
one to two years.9 But at least two more studies contradict these findings, finding that the
programs may not or do not improve HbA1c levels or reduce costs.10 No published papers
to our knowledge have tracked the economic effects of a diabetes management program in
a single health plan over time to find out whether the economic benefits actually
outweighed the costs for that organization.
Quality Measurement
The set of measures commonly used to assess quality of care for diabetics was designed
jointly by the Centers for Medicare and Medicaid Services (formerly Health Care
Financing Administration) and the National Committee for Quality Assurance (NCQA)
Diabetes Quality Improvement Project. The six key measures, which are incorporated
into NCQA’s Health Plan Employer Data and Information Set (HEDIS) in 2000, are the
percentage of the diabetic population with:
• HbA1c tested in the last year
• Poor HbA1c control (HbA1c > 9.5%)
• Eye exam performed in the last year
• Lipid profile performed in the last year
• Lipids controlled (LDL-C < 130 mg/dL)
• Monitoring for diabetic nephropathy (kidney disease) at least once in the past year
It is generally perceived that there is a failure to ensure good diabetes control
among the diabetic population as a whole. This perception is supported by the graph
below, which displays HEDIS data for the year 2000. Following the 2000 NCQA report
“Measuring the Quality of America’s Healthcare,” the percentages given are unweighted
7 Sadur C N et al. Diabetes Management in a Health Maintenance Organization: Efficacy of Care
Management Using Cluster Visits. Diabetes Care 22, December 1999; Lisa Ketner. Population Management Takes Disease Management to the Next Level. Healthcare Financial Management, August 1999.
8 Rubin R et al. Clinical and Economic Impact of Implementing a Comprehensive Diabetes Management Program in Managed Care, Journal of Clinical Endocrinology and Metabolism, 83, 1998.
9 Wagner E H, Sandhu N et al. Effect of Improved Glycemic Control on Health Care Costs and Utilization. JAMA 285, January 10, 2001; Testa MA et al. Health Economic Benefits and Quality of Life During Improved Glycemic Control in Patients With Type 2 Diabetes Mellitus. JAMA, November 4, 1998.
10 Klonoff D C and Schwartz D M. An Economic Analysis of Interventions for Diabetes. Diabetes Care 23, 2000; Wagner E H et al. Chronic Care Clinics for Diabetes in Primary Care: A System-Wide Randomized Trial. Diabetes Care, April 2001.

5
averages of individual plan values; this approach provides the best information available
about the average health plan. It is clear that, while most plans had reasonable testing rates
for HbA1c and Cholesterol levels (over 70% of patients tested within the last year on
average), the proportion of patients with poor HbA1c control or poor cholesterol control
(as defined by HEDIS) or without a kidney or eye exam in the past year was close to
50 percent.11
41.4
48.1
78.4
42.5
76.5
44.3
0 20 40 60 80 100
HbA1c Test Rate
Poor HbA1c Control
Cholesterol Screening Rate
Cholesterol Control
Monitoring Kidney Disease
Eye Exam Rate
Figure 1. HEDIS Comprehensive DiabetesCare Rates: Unweighted Plan Averages, 2000
Source: National Committee for Quality Assurance, State of Managed Care Quality Report, 2001.
11 The HEDIS measures set fairly low standards for diabetes management. For example, they define
“poor HbA1c control” as “HbA1c level more than 9.5 percent.” The ADA targets are more stringent: in order to receive ADA Provider Recognition physician groups have to ensure that 55 percent of adult patients have HbA1c levels less than 8 percent, implying that this is the ADA’s definition of HbA1c control. Many plans set even more ambitious targets internally. The goal at HealthPartners is to test HbA1c levels every 3–6 months and to keep HbA1c levels under 7 percent. Judging by these standards, average control in the diabetic population would be worse than that illustrated in the graph.
6
THE BUSINESS ENVIRONMENT FOR DIABETES CARE
Providers and Sites of Care
In most cases, diabetes care is coordinated and controlled by a patient’s primary care
physician (PCP). The typical physician practice is organized to respond to the acute and
urgent needs of patients and is not focused on helping individual patients manage their
chronic illness. Normally, a diabetic patient visits his or her PCP once each year, the PCP
orders the recommended tests and examinations (e.g., HbA1c, eye exams), and prescribes
medication as necessary. Foot exams, HbA1c tests, and tests for kidney disease are typically
performed at the PCP’s office. The annual retinal exam is generally performed by a
specialist at a separate location. Ideally, the patient self-monitors his or her insulin and/or
blood glucose level on a daily basis and contacts the PCP if changes occur. If necessary,
the PCP refers the patient to a specialist (e.g., an endocrinologist or a podiatrist) and/or
admits the patient to the hospital. Any of the complications described above, such as
blindness, end-stage renal disease, and coronary artery disease, can lead to hospitalization
or to an emergency room visit.
One issue that emerges from this care structure is the challenge of coordinating of
care between PCPs and specialists, and in particular between PCPs and endocrinologists.
While the PCP has nominal control over the patient’s care, this changes when the patient
is referred to an endocrinologist and begins a cycle of repeat visits to the specialist that may
partly or fully replace those to the PCP. In this transfer, information about the patient and
the patient’s care management program is fragmented and sometimes lost. Furthermore,
lifestyle and behavioral change support (provided by diabetes educators, health educators,
and exercise or counseling physiologists) is often not coordinated from the physician’s
office. This lack of coordination can reduce the quality and coherence of care provided, and
is one of the problems addressed by new disease management programs, discussed below.
Health Care Resources for Treating Diabetes
Diabetes treatment requires considerable health care resources each year. Diabetes-related
hospitalizations totaled 13.9 million days in 1997, according to the ADA, and the mean
length of stay was 5.4 days. In the same year, patients with diabetes made 30.3 million
physician office visits.
Insurance Policy Coverage
Diabetes-specific coverage in the typical insurance policy varies by state because of
differences in state regulations. In addition, self-insured employers are exempt from state
regulations. Traditionally, many government and private payers have reimbursed providers

7
for acute care treatment and hospitalization, but have not covered preventive services and
education. In the last few years the situation has changed. At the federal level, the
Balanced Budget Act of 1997 expanded Part B Medicare, for ambulatory care and related
services, to include coverage for diabetes self-management training services when ordered
by a physician. Medicare also covers testing supplies such as glucose strips. In addition, the
American Diabetes Association has led a campaign to expand private coverage to
preventive services. By October 2000, 38 states had passed legislation requiring state-
regulated health insurance plans to provide coverage for diabetes supplies (e.g., insulin, test
strips, and meters) and self-management education as part of basic coverage at no
additional cost. There is currently wide variation in coverage. For example, in 2000, at
least one HMO in Wisconsin paid pharmacists $1 per minute for services related to
management of diabetes, whereas HMOs in other states reimbursed only for acute care
treatment. The ADA’s goal is to encourage more preventive services to be delivered to
diabetics and is working on passing legislation to this effect in the remaining states by the
year 2003.
Reimbursement and Financing for Diabetes Care
Physicians do not in general receive special reimbursements for their diabetic patients. In
fee-for-service payment systems, useful new arrangements such as group visits are not
generally reimbursed separately from single-patient visits. Furthermore, if providers are
paid on a fee-for-service basis, they may be unable to pass on fixed costs, such as the costs
of information technology, to the health plan. Intuitively, one would think that capitation
would allow providers the greatest flexibility in choosing the types of services to deliver to
diabetic patients. However, if providers are paid on a capitation basis without adequate
risk adjustment, these providers will be penalized financially from an increase in the
number of diabetics on their panels. This would generate disincentives for providers to
deliver high-quality care to diabetics. The extent to which risk adjustment systems
currently in use adequately compensate for the care of diabetics is not known. The
Hierarchical Coexisting Conditions index has been shown to lead to diabetes prediction
error of less than 15 percent in many cases, but the prevalence of its use in adjusting
physician payments is unknown.
Disease Management Programs
Over the last five to 10 years, new types of care management strategies for diabetes have
emerged and been adopted by some providers. They all fall under the definition of disease
management. Different programs offer different services, but a few key elements are
common to all programs. The basic idea is that diabetic patients’ long-term health can be
improved and medical care costs can be saved if patients learn about their disease and

8
become active participants in managing their health. The focus of disease management is
on prevention and control rather than on acute care. The aim is to improve the
coordination of care and reduce the number of hospitalizations and severe complications
among diabetic patients. The key elements of these programs are educational and support
services to help the patient understand and manage his or her disease and a comprehensive
monitoring process to provide feedback to assist the patient in controlling the condition
successfully. The program is generally coordinated at health plan level rather than at the
physician level, largely because the plan is in the best position to pull together all the
information needed to track the patient’s health status (from laboratories, specialists, PCPs,
and pharmacies). Because health plans often receive a fixed per member payment from a
payer (an employer, the government, or the patient) and thus bear the financial risk, the
health plan may have the most clear financial incentive to keep the patient healthy.12
The monitoring and tracking components of a disease management program can
be organized in a number of ways. One fairly common practice is a system by which
patients are reminded, either by phone or mail, of future test and checkup dates. Registries
are also used to track test results and alert the PCP or nurse if tests are not performed, if
the results indicate a change in the disease progression, or if test results suggest some acute
condition requiring immediate treatment. A less common practice involves more
comprehensive tracking and sharing of laboratory, claims, and pharmacy data to enhance
coordination of patient care. These data can be used by PCPs, specialists, and pharmacists
to surround a patient with a “virtual care team” that coordinates health care delivery and
delivers the appropriate level of care in a timely manner.
Disease management programs often involve education and support services from
certified diabetes education providers or pharmacists as well as from printed materials
provided by their PCP. Patients often receive case management, advice, and telephone
follow-up from a dedicated nurse, who will refer them to their PCP when necessary and
coordinate the provision of specialty care. Patients may also be encouraged to participate
in educational sessions provided by other specialists such as nutritionists, exercise
counselors, and certified educators.
The third possible element of diabetes disease management programs involves
identifying health plan members who are at risk of developing diabetes. Members are
checked using pharmacy and lab data and various types of questionnaires and surveys.
Once these members are identified as being at-risk, they are encouraged to implement
12 When the payer is self-insured, as is the case with many large employers, the health plan provides
only administrative services and does not bear any financial risk for the volume or cost of care delivered.
9
lifestyle changes to avoid developing full-blown diabetes. Identification of members who
are at risk of developing diabetes requires substantial data collection and sophisticated data
analysis tools; because many health care organizations lack the information systems
necessary to implement at-risk identification, few organizations have implemented this
component of disease management.
Carve-Ins and Carve-Outs:
The Delivery of Diabetes Disease Management Programs
There are three general models of diabetes disease management: “carve-outs,” “carve-ins,”
and the integrated delivery system model. In a carve-out arrangement, a private disease
management vendor typically takes on full risk for the care of patients with specific diseases
such as diabetes. The health plan identifies its diabetic patients and the vendor is placed
financially at risk for the costs of patient medical care and is responsible for coordinating all
aspects of care for those patients. Frequently, the vendor is also involved with other
chronically ill patients of the same health plan, for example those with asthma or
hypertension. In a carve-in arrangement, the outside vendor partners with the health plan
or provider, offering its special expertise but not taking on risk for the patient population.
Carve-ins became popular when carve-outs were seen to be working fairly effectively and
physicians wanted more involvement in the care of their patients. In a typical carve-in, the
vendor would provide the information technology systems needed to set up and maintain
a patient registry. The Integrated Delivery System model entails complete integration of all
elements of the disease management program. The plan or provider develops all elements
of the program in-house, with no help from an external vendor.
The Role of Employers
While not the focus of this case study, employers may play a potentially important role in
the financing and delivery of diabetes disease management services. The existing literature
suggests potentially large benefits to employers (particularly self-insured employers) for
effective management of diabetes among employees.13 These benefits derive from a
number of sources: reduced medical care costs over the long term, reduced disability
payments, reduced absenteeism, and enhanced productivity. The additional costs
associated with enhanced diabetes management derive from potential increases in health
insurance premiums (or separate payments to providers of carve-out programs) and
potential adverse selection.
13 Testa M, Simonson D. Health Economic Benefits and Quality of Life During Improved Glycemic
Control in Patients with Type 2 Diabetes Mellitus: A Randomized, Controlled, Double-Blind Trial. JAMA 280, November 1998:1490–1496; Ng, Y C, Jacobs P, Johnson J A. Productivity Losses Associated with Diabetes in the U.S. Diabetes Care Volume 24, 2001; Ramsey S. et al. Productivity and Medical Costs of Diabetes in a Large Employer Population. Diabetes Care 25, 2002:23–29.
10
Adverse selection could affect employers through two different routes. First,
effective chronic disease management programs are likely to be most valued by individuals
who either already have these diseases or think they are likely to have the diseases in the
future. Hence, the offering of such programs could attract less healthy employees to work
at the corporation. Second, when the corporation offers multiple health plans for
employees to choose from, and when payments to the health plans are not adjusted for the
relative health of the employees selecting each plan, adverse selection among health plans
offered by a single employer may lead to overall higher premiums and health plan death
spirals.14 Employers might avoid some of the potential costs associated with adverse
selection by carving disease management programs out of the health insurance benefit they
offer to all employees and possibly requiring some copayment from those employees who
would enroll in the carved-out programs. It should be noted that it is unknown whether
carved-out diabetes disease management are more, less, or equally effective as diabetes
disease management programs offered as integral part of a traditional health benefit
delivered through a managed care organization.
Three other issues arise for employers considering whether or not to offer a
diabetes disease management program. First, employers will only realize benefits from
these programs if their employee turnover is low: complications prevented 10 years in the
future will not interest a firm whose employees move on after two or three years’
employment. Second, the literature suggests that patients must remain in the program for a
significant period of time to experience health benefits. If the patient switches plans—or
even switches physicians within the plan, from one who implements the diabetes program
adequately to another who does not—then his or her diabetes will not be effectively
controlled. These factors suggest that, in order to reap the benefits from enrolling
employees in diabetes disease management, the employer and the employee must enter a
relatively long-term relationship with the providers of diabetes disease management. For
the employer, this might impose restrictions on the employer’s selection of health plans
that could affect efficiency in terms of a reduction in price competition between plans.
Finally, anecdotal evidence suggests that employers are unwilling to pay for
enhanced diabetes disease management. This unwillingness may be due to a number of
factors. Future research is needed to understand the informational, financing, and/or
organizational barriers to this phenomenon.
14 Cutler, D and Reber, S. Paying for Health Insurance: The Trade-Off Between Competition and
Adverse Selection. Quarterly Journal of Economics113, 1998:433–466.

11
COSTS AND BENEFITS OF DIABETES CARE
There is a general belief among many in the medical profession that diabetes
management programs are effective in improving and maintaining health; in the long term
these programs succeed in reducing the incidence of severe complications (e.g., blindness,
amputations, and end-stage renal disease) in diabetic patients. We believe that the benefits
of these programs for society as a whole will outweigh their costs when changes in
beneficiaries’ length and quality of life are considered. It may even be the case, at the
society level, that the health care cost savings from reduced complications outweigh the
costs of additional specialized services (i.e., ignoring quality of life benefits). However,
individual actors and organizations in the health care delivery system may or may not
experience a positive net benefit from these programs. The individual costs and benefits,
and the constituencies to which they accrue, are described below and summarized in the
table at the end of this section.
Costs
The costs associated with implementing diabetes management programs fall on two sets of
players: patients and plans/providers. We combine health plans and providers in this
analysis because the division of costs and benefits of diabetes disease management between
these parties depends on the specific contracting arrangements in place. The only direct
costs paid by patients will be those that the health plan succeeds in passing on to them,
either through increased premiums or through out-of-pocket costs such as copayments.
Together, plans and providers face three categories of costs: set-up costs, direct
operating costs, and indirect costs resulting from changes in enrollment and utilization of
services. Set-up costs are incurred once, when the program is initiated, and are relatively
independent of the scale of the program. For example, investment in information
technology systems is often needed to track patients’ test dates and the results of their tests.
Similarly, there will be predictable staffing costs necessary to design and launch the
program (i.e., leadership time will be needed to oversee the program and ensure that it is
fully implemented). Other one-time set-up costs that are dependent on the scale of the
program are the costs involved in educating providers and patients.
Operating costs are primarily comprised of the human resources necessary to
deliver services in a coordinated fashion. Additional nurses or administrative staff will be
required to remind patients of tests and checkups and monitor their health status. There
are other operating costs that will be less predictable, caused by improved patient
compliance with diabetes treatment protocols. For example, the frequency of patient visits

12
to PCPs may well go up, at least for those programs not coordinated by a nurse case
manager. There may be more visits to nutritionists and exercise counselors (who may now
be available at the primary care clinic as well as the local hospital). If patients are more
aware of how to control their symptoms, their use of medication may go up, with an
accompanying increase in costs for these drugs. In addition, laboratory and diagnostic
examination costs are likely to increase in proportion with the number of patients enrolled
and actively participating in the program. Anecdotal evidence suggests that most of these
operating costs would increase within a year of implementing the new program; and that
it some time would elapse before the health benefits and cost savings were realized.
Finally, there may be an increase in indirect costs due to enhanced identification of
diabetic plan members and increases in plan enrollment of diabetics. (While this is a cost to
each individual health plan, and therefore acts as a disincentive to plans considering
implementing diabetes programs, it does not increase the cost to the health system as a
whole, unless the new diabetic members were not previously enrolled in a diabetes
management program at another health plan.) Implementation of improved identification
programs and at-risk programs will likely increase the number of existing plan members
obtaining care through the diabetes disease management program. In addition, new
diabetic members may be induced to join a health plan that has acquired a reputation for
offering a high-quality diabetes management program. If the health plan is unable to
increase its average price to account for these changes in membership, or if the payments
the plan receives from purchasers are not risk-adjusted, then the plan will suffer financially
from this adverse selection in terms of higher per member utilization of health care
services. The distribution of these three types of costs between plans and providers
depends on how providers are reimbursed for delivering medical care services.
Benefits
In the short and medium term, diabetes disease management can bring cost savings from
reduced health care service utilization to plans and providers; disease management can
result in reduced costs for specialist visits, emergency room visits, and hospital inpatient
stays. It can also improve the quality of life of patients, resulting in improved functional
status and reduced illness.
In the longer term, we would expect a reduction in the level of comorbidities
among diabetic patients. This would lead to lower costs from managing blindness, heart
attacks, strokes, amputations, end-stage renal failure, and other serious conditions. The
cost reductions here would clearly be substantial even if only a few patients were affected
each year. However, from an incentives point of view, the timing of these benefits is

13
crucial. The health plan/provider that invests in diabetes disease management will reap
these benefits only if the individual patients remain in the plan for a substantial length of
time—possibly up to 10 years after the beginning of the program. Thus, patient turnover
is a key driver in determining who benefits from diabetes management and consequently
whether there is a business case for health plans to implement these programs in the first
place. If the average tenure of patients enrolled in diabetes disease management is only
about 18 to 24 months, as interviews with experts at the American Association of Health
Plans, ADA, and others suggest, then much of the expected benefit will be lost to the plan
implementing the program.15
The overall distribution of costs and benefits is shown in Table 1.
15 Data from HealthPartners indicates that average tenure of diabetic patients may be higher for plans
that provide higher-quality diabetes management programs. This would reduce the problems caused by high turnover but possibly aggravate problems caused by adverse selection.

14
Table 1. Costs and Benefits of Diabetes Management Programs Benefits Costs Patient Improved length/quality of life
- Net of psychic costs of changing behaviors
Higher premium for health insurance - If the employer responds in this way Out-of-pocket expenses (e.g., copayments) Possible reduced wages
Plan/Provider
Lower use of acute services over time - If the patient stays in the plan Higher premium for disease management program - If the health plan can charge for it
Setup costs (e.g., IT systems) Operating costs (e.g., nurses, drugs, PCPs) Adverse selection costs (to one plan, not the system)
Employer Possible productivity gains - If the patient stays with the
company Possible reduced wages in exchange for better health benefits
Higher premium paid for management program - If the health plan can charge for it
Net Improved length/quality of life - Net of psychic costs of changing
behaviors and indirect patient costs Potential long-run cost savings due to lower use of acute services over time Potential productivity gains
Set-up costs Operating costs
Source: Authors’ analysis.
Division of Costs and Benefits
Who accrues the individual costs and benefits of diabetes disease management, and how is
this likely to affect the incentives of individual participants? Table 1 partially answers this
question. But the precise distribution of benefits and costs, and therefore the incentives to
invest in these programs, will vary depending on the type of disease management program
and the nature of the contracts between the participants. The effects of disease
management on each participant in our two case studies are discussed in detail below.

15
How willing are consumers and employers to pay for improved quality of diabetes
management? There is little evidence in the literature on this point; our interviewees
generally believed that “money is very tight” and that most employers, particularly smaller
firms, would be unwilling to increase payments for any reason. Health plans report that
employers are becoming less and less willing to cover the administrative costs of diabetes
management programs.
Two other institutions have an interest in supporting high-quality diabetes
programs: Medicare and Medicaid. Medicare in particular benefits from these programs,
since the reduction in costs from complications due to good diabetes management will
occur at least partly in a patient’s old age, when he or she has switched from a commercial
plan to Medicare. It seems reasonable to ask whether Medicare and Medicaid could be
charged a nominal amount to subsidize health plans’ programs. In practice this seems
unlikely for a number of reasons, including the difficulties of deciding on a fair amount
and allocating funds among health plans.
Societal Cost-Benefit Analysis
Judging from the two case studies, the total discounted operating costs of running a
comprehensive diabetes management program for a 10-year period are roughly $330 per
patient. It seems that the discounted value of the potential long-run cost savings is around
$405 per patient. Ignoring the possibility of adverse selection, the benefit to a health
plan/provider of operating such a program is a cost of $75 per patient over a 10-year
period.16
To estimate the social value of the program, we need to include a figure for the
value of the health improvement of each individual patient. There is a significant literature
on this issue. For example, Dr Richard Eastman et al. uses an incidence-based simulation
model of NIDDM (non-insulin dependent Diabetes Mellitus) together with national
survey data and clinical trials to estimate costs and benefits of treatment of the disease.17
Among other things, the paper considers the change in quality-adjusted life years caused
by the health improvements (reductions in incidence of blindness, end-stage renal disease,
and amputations) that result from reduced levels of HbA1c. It estimates that a reduction in
HbA1c from 10 percent to 7.2 percent leads to a (discounted) increase of 0.87 quality-
adjusted life years (QALYs) per patient (including an increase of 1.32 life years). If we
16 This analysis does not include fixed costs that would be required to set up a diabetes disease
management program such as investments in information technology. 17 Eastman, Richard C, MD et al., “Model of Complications of NIDDM: II. Analysis of the health
benefits and cost-effectiveness of treating NIDDM with the goal of normoglycemia,” Diabetes Care, Vol. 20, Issue 5, 1997.

16
assume a linear effect of changing HbA1c levels, and that each QALY has a value of
$100,000 to the individual patient, we can estimate the patient’s private discounted value
of a 1 percent reduction in HbA1c levels as (0.87/2.8)*$100,000 = $31,000 per patient.
So if the program reduces each patient’s HbA1c level by 1 percent (consistent with
the results we found in our two case studies below), then the patients’ private discounted
value alone (without accounting for any cost savings) far outweighs the costs of the
program.
Clearly this is a very rough calculation, but the magnitude of the difference
between costs and patient benefits is so great that we believe, at the social level, the
outcomes of these comprehensive programs will always be worth the investment needed.

17
DIABETES DISEASE MANAGEMENT AT HEALTHPARTNERS
HealthPartners18
HealthPartners is an independent, non-profit, mixed-model HMO with a total enrollment
of approximately 675,000. In 2001, about 40 percent of its enrollment was served by the
staff model HMO and the remaining 60 percent served by affiliated medical groups.
HealthPartners offers a full range of health insurance including traditional HMO
insurance, point-of-service products, a Medicare managed care product, a Medicaid
managed care product, a preferred provider organization product, and a large self-insured
product. The health plan is governed by a consumer-elected board of directors.
In 1992, HealthPartners was formed by the merger of Group Health Inc. (a staff
model HMO) and MedCenters Health Plan (a network model HMO). Initially, Group
Health was comprised of one large clinic in which physicians were employed and paid by
salary. The organization expanded in two ways: through the creation of 15 staff clinic sites
and by contracting with providers at satellite clinics who were paid through capitation
contracts. In a similar fashion, MedCenters was created when the Park Nicollet clinic (a
single-site, single-group HMO) contracted with 20 multispecialty group practices using
capitation to form a network HMO. The merger of Group Health and MedCenters
resulted in a network of approximately 4,000 physicians. Subsequently, HealthPartners,
entered into contracts with other medical groups and some hospital-based Independent
Practice Associations of physicians to expand the network to 7,000 physicians. Today,
the HealthPartners network includes approximately 3,700 primary care physicians and
4,500 specialists.
HealthPartners providers are organized into clinic groups that represent integrated
systems of care. Teams of physicians, dentists, clinics, and hospitals form a clinic group.
Upon enrollment, members select a clinic group within which to receive their care. These
clinic groups are the units in HealthPartners’ unique performance measurement system.
Since 1993, HealthPartners has collected performance data at the provider group level on
a variety of different measures. These data, along with hospital-level information, are
published on the HealthPartners website to facilitate member choice of clinic group. The
data are also fed back to individual physician groups to support learning and quality
improvement (see Bohmer and Beaulieu, 1999 for a detailed description of
HealthPartners’ performance measurement systems).
18 Substantial material drawn from Bohmer and Beaulieu’s Harvard Business School case number N6-
699-131, published in 1999, entitled “HealthPartners.”

18
In the past, HealthPartners reimbursed provider groups primarily through
capitation; clinic groups were at risk for specialist fees, hospital admissions, and pharmacy
charges. Gains or losses were shared 70 percent by the group and 30 percent by the plan.
In recent years, HealthPartners has moved away from these arrangements and today bears
approximately 70 percent of the risk for medical and pharmacy costs.
Minneapolis Market19
During the early 1990s, the health insurance market in Minneapolis underwent
considerable consolidation. This trend was driven in part by purchasers’ demands for total
replacement products, which in turn necessitated broader provider networks. Today, there
are three major HMOs in the Minneapolis market: HealthPartners, Medica, and Blue
Cross Blue Shield. By law, all health maintenance organizations are non-profit.
HealthPartners and Medica have approximately the same number of enrollees; Blue Cross
Blue Shield’s enrollment, over all products, is roughly twice the enrollment of
HealthPartners.
For several decades in Minnesota, physicians have been organized into group
practices or clinics. Indigenous group practice has affected the manner in which this
market has evolved. In particular, this organization facilitated the early introduction of
capitated reimbursement systems; it also facilitated the formation of the care systems or
clinic groups on which the HealthPartners model is based. The provider market in
Minneapolis is also characterized by substantial network overlap; most physicians contract
with all the major health insurers. One exception to this is HealthPartners’ tightly
integrated staff model.
In 1992, shortly following the merger that created HealthPartners, the Institute for
Clinical Systems Improvement (ICSI) was formed with funding from HealthPartners.
ICSI’s purpose was to bring physicians together to generate clinical practice guidelines, to
help physicians implement these guidelines in their medical groups, and to collaborate on
processes to improve the quality of care for the entire community. There were two
primary factors that stimulated the development of this unique provider-driven
organization. The first was a preexisting commitment to quality improvement initiatives
among key physician leaders in the community (e.g., at Park Nicollet and Group Health,
two of the largest medical groups in the area). The second factor was an agreement
between HealthPartners and a purchaser organization (the Buyers Health Care Action
Group) to assign ICSI the role of facilitating quality improvement. The medical groups
19 Substantial material drawn from Bohmer and Beaulieu’s Harvard Business School case number N6-
699-131, published in 1999, entitled “HealthPartners.”
19
dominated, and still dominate, the ICSI Board. Board membership recently expanded
when four other health plans in the area became sponsors and acquired board seats along
with HealthPartners. The health plans are now more fully represented, and can become
more involved in the work of the institute. A major population-based project is being
planned for next year, focusing on diabetes.
The Minneapolis health care market is perhaps most widely known for the
creation and operation of the employer purchasing group, the Buyers Health Care Action
Group (BHCAG). BHCAG was formed in 1991 by 14 large employers for the purposes of
collective bargaining with health plans. Until recently, BHCAG negotiated a single set of
contracts with health care providers on behalf of its employer members. Affiliated
employers would then choose to offer the BHCAG product to its employees or negotiate
privately and separately with one or more HMOs. In 1998, 135,000 employees from 33
employers (5% of the Minneapolis-St. Paul group market) were covered through a
BHCAG-negotiated product. In the early years of its operation, BHCAG piggybacked on
HealthPartners’ claims processing, enrollment, and performance measurement systems. In
2000, BHCAG terminated its function as a purchasing coalition and entered the health
insurance business; it currently insures approximately 100,000 members.
Diabetes Disease Management Programs
Diabetes disease management at HealthPartners can be divided conceptually into two
programs, each focused on a particular subpopulation. The care management program
focuses on members already diagnosed with diabetes. The early identification and
prevention program is designed to intervene before particular members develop the
disease. Appendix Table A-1 lists the components of each of these programs. The idea for
the programs began not long after the formation of HealthPartners in 1992; individual
components of the programs have been phased in over the last decade. The Partners for
Better Health 2000 goals, established in 1994, ensured that diabetes was on
HealthPartners’ agenda, but the focus on quality began earlier, with the formation of ICSI.
The 1997 appointment of JoAnn Sperl-Hillen, M.D., as guideline lead on diabetes
brought a key leadership figure to the diabetes initiative and was a sign of increased focus
on diabetes throughout HealthPartners. An internist, Dr. Sperl-Hillen is on the cutting
edge of diabetes treatment. Her experience with group visits for diabetes was particularly
important, and signaled HealthPartners’ intention to make innovative progress in this area.
Physician Education and Engagement
The ICSI Diabetes Guidelines and the at-risk lists are two of the key components on
which the HealthPartners diabetes care management program is based. Diabetes guideline
20
development began in November 1994, received first approval in December 1995, and is
currently undergoing its sixth revision. The ICSI guidelines, which are distributed to all
participating medical groups, identify outcome targets for individual diabetic patients (e.g.,
“keep HbA1c levels under 8%”) and back them up with evidence from the academic
literature. They provide some guidance on clinical management (e.g., switch to insulin if
glycemic control is not achieved with two oral agents; monitor HbA1c every 3 to 6
months once treatment goals are met), but offer no advice on more general patient
management (e.g., the need for a nurse case manager, patient registries, or telephone help-
lines). The guidelines therefore specify outcomes or objectives rather than a process for
reaching them. However, guidance on processes is forthcoming through the Diabetes
Action Group, which is sponsored by ICSI. The Diabetes Action Group organizes
quarterly meetings of several medical groups in the area to compare notes on progress and
lessons learned in diabetes care.20 ICSI has also provided written case studies of successful
implementation of care management programs (including a study of diabetes registries at
HealthPartners Medical Group and two other sites).
In 1995, HealthPartners developed at-risk lists to assist medical groups in meeting
the outcome targets specified in the guidelines. All patients diagnosed with diabetes are
included in the at-risk lists. The lists are compiled twice a year and sent to contracted
clinics; they include not only the names of patients with diabetes but also the dates of
recent HbA1c tests, LDL tests, comorbidity, and other exams. The lists sent to HPMG are
more detailed (this is possible since HPMG computer systems contain more data than
what is available through administrative databases for the contracted clinics); they include
the results as well as dates of the most recent HbA1c and LDL tests for each patient. (They
also include coronary artery disease comorbidity and congestive heart failure information.)
Each primary care provider in HPMG receives a risk list for his or her own patients.
Along with the at-risk lists, HPMG sends out information on performance—a
“diabetes performance profile”—for each individual physician, giving his or her patients’
test rates and levels compared with the averages in the clinic and in the medical group.
This inspires competition between physicians to improve their diabetes management
outcomes. On an annual basis since 1994, HealthPartners has assembled and issued the
Clinical Indicators Report (CIR) to all primary care medical groups, including the
contracted clinics. The CIR contains medical group comparative data on test rates and
also on HbA1c and LDL levels; the latter data is obtained by sampling individual medical
records.21
20 The Diabetes Action Group has now been rolled into a Planned Care Action Group. 21 The clinical indicators report includes clinical performance data on conditions other than diabetes.

21
In HPMG, the at-risk lists lead to proactive contact with patients. Around 55
diabetes resource nurses (DRNs) work across the HPMG clinics, seeing patients with
diabetes and those with other conditions (roughly 6.7 full-time equivalent nurses work on
diabetes). The nurses receive the lists and contact (by phone or using a standard letter)
those patients who have missed tests or appointments. The relevant nurse also delivers
diabetes education and self-management support in the clinics, and works with the
provider to decide which patients with poor test results should be contacted.22 The DRN
program is now being replaced with the Certified Diabetes Educator (CDE) program; 5.9
CDE full-time equivalent nurses will be available across HPMG. Although they will be
fewer in number, the nurses in the CDE program will be trained to deliver education and
care specifically to diabetics. The nurses will also act as a link between the PCP and the
endocrinologist, ensuring that patients are transferred between the two as necessary (this
should reduce unnecessary visits to the endocrinologist). All new patients will be
encouraged to see the CDE, and will be able to choose to see the endocrinologist
(referred by the physician upon request).
Also in 1995, HealthPartners began the Diabetes Action Project, which brought
HealthPartners together with the Center for Health Promotion. This project was
organized around reducing the number of diabetes patients with HbA1c values over 10
percent and increasing the proportion of patients with values under 8 percent. The project
was designed as a “closed-loop” system in which clinical care was connected to
decentralized services, including support for lifestyle and behavior change.
In 1998, HPMG introduced Staged Diabetes Management to help its PCPs
achieve the Institute for Clinical Systems Improvement outcome objectives, focusing on
prescription of medication and nutrition counseling. It sets out more detailed advice than
that in the ICSI guidelines on when to switch from monitoring a patient to prescribing a
single oral medication, when to move on to two oral agents, and when to move finally to
insulin. HPMG trained roughly half its clinics in this system before physician
reimbursement changes (from capitation to fee-for-service based on resource value units)
reduced the focus on and time spent in education.
Diabetes care management is sometimes less intensive and less centrally
coordinated in the contracted clinics than in the HPMG clinics. One reason for this is that
the at-risk list contracted clinics receive is less detailed than that for HPMG and does not
cover all patients (only those from HealthPartners). Around one-third of the clinics use the
22 HealthPartners nurses do not contact patients on a regular basis to check their health status. Most
interviewees saw such arrangements as a waste of resources.

22
at-risk list as a tool for proactive contact with patients. Some clinics use it to check the
details in their own registries; others do not use it at all, preferring to pull data from their
own systems. A second reason is that Staged Diabetes Management was not a health plan–
wide initiative. Some contracted clinics adopted it years ago; others did not. In those
clinics where it was not adopted, physicians receive the ICSI guidelines without further
advice on how to achieve the objectives they contain. The extent to which ICSI
guidelines are used may also vary among contracted clinics. Dr. Pat Courneya, whose
practice was involved in the ICSI guideline development, believes that they provide a
very good tool, both because they are owned by physicians and because they may deter
individual health plans from coming up with individual quality initiatives (he described
ICSI as “establishing a community standard”). However, there may be other
HealthPartners contracted medical groups, particularly those that were not involved in the
guideline development, that have different attitudes toward the ICSI guidelines.
Dr. Courneya’s clinic periodically pulls charts or queries data in their local
reference lab to compile HbA1c levels for all patients. (Some other clinics have their own
lab systems and electronic capabilities.) In addition, they query their system monthly and
make calls to remind patients if tests or appointments are due. Most diabetic patients are
seen every three to six months. Physicians in this clinic are provided with a flow sheet,
including a checklist of questions to ask the patient and the tests that are needed. The flow
sheet includes lifestyle discussion points. Physicians work through the details with the
patient and offer counseling from an educator or dietician if appropriate. (This clinic does
not employ a dietician; a few others, such as Park Nicollet, do.)
In 1997, HealthPartners Medical Group began an ongoing collaboration with the
Minnesota Diabetes Program, using Project IDEAL methods to implement the ICSI
guidelines. Project IDEAL (Improving care for Diabetes through Empowerment, Active
collaboration, and Leadership) was an effort begun in 1994 to develop a clinic-based
intervention process for patients with diabetes, building on previous work at the
Minnesota Diabetes Control Program.) According to Dr. Leif Solberg, associate medical
director at HealthPartners, Project IDEAL has been instrumental in “raising awareness of
the issue of diabetes” both within HPMG and in many contracted groups. The diabetes
disease management program was piloted in HPMB and then rolled out to contracted
clinics. Work was also going on in the contracted clinics in 1995–1997. For example,
some contracted clinics participated in the ICSI Diabetes Action Group before HPMG
joined in; and the East Side Diabetic Coalition included several contracted clinics but not
HPMG. Several interviewees pointed out that the focus of other payers on diabetes,

23
which was fairly strong at that time, was important to encourage contracted clinics to
focus on the issue as well.
Member Education and Engagement
In 1995 the Center for Health Promotion set up their phone line for the self-management
component of diabetes and other chronic disease programs. Of 16,000 diabetic
HealthPartners patients, more than 3,200 use or have used the phone line. These contacts
seem to be successful: six months after the end of a formal phone program, HbA1c levels
decreased by an average of 1.6 percent. This has been an important resource for
physicians. For example, a physician can give a patient a “prescription” for lifestyle
change, and the phone line will follow up with a call to the patient. Alternatively, patients
can proactively call the phone line, and their provider will receive a record stating that the
conversation has taken place. The vast majority of conversations (with diabetics and
others) are around weight control and smoking cessation. The documented enrollment
rate in “formal” multi-session telephone-based programs following physician referral
exceeds 50 percent. The Center for Health Promotion currently offers both a telephone
diabetes prevention course and a diabetes management course.
The HealthPartners ADA-recognized education program has highly decentralized
delivery. Patient education mailings are sent out regularly by the Center for Health
Promotion to all HealthPartners patients, giving advice on exercise, diet, and the need for
regular tests. In addition, the collaboration between the health plan and medical groups to
engage patients with diabetes through member publications, newsletters, and wallet care
cards is believed to be a major strength of the program. HPMG coordinates the provision
of patient education centrally in addition to ensuring that its clinics have access to certified
diabetes educators. In 1998–99, HPMG participated in the Institute for Healthcare
Improvement Breakthrough Series on diabetes improvement. This led to a mass mailing of
wallet cards to help patients remember test dates. Decision support involved sending cards
to physicians and nurses giving guidance on diagnosis and other elements of care.
A timeline for implementation of the diabetes management program at
HealthPartners is given in Figure 2.

24
1994
1994: Partners for Better Health 2000: HealthPartnersidentify 8 population health goals, including efforts targeting diabetic patients
1997: Formal start of the diabetes improvement project
1997: HPMG joins the ICSI Diabetes Action Group, focusing on diabetes guideline implementation
1997: HPMG begins collaboration with Minnesota Diabetes Program. Project IDEAL methods used to implement evidence-based diabetes care guidelines
Aug 1998-Sept1999: HPMG participates in IHI Breakthrough Series, developing education materials, patient registry and multidisciplinary care
Sept 1999: HPMG receives ADA Provider Recognition
June 2000: HealthPartnersrecognized by ADA as model of diabetes care
Oct 2000: Partners for Better Health 2005 includes new diabetes improvement goals
1994: Comparativemedical group performance dataincludes diabetes data
Figure 2. HealthPartners:Diabetes Program Timeline
1995 1996 1997 1998 1999 2000 2001
Source: Interviews with HealthPartners employees.
Innovations in Diabetes Care Management
HPMG is trying to provide group visits. Although they are very popular with patients and
seem to be successful in reducing HbA1c levels, they have only spread to a limited
number of clinics. PCPs may find it difficult to bill for these visits; moreover, group
require a paradigm shift for physicians. Ironically, the shift from salary to resource value
unit–based physician payment based on the Resource Based Relative Value Scale may
have retarded the adoption of group visits. In the Resource Based Relative Value Scale,
group visits are not coded separately from single-patient visits. Similar issues are raised by
the funding system. For example, providers can claim reimbursement for nurse
interventions, but generally only if they take place on a different day from the PCP
appointment. Separate billing codes do not exist to pay for nurses or educators calling
patients to remind them of clinics. The idiosyncrasies of the system have prompted
HealthPartners to take steps such as retraining diabetic nurses and reorganizing the way
care is delivered so that visits meet reimbursement requirements. The funding system
clearly creates incentives for potentially unnecessary changes or inefficient practice.
Diabetes Identification and Prevention Program
The Center for Health Promotion (CHP) at HealthPartners provides services to medical
groups to identify and care for members who are not yet diagnosed with diabetes but may
be at risk. Members can complete a voluntary Health Risk Assessment, either sent to them
through the mail or through CHP their employer. For example, the diabetes risk quiz

25
went to the entire small employer/brokered market segment (roughly 27,000 members);
22 percent responded and 15 percent of respondents were found to be at high risk for
developing diabetes. The Health Risk Assessment contains 10 questions on diabetes risk,
covering family history of the disease, diet, and physical fitness level. These questions have
also been sent out separately as a “diabetes risk quiz.” An algorithm is used to identify
patients likely to become diabetic in the following 2.5 years. Members considered to be at
risk of becoming diabetic receive a phone call from the Center for Health Promotion’s
telephone bank to discuss how to manage their risk. There are formal programs (including
a disease management program for diabetes) in which a counselor talks a patient through a
workbook (around 10 15-minute sessions followed by contact after six months) or the
patient can make less formal phone calls whenever this is useful. The phone lines and
HRA are the only methods by which HealthPartners can track patients’ weight (since
medical records are not computerized).
Provider Reimbursement and Bonus Programs
HealthPartners Medical Group (rather than the individual clinic) pays for the provision of
the 6.7 full time equivalent diabetes resource nurses; the 5.9 full time equivalent certified
diabetes educators who will replace this system will be self-supported through billing for
diabetes education, and be members of the department of endocrinology.
In contracted clinics, the health plan pays for hospital diabetic educator visits if a
patient requests counseling. The medical group can be partly at risk for laboratory tests on
capitated patients. Dr Courneya told us that his medical group also tries to measure costs
to build into negotiations with the health plan; he felt he was at least sometimes successful
in increasing reimbursement to take account of quality improvements.
The Outcomes Recognition Program, with a committee headed up by Dr. Gail
Amundson, associate medical director at HealthPartners, pays a bonus of between $75,000
and $250,000 (< 0.5% of premiums) to contracted medical groups that hit “stretch” targets
in five areas, including diabetes management. (HealthPartners Medical Group clinics can
apply for recognition, but the financial bonus is not available to them.) Thirty percent of
the bonus is assigned to patient satisfaction; the rest is divided equally among the four
quality indicators. HealthPartners pays out roughly $500,000 in bonuses each year.
Because the aim of the program is to reward stretch performance rather than average
performance, HealthPartners changes the targets as the performance of the clinics as a
whole improves. The data are gathered through audits: a sample of 60 charts is pulled in
each medical group so that LDL and HbA1c levels, aspirin use, blood pressure, and
26
smoking advice can be added to the other data the plan can access through computer
systems. Some clinics have all the data in their registry and can run reports for themselves.
Dr Courneya commented that the bonus payments from the Outcomes
Recognition Program are not large enough to provide significant extra margin to the
medical group, but that they do provide extra support for the quality initiative, for
example to pay for administrative staff to gather data. He believes that the diabetes
program ultimately costs the medical group money (e.g., there is no reimbursement for
the time PCPs spend working with the Institute for Clinical Systems Improvement or for
follow-up with patients after lab tests). The clinic is particularly strongly squeezed by the
fee-for-service with withholds system from payers other than HealthPartners; they find it
easier to work within the capitation and straight fee-for-service systems, which allow
higher margins and/or more flexibility. The cost of the initiatives may make the clinic a
little less able to invest in other areas, such as infrastructure.
Resources
Health Plan Resources
Significant health plan resources were required to implement and run the diabetes disease
management program. Chart reviews for the clinical indicator reports are conducted at the
health plan level, and health plan personnel construct the at-risk lists and put together
educational and wallet card mailings. The telephone banks described above, staffed by
certified diabetes educators and health educators, are operated by the health plan, as is the
Outcome Recognition Program. Additional full time equivalents were needed to operate
the program: most important, Dr Sperl-Hillen was appointed as guideline lead on diabetes.
In addition, at least one new analyst was hired to create the necessary measurement
algorithms.
Medical Group and Individual Physician Resources
Additional resources were also needed at the medical group and clinic level. First, HPMG
provides the 55 diabetes resource nurses who work across the HPMG clinics. Individual
clinics devote resources to reminding patients of visit and test dates, conducting chart
reviews, and (in contracted clinics) putting together physician flow sheets. Diabetic
educators and dieticians are also staffed at the medical group or clinic level.
Other Resources
Finally, other resources were needed in the short term to ensure the program ran
smoothly. For example, HPMG devoted resources to developing and implementing
Staged Diabetes Management in 1997. Individual clinicians were actively involved in the
27
development and revision of ICSI guidelines. Health Plan resources were needed to
operate the Diabetes Action Group.
Implementation Successes and Challenges
People within HealthPartners believe that the program has led to improvements in the
quality of patient care.23 HealthPartners received ADA Provider Recognition for its
diabetes management programs in September 1999; it achieved an “excellent”
accreditation status from NCQA in 2001. The plan rates very highly for both member and
employer satisfaction: in 2001 it was the highest rated Minnesota health plan in terms of
satisfaction, and it received a Gold Quality Award from the Buyers Health Care Action
Group in the same year. We asked various staff members, from the chief operating officer
to front-line workers, to name reasons for the program’s success. Many interviewees
pointed to the involvement of ICSI, which convened physicians to decide on ideal
outcomes and then left individual medical groups to find ways to reach those outcomes.
The guidelines are detailed when supported by evidence (e.g., specifying recommended
medications) and leave flexibility to individual medical groups where compelling evidence
does not exist. ICSI is unwilling to substitute consensus for evidence when the evidence
does not exist, acknowledging that different processes, preferred by different medical
groups, may achieve the desired outcome. Another reason identified by interviewees for
the program’s success is that the outcomes measures were clear, could be measured in a
credible way, and were backed by scientific/academic research. Finally, interviewees
noted that the guidelines and materials sent regularly to HPMG physicians showing their
performance relative to their peers promoted professional competition among physicians
and clinics and led to improved outcomes.
The ICSI staff we interviewed believed that the successful guidelines involved a
system to ensure adequate delivery of care, rather than a change in physician/medical
practice. (Dr. Leif Solberg agreed with this view.) Diabetes management is a good
example of such a condition. Dr. Gail Amundson noted: “Over 90 percent of our
membership comes in every year. So what needs to change most is the system which then
influences physician behavior.”
A number of potential barriers to successful implementation were pointed out
during the site visit. First, high turnover could result in patients leaving the program
before its benefits have been reaped by the health plan. This was agreed to be problematic,
23 Because of sample size issues, no attempt has been made to measure the numbers of complications
that occur in HealthPartners’ diabetic members. Instead, HealthPartners uses data from the Diabetes Control and Complications Trial.

28
but there was a general feeling that it was beyond health plans’ control and should not
deter quality improvement efforts. Second, it was noted that adverse selection may cause
problems. This is in fact not a major issue in Minnesota, since more than 80 percent of
employers offer products from only one health plan to their employees, so the plan is able
to pool risk across that employee population.
Organizational issues, however, were agreed to be very real. Several people
suggested that the structure of HPMG as a staff model HMO makes implementation much
easier than for the contracted clinics, where data is less readily available (e.g., the at-risk
lists generated from HealthPartners do not have access to contracted clinics’ laboratory lab
data), the plan has less leverage over the clinic, and physicians have competing priorities
given their responsibility to treat other health plans’ patients. This lack of leverage over
contracted clinics makes the role of ICSI more important. While ICSI is a good tool to
ensure that participating medical groups all work toward the same goals, not all contracted
medical groups are members of ICSI.24
PCP practice patterns may be difficult to change for another reason. Since it is
generally difficult to persuade patients to change their lifestyle, disease management
programs are more likely to result in increased prescribing of medication rather than in
efforts to change exercise/diet behaviors. Indeed, many of the physicians we interviewed
thought that the increase in metformin use was by far the biggest improvement caused by
the program. Another potential set of barriers relates to the fact that patients tend to regard
their PCP, rather than their health plan, as the driver of quality. This could provide either
positive or negative incentives to physicians to implement the diabetes program.
Implementing the program in a particular clinic could lead to patients associating that
clinic with high quality, which could drive future enrollment. However, if a physician is
committed to providing the same standard of care to all patients from all health plans, but
is being given funds toward the costs of the program only by HealthPartners, then
implementation could lead to a large amount of clinic work for a small amount of money.
Making organizational changes within a clinic is very difficult. It seems that
improvements in health outcomes have been achieved at HealthPartners without large-
scale changes in the way the patient-care process is organized. Patients still see their PCP
initially rather than a nurse, and the PCP still coordinates the provision of care. According
to some interviewees, the PCP still practices in much the same way as he or she always
has, albeit with some help from a nurse in reminding patients of test dates and with a list
24 Roughly 4,000 physicians, out of a total of 9,000 in the state, are currently members of ICSI; their
goal is to cover 60 percent of state physicians by 2003.

29
reminding him/her of key patient data. The PCP may not even be aware of what the
nurse is doing.25 The fact that HealthPartners set up a diabetes program, rather than a
broader chronic/preventive care program, may have reduced the probability of wholesale
changes in physician behavior.
Finally, there are financial barriers to implementation of a diabetes management
program. First, clinics can have real difficulty in negotiating increased capitation rates
linked to increases in quality. While Dr Courneya believed successful quality-related
negotiations were possible for North Suburban Family Physicians, Dr. Maureen Reed,
medical director, felt that the size and importance of the network were the main drivers of
payment. In addition, Dr Reed pointed out that HealthPartners measurement systems are
not robust enough to determine which medical groups provide the overall highest quality,
reducing the usefulness of quality-based reimbursement. Second, technicalities of the
payment systems can create barriers to paying providers for their efforts even where the
health plan would like to do so. For example, the move toward fee-for-service payment
(on a resource value unit basis) makes it very difficult for providers to charge for
preventive and chronic care programs for which there is no resource value unit code. For
this reason, HealthPartners decided to help its providers by paying for certain projects such
as the Partners for Better Health initiative at plan level. Also, HealthPartners has so far
been unable to devise a way to reimburse medical groups for providing the majority of
group visits, even though these clearly save physician time and can be a more effective
way for patients to change their behavior and improve self-management.
Finally, Mary Brainerd, executive vice president and COO of HealthPartners,
pointed out that investments in health have a trade-off in terms of capital availability. The
plan would like to invest in systems, such as an expansion of the clinical information
system across HealthPartners Medical Group that would cost $14 million. But it is
challenging for an organization like HealthPartners, which has margins of about 1 percent,
to generate the capital to invest. For-profit insurers have easier access to capital (e.g.,
through equity markets) to make these kinds of investments.
Health and Economic Impact
The impact of the HealthPartners diabetes disease management programs on individual
patients’ health, measured using HbA1c and LDL levels, is striking. HealthPartners has
tracked the health outcomes of a cohort of diabetic patients identified in 1994. The
reductions in HbA1c and LDL levels have been significant, as shown in Figures 3 and 4.
25 This communication problem may be a function of the organizational structure of HPMG, in which
PCPs are based at clinic level but DRNs are based at medical group level.
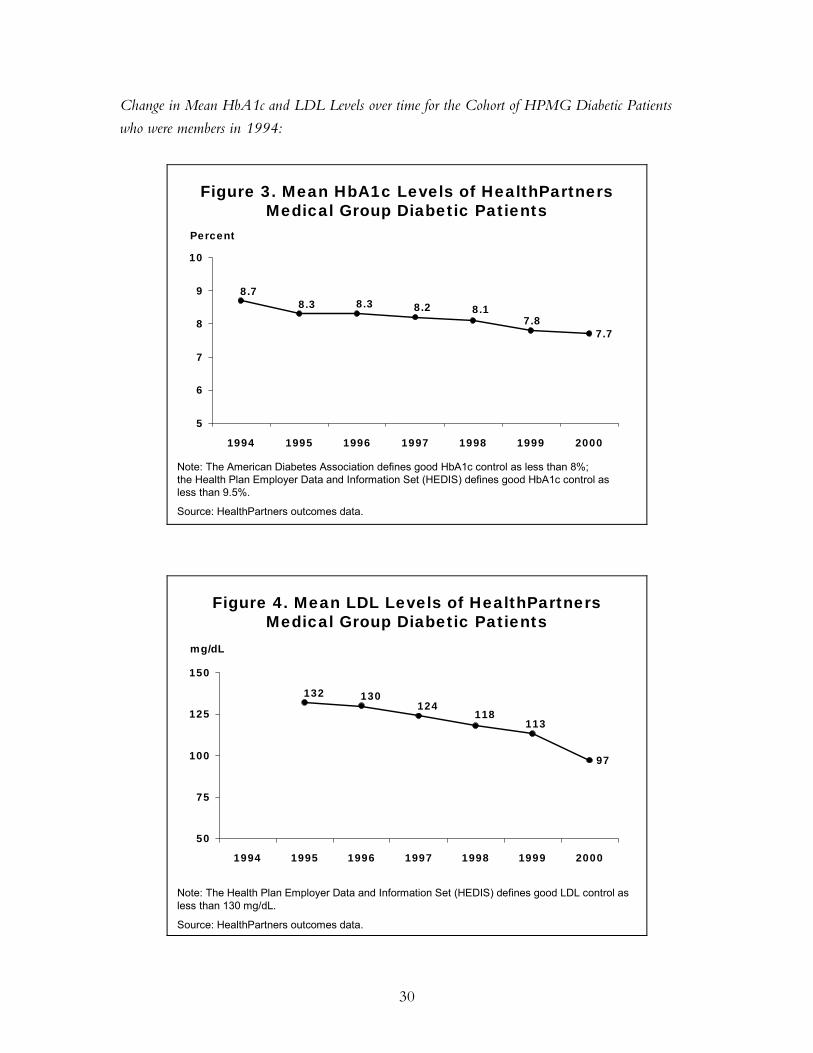
30
Change in Mean HbA1c and LDL Levels over time for the Cohort of HPMG Diabetic Patients
who were members in 1994:
Figure 3. Mean HbA1c Levels of HealthPartnersMedical Group Diabetic Patients
7.77.8
8.18.28.38.38.7
5
6
7
8
9
10
1994 1995 1996 1997 1998 1999 2000
Note: The American Diabetes Association defines good HbA1c control as less than 8%;the Health Plan Employer Data and Information Set (HEDIS) defines good HbA1c control asless than 9.5%.
Source: HealthPartners outcomes data.
Percent
Figure 4. Mean LDL Levels of HealthPartnersMedical Group Diabetic Patients
97
113118
124130132
50
75
100
125
150
1994 1995 1996 1997 1998 1999 2000
Note: The Health Plan Employer Data and Information Set (HEDIS) defines good LDL control as less than 130 mg/dL.
Source: HealthPartners outcomes data.
mg/dL

31
The picture changes very little when we consider the proportion of diabetic patients with
poor HbA1c control. Figure 5 shows the percent of diabetic patients with HbA1c levels
less than 9.5 percent (the HEDIS definition of good HbA1c control) and less than
8 percent (the ADA definition). By both definitions, HbA1c control improved steadily
from 1994 to 2000.
Notes: Cohort of HealthPartners Medical Group Diabetic Patients who were members in 1994.The American Diabetes Association defines good HbA1c control as less than 8%; the Health Plan Employer Data and Information Set (HEDIS) defines good HbA1c control as less than 9.5%.
Source: HealthPartners outcomes data.
Figure 5. Percent of Tested Diabetic Patients with HbA1c Levels Less than 9.5% and Less than 8%
7078 81 82 84 87 87
31 36 38 41 43 4353
0
25
50
75
100
1994 1995 1996 1997 1998 1999 2000
Percent less than 9.5% Percent less than 8%
It is difficult to identify which elements of the diabetes management program
caused the health improvements. For example, the large decrease in HbA1c levels from
1998–99 could have been a delayed reaction to the measures introduced at the formal start
of the diabetes management program in 1997, or even to the introduction of at-risk lists in
1995. However, it is clear that the program as a whole has had a positive effect on
patients’ health.
Our results concerning the economic impact of the program are set out below.
We estimate that, over a 10-year time horizon, the benefits and costs are as shown in
Table 2.
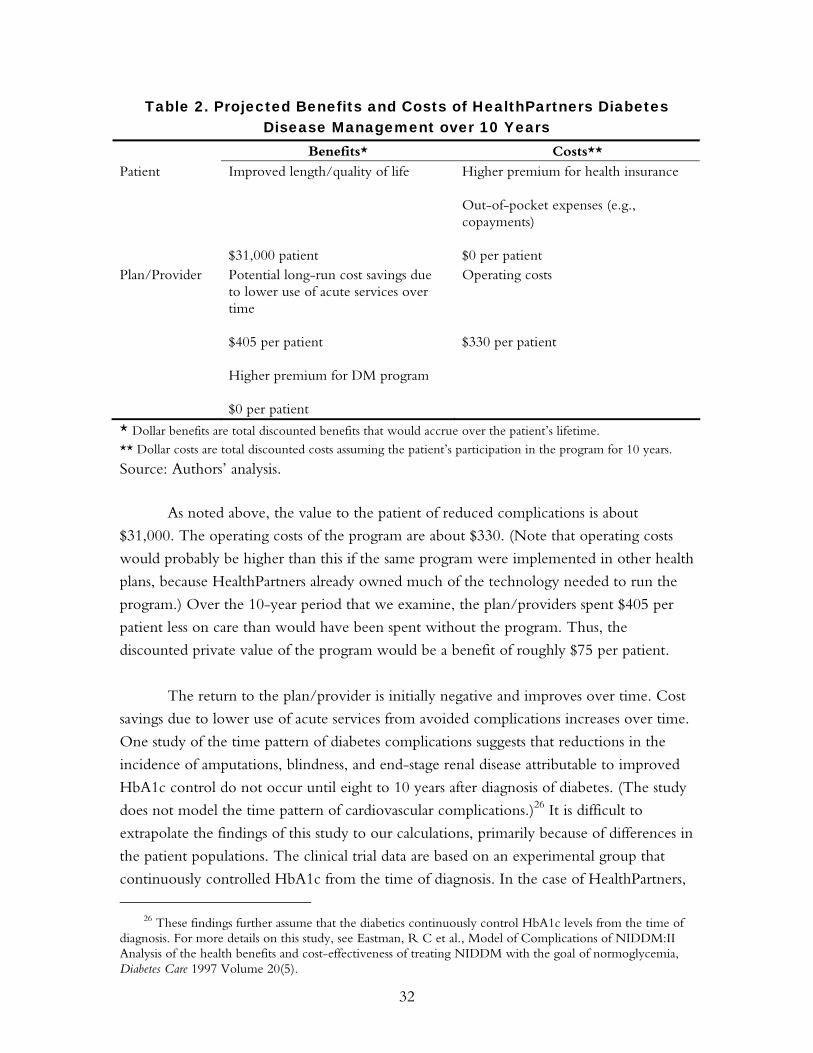
32
Table 2. Projected Benefits and Costs of HealthPartners Diabetes Disease Management over 10 Years
Benefits* Costs** Patient Improved length/quality of life
$31,000 patient
Higher premium for health insurance Out-of-pocket expenses (e.g., copayments) $0 per patient
Plan/Provider Potential long-run cost savings due to lower use of acute services over time $405 per patient Higher premium for DM program $0 per patient
Operating costs $330 per patient
* Dollar benefits are total discounted benefits that would accrue over the patient’s lifetime. ** Dollar costs are total discounted costs assuming the patient’s participation in the program for 10 years.
Source: Authors’ analysis.
As noted above, the value to the patient of reduced complications is about
$31,000. The operating costs of the program are about $330. (Note that operating costs
would probably be higher than this if the same program were implemented in other health
plans, because HealthPartners already owned much of the technology needed to run the
program.) Over the 10-year period that we examine, the plan/providers spent $405 per
patient less on care than would have been spent without the program. Thus, the
discounted private value of the program would be a benefit of roughly $75 per patient.
The return to the plan/provider is initially negative and improves over time. Cost
savings due to lower use of acute services from avoided complications increases over time.
One study of the time pattern of diabetes complications suggests that reductions in the
incidence of amputations, blindness, and end-stage renal disease attributable to improved
HbA1c control do not occur until eight to 10 years after diagnosis of diabetes. (The study
does not model the time pattern of cardiovascular complications.)26 It is difficult to
extrapolate the findings of this study to our calculations, primarily because of differences in
the patient populations. The clinical trial data are based on an experimental group that
continuously controlled HbA1c from the time of diagnosis. In the case of HealthPartners,
26 These findings further assume that the diabetics continuously control HbA1c levels from the time of
diagnosis. For more details on this study, see Eastman, R C et al., Model of Complications of NIDDM:II Analysis of the health benefits and cost-effectiveness of treating NIDDM with the goal of normoglycemia, Diabetes Care 1997 Volume 20(5).

33
some of the members who enrolled in the diabetes disease management program were
likely to have been diagnosed with the disease at various points in time prior to 1994.
These individuals may have been at the point in their disease progression during which
they were already at risk for or experiencing complications. However, papers such as this
one do give us sufficient evidence to indicate that only a portion of the total cost savings
from avoided complications are included in our calculations using a 10-year time frame.
Had we looked solely at patient groups for whom treatment had immediate effects,
such as those with very high initial HbA1c levels, we would almost certainly have
observed cost savings within the first one to three years of treatment. Including all
diabetics in the population gives a more complete picture of the business case for the
program, but obscures our view of the specific benefits to particular subpopulations. The
upward trend in plan/provider benefits over time is illustrated in the Figure 6.
-67.78
187.38
405.30
713.99
1075.97
1498.99
-349.80 -426.90-255.76
0.00
-467.81-500
0
500
1000
1500
1994 1995 1996 1997 1998 1999 2000 2001* 2002* 2003* 2004*
Figure 6. Change in HealthPartners Net Benefits from Diabetes Program over Time
Note: Data for 1994 and 2001–04 are estimates formed in discussion with HealthPartners analysts.
Source: HealthPartners financial data and authors’ analysis.
Benefits less Costs to Plan/Provider,$ per diabetic patient per year
Our calculations are based on a number of assumptions, the most important of
which are assumptions about medical care cost inflation for diabetics and non-diabetics in
years seven through 10 of the program. We assume that costs of care for diabetic patients
in HPMG will increase at a rate of 7 percent per year, and that the costs of care for all
patients in HPMG (non-diabetics as well as diabetics) will increase at a rate of 12 percent
per year from 2001 to 2005. Two factors determine cost inflation in a particular
population: changes in the quantity of services delivered and changes in the prices of those
services. We do not expect that prices will change differentially for diabetic and non-

34
diabetic patient populations over time. Rather, the difference in medical care cost inflation
for diabetics and non-diabetics is driven by assumptions about changes in the quantities of
services consumed by the two populations. Our assumption is that diabetics will increase
the quantities of care at a lower rate (7%) compared with increases in quantities of care
consumed by non-diabetics (12%). Our quantitative estimates of the private value of
diabetes disease management are heavily dependent on this assumption. For example, if
we assume that the costs of care for the overall patient population (including diabetics and
non-diabetics) increase by 10 percent per year, the discounted private value of the
program over a 10-year period would be a cost of $310 per patient. Alternatively, a rate of
cost increase of 14 percent per year implies a discounted private value of $467 per patient.
Our quantitative analyses point to a clear finding that the program loses money in
the first one to three years. Over a decade, the value of the program ranges from losses of
a few thousand dollars per patient to gains of a few thousand dollars per patient. The range
depends heavily on our assumptions about medical cost inflation that in turn depend on
the expected number of complications averted and how expensive they would be to treat.
Are these estimates consistent with the literature? We can check them against the
evidence on reductions in complications in a number of published articles.27 We know
that the cost of treating a newly diagnosed diabetic patient is about $1,000 per year. So if a
complication costs $10,000 to treat, the reduction in complications would have to be 30
percentage points for the program to break even in three years (not discounted). But the
estimates in the literature are that it takes three years for retinopathy to manifest (and
hence to be reduced through disease management), and at least seven years for the
manifestation of more expensive complications such as end-stage renal disease or lower
extremity amputation (which cost between $30,000 and $45,000 per patient to treat). The
program therefore cannot break even in a three-year time period. Breaking even might be
more likely over eight to 12 years.
27 Eastman, R C et al., Model of Complications of NIDDM:II Analysis of the health benefits and cost-
effectiveness of treating NIDDM with the goal of normoglycemia, Diabetes Care 1997 Volume 20(5); The Effect of Intensive Treatment of Diabetes on the Development and Progression of Long-Term Complications in Insulin-dependent Diabetes Mellitus, a report of the Diabetes Control and Complications Trial Research Group, NEJM 1993 Volume 329(14); Lifetime Benefits and Costs of Intensive Therapy as Practiced in the Diabetes Control and Complications Trial, a report of the Diabetes Control and Complications Trial Research Group, JAMA 1996 Volume 276(17).

35
DIABETES DISEASE MANAGEMENT AT INDEPENDENT HEALTH
Independent Health Association
Independent Health Association (IHA) was founded in February 1980 as a non-profit
independent practice association model HMO. It was one of the first health plans in
western New York to become federally qualified. IHA currently offers a prepaid
commercial group product (81%), a Medicaid product (7%), a Medicare risk product (7%),
and a for-profit subsidiary that serves as a third party administrator for self-insured
companies (5%). In 2002, it will introduce a preferred provider organization product. It
enrolled roughly 380,000 members in all its products and contracted with 2,800 physicians
in 2001.
IHA is comprised of two organizations: the health plan and the independent
practice association (IPA). The IPA, with 2,800 member physicians in 2001, has its own
governing board of nine physicians. The health plan board is comprised of six consumers,
six employers, and six providers. Through the IPA, Independent Health contracts with 90
percent of the physicians in western New York. These physicians practice in university-
affiliated groups (200 physicians), large private groups (350 physicians), hospital IPA-
owned groups (800 physicians), and small group practices. Roughly one-third of primary
care physicians are paid through a capitated contract, one-third are paid according to a
fee-for-service schedule with global budgets, and one-third are paid according to a fee-
for-service schedule with global risk. Specialty care physicians are paid on a fee-for-service
basis.
The Buffalo–Niagara Falls Health Care Market
Though the plan has a small presence in the Jamestown and Rochester markets, most of
IHA’s membership (95%) is located in the Buffalo–Niagara Falls market. Roughly 1.2
million people lived this market in 1999 and approximately 730,000 obtained health
insurance through an HMO (InterStudy Competitive Edge 9.2). There are two other
health plans that, together with IHA, accounted for 99 percent of HMO enrollment in
1998: The Health Care Plan (25%), Blue Cross Blue Shield of Western New York (24%),
and Independent Health Association (50%). All three health plans have operated in the
market for more than 15 years. UNIVERA (Health Care Plan) is an independent, not-for-
profit, mixed-model HMO; its membership is split evenly between a network model and
a group model, and it contracted with 2,300 physicians in 1999. The Blue Cross Blue
Shield plan is a not-for-profit, IPA-model HMO, and it contracted with approximately
3,000 physicians in 1999. IHA reports 90 to 95 percent overlap in physician delivery
systems for the three health plans. Buffalo Medical Group and Promedicus Medical Group

36
are the only very large physician medical groups operating in this market, with
approximately 120 physicians each.
Program Design
IHA initiated their diabetes disease management program in June 1997 by distributing
revised clinical practice guidelines for the care of diabetic patients to primary care
physicians of. As shown in Appendix Table A-2 and summarized below, a few core
components to the diabetes management program have persisted over time:
• Dissemination to providers of updated guidelines for diabetes screening and care
• Case management program for high-risk diabetics
• The provision of educational materials to all diabetic members (through multiple
media)
• The provision of educational materials to physicians (primarily through physician
newsletter)
• Diabetic screening programs
• Reminders to patients and their physicians about diabetic retinal exams and
HbA1c tests
The ultimate objective for the management program is to improve health care
outcomes of diabetics. The intermediate objectives are to improve self-care management
among diabetics, to improve the delivery of appropriate services to diabetics by their
primary care providers, and to identify new diabetics in a timely manner. IHA has
experienced some success in achieving these objectives as measured by improvements in
process measures of care and patient compliance with recommended lifestyle changes.
IHA does not yet have the systems in place to assess whether its program is improving
clinical outcomes (e.g., HbA1c rates) among the same diabetic members over time.
Recently, IHA has chosen to focus on collaborating with physicians to leverage
the resources that it commits to diabetes disease management. It plans to provide quality
improvement incentives for physicians to work more closely with the health plan to
promote “best practice” diabetes care. IHA is striving to improve access to comprehensive
diabetes education programs that are readily accessible to patients at the right time and in
the right place. The health plan believes that patients need to be vigorously directed to
education programs/dieticians by their physicians (rather than their health plan). IHA
managers say they want to build synergy among the individual components of the disease

37
management program. For example, they might alert physicians about members in need of
services at the same time as they remind members about needed tests. As an insurer, IHA
is able to provide physicians with feedback on their diabetic patients and assist them in
strategies to improve quality indicators (e.g., community education program, reminders,
and case management). IHA is now in the process of collaborating with physicians to use
quality improvement incentives for improved performance on process and outcome
measures of diabetes care.
Case Management
IHA uses claims data both to identify members who are diabetic and to assign these
members to risk categories. The highest risk category is defined by two inpatient
admissions with diabetes as a primary diagnosis or two emergency room claims in a given
year. The high-risk members are enrolled in a case management program supported and
directed by IHA.28 In 1998–99, there were 438 high-risk diabetic members; 363 of them
were case managed. At any given time, a diabetes case manager has about 60 patients and
coordinates with about 40 different physicians for their care. Case management involves
monthly telephone contact between a nurse case manager and patient; careful tracking of
medication, laboratory tests, exams, and compliance issues; referrals to other health
professionals when appropriate (e.g., nutritionists, endocrinologists); and help in accessing
community resources. Case management has been successful in increasing compliance in
taking medications, obtaining annual retinal exams, exercise and diet modification, and
glucose monitoring.
Physician Education and Engagement
Supplying physicians with performance data is considered a key tool for changing
physician behavior to more closely accord with clinical practice guidelines. IHA reviews
claims data for each physician to assess whether the physicians’ patients are obtaining the
needed tests and reports these data back to physicians. On an annual basis, physicians
receive a quality profiler mailing that includes a synopsis of the service rate and risk
stratification of their patients and an annual care report providing a list of diabetic patients,
their diabetic pharmacy utilization, and whether they have been seen in the office in the
past year. Because claims data do not include test results, IHA has had to rely on chart
28 Risk-stratifying its population provides IHA with the ability to target interventions to members
according to their risk of increasing disease severity and risk of complications. Targeting case management to those members at high risk is not considered as effective since these people are already experiencing the devastating effects of complications. It makes intuitive sense that intervening at an early stage of the disease would be cost-effective. IHA will be reallocating its case managers to members in a lower-risk category through collaborative efforts with physicians (e.g., providing education in their offices, reviewing charts for reminders/outreach to members in need of services). The charts of high-risk members will be reviewed as well, but if goals cannot be established the organization will redirect its efforts to a lower-risk group.

38
reviews to assess physician performance on clinically meaningful outcome measures. A
medical record self-review was conducted in 1997 to document physician adherence to
Diabetes Clinical Practice Guidelines. Overall, compliance with the guidelines was judged
to be high—81 percent—as documented by physician self-review. It was expected that the
process of simply completing the review would be a learning tool. Physicians’ unsolicited
positive comments about the review were that the review was a positive educational
experience, a good exercise in chart coding, and helpful for understanding guidelines.
Negative comments included that it was too much information, it was too time
consuming, not a measure of quality, and a waste of time (IHA should do it). IHA
perceives the intervention to be relatively effective and has replicated it for other disease
states, including asthma, and tied it into a CME/feedback initiative.
In 2001, a disease management quality initiative was begun with a medical group
comprised of six physicians (responsible for care to 190 diabetics). Adherence to diabetes
clinical practice guidelines was again conducted through chart review. Initially the intent
was to have these physicians conduct their own chart review, but they requested assistance
from IHA for this labor-intensive activity. Physicians received feedback from the health
plan on adherence to diabetes clinical practice guidelines according to chart review.
Another measurement will take place to determine if this type of feedback is successful in
changing physician management of diabetes and the documentation of diabetes care.
In the past, clinical guidelines were disseminated through physician mailings.
Currently, the Diabetes Clinical Practice Guidelines are available to physicians on the
website. A provider toolbox, including the Diabetes Chart Abstraction Tool and the
Diabetes Care Flow Sheet, is scheduled to be available on the website in 2002. Diabetes
identification, prevention, and care management techniques are also frequently the focus
of articles in the IHA physician newsletter. Recently, IHA collaborated with other area
health plans and approved the use of a single Diabetes Clinical Practice Guideline to
improve and standardize best-practice care for all people with diabetes in western New
York.
In November of 2000, IHA launched an educational program targeted to PCP
office clinical staff and managers. The program was designed to increase the familiarity
among office staff with tools that would improve adherence to diabetes standards of care
(e.g., diabetes care flow sheet, reminder posters, and diabetes care cards). Office staff can
have a tremendous impact on improving the process of diabetes care by reviewing medical
records to identify the need for preventive services, providing reminders to physicians

39
(e.g., request patients to remove their socks and shoes at every visit or attach notes to
chart), and providing basic diabetes education.
IHA is poised to implement a new program entitled “Data direct–Health Alert.”
This is a real-time reminder program to physicians at the point of service (i.e. the
physician office visit), alerting the physician to member needs for HbA1c tests and/or
diabetic retinal examinations.
Member Education and Engagement
IHA uses a variety of media to educate its diabetic members about their disease and
effective self-management strategies. Members identified as having diabetes are sent
educational information through the mail about the importance of obtaining HbA1c tests
and diabetic retinal eye exams. Mailings are sometimes combined with incentives for
members to obtain tests. In August 1999, 9,565 members identified as diabetic were sent a
pre-paid phone card along with a brochure explaining the importance of obtaining a
retinal exam. The benefits of the initiative appear to have been minimal: only five percent
(N=484) of members responded to the mailing and submitted evidence of having had a
retinal exam. Of these members, 138 received the exam prior to the mailing (but took
advantage of the phone card incentive), while 346 received the exam after the mailing.
Comparing trends in the rate of diabetic retinal eye exams, it appears that the rate had
been increasing before the initiative and only increased modestly afterwards (53.8% vs.
54.8%, respectively). It was felt that targeting the intervention to only those members
identified as needing an eye exam would increase the efficacy of the intervention.
Unfortunately, the cost of multiple mailings precluded this strategy.29
The Diabetes Care Card was a wallet-sized card designed to assist members with
tracking their tests, increase members’ awareness of the results (e.g., encouraging them to
ask their provider for HbA1c results), and to promote self-management and corrective
actions. The card was sent as part of a mailing to plan members in November 2000 that
also included educational information about the importance of obtaining a number of key
tests and examinations.
IHA promotes its website in all of its disease management communications. The
diabetes care section of the website includes educational information, a listing of diabetes-
related seminars and programs, links to diabetes Internet resources, and listings of local
29 A more targeted intervention was planned for late 2000 or early 2001, however, due to budget issues
related to mailing costs, the incentive was once again offered as part of a general mailing to all diabetic members in June 2001. The mailing went out to 9,723 members and to date approximately 600+ responses to the incentive have been received. IHA has not conducted analyses on the efficacy of this initiative.

40
community and national organizations. IHA recently switched from The Daily Apple to
Healthology, an online producer and distributor of medical information that provides
interactive diabetes health education articles and videos to members. In addition to
maintaining the website, IHA supports a 24-hour medical call center staffed by nurses and
an audio health library, with tapes on diabetes self-care.
Recent reductions in the number of outpatient diabetes education classes provided
by the hospital system have led to efforts by IHA to improve access to community
education programs.
Prevention
IHA is unable to identify members who have not been diagnosed with diabetes but may
be at risk for developing the disease through claims analysis, since this would require
tracking clinical data that are unavailable except through chart review.30 Each year since
1998, the Independent Health Foundation has sponsored a senior health education and
awareness seminar to address issues affecting seniors. The seminar includes a free health
screen for diabetes. Since 1999, the IHA Foundation has sponsored a thyroid and diabetes
screening program to IHA members. In 2001, IHA provided preventive diabetes
education to targeted employer groups. In 2001, IHA included a paycheck insert—
“Could You Be At Risk for Diabetes? Take the Test”—to its own employees.
At the current time, IHA is testing an employer-based disease management
program. This is a shared initiative with IHA’s Feeling Fit/Wellness Programs, in which
the health plan works with two employers to identify member needs and initiate targeted
interventions. For the diabetes program, preventive efforts will be directed at weight
control and fitness/exercise.
Other
Until June 2001, IHA randomly distributed quality-of-life surveys on a quarterly basis to
400 members with diabetes. Not surprisingly, high-risk members demonstrated
significantly lower quality of life than other risk groups, suggesting that interventions
should continue to be targeted to this group. Dietary restrictions and issues related to
maintaining glucose control were rated as problematic for the majority of members in the
moderate- and low-risk groups. Distribution of quality-of-lie surveys was discontinued
30 It is difficult to identify new diabetics through claims data or those at risk. IHA is beginning to
attempt to identify these members by looking at pharmacy data (past three months on a diabetic medication compared with three months prior with no claim for a diabetic medication). This method identified 856 new diabetics in a three-month period. This number would seem to be too high and IHA is attempting to refine the methodology.

41
because program staff felt that surveys measuring a particular intervention would be more
useful. All high-risk members receiving case management were sent a quality-of-life
survey before and after the case management intervention. IHA is currently working on
an analysis of this data.
The Disease Management Team was developed in 2001 to address management
issues that are relevant to different diseases. The team includes the medical director and
managers from Health Care Services/Disease Management, Quality Management, and
Pharmacy. Many IHA initiatives have a clear impact on diabetes disease management,
including the Western New York Electronic Prescribing Initiative, a prescription-writing
system using a hand-held electronic device. Likewise, strong synergies occur between
different disease initiatives. For example, 20 percent of members identified with
hypertension are also diabetic, so that interventions to address hypertension will have an
impact on outcomes in the diabetes program.
Implementation of the Disease Management Program cuts across many
departments within the company. The Integration Team was developed in the past year to
promote cross-functional disease management efforts across the company. Until recently,
disease management seemed to be working in isolation from the rest of the organization.
The Integration Team includes representatives from quality management, practice
management, utilization management, communications, Independent Health Foundation,
and disease management.
The Diabetes Clinical Advisory Group, comprised of community physicians, has
been the foundation of the diabetes disease management program. Significant changes
have occurred in the program with the creation of the Disease Management Team and the
Integration Team. These interdisciplinary/cross-functional teams came about due to
frustrations about perceived internal barriers and the desire to implement interventions
that could effect real changes in both physician and member behavior.
Resources
A variety of resources are needed to manage and implement the diabetes disease
management program at Independent Health. IHA reports that the staff costs for diabetes
disease management were $147,000 (including benefits). Staff are needed to compose
materials sent to physicians and members and to chart and review progress of the program.
One nurse operates the case management program. Other human resources are not
dedicated specifically to the program but provide needed services such as answering calls
on the telephone help line and maintaining the health plan’s website. Once each year,

42
human resources are needed to assemble the quality management profile reports sent to
individual PCPs. The resources needed to operate a diabetic screening event include
staffing, site costs, and numerous volunteers. In the past year, the long-distance phone card
incentive offered to members cost the plan $220. Finally, mailings cost the plan
approximately $6,433 on an annual basis.
Barriers to Successful Operation of Diabetes Disease Management
Individuals interviewed at IHA identified several barriers to the successful operation of
their diabetes disease management program. These fell mainly into the two categories
discussed in the Overview: organizational issues and financial issues.
A major hurdle for diabetes disease management relates to plan member turnover
and the length of time before the cost-savings of disease management might occur. The
literature states that the complications from poor control of diabetes are not manifested for
seven to eight years, hence the potential cost-savings to plans and/or providers from good
diabetes management (and averted complications) may not materialize for some time. A
diabetic individual enrolled in a disease management program may change plans before
any health and cost benefits materialize, and thus the plan will not be able to capture the
benefits of its investment in disease management.
It is difficult for organizations to enlist both patients and physicians to become
engaged in management programs. Dianne Hurren, health management program
coordinator at IHA, provided a few examples of the difficulty of involving physicians:
“Physicians are not actively promoting education to their patients and in
fact, one of our high-volume diabetes providers recently declined an offer
by IHA to provide a comprehensive diabetes education program (taught by
a certified diabetes educator, nurse practitioner, dietician, pharmacist,
wellness specialist, and podiatrist). This program would have been offered
at no cost to members in the physician office or nearby community center.
This physician felt that a comprehensive program such as this was too
overwhelming for patients and instead preferred a two-hour information
program offered by a certified diabetes educator and funded by a
pharmaceutical company.
“To date, physicians have generally not been particularly responsive to
disease management initiatives and often view them as challenging
professional autonomy. Disease management needs to overcome this

43
perception by physicians and assist physicians to understand that our goal is
to promote adherence to a prescribed regimen and provide the physician
with information which they may not have access to (e.g., claims data
regarding laboratory tests, eye exams, and pharmacy utilization). One
physician recently stated: ‘Who is being case-managed, the physician or the
patient?’ Initiatives that require increases in workload or changes in office
procedure are not well received, even if it is conceded that they might be
worthwhile. We have learned that it is essential to have physician buy-in to
the program for it to be successful. . . . Success with implementing disease
management initiatives may be improved by sharing the economic gains of
providing quality diabetes care.
“A significant issue that needs to be addressed is physician buy-in to disease
management programs. We have not entirely overcome this issue. We are
striving to work more collaboratively with specific physician groups to
define their needs and develop strategies to address their needs. This has
been difficult due to physician perception that the health plan is developing
a “report card” and they “do not want to look bad.” IHA can assist
physicians by providing a registry of their diabetic patients and clinical
performance indicator measures. In the spirit of true collaboration, disease
management is able to provide this information and, together with the
physician, problem-solve regarding strategies to address issues in ways
which involve minimal hassle for the physician (e.g., on-site case
management, phone reminders to patients, diabetes education classes etc.).”
Actively engaging patients is also a difficult yet critical mission for the diabetes
disease management program. Providing information to patients through multiple
channels appears to have limited effect in terms of securing their involvement in the
program. Financial incentives (e.g., the long-distance telephone card) do seem to increase
patient compliance, although this method is fairly costly, especially when one takes the
crowd-out factor into consideration. Because of this expense, IHA relies on a number of
community programs to reach and educate its diabetic members. Recently, some
outpatient education programs have undergone cutbacks and are often not accessible to
members at the right time and in the right place, when they would be most effective in
changing patient behavior.31
31 IHA covers outpatient diabetes education programs at both hospital systems with a member
copayment.
44
Interviewees also identified several financial barriers to program success. First,
disease management programs are driven by timely data. Lack of data was a considerable
problem for implementing specific components of the disease management program such
as population identification using utilization and pharmacy data. To some extent, data
limitations have been addressed over the past year and IHA is beginning to understand the
complexities of its diabetic population. The Diabetes Registry is now refreshed on a
quarterly basis and is readily available to the program coordinator for up-to-date analysis.
However, IHA still relies on medical chart review to collect the clinical data necessary to
monitor progress, learn, and improve quality. Thus, up-front investment in information
technology is needed to make data available.
IHA is an IPA-model managed care organization, so that central health plan
adoption of an electronic medical record (EMR) would not be feasible for this
organization. Adoption of an EMR by individual physicians could yield several benefits,
however. It could provide physicians with a means to develop their own patient registries
and establish their own reminder systems. An EMR would also allow physicians to assess
and improve their adherence to clinical practice guidelines. With an EMR system in
place, IHA could expand its disease management programs to provide physicians with
more comprehensive benchmarking data. Access to an EMR would also provide IHA
with laboratory values to more effectively stratify members according to risk, resulting
ultimately in a more efficient targeting of interventions.
Endocrinologists on IHA’s advisory board complain that they see diabetics only
when they are completely out of control and experiencing multiple long-term
complications of hyperglycemia. Dr. Torres, an endocrinologist at the Buffalo Medical
Group, remarked that changes could be made to the reimbursement system to encourage
more coordination between endocrinologists and PCPs. Improved collaborative efforts
might avert the development of severe complications and, from the patient’s point of
view, result in better continuity of care. Currently, endocrinologists are reimbursed like
general internists. This payment system does not adequately compensate for the severity of
the health problems in their patient populations nor the specialized skills and knowledge
that endocrinologists acquire as a result of their additional training. Dr. Torres believes
that these problems have, in part, led to decreased entry into the field of endocrinology.
There are no enough endocrinologists in the western New York area to manage the large
number of diabetics. One endocrinologist (from IHA’s Diabetes Clinical Advisory Group)
recently stated that appointments need to be made 10 months in advance.

45
Health and Economic Impact
We obtained from IHA a claims and medical record data to analyze the health and
financial effects of IHA’s diabetes disease management program. For each year 1998–2000,
IHA collected medical record data for a sample of diabetics in each of the markets it
serves: commercial, Medicare, and Medicaid (no medical record data were collected for
Medicare members in 1998). The medical record data indicate whether the diabetic
member had each of four tests (HbA1c, LDL, Microalbumin, and diabetic retinal exam)
and the results of any tests performed. In addition, the medical record data indicate
whether or not the member is insulin dependent. For each member for which medical
record data were available, claims data were obtained for the years 1998–2000; only paid
claims were used in this analysis. The claims data included both prescription and non-
prescription claims. From these data it was possible to create a variable indicating whether,
for an individual member in a particular year, there was at least one claim filed recording a
comorbidity. Additional data were obtained from the enrollment files on the members’
age and gender.
Figures 7–12 and Appendix Table 4 present summary statistics by IHA line of
business and the year the medical record data were collected for diabetes testing rates, test
results, insulin dependence, existence of comorbidity, age, and gender. The data show
that, in all three lines of business, testing rates increased and many of the test results
improved over time.
Figure 7. Mean HbA1c Levels Among IHA Diabetic Members, 1998–2000
7.57.5
8.1 8.0
8.88.8
7.37.5
6
7
8
9
10
1998 1999 2000
Commercial Medicaid Medicare
Note: The American Diabetes Association defines good HbA1c control as less than 8%;the Health Plan Employer Data and Information Set (HEDIS) defines good HbA1c control asless than 9.5%.
Source: IHA outcomes data.
Percent
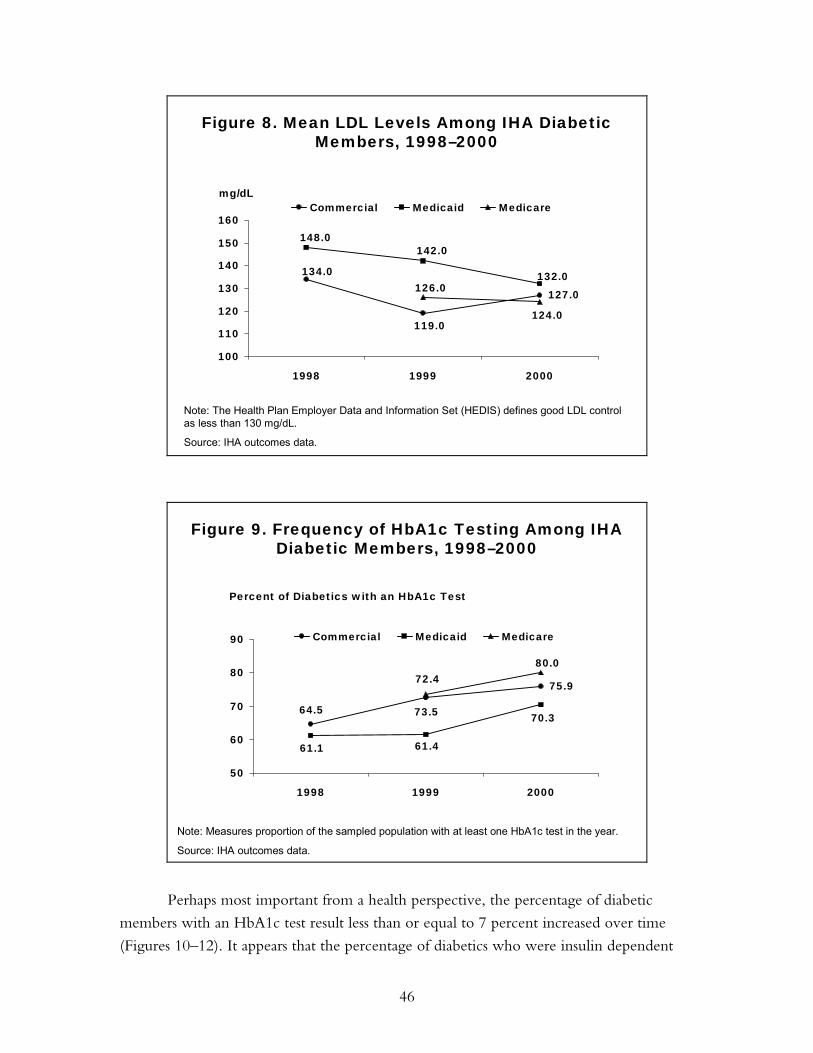
46
Figure 8. Mean LDL Levels Among IHA Diabetic Members, 1998–2000
127.0
119.0
134.0 132.0
142.0148.0
124.0
126.0
100
110
120
130
140
150
160
1998 1999 2000
Commercial Medicaid Medicare
Note: The Health Plan Employer Data and Information Set (HEDIS) defines good LDL control as less than 130 mg/dL.
Source: IHA outcomes data.
mg/dL
Figure 9. Frequency of HbA1c Testing Among IHA Diabetic Members, 1998–2000
75.972.4
64.570.3
61.461.1
80.0
73.5
50
60
70
80
90
1998 1999 2000
Commercial Medicaid Medicare
Percent of Diabetics with an HbA1c Test
Note: Measures proportion of the sampled population with at least one HbA1c test in the year.
Source: IHA outcomes data.
Perhaps most important from a health perspective, the percentage of diabetic
members with an HbA1c test result less than or equal to 7 percent increased over time
(Figures 10–12). It appears that the percentage of diabetics who were insulin dependent

47
decreased over time and that the percentage of diabetics with at least one report of a
comorbidity increased over time.
Figure 10. Percent of IHA Diabetic Memberswith HbA1c Levels Less than 9.5%
88.089.079.0
90.090.0
65.0
80.0
72.0
60
70
80
90
100
1998 1999 2000
Commercial Medicaid Medicare
Note: The American Diabetes Association defines good HbA1c control as less than 8%;the Health Plan Employer Data and Information Set (HEDIS) defines good HbA1c control asless than 9.5%.
Source: IHA outcomes data.
Figure 11. Percent of IHA Diabetic Memberswith HbA1c Levels Less than 8.0%
71.070.057.0
77.071.0
42.0
57.0
49.040
50
60
70
80
1998 1999 2000
Commercial Medicaid Medicare
Note: The American Diabetes Association defines good HbA1c control as less than 8%;the Health Plan Employer Data and Information Set (HEDIS) defines good HbA1c control asless than 9.5%.
Source: IHA outcomes data.

48
Figure 12. Percent of IHA Diabetic Memberswith HbA1c Levels Less than 7.0%
50.348.1
36.538.5
23.623.2
55.4
44.1
20
30
40
50
60
1998 1999 2000
Commercial Medicaid Medicare
Note: The American Diabetes Association defines good HbA1c control as less than 8%;the Health Plan Employer Data and Information Set (HEDIS) defines good HbA1c control asless than 9.5%.
Source: IHA outcomes data.
It is widely appreciated among those conducting health care research that the
distribution of claims, and the dollar value of claims, is highly skewed. In particular, there
typically exist very large outliers in inpatient claims data. In our analyses, we have
removed outliers, defined by a claim with a dollar value greater than three standard
deviations above the mean. In Appendix Table 5, we present IHA’s average dollar claims
in total and by site of health care delivery (office, inpatient, and emergency room) for each
year and each line of business. In addition, we calculate the percent of members with at
least one inpatient claim and with at least one emergency room claim. In both the
Medicare and commercial populations, total non-prescription claims increased over the
period 1997 to 2000. In the Medicaid population, total non-prescription claims rose from
1998–2000. There appears to be no time pattern to the percentage of diabetics with at
least one inpatient or emergency room claim.
Appendix Table 5 presents further results for the dollar value of claims in the years
for which we have medical record data. For each year and line of business, we computed
the average dollar value of claims for members who did and did not have an HbA1c test.
We then aggregated these data over all the years for which we had medical record data.
Because there were no data to indicate formal enrollment in the diabetes disease
management program, we use the indication of an HbA1c test in the medical record as a
proxy for participation in the disease management program. In the sample of commercial
members, total non-prescription claims were approximately equal for those with and
without an HbA1c test. However, those with an HbA1c test had lower inpatient claims

49
and higher doctor visit claims. This pattern of lower inpatient claims and higher doctor
visit claims is repeated in the claims data for the subsample of members defined by the
presence of a comorbidity. However, among the sample of members with at least one
comorbidity, members with an HbA1c test had lower total non-prescription claims. For
members who were non-insulin dependent and whose claims indicate the presence of a
comorbidity, total non-prescription claims, inpatient claims, and doctor visit claims were
lower in the sample without an HbA1c test.
In the sample of Medicaid members, those members who had an HbA1c test had
lower non-prescription claims than members who did not have an HbA1c test for all sites
of care delivery and for all subpopulations (comorbidities and insulin dependence). This
pattern generally holds for the Medicare population as well, with one exception. Among
those members who were insulin dependent or whose claims indicated the presence of a
comorbidity, the dollar value of claims for doctor office visits was higher for those who
had an HbA1c test than for those who did not have the test.
The data presented Appendix Table 6 seem to suggest that, in many populations,
having an HbA1c test is associated with lower claims expenses. For a number of reasons, it
is inappropriate to conclude from these data that participation in a diabetes disease
management program (as indicated by the presence of an HbA1c test) causes a reduction
in claims expenses. A better test of a causal relationship is the comparison of claims
expenses before and after the observation of whether or not a member had an HbA1c test
in a particular year. Data for this longitudinal comparison are presented in Appendix Table
7 and in Figures 13 and 14. For these analyses, we use samples of commercial and
Medicaid members for whom we have medical chart data in 1998. Total non-prescription
claims expenses increased nearly uniformly for those with and without an HbA1c test.
However, claims expenses appear to have increased faster in the subgroups without an
HbA1c test. These analyses suggest a small cost savings by two years after the HbA1c test,
but additional data from subsequent years are needed to formally test this hypothesis.

50
Figure 13. IHA Commercial Population TotalNon-Prescription Claims, 1997–2000
3015
3661
2141
1642
16462077
2297
1668
1000
2000
3000
4000
1997 1998 1999 2000
No HbA1c HbA1c
In Dollars
Source: IHA outcomes data.
Figure 14. IHA Medicaid Population TotalNon-Prescription Claims, 1997–2000
2396
2729
2011
21101960 1939
21282263
1000
1500
2000
2500
3000
1997 1998 1999 2000
No HbA1c HbA1c
Source: IHA outcomes data.
In Dollars

51
DIFFERENCES BETWEEN INDEPENDENT HEALTH ASSOCIATION
AND HEALTHPARTNERS
Several key differences between Independent Health Association and
HealthPartners have influenced the types of diabetes management programs that have
developed in the different organizations. The differences are not related to philosophy;
both organizations are highly focused on quality and aim to provide the best possible care
for their diabetic patients. Rather, the differences arise from the unique organizational and
market environments in which the disease management programs were implemented.
First, there are a number of organizational differences that have affected the
implementation of diabetes disease management programs at the two plans. As noted
above, HealthPartners has a fairly sophisticated quality measurement and reporting system.
This system has been developed and improved over time. HealthPartners has utilized this
infrastructure to collect and report data on the treatment of diabetic patients.
Second, the group-staff model portion of HealthPartners’ provider network
probably reduced the costs of implementing diabetes disease management and made
implementation of the program more successful than it would have been if the program
had been implemented in an IPA network. More generally, the provider networks at the
two managed care organizations we studied were very different. HealthPartners network is
comprised of physicians practicing either in the old staff model (HealthPartners Medical
Group) or in medical group practices that are part of larger care systems. By comparison,
physicians contracting with Independent Health Association are primarily in solo practice
or in very small group practices. The organization of providers has implications both for
how patient care is delivered and the nature of potential contracting arrangements
between the managed care organization and the providers.
There are also differences between the physician markets in Minneapolis and
Buffalo. Group practice has a long history in Minneapolis, whereas the Buffalo physician
market is characterized by independently practicing physicians who bargain together
through independent practice associations. Moreover, Minneapolis has the Institute for
Clinical Systems Improvement, which has united physicians to make quality
improvements in the delivery of health care. No similar institution exists in Buffalo.
Both HealthPartners and Independent Health Association are non-profit
organizations; the business case for for-profit managed care organizations would be
different because of their different tax liability. All managed care organizations are required
52
to be non-profit in Minnesota. This could affect the health care market in Minneapolis
and indirectly affect the business case for diabetes disease management.
Finally, the Buffalo and Minneapolis markets appear to differ in terms of the
intensity of employer involvement in health insurance markets. Minneapolis is well
known for its employer purchasing coalition, the Buyers Health Care Action Group
(BHCAG). This suggests that employers in Minneapolis may be engaged in health care
purchasing in ways than employers in the Buffalo market are not. Also, from its inception,
BHCAG has had a close relationship with HealthPartners; these organizations have to
some extent evolved together over time. It is hard to isolate the effect this may have on
the business case for diabetes management at HealthPartners, but it is clearly a salient
difference between the Minneapolis and Buffalo markets. In addition, individuals at
HealthPartners have noted a high degree of total replacement contracting between
purchasers and health plans. Total replacement refers to the exclusive contracting
arrangements between a purchaser and a health plan in which the health plan may offer
multiple products (e.g., HMOs or preferred provider organizations). These exclusive
contracting arrangements have implications for the likelihood of adverse selection
problems arising in connection to diabetes disease management.
Summary of Implementation Challenges
In addition to our interviews at HealthPartners and Independent Health, we spoke with
knowledgeable individuals at the American Association of Health Plans, the American
Diabetes Association, Center for Disease Control and Prevention, and Centers for
Medicare and Medicaid Services, among others, to gain a better understanding of why
diabetes disease management programs are so difficult to implement and why more plans
do not adopt them. Because of the limited focus of this case study, we cannot speculate on
the extent to which the challenges we identified apply differentially to organizations that
have not successfully adopted disease management programs. The testing of such
hypotheses would require a different research methodology. However, we feel it is useful
to summarize the challenges encountered by the organizations we studied and to report
the findings of our conversations with individuals in other organizations.
Many interviewees agreed that organization is key to the design and
implementation of cost-effective diabetes disease management programs. They argued that
truly comprehensive diabetes programs are currently only offered by staff-model HMOs or
group models closely associated with an HMO (the model at HealthPartners), and that it is
much more difficult for network or IPA-model plans to provide them. Staff and group-
model HMOs are dying breeds in the United States. Given the documented finding of

53
higher-quality health care delivered through these types of organizations, the causes of
their decline merits future research.
Some people we interviewed remarked that even the state-of-the-art programs at
IHA and HealthPartners have not had great success in changing physician behavior and
have only moderate success in changing patient behavior. Behavioral change requires two
fundamental shifts for physicians: 1) from a focus on delivery of acute care services to
management of a program of chronic care, and 2) from autonomously delivering health
care services to partnering with patients in the management of their disease. Generally, in
their professional training, physicians do not acquire the skills necessary for chronic disease
management. Therefore, implementing disease management often requires the acquisition
of new skills by the physician and the implementation of new practices and processes in
the physician’s office. For a variety of reasons, it is difficult for health plans to stimulate
these changes. Even when a physician is open to making such changes, he or she faces the
challenge of interfacing with a few or several different health plans, which may have
different strategies for managing the care of their chronically ill members. These
differences could take the form of varying guidelines, reporting requirements, and levels of
access to auxiliary health professionals.
Health plans face several challenges in convincing patients to acquire new health
behaviors. To be actively involved in their care, patients must be knowledgeable of their
disease and capable of tracking their progress over time. Diabetic patients can obtain
generic information about their disease from their doctor and health plan. However, at the
current time, there are no systems in place that would help a patient track the clinical
indicators of their disease status. An ideal system would entail make laboratory and
examination data available to the patient as well as the physician. This would facilitate
partnerships between patients and physicians and emphasize the health care improvements
of lifestyle changes. There was general agreement among our interviewees that existing
computer resources are sufficient to implement disease management programs. However,
an information system that recorded and made clinical data available to all participants in
the disease management program could have substantial benefits.
A number of financial issues are barriers to implementing diabetes disease
management programs. Patients benefit greatly from improved diabetes care and may be
willing to pay an increased premium for such programs. This would be a substantial
inducement to health plans to provide diabetes care. Yet, health plans uniformly report
they are unable or only marginally able to raise prices after such programs are
implemented. Employers may be unwilling to pay higher premiums because they know

54
that physicians treat all their patients in the same way, no matter what health plan they
belong to. Thus, employers do not need to contract with the health plan that originally
implemented the diabetes program in order to reap the benefits for their employees.
Alternatively, employers may be unwilling to pay extra because of the potential costs to
the firm of raising health insurance premiums paid by employees.
In addition, it is difficult for providers to obtain reimbursement for care
management services. This may be most problematic in fee-for-service payment
arrangements, which reimburse contact with physicians and some non-physician personnel
(such as physician assistants), but rarely enough to justify extensive investments in new
care arrangements. Group visits, for example, which appear cost-effective in managing
diabetes, are generally not reimbursed. Reminder systems and electronic communication
between patients and providers are not compensated. In capitated arrangements, the
provider may choose to provide these services in the knowledge that longer-term savings
will be realized. Ironically, this problem may have worsened in recent years. The Health
Insurance Portability and Accountability Act (HIPAA) of 1996 required standardization of
medical electronic transactions (e.g., claims processing) reporting. This limits the scope for
payment systems reimbursing currently non-covered services. Several people indicated that
payments for some non-traditional activities were being eliminated after HIPAA.
The frequency of plan turnover compounds the financial difficulties. Several
people interviewed estimated the median time in a health plan to be 18 to 24 months. As
a result, insurers conduct cost-benefit analyses within the context of a short-term horizon,
generally one to two years in the future. Programs with returns over five to 10 years, such
as a diabetes disease management, do not have a rapid enough payoff to justify up-front
investment costs.
Adverse selection was also frequently mentioned as a disincentive for health plans
to adopt disease management programs. More generous plans are more likely to attract
sick patients than less generous plans. As a result, plans may be reluctant to improve
quality, fearing that the proportion of diabetic patients in the plan will increase due to
their improved reputation for diabetes management.
Extension of Findings to Other Chronic Care Disease Management Programs
The principles of disease management have been adapted for the care of many other
chronic diseases. We found reference to a number of health plan–initiated chronic disease
management programs in our research, including programs for asthma, congestive heart
failure, HIV/AIDS, cancer, and depression. The quantitative analyses presented in this case
55
study apply only to the business case for diabetes disease management delivered through
managed care organizations. In particular, the calculation of return on investment is very
sensitive to the time pattern of the cost savings from averted complications. Different
diseases will likely have different time patterns and hence different financial returns.
However, the issues relating to barriers to program implementation and the effectiveness
of disease management in improving health are quite general and likely to be pertinent to
the business cases for other chronic care disease management programs.
Knowledge Gaps and Study Limitations
As noted above, it is not possible to generalize the results of this case study to the business
case for diabetes disease management at other managed care organizations operating in
other markets. This is a limitation of case study analysis. In addition, the organizations we
studied have been repeatedly recognized for excellence in health care delivery in general
and for their diabetes programs in particular. Thus, the challenges that these organizations
faced in implementing their diabetes disease management programs may be only a subset
of the implementation challenges that would face other managed care organizations in
implementing similar programs. In addition, it was necessary to make a number of
important assumptions (for example about medical care inflation) to arrive at our estimate
of the return on investment. Different assumptions necessarily lead to different estimates of
the return on investment.
Finally, we were unable to obtain some data that would affect the business case for
diabetes disease management. These include but are not limited to: rates of turnover in
diabetic and non-diabetic populations, employers’ willingness to pay for enhanced quality
of care, the relative effectiveness of disease management carve-out programs, and the fixed
costs associated with the design and institution of a diabetes disease management
(particularly with respect to information systems).

56
APPENDIX
Table A-1. Component Listing of HealthPartners’ Diabetes Care Management and Prevention Programs
Care Management Program
• ICSI guidelines identify outcome targets for diabetic patients and guidance on clinical management
• at-risk lists sent to HPMG clinics twice yearly with names, test dates, and test results of all diabetic patients
• at-risk lists sent to contracted clinics twice yearly with names and test dates of all diabetic patients
• performance information sent to all PCPs in HPMG twice yearly
• Diabetes resource nurses in HPMG proactively contact patients with missed appointments/tests and deliver diabetes education and self-management support in clinics
• PCPs in contracted clinics discuss lifestyle details with patients and offer counseling from an educator or dietician if needed
• Staged Diabetes Management advises PCPs in HPMG and some contracted clinics on prescription of medication and medical nutrition treatment
• Outcomes Recognition Program pays bonuses to contracted medical groups that reach stretch targets in five areas, including diabetes management
• patient education mailings sent out regularly to all patients
• collaboration between health plan and medical groups produces member publications, newsletters, wallet cards
• new Certified Diabetes Educator program involves diabetes educators acting as liaison between PCP and endocrinologist
Early Identification and Prevention Program
• voluntary Health Risk Assessment (HRA) sent through mail or via employer
• diabetes risk quiz includes 10 HRA questions specific to diabetes; algorithm is used to identify patients likely to be diabetic in the following 2.5 years
• phone bank follows up on HRA and diabetes risk quiz
• patients can call the phone line proactively or be referred to it by PCP
• formal programs through phone bank to help patients control weight and make other lifestyle changes

57
Table A-2. Description of Independent Health Disease Management Program
1997
• revised clinical guidelines distributed to PCPs
• diabetes case management program initiated
• an article on blood sugar warnings in the member newsletter
• quality profile mailing to PCPs with diabetic members
• seminar for physicians on updates in diabetes management (continuing medical education credit)
• medical record self-review for adherence to diabetes clinical practice guidelines (393 charts reviewed)
• member mailing on the importance of HbA1c testing to members who failed to obtain the minimum of two tests in the past year; additional educational information included
• member mailing about free blood glucose meter exchange program sponsored by Independent Health; additional educational information included
• mailing to physicians who prescribe rezulin of a warning letter issued by the drug’s manufacturer
1998
• continuation of the diabetes case management program (214 members case-managed in 1998)
• mailing to physicians on diabetes screening and clinical practice guidelines
• an article entitled “American Diabetes Alert” in the member newsletter
• diabetes educational seminar sponsored by Independent Health; invitations sent to members with diabetes
• quality profile mailing to PCPs with diabetic members
• audio health library expanded to include materials on diabetes care
• telephone self-help program (“Feeling Fit”) provides information about community programs for diabetics
• diabetes screening offered to seniors in the context of a senior health education and awareness seminar
• Independent Health’s website expanded to include a web page with educational information on diabetes and links to diabetes-related websites and community resources.
• Physicians mailed a diabetes case management tip sheet and a case management referral sheet to facilitate the enrollment of high-risk members in case management
• Telephone reminder calls to diabetic members who have not had a diabetic retinal exam during the past year

58
Table A-2. (continued)
1999
• continuation of the diabetes case management program (216 members case-managed in 1999)
• audio health library program continued
• Independent Health web page on diabetes continued
• “Health Fax Special Reports” (advertised in member newsletter) requested by and sent to 174 diabetic IH members
• telephone self-help program expanded to include information on hospital-based diabetes education programs
• physician newsletter articles on foot exams for diabetics, HbA1c testing, incentive program for members to get diabetic retinal exams
• thyroid and diabetes screening program (invitation sent to 2000 IH members)
• diabetes-related articles in member newsletters
• quality-of-life survey sent to 400 members with diabetes
• reminders mailed to physicians about members needing HbA1c and diabetic retinal exams
• follow-up calls to 100 members who did not obtain diabetic retinal exam
• mailing to diabetic members who did not have two HbA1c exams and/or diabetic retinal exams
• education mailing to all diabetic members with information on HbA1c and retinal exams, invitation to participate in telephone self-help program (“Feeling Fit with Diabetes”), and incentive (long-distance phone card) to get annual retinal exam
2000
• continuation of the diabetes case management program (202 members case-managed in 2000)
• telephone 24-hour medical help line continued with nurses accessible for emergencies
• audio health library available with tapes on diabetes management
• Independent Health web page on diabetes continued
• “Health Fax Special Reports” sent to diabetic IH members
• diabetes-specific quality-of-life surveys sent on a quarterly basis to a random sample of members with diabetes
• special classes on health care management offered to members with diabetes
• articles in member newsletter related to diabetes
• diabetes screening program offered, invitation sent to 2000 IH members
• revised diabetes clinical practice guidelines send to PCPs, endocrinologists, ophthalmologists, optometrists, and podiatrists
• free diabetes screening and health education and awareness seminar offered to seniors

59
Table A-2. (continued)
• articles in physician newsletter on: showcasing diabetes disease management program; summaries of ADA standards of care, review of diabetes screening and care for patients with diabetes; encouraging use of diabetes care flow-sheets and availability of office posters, chart stickers, etc; screening for various diseases including diabetes
• mailing to IH members with diabetes includes educational pamphlet reminder sheet listing important tests and exams, pocket diabetes care card to record dates and results of tests, invitation to attend eight-hour educational program, “Feeling Fit with Diabetes”
• education program for PCP office staff to promote adherence to diabetes standards of care and to utilize provider tools for diabetes management in the office

60
Table A-3. Independent Health: Program and Population Statistics by Year and Line of Business
Commercial Population 1998 1999 2000 Cohort size 454 511 453 Test Rates
HbA1c 64.5 72.4 75.9 LDL 55.1 63.6 73.9 Micro 44.9 48.1 51.0 DRE 27.5 27.4 31.1 All four tests 9.2 12.5 15.5
Test Results
HbA1c 8.1 7.5 7.5 % HbA1c<7 36.5 48.1 50.3 LDL 134 119 127 Micro (% normal) 78.4 83.7 81.1 DRE (% normal) 78.7 64.7 75.7
% female 48.0 49.0 49.0 Average Age 50.7 52.9 53.8 % insulin dependent 36.9 27.6 24.3 % with at least one comorbidity 33.2 37.9 41.6 Average Total non-Rx Claims for diabetics 2075 2705 2773

61
Table A-3. (continued) Medicaid Population 1998 1999 2000 Cohort size 162 290 303 Test Rates
HbA1c 61.1 61.4 70.3 LDL 32.7 42.8 59.7 Micro 42.0 47.9 56.1 DRE 21.0 14.8 16.5 All four tests 3.7 6.2 7.3
Test Results HbA1c 8.8 8.8 8.0 % HbA1c<7 23.2 23.6 38.5 LDL 148 142 132 Micro (% normal) 69.1 86.3 69.5 DRE (% normal) 83.3 81.0 64.6
% female 80.0 76.0 71.0 Average Age 41.8 44.1 45.4 % insulin dependent 44.4 31.4 32.8 % with at least one comorbidity 24.8 25.4 32.9 Average Total non-Rx Claims for diabetics 2121 2128 2864

62
Table A-3. (continued) Medicare Population 1999 2000 Cohort size 509 453 Test Rates
HbA1c 73.5 80.0 LDL 64.8 75.1 Micro 45.6 45.0 DRE 30.5 29.1 All four tests 13.9 13.9
Test Results
HbA1c 7.5 7.3 % HbA1c<7 44.1 55.4 LDL 126 124 Micro (% normal) 86.1 76.0 DRE (% normal) 59.3 69.0
% female 49 49 Average Age 67.9 68.0 % insulin dependent 21.1 22.2 % with at least one comorbidity 55.0 59.4 Average Total non-Rx Claims for diabetics 3697 4627
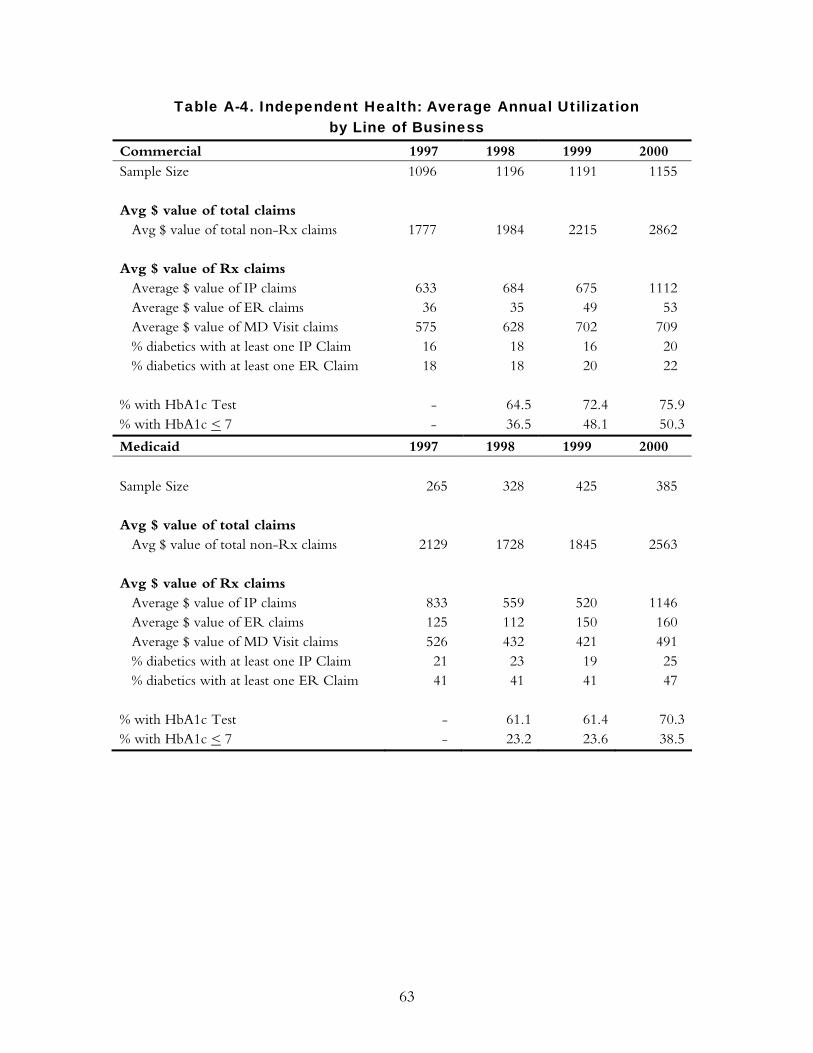
63
Table A-4. Independent Health: Average Annual Utilization by Line of Business
Commercial 1997 1998 1999 2000 Sample Size 1096 1196 1191 1155 Avg $ value of total claims
Avg $ value of total non-Rx claims 1777 1984 2215 2862 Avg $ value of Rx claims
Average $ value of IP claims 633 684 675 1112 Average $ value of ER claims 36 35 49 53 Average $ value of MD Visit claims 575 628 702 709 % diabetics with at least one IP Claim 16 18 16 20 % diabetics with at least one ER Claim 18 18 20 22
% with HbA1c Test - 64.5 72.4 75.9% with HbA1c < 7 - 36.5 48.1 50.3
Medicaid 1997 1998 1999 2000 Sample Size 265 328 425 385 Avg $ value of total claims
Avg $ value of total non-Rx claims 2129 1728 1845 2563 Avg $ value of Rx claims
Average $ value of IP claims 833 559 520 1146 Average $ value of ER claims 125 112 150 160 Average $ value of MD Visit claims 526 432 421 491 % diabetics with at least one IP Claim 21 23 19 25 % diabetics with at least one ER Claim 41 41 41 47
% with HbA1c Test - 61.1 61.4 70.3% with HbA1c < 7 - 23.2 23.6 38.5
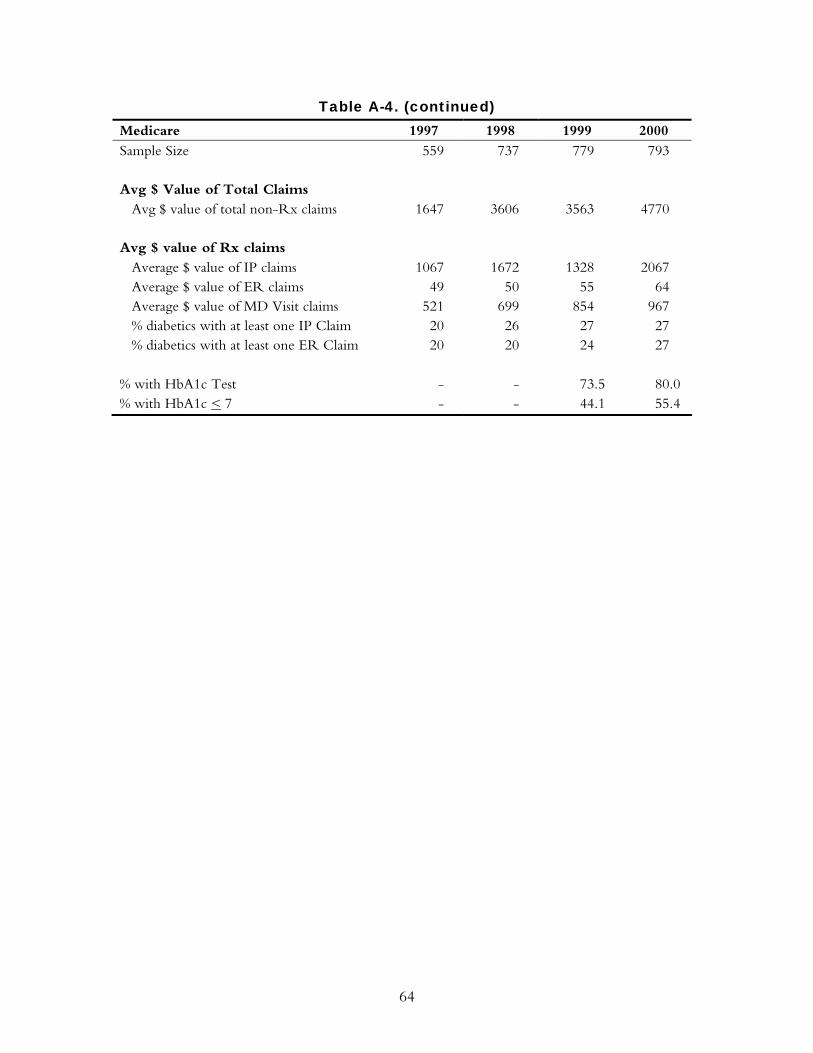
64
Table A-4. (continued) Medicare 1997 1998 1999 2000 Sample Size 559 737 779 793 Avg $ Value of Total Claims
Avg $ value of total non-Rx claims 1647 3606 3563 4770 Avg $ value of Rx claims
Average $ value of IP claims 1067 1672 1328 2067 Average $ value of ER claims 49 50 55 64 Average $ value of MD Visit claims 521 699 854 967 % diabetics with at least one IP Claim 20 26 27 27 % diabetics with at least one ER Claim 20 20 24 27
% with HbA1c Test - - 73.5 80.0 % with HbA1c < 7 - - 44.1 55.4

65
Table A-5. Independent Health: Decomposition of Total Claims by Site of Service and Evidence of HbA1c Test
Commercial 1998–2000
Total claims$ (t)
IP claims $ (t)
ER claims $ (t)
MD visit claims $ (t)
Overall Population No HbA1c test 2504 1077 52 652 HbA1c test 2535 937 44 726
Insulin Dependent
No HbA1c test 3405 1847 52 610 HbA1c test 3302 1112 43 911
Non-Insulin Dependent No HbA1c test 1944 690 33 598 HbA1c test 2349 883 42 682
Comorbidity No HbA1c test 4348 2449 59 897 HbA1c test 3688 1590 58 962
No Comorbidity No HbA1c test 1712 488 50 541 HbA1c test 1797 515 36 570

66
Table A-5. (continued) Medicaid 1998–2000
Total claims$ (t)
IP claims $ (t)
ER claims $ (t)
MD visit claims $ (t)
Overall Population No HbA1c test 2722 1095 180 486 HbA1c test 2253 856 156 562
Insulin Dependent
No HbA1c test 2548 1280 220 440 HbA1c test 2542 1022 172 599
Non-Insulin Dependent No HbA1c test 2403 1014 148 569 HbA1c test 2107 760 140 546
Comorbidity No HbA1c test 4388 1758 193 699 HbA1c test 3271 1335 134 715
No Comorbidity No HbA1c test 2156 871 176 411 HbA1c test 1866 672 165 499

67
Table A-5. (continued) Medicare 1998–2000
Total claims$ (t)
IP claims $ (t)
ER claims $ (t)
MD visit claims $ (t)
Overall Population No HbA1c test 5229 2941 80 931 HbA1c test 3823 1372 55 927
Insulin Dependent
No HbA1c test 6959 5664 105 1078 HbA1c test 4535 1803 55 1186
Non-Insulin Dependent No HbA1c test 4512 2486 83 1026 HbA1c test 3519 1166 52 885
Comorbidity No HbA1c test 6964 4145 97 975 HbA1c test 4585 1750 69 1134
No Comorbidity No HbA1c test 2894 1274 55 868 HbA1c test 2877 899 37 658

68
Table A-6. Independent Health: Time Pattern of Total Non-Prescription Claims
Cohort Defined by Medical Record Review in 1998
Total $ claims
1997
Total $ claims
1998
Total $ claims
1999
Total $ claims
2000 Commercial
No HbA1c test 1646 1642 2141 3661 HbA1c test 1668 2297 2077 3015
Medicaid
No HbA1c test 1960 2110 2011 2729 HbA1c test 2263 2128 1939 2396

69
RELATED PUBLICATIONS
In the list below, items that begin with a publication number are available from The
Commonwealth Fund by calling its toll-free publications line at 1-888-777-2744
and ordering by number. These items can also be found on the Fund’s website at
www.cmwf.org. Other items are available from the authors and/or publishers.
#620 Smallpox Vaccinations: The Risks and the Benefits (April 2003, Web publication). Rena Conti. Prepared for the 2003 Commonwealth Fund/John F. Kennedy School of Government Bipartisan Congressional Health Policy Conference, this issue brief argues that offering voluntary smallpox vaccinations to the public presents benefits that must be weighed against associated medical, logistic, and economic risks. Policymakers must navigate complex tensions between scientific and political uncertainty, and between the government’s role in protecting its citizenry while guaranteeing individuals’ rights to self-determination. #619 The Nursing Workforce Shortage: Causes, Consequences, Proposed Solutions (April 2003, Web publication). Patricia Keenan. Prepared for the 2003 Commonwealth Fund/John F. Kennedy School of Government Bipartisan Congressional Health Policy Conference, this issue brief argues that projected long-term nursing shortages will create still greater cost and quality challenges, and that without increased payments from public or private purchasers, health care institutions will most likely have to make tradeoffs between investing in staffing and pursuing other quality-improvement efforts. #615 Balancing Safety, Effectiveness, and Public Desire: The FDA and Cancer (April 2003, Web publication). Rena Conti. Prepared for the 2003 Commonwealth Fund/John F. Kennedy School of Government Bipartisan Congressional Health Policy Conference, this issue brief discusses the challenges the FDA faces in balancing the need to ensure that cancer drugs are safe and effective against pressure to make therapies available quickly. #614 The Business Case for Tobacco Cessation Programs: A Case Study (April 2003, Web publication). Artemis March, The Quantum Lens. This case study looks at the business case for a smoking cessation program that was implemented through the Group Health Cooperative (GHC), a health system and health plan based in Seattle. #613 The Business Case for Pharmaceutical Management: A Case Study (April 2003, Web publication). Helen Smits, Barbara Zarowitz, Vinod K. Sahney, and Lucy Savitz. This case study explores the business case for two innovations in pharmacy management at the Henry Ford Health System, based in Detroit, Michigan. In an attempt to shorten hospitalization for deep vein thrombosis, Henry Ford experimented with the use of an expensive new drug, low molecular weight heparin. The study also examines a lipid clinic that was created at Henry Ford to maximize the benefit of powerful new cholesterol-lowering drugs. #612 The Business Case for a Corporate Wellness Program: A Case Study (April 2003, Web publication). Elizabeth A. McGlynn, Timothy McDonald, Laura Champagne, Bruce Bradley, and Wesley Walker. In 1996, General Motors and the United Auto Workers Union launched a comprehensive preventive health program for employees, LifeSteps, which involves education, health appraisals, counseling, and other interventions. This case study looks at the business case for this type of corporate wellness program.

70
#611 The Business Case for Drop-In Group Medical Appointments: A Case Study (April 2003, Web publication). Jon B. Christianson and Louise H. Warrick, Institute for Healthcare Improvement. Drop-In Group Medical Appointments (DIGMAs) are visits with a physician that take place in a supportive group setting, and that can increase access to physicians, improve patient satisfaction, and increase physician productivity. This case study examines the business case for DIGMAs as they were implemented in the Luther Midelfort Mayo System, based in Eau Claire, Wisconsin. #609 The Business Case for Clinical Pathways and Outcomes Management: A Case Study (April 2003, Web publication). Artemis March, The Quantum Lens. This case study describes the implementation of an outcomes center and data-based decision-making at Children’s Hospital and Health Center of San Diego during the mid-1990s. It examines the business case for the core initiative: the development of a computerized physician order entry system. Hospital Disclosure Practices: Results of a National Survey (March/April 2003). Rae M. Lamb, David M. Studdert, Richard M. J. Bohmer, Donald M. Berwick, and Troyen A. Brennan. Health Affairs, vol. 22, no. 2. Copies are available from Health Affairs, 7500 Old Georgetown Road, Suite 600, Bethesda, MD 20814-6133, Tel: 301-656-7401 ext. 200, Fax: 301-654-2845, www.healthaffairs.org. The Business Case for Quality: Case Studies and An Analysis (March/April 2003). Sheila Leatherman, Donald Berwick, Debra Iles, Lawrence S. Lewin, Frank Davidoff, Thomas Nolan, and Maureen Bisognano. Health Affairs, vol. 22, no. 2. Copies are available from Health Affairs, 7500 Old Georgetown Road, Suite 600, Bethesda, MD 20814-6133, Tel: 301-656-7401 ext. 200, Fax: 301-654-2845, www.healthaffairs.org. #606 Health Plan Quality Data: The Importance of Public Reporting (January 2003). Joseph W. Thompson, Sathiska D. Pinidiya, Kevin W. Ryan, Elizabeth D. McKinley, Shannon Alston, James E. Bost, Jessica Briefer French, and Pippa Simpson. American Journal of Preventive Medicine, vol. 24, no. 1 (In the Literature summary). The authors present evidence that health plan performance is highly associated with whether a plan publicly releases its performance information. The finding makes a compelling argument for the support of policies that mandate reporting of quality-of-care measures. #578 Exploring Consumer Perspectives on Good Physician Care: A Summary of Focus Group Results (January 2003, Web publication). Donna Pillittere, Mary Beth Bigley, Judith Hibbard, and Greg Pawlson. Part of a multifaceted Commonwealth Fund-supported study, “Developing Patient-Centered Measures of Physician Quality,” the authors report that consumers can understand and will value information about effectiveness and patient safety (as well as patient-centeredness) if they are presented with information in a consumer-friendly framework. #563 Escape Fire: Lessons for the Future of Health Care (November 2002). Donald M. Berwick. In this monograph, Dr. Berwick outlines the problems with the health care system—medical errors, confusing and inconsistent information, and a lack of personal attention and continuity in care—and then sketches an ambitious program for reform. Achieving and Sustaining Improved Quality: Lessons from New York State and Cardiac Surgery (July/August 2002). Mark R. Chassin. Health Affairs, vol. 21, no. 4. Copies are available from Health Affairs, 7500 Old Georgetown Road, Suite 600, Bethesda, MD 20814-6133, Tel: 301-656-7401 ext. 200, Fax: 301-654-2845. Available online at http://www.healthaffairs.org/ readeragent.php?ID=/usr/local/apache/sites/healthaffairs.org/htdocs/Library/v21n4/s8.pdf.

71
Improving Quality Through Public Disclosure of Performance Information (July/August 2002). David Lansky. Health Affairs, vol. 21, no. 4. Copies are available from Health Affairs, 7500 Old Georgetown Road, Suite 600, Bethesda, MD 20814-6133, Tel: 301-656-7401 ext. 200, Fax: 301-654-2845. Available online at http://www.healthaffairs.org/readeragent.php?ID=/usr/local/ apache/sites/healthaffairs.org/htdocs/Library/v21n4/s9.pdf. Factors Affecting Response Rates to the Consumer Assessment of Health Plans Study Survey (June 2002). Alan M. Zaslavsky, Lawrence B. Zaborski, and Paul D. Cleary. Medical Care, vol. 40, no. 6. Copies are available from Paul D. Cleary, Department of Health Care Policy, Harvard Medical School, 180 Longwood Avenue, Boston, Massachusetts 02115, E-mail: [email protected]. #539 Improving Health Care Quality: Can Federal Efforts Lead the Way? (April 2002). Juliette Cubanski and Janet Kline. This issue brief, prepared for the 2002 Commonwealth Fund/Harvard University Bipartisan Congressional Health Policy Conference, discusses the ways in which various federal agencies can work to improve health care quality for all Americans. Available online only at www.cmwf.org. #535 Assessing the Threat of Bioterrorism: Are We Ready? (April 2002). Patricia Seliger Keenan and Janet Kline. This issue brief, prepared for the 2002 Commonwealth Fund/Harvard University Bipartisan Congressional Health Policy Conference, examines federal preparedness, state and local infrastructure, congressional actions to improve preparedness, and regulatory and legal policies regarding the threat of bioterrorism in the United States. Available online only at www.cmwf.org. #534 Room for Improvement: Patients Report on the Quality of Their Health Care (April 2002). Karen Davis, Stephen C. Schoenbaum, Karen Scott Collins, Katie Tenney, Dora L. Hughes, and Anne-Marie J. Audet. Based on the Commonwealth Fund 2001 Health Care Quality Survey, this report finds that many Americans fail to get preventive health services at recommended intervals or receive substandard care for chronic conditions, which can translate into needless suffering, reduced quality of life, and higher long-term health care costs. #520 Quality of Health Care in the United States: A Chartbook (April 2002). Sheila Leatherman and Douglas McCarthy. This first-of-its-kind portrait of the state of health care quality in the United States documents serious gaps in quality on many crucial dimensions of care: lack of preventive care, medical mistakes, substandard care for chronic conditions, and health care disparities. The chartbook is based on more than 150 published studies and reports about quality of care. A 58-Year-Old Woman Dissatisfied with Her Care, Two Years Later (March 27, 2002). Anne-Marie Audet and Erin Hartman. Journal of the American Medical Association, vol. 287, no. 12. Copies are available from Anne-Marie Audet, M.D., The Commonwealth Fund, 1 East 75th Street, New York, NY 10021-2692, E-mail: [email protected]. Delivering Quality Care: Adolescents’ Discussion of Health Risks with Their Providers (March 2002). Jonathan D. Klein and Karen M. Wilson. Journal of Adolescent Health, vol. 30, no. 3. Copies are available from Jonathan D. Klein, Strong Children’s Research Center, Division of Adolescent Medicine, Department of Pediatrics, University of Rochester School of Medicine and Dentistry, 601 Elmwood Avenue, RM 4-6234, Rochester, NY, Tel: 585-275-7660, E-mail: [email protected]. #503 Accessing Physician Information on the Internet (January 2002). Elliot M. Stone, Jerilyn W. Heinold, Lydia M. Ewing, and Stephen C. Schoenbaum. In this field report, the authors analyzed 40 websites that offer information about physicians. Finding many instances where websites had incomplete, missing, and possibly inaccurate or outdated data, the authors conclude that health

72
care accrediting organizations, health plans, hospitals, and local and national industry organizations and associations should make efforts to improve the information on the Internet, saying that it is a potential valuable tool for consumers. #528 The APHSA Medicaid HEDIS Database Project (December 2001). Lee Partridge, American Public Human Services Association. This study (available on the Fund’s website only) assesses how well managed care plans serve Medicaid beneficiaries, and finds that while these plans often provide good care to young children, their quality scores on most other measures lag behind plans serving the commercially insured. For-Profit and Not-for-Profit Health Plans Participating in Medicaid (May/June 2001). Bruce E. Landon and Arnold M. Epstein. Health Affairs, vol. 20, no. 3. Copies are available from Health Affairs, 7500 Old Georgetown Road, Suite 600, Bethesda, MD 20814-6133, Tel: 301-656-7401 ext. 200, Fax: 301-654-2845, www.healthaffairs.org. Improving Quality, Minimizing Error: Making It Happen (May/June 2001). Elise C. Becher and Mark R. Chassin. Health Affairs, vol. 20, no 3. Copies are available from Health Affairs, 7500 Old Georgetown Road, Suite 600, Bethesda, MD 20814-6133, Tel: 301-656-7401 ext. 200, Fax: 301-654-2845, www.healthaffairs.org. #456 A Statistical Analysis of the Impact of Nonprofit Hospital Conversions on Hospitals and Communities, 1985–1996 (May 2001). Jack Hadley, Bradford H. Gray, and Sara R. Collins. In this study, the authors analyze the effects of private, nonprofit hospital conversions that occurred between 1985 and 1993 by comparing converting hospitals to a control group of statistically similar private nonprofit hospitals that were estimated to have a high probability of conversion, but did not convert over the observation period. The report is available online only at www.cmwf.org. #455 The For-Profit Conversion of Nonprofit Hospitals in the U.S. Health Care System: Eight Case Studies (May 2001). Sara R. Collins, Bradford H. Gray, and Jack Hadley. This report examines the 87 for-profit conversions of nonprofit hospitals in the years 1985–1994, more than one-third of which took place in three states, and nearly half of which were in the Southeast. The report is available online only at www.cmwf.org. Measuring Patients’ Expectations and Requests (May 1, 2001). Richard L. Kravitz. Annals of Internal Medicine, vol. 134, no. 9, part 2. Copies are available from Richard L. Kravitz, Center for Health Services Research in Primary Care, University of California, Davis, 4150 V Street, PSSB Suite 2500, Sacramento, CA 95817, E-mail: [email protected]. Current Issues in Mental Health Policy (Spring 2001). Colleen Barry. Harvard Health Policy Review, vol. 2, no. 1. Adapted from an issue brief prepared for the John F. Kennedy School of Government/Commonwealth Fund Bipartisan Congressional Health Policy Conference in January 2001. Available online at http://hcs.harvard.edu/~epihc/currentissue/spring2001/barry.html. Health Plan Characteristics and Consumers’ Assessments of Quality (March/April 2001). Bruce E. Landon et al. Health Affairs, vol. 20, no. 2. Copies are available from Health Affairs, 7500 Old Georgetown Road, Suite 600, Bethesda, MD 20814-6133, Tel: 301-656-7401 ext. 200, Fax: 301-654-2845, www.healthaffairs.org. Patient Safety and Medical Errors: A Road Map for State Action (March 2001). Jill Rosenthal and Trish Riley. Copies are available from the National Academy for State Health Policy, 50 Monument

73
Square, Suite 502, Portland, ME 04101, Tel: 207-874-6524, Fax: 207-874-6527. Available online at www.nashp.org/GNL37.pdf. #446 The Quality of American Health Care: Can We Do Better? (January 2001). Karen Davis. In this essay—a reprint of the president’s message from the Fund’s 2000 Annual Report—the author looks at health care quality: how to define it, how to measure it, and how to improve it. Envisioning the National Health Care Quality Report (2001). Committee on the National Quality Report on Health Care Delivery, Institute of Medicine. Copies are available from the National Academy Press, 2101 Constitution Avenue, NW, Box 285, Washington, DC 20055, Tel: 800-624-6242, E-mail: www.nap.edu.