Embed Size (px)
DESCRIPTION
survey of sicker adults in 11 countries
Citation preview

THE COMMONWEALTH
FUND
The Commonwealth Fund
2011 International Health Policy
Survey
of Sicker Adults in Eleven
Countries Cathy Schoen and Robin Osborn
The Commonwealth Fund
November 2011

THE
COMMONWEALTH
FUND
2011 Commonwealth Fund International Health Policy Survey 2
• Telephone survey of representative samples of sicker adults
ages 18 and older conducted from March to June 2011.
• Sicker adults screened in: fair or poor health; had
surgery or been hospitalized in past two years; or
received care for serious or chronic illness, injury,
or disability in past year.
• Final samples: Australia 1,500, Canada 3,958, France
1,001, Germany 1,200, Netherlands 1,000, New Zealand
750, Norway 753, Sweden 4,804, Switzerland 1,500,
United Kingdom 1,001, and United States 1,200.
• Conducted by Harris Interactive and country contractors.
• Core topics: Affordability and access, care
coordination and care transitions, patient safety,
patient-centered care, doctor–patient relationship
and patient activation, managing chronic conditions,
medical homes, and U.S. experiences by age and
insurance status.

THE
COMMONWEALTH
FUND
$2,983
$3,445 $3,487 $3,722
$3,978 $4,218 $4,363
$4,914 $5,144
$5,352
$7,960
$0
$1,000
$2,000
$3,000
$4,000
$5,000
$6,000
$7,000
$8,000
NZ (10.3%) AUS (8.7%)* UK (9.8%) SWE (10.0%) FR (11.8%) GER (11.6%) CAN (11.4%) NETH (12.0%) SWIZ (11.4%) NOR (9.6%) US (17.4%)
3 Health Spending per Capita, 2009
Adjusted for Differences in Cost of Living
* 2008.
Source: OECD Health Data 2011 (June 2011).
% GDP
Dollars

THE
COMMONWEALTH
FUND
4 2011 Survey Profile of Sicker Adults
Percent AUS CAN FR GER NETH NZ NOR SWE SWIZ UK US
Age 50 or older 57 50 54 60 57 54 60 58 63 62 56
Has two or more
chronic
conditions (out
of eight)
44 41 34 42 34 34 35 26 37 45 53
Health care use
in past two
years:
Hospitalized 54 37 51 43 40 50 46 48 54 48 40
Surgery 43 37 36 37 39 46 38 35 46 41 38
Saw four or
more doctors 32 21 23 36 24 26 19 23 6 16 21
Taking four or
more
prescription
medications
regularly
28 30 26 24 31 27 29 30 24 35 37
Source: 2011 Commonwealth Fund International Health Policy Survey of Sicker Adults in
Eleven Countries.
THE
COMMONWEALTH
FUND
5 5
Affordability and Access

THE
COMMONWEALTH
FUND
6 Cost-Related Access Problems in the Past Year
Percent AUS CAN FR GER NETH NZ NOR SWE SWIZ UK US
Did not fill
prescription
or skipped
doses
16 15 11 14 8 12 7 7 9 4 30
Had a medical
problem but
did not visit
doctor
17 7 10 12 7 18 8 6 11 7 29
Skipped test,
treatment, or
follow-up
19 7 9 13 8 15 7 4 11 4 31
Yes to at
least one of
the above
30 20 19 22 15 26 14 11 18 11 42
Source: 2011 Commonwealth Fund International Health Policy Survey of Sicker
Adults in Eleven Countries.

THE
COMMONWEALTH
FUND
7 Out-of-Pocket Spending and Problems Paying Medical Bills
in Past Year
Percent
1
5 6
11 12 13
16
24
35 36 39
0
10
20
30
40
50
60
More than US$1,000 in
out-of-pocket costs
1 4 5 6 7 8 8 8
11 14
27
Serious problems paying or
unable to pay medical bills
Source: 2011 Commonwealth Fund International Health Policy Survey of Sicker
Adults in Eleven Countries.
THE
COMMONWEALTH
FUND
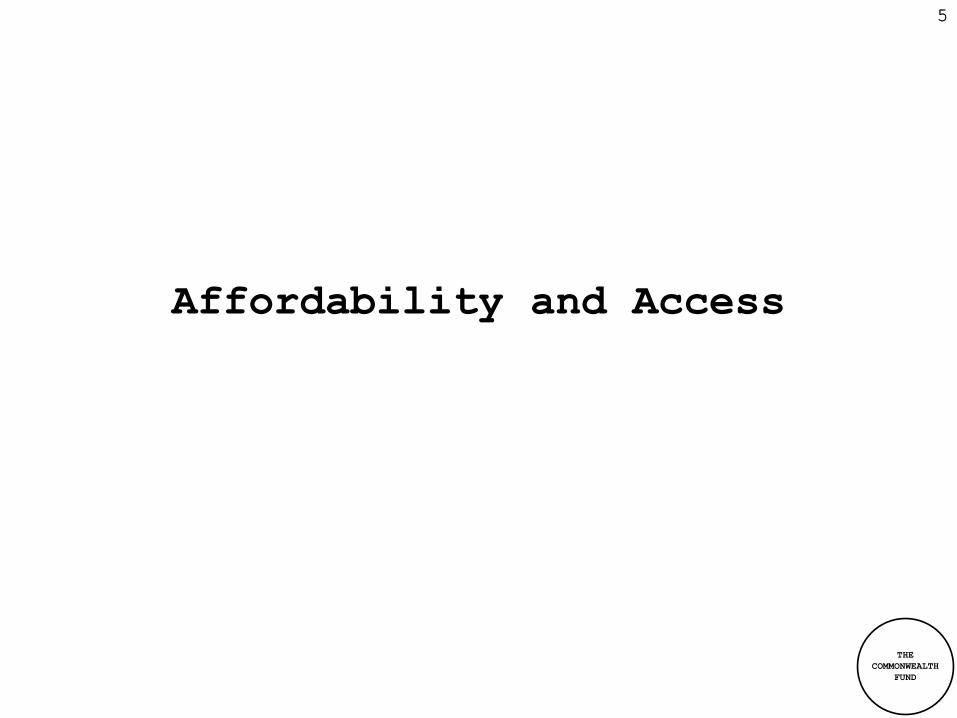
8
79 79 75 75
70
63 59 59 59
51 50
0
25
50
75
100
Access to Doctor or Nurse When Sick or Needed Care
Percent
2 4 5 8 10 12
14 16 22 23 23
Same- or next-day
appointment
Waited six days or more
Source: 2011 Commonwealth Fund International Health Policy Survey of Sicker
Adults in Eleven Countries.

THE
COMMONWEALTH
FUND
9
21 26
34 35 40 40
52 55 55 56
63
0
25
50
75
100
After-Hours Care and Emergency Room Use
Percent
31 32 33 39 40 40
47 48 49 50
58
Difficulty getting after-hours
care without going to the
emergency room
Used emergency room in past two
years
Source: 2011 Commonwealth Fund International Health Policy Survey of Sicker
Adults in Eleven Countries.

THE
COMMONWEALTH
FUND
10 Waited Less Than a Month to See Specialist
92 88
81 80 79
68 67 63
59 52
47
0
20
40
60
80
100
SWIZ US NETH UK GER NZ FR SWE AUS CAN NOR
Percent
Base: Saw or needed to see a specialist in the past two years.
Source: 2011 Commonwealth Fund International Health Policy Survey of Sicker
Adults in Eleven Countries.

THE
COMMONWEALTH
FUND
11 11
Care Coordination and Care
Transitions

THE
COMMONWEALTH
FUND
12 Coordination Problems in the Past Two Years
Percent AUS CAN FR GER NETH NZ NOR SWE SWIZ UK US
Test results/
records not
available at
appointment
and/or duplicate
tests ordered
19 25 20 16 18 15 22 16 11 13 27
Providers
failed to share
important
information
with each other
12 14 13 23 15 12 19 18 10 7 17
Specialist did
not have
information
about medical
history and/or
regular doctor
not informed
about specialist
care
19 18 37 35 17 12 25 20 9 6 18
Source: 2011 Commonwealth Fund International Health Policy Survey of Sicker
Adults in Eleven Countries.

THE
COMMONWEALTH
FUND
13 Experienced Coordination Gaps in Past Two Years
20 23
30
36 37 39 40 42 43
53 56
0
20
40
60
80
UK SWIZ NZ AUS NETH SWE CAN US NOR FR GER
Percent
* Test results/records not available at time of appointment, doctors ordered test
that had already been done, providers failed to share important information with
each other, specialist did not have information about medical history, and/or
regular doctor not informed about specialist care.
Source: 2011 Commonwealth Fund International Health Policy Survey of Sicker Adults
in Eleven Countries.
THE
COMMONWEALTH
FUND
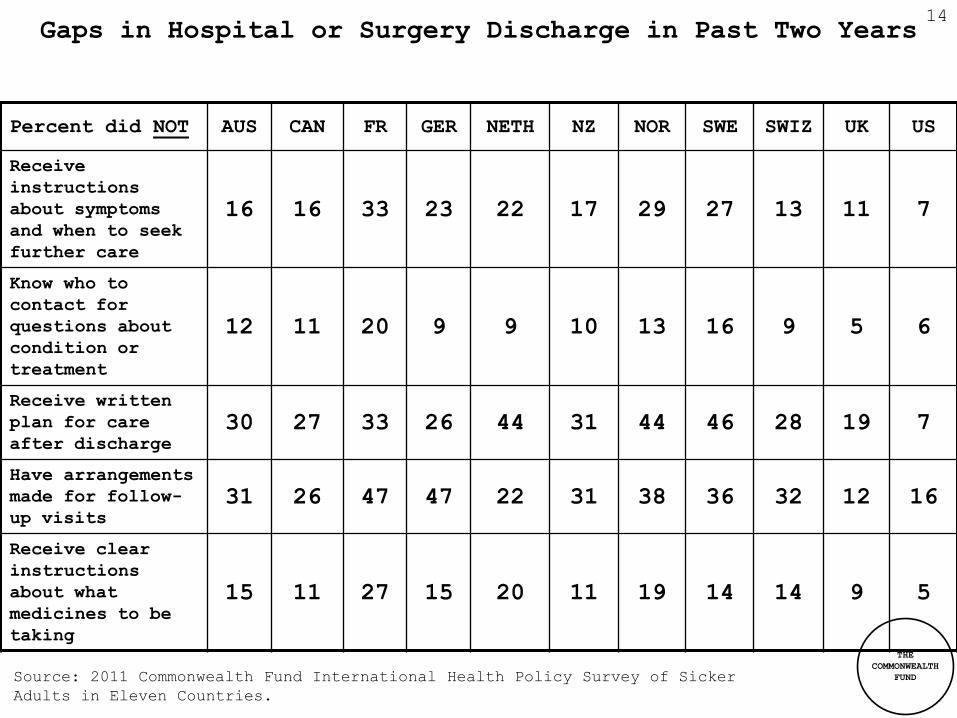
14 Gaps in Hospital or Surgery Discharge in Past Two Years
Percent did NOT AUS CAN FR GER NETH NZ NOR SWE SWIZ UK US
Receive
instructions
about symptoms
and when to seek
further care
16 16 33 23 22 17 29 27 13 11 7
Know who to
contact for
questions about
condition or
treatment
12 11 20 9 9 10 13 16 9 5 6
Receive written
plan for care
after discharge
30 27 33 26 44 31 44 46 28 19 7
Have arrangements
made for follow-
up visits
31 26 47 47 22 31 38 36 32 12 16
Receive clear
instructions
about what
medicines to be
taking
15 11 27 15 20 11 19 14 14 9 5
Source: 2011 Commonwealth Fund International Health Policy Survey of Sicker
Adults in Eleven Countries.

THE
COMMONWEALTH
FUND
15
26 29
48 50 51 55
61 66 67
71 73
0
20
40
60
80
100
UK US SWIZ CAN NZ AUS GER NETH SWE NOR FR
Percent
* Last time hospitalized or had surgery, did NOT: 1) receive instructions about symptoms and
when to seek further care;
2) know who to contact for questions about condition or treatment; 3) receive written plan for
care after discharge;
4) have arrangements made for follow-up visits; and/or 5) receive very clear instructions
about what medicines you should be taking.
Source: 2011 Commonwealth Fund International Health Policy Survey of Sicker Adults in Eleven
Countries.
Any Gaps in Hospital or Surgery Discharge in Past Two
Years

THE
COMMONWEALTH
FUND
16 16
Patient Safety

THE
COMMONWEALTH
FUND
Medical, Medication, or Lab Test Errors in Past Two Years
Percent
reported: AUS CAN FR GER NETH NZ NOR SWE SWIZ UK US
Wrong
medication
or dose
4 5 6 8 6 7 8 5 2 2 8
Medical
mistake in
treatment
10 11 6 8 11 13 17 11 4 4 11
Incorrect
diagnostic/
lab test
results*
4 5 3 2 6 5 4 3 3 2 5
Delays in
abnormal
test results*
7 11 3 5 5 8 10 9 5 4 10
Any medical,
medication, or
lab errors
19 21 13 16 20 22 25 20 9 8 22
17
* Base: Had blood test, x-rays, or other tests in past two years.
Source: 2011 Commonwealth Fund International Health Policy Survey of Sicker
Adults in Eleven Countries.
THE
COMMONWEALTH
FUND
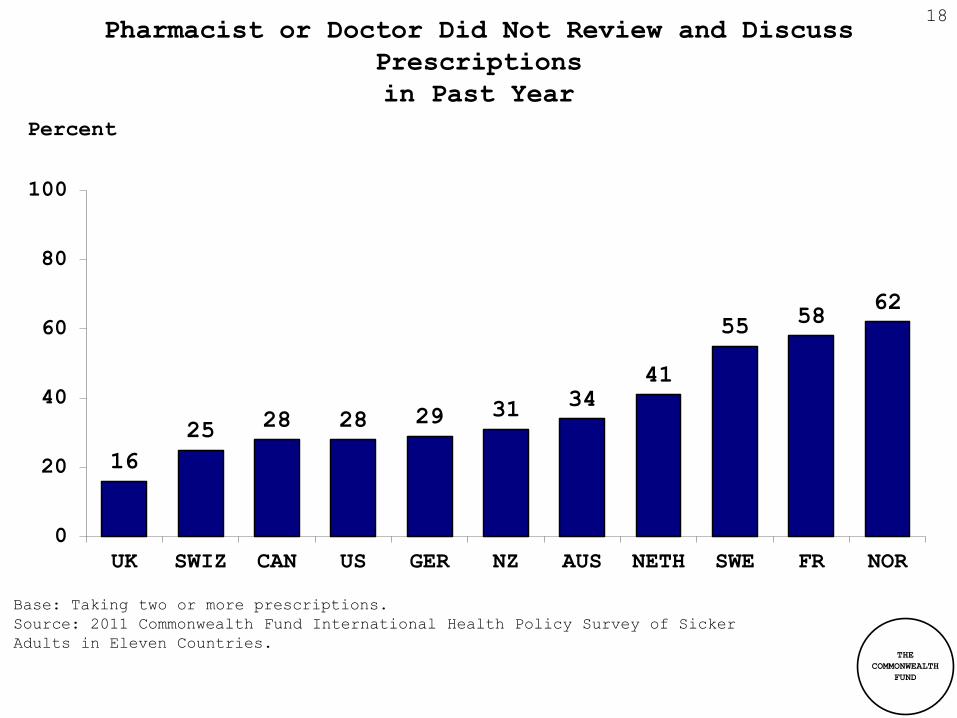
18
16
25 28 28 29 31
34 41
55 58
62
0
20
40
60
80
100
UK SWIZ CAN US GER NZ AUS NETH SWE FR NOR
Percent
Pharmacist or Doctor Did Not Review and Discuss
Prescriptions
in Past Year
Base: Taking two or more prescriptions.
Source: 2011 Commonwealth Fund International Health Policy Survey of Sicker
Adults in Eleven Countries.

THE
COMMONWEALTH
FUND
19 19
Doctor–Patient Relationship and
Patient Activation

THE
COMMONWEALTH
FUND
Doctor–Patient Relationship and Communication
Percent
reported
regular doctor
always/often:
AUS CAN FR GER NETH NZ NOR SWE SWIZ UK US
Spends enough
time with you 85 77 82 86 87 87 71 70 88 87 81
Encourages you
to ask
questions and
explains
things in a
way that is
easy to
understand
69 59 53 64 54 67 31 41 77 77 71
Always/often
to both 66 54 50 61 52 65 27 37 73 72 65
20
Base: Has a regular doctor/place of care.
Source: 2011 Commonwealth Fund International Health Policy Survey of Sicker
Adults in Eleven Countries.

THE
COMMONWEALTH
FUND
Shared Decision-Making with Specialists 21
80 79
72 67 67
64 61
50 48
40 37
0
20
40
60
80
100
SWIZ UK NZ NETH US AUS CAN GER SWE NOR FR
Percent reporting positive shared decision-making experiences
with specialists*
* Reported specialist always/often: 1) Gives opportunities to ask questions about
recommended treatment; 2) Tells you about treatment choices; and 3) Involves you
as much as you want in decisions about your care.
Base: Seen specialist in past two years.
Source: 2011 Commonwealth Fund International Health Policy Survey of Sicker Adults
in Eleven Countries.

THE
COMMONWEALTH
FUND
22 22
Managing Chronic Conditions

THE
COMMONWEALTH
FUND
Patient Engagement in Care Management for Chronic
Condition
Percent
reported
professional in
past year has:
AUS CAN FR GER NETH NZ NOR SWE SWIZ UK US
Discussed your
main goals/
priorities
63 67 42 59 67 62 51 36 81 78 76
Helped make
treatment plan
you could
carry out in
daily life
61 63 53 49 52 58 41 40 74 80 71
Given clear
instructions
on symptoms
and when to
seek care
66 66 56 64 64 63 44 49 84 80 75
Yes to all
three 48 49 30 41 42 45 23 22 67 69 58
23
Base: Has chronic condition.
Source: 2011 Commonwealth Fund International Health Policy Survey of Sicker
Adults in Eleven Countries.
THE
COMMONWEALTH
FUND
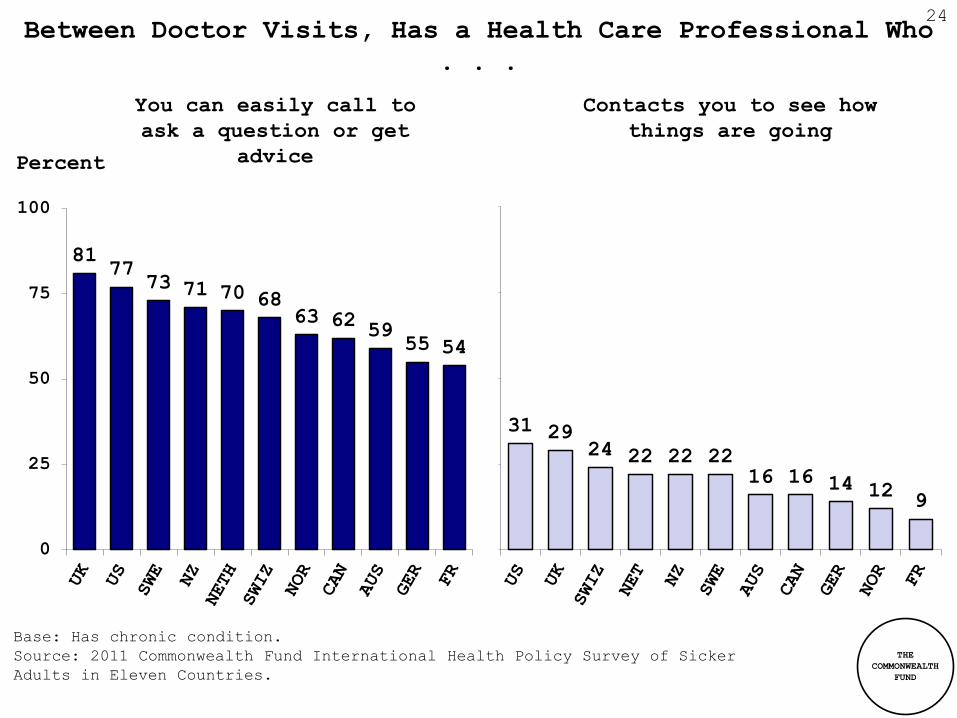
24
81 77
73 71 70 68 63 62
59 55 54
0
25
50
75
100
Between Doctor Visits, Has a Health Care Professional Who
. . .
Percent
31 29 24 22 22 22
16 16 14 12 9
You can easily call to
ask a question or get
advice
Contacts you to see how
things are going
Base: Has chronic condition.
Source: 2011 Commonwealth Fund International Health Policy Survey of Sicker
Adults in Eleven Countries.

THE
COMMONWEALTH
FUND
Blood Pressure Under Control Last Time Checked Has Heart Disease, Hypertension, and/or Diabetes
25
85 85 85 84 84 83 79 78
74 69 69
0
20
40
60
80
100
CAN NOR US NZ SWE FR AUS GER NETH SWIZ UK
Percent yes, under control
Base: Has heart disease, hypertension, and/or diabetes and blood pressure
checked in past year.
Source: 2011 Commonwealth Fund International Health Policy Survey of Sicker
Adults in Eleven Countries.

THE
COMMONWEALTH
FUND
26 26
Medical Homes

THE
COMMONWEALTH
FUND
Medical Homes
Percent AUS CAN FR GER NETH NZ NOR SWE SWIZ UK US
Has a regular
doctor or
place of care
. . .
97 96 99 97 100 99 99 95 99 99 91
. . . who is
accessible . .
.
79 70 91 85 89 91 80 83 89 90 80
. . . knows
you . . . 84 80 88 91 79 89 76 66 96 94 84
. . . and
helps
coordinate
your care
66 71 60 56 59 72 67 42 80 83 71
Has a medical
home* 51 49 52 48 48 65 53 33 70 74 56
27
* 1) Has a regular doctor/place; 2) able to get appointment same/next day last time
sick and/or regular place of care always/often calls back the same day to answer
question; 3) someone at regular place of care always/often knows important information
about medical history; and 4) regular practice always/often helps coordinate and
arrange care from other doctors/places and/or one person responsible for all care
received for chronic condition.
Source: 2011 Commonwealth Fund International Health Policy Survey of Sicker Adults in
Eleven Countries.

THE
COMMONWEALTH
FUND
Patients with a Regular Doctor versus a Medical Home 28
99 99 99
91
99 99 97 96 97 100 95
74 70
65
56 53 52 51 49 48 48
33
0
20
40
60
80
100
UK SWIZ NZ US NOR FR AUS CAN GER NETH SWE
Has a regular doctor or place
of care Percent
Patients with a medical home have a regular practice who is
accessible, knows them, and helps coordinate their care
Source: 2011 Commonwealth Fund International Health Policy Survey of Sicker
Adults in Eleven Countries.

THE
COMMONWEALTH
FUND
29
79
70
59
72
65
76
36
55
82 79 80
52
38 40
50
40 45
18
28
51 54
41
0
20
40
60
80
100
AUS CAN FR GER NETH NZ NOR SWE SWIZ UK US
Medical home No medical home
Percent reporting positive
doctor–patient relationship and
communication*
Doctor–Patient Relationship and Communication, by Medical
Home
* Regular doctor always/often: spends enough time with you, encourages you to ask
questions, and explains things in a way that is easy to understand.
Base: Has a regular doctor/place of care.
Source: 2011 Commonwealth Fund International Health Policy Survey of Sicker Adults in
Eleven Countries.

THE
COMMONWEALTH
FUND
31 30
49 53
32
25
36 32
20 15
33
41
49
57 59
42 41
51
42
30 33
54
0
20
40
60
80
100
AUS CAN FR GER NETH NZ NOR SWE SWIZ UK US
Medical home No medical home
30 Experienced Coordination Gaps in Past Two Years, by
Medical Home
Percent
*
* Test results/records not available at time of appointment, doctors ordered test
that had already been done, providers failed to share important information with each
other, specialist did not have information about medical history, and/or regular
doctor not informed about specialist care.
Source: 2011 Commonwealth Fund International Health Policy Survey of Sicker Adults in
Eleven Countries.

THE
COMMONWEALTH
FUND
31 Hospital or Surgery Discharge Gap in Past Two Years, by
Medical Home
49 43
66 60 59
42
64 59
41
17 19
63 57
82
63
74 68
78
70 67
53
46
0
20
40
60
80
100
AUS CAN FR GER NETH NZ NOR SWE SWIZ UK US
Medical home No medical home
Percent
*
* Last time hospitalized or had surgery, did NOT: 1) receive instructions about
symptoms and when to seek further care; 2) know who to contact for questions about
condition or treatment; 3) receive written plan for care after discharge; 4) have
arrangements made for follow-up visits; and/or 5) receive very clear instructions
about what medicines you should be taking.
Source: 2011 Commonwealth Fund International Health Policy Survey of Sicker Adults in
Eleven Countries.

THE
COMMONWEALTH
FUND
32 Medical, Medication, or Lab Test Errors in Past Two Years,
by Medical Home
15 15
10
15 16
19
22
16
6 6
17
23
27
15
18
23
29 29
22
15 14
29
0
10
20
30
40
AUS CAN FR GER NETH NZ NOR SWE SWIZ UK US
Medical home No medical home
Percent
*
* Reported medical mistake, medication error, and/or lab test error or delay in
past two years.
Source: 2011 Commonwealth Fund International Health Policy Survey of Sicker Adults
in Eleven Countries.
THE
COMMONWEALTH
FUND
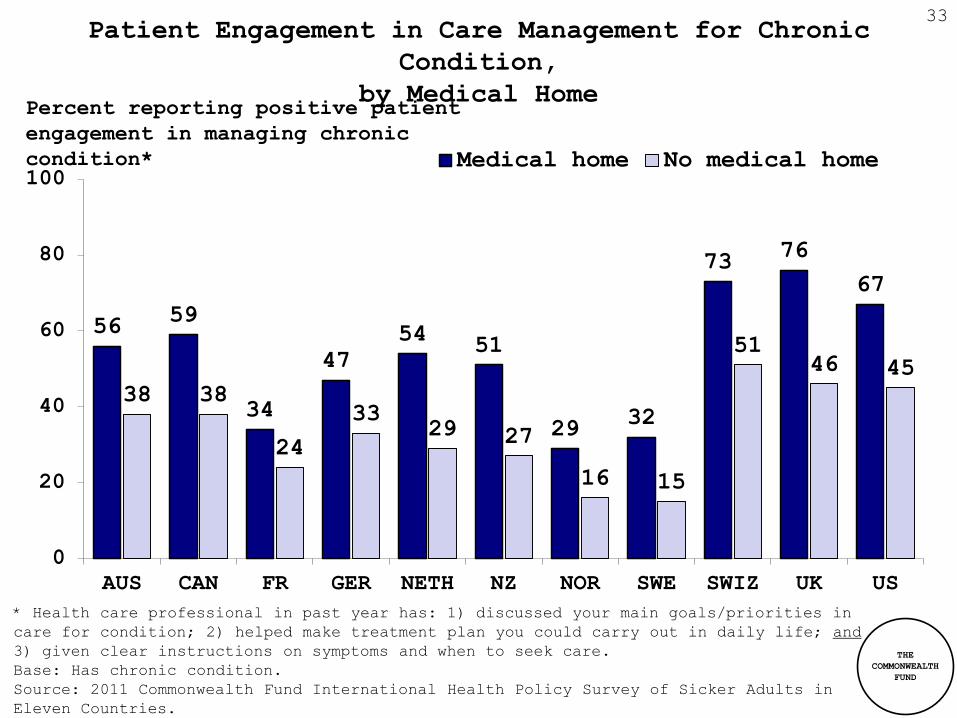
Patient Engagement in Care Management for Chronic
Condition,
by Medical Home
33
56 59
34
47
54 51
29 32
73 76
67
38 38
24
33 29 27
16 15
51 46 45
0
20
40
60
80
100
AUS CAN FR GER NETH NZ NOR SWE SWIZ UK US
Medical home No medical home
* Health care professional in past year has: 1) discussed your main goals/priorities in
care for condition; 2) helped make treatment plan you could carry out in daily life; and
3) given clear instructions on symptoms and when to seek care.
Base: Has chronic condition.
Source: 2011 Commonwealth Fund International Health Policy Survey of Sicker Adults in
Eleven Countries.
Percent reporting positive patient
engagement in managing chronic
condition*
THE
COMMONWEALTH
FUND
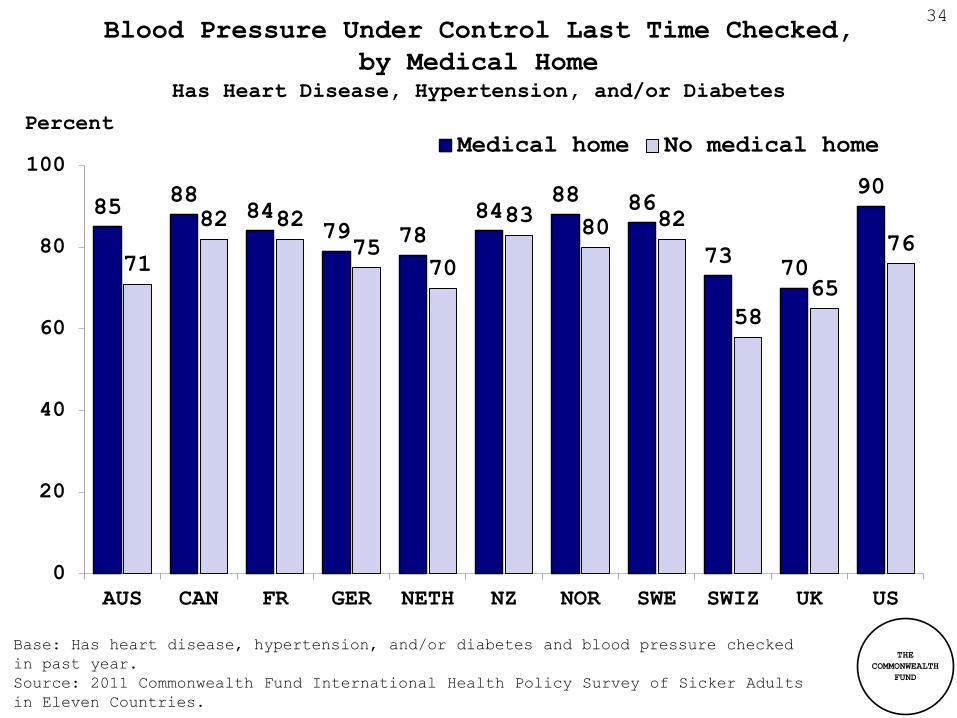
Blood Pressure Under Control Last Time Checked,
by Medical Home Has Heart Disease, Hypertension, and/or Diabetes
34
85 88
84 79 78
84 88 86
73 70
90
71
82 82
75 70
83 80 82
58
65
76
0
20
40
60
80
100
AUS CAN FR GER NETH NZ NOR SWE SWIZ UK US
Medical home No medical home
Base: Has heart disease, hypertension, and/or diabetes and blood pressure checked
in past year.
Source: 2011 Commonwealth Fund International Health Policy Survey of Sicker Adults
in Eleven Countries.
Percent
THE
COMMONWEALTH
FUND
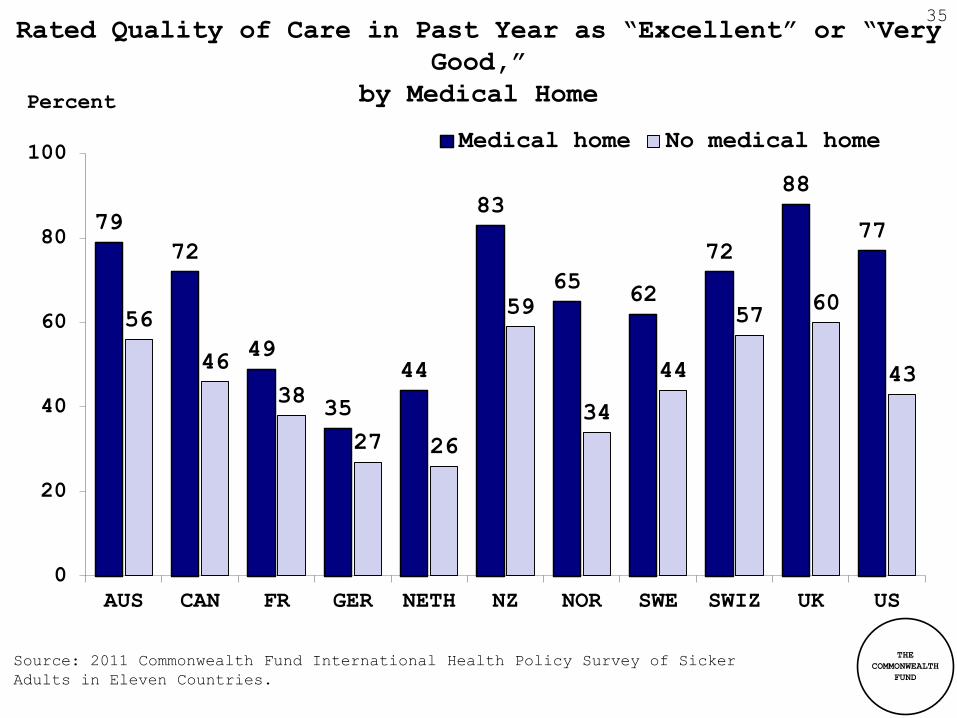
35 Rated Quality of Care in Past Year as “Excellent” or “Very
Good,”
by Medical Home
79
72
49
35
44
83
65 62
72
88
77
56
46
38
27 26
59
34
44
57 60
43
0
20
40
60
80
100
AUS CAN FR GER NETH NZ NOR SWE SWIZ UK US
Medical home No medical home
Percent
Source: 2011 Commonwealth Fund International Health Policy Survey of Sicker
Adults in Eleven Countries.

THE
COMMONWEALTH
FUND
36 36
U.S. Sicker Adults,
by Age and Insurance Status

THE
COMMONWEALTH
FUND
19
6
27
33
72
38
25
40
43
57
76
57
41
52
35
0 25 50 75 100
Access problems
because of costs
Serious problems
paying or unable
to pay medical
bills
Out-of-pocket
spending: more
than $1,000
Experienced
coordination gap
Has a medical
home
Age 65+
Under 65: insured all
year
Affordability, Access, and Coordination Experiences in the
Past Year, by Age and Insurance Among U.S. Adults
37
Percent Source: 2011 Commonwealth Fund International Health Policy Survey of Sicker Adults
in Eleven Countries.

THE
COMMONWEALTH
FUND
38 Cross-Cutting Themes and Implications
• Room for improvement in all countries
– Improving care coordination and system integration
– Engaging patients in care and self-management
• No single health system model stands out
– U.K. and Switzerland often lead but have very
different systems
• U.S. is an outlier on access and affordability
– Cost-sharing and benefit design matters
• Strong primary care “medical homes” make a difference in
all countries

THE
COMMONWEALTH
FUND
39 39 Acknowledgments and Cofunders
• Australia: Bureau of Health Information
• Canada: Health Council of Canada, Ontario Quality Council, Quebec
Health Commission, Health Quality Council of Alberta
• France: Haute Authorité de Santé (HAS), Caisse Nationale de
l’Assurance Maladie des Travailleurs Salariés (CNAMTS)
• Germany: German National Institute for Quality Measurement in
Health Care
• Netherlands: Dutch Ministry of Health, Welfare and Sport, and
Scientific Institute for Quality of Healthcare, Radboud University
Nijmegen
• Norway: Norwegian Knowledge Centre for the Health Services
• Sweden: Swedish Ministry of Health and Social Affairs
• Switzerland: Federal Office of Public Health
• United Kingdom: Health Foundation
Thanks to coauthors David Squires, Michelle M. Doty, Roz Pierson, and
Sandra Applebaum, and to Harris Interactive, Inc., and contractors for
conducting the survey. Published in Health Affairs as: “New 2011 Survey
of Patients with Complex Care Needs in Eleven Countries Finds That Care
Is Often Poorly Coordinated,” Web First, November 9, 2011.