Embed Size (px)
Citation preview

The Business Casefor CUSP
William J. Ward, Jr., MBA
Associate Professor of Health Finance and Management
Associate Professor of NursingDirector, Master of Health Administration Degree
The Johns Hopkins Bloomberg School of Public Health

Your Feedback is Important
https://www.surveymonkey.com/s/Z6FJ28T

Framing the Business Case
• How hospitals operate• Revenue & expense behavior• Connecting the dots• The valid business case• Why CUSP matters – the financial pay-off• Questions and Answers

The Process of Hospital Care The orchestrated application of caregiver
knowledge, skills, and expertise; technologies; supplies and medications
A process as opposed to a single intervention or a series of isolated events

The Process of Hospital Care The orchestrated application of caregiver
knowledge, skills, and expertise; technologies; supplies and medications
A process as opposed to a single intervention or a series of isolated events
A System
A System


How Hospitals are Paid
• Fee For Service (FFS)– Payments for individual services rendered– Per lab test, patient day– Less work equals less revenue
• DRG or Case Based– Payment for a case regardless of work performed – Less work equals more profit

How Hospitals are PaidHospital Charges Case 1 Case 2 Case 3
Room & Board $ 4,500 $ 5,000 $ 5,500
Laboratory
500
600
700
Diagnostic Imaging
400
500
600
Medications
800
1,000
1,200
Other Charges
800
900
1,000
Total Billed $ 7,000 $ 8,000 $ 9,000
DRG Payment $ 8,000 $ 8,000 $ 8,000
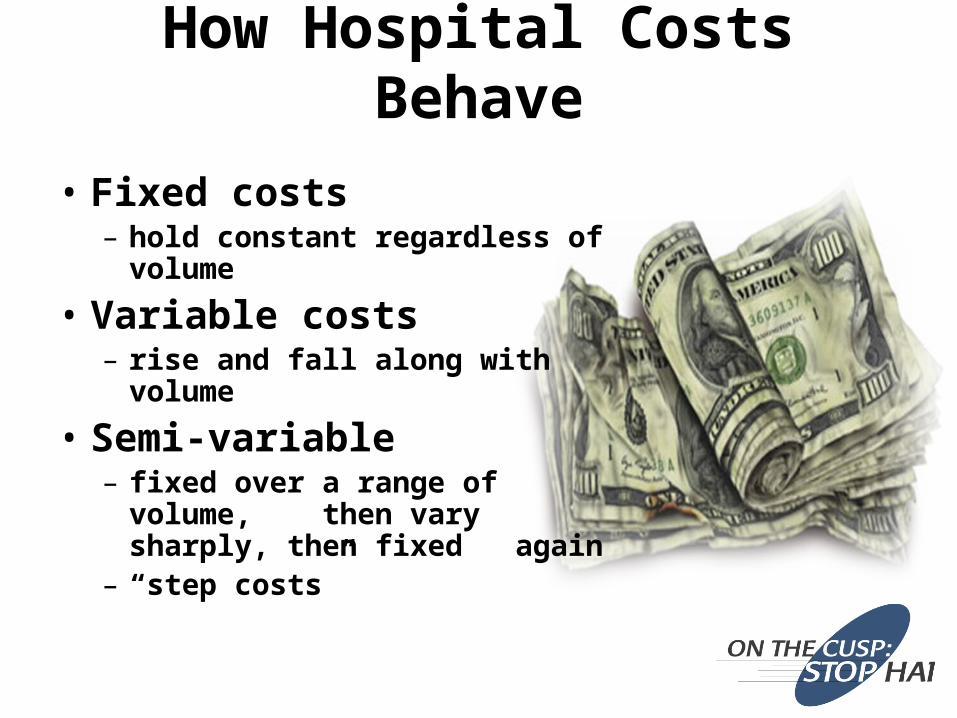
How Hospital Costs Behave
• Fixed costs– hold constant regardless of volume
• Variable costs– rise and fall along with volume
• Semi-variable– fixed over a range of volume,
then vary sharply, then fixed again
– “step costs”

Profile of Fixed & Variable CostsProfile of Fixed & Variable Costs
Expense CategoryExpense Category
Percent of Percent of Total CostTotal Cost
Fixed Fixed ProportionProportion
Variable Variable ProportionProportion
Salary & BenefitsSalary & Benefits 65%65% 60%60% 5%5%
Supplies & ServicesSupplies & Services 15%15% 10%10% 5%5%
InterestInterest 10%10% 10%10% 0%0%
DepreciationDepreciation 10%10% 10%10% 0%0%
TotalTotal 100%100% 90%90% 10%10%

How Hospital Costs Behave
• Fixed costs– hold constant regardless of volume
• Variable costs– rise and fall along with volume
• Semi-variable– fixed over a range of volume,
then vary sharply, then fixed again
– “step costs”
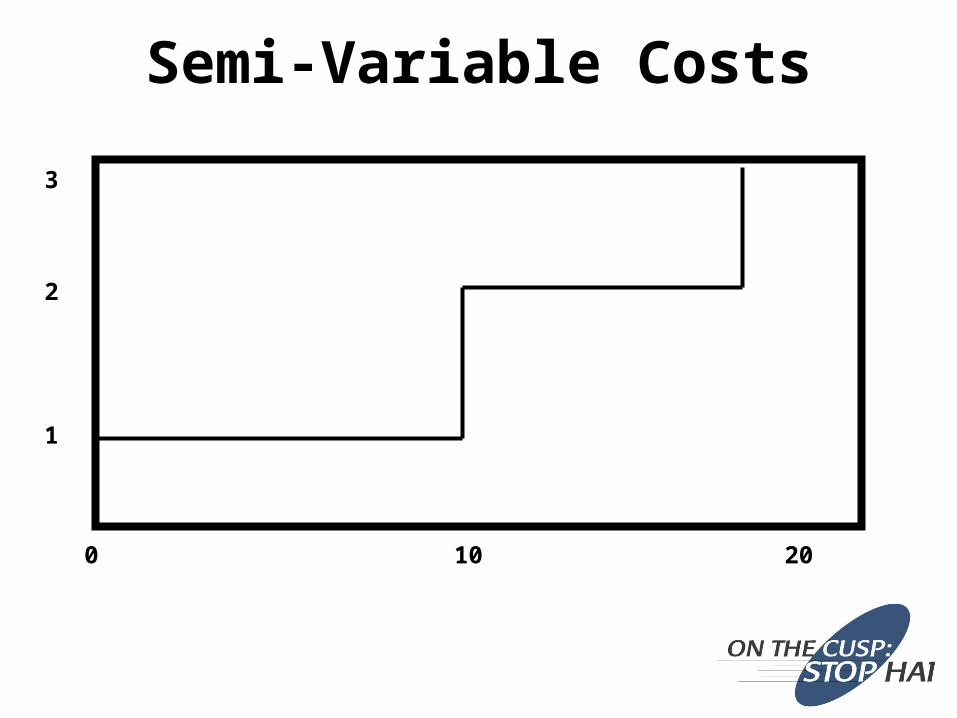
Semi-Variable Costs
0 10
1
20
2
3

Semi-Variable Costs and Revenue
0 10
1
20
2
3

Semi-Variable Costs and Revenue
Profit
Loss

ImprovedProfits
ControlledCosts
IncreasedRevenue
Increased BedTurnover
ReducedALOS
ReducedInfections
Static BedCount
IncreasedAdmits
??
????
??
??
??
????
??
??
??
??
??
??
????
??
Connecting the Dots(from fewer infections to more profit)

ImprovedProfits
ControlledCosts
IncreasedRevenue
Increased BedTurnover
ReducedALOS
ReducedInfections
Static BedCount
IncreasedAdmits
Connecting the Dots(from fewer infections to more profit)

ImprovedProfits
ControlledCosts
IncreasedRevenue
Increased BedTurnover
ReducedALOS
ReducedInfections
Static BedCount
IncreasedAdmits
Connecting the Dots(from fewer infections to more profit)

ImprovedProfits
ControlledCosts
IncreasedRevenue
Increased BedTurnover
ReducedALOS
ReducedInfections
Static BedCount
IncreasedAdmits
Connecting the Dots(from fewer infections to more profit)

ImprovedProfits
ControlledCosts
IncreasedRevenue
Increased BedTurnover
ReducedALOS
ReducedInfections
Static BedCount
IncreasedAdmits
Connecting the Dots(from fewer infections to more profit)

ImprovedProfits
ControlledCosts
IncreasedRevenue
Increased BedTurnover
ReducedALOS
ReducedInfections
Static BedCount
IncreasedAdmits
Connecting the Dots(from fewer infections to more profit)

An ounce of prevention is worth a pound of cure.”
Benjamin Franklin

Importance of Infection Control
DISCHARGE
ADMISSION
Infections
Nursing CareNursing CareNursing CareNursing Care
Ancillary ServicesAncillary ServicesAncillary ServicesAncillary Services
Support ServicesSupport Services Support ServicesSupport Services
Other FactorsOther FactorsOther FactorsOther Factors

• Improvements in quality and patient safety can yield . . .– Cost efficiency– Real cost reduction– Revenue enhancement– Balance sheet improvements– Intangible improvements
Connecting the Dots(from fewer infections to more profits)

Improved HAI rate yieldsImproved HAI rate yields■ Increased capacityIncreased capacity■ Increased work output Increased work output ■ No change in total costNo change in total cost
Same cost ÷ increased work outputSame cost ÷ increased work output= Reduced Cost per Unit of Work= Reduced Cost per Unit of Work
Cost Efficiency ModelCost Efficiency Model

Improved HAI rate yieldsImproved HAI rate yields■ Increased capacityIncreased capacity■ No change in work output No change in work output ■ Reduction in staffing levelsReduction in staffing levels
Workload Reduction ÷ Original WorkloadWorkload Reduction ÷ Original Workload= Potential Percentage Staff Reduction= Potential Percentage Staff Reduction
Real Cost ReductionReal Cost Reduction

Improved HAI rate yieldsImproved HAI rate yields Increased patient throughputIncreased patient throughput Reduced OR case cancellationsReduced OR case cancellations Increased surgical casesIncreased surgical cases Reduced ER divert hoursReduced ER divert hours Increased ER visits and admissionsIncreased ER visits and admissions Increased follow-up visits and proceduresIncreased follow-up visits and procedures Increased revenue and increased cashIncreased revenue and increased cash
Hospital ThroughputHospital Throughput
• Improvements in HAI rate leads to improved throughput– Maximized brick & mortar investments– Additional funds available for
capital purchases– Reduced need for cash or
borrowing to increase capacity
Balance Sheet Improvement

Reduced malpractice claimsHigher satisfaction scores
patient, family & staff Better reputationBetter market position
Intangible Hospital Benefits

Getting Down to Cases # 1
• 66 years old• Medicare patient• Grandmother of 2• Diabetic, hypertensive,
obese, nonsmoker• Elective admission for
CABG

Getting Down to Cases # 1
• 66 years old• Medicare patient• Grandmother of 2• Diabetic, hypertensive,
obese, nonsmoker• Elective admission for
CABG Day 5 – fever of 103o
Day 9 – 15 vent dependent Day 22 – transferred to LTAC
OoopsOoops

Revenue ImpactDay 1Day 1 Day 22Day 22
Case # 1 – DRG payment $12,689
Case # 1 – $12,689Case # 1 – $12,689
Case # 2 – $12,689Case # 2 – $12,689
Case # 3 – $12,689Case # 3 – $12,689
One case w/complicationsOne case w/complicationsVersus three cases w/o complicationsVersus three cases w/o complicationsRevenue of Revenue of $ 12,689 $ 12,689 versus Revenue of versus Revenue of $ 38,067$ 38,067
One case w/complicationsOne case w/complicationsVersus three cases w/o complicationsVersus three cases w/o complicationsRevenue of Revenue of $ 12,689 $ 12,689 versus Revenue of versus Revenue of $ 38,067$ 38,067


Source: NEJM Archive / NEJM.org / December 15, 2011 / Copyright © 2010 NEJM

April 2010
“… they are disappointed when the reduction in the number of HAIs does not yield the anticipated cost savings.”
“… and, so, seek the opportunity cost …”

The Real CUSP Payoff
Values shown are strictly for purposes of illustration and are not meant to approximate real results
Average Length of Stay - CLABSI Cases (days) 28.8 A
Average Length of Stay - All Cases (days) 4.8 B
Reduction in ALOS (days) (1) 24.0 C
Potential Incremental Case Throughput 5.0 D = C / B
Average Net Revenue per Case (2) $7,078.00 E
Potential Incremental Net Revenue Opportunity per Avoided CLABSI $35,390 F = D x E
Potential Annual Avoided CLABSI Cases 100 G
Potential Annual Incremental Profit Opportunity $3,539,000 H = F x G
Sources:1. CDC2. HFMA (William O. Cleverley and James O. Cleverley)

Your Feedback is Important
https://www.surveymonkey.com/s/Z6FJ28T

Questions and Answers