Embed Size (px)
Citation preview
THE BUSINESS CASE FOR A CORPORATE WELLNESS PROGRAM:
A CASE STUDY OF GENERAL MOTORS
AND THE UNITED AUTO WORKERS UNION
Elizabeth A. McGlynn
Associate Director, RAND Health
Timothy McDonald
Manager, Corporate Health Promotion, General Motors Corporation
Laura Champagne
Assistant Director, Social Security Department
United Automobile, Aerospace and Agricultural Implement Workers of America
Bruce Bradley
Director, Health Plan Strategy and Public Policy
Health Care Initiatives, General Motors Corporation
Wesley Walker
Resident in Internal Medicine, University of California at Los Angeles
FIELD REPORT
April 2003
Support for this research was provided by The Commonwealth Fund. The views
presented here are those of the authors and should not be attributed to The Commonwealth
Fund or its directors, officers, or staff.
This report (#612) is available online only from The Commonwealth Fund’s website at
www.cmwf.org.
iii
CONTENTS
List of Figures and Tables................................................................................................ iv
About the Authors ........................................................................................................... v
Acknowledgments .......................................................................................................... vi
Executive Summary....................................................................................................... vii
Background .....................................................................................................................1
Program Design...............................................................................................................2
Program Savings and Costs ............................................................................................ 10
Potential Causes of Success or Failure ............................................................................ 15
Knowledge Gaps and Study Limitations ......................................................................... 16
Health Impact of LifeSteps ............................................................................................. 17
Economic Impact .......................................................................................................... 19
Policy Recommendations .............................................................................................. 21
References..................................................................................................................... 30
Appendix Exhibit A Health Risk Appraisal: Wellness Score of “92”
Appendix Exhibit B Health Risk Appraisal: Wellness Score of “59”
Appendix Exhibit C LifeSteps Quarterly Newsletter
iv
LIST OF FIGURES AND TABLES
Figure 1 GM’s Key Health Care Initiatives, Quality and Cost Drivers ..........................2
Figure 2 General Motors Age Distribution ...................................................................8
Figure 3 The Medical Cost Gap: Why Purchasers Care About Health Care Costs ...... 11
Table 1 Content of the LifeSteps Health Risk Appraisal ............................................ 23
Table 2 Comparison of Health Plan Benefits for GM Salaried Employees
Under Traditional and PPO Coverage ................................................... 24
Table 3 Participation Rates in LifeSteps Program Components by Year..................... 25
Table 4 Proportion of Participants in the Low-Risk Group Overall
and by Group and Location .................................................................... 26
Table 5 Change in the Proportion of Persons in Low-Risk Status
Among Those with at Least Two Health Risk Appraisals ........................ 26
Table 6 Current Wellness Scores Among Health Risk Appraisal Participants
Overall and in Pilot and Non-Pilot Sites by Group ................................. 27
Table 7 Change in the Wellness Score Among Those with at Least Two
Health Risk Appraisals ............................................................................ 27
Table 8 Risk Profiles Among Health Risk Appraisal Participants at GM .................... 28
Table 9 Annual Medical Costs for GM by Age, Risk Level, and Health Risk
Appraisal Participation ............................................................................ 29
Table 10 Estimate of the Link Between Improved Health and the Costs of
Medical Care for 1,000 Active Employees .............................................. 29
v
ABOUT THE AUTHORS
Elizabeth A. McGlynn, Ph.D., is the associate director of RAND Health and the
director of the Center for Research on the Quality of Health Care at RAND Health. Dr.
McGlynn is a nationally known expert on measuring the quality of clinical care. She has
published extensively on the topic and serves on the editorial boards for Health Services
Research and The Milbank Memorial Fund Quarterly. She serves on advisory committees for
the National Committee for Quality Assurance, the National Quality Forum, and the
National Board of Medical Examiners.
Timothy McDonald, MHSA, joined General Motors in 1986 and in 1996 became
manager of Corporate Health Programs and Quality Assurance as part of GM’s Health
Care Initiatives staff. McDonald is responsible for managing GM’s executive health
program, salaried disease management program, salaried employee assistance program, and
LifeSteps, GM’s health and wellness program. He works closely with the International
Union, UAW, and other unions to facilitate communications related to joint
involvement. In addition, McDonald is responsible for linking LifeSteps with numerous
other corporate initiatives such as safe driving, fitness centers, and disability management.
Recently McDonald co-led the implementation team for a worksite diabetes disease
management pilot program at three GM plant locations. Before joining General Motors,
McDonald worked as a physician’s assistant for 10 years then received his master’s in
health services administration from the University of Michigan. He also completed a post-
graduate fellowship in hospital administration.
Laura Champagne, an attorney, is the assistant director with the Social Security
Department of the International Union, UAW, providing technical assistance in
negotiating health and pension benefits and in public policy issues related to health. Prior
to joining the UAW, in September 1985, Ms. Champagne served as a staff director for the
Economic Alliance for Michigan, a coalition of Michigan union leaders and corporate
executives. She has also held a number of other positions in the health field, including a
six-year stint on Governor Milliken’s staff as the director of the State Nutrition
Commission. She has been involved in lobbying at state and national levels for health
issues for almost 30 years. She also provides consulting services and serves on the boards of
a number of community organizations, and is a member of UAW Local 1981.

vi
ACKNOWLEDGMENTS
The authors would like to thank Dee Edington at the University of Michigan's Health
Management Research Center for providing qualitative and quantitative information
about the LifeSteps program.
vii
EXECUTIVE SUMMARY
During the 1990s, the General Motors Corporation (GM) wanted to hold down
rising health care costs by improving the health status of its workers and their dependents,
and the United Auto Workers (UAW) made the development of a comprehensive
preventive health program one of its bargaining demands. Working together, GM and
UAW launched a corporate wellness program in April 1996—LifeSteps.
There is some evidence that the LifeSteps program has succeeded in slowing the
rate of increase in health care costs. Our study found that LifeSteps interventions may save
$42,355 per 1,000 active employees, or roughly $42 a person—sizable savings for a self-
insured company responsible for the health care costs of 1.25 million employees,
dependents, and retirees. About two-thirds of the people GM insures have indemnity or
preferred provider organization coverage, and it is this group that presents the greatest
opportunity for GM to control health care expenditures.
Background
LifeSteps grew in part out of GM’s concern over rising medical costs. While GM’s
worldwide production costs have fallen, health care costs have risen sharply, cutting into
profitability. In 1994, GM projected a 25-percent increase in medical expenditures over
10 years based on the demographics of its employed population, without adjusting for
inflation.
LifeSteps is operated in conjunction with the United Auto Workers Union. The
UAW-GM Joint Training Fund finances one-third of the program costs. A substantial
portion of active employees are UAW members, and the union has been supportive of the
program because it is aimed at improving health, rather than simply reducing health care
costs.
Program Design
LifeSteps consists of a basic program that operates nationwide, as well as an intensive
version available in two communities (Flint, Michigan, and Anderson, Indiana).
The basic program consists of several components: quarterly newsletters on health
education topics, targeted mailings on select topics, and toll-free, 24-hour telephone access
to nurses for health advice. The most important aspect is the Health Risk Appraisal
(HRA). This multi-item questionnaire assigns participants a wellness score based on their
responses. The HRA also groups people according to their likelihood of developing
viii
diseases, based on factors such as a sedentary lifestyle, number of days sick, being
overweight, smoking, drinking excessively, having high blood pressure or cholesterol
levels, or being under stress.
Offered at GM production plants in Flint, Michigan, and Anderson, Indiana, the
intensive version of LifeSteps includes on-site measurement of such data as weight, blood
pressure, and cholesterol. High-risk employees—those showing three or more risk
factors—are encouraged to enroll in counseling for behavioral change. High-risk
individuals also are eligible for vouchers that pay for the cost of two visits to the doctor.
Traditional fee-for-service insurance does not cover routine office visits, and these
vouchers are meant to minimize cost as a barrier to seeking either preventative or follow-
up care. However, only 29 percent of the vouchers distributed are used.
Successful corporate wellness programs like LifeSteps have several factors in
common. Retired people prefer to participate in interventions at home, through printed
material or telephone calls. Active employees are most receptive to programs at their
worksite. Intensive intervention seems to be more effective than more basic interventions
for promoting behavioral change.
Health Benefits
LifeSteps delivered a measurable impact on both risk status and wellness scores. Since its
inception, the program has attracted 43 percent of households and 34 percent of
individuals. Among all active employees and retirees under age 65, the number of people
considered low risk has increased. Among people who participated in three or more
LifeSteps components, 13 percent migrated to low risk from a higher-risk category.
Potential Savings and Costs
An important administrative component of LifeSteps is measurement and evaluation of the
program itself. Both GM and the vendors that deliver intervention services receive
quarterly reports on the program’s performance, based on analyses conducted by an
independent group at the University of Michigan. Program costs, including the delivery of
services, administration, and program evaluation, were not revealed by GM.
In general, tracking the financial success of corporate wellness programs is
challenging; benefits most often take the form of costs avoided rather than actual savings.
GM’s major return on investment came from a reduction in the rate of increase in medical
costs for individuals with non-Medicare indemnity and PPO coverage. For this group, the
company estimates it saves $226 per risk factor ($171 in health services costs, the rest in
ix
drug costs). GM also estimates that its average plant can save nearly $350,000 annually in
absenteeism costs through active participation in the intensive-level program.
Policy Recommendations
GM’s investment in wellness can return potential long-term savings in health care costs.
Each year a worker remains with GM past the break-even point of the wellness program,
the greater the opportunity to reap savings or avoid risings costs. This is a significant
finding for other self-insured employers—particularly those with a large fee-for-service
population. However, this many be limited to those employers whose workforce has a
long tenure with the company. Moreover, labor unions should include wellness programs
in their future collective bargaining negotiations.
1
THE BUSINESS CASE FOR A CORPORATE WELLNESS PROGRAM:
A CASE STUDY OF GENERAL MOTORS
AND THE UNITED AUTO WORKERS UNION
BACKGROUND
During the 1980s and early 1990s, the United Auto Workers (UAW) made the
development of a comprehensive preventive health program one of its bargaining
demands. Efforts to meet the contractual obligations led to numerous programs focused on
single preventive measures, including blood pressure screening, smoking cessation,
cholesterol screening, and HIV/AIDS awareness. In 1994, General Motors (GM) created
the Health Care Initiatives (HCI) Group as its administrative section responsible for,
among other things, developing proactive programs to address the health needs of the GM
population. The director of HCI, Jim Cubbin, examined the patterns of utilization among
GM employees and projected a 25-percent increase in medical expenditures over 10 years
based strictly on the demographics of the employed population (that is, he did not include
potential increases in prices and advances in technology).* Cubbin proposed to GM
management that a program be created to improve the health status of the population. In
this manner, the interests of GM and the UAW converged, and the two parties together
created a corporate wellness program—LifeSteps.
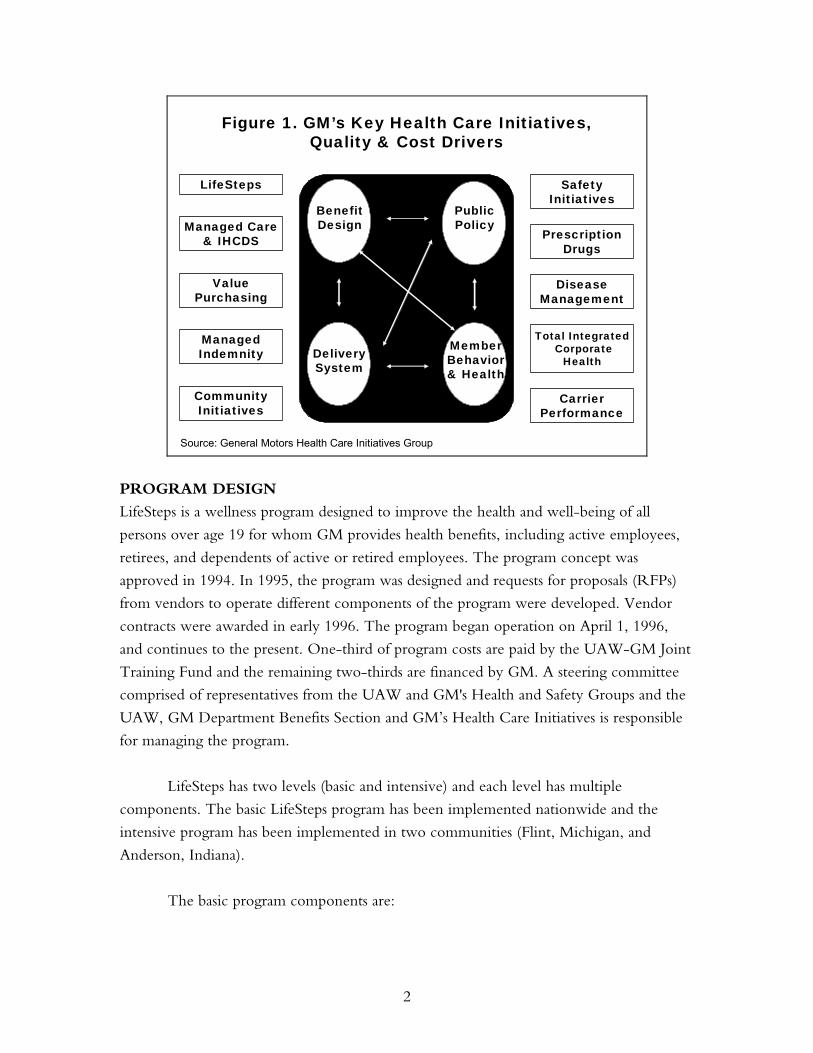
HCI uses a conceptual framework to assess the drivers of cost and quality within
the organization: benefit design, public policy, delivery systems, and member behavior and
health (Figure 1). The corporate wellness intervention was designed to address the drivers
related to modifiable aspects of member health-related behaviors and health. But the
intervention operates within the context of the other drivers, all of which interact with
each other. Other programs within the purview of HCI are designed to address or
influence the other three drivers of cost and quality.
* See Figure 2 for an example of the type of diagram used to make this point.
2
Figure 1. GM’s Key Health Care Initiatives,Quality & Cost Drivers
BenefitDesign
DeliverySystem
MemberBehavior& Health
PublicPolicy
LifeSteps
DiseaseManagement
ValuePurchasing
Managed Care& IHCDS
Community Initiatives
ManagedIndemnity
CarrierPerformance
PrescriptionDrugs
Total IntegratedCorporate
Health
Safety Initiatives
Source: General Motors Health Care Initiatives Group
PROGRAM DESIGN
LifeSteps is a wellness program designed to improve the health and well-being of all
persons over age 19 for whom GM provides health benefits, including active employees,
retirees, and dependents of active or retired employees. The program concept was
approved in 1994. In 1995, the program was designed and requests for proposals (RFPs)
from vendors to operate different components of the program were developed. Vendor
contracts were awarded in early 1996. The program began operation on April 1, 1996,
and continues to the present. One-third of program costs are paid by the UAW-GM Joint
Training Fund and the remaining two-thirds are financed by GM. A steering committee
comprised of representatives from the UAW and GM's Health and Safety Groups and the
UAW, GM Department Benefits Section and GM’s Health Care Initiatives is responsible
for managing the program.
LifeSteps has two levels (basic and intensive) and each level has multiple
components. The basic LifeSteps program has been implemented nationwide and the
intensive program has been implemented in two communities (Flint, Michigan, and
Anderson, Indiana).
The basic program components are:
3
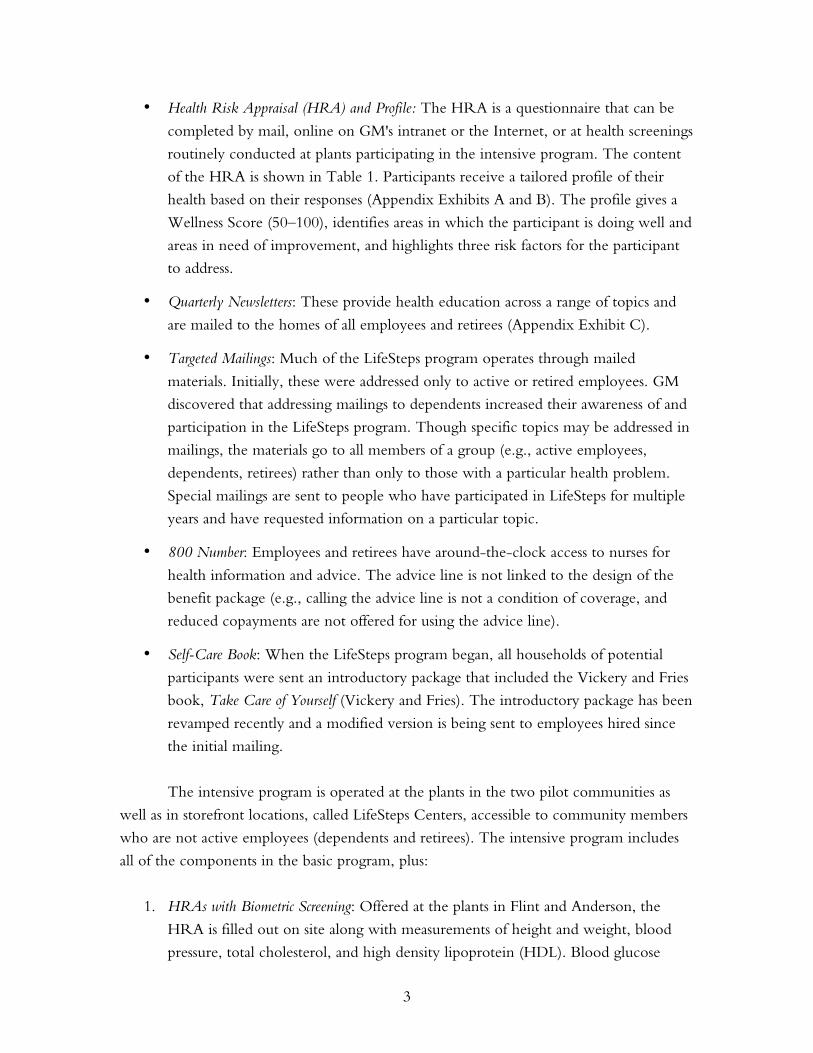
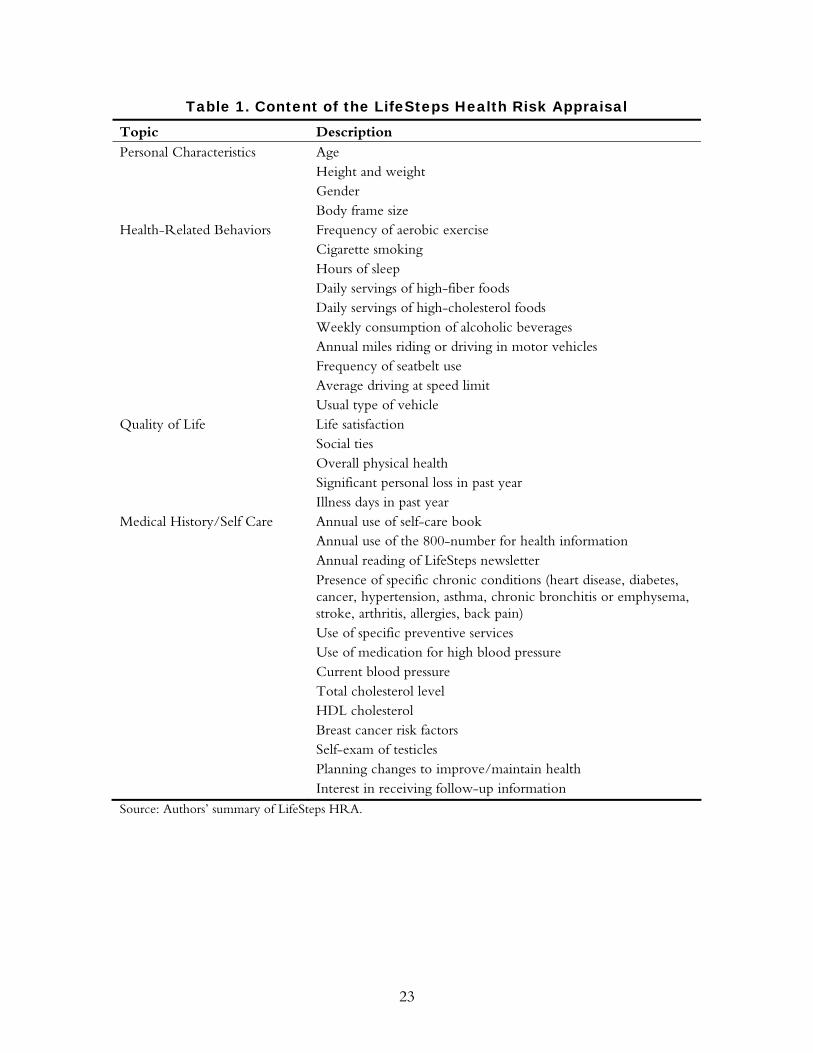
• Health Risk Appraisal (HRA) and Profile: The HRA is a questionnaire that can be
completed by mail, online on GM's intranet or the Internet, or at health screenings
routinely conducted at plants participating in the intensive program. The content
of the HRA is shown in Table 1. Participants receive a tailored profile of their
health based on their responses (Appendix Exhibits A and B). The profile gives a
Wellness Score (50–100), identifies areas in which the participant is doing well and
areas in need of improvement, and highlights three risk factors for the participant
to address.
• Quarterly Newsletters: These provide health education across a range of topics and
are mailed to the homes of all employees and retirees (Appendix Exhibit C).
• Targeted Mailings: Much of the LifeSteps program operates through mailed
materials. Initially, these were addressed only to active or retired employees. GM
discovered that addressing mailings to dependents increased their awareness of and
participation in the LifeSteps program. Though specific topics may be addressed in
mailings, the materials go to all members of a group (e.g., active employees,
dependents, retirees) rather than only to those with a particular health problem.
Special mailings are sent to people who have participated in LifeSteps for multiple
years and have requested information on a particular topic.
• 800 Number: Employees and retirees have around-the-clock access to nurses for
health information and advice. The advice line is not linked to the design of the
benefit package (e.g., calling the advice line is not a condition of coverage, and
reduced copayments are not offered for using the advice line).
• Self-Care Book: When the LifeSteps program began, all households of potential
participants were sent an introductory package that included the Vickery and Fries
book, Take Care of Yourself (Vickery and Fries). The introductory package has been
revamped recently and a modified version is being sent to employees hired since
the initial mailing.
The intensive program is operated at the plants in the two pilot communities as
well as in storefront locations, called LifeSteps Centers, accessible to community members
who are not active employees (dependents and retirees). The intensive program includes
all of the components in the basic program, plus:
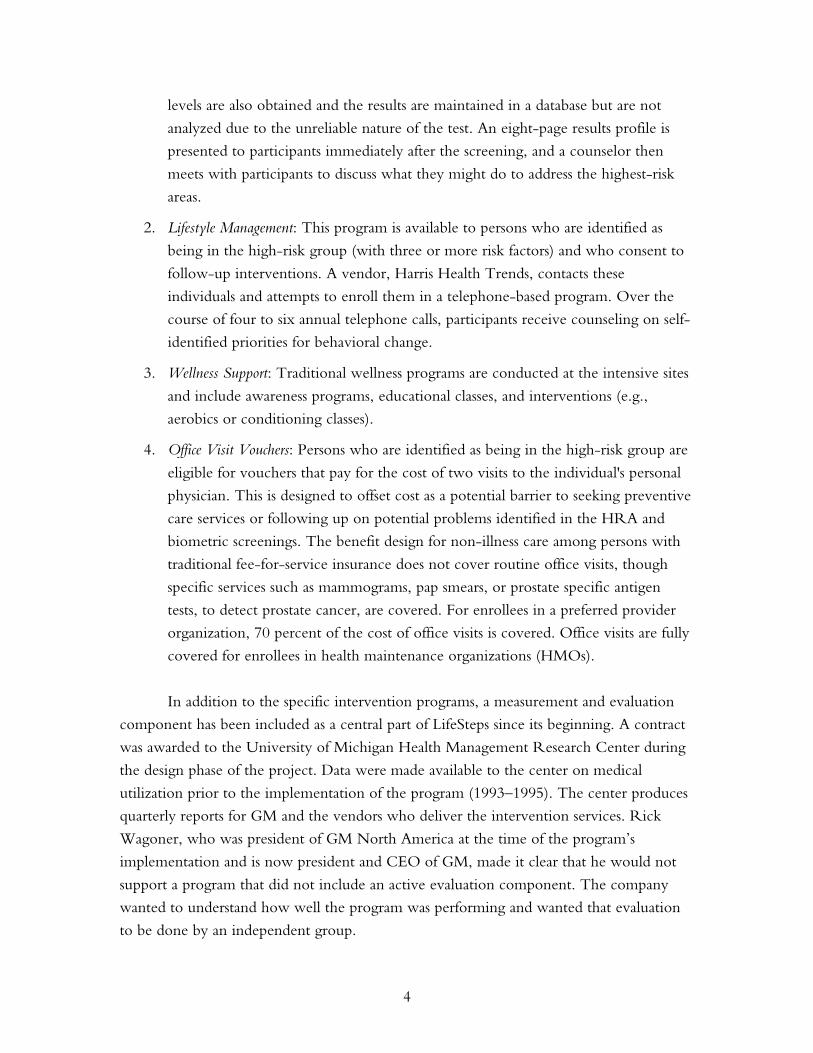
1. HRAs with Biometric Screening: Offered at the plants in Flint and Anderson, the
HRA is filled out on site along with measurements of height and weight, blood
pressure, total cholesterol, and high density lipoprotein (HDL). Blood glucose
4
levels are also obtained and the results are maintained in a database but are not
analyzed due to the unreliable nature of the test. An eight-page results profile is
presented to participants immediately after the screening, and a counselor then
meets with participants to discuss what they might do to address the highest-risk
areas.
2. Lifestyle Management: This program is available to persons who are identified as
being in the high-risk group (with three or more risk factors) and who consent to
follow-up interventions. A vendor, Harris Health Trends, contacts these
individuals and attempts to enroll them in a telephone-based program. Over the
course of four to six annual telephone calls, participants receive counseling on self-
identified priorities for behavioral change.
3. Wellness Support: Traditional wellness programs are conducted at the intensive sites
and include awareness programs, educational classes, and interventions (e.g.,
aerobics or conditioning classes).
4. Office Visit Vouchers: Persons who are identified as being in the high-risk group are
eligible for vouchers that pay for the cost of two visits to the individual's personal
physician. This is designed to offset cost as a potential barrier to seeking preventive
care services or following up on potential problems identified in the HRA and
biometric screenings. The benefit design for non-illness care among persons with
traditional fee-for-service insurance does not cover routine office visits, though
specific services such as mammograms, pap smears, or prostate specific antigen
tests, to detect prostate cancer, are covered. For enrollees in a preferred provider
organization, 70 percent of the cost of office visits is covered. Office visits are fully
covered for enrollees in health maintenance organizations (HMOs).
In addition to the specific intervention programs, a measurement and evaluation
component has been included as a central part of LifeSteps since its beginning. A contract
was awarded to the University of Michigan Health Management Research Center during
the design phase of the project. Data were made available to the center on medical
utilization prior to the implementation of the program (1993–1995). The center produces
quarterly reports for GM and the vendors who deliver the intervention services. Rick
Wagoner, who was president of GM North America at the time of the program’s
implementation and is now president and CEO of GM, made it clear that he would not
support a program that did not include an active evaluation component. The company
wanted to understand how well the program was performing and wanted that evaluation
to be done by an independent group.
5
Scientific Evidence
During the last 20 years, a body of literature devoted to the investigation of worksite
health promotion programs has developed (Pelletier, 2001). These programs have evolved
from a central idea—that lifestyle choices profoundly affect health and health care costs. As
such, interventions that modify lifestyle, or more specifically behavior, in positive ways are
likely to have beneficial effects on clinical and financial outcomes. Health promotion
programs employ several tools to facilitate healthy lifestyles among program participants.
These include broad health education and awareness programs, health risk appraisals,
targeted educational materials, and customized interpersonal counseling (Heaney and
Goetzel, 1997). Each of these tools is focused on either maintaining healthy behaviors or
encouraging those who engage in unhealthy behaviors to adopt healthier ones (Yen,
Edington, et al., 1994).
This case study summarizes the scientific evidence in support of worksite health
promotion efforts and some of the methods such programs use to achieve their ends. We
examine the characteristics of the health risk appraisal, the association between certain risks
and cost outcomes, and whether health promotion programs can modify behavior and
thereby decrease risk and cost. We also compare GM’s basic and intensive LifeSteps
programs by analyzing the evidence from the literature of the relative strengths and
weaknesses of the programs’ components. Finally, we discuss some of the conclusions
drawn from comprehensive reviews of the health promotion program literature.
Health Risk Appraisal
Both the basic and intensive LifeSteps programs rely on a health risk appraisal (HRA),
which is a centerpiece of many comprehensive health promotion programs (Anderson and
Staufacker, 1996). The HRA provides guidance for targeting interventions while also
functioning as a measurement and evaluation tool. The HRA gained widespread use and
acceptance after it was introduced into the public domain by the Centers for Disease
Control and Prevention in 1980. It consists of three components: a questionnaire, a risk
projection calculation, and an educational report. The HRA is used to stratify individuals
according to their likelihood of developing disease and predicted future health care costs
(Smith, McKinlay, et al., 1987; Yen, Edington, et al., 1994). This information is then fed
back to individuals, along with suggestions regarding risk modification. Both the reliability
and validity of the HRA have been established (Anderson and Staufacker, 1996). While
some see the HRA as simply a measurement tool, others speculated that completing the
HRA itself produced a positive impact on health outcomes, i.e., risk improvement. A
review of the scientific literature concluded that the evidence does not strongly support
this view (Anderson and Staufacker, 1996).
6
The risks that the HRA assesses can be divided into four groups: behavioral,
biometric, attitudinal, and descriptive. Behavioral risks include low physical activity, being
overweight, smoking tobacco, excessive alcohol consumption, and not using seatbelts.
Longitudinal studies have established that these risks are associated with poor health
outcomes (U.S. Preventive Services Task Force, 1996). Further, with the exception of not
using seatbelts, these behaviors have all been associated with higher health care costs based
on employer insurance claims (Yen, Edington, et al., 1994; Goetzel, Anderson, et al.,
1998; Aldana, 2001; Yen, Edington, et al., 1991). It has also been established that
education and counseling programs are effective in increasing physical activity levels and
encouraging smoking cessation, limited alcohol consumption, and the use of seat belts
(Heaney and Goetzel, 1997; Wilson and Holman, 1996). The effectiveness of
interventions aimed at weight loss, however, has not been established.
Biometric risks assessed include high blood pressure, high cholesterol, and low
HDL. Again, these physiologic parameters have well-documented adverse influences on
morbidity and mortality (U.S. Preventive Services Task Force, 1996). In terms of financial
outcomes, hypertension has been associated with higher costs, while there is less evidence
implicating high total cholesterol and low HDL (Goetzel, Anderson, et al., 1998; Aldana,
2001). (“Financial outcomes” in this discussion refers only to those costs captured by
employer-based health insurance claims.) Several health promotion programs have proven
effective in reducing high blood pressure and high total cholesterol (Wilson, Holman, et
al., 1996).
The attitudinal risks assessed include self-reported high stress, self-reported low life
satisfaction, and self-reported fair or poor physical health. One study has documented the
increased costs associated with stress, and another has reported the ability of health
promotion programs to decrease stress (Anderson, Whitmer, et al., 2000; Ozminkowki,
Dunn, et al., 1999).
Descriptive risks in the HRA include existing medical problems and greater than
five work absences per year. Studies have shown that the existence of chronic medical
conditions confers higher risk for adverse health and financial outcomes, and that
absenteeism tends to predict higher health care costs and increased health risk (Yen,
Edington, et al., 1994). Several studies have clearly shown that comprehensive health
promotion programs often lead to decreased rates of absenteeism (Yen, Edington, et al.,
1991).
7
Basic and Intensive Program Strategies
How effective are the different types of strategies employed in the basic and intensive
LifeSteps programs? According to the literature, programs that disseminate educational
messages to large populations via awareness programs may be less expensive, but they are
likely not as effective as customized messages at engendering behavioral change (Pelletier,
2001). Approaches that incorporate individual counseling and periodic support related to
individually identified risks are likely to be more successful (Heaney and Goetzel, 1997).
Unfortunately, there is currently no literature that directly addresses the effect of the
addition of biometric screening to the HRA, a step that was added by GM. Programs that
use tiered interventions of increasing intensity for high-risk individuals appear to be most
successful at decreasing risks among those individuals (Pelletier, 1997). The LifeSteps
intensive program uses such an approach.
Worksite health promotion programs have evolved over the last two decades, and
numerous comprehensive reviews have evaluated specific components of these programs.
However, it is also useful to understand if the reviews point to any basic principles that
appear common to successful programs. Heaney and Goetzel provide us with valuable
guidelines for implementing future health promotion programs:
• Multi-component programs appear to be more effective because they allow
employees to choose which program components they want to use, and thereby
customize the program to their individual needs.
• Programs must usually be of a minimum duration, roughly one year, to achieve
results.
• Programs that continually reinforce messages, provide support, and have an
ongoing maintenance component have more durable outcomes.
• Better outcomes are associated with senior management buy-in and with work
environments where employee health is seen as a priority for the corporation.
The design of the LifeSteps program is consistent with these principles, which
leads us to expect (1) positive outcomes from the intervention and (2) greater effects in the
more intensive program.
Populations Potentially Affected by LifeSteps
General Motors is responsible for 1.25 million covered lives nationally. Active employees
constitute 16 percent of the population, retirees constitute 33 percent, and dependents
over age 19 constitute the remaining 51 percent. The age distribution of the population is
8
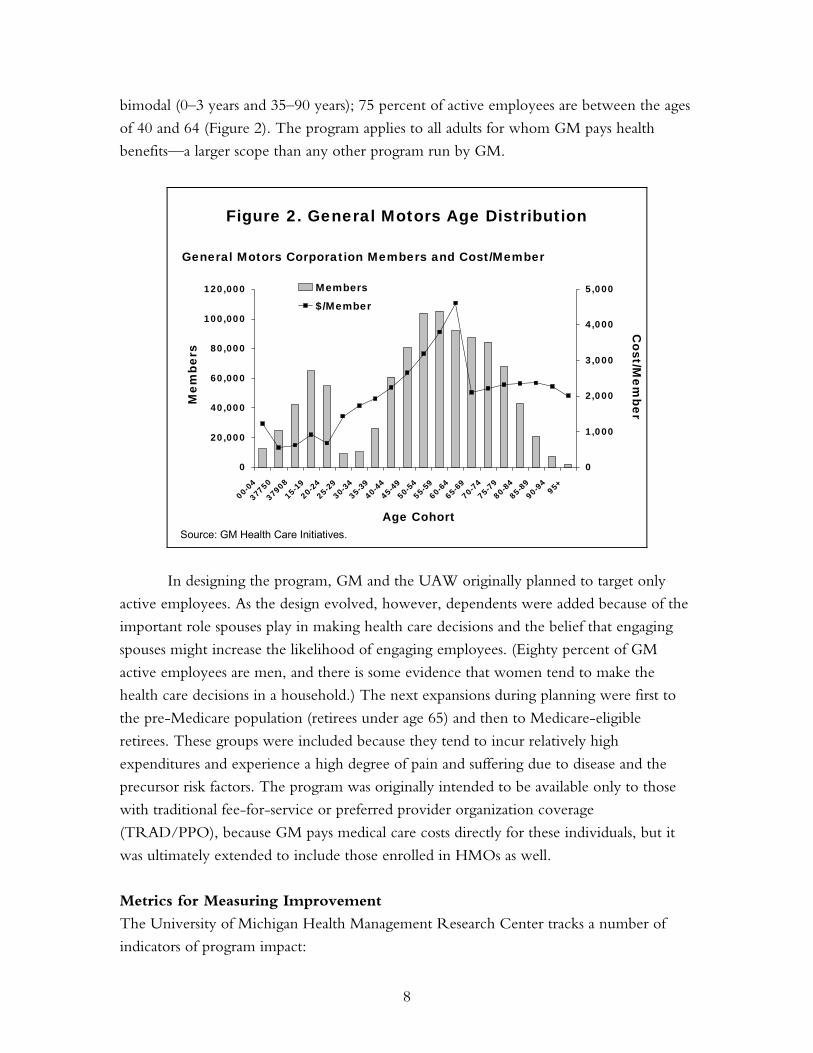
bimodal (0–3 years and 35–90 years); 75 percent of active employees are between the ages
of 40 and 64 (Figure 2). The program applies to all adults for whom GM pays health
benefits—a larger scope than any other program run by GM.
0
20,000
40,000
60,000
80,000
100,000
120,000
00-0
4
37750
3790
815
-1920
-2425
-2930
-3435
-3940
-4445
-4950
-5455
-5960
-6465
-6970
-7475
-7980
-8485
-8990
-94
95+
0
1,000
2,000
3,000
4,000
5,000Members
$/Member
Figure 2. General Motors Age DistributionM
embe
rsC
ost/Mem
ber
Age Cohort
General Motors Corporation Members and Cost/Member
Source: GM Health Care Initiatives.
In designing the program, GM and the UAW originally planned to target only
active employees. As the design evolved, however, dependents were added because of the
important role spouses play in making health care decisions and the belief that engaging
spouses might increase the likelihood of engaging employees. (Eighty percent of GM
active employees are men, and there is some evidence that women tend to make the
health care decisions in a household.) The next expansions during planning were first to
the pre-Medicare population (retirees under age 65) and then to Medicare-eligible
retirees. These groups were included because they tend to incur relatively high
expenditures and experience a high degree of pain and suffering due to disease and the
precursor risk factors. The program was originally intended to be available only to those
with traditional fee-for-service or preferred provider organization coverage
(TRAD/PPO), because GM pays medical care costs directly for these individuals, but it
was ultimately extended to include those enrolled in HMOs as well.
Metrics for Measuring Improvement
The University of Michigan Health Management Research Center tracks a number of
indicators of program impact:
9
• Participation: Rates of participation by eligible individuals and households are
tracked by component. The intensity of participation is also tracked (number of
program components in which an individual participates). Participation rates are an
indicator of how many people the program is reaching and intensity is a good
predictor of the likelihood that low-risk maintenance or changes in risk status will
occur. Annual as well as cumulative participation rates are tracked.
• Risk Status: The metric used is the proportion of the population that is at low risk
(defined as zero to two risk factors). Disease management programs tend to focus
only on managing or improving the health of those at highest risk (defined as five
or more risk factors). However, University of Michigan researchers have found
that it is also critical to keep those who are at low risk from migrating to higher-
risk status (Edington). In the absence of programs designed to maintain people in
low-risk status, an upward risk migration has been observed. The Health
Management Research Center has labeled this “the natural flow of risk,” which is
particularly important among those ages 35 to 55. This is because studies show that
people add risk factors during those years.
• Wellness Score: The wellness score is intended to capture overall health status in a
single number. This is calculated from the Health Risk Appraisal and has three
components: the number of health risks, an interaction function related to the
appraised age calculations from the Centers for Disease Control and Prevention
and the Carter Center, and a function related to the use of preventive services.
The wellness score has a range from 50 to 100, a mean of 80, and a standard
deviation of 10. Higher wellness scores are associated with lower health care costs
and changes in wellness scores are associated with changes in health care costs.
• Change in Risk Status Classification: This refers to the change in risk status over
time. A positive program outcome occurs when people either maintain their risk
status (especially if that status is low) or when their risk status improves. Ideally,
one would like to compare these changes over time to what would have happened
in the absence of the program, but the risk status classification requires an HRA to
be completed and that constitutes a part of the intervention. Absent a true control
group, one might compare the experience of those in the intensive versus basic
interventions, although these comparisons will be affected by selection bias.
• Reductions in Overall Health Care Costs and Rates of Increase: The total costs and rates
of increase in costs among those in each age/risk group as well as non-participants
are routinely tracked.
10
• Days Absent From Work: Although not a major focus of the program evaluation,
estimates have been made about whether the program has affected absenteeism.
This metric only applies to active employees (about 20 percent of participants).
• Satisfaction with LifeSteps: Two surveys have been undertaken to assess the target
population’s satisfaction with the program.
All of these metrics are confounded by the problem of selection—those who
choose to participate in the LifeSteps program may be different from those who do not
participate, and there are no observations made of those who do not participate.
PROGRAM SAVINGS AND COSTS
General Motors is the world's largest vehicle manufacturer. GM has manufacturing
operations in more than 30 countries, and about 55 percent of the active workforce is
located in the United States. Within the United States, GM has employees or retirees in
most states, although the company's largest presence is in the Midwest.
The LifeSteps intervention occurs at the corporate level, rather than within a
health care organization or delivery system. Since GM is self-insured, it directly incurs the
costs of health care services, either through direct payments in the case of the traditional
indemnity plan (TRAD) or preferred provider organizations (PPOs), or through
premiums in the case of health maintenance organizations (HMOs). Because the LifeSteps
program is important to the UAW, the cost of the intervention itself is partially financed
by union-negotiated joint funds (in proportion to the number of active union members
and their families who were eligible for the program at its inception).
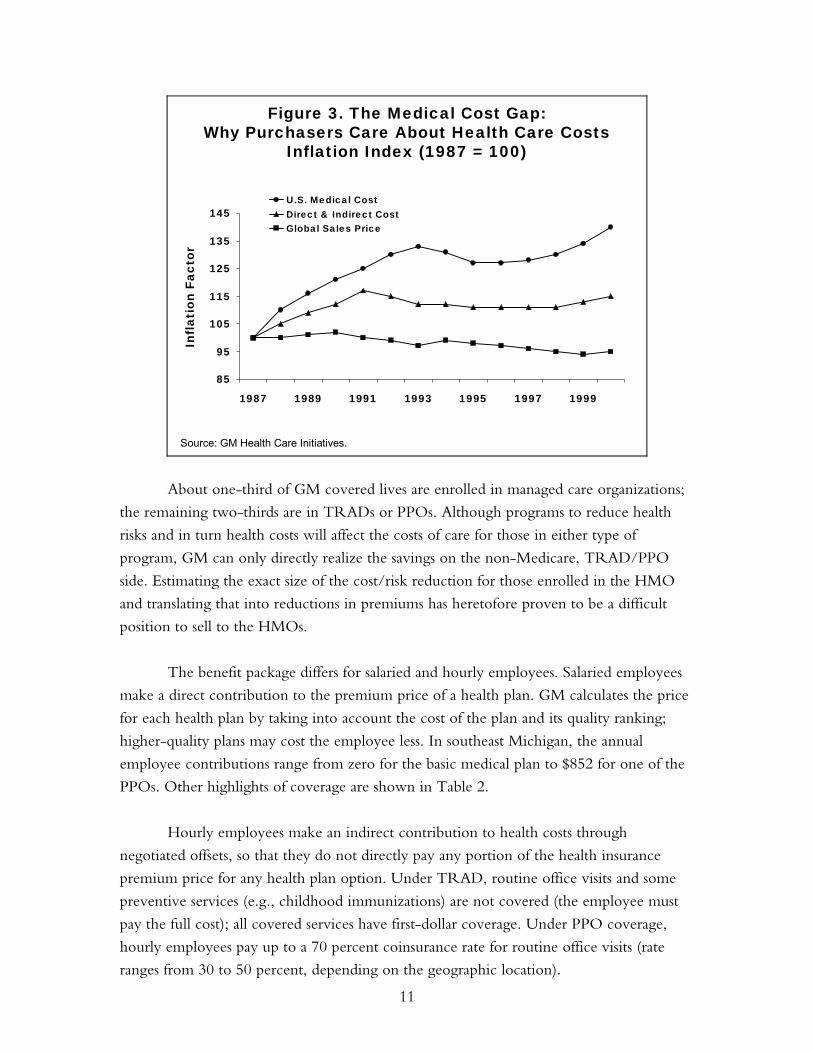
The pressure to reduce medical care costs is considerable within GM because these
are the only component of production costs that are steadily rising (Figure 3). Global sales
prices for vehicles are declining and the costs of all other production components have
been reduced. Rising health care costs thus affect the profitability of the company. This
trend has been observed across a number of large United States–based employers.
11
85
95
105
115
125
135
145
1987 1989 1991 1993 1995 1997 1999
U.S. Medical CostDirect & Indirect CostGlobal Sales Price
Source: GM Health Care Initiatives.
Figure 3. The Medical Cost Gap:Why Purchasers Care About Health Care Costs
Inflation Index (1987 = 100)
Infl
atio
n Fa
ctor
About one-third of GM covered lives are enrolled in managed care organizations;
the remaining two-thirds are in TRADs or PPOs. Although programs to reduce health
risks and in turn health costs will affect the costs of care for those in either type of
program, GM can only directly realize the savings on the non-Medicare, TRAD/PPO
side. Estimating the exact size of the cost/risk reduction for those enrolled in the HMO
and translating that into reductions in premiums has heretofore proven to be a difficult
position to sell to the HMOs.
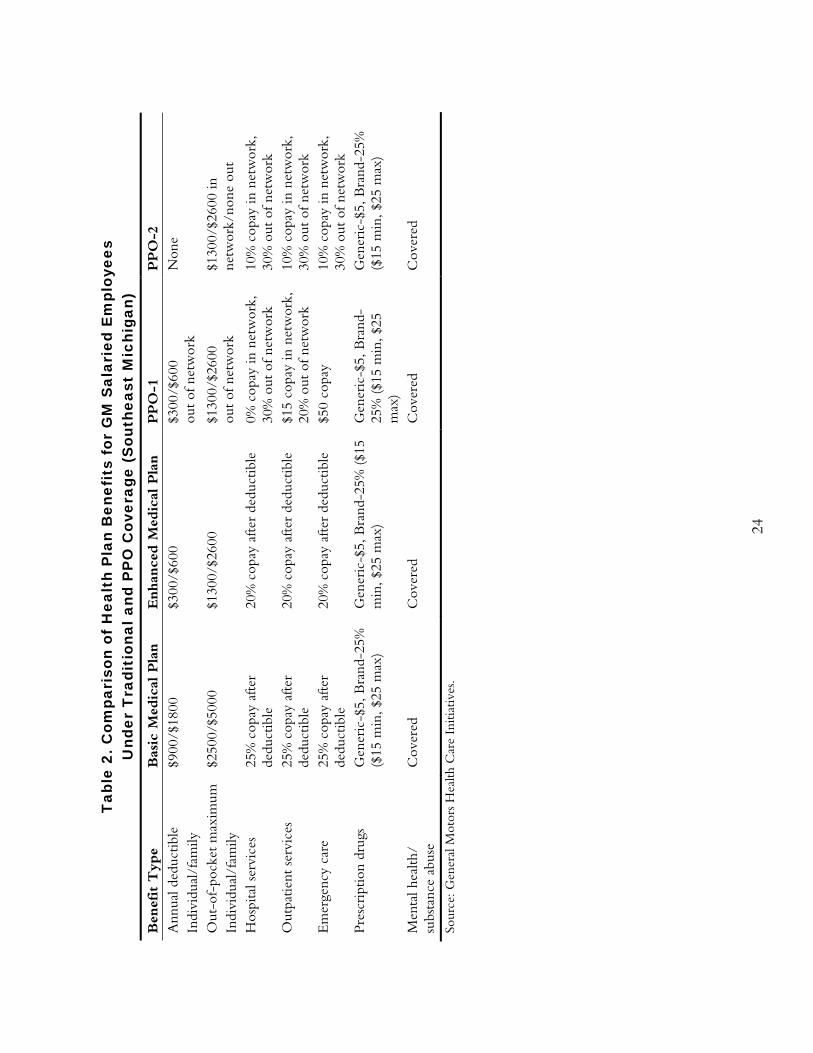
The benefit package differs for salaried and hourly employees. Salaried employees
make a direct contribution to the premium price of a health plan. GM calculates the price
for each health plan by taking into account the cost of the plan and its quality ranking;
higher-quality plans may cost the employee less. In southeast Michigan, the annual
employee contributions range from zero for the basic medical plan to $852 for one of the
PPOs. Other highlights of coverage are shown in Table 2.
Hourly employees make an indirect contribution to health costs through
negotiated offsets, so that they do not directly pay any portion of the health insurance
premium price for any health plan option. Under TRAD, routine office visits and some
preventive services (e.g., childhood immunizations) are not covered (the employee must
pay the full cost); all covered services have first-dollar coverage. Under PPO coverage,
hourly employees pay up to a 70 percent coinsurance rate for routine office visits (rate
ranges from 30 to 50 percent, depending on the geographic location).
12
In the initial design of the LifeSteps intensive intervention, the planning team
examined potential barriers to access for preventive services. In Flint, 70 percent of active
employees are men and most do not have an established relationship with a physician. GM
worked with Blue Cross Blue Shield of Michigan to develop a panel of physicians in the
area willing to take new patients. Another barrier was the lack of coverage for routine
office visits. The voucher program was designed to offset the potential barrier of the cost
of an office visit for those with a high risk (e.g., total cholesterol level of 240 or greater).
The total cost of the LifeSteps program was not made available for this project.
The costs include the direct delivery of services (which are provided by vendors),
administrative costs, and the costs associated with the measurement and evaluation
activities. The University of Michigan Health Management Research Center provides the
measurement and evaluation services; the cost of this activity is about 10 percent of total
program costs.
GM contracts for most of the services included in LifeSteps using four main
vendors: Health Solutions, McKesson-HBOC-Access Health Group, Campbell-Ewald,
and the University of Michigan's Health Management Research Center (UMHMRC).
Health Solutions is responsible for managing the on-site services at the two intensive sites.
Health Solutions is paid a fixed amount annually (about 80 percent of its total contract)
and a variable amount if services exceed certain thresholds; the variable amount is paid on
the basis of additional hours worked. The lifestyle management telephone program is run
by Harris Health Trends through a subcontract arrangement with Health Solutions and
the fixed and variable cost approach is used for that contract as well. The toll-free number
is run by Access Health under a fee-for-service contract. The contract was initially
awarded on a capitated basis but analysis of low rates of utilization led to a change in the
contract terms. The newsletter is produced by Campbell-Ewald, a public relations firm;
the contract provides a fixed amount for each unit of production (e.g., a newsletter). The
contract with the University of Michigan is a combination of fee-for-service (e.g.,
processing the HRAs) and a fixed annual contract for measurement and evaluation
services. The UAW, GM, and University of Michigan Health Management Resource
Center have developed a close working relationship with the vendors, providing feedback
reports that have helped them tailor their services over the course of the program.
The costs of the program are incurred on an annual basis within a relatively fixed
budget. Start-up costs, which were substantial, were amortized over the first three years of
the program; in subsequent years, only the ongoing operational costs of the program are
incurred. The benefits occur over a period of time. Some occur in the year in which
13
expenditures are made and others occur over time. One of the challenges with health
promotion programs is that the benefits are most often in the form of costs avoided, rather
than in cost savings. Because it is difficult to calculate or see costs avoided, estimating the
financial benefits of the program is complex and may be difficult to sell within the
organization. GM has set a high standard for the calculation of return-on-investment
(ROI). The costs of the program are “assigned” to persons who participate in a
component of the LifeSteps program that can be tracked (e.g., completing a health risk
appraisal, attending an in-plant screening, or taking an aerobics class at the plant). Persons
who read the newsletter or look at the website but do not take part in a component that
can be tracked are not counted as participants. Further, only participants who have TRAD
or PPO coverage are included in the ROI calculations because these participants are the
ones for whom GM can directly benefit from reduced expenditures. HMO and Medicare
covered persons are excluded from these calculations. The original estimates from the
University of Michigan were that the program might expect to break even in its seventh
or eighth year. Some efficiencies in program operations have been implemented that may
make the break-even point occur earlier, but it has not yet been reached. The program
has a different ROI calculation for each of the populations (active employees, retirees,
dependents) and for each of the components, but these numbers were not made available
for this case study. The ROI was characterized as most favorable for active employees,
especially those in the intensive sites.
There are a number of non-economic benefits related to successful implementation
of worksite wellness programs. These include improved morale, improved health status,
improved health consumer knowledge, and reduced prevalence of modifiable health risks,
among others. Satisfaction ratings are evidence of the importance of these non-economic
benefits.
The major economic gain to GM for this program is a reduction in the rate of
increase in health care costs incurred by persons in the non-Medicare, TRAD/PPO
coverage groups. There are potential gains to GM in the form of reduced absenteeism.
GM estimates that the average plant could save nearly $350,000 annually in absenteeism
costs through active participation in the LifeSteps intensive program. There are gains to
physicians who treat individuals who might otherwise not have sought care. This is likely
to be greatest in the pilot communities where the voucher program operates, although the
rate of use of vouchers is quite low—about 29 percent of those who receive the vouchers
actually use them. There may be gains to those who provide pharmaceuticals through an
increased number of persons taking medication for such health problems as hypertension
and hypercholesterolemia, though this is a loss to GM in the form of increased health care
14
costs in the short term. There are potential losses to hospitals for health problems avoided
(e.g., heart attacks, cardiac surgeries). There are potential “gains” to GM in the form of
reduced premiums to the HMOs. The HMO premiums are based on experience rating
with a lag—premiums in year 2002 are based on the experience in 2000. Because the GM
population tends to have higher costs than many other HMO enrollees, it is challenging to
link participation in LifeSteps to reduced costs and thus reduced premiums. There may be
initial losses to participants in the program in the form of higher out-of-pocket payments
for physician visits that they might not otherwise have made.
A 1999 survey of participants found that 85 percent wanted the LifeSteps program
to continue and 74 percent indicated that it had improved their opinion of both GM and
the UAW. The program by this time had reached 78 percent of the target audience with
at least one component. Individuals do not have to pay to participate in the program and
no assessments of willingness to pay have been made because of the negotiated use of joint
funds.
Regulatory, Public Financing, and Labor Environment
GM is a self-insured company subject to the Employee Retirement Income Security Act
(ERISA), which to some extent shapes the health benefits environment. GM has a health
benefit program for retirees, which is affected directly and indirectly by the policies of the
Medicare program (i.e., benefits not provided under Medicare are likely to be paid by GM
under wrap-around coverage). GM is also affected by the rules and regulations of the
Occupational Safety and Health Administration with respect to workplace health and
safety issues.
A substantial portion of active employees are hourly employees represented by the
UAW. Health benefits for this group are part of the contract bargaining cycle (currently
four years) between the UAW and GM. Thus, GM cannot act unilaterally in changing the
benefit package to accomplish policy goals such as reductions in health care expenditures
or changes in the patterns of utilization. The UAW is also actively involved in approving
the programs that will be offered to GM hourly workers. The UAW was supportive of a
program aimed at improving the health and well-being of the population; the union
would not have been as enthusiastic a supporter of a program aimed strictly at reducing
health care costs for GM through benefit reductions. The collective bargaining
environment that exists between GM and the UAW is a key driver of the ongoing
development and evaluation of health benefits policies and special programs such as
LifeSteps.
15
POTENTIAL CAUSES OF SUCCESS OR FAILURE
From the perspective of those interviewed for this study, four factors operated together to
make the implementation of LifeSteps successful. First, there were champions of the
program at high levels in the corporation (Cubbin, Kevin Butler, former general director
of GM Health Care Initiatives, and Mark White, former GM codirector of UAW-GM
Center for Health and Safety) and in the UAW (Vice President Richard Shoemaker).
Senior management buy-in is one of the principles of successful programs identified from
the literature. Second, the UAW enthusiastically supported the initiative and was willing
to use joint funds to pay a part of the costs. The literature also suggests that a culture that
values the health of employees provides the best environment for health promotion
programs. Third, there was a model that placed this initiative within the larger context of
other cost and quality drivers. The model provided a common conceptual framework for
the GM and UAW staff involved in design and implementation activities. Finally, there
are dedicated GM staff and UAW International representatives with considerable
experience. Thus, high-level leadership support from both GM and UAW, on-the-
ground experience, and a common frame of reference are markers for likely program
success. In addition, the team at the University of Michigan's Health Management
Research Center had considerable experience with corporate wellness programs and
brought expertise to the design, implementation, and evaluation activities. Having
information from the measurement and evaluation portion of the initiative has been
critical for redesigning and fine-tuning the program over time.
Different target groups are reached by different elements of the LifeSteps program.
For example, the retired population is most likely to participate in interventions that are
available in their homes (e.g., printed materials, telephone calls); this group is much less
receptive to interventions that require leaving home. Active employees are most
responsive to interventions available at the plant site. Dependents are the hardest group to
reach. By having different types of interventions, LifeSteps has been able to attract
different groups. However, it is clear that the program has been much less successful
among dependents and retirees.
It appears that the intensive intervention is somewhat more successful than the
basic intervention in promoting behavior change. However, the company has not
expanded the number of intensive sites. There appear to be a couple of reasons for this.
First, the expansion of the program has been linked to the union contract bargaining
cycle. Second, because the focus in the pilot sites is on active employees, GM would likely
seek a larger share in costs from the UAW joint funds. This may not be feasible because
there are competing uses for these funds—particularly in the current economic climate.
16
This may limit the magnitude of program’s potential success. It is sufficiently popular,
however, that it is unlikely to be scaled back in the near future.
KNOWLEDGE GAPS AND STUDY LIMITATIONS
A remarkable amount of information has been collected and analyzed by the University of
Michigan Health Management Research Center regarding the effect of LifeSteps on the
health status and expenditures of the target population. However, substantially more
information has been made available about the impact of the program on health than on
costs, primarily because of the decision to focus on risk reduction and health
improvement. Thus, this study is limited by a lack of data made available on program
costs.
Another potential limitation of the study is that the data presented here were not
independently analyzed. Although there is no reason to believe that the results are
inaccurate, the reader should be aware that no separate examination of the data was
undertaken.
A number of questions could not be answered within the context of the current
study. The following might be important for those considering whether to implement
such a program:
• How well do different components of the program work? The assessments that
were made available treat the individual interventions as a set and do not disclose
the value of each component (e.g., through a cost-benefit calculation). These
analyses have been done but were not shared for this case study. Although it has
been established that participating in more program components is better, it is
unclear whether a hierarchy of effectiveness exists among the components.
• What is the timing of benefits relative to costs? While some benefits are realized
within the same year that costs are incurred, some are likely to pay off in later years
(e.g., reductions in blood pressure or cholesterol). The evaluation design allows for
the testing of a latent period, but this information was not made available for this
study. This may affect the relevance of the findings to employers whose
employees’ average tenures are shorter than those experienced by GM. It is likely
that Medicare would be one of the major beneficiaries of the LifeSteps program
because of health care costs prevented or delayed in that population.
• How well are behavior changes maintained? The data are presented in aggregate
form in order to protect confidentiality, limiting our ability to understand how
17
individuals fare over time and whether some behavior changes are more likely to
be maintained than others. Presumably, if a return to poor health habits can be
delayed, the costs associated with the poor behavior are also delayed, but such
issues are complex. Even though individual data are tracked by the UMHMRC,
including information on risks, program costs, and savings in medical care
expenditures, these results are shared in aggregate form only.
• How would changes in the benefit package (e.g., improved coverage of routine
office visits) accelerate the benefits of or substitute for the LifeSteps program?
There was little opportunity to consider alternatives to LifeSteps but, given the
extensive work done in planning the program, it seems unlikely that significant
established alternatives exist.
• How would the implementation of this program nationally affect the health status
and health expenditures of the U.S. population? No estimates were made of
whether large-scale adoption of a similar program by many large employers would
have significant effects on the health of the U.S. population.
HEALTH IMPACT OF LIFESTEPS
The metrics used to assess the impact of LifeSteps are described above. This section
presents the results with respect to participation, risk status, wellness score, and change in
risk status.
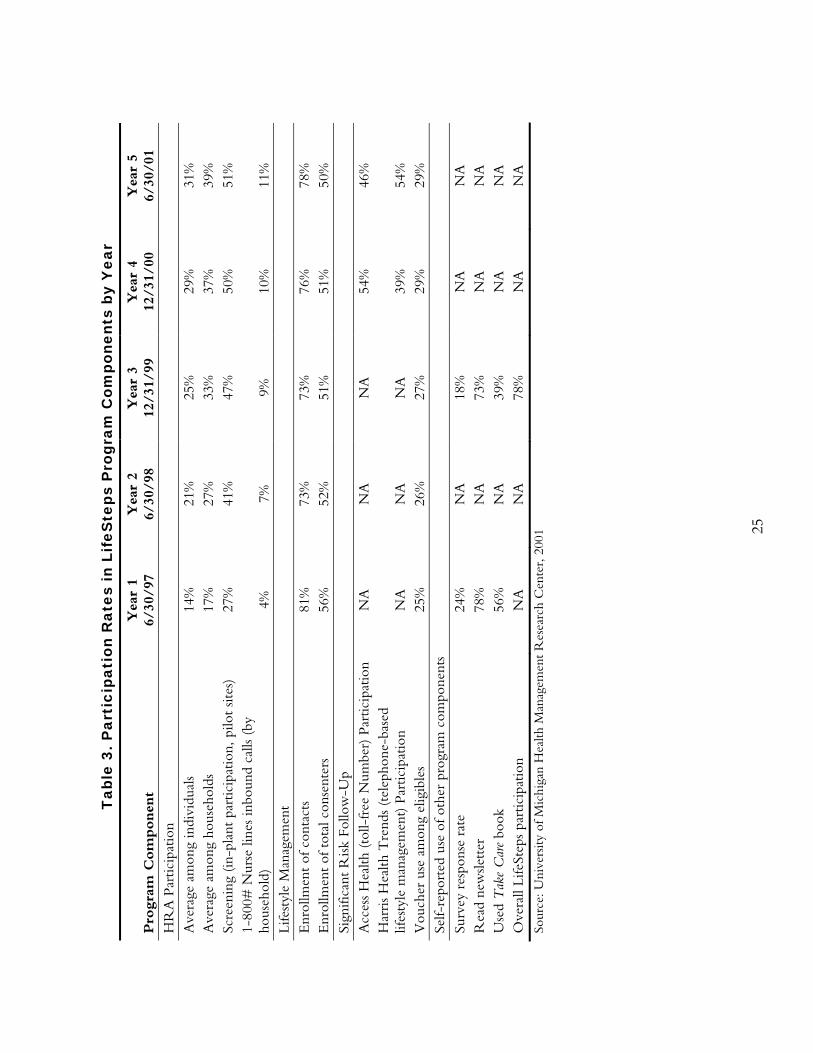
Rates of participation by program component are shown in Table 3. Since the
program's inception, 43 percent of households and 34 percent of individuals have
participated in at least one trackable component of LifeSteps. As of June 30, 2001, 24
percent of households had participated for at least two years and 13 percent had
participated for at least three years. The intensive program has reached a higher proportion
of the target group than the basic program, in large part because it is operated at the
worksite and is thus convenient for employees. Half of the active employees in the pilot
plants have been screened, nearly half have participated in the wellness support program,
and 29 percent of those receiving vouchers (those at highest risk) use the vouchers.
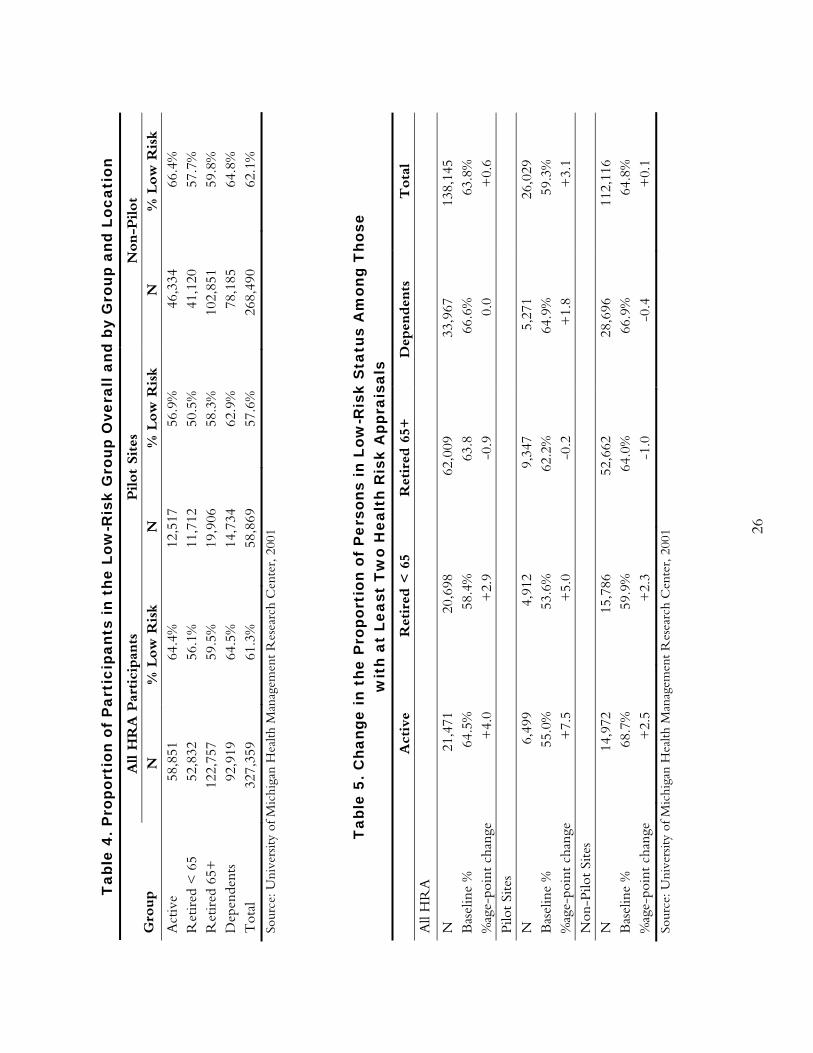
The proportion of persons in low-risk status is shown in Table 4. Overall, 61
percent of GM participants are in the low-risk group. Maintaining or improving this
proportion over time is one of the objectives of the program (Yen, Edington, et al., 2001).
Table 5 shows the change in low-risk status among persons who have completed at least
two HRAs. Among all active employees and retirees under age 65, the proportion of
persons with low-risk status has increased by the downward migration of the moderate-
18
and high-risk groups. Among retirees age 65 and older, there have been small percentage
point decreases in the proportion of persons with low-risk status. Among dependents, no
consistent overall pattern emerges; there has been an increase in the proportion of persons
with low-risk status in the pilot sites and a small decrease in the non-pilot sites.
Although intensity of participation is associated with the likelihood that a person
will change risk groups, in multivariate analyses (controlling for the number of baseline
risks and eligibility for high-risk programs) this effect is not significant (Yen, Edington, et
al., 2001). Among persons participating in three or more LifeSteps components, 13
percent migrated to low risk from a higher-risk category. Persons who had the biometric
screening in addition to completing the HRA and received personal counseling about the
results reduced risks by 30 percent more than those who only completed the HRA by
mail and received written feedback. The cost-effectiveness of this additional risk reduction
is still being measured.
Table 6 shows the Wellness Score overall and by type of participant and location.
The average score for populations participating in the HRA is 78.6. In Table 7, changes in
the Wellness Score among participants with at least two HRAs are shown. As with
changes in the proportion of persons in low-risk status, a positive direction is desirable.
Overall, there has been a positive change in Wellness Scores among active employees and
retirees under age 65. There has been a negative change among retirees age 65 and older
and dependents, leading to an overall negative change among all participants, although the
magnitude is quite small. In the pilot sites, where the more intensive intervention is
available, the positive changes in Wellness Scores are larger in magnitude.
Table 8 provides more detail about the types of health risks experienced by
participants in the LifeSteps program. The University of Michigan group has examined the
extent to which these risk factors are correlated with one another among different age,
gender, and health status groups (Braunstein, Li, Hirschland, McDonald, and Edington,
2001). The purpose of the study was to examine whether packages of interventions could
be developed to target the needs of subgroups in the population. One of the strongest
single predictors of the number of risk factors across the groups was an individual’s
perception of their own health status, which the authors found to be an accurate measure
of risk status. The study found four different groups of risk factors:
• Risk-taking behaviors group: high prevalence of smoking, high levels of alcohol
use, low levels of physical activity, and low rates of seatbelt use;
19
• Low-risk group: body mass index is most prevalent risk among this group, along
with high total cholesterol and low HDL;
• Biometric risk group: high prevalence of body mass index risk, high blood
pressure, high cholesterol, low HDL;
• Psychological risk group: high prevalence of life dissatisfaction and stress, low
ratings on self-perceived health; this group had the highest average number of risk
factors (4.4).
The analysis did discover differences in the age and gender profiles of these risk
factor clusters. For example, the biometric risks were more common among men and
salaried employees. For men, risks related to heart disease were the most common. Risks
related to illness days and stress were the most common for women.
ECONOMIC IMPACT
The association between risk status and the cost of health care by age group is shown in
Table 9. For example, in the 45–54 age group, persons in the low-risk group have an
average annual health expenditure of $1,713, compared with $4,828 among those in the
high-risk group. It is interesting to note that in all age groups, non-participants in the
program have costs that are higher on average than those in the low-risk participant group
but lower than those in the medium-risk group. This underscores the importance of rates
of participation on overall financial impact. GM calculates excess costs as the difference
between the low-risk groups and the nonparticipant and moderate and higher-risk groups.
The proportion of total costs that are attributable to excess risks is 25.7 percent.
Among those with TRAD or PPO coverage, GM estimates that it saves $226 per
risk factor reduced in the non-Medicare population and $106 per risk factor reduced in
the Medicare population. For the non-Medicare population, 76 percent of the savings is in
health services costs and 24 percent is in pharmaceutical costs. For the Medicare
population, 54 percent of the savings is in medical services costs and 46 percent is in
pharmaceutical costs.
Program participation also has an effect on the rate of health cost increases. An
analysis comparing the cost increases among active employees in the pilot program in the
pre-program years (1993–96) with cost increases in the program years (1996–99) found
that the difference in the annual increased dollar amount spent per person on health care
was $99. The cost increases were $160 per program participant annually, compared with
$219 for non-program participants, or a 37 percent higher rate of increase. In other words,
20
during the program years, health costs of participants increased less than those of non-
participants, with an annual savings of $99 in medical costs.
Table 10 demonstrates how the information on changes in health risk levels can be
brought together with information on the relationship between health risks and health
care costs to estimate the potential impact on health spending for a population of 1,000
active employees. According to this example, the program could save $42,355 per 1,000
active employees (or about $42 per person). Net savings would take into account the costs
of providing the intervention to 1,000 employees and consider the fact that other people
in this group are likely gaining risk (data not available for this case study).
Absence days were also examined before and after implementation of the program
among male hourly active employees in the two pilot sites. Before the LifeSteps program
began, there were no differences between eventual participants and non-participants in the
number of disability absences; about half of the population had zero disability absence days
over the six years of the study (1995–2000). The proportion of employees who had any
absence days increased less for those who participated in LifeSteps than for non-
participants (105 percent increase in absence days for participants versus a 141 percent
increase for non-participants). Those who participated in the LifeSteps program in
multiple years experienced a decrease in absence days, while non-participants increased
their absences by 0.7 days per year, single-year participants decreased absences by 0.3 days,
two-year participants decreased absence days by 0.4 days, and three-year participants
decreased absences by 0.6 days.
Critics of the results suggest that they are driven by selection effects—those who
are already interested in maintaining or improving their health or who are motivated to
change are more likely to join the program than those without such motivations. In fact,
one would prefer to see those at high risk participate in the program, since they could
potentially realize the greatest gains in health status and cost reductions. The UMHMRC
reports that there is a slight trend in the most recent year toward new participants having
higher risks.
No analysis was made available for this study that specifically identifies economic
winners and losers, although such analyses have been completed and are available for
review by program managers.
21
POLICY RECOMMENDATIONS
Four recommendations emerge from this study:
• Medicare should evaluate whether a health promotion program such as the one
described here should be implemented nationally. Medicare, like GM, may be able
to realize savings from an investment in better health. A creative approach would
be for Medicare to intervene before people age into the Medicare population. This
“risk profile enhancement” strategy would likely require new legislative authority.
(RAND is currently conducting a study for the Centers for Medicare and
Medicaid Services, called the “Healthy Aging” project, to examine evidence-based
interventions to promote the health and well-being of the Medicare population.
This policy recommendation is consistent with the content of that project but
offers some insights into potential cost savings for Medicare from making such
investments.)
• In the case of self-insured employers, particularly those with a large fee-for-service
component, the incentives to implement programs such as the one described here
are reasonably well aligned with the opportunity to realize savings. A critical
element for consideration is the length of time between implementing a program
and realizing cost savings. For example, if the break-even point is four years,
companies that have average tenures of four or more years may be able to incur
savings (or avoid cost increases). This has implications for regulations governing
such employers. If ERISA changed in a way that made it less attractive for
employers to self-insure, this would also reduce incentives for employers to invest
in health promotion or prevention programs, because they would not be able to
directly reap the benefits of any cost savings.
• UAW and GM are invested in a community-wide approach to improving health
status. They believe that this approach will ensure the long-term success of the
program and create a healthier pool of potential employees for all employers in a
community.
• Labor unions should consider programs such as the one described here as part of
future bargaining. There appear to be advantages to the health and well-being of
the population represented and, if the business case can be made to the employer,
both sides may incur a benefit.
22
• Measurement and evaluation should be a required program element for all quality
improvement interventions. The ability to demonstrate a business case for quality
hinges on having credible data that speak to the interests of the various
stakeholders affected by the intervention. The LifeSteps program is unusual in
terms of the richness of health status and financial data that have been available to
GM and the UAW throughout the program. The availability of such information
has enabled the Steering Committee to make improvements throughout the course
of the program to enhance its effectiveness. The independence of the evaluators
has also been important given the different stakeholder perspectives (that is, the
evaluation comes from a source that is trusted by both GM and the UAW).
Another key has been the commitment to confidentiality, which is regularly
communicated to the target population.
23
Table 1. Content of the LifeSteps Health Risk Appraisal Topic Description Personal Characteristics Age Height and weight Gender Body frame size Health-Related Behaviors Frequency of aerobic exercise Cigarette smoking Hours of sleep Daily servings of high-fiber foods Daily servings of high-cholesterol foods Weekly consumption of alcoholic beverages Annual miles riding or driving in motor vehicles Frequency of seatbelt use Average driving at speed limit Usual type of vehicle Quality of Life Life satisfaction Social ties Overall physical health Significant personal loss in past year Illness days in past year Medical History/Self Care Annual use of self-care book Annual use of the 800-number for health information Annual reading of LifeSteps newsletter Presence of specific chronic conditions (heart disease, diabetes,
cancer, hypertension, asthma, chronic bronchitis or emphysema, stroke, arthritis, allergies, back pain)
Use of specific preventive services Use of medication for high blood pressure Current blood pressure Total cholesterol level HDL cholesterol Breast cancer risk factors Self-exam of testicles Planning changes to improve/maintain health Interest in receiving follow-up information Source: Authors’ summary of LifeSteps HRA.
24
Tab
le 2
. Com
pari
son
of H
ealt
h P
lan
Ben
efit
s fo
r G
M S
alar
ied
Em
ploy
ees
Und
er T
radi
tion
al a
nd P
PO
Cov
erag
e (S
outh
east
Mic
higa
n)
Ben
efit T
ype
Bas
ic M
edic
al P
lan
Enhan
ced M
edic
al P
lan
PPO
-1
PPO
-2
Ann
ual d
educ
tible
In
divi
dual
/fam
ily
$900
/$18
00
$300
/$60
0 $3
00/$
600
out
of n
etw
ork
Non
e
Out
-of-
pock
et m
axim
um
Indi
vidu
al/f
amily
$2
500/
$500
0 $1
300/
$260
0 $1
300/
$260
0 ou
t of
net
wor
k $1
300/
$260
0 in
ne
twor
k/no
ne o
ut
Hos
pita
l ser
vice
s 25
% c
opay
afte
r de
duct
ible
20
% c
opay
aft
er d
educ
tible
0%
cop
ay in
net
wor
k,
30%
out
of n
etw
ork
10%
cop
ay in
net
wor
k,
30%
out
of n
etw
ork
Out
patie
nt s
ervi
ces
25%
cop
ay a
fter
dedu
ctib
le
20%
cop
ay a
fter
ded
uctib
le
$15
copa
y in
net
wor
k,
20%
out
of n
etw
ork
10%
cop
ay in
net
wor
k,
30%
out
of n
etw
ork
Em
erge
ncy
care
25
% c
opay
afte
r de
duct
ible
20
% c
opay
aft
er d
educ
tible
$5
0 co
pay
10%
cop
ay in
net
wor
k,
30%
out
of n
etw
ork
Pres
crip
tion
drug
s G
ener
ic-$
5, B
rand
-25%
($
15 m
in, $
25 m
ax)
Gen
eric
-$5,
Bra
nd-2
5% (
$15
min
, $25
max
) G
ener
ic-$
5, B
rand
-25
% (
$15
min
, $25
m
ax)
Gen
eric
-$5,
Bra
nd-2
5%
($15
min
, $25
max
)
Men
tal h
ealth
/ su
bsta
nce
abus
e C
over
ed
Cov
ered
C
over
ed
Cov
ered
Sour
ce: G
ener
al M
otor
s H
ealth
Car
e In
itiat
ives
.
25
Tab
le 3
. Par
tici
pati
on R
ates
in L
ifeS
teps
Pro
gram
Com
pone
nts
by Y
ear
Pro
gra
m C
om
ponen
t Y
ear
1 6/
30/9
7 Y
ear
2 6/
30/9
8 Y
ear
3 12
/31/
99
Yea
r 4
12/3
1/00
Y
ear
5 6/
30/0
1 H
RA
Par
ticip
atio
n A
vera
ge a
mon
g in
divi
dual
s 14
%
21%
25
%
29%
31
%
Ave
rage
am
ong
hous
ehol
ds
17%
27
%
33%
37
%
39%
Sc
reen
ing
(in-p
lant
par
ticip
atio
n, p
ilot
sites
) 27
%
41%
47
%
50%
51
%
1-80
0# N
urse
line
s in
boun
d ca
lls (
by
hous
ehol
d)
4%
7%
9%
10%
11
%
Life
styl
e M
anag
emen
t E
nrol
lmen
t of
con
tact
s 81
%
73%
73
%
76%
78
%
Enr
ollm
ent
of t
otal
con
sent
ers
56%
52
%
51%
51
%
50%
Si
gnifi
cant
Ris
k Fo
llow
-Up
Acc
ess
Hea
lth (
toll-
free
Num
ber)
Par
ticip
atio
n N
A
NA
N
A
54%
46
%
Har
ris
Hea
lth T
rend
s (t
elep
hone
-bas
ed
lifes
tyle
man
agem
ent)
Par
ticip
atio
n N
A
NA
N
A
39%
54
%
Vou
cher
use
am
ong
elig
ible
s 25
%
26%
27
%
29%
29
%
Self-
repo
rted
use
of o
ther
pro
gram
com
pone
nts
Surv
ey r
espo
nse
rate
24
%
NA
18
%
NA
N
A
Rea
d ne
wsle
tter
78
%
NA
73
%
NA
N
A
Use
d T
ake
Car
e bo
ok
56%
N
A
39%
N
A
NA
O
vera
ll Li
feSt
eps
part
icip
atio
n N
A
NA
78
%
NA
N
A
Sour
ce: U
nive
rsity
of M
ichi
gan
Hea
lth M
anag
emen
t R
esea
rch
Cen
ter,
200
1
26
Tab
le 4
. Pro
port
ion
of P
arti
cipa
nts
in t
he L
ow-R
isk
Gro
up O
vera
ll an
d by
Gro
up a
nd L
ocat
ion
All
HR
A P
artici
pan
ts
Pilot
Sites
N
on-P
ilot
Gro
up
N
% L
ow
Ris
k N
%
Low
Ris
k N
%
Low
Ris
k A
ctiv
e 58
,851
64
.4%
12
,517
56
.9%
46
,334
66
.4%
R
etir
ed <
65
52,8
32
56.1
%
11,7
12
50.5
%
41,1
20
57.7
%
Ret
ired
65+
12
2,75
7 59
.5%
19
,906
58
.3%
10
2,85
1 59
.8%
D
epen
dent
s 92
,919
64
.5%
14
,734
62
.9%
78
,185
64
.8%
T
otal
32
7,35
9 61
.3%
58
,869
57
.6%
26
8,49
0 62
.1%
So
urce
: Uni
vers
ity o
f Mic
higa
n H
ealth
Man
agem
ent
Res
earc
h C
ente
r, 2
001
T
able
5. C
hang
e in
the
Pro
port
ion
of P
erso
ns in
Low
-Ris
k S
tatu
s A
mon
g T
hose
w
ith
at L
east
Tw
o H
ealt
h R
isk
App
rais
als
A
ctiv
e R
etir
ed <
65
Ret
ired
65+
D
epen
den
ts
Tota
l A
ll H
RA
N
21,4
71
20,6
98
62,0
09
33,9
67
138,
145
Bas
elin
e %
64
.5%
58
.4%
63
.8
66.6
%
63.8
%
%ag
e-po
int
chan
ge
+4.
0 +
2.9
-0.9
0.
0 +
0.6
Pilo
t Si
tes
N
6,49
9 4,
912
9,34
7 5,
271
26,0
29
Bas
elin
e %
55
.0%
53
.6%
62
.2%
64
.9%
59
.3%
%
age-
poin
t ch
ange
+
7.5
+5.
0 -0
.2
+1.
8 +
3.1
Non
-Pilo
t Si
tes
N
14,9
72
15,7
86
52,6
62
28,6
96
112,
116
Bas
elin
e %
68
.7%
59
.9%
64
.0%
66
.9%
64
.8%
%
age-
poin
t ch
ange
+
2.5
+2.
3 -1
.0
-0.4
+
0.1
Sour
ce: U
nive
rsity
of M
ichi
gan
Hea
lth M
anag
emen
t R
esea
rch
Cen
ter,
200
1
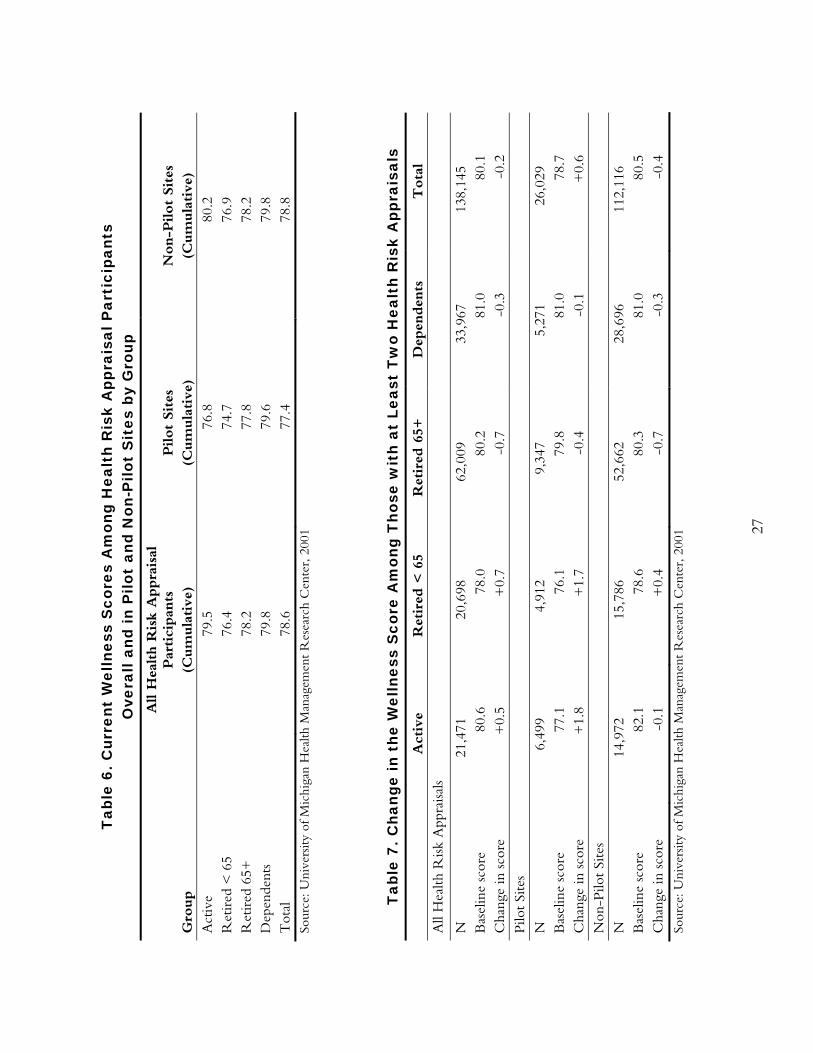
27
Tab
le 6
. Cur
rent
Wel
lnes
s S
core
s A
mon
g H
ealt
h R
isk
App
rais
al P
arti
cipa
nts
Ove
rall
and
in P
ilot
and
Non
-Pilo
t S
ites
by
Gro
up
Gro
up
All
Hea
lth R
isk
Appra
isal
Par
tici
pan
ts
(Cum
ula
tive
) Pilot
Sites
(C
um
ula
tive
) N
on-P
ilot
Sites
(C
um
ula
tive
) A
ctiv
e 79
.5
76.8
80
.2
Ret
ired
< 6
5 76
.4
74.7
76
.9
Ret
ired
65+
78
.2
77.8
78
.2
Dep
ende
nts
79.8
79
.6
79.8
T
otal
78
.6
77.4
78
.8
Sour
ce: U
nive
rsity
of M
ichi
gan
Hea
lth M
anag
emen
t R
esea
rch
Cen
ter,
200
1
T
able
7. C
hang
e in
the
Wel
lnes
s S
core
Am
ong
Tho
se w
ith
at L
east
Tw
o H
ealt
h R
isk
App
rais
als
A
ctiv
e R
etir
ed <
65
Ret
ired
65+
D
epen
den
ts
Tota
l A
ll H
ealth
Ris
k A
ppra
isals
N
21,4
71
20,6
98
62,0
09
33,9
67
138,
145
Bas
elin
e sc
ore
80.6
78
.0
80.2
81
.0
80.1
C
hang
e in
sco
re
+0.
5 +
0.7
-0.7
-0
.3
-0.2
Pi
lot
Site
s N
6,
499
4,91
2 9,
347
5,27
1 26
,029
B
asel
ine
scor
e 77
.1
76.1
79
.8
81.0
78
.7
Cha
nge
in s
core
+
1.8
+1.
7 -0
.4
-0.1
+
0.6
Non
-Pilo
t Si
tes
N
14,9
72
15,7
86
52,6
62
28,6
96
112,
116
Bas
elin
e sc
ore
82.1
78
.6
80.3
81
.0
80.5
C
hang
e in
sco
re
-0.1
+
0.4
-0.7
-0
.3
-0.4
So
urce
: Uni
vers
ity o
f Mic
higa
n H
ealth
Man
agem
ent
Res
earc
h C
ente
r, 2
001
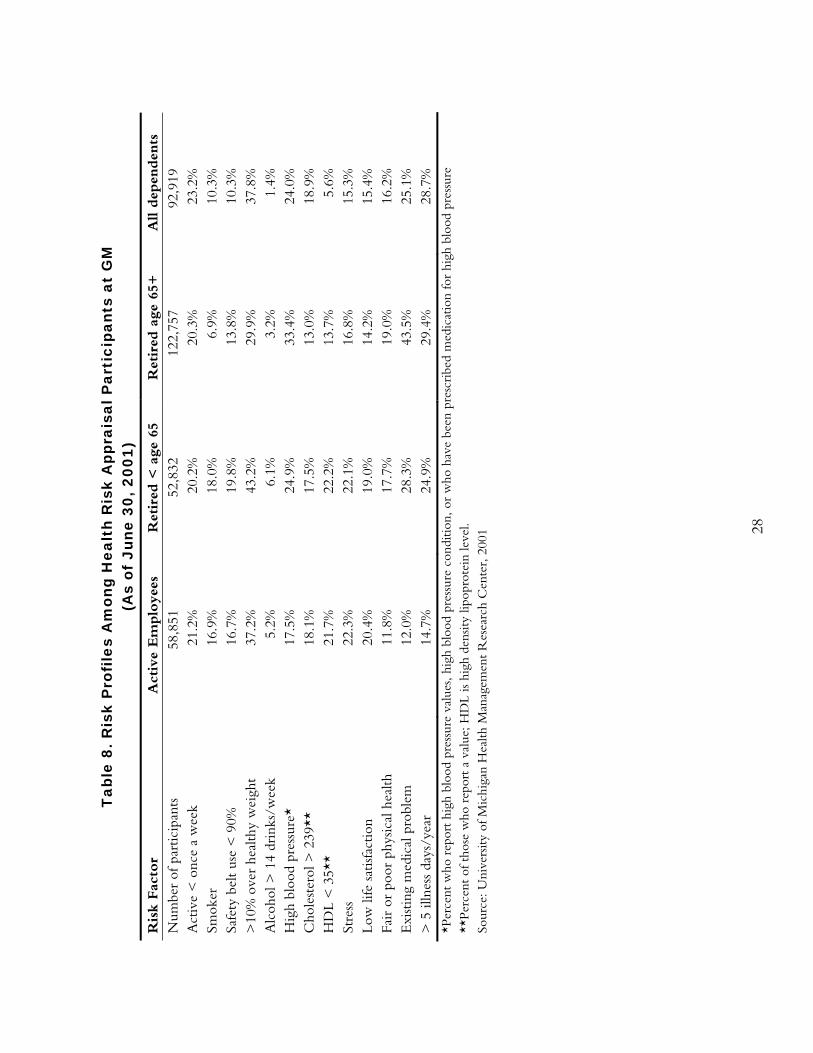
28
Tab
le 8
. Ris
k P
rofi
les
Am
ong
Hea
lth
Ris
k A
ppra
isal
Par
tici
pant
s at
GM
(A
s of
Jun
e 30
, 200
1)
Ris
k Fac
tor
Act
ive
Em
plo
yees
R
etir
ed <
age
65
Ret
ired
age
65+
A
ll dep
enden
ts
Num
ber
of p
artic
ipan
ts
58,8
51
52,8
32
122,
757
92,9
19
Act
ive
< o
nce
a w
eek
21
.2%
20
.2%
20
.3%
23
.2%
Sm
oker
16
.9%
18
.0%
6.
9%
10.3
%
Safe
ty b
elt
use
< 9
0%
16.7
%
19.8
%
13.8
%
10.3
%
>10
% o
ver
heal
thy
wei
ght
37.2
%
43.2
%
29.9
%
37.8
%
Alc
ohol
> 1
4 dr
inks
/wee
k 5.
2%
6.1%
3.
2%
1.4%
H
igh
bloo
d pr
essu
re*
17.5
%
24.9
%
33.4
%
24.0
%
Cho
lest
erol
> 2
39**
18
.1%
17
.5%
13
.0%
18
.9%
H
DL
< 3
5**
21.7
%
22.2
%
13.7
%
5.6%
St
ress
22
.3%
22
.1%
16
.8%
15
.3%
Lo
w li
fe s
atisf
actio
n 20
.4%
19
.0%
14
.2%
15
.4%
Fa
ir o
r po
or p
hysic
al h
ealth
11
.8%
17
.7%
19
.0%
16
.2%
E
xist
ing
med
ical
pro
blem
12
.0%
28
.3%
43
.5%
25
.1%
>
5 il
lnes
s da
ys/y
ear
14.7
%
24.9
%
29.4
%
28.7
%
*Per
cent
who
rep
ort
high
blo
od p
ress
ure
valu
es, h
igh
bloo
d pr
essu
re c
ondi
tion,
or
who
hav
e be
en p
resc
ribe
d m
edic
atio
n fo
r hi
gh b
lood
pre
ssur
e **
Perc
ent
of t
hose
who
rep
ort
a va
lue;
HD
L is
high
den
sity
lipop
rote
in le
vel.
Sour
ce: U
nive
rsity
of M
ichi
gan
Hea
lth M
anag
emen
t R
esea
rch
Cen
ter,
200
1
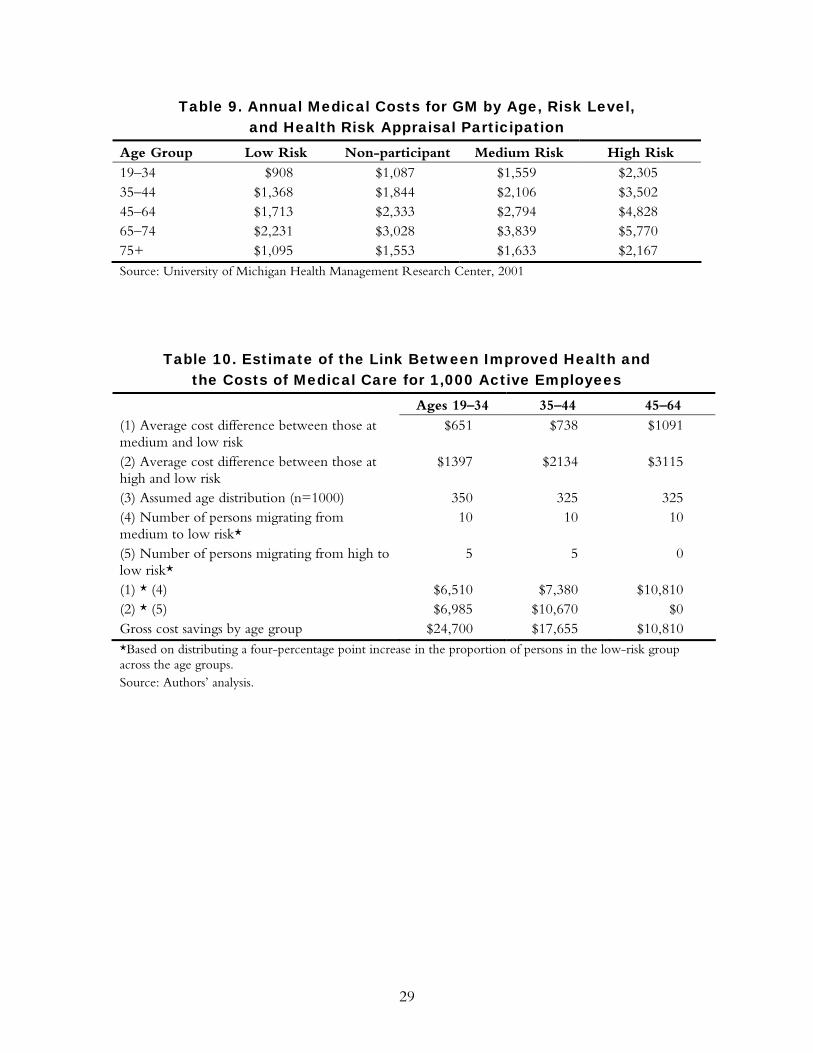
29
Table 9. Annual Medical Costs for GM by Age, Risk Level, and Health Risk Appraisal Participation
Age Group Low Risk Non-participant Medium Risk High Risk 19–34 $908 $1,087 $1,559 $2,305 35–44 $1,368 $1,844 $2,106 $3,502 45–64 $1,713 $2,333 $2,794 $4,828 65–74 $2,231 $3,028 $3,839 $5,770 75+ $1,095 $1,553 $1,633 $2,167 Source: University of Michigan Health Management Research Center, 2001
Table 10. Estimate of the Link Between Improved Health and the Costs of Medical Care for 1,000 Active Employees
Ages 19–34 35–44 45–64 (1) Average cost difference between those at medium and low risk
$651 $738 $1091
(2) Average cost difference between those at high and low risk
$1397 $2134 $3115
(3) Assumed age distribution (n=1000) 350 325 325 (4) Number of persons migrating from medium to low risk*
10 10 10
(5) Number of persons migrating from high to low risk*
5 5 0
(1) * (4) $6,510 $7,380 $10,810 (2) * (5) $6,985 $10,670 $0 Gross cost savings by age group $24,700 $17,655 $10,810 *Based on distributing a four-percentage point increase in the proportion of persons in the low-risk group across the age groups. Source: Authors’ analysis.
30
REFERENCES
1. Vickery DM, Fries JF. Take Care of Yourself: A Consumer's Guide to Medical Care. Reading,
MA: Addison-Wesley Pub. Co., 1976.
2. Pelletier K. A review and analysis of the clinical- and cost-effectiveness studies of comprehensive health promotion and disease management programs at the worksite: 1998–2000 update. American Journal of Health Promotion. 2001; 16(2):107–116.
3. Heaney C, Goetzel R. A review of health-related outcomes of multi-component worksite health promotion programs. American Journal of Health Promotion. 1997; 11(4): 290–308.
4. Yen L, Edington M, et al. Changes in health risks among participants in the United Auto Workers–General Motors LifeSteps health promotion program. American Journal of Health Promotion. 2001; 16(1):7–15.
5. Anderson D, Staufacker, M. The impact of worksite-based health risk appraisal on health-related outcomes: a review of the literature. American Journal of Health Promotion. 1996; 10(6):499–508.
6. Centers for Disease Control and Prevention. Health risk appraisal. Morbidity and Mortality Weekly Report. 1981; 30(11): 133–135.
7. Smith K, McKinlay S, et al. The validity of health risk appraisal instruments for assessing coronary heart disease risk. American Journal of Public Health. 1987; 77: 419–24.
8. Yen L, Edington D, et al. Corporate medical claim cost distributions and factors associated with high-cost status. Journal of Occupational and Environmental Medicine. 1994; 36(5): 505–15.
9. U.S. Preventive Services Task Force. Guide to clinical preventive services, 2nd edition. U.S. Department of Health and Human Services. 1996.
10. Goetzel R, Anderson D, et al. The relationship between modifiable health risks and health care expenditures: an analysis of the multi-employer HERO health risk and cost database. Journal of Occupational and Environmental Medicine. 1998; 40:1–12.
11. Aldana S. Financial impact of health promotion programs: a comprehensive review of the literature. American Journal of Health Promotion. 2001; 15(5):296–320.
12. Yen L, Edington D, et al. Associations between health risk appraisal scores and employee medical claims costs in a manufacturing company. American Journal of Health Promotion. 1991; 6:46–54.
13. Wilson M, Holman P, et al. A comprehensive review of the effects of worksite health promotion on health-related outcomes. American Journal of Health Promotion. 1996; 10(6):429–35.
14. Anderson D, Whitmer R, et al. The relationship between modifiable health risks and group-level health care expenditures. American Journal of Health Promotion. 2000; 13(1):45–52.
15. Ozminkowski R, Dunn R, et al. A return on investment evaluation of the Citibank, N.A., health management program. American Journal of Health Promotion. 1999; 14(1):31–43.
16. Pelletier K. Clinical and cost outcomes of multifactorial, cardiovascular risk management interventions in the worksite: a comprehensive review and analysis. Journal of Occupational and Environmental Medicine. 1997; 39:1154–1167.
17. Edington DW. Emerging research: a view from one research center. American Journal of Health Promotion. 2001; 15(5):341–349.

31
18. Braunstein A, Li Y, Hirschland D, McDonald T, Edington DW. Internal associations among health-risk factors and risk prevalence. American Journal of Health Promotion. 2001; 25(4):407–417.
32
RELATED PUBLICATIONS
In the list below, items that begin with a publication number are available from The
Commonwealth Fund by calling its toll-free publications line at 1-888-777-2744
and ordering by number. These items can also be found on the Fund’s website at
www.cmwf.org. Other items are available from the authors and/or publishers.
#620 Smallpox Vaccinations: The Risks and the Benefits (April 2003, Web publication). Rena Conti. Prepared for the 2003 Commonwealth Fund/John F. Kennedy School of Government Bipartisan Congressional Health Policy Conference, this issue brief argues that offering voluntary smallpox vaccinations to the public presents benefits that must be weighed against associated medical, logistic, and economic risks. Policymakers must navigate complex tensions between scientific and political uncertainty, and between the government’s role in protecting its citizenry while guaranteeing individuals’ rights to self-determination. #619 The Nursing Workforce Shortage: Causes, Consequences, Proposed Solutions (April 2003, Web publication). Patricia Keenan. Prepared for the 2003 Commonwealth Fund/John F. Kennedy School of Government Bipartisan Congressional Health Policy Conference, this issue brief argues that projected long-term nursing shortages will create still greater cost and quality challenges, and that without increased payments from public or private purchasers, health care institutions will most likely have to make tradeoffs between investing in staffing and pursuing other quality-improvement efforts. #615 Balancing Safety, Effectiveness, and Public Desire: The FDA and Cancer (April 2003, Web publication). Rena Conti. Prepared for the 2003 Commonwealth Fund/John F. Kennedy School of Government Bipartisan Congressional Health Policy Conference, this issue brief discusses the challenges the FDA faces in balancing the need to ensure that cancer drugs are safe and effective against pressure to make therapies available quickly. #614 The Business Case for Tobacco Cessation Programs: A Case Study (April 2003, Web publication). Artemis March, The Quantum Lens. This case study looks at the business case for a smoking cessation program that was implemented through the Group Health Cooperative (GHC), a health system and health plan based in Seattle. #613 The Business Case for Pharmaceutical Management: A Case Study (April 2003, Web publication). Helen Smits, Barbara Zarowitz, Vinod K. Sahney, and Lucy Savitz. This case study explores the business case for two innovations in pharmacy management at the Henry Ford Health System, based in Detroit, Michigan. In an attempt to shorten hospitalization for deep vein thrombosis, Henry Ford experimented with the use of an expensive new drug, low molecular weight heparin. The study also examines a lipid clinic that was created at Henry Ford to maximize the benefit of powerful new cholesterol-lowering drugs. #611 The Business Case for Drop-In Group Medical Appointments: A Case Study (April 2003, Web publication). Jon B. Christianson and Louise H. Warrick, Institute for Healthcare Improvement. Drop-in Group Medical Appointments (DIGMAs) are visits with a physician that take place in a supportive group setting, and that can increase access to physicians, improve patient satisfaction, and increase physician productivity. This case study examines the business case for DIGMAs as they were implemented in the Luther Midelfort Mayo System, based in Eau Claire, Wisconsin.
33
#610 The Business Case for Diabetes Disease Management at Two Managed Care Organizations: A Case Study (April 2003, Web publication). Nancy Dean Beaulieu, David M. Cutler, Katherine E. Ho, Dennis Horrigan, and George Isham. This case study looks at the business case for a diabetes disease management program at HealthPartners, an HMO in Minneapolis, Minnesota, and Independent Health Association, an HMO in Buffalo, New York. Both disease management programs emphasize patient and physician education, adherence to clinical guidelines, and nurse case management. #609 The Business Case for Clinical Pathways and Outcomes Management: A Case Study (April 2003, Web publication). Artemis March, The Quantum Lens. This case study describes the implementation of an outcomes center and data-based decision-making at Children’s Hospital and Health Center of San Diego during the mid-1990s. It examines the business case for the core initiative: the development of a computerized physician order entry system. Hospital Disclosure Practices: Results of a National Survey (March/April 2003). Rae M. Lamb, David M. Studdert, Richard M. J. Bohmer, Donald M. Berwick, and Troyen A. Brennan. Health Affairs, vol. 22, no. 2. Copies are available from Health Affairs, 7500 Old Georgetown Road, Suite 600, Bethesda, MD 20814-6133, Tel: 301-656-7401 ext. 200, Fax: 301-654-2845, www.healthaffairs.org. The Business Case for Quality: Case Studies and An Analysis (March/April 2003). Sheila Leatherman, Donald Berwick, Debra Iles, Lawrence S. Lewin, Frank Davidoff, Thomas Nolan, and Maureen Bisognano. Health Affairs, vol. 22, no. 2. Copies are available from Health Affairs, 7500 Old Georgetown Road, Suite 600, Bethesda, MD 20814-6133, Tel: 301-656-7401 ext. 200, Fax: 301-654-2845, www.healthaffairs.org. #606 Health Plan Quality Data: The Importance of Public Reporting (January 2003). Joseph W. Thompson, Sathiska D. Pinidiya, Kevin W. Ryan, Elizabeth D. McKinley, Shannon Alston, James E. Bost, Jessica Briefer French, and Pippa Simpson. American Journal of Preventive Medicine, vol. 24, no. 1 (In the Literature summary). The authors present evidence that health plan performance is highly associated with whether a plan publicly releases its performance information. The finding makes a compelling argument for the support of policies that mandate reporting of quality-of-care measures. #578 Exploring Consumer Perspectives on Good Physician Care: A Summary of Focus Group Results (January 2003, Web publication). Donna Pillittere, Mary Beth Bigley, Judith Hibbard, and Greg Pawlson. Part of a multifaceted Commonwealth Fund-supported study, “Developing Patient-Centered Measures of Physician Quality,” the authors report that consumers can understand and will value information about effectiveness and patient safety (as well as patient-centeredness) if they are presented with information in a consumer-friendly framework. #563 Escape Fire: Lessons for the Future of Health Care (November 2002). Donald M. Berwick. In this monograph, Dr. Berwick outlines the problems with the health care system—medical errors, confusing and inconsistent information, and a lack of personal attention and continuity in care—and then sketches an ambitious program for reform. Achieving and Sustaining Improved Quality: Lessons from New York State and Cardiac Surgery (July/August 2002). Mark R. Chassin. Health Affairs, vol. 21, no. 4. Copies are available from Health Affairs, 7500 Old Georgetown Road, Suite 600, Bethesda, MD 20814-6133, Tel: 301-656-7401 ext. 200, Fax: 301-654-2845. Available online at http://www.healthaffairs.org/ readeragent.php?ID=/usr/local/apache/sites/healthaffairs.org/htdocs/Library/v21n4/s8.pdf.
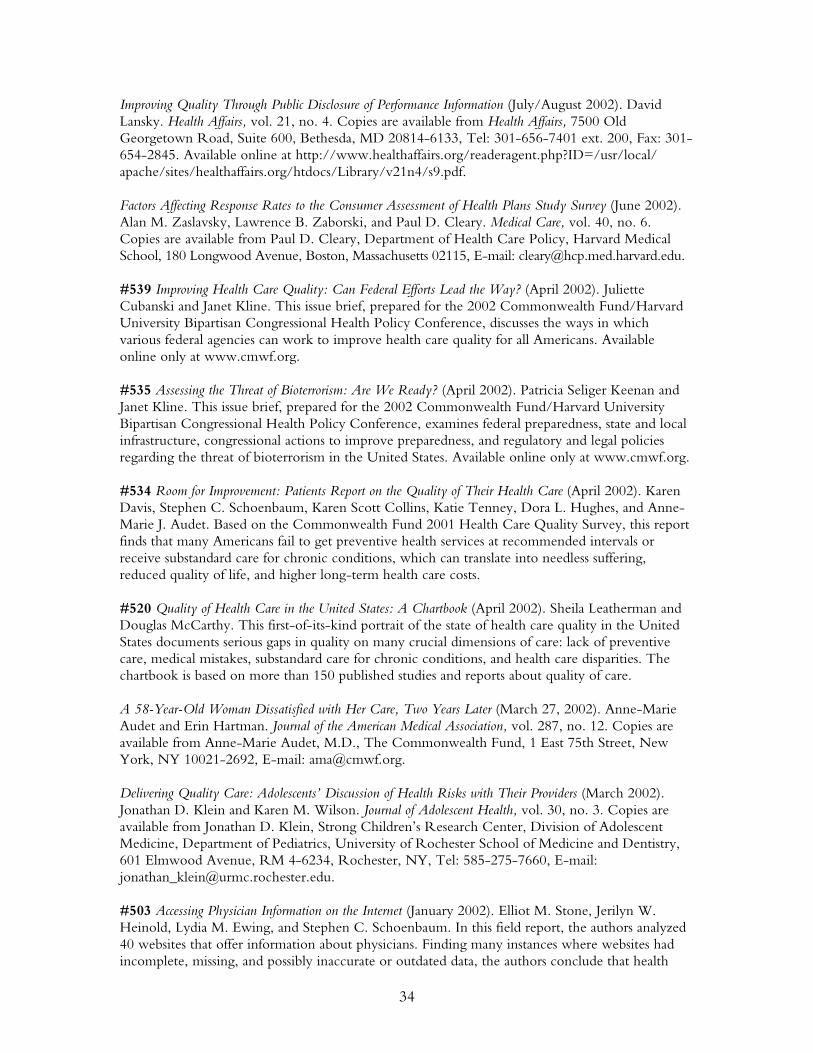
34
Improving Quality Through Public Disclosure of Performance Information (July/August 2002). David Lansky. Health Affairs, vol. 21, no. 4. Copies are available from Health Affairs, 7500 Old Georgetown Road, Suite 600, Bethesda, MD 20814-6133, Tel: 301-656-7401 ext. 200, Fax: 301-654-2845. Available online at http://www.healthaffairs.org/readeragent.php?ID=/usr/local/ apache/sites/healthaffairs.org/htdocs/Library/v21n4/s9.pdf. Factors Affecting Response Rates to the Consumer Assessment of Health Plans Study Survey (June 2002). Alan M. Zaslavsky, Lawrence B. Zaborski, and Paul D. Cleary. Medical Care, vol. 40, no. 6. Copies are available from Paul D. Cleary, Department of Health Care Policy, Harvard Medical School, 180 Longwood Avenue, Boston, Massachusetts 02115, E-mail: [email protected]. #539 Improving Health Care Quality: Can Federal Efforts Lead the Way? (April 2002). Juliette Cubanski and Janet Kline. This issue brief, prepared for the 2002 Commonwealth Fund/Harvard University Bipartisan Congressional Health Policy Conference, discusses the ways in which various federal agencies can work to improve health care quality for all Americans. Available online only at www.cmwf.org. #535 Assessing the Threat of Bioterrorism: Are We Ready? (April 2002). Patricia Seliger Keenan and Janet Kline. This issue brief, prepared for the 2002 Commonwealth Fund/Harvard University Bipartisan Congressional Health Policy Conference, examines federal preparedness, state and local infrastructure, congressional actions to improve preparedness, and regulatory and legal policies regarding the threat of bioterrorism in the United States. Available online only at www.cmwf.org. #534 Room for Improvement: Patients Report on the Quality of Their Health Care (April 2002). Karen Davis, Stephen C. Schoenbaum, Karen Scott Collins, Katie Tenney, Dora L. Hughes, and Anne-Marie J. Audet. Based on the Commonwealth Fund 2001 Health Care Quality Survey, this report finds that many Americans fail to get preventive health services at recommended intervals or receive substandard care for chronic conditions, which can translate into needless suffering, reduced quality of life, and higher long-term health care costs. #520 Quality of Health Care in the United States: A Chartbook (April 2002). Sheila Leatherman and Douglas McCarthy. This first-of-its-kind portrait of the state of health care quality in the United States documents serious gaps in quality on many crucial dimensions of care: lack of preventive care, medical mistakes, substandard care for chronic conditions, and health care disparities. The chartbook is based on more than 150 published studies and reports about quality of care. A 58-Year-Old Woman Dissatisfied with Her Care, Two Years Later (March 27, 2002). Anne-Marie Audet and Erin Hartman. Journal of the American Medical Association, vol. 287, no. 12. Copies are available from Anne-Marie Audet, M.D., The Commonwealth Fund, 1 East 75th Street, New York, NY 10021-2692, E-mail: [email protected]. Delivering Quality Care: Adolescents’ Discussion of Health Risks with Their Providers (March 2002). Jonathan D. Klein and Karen M. Wilson. Journal of Adolescent Health, vol. 30, no. 3. Copies are available from Jonathan D. Klein, Strong Children’s Research Center, Division of Adolescent Medicine, Department of Pediatrics, University of Rochester School of Medicine and Dentistry, 601 Elmwood Avenue, RM 4-6234, Rochester, NY, Tel: 585-275-7660, E-mail: [email protected]. #503 Accessing Physician Information on the Internet (January 2002). Elliot M. Stone, Jerilyn W. Heinold, Lydia M. Ewing, and Stephen C. Schoenbaum. In this field report, the authors analyzed 40 websites that offer information about physicians. Finding many instances where websites had incomplete, missing, and possibly inaccurate or outdated data, the authors conclude that health
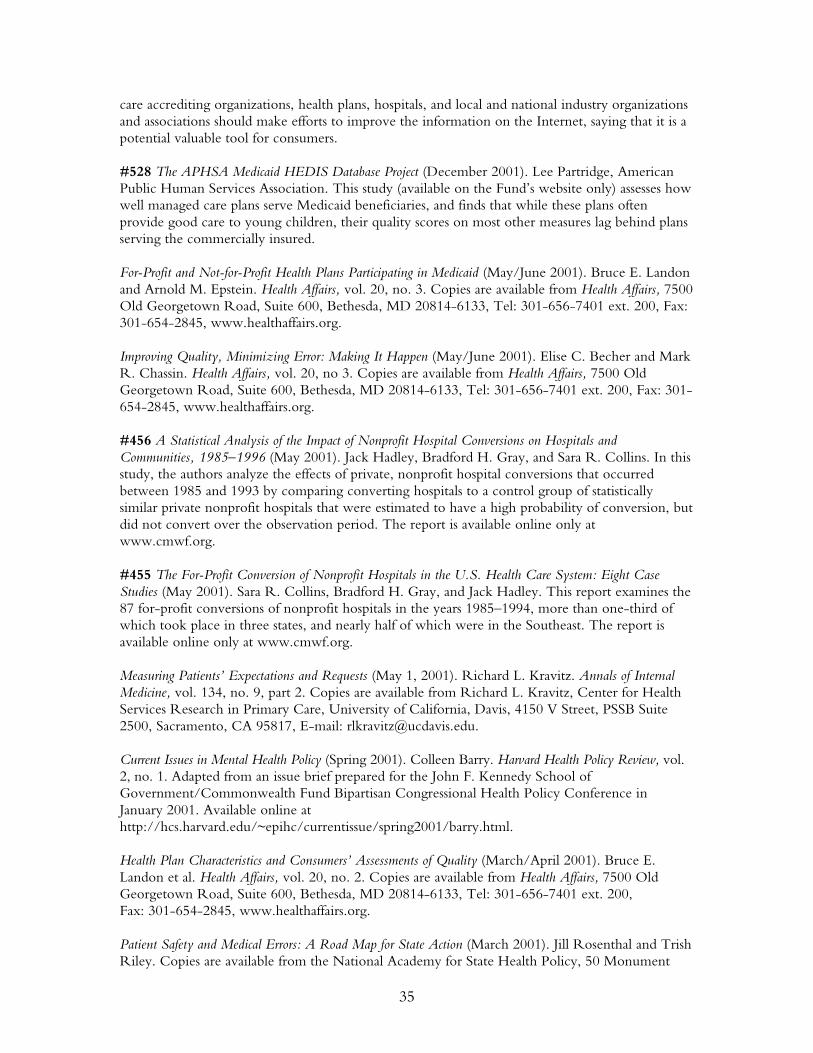
35
care accrediting organizations, health plans, hospitals, and local and national industry organizations and associations should make efforts to improve the information on the Internet, saying that it is a potential valuable tool for consumers. #528 The APHSA Medicaid HEDIS Database Project (December 2001). Lee Partridge, American Public Human Services Association. This study (available on the Fund’s website only) assesses how well managed care plans serve Medicaid beneficiaries, and finds that while these plans often provide good care to young children, their quality scores on most other measures lag behind plans serving the commercially insured. For-Profit and Not-for-Profit Health Plans Participating in Medicaid (May/June 2001). Bruce E. Landon and Arnold M. Epstein. Health Affairs, vol. 20, no. 3. Copies are available from Health Affairs, 7500 Old Georgetown Road, Suite 600, Bethesda, MD 20814-6133, Tel: 301-656-7401 ext. 200, Fax: 301-654-2845, www.healthaffairs.org. Improving Quality, Minimizing Error: Making It Happen (May/June 2001). Elise C. Becher and Mark R. Chassin. Health Affairs, vol. 20, no 3. Copies are available from Health Affairs, 7500 Old Georgetown Road, Suite 600, Bethesda, MD 20814-6133, Tel: 301-656-7401 ext. 200, Fax: 301-654-2845, www.healthaffairs.org. #456 A Statistical Analysis of the Impact of Nonprofit Hospital Conversions on Hospitals and Communities, 1985–1996 (May 2001). Jack Hadley, Bradford H. Gray, and Sara R. Collins. In this study, the authors analyze the effects of private, nonprofit hospital conversions that occurred between 1985 and 1993 by comparing converting hospitals to a control group of statistically similar private nonprofit hospitals that were estimated to have a high probability of conversion, but did not convert over the observation period. The report is available online only at www.cmwf.org. #455 The For-Profit Conversion of Nonprofit Hospitals in the U.S. Health Care System: Eight Case Studies (May 2001). Sara R. Collins, Bradford H. Gray, and Jack Hadley. This report examines the 87 for-profit conversions of nonprofit hospitals in the years 1985–1994, more than one-third of which took place in three states, and nearly half of which were in the Southeast. The report is available online only at www.cmwf.org. Measuring Patients’ Expectations and Requests (May 1, 2001). Richard L. Kravitz. Annals of Internal Medicine, vol. 134, no. 9, part 2. Copies are available from Richard L. Kravitz, Center for Health Services Research in Primary Care, University of California, Davis, 4150 V Street, PSSB Suite 2500, Sacramento, CA 95817, E-mail: [email protected]. Current Issues in Mental Health Policy (Spring 2001). Colleen Barry. Harvard Health Policy Review, vol. 2, no. 1. Adapted from an issue brief prepared for the John F. Kennedy School of Government/Commonwealth Fund Bipartisan Congressional Health Policy Conference in January 2001. Available online at http://hcs.harvard.edu/~epihc/currentissue/spring2001/barry.html. Health Plan Characteristics and Consumers’ Assessments of Quality (March/April 2001). Bruce E. Landon et al. Health Affairs, vol. 20, no. 2. Copies are available from Health Affairs, 7500 Old Georgetown Road, Suite 600, Bethesda, MD 20814-6133, Tel: 301-656-7401 ext. 200, Fax: 301-654-2845, www.healthaffairs.org. Patient Safety and Medical Errors: A Road Map for State Action (March 2001). Jill Rosenthal and Trish Riley. Copies are available from the National Academy for State Health Policy, 50 Monument
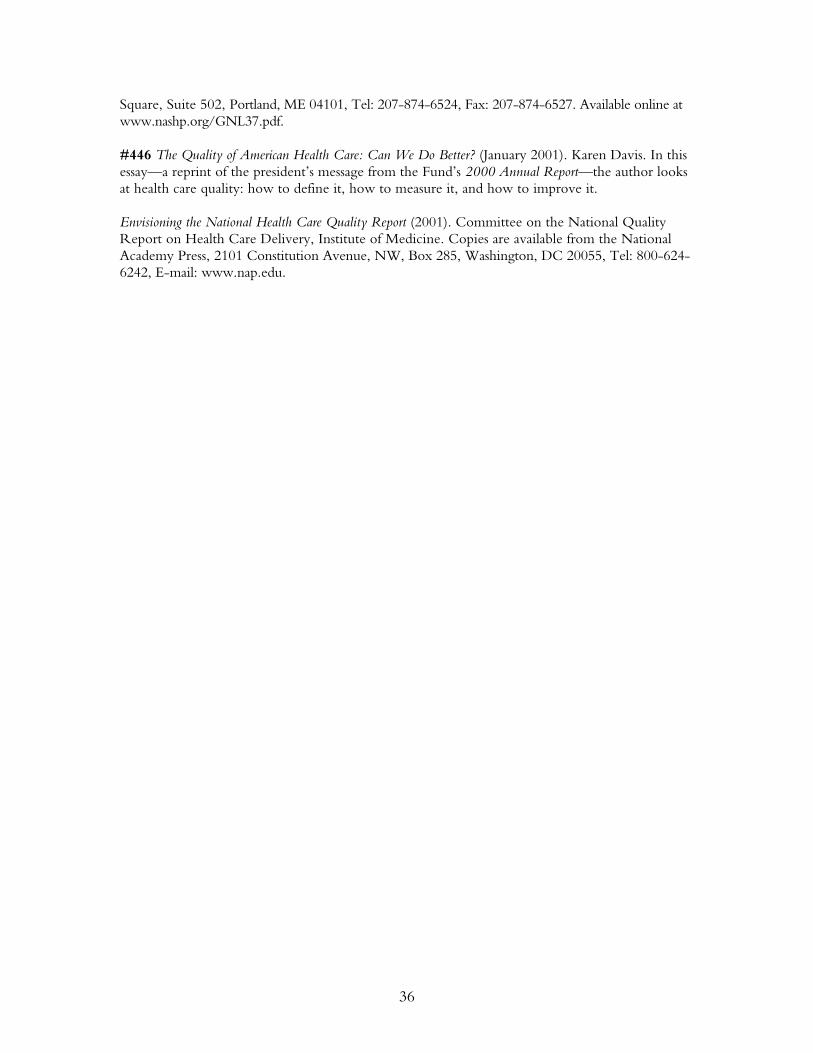
36
Square, Suite 502, Portland, ME 04101, Tel: 207-874-6524, Fax: 207-874-6527. Available online at www.nashp.org/GNL37.pdf. #446 The Quality of American Health Care: Can We Do Better? (January 2001). Karen Davis. In this essay—a reprint of the president’s message from the Fund’s 2000 Annual Report—the author looks at health care quality: how to define it, how to measure it, and how to improve it. Envisioning the National Health Care Quality Report (2001). Committee on the National Quality Report on Health Care Delivery, Institute of Medicine. Copies are available from the National Academy Press, 2101 Constitution Avenue, NW, Box 285, Washington, DC 20055, Tel: 800-624-6242, E-mail: www.nap.edu.