Embed Size (px)
Citation preview

The Burton upon Trent School Planning Study
Part 1
Managing demographic growth and increasing education opportunities
October 2013
Staffordshire County & East Staffordshire Borough Councils Borough Councils


323137 BPI MBS P1 D
323137/PK/PW/TB
24 October 2013
The Burton upon Trent School Planning Study Part 1
Managing demographic growth and increasing education opportunities
The Burton upon Trent School Planning Study Part 1
Managing demographic growth and increasing education opportunities
October 2013
Staffordshire County & East Staffordshire Borough Councils
Cambridge Education, Demeter House, Station Road, Cambridge CB1 2RS, United Kingdom
T +44 (0)1223 463500 F +44 (0)1223 461007 W www.camb-ed.com
Staffordshire County Council Number 1, Staffordshire Place Stafford, ST16 2LP East Staffordshire Borough Council The Maltsters, Wetmore Road Burton upon Trent, DE14 1LS


The Burton upon Trent School Planning Study Part 1 Managing demographic growth and increasing education opportunities
323137/BPI/MBS/P1/D 24 October 2013 323137/PK/PW/TB
Revision Date Originator Checker Approver Description Standard
Part 1-D 26/10/13 PW/PK TB/FG TB
Issue and revision record
This document is issued for the party which commissioned it and for specific purposes connected with the above-captioned project only. It should not be relied upon by any other party or used for any other purpose.
We accept no responsibility for the consequences of this document being relied upon by any other party, or being used for any other purpose, or containing any error or omission which is due to an error or omission in data supplied to us by other parties.
This document contains confidential information and proprietary intellectual property. It should not be shown to other parties without consent from us and from the party which commissioned it.


The Burton upon Trent School Planning Study Part 1 Managing demographic growth and increasing education opportunities
323137/BPI/MBS/P1/D 24 October 2013 323137/PK/PW/TB
Chapter Title Page
Executive Summary i
1 The Brief 1
1.1 Introduction ________________________________________________________________________ 1 1.2 Study Outputs ______________________________________________________________________ 1 1.3 Statutory responsibilities ______________________________________________________________ 3 1.4 Principles of School Planning __________________________________________________________ 6
2 Staffordshire’s Projection Methodology 8
2.1 Overview _________________________________________________________________________ 8 2.2 Staffordshire County Council’s general projections _________________________________________ 8 2.3 School roll projections and forecasts ___________________________________________________ 10 2.4 Review of Methodology _____________________________________________________________ 14
3 Planning school provision in Burton 17
3.1 East Staffordshire and Burton upon Trent: Context ________________________________________ 17 3.2 Schools in East Staffordshire and Burton upon Trent _______________________________________ 17 3.3 School Planning Areas in Burton on Trent _______________________________________________ 18 3.3.1 Primary schools ___________________________________________________________________ 18 3.3.2 Secondary schools _________________________________________________________________ 24 3.3.3 Burton and South Derbyshire College __________________________________________________ 27 3.3.4 Burton and South Derbyshire UTC _____________________________________________________ 27 3.3.5 Special Needs ____________________________________________________________________ 28 3.3.6 Pupil Referral Unit _________________________________________________________________ 28 3.4 Burton primary sector school place planning _____________________________________________ 28 3.4.1 Recent developments _______________________________________________________________ 28 3.4.2 Before 2013 ______________________________________________________________________ 29 3.4.3 Births data _______________________________________________________________________ 30 3.5 Forecast of demand for school places – primary & secondary ________________________________ 31 3.5.1 Primary sector pupil place planning ____________________________________________________ 32 3.5.2 Secondary school pupil place planning _________________________________________________ 38
4 School Infrastructure Assessment 41
4.1 Primary Schools ___________________________________________________________________ 41 4.2 Secondary Schools_________________________________________________________________ 42 4.3 Assessment of Existing Stock ________________________________________________________ 42 4.3.1 Primary Area 1 ____________________________________________________________________ 42 4.3.2 Primary Area 2 ____________________________________________________________________ 43 4.3.3 Primary Area 3 ____________________________________________________________________ 43 4.3.4 Primary Area 4 ____________________________________________________________________ 44 4.3.5 Primary Area 5 ____________________________________________________________________ 44 4.3.6 Secondary schools _________________________________________________________________ 45
Contents
The Burton upon Trent School Planning Study Part 1 Managing demographic growth and increasing education opportunities
323137/BPI/MBS/P1/D 24 October 2013 323137/PK/PW/TB
4.3.7 Special schools ___________________________________________________________________ 46 4.4 Issues for consideration _____________________________________________________________ 46 4.4.1 Optimal school size and the impact on learning outcomes ___________________________________ 46 4.4.2 Multi storey primary schools __________________________________________________________ 48
5 Conclusion 51
5.1 Overview ________________________________________________________________________ 51 5.2 New School Provision_______________________________________________________________ 55 5.3 Summary review of potential school expansion ___________________________________________ 56
The Burton upon Trent School Planning Study Part 1 Managing demographic growth and increasing education opportunities
i 323137/BPI/MBS/P1/D 24 October 2013 323137/PK/PW/TB
Cambridge Education is pleased to submit this report on school place planning in Burton
upon Trent to East Staffordshire Borough Council and Staffordshire County Council
This interim and draft report summarises the data on school roll projections so far
presented and methods used. It presents the education case for increased provision in
Burton upon Trent and in the context of the East Staffordshire Local Plan, and reviews
the school roll projections and forecasting methods used by Staffordshire County
Council.
This study is presented in two Parts:
Part 1: Initial overview outlining planning provision, projected pupil numbers and
potential shortfalls in places
Part 2: Recommendations on school place planning going forward and the associated
delivery and financial implications
Additionally, separate Appendices A to D provide supporting information as follows:
Appendix A: Primary School Data
Appendix B: Secondary School Data
Appendix C: Births and Projected School Place Requirements
Appendix D: Housing Requirements
Executive Summary

The Burton upon Trent School Planning Study Part 1 Managing demographic growth and increasing education opportunities
323137/BPI/MBS/P1/D 24 October 2013 323137/PK/PW/TB
1
1.1 Introduction
The brief for this review outlines the need for an evidence base to
support East Staffordshire Borough Council’s Local Plan on the need
for school places to mitigate the impact of the housing options being
developed by the Borough Council as part of its local planning process.
A high level infrastructure assessment prepared for the Borough
Council to support its preferred option Local Plan Consultation in 2012
noted that education provision is “a difficult strategic issue, particularly
in Burton upon Trent”, though this has so far not proved to be an
“infrastructure showstopper”. However, there are clearly challenges to
be met and a clear and informed view of the implications of each
development option and guidance on the way forward for both
authorities involved and their communities – resident and school.
The brief asked for a review and a report that will add to the evidence
base underpinning the Local Plan and the report produced by an
external body gives another dimension to the evidence base. The
outcome from our review will be a report that gives clear ways forward
under the development options, which may be used in discussion with
developers and those with an interest in schools and infrastructure
development in the Borough, and which will stand up to scrutiny at the
Local Plan examination.
1.2 Study Outputs
The essential requirements of the review, as set out in the brief, are as
follows:
Existing School Infrastructure Capacity – Part 1
Test current infrastructure provision, identifying capacity of existing
school sites to accommodate expansion to allow for a permanent
increase in the Published Admissions Number (PAN1), as a desktop
exercise, but one which requires a thorough understanding of the
expansion of classrooms and of the knock on effect on the school
and its site.
Pupil Projections – Part 1
Investigate and validate the current forecasting method of the way in
1 PAN – Published Admissions Number – the number of children a school is able to admit
each year (typically into YR and Y7), which is a reflection of its capacity.
1 The Brief
…education provision is “a
difficult strategic issue,
particularly in Burton upon
Trent”.

The Burton upon Trent School Planning Study Part 1 Managing demographic growth and increasing education opportunities
323137/BPI/MBS/P1/D 24 October 2013 323137/PK/PW/TB
2
which pupil projections are calculated by the County Council. This
would require a thorough assessment that would also make
reference to the findings of the Strategic Housing Market
Assessment (SHMA):
– Recommend as appropriate any improvements to the current
projection methodology. Apply the recommended methodology
to project future pupil numbers for Burton upon Trent and
provide to the County Council in tabular form showing
projections by academic year and cohort and a breakdown of
the supporting data. Projections should be broken down by area
(as per the cluster areas provided by the County Council).
– Present and, through discussion, agree a finalised projection
methodology with the County Council before moving to the next
stage.
Proposed New Infrastructure Requirements – Part 2
– Having responded to the existing infrastructure capacity and
pupil projections section of the brief, apply the information
collected and agreed methodology to determine on a school by
school basis what requirements are necessary to meet Burton
upon Trent’s education provision, across the Local Plan period
of 2012-31.
– Put forward recommendations for the expansion of existing
schools, new schools and new school sites, to meet the local
need for future education provision arising from population
growth, including new housing.
– A maximum of three alternative growth scenarios will be
presented for assessment and an education provision plan will
be required for each.
Delivery of New Education Infrastructure – Part 2
– Advise East Staffordshire Borough Council on how the local
plan should respond to meeting education need both in terms of
delivering housing allocations to secure education provision and
a policy framework to ensure that existing and proposed new
supply is protected or can deliver future flexibility.
– For each growth scenario, prepare for East Staffordshire
Borough Council an Infrastructure Delivery Plan in relation to
education provision that will support the Local Plan at
The Burton upon Trent School Planning Study Part 1 Managing demographic growth and increasing education opportunities
323137/BPI/MBS/P1/D 24 October 2013 323137/PK/PW/TB
3
examination. The infrastructure plan should as a minimum:
i. Identify where and when that infrastructure may be
required;
ii. Identify land required for additional educational
infrastructure;
iii. Identify the outline costs of such infrastructure;
iv. Provide a delivery plan that incorporates flexibility in the
delivery of sites (should large infrastructure projects not be
forthcoming or if there is uncertainty in delivery); and
v. Provide a funding strategy that takes into consideration the
relevant legislation in relation to developer contributions,
including the limitations of pooling contributions from
Section 106 agreements.
1.3 Statutory responsibilities
Ensuring there are sufficient school places has been a core duty of a
Local Authority; one that has always been a challenge and one that is
even more so in an increasingly complex and challenging school
environment. The Local Authority – in this case the County Council,
formerly known as the Local Education Authority – not only needs to
provide enough places for all the young people it is required to educate,
but also to ensure a good match between the number of young people
and school places to secure good value for money. Getting the stock of
schools and access to them ‘right’ creates the conditions for successful
teaching and learning.
Sections 13 and 14 of the Education Act 1996 refer to the general
responsibility for education:
“A local authority shall (so far as their powers enable them to
do so) contribute towards the spiritual, moral, mental and
physical development of the community by securing that
efficient primary education, secondary education and, in the
case of a local authority in England, further education, are
available to meet the needs of the population of their area.”
(S13)
Section 14 covers the sufficiency of schools, appropriate education and
the local authority exercising these functions in order to secure diversity
in the provision of schools and increasing opportunities for parental
choice.
The Local Authority not only
needs to provide enough
places for all the young
people it is required to
educate, but also to ensure
a good match between the
number of young people
and school places to secure
good value for money.

The Burton upon Trent School Planning Study Part 1 Managing demographic growth and increasing education opportunities
323137/BPI/MBS/P1/D 24 October 2013 323137/PK/PW/TB
4
These duties, however, have been re-defined in the courts as ‘target
duties’:
“..which are therefore almost impossible to enforce by legal
action …since local authorities now have little or no ability to do
anything about them”.2
The reason for this is the growth in the number of academies and their
variants, including free schools, as state funded independent schools,
operating under a contract with the Secretary of State for Education
rather than being ‘maintained’ by the local authority.
The constraints on local authorities in school place planning were
raised in a recent session of the House of Commons Committee of
Public Accounts. They recognised that local authorities can direct
maintained schools to expand or close, depending on fluctuations in
demand, but do not have the power over academies and free schools.
Where local authorities identify a need for a new school, it must seek
proposals to establish an academy/free school.
Local authorities will or ought to have in place procedures for
monitoring the number of children and young people within schools in
the area of the authority and in forecasting the demand for places in the
future. While forecasting school rolls may sometimes be more of an art
than a science, most authorities will have a similar core method of
forecasting or projecting school rolls.
Authorities may differ in the degree of sophistication in their techniques,
in access to and quality of information that supports the process (the
number of births each year, for instance), the range of assumptions that
underpin the projections (eg. housing yield – the numbers of children of
schools age generated by new housing development) and the ways in
which they engage with and inform schools of their analysis. In recent
years, the Audit Commission has given guidance on the methods of
school place planning and the standards of performance that might be
expected (accuracy of forecasts, for instance).
There can be no certainty that what an authority produces will come to
pass; they are after all either ‘projections’ – what the population will be
if the trends assumed continue – or ‘forecasts’ of what might happen,
based on a number of policy assumptions. Planning for school places is
based on probabilities rather than certainties. There are many variables
2D Wolfe, Education Law Journal, May 2013
Where local authorities
identify a need for a new
school, it must seek
proposals to establish an
academy/free school.
There can be no certainty
that what an authority
produces will come to pass.
There are many variables
and uncertainties in any
local area.
The Burton upon Trent School Planning Study Part 1 Managing demographic growth and increasing education opportunities
323137/BPI/MBS/P1/D 24 October 2013 323137/PK/PW/TB
5
and uncertainties in any local area – parental choice, migration etc. –
and we know of a number of authorities who, in recent years, have
been ‘caught out’ by new in-migrants settling and bringing with them or
having children of school age, so that plans to close schools have been
reversed (see, again, the Commons Account Committee report). Local
authorities have to do their best to monitor and review continuously
supply of and demand for places in their areas, think about and
challenge their own assumptions and adjust their forecasts in light of
new information.
East Staffordshire Borough Council, as the local planning authority, is
responsible for producing and maintaining a Local Plan, which provides
the planning policy framework for delivering development and
managing change within the Borough. “It will contain a set of
overarching strategic policies that set out broad principles for guiding
development, supplemented and supported by detailed policies which
will address specific development issues. In order to deliver the level of
pupil growth in the Local Plan, strategic development sites are
allocations are made in [the] Local Plan.3
The Plan is or can be a ‘Vision’ document as well. East Staffordshire’s
plan is very much about: what kind of place do we want to be and how
do we respond to changing demands and circumstances? Constraints
as well as opportunities are recognised. The Spatial Strategy provides
the overall approach to development and growth. It sets out where, in
broad terms, new housing and other land uses are to be delivered,
taking account of these constraints and opportunities, Under the
heading, “Other Infrastructure”, (p47), it reads:
“There is little or no additional transport or education
infrastructure capacity in Burton to accommodate additional
growth. Whilst not an absolute constraint on additional growth,
proposals located within the urban areas are likely to result in
difficulties in terms of finding a site capable of accommodating
additional educational establishments. Development proposals
on greenfield sites will need to address education requirements
as part of infrastructure delivery.”
3ESBC Planning for Change Preferred Option July 2012, p3.
…what kind of place do we
want to be and how do we
respond to changing
demands and
circumstances?

The Burton upon Trent School Planning Study Part 1 Managing demographic growth and increasing education opportunities
323137/BPI/MBS/P1/D 24 October 2013 323137/PK/PW/TB
6
1.4 Principles of School Planning
There are duties and principles that underpin any school planning
exercise; however, as noted in the previous section, the role of the local
authority is changing in this respect:
Under 5s – there are duties to ensure that all parents of three and
four year olds are able to access the minimum free entitlement for
up to two years before their children reach statutory school age and
that sufficient childcare is available under the Early Years free
entitlement. As of September 2013 there is now a statutory duty to
ensure provision for less advantaged two year olds as well as 3 and
4 year olds.
5-16 – there is the core duty to ensure provision for the education of
children from the first term in which they attain the age of five to the
end of the term in which they attain 16 years of age. These are now
in maintained schools or in academies, including free schools.
Nationally, around 7% of children are educated in the independent
(fee paying sector) while a small proportion are home educated.
Special needs – there are duties on schools and local authorities to
meet the needs of children with special educational needs and some
children may be educated in special schools or designated provision
within mainstream schools.
14-19 provision – there is a strategic commissioning role played by
local authorities in the provision of 14-19 education and training
across an area, also ensuring access for young people with learning
difficulties or disabilities, up to age 25. So far as changing provision
or making new provision , local authorities may have:
– policies on schools size – the number of forms of entry
(hereafter referred to as FE) – typically at Reception Year and
Year 7 entry to secondary schools – that are deemed to be
appropriate for particular areas
– the type and structure of schools– two tier (primary and
secondary) or three tier (first, middle and high) and also
whether separate infant and junior schools are maintained, as
opposed to all through primary schools.
PAN numbers – the usual admission number is in multiples of 30, ie.
1 form of entry, eg. a 2.0 FE primary school will admit up to 60

The Burton upon Trent School Planning Study Part 1 Managing demographic growth and increasing education opportunities
323137/BPI/MBS/P1/D 24 October 2013 323137/PK/PW/TB
7
pupils each year into Reception Year. It will have a capacity of 420
(2x30x7 year groups = 420), covering the Reception class and
Years 1-6). In some cases, in some authorities, multiples of a PAN
of 15 are possible. Authorities typically aim for primary schools of
between 1.0 and 5.0 FE; and between 5.0 and 12.0 FE in
secondary, although, given the increase in demand for school
places in many parts of the country, there are now primary schools
with up to 1000 places.
Range of providers – authorities now recognise that there is an
increasing range of school types in an area, and recognise the need
to work with all schools in their area – free schools, academies,
voluntary aided or controlled, foundation and maintained schools.
Assumptions over level of surplus places – there has been
guidance from both the Audit Commission and the Department for
Education (DfE) for some years about the need to get a degree of
surplus places within the school system. In March 2013 the National
Audit Office (NAO) published a document entitled “Capital Funding
for New School Places” which also highlights the need for
authorities to maintain “a surplus of 5% as a bare minimum to allow
authorities to meet their statutory duty with operational flexibility
while enabling parents to have some choice of schools”. Authorities
generally assume at least a 5% surplus of places to give a degree
of flexibility to the system, balanced with the need to ensure
efficiency in the use of resources. A high level of surplus places
(25% or more) in a school is a poor use of resources and is likely to
prompt an intervention.
Initiating changes and consultation – good practice suggests the
need to take a consultative approach to school changes and to
develop options that are based on data that are as sound as
possible. Consideration is also given to the possible effect on the
quality of provision at a school from potential changes, while it is
unlikely that schools that are in difficulty will be subject to expansion
until those difficulties are addressed.
Authorities generally
assume at least a 5%
surplus of places to give a
degree of flexibility to the
system balanced with the
need to ensure efficiency in
the use of resources.
The Burton upon Trent School Planning Study Part 1 Managing demographic growth and increasing education opportunities
323137/BPI/MBS/P1/D 24 October 2013 323137/PK/PW/TB
8
2.1 Overview
Local authorities will or ought to have in place procedures for
monitoring the number of children and young people within schools in
the area of the authority and in forecasting the demand for places in the
future. While forecasting school rolls may sometimes be more of an art
than a science, most authorities will have a similar core method of
forecasting or projecting school rolls. Authorities may differ in the
degree of sophistication in their techniques, in access to and quality of
information that supports the process (the number of births each year,
for instance), the range of assumptions that underpin the projections
(eg. housing yield – the numbers of children of school age generated by
new housing development) and the ways in which they engage with and
inform schools of their analysis.
In recent years, the Audit Commission has given guidance on the ‘how
tos’ of school place planning and the standards of performance that
might be expected (accuracy of forecasts, for instance). An authority
produces either ‘projections’ – what the population will be if the trends
assumed continue – or “forecasts” – what might happen, based on
policy assumptions. Planning for school places is based on probabilities
rather than certainties, with a number of variables (parental choice,
migration etc.) to be taken into account.
2.2 Staffordshire County Council’s general projections
An explanation has been provided on Staffordshire’s projection
methodology. Data sources include:
Primary: Live births, current and historical.
January school census, ie. Pupils on roll at each school, current and
historical (except for projections produced in October for which the
latest October data are used as January data are not yet available).
Secondary: cohort data from January, current and historical, as per
the primary projections and live births.
The key features of Staffordshire’s approach are:
Primary aged projections
A child will start Reception at a primary phase school five academic
years after they are born. For example, a child born in 2008/09
2 Staffordshire’s projection methodology
Local authorities will or
ought to have in place
procedures for monitoring
the number of children and
young people within
schools.
Planning for school places is
based on probabilities rather
than certainties, with a
number of variables
(parental choice, migration
etc.) to be taken into
account.
A link is made between the
number of children born in
an area and the total intake
of each school in the
Reception Year five years
later.

The Burton upon Trent School Planning Study Part 1 Managing demographic growth and increasing education opportunities
323137/BPI/MBS/P1/D 24 October 2013 323137/PK/PW/TB
9
would enter Reception in 2013/14. A percentage is calculated by
comparing the Reception intake to the relevant year’s catchment
births for each intake year, referred to as an uptake factor. An
average of the uptake factor for each of the last four years is
calculated. This is a weighted average using 50% of the uptake from
the last year of actual data, 25% of the year before, 15% of the data
three years previously and lastly 10% of the uptake from four years
ago. This method is preferred over a straight 5-year average to
better allow for more recent trends. For primary schools,
Staffordshire can project for the following four years. This is because
the birth data is not complete until the end of the academic year (31st
August). Therefore only four years of new births are available at any
one time. The weighted average is then applied to the births in order
to project the next four years of reception intakes.
To project beyond this four year period, the same methodology is
used but instead of actual births, projected births are used.
Projected births are the mean average of the last 4 years of births to
ensure that any significant rises or falls do not have an adverse
impact on future projections.
There is recognition of the fluidity of pupil movement in urban areas.
A percentage is also calculated as each year group moves through
the schools. For example the reception intake in 2010/11 became
Year 1 in 2011/12 and a percentage is calculated on the change in
size of the year group. This is referred to as year-on-year cohort
transfer rates. The weighted average is calculated for the last four
year-on-year cohort transfer rates. Each individual weighted average
is assessed and where the trend is expected to continue this is
utilised on the projections for that year group. This allows the
projections to reflect area specific trends, for example Year 2 to
Year 3 transfers in areas that include infant and junior school(s).
Secondary aged projections
The same weighted average methodology used for the primary-aged
projections is applied to the secondary aged figures. Instead of
using births to calculate the intake year, the total number of pupils
attending or projected to be attending primary phase schools for the
year prior to the intake is used. For example, the number of pupils in
Year 6 in 2010/11 would be used to calculate the projected Year 7
pupils in 2011/12. As with the primary projections, a year-on-year
transfer rate is calculated on each cohort and where a trend is
identified and expected to continue this is utilised on the individual

The Burton upon Trent School Planning Study Part 1 Managing demographic growth and increasing education opportunities
323137/BPI/MBS/P1/D 24 October 2013 323137/PK/PW/TB
10
year group projections. For example, if a college were operating in
the area and attracting pupils out of school at Year 10, this would be
reflected in the projections.
As Burton operates a two-tier system, all of the pupils on roll at
schools in each of the primary school clusters in Year 6 have been
used to project the following years’ Year 7 intake.
Sixth form aged projections
The same methodology is used to calculate the sixth form pupils as
for primary and secondary projections. The total number of children
in Year 11 at each secondary school within the area is used to
calculate the Year 12 intake. A year-on-year transfer rate is applied
to calculate the number of Year 13 pupils, as this normally reduces
from the Year 12 pupil numbers.
No account is currently made in the projections for the recent
legislative change that requires pupils to remain in education or
training until at least Year 12 from 2013 onwards, and Year 13 from
2015 onwards. This will be picked up in future years’ projections as
historical data are used and will reflect any change in pupil trends.
2.3 School roll projections and forecasts
Births
Birth data are received monthly from Health Authorities, which for each
child record consists of a birthdate and postcode. Birth data are
imported into a database and matched to a primary phase school
catchment area, based on the postcode.
Births are totalled for an academic year by cluster area and are
compared to the actual reception year intake five years later; this
generates an uptake factor for each comparison. The most recent four
comparisons are used in weighted uptake factor (50%, 25%, 15% then
10%).
Thus, the projections rely on births/Reception intakes. To project
beyond four years, projected births are the average of the last four
years of births. Many local authorities, like Staffordshire, use that trend
analysis between birth numbers and reception entry 4/5 years later. The
Staffordshire model is refined using weighted averages. Such trend
data are less reliable at individual school level than area level.
The Burton upon Trent School Planning Study Part 1 Managing demographic growth and increasing education opportunities
323137/BPI/MBS/P1/D 24 October 2013 323137/PK/PW/TB
11
However, Staffordshire evidence that, for accuracy, earlier intake
projections have been checked against what actually happened.
Projections for the whole of the population and, with births, will reflect
both current or recent birth rates and the changes to the size of the
child bearing population. It is correct to use a good average for birth
projections; it is notoriously difficult to get this right: ONS, DfE and LAs
have all been ‘caught out’ in recent years (See Parliamentary Accounts
Committee report cited earlier). The number of births is the product of
a) the number of women of child bearing age in the population and b)
the rate at which they have children.
Transfers
Within the Staffordshire model, account is taken or is deduced for SEN/
independent schooling/cross boundary flows at primary stage.
Nationally, the percentage attending private schools is around 7%.
Staffordshire have advised that projections can be produced for
individual schools but they have found that in urban areas projections
by cluster give a more accurate reflection of the number of places
required.
Historically, and in the projections, there is an uplift from Y6 to Y7 in the
secondary projections – up to +6%. The difference is anything between
30-60 pupils. We understand this reflects inward movement to Burton
secondary schools from outside the area, part of which is because The
John Taylor Academy and Blessed Robert Sutton Catholic School both
cover a wider area than Burton, including areas outside the
Staffordshire county boundary.
Housing and Housing Yield
In the Staffordshire model, any known housing is totalled and the pupil
numbers that could be generated are calculated using the formula of 3
pupils per year group per 100 houses. The total of sixth form pupils
tends to equate to a single form of entry and so the extra pupils from
housing are divided between Year 12 and Year 13.
Staffordshire’s forecasts are informed by East Staffordshire’s advice of
the expected start of strategic sites and some non-strategic sites across
the area served by the borough. That is set out in ESBC’s ‘Note on 5
year land supply’ (ESBC June 2013). The borough’s approach applies
national guidance (National Planning Policy Framework March 2012) in
assessing the five year housing supply.
Nationally, the percentage
attending private schools is
around 7%.
The Burton upon Trent School Planning Study Part 1 Managing demographic growth and increasing education opportunities
323137/BPI/MBS/P1/D 24 October 2013 323137/PK/PW/TB
12
ESBC’s approach is for complete review, twice a year, of housing data
including site based visits to each of the extant planning permissions to
ensure robustness and accuracy in the data.
The twice yearly review is based on the housing situation as at 31
March and 30 September. Any housing supply figure in the interim will
have to make assumptions about completions in the absence of
monitoring those through site visits. The most recent document sets out
a 5 Year Housing Land Calculation:
This calculation uses the new Housing requirement figure of 11,648
dwellings to be delivered between 2012 and 2031 or 613 dwellings
per year across ESBC’s area.
The calculation reflects the historic under-delivery against RSS
figures 2006 - 2012 so that 1 year (from April 2012 to March 2013)
should be measured against the lower GVA housing requirement.
Under delivery is spread over the remaining plan period.
A buffer of 5% is used to increase housing choice.
The current housing model is shown as Appendix D of this report. The
numbers of housing generated and the expected pupil yield are then
built into the school roll forecasts. Where no expected commencement
date is available, the additional pupils are added to the year group
cohorts in the year corresponding to three years after the planning
permission was approved and then rounded up to the next January.
Housing is phased into the projections across all year groups for the
relevant year and then cumulatively at the Reception year group only
for all following years. This is because the methodology carries any
housing already added in previous years, through all year groups
except the Reception year group (as births are assumed to remain
constant and do not take account of any growth.) The assumptions
underlying the 5 year land supply document on phasing and timing of
development are applied, eg. 40 dwellings on site per year, per
developer.
The 5 year supply document also refers to new housing from ‘windfall’
sites – a total of 1,710 units across the whole district – which are not
factored into the school roll forecast. The expected number of new
dwellings from each of the developments is included in the school roll
projections, so far as they apply to the Burton area. These are
principally the 6,473 units on brown field and green field sites in Burton
and a share from the wider area, including existing or pending
permissions, plus a further allocation of new housing to each of the
primary clusters or planning areas.

The Burton upon Trent School Planning Study Part 1 Managing demographic growth and increasing education opportunities
323137/BPI/MBS/P1/D 24 October 2013 323137/PK/PW/TB
13
The planned new housing at Drakelow, in neighbouring South
Derbyshire, is also taken into account in the secondary age forecasts. It
is expected that new housing there will produce an additional 2.0 FE of
secondary pupils in the east of Burton. Primary school forecasts do not
include the Drakelow development. This is because the Section 106
Agreement states the development must deliver a new primary school
within the development site. However, depending on when the new
school is delivered, the size of the school and the rate at which
dwellings are occupied, Burton primary schools may see increased
demand for places which has not been factored into the forecasts.
Pupil yield
Department for Education (DfE) guidance says that authorities need to
take account of housing yield in planning provision, but the rates of
pupil yield from new housing are best informed by local knowledge and
intelligence.
In our experience, authorities often assume a yield factor of around 30
per 100 houses for primary age children (ie. YR-Y6). There may be a
risk of double counting if new housing attracts existing residents and
children are already in the system (however, new families may move
into the existing housing) or, again, if children from completed housing
are already counted, but it is largely down to local authorities to take a
view locally on what is the most sensible set of assumptions.
One authority, Cambridgeshire, uses general multipliers for housing
development. For 100 dwellings:
– 18-25 pre-school age children
– 25-35 primary aged children
– 18-25 secondary aged children
In Surrey, Council officers have advised that they use the Oxford model
of housing yield (0.25 primary pupils and 0.18 secondary pupils per
dwelling), though they, like a number of other authorities, are finding
there are higher yields from new dwellings, including flats, compared
with the past.
Hertfordshire use 0.251 for primary and 0.130 secondary pupils per
dwelling (251 primary pupils per 1,000 dwellings; 130 secondary pupils
per 1,000 dwellings where the number of bedrooms per dwelling is
unknown, with a more refined set of yield factors where the number of
bedrooms is known.

The Burton upon Trent School Planning Study Part 1 Managing demographic growth and increasing education opportunities
323137/BPI/MBS/P1/D 24 October 2013 323137/PK/PW/TB
14
Of course timing is critical as well. The Staffordshire model makes clear
its assumptions about the supply of new housing over the planning
period, which are based on the information provided by East
Staffordshire Borough Council. Clearly those sort of assumptions need
to be kept under review. Staffordshire have obtained information on
child yield from new housing in the county. It would be worth applying
that information to the Burton upon Trent housing scenario and also
refining the child yield model to Burton once there is better information
on the types and mix of housing in the Local Plan.
Staffordshire’s use of 0.3 pupils per dwelling is similar to that of other
authorities. It is probably on the conservative side, particularly for
forecasts of pupils of primary age generated from new housing. Nor
does it take account, in the current exercise, of potential differences in
housing type and the number of bedrooms. But, as we have shown in
this report, the assumption is adequate for the practical purpose in
hand.
Some authorities only take into account housing schemes that are
completed, under construction or where planning permission has been
given. Clearly, this does not apply to most of the proposed development
in East Staffordshire. When there is better information on the likely
housing mix in each of the proposed developments in East
Staffordshire, then a more refined set of forecasts of pupil yield can be
produced.
2.4 Review of Methodology
We have reviewed Staffordshire’s approach to school place planning
with them in this review. They have supplied us with information about
their methods and the detailed forecasts for all primary and secondary
schools in the county. While recognising the limits to any school roll
forecasting exercise (for reasons given above), the approach in the
county is as accurate as possible, based on the information available to
them, for the following reasons:
forecasts are produced for primary and secondary schools in local
Education Planning areas. The forecasts for primary schools are for
four years ahead; those for secondary schools are for 11 years
ahead. To project beyond this, (as the children are not yet born)
Staffordshire use an average of the four previous years’ births in
future projections (some LAs use a single previous year, which can
lead to an overestimate if there is a ‘spike’ in the number of births);
Staffordshire’s use of 0.3
pupils per dwelling is similar
to that of other authorities.

The Burton upon Trent School Planning Study Part 1 Managing demographic growth and increasing education opportunities
323137/BPI/MBS/P1/D 24 October 2013 323137/PK/PW/TB
15
the forecasts are both reviewed and produced every 6 months
(rather than just annually); this is at significant points in the
academic year, ie. October and January when the school census is
carried out;
there is limited information on the number of children age 0-5 in local
areas. Some local authorities get these from GP registrations and
these are consequently quite accurate. One area for development in
Staffordshire may be to explore the scope for obtaining and applying
data on the numbers of children aged from 0 - 5, ie. pre-school age
population;
the core of the methodology is the number of children on roll taken
from the schools’ census (PLASC data), as it is in all authorities.
Staffordshire take account of transfer rates and cohort survival using
weighted four-year averages (again, good practice) in producing
their forecasts. There is evidence of much detailed work on transfer
rates from local primary to secondary schools that gives greater
confidence in the resulting projections;
the assumptions that are used by Staffordshire to determine the
pupil yield from new housing are discussed above. The forecasting
data factor in pupil yield from new housing and are central to the
present review. Staffordshire use a straightforward 3 pupils per age
group for each 100 dwellings which, particularly as a contribution to
a Local Plan document, seems to be adequate for that purpose
the projections rest in a number of spread sheet models that have
been developed in-house by the School Organisation Team or their
colleagues. There can be risks in maintaining these models in
house. Sometimes, there may be only one or two individuals who
know how they work and what assumptions are contained within
them. The spread sheets can become complex and difficult to use
and there may also be issues in the way that source data and
projection outputs are stored. This is not an issue for Staffordshire
as they have detailed procedure documents which fully outline how
the spread sheet model works, how it should be updated annually
and how to correct any problems. These have been written with the
intention that anyone new to the team, with basic spread sheet
skills, could follow the procedures;
some local authorities are either investigating or have secured
externally produced applications, which it is hoped will be more
secure, reliable and easier to use than the in-house models that
have previously been developed. However, this is very new
technology and will require further testing and reviewing before any
One area for development in
Staffordshire may be to
explore the scope for
obtaining and applying data
on the numbers of children
aged from 0 – 5.

The Burton upon Trent School Planning Study Part 1 Managing demographic growth and increasing education opportunities
323137/BPI/MBS/P1/D 24 October 2013 323137/PK/PW/TB
16
firm conclusions can be drawn. There are a small number of
external providers in this specialist area of demographic modelling.
The data that are used in this Education Case for Burton upon Trent
and East Staffordshire are Staffordshire County Council’s own forecast
data, which we have carefully assessed. We agree with their
methodology, although we caveat the forecasting of pupil yield based
on housing that is predicted to be built far into the future. Across the
country, housing programmes have been postponed for years or
decades, so we need to be clear – as indeed the county are – of the
difference between new housing that has been completed or for which
approval has been given and what is a target figure for new housing
within the Local Plan.

The Burton upon Trent School Planning Study Part 1 Managing demographic growth and increasing education opportunities
323137/BPI/MBS/P1/D 24 October 2013 323137/PK/PW/TB
17
3.1 East Staffordshire and Burton upon Trent: Context
East Staffordshire had a population of 113,600 on Census night, 2011.
It is the third largest local authority in Staffordshire, with a total
population of 848,500. The population of East Staffordshire grew by
9.5% – the highest growth rate in Staffordshire – in the 10 years since
the 2001 Census, when its population was 103,770. The mid 2009
population estimate was 108,600. There was an increase in all age
groups between 2001 and 2011, with the exceptions of those aged 5-14
(ie. including those of statutory school age) and those aged 30-39-
typically the age group who are parents of young children.
A briefing report on the Census by the Borough Council4 noted that the
percentage of the population aged 65 and over was the highest seen in
any census at 16.4% in England & Wales and that East Staffordshire
was on a par with that at 16.8% of the population being over 65: “across
Staffordshire generally, the population is ageing”. The report also noted
the increase of 15.9% in neighbouring South Derbyshire in the 10 years
between the Censuses. While there may be a larger number of older
people in the population, the proportion of under-5s had increased
since 2001, with 7,000 in 2011, an 11% increase on 2001. So, an
ageing population doesn’t necessarily imply a decrease in the demand
for school places.
The sub-national population projections for East Staffordshire (ONS
Interim 2011 based, September 2012) for the period 2011 to 2021 show
projections of what the population will be if the trends assumed
continue (ie. without the effect of policy changes like new housing).
These project an increase in the number of 0-4 year olds from 7,008 in
2011 to just under 8,000 (7,936) in 2021 – a 13% increase, although in
one year (2016) it is projected to be over 8,200 (+17% on 2011).
3.2 Schools in East Staffordshire and Burton upon Trent
There are 56 state funded schools in the area served by East
Staffordshire Borough Council. There are 32 schools in the Burton upon
Trent area5 providing for primary age children, 24 of which are all-
through primaries for children aged 3 or 4 to 11; the other eight are
Infants and Junior Schools (4 Infant and 4 Junior). Ten are
denominational (Voluntary Aided or Voluntary Controlled), while four
42011 Census: Population and household estimates for East Staffordshire, prepared by
East Staffordshire Borough Council. 5 Please refer to Appendix A for a map detailing the specific areas
3 Planning school provision in Burton
The population of East
Staffordshire grew by 9.5%
– the highest growth rate in
Staffordshire – in the 10
years since the 2001
Census.
The proportion of under-5s
had increased since 2001,
with 7,000 in 2011, an 11%
increase on 2001.

The Burton upon Trent School Planning Study Part 1 Managing demographic growth and increasing education opportunities
323137/BPI/MBS/P1/D 24 October 2013 323137/PK/PW/TB
18
are academies. Within the Burton upon Trent area, there are six 11-18
secondary schools, one of which is denominational while two others are
academies.
At January 2013 there were 13,997 pupils in the state funded schools in
Burton upon Trent. In addition to pre-school provision, there are just
over 7,600 pupils in primary age schools (Year Reception to Year 6);
just under 5,300 in secondary schools (Years 7 to 11) with 1,100 in
sixth forms in the town.
Within the Uttoxeter area of East Staffordshire, and in contrast to
Burton upon Trent, there is a three tier system with 13 first schools, one
denominational primary school, three middle schools and one high
school. There is also a 14-19 Academy (JCB Academy), which draws
students in part from the areas served by East Staffordshire Borough.
There are other cross boundary flows with Lichfield/South Staffordshire
and South Derbyshire and East Staffordshire Borough. These are taken
into account in this review.
However, this report is specifically focused on planning school provision
in Burton on Trent.
3.3 School Planning Areas in Burton on Trent
In this section, we look at current provision and recent school
development in Burton on Trent.
3.3.1 Primary schools
There are five primary clusters that are used as local planning areas in
Burton on Trent6. Staffordshire County Council group schools into
cluster areas based on geographical location and pupil mobility. These
are referred to by the County Council as Basic Need Clusters. Within
Clusters 1, 2 and 3, it is understood that there is some interaction
between the schools in terms of pupil movement. Burton 4 is a cluster
of schools in the area surrounding Burton, but where there is not
necessarily the same degree of interaction as in the town. Richard
Crosse CE (VA) Primary School is placed in its own ‘cluster’ as it is
somewhat removed from Burton, being located in Kings Bromley.
As at January 2013, there were 7,608 pupils on roll in Burton primary
schools against a capacity of 7,745 Reception Class (YR) to Year 6
6 Refer to Appendix A for area location maps
At January 2013 there were
13,997 pupils in the state
funded schools in Burton
upon Trent.
As at January 2013, there
were 7,608 pupils on roll
against a capacity of what of
7,745 Reception Class to
Year 6 places.

The Burton upon Trent School Planning Study Part 1 Managing demographic growth and increasing education opportunities
323137/BPI/MBS/P1/D 24 October 2013 323137/PK/PW/TB
19
places, giving an overall net surplus of only 137 places across Burton
(or 1.8%).
New provision has been added from September 2013 in a new primary
academy (Scientia Academy, phased in provision), enlargement and
change of age range at Christchurch Primary School (formerly an Infant
School) and enlargement and relocation of St Modwen’s Catholic
Primary School. This has increased the total primary net capacity to
8,570 places across Burton.
In addition, a further proposal to enlarge River View Primary School will
increase provision further to a total capacity of 8,660 places by
September 2014. The combined PAN (Published Admission Number)
for Burton primary schools from September 2014 – the number of
places available for Reception age children will be 1,246.
The total capacity figure of 8,660 is used as the base when we forecast
the number of primary age pupils on roll over the planning period up to
2030/31 and the consequent demand for additional school places.
Early indications are that pupil numbers for academic year 2013/14 are
in the region of 7,855, a net increase of 250 or 3% on the previous year,
indicating a surplus of 715 places or 8% against the current capacity of
8,570 places.
The additional school places required to accommodate the larger
cohorts seen in recent years have been provided by adding physical
capacity across the whole school(s). This provides 8,570 (to increase to
8,660) total school places which will fill over time in line with the larger
reception intakes moving through the school. In the short term, any
projected surplus shown is due to junior aged year groups not being full
to the increased capacity; however infant aged groups will be at
capacity and as these larger infant aged year groups work through the
school, any surplus will be exhausted by children already living in the
area.
Furthermore, the total additional places currently being provided have
been noted in Table 2.1 below; in all cases, the additional pupils on roll
at the schools will grow year on year until the maximum capacity of
8,660 in the Burton area is reached.

The Burton upon Trent School Planning Study Part 1 Managing demographic growth and increasing education opportunities
323137/BPI/MBS/P1/D 24 October 2013 323137/PK/PW/TB
20
Table 3.1: Burton Primary Schools Summary – Capacity available from 2014 onwards
Indicative
NOR/Jan 14
2014/15 PAN
Reception places Net Capacity
Surplus/Deficit Nos %
7,855 1,246 8,570 (8,660) 715/8%
We now look at each Primary Basic Need area in turn, using the 2013
pupil numbers as the basis. Appendix A shows a map of each area and
gives information for each school in the cluster. This uses the increased
capacity figures (8,660 total) and the January 2013 School Census for
the numbers on roll (7,608).
The published admission number (or PAN) is the number of pupils in
each year group that the admission authority has agreed will be
admitted and is determined annually. The PAN is retained for the
relevant year’s intake as it moves through the school. For example,
River View Primary PAN for the 2010/11 Reception intake was 45. In
2014/15 this cohort will be in Year 4; although the PAN for the reception
intake in 2014/15 will increase to 60, the PAN for Year 4 will still be 45.
However there will be the physical capacity for the school to take up to
60 pupils in all year groups.
The net capacity is calculated using a national formula based on the
size of classrooms and common areas that determines the maximum
number of work places available in a school. The only exceptions to this
are academies, which have a funding agreement with the Secretary of
State, and their net capacity is the number of funded places, as stated
in the agreement.
Area 1 – is in the north of the town of Burton and has 14 schools with a
combined total of 3,409 pupils on roll at January 2013. With the
additional places provided from September 2013 onwards, there is now
a combined PAN of 574 (ie. the number of places available for
Reception age children in September 2013), and a total capacity/funded
places of 4,028. Based on indicative pupil numbers for January 2014
(3,554) and taking into account the additional capacity provided across
the whole school stock, there is a notional surplus projected of 474
places or 11.7%. However, as stated above, the majority of this surplus
is in the junior aged year groups. Without the additional places that
have been recently provided, there would be an overall shortage in
Area 1 of 156 places (6%).

The Burton upon Trent School Planning Study Part 1 Managing demographic growth and increasing education opportunities
323137/BPI/MBS/P1/D 24 October 2013 323137/PK/PW/TB
21
The full potential capacity of Scientia Academy of 420 places is
included in the table and the forecasts of demand. As of September
2013, the capacity is 120, as this is the total number of places on offer
across Reception, Year 1 and Year 2, which will be increased year on
year due to a new Reception intake and as the number of cohorts grow.
Only one school in Area 1 (Belvedere Junior School) had surplus
places to any significant degree, as at January 2013. However,
indicative pupil numbers for January 2014 show this has reduced
significantly. The projections indicate that the surplus will continue to
reduce as smaller cohorts leave the school and larger Year 3 cohorts
are admitted. All schools in this area are projected to be full for the
foreseeable future.
Table 3.2: Area 1 Primary Schools
Scientia Academy
Grange Community School*
Horninglow Primary School
Shobnall Primary School
Lansdowne Infants School
Victoria Community School
The Mosley Academy
William Shrewsbury Primary School
John of Rolleston Primary School
Holy Trinity CE (C) Primary School
Outwoods Primary School
Belvedere Junior School
Eton Park Junior School
St. Modwen's Catholic Primary School
*Grange Community School is an infant school
Area 2 – primarily covers the Branston area, with three schools with a
combined total of 1,220 pupils on roll at January 2013.
There is a combined PAN in Area 2 of 197. Christchurch Primary
School was enlarged and had a change of age range from an infant
school to a primary school in September 2013. The additional capacity
provided in this area increased total net capacity/funded places to 1,323
from September 2013.

The Burton upon Trent School Planning Study Part 1 Managing demographic growth and increasing education opportunities
323137/BPI/MBS/P1/D 24 October 2013 323137/PK/PW/TB
22
The indicative January 2014 pupil numbers on roll in Area 2 is 1,280.
This is an increase of 60 pupils on January 2013 pupil numbers (almost
5%) so there is a projected notional surplus of 43 places (3%).
Recent advice from the Department for Education (DfE) is that the
places that are funded as academies must be treated as the net
capacity from now on. In this case, the capacity of Anglesey Primary
Academy is 539, rather than the previous net capacity figure of 639
places (which included a temporary increase in capacity to
accommodate higher pupil numbers in the short term whilst permanent
additional provision was being provided at Christchurch Primary). The
PAN indicates a total capacity of 595 places.
The pupil numbers on roll at Christchurch Primary school will increase
year on year until the total capacity of the school has been reached,
and has pupils in each year group.
Table 3.3 Area 2 Primary Schools
Christchurch Primary School
Rykneld Primary School
Anglesey Primary Academy
Area 3 – is to the south east of the town, east of the river, with three
schools. As at January 2013 there was a combined PAN of 135,
capacity/funded places of 960, and 890 pupils on roll.
Indicative pupil numbers of 907 for January 2014 indicate that there will
be around 53 surplus places (5.5%).
Proposals are being implemented to enlarge River View Primary School
from September 2014, to accommodate the significant rise in the
number of children being born and living in this area. This will increase
the net capacity in the area to 1,050 places (the capacity figure used in
the forecasts of demand).
Table 3.4: Area 3 Primary Schools
The Violet Way Academy
River View Primary and Nursery School
Edge Hill Junior School
Area 4 – is the geographically large rural area to the west of the town,
with eight schools and with a combined total of 1,264 pupils on roll as at

The Burton upon Trent School Planning Study Part 1 Managing demographic growth and increasing education opportunities
323137/BPI/MBS/P1/D 24 October 2013 323137/PK/PW/TB
23
January 2013. The schools are generally dispersed with most being
distinct village schools.
This is against a net capacity of 1,344 places, so, as at January 2013,
there were 80 surplus places overall (6%) with a combined PAN of 190.
Two schools can be classed as small schools (fewer than 100 on roll):
Mary Howard CE Primary and Needwood CE (VA) Primary School.
Table 3.5: Area 4 Primary Schools
Thomas Russell Infants School
All Saints CE (C) Primary School, Rangemore
St Peter's CE (C) Primary School
Needwood CE (A) Primary School
All Saints CE (C) Primary School
Mary Howard CE (C) Primary School
Thomas Russell Junior School
Richard Wakefield CE (VC) Primary School
Area 5 – is the area to the east of the town centre and the river. There
are three schools with a combined total of 709 pupils on roll as at
January 2013. This is against a net capacity of 810, so there are 101
surplus places (12.5%), with a combined PAN of 120.
Indicative pupil numbers for January 2014 indicate that surplus will
reduce to 76 places (9.4%) and is projected to continue to reduce as
the smaller cohorts leaving the schools are replaced by larger reception
cohorts.
Table 3.6: Area 5 Primary Schools
Tower View Primary
Winshill Village Primary
Holy Rosary Catholic Primary
There is also Richard Crosse CE VA Primary School, a rural school
outside the local planning areas, with 116 on roll at January 2013,
against a capacity of 105, so it is in excess of its net capacity (10%)7.
A number of the maintained and academy schools are shown as having
nurseries.
7 Refer to Appendix A for primary school location maps

The Burton upon Trent School Planning Study Part 1 Managing demographic growth and increasing education opportunities
323137/BPI/MBS/P1/D 24 October 2013 323137/PK/PW/TB
24
3.3.2 Secondary schools
Burton has six secondary schools with five high school catchment areas
and a Catholic secondary, which serves a wider area across all the
catchment areas as well as outside of the Staffordshire County Council
boundary. There is some, but not complete, correspondence between
the primary clusters and the secondary school catchment areas. There
is detailed information on transfer rates between local primary and
secondary schools, which suggests that the five non-denominational
schools predominantly serve their local communities, drawing as they
do largely from within their catchment areas.8
The secondary schools are profiled below. All six are mixed, with an
age range of 11-18/19. In summary:
Table 3.7: Secondary Schools Summary
School Name January
2013 NOR 2014/15 PAN
Net Capacity/ (Funded)
Paulet High School 710 130 749
Paget High School 914 169 1021
John Taylor Academy 1478 224 ~1417
The de Ferrers Academy 1861 350 *2093
Abbot Beyne School 717 150 1169
Blessed Robert Sutton Catholic HS
706 124 710
Total 6386 1147 7159 (/7399)
Notes: ~ JTA funded places of 1800, of which 600 are post 16; * de Ferrers funded places
of 1950
The profiles for each school are shown below:
Table 3.8: Abbot Beyne High School
Total NOR 717
Net capacity 1169
Y7 PAN 150
Forms of entry 5.0
Abbot Beyne High School is located east of the river. The school’s
catchment area is shown as serving the north east of the town. It
8 Refer to Appendix B for secondary school catchment areas

The Burton upon Trent School Planning Study Part 1 Managing demographic growth and increasing education opportunities
323137/BPI/MBS/P1/D 24 October 2013 323137/PK/PW/TB
25
currently has surplus places. However, its PAN was increased between
2013/14 and 2014/15 from 130 to 150 in anticipation of growing
demand.
Blessed Robert Sutton Catholic High School is located in the south east
of the town and east of the river. As a Catholic High School, it serves
pupils and students from a wider area than a locally determined
catchment area, including areas outside of the Staffordshire County
Council Boundary. Blessed Robert Sutton High School currently has
less than 1% surplus.
Table 3.10: John Taylor Academy
Total NOR 1478
Total funded places 1800
Y7 PAN 224
Forms of entry 7.5
John Taylor Academy is located to the south of Burton, in Barton under
Needwood. It has a catchment area that covers the rural area to the
west and south of Burton, and also covers an area which falls into the
Derbyshire County Council boundary. As this school is an academy, it
is directly funded by the Education Funding Agency for 1,800 places, of
which 600 are funded for post 16. There are some differences in the
physical capacity of the school calculated by the County Council using
the net capacity process (1,417) and the number of places funded by
the EFA (1800) and consequently differences in the assessment of the
level of surplus places, if any. However, the school was full to, or over,
the current PAN of 224 in every year group in January 2013.
Table 3.11: Paget High School
Total NOR 914
Net capacity 1021
Y7 PAN 169
Forms of entry 5.6
Table 3.9: Blessed Robert Sutton Catholic High School
Total NOR 706
Net capacity 710
Y7 PAN 124
Forms of entry 4.1

The Burton upon Trent School Planning Study Part 1 Managing demographic growth and increasing education opportunities
323137/BPI/MBS/P1/D 24 October 2013 323137/PK/PW/TB
26
Paget High School is located in Branston, to the west of the river. There
is limited spare capacity.
Table 3.12: Paulet High School
Total NOR 710
Net capacity 749
Y7 PAN 130
Forms of entry 4.3
Paulet High School is located in the south east of Burton to the east of
the river. Stapenhill Post-16 Centre is located on the school’s campus.
There are currently limited surplus places.
Table 3.13: The de Ferrers Academy
Total NOR 1861
Funded places 1950
Y7 PAN 350
Forms of entry 11.6
The de Ferrers Academy is situated in the north of Burton, operating on
two sites, with a catchment area that serves the north of the town,
Rolleston and Tutbury. As this school is an academy, it is directly
funded by the Education Funding Agency for 1,950 places, of which
325 are funded for post 16. There are some differences in the physical
capacity of the school calculated by the County Council using the net
capacity process (2,093) and the number of places funded by the EFA
(1,950) and consequently differences in the assessment of the level of
surplus places, if any.
The PAN was increased by 25 between 2013/14 and 2014/15 from 325
to 350. Consequently, the net capacity has increased from that, based
on a PAN of 325, which would be 2,017, to a net capacity based on the
PAN of 350 which is 2,093. This has only recently been determined and
therefore any apparent surplus will be exhausted as the smaller cohorts
leaving the school are replaced with larger Year 7 cohorts.
In summary there is a combined total of 6,386 pupils on roll (as at
January 2013) with a net capacity of 3,649 in maintained schools and a
further 3,750 funded places in academies, totalling 7,399 places.
However the physical capacity at the schools based on the net capacity
formula and PAN is 7,159 places. There was a combined PAN for Year
7 of 1,102 for 2013 compared to 1,046 Year 7 pupils on roll, 5%
The Burton upon Trent School Planning Study Part 1 Managing demographic growth and increasing education opportunities
323137/BPI/MBS/P1/D 24 October 2013 323137/PK/PW/TB
27
surplus. The PAN has increased to 1,147 for September 2014 onwards
in anticipation of growing demand.
Five schools have defined catchment areas. The significance of
catchment areas becomes clear if a school is oversubscribed, that is, if
there are more applications for places than there are places in their
Year 7 intake. In this event, some priority may be given to pupils who
are resident in those areas. Parents can express a preference for a
place at a school in another area and, if it is a maintained school or
academy, the school is obliged to admit the child, in line with the
school’s admission criteria.
The County Council have analysed the residing address and
destination of pupils attending secondary schools. This shows, not
surprisingly, that the bulk of children attend the schools in whose
catchment area they live in Burton.
Analyses indicate that the County have good quality data.
3.3.3 Burton and South Derbyshire College
Mention should also be made of the Burton & South Derbyshire College
campus in the centre of Burton upon Trent as a provider of academic
and vocational education post 16 (‘16-99’). There are a reported 2,645
students aged 16-18 at the college, a much larger number than the total
at the schools’ sixth forms.
Pupils attending the college (now and future) are not included in
Staffordshire’s projection methodology as the forecasts only project the
number of school places required.
3.3.4 Burton and South Derbyshire UTC
Approval has been granted to pre-opening stage for Burton and South
Derbyshire UTC, which will be located in Burton on Trent. The UTC will
offer places to 14 to 19 year olds and will specialise in Biomedical
Science and Engineering. It is proposed that the UTC will open in 2015,
initially offering 120 Year 10 places and 145 Year 12 places, with this
increasing year on year to full capacity of 600 pupils by 2018.
It is expected that the UTC is likely to attract pupils from a wider area
than just Burton, or East Staffordshire, as is the case for the JCB

The Burton upon Trent School Planning Study Part 1 Managing demographic growth and increasing education opportunities
323137/BPI/MBS/P1/D 24 October 2013 323137/PK/PW/TB
28
Academy, which also offers 14 to 19 provision and is located in
Uttoxeter.
3.3.5 Special Needs
Fountains Primary School and High School are co-located special
schools catering for 2 – 19 year olds, with 90 places in the primary
phase (with some nursery provision) and 130 in the High School9. An
additional pressure for the school is its net importing from other
counties, especially Derby, because of the proximity of the border.
Additionally, a local Derby Special School has gone into a category and
this has also increased demand on Fountains.
Both Fountains Primary and High School sites are constrained so that
expansion would not be feasible on either site.
3.3.6 Pupil Referral Unit
There is also the Burton PRU with 17 pupils on roll aged 11-16. It is
difficult to predict around exclusions and numbers of students who may
attend a PRU for other reasons. It has been around 90 students per
year for a number of years now, not all of whom have been excluded.
The Council is able to increase capacity temporarily at a PRU as a
number of offsite provisions can be utilised and in Burton there is more
than one base.
3.4 Burton primary sector school place planning
3.4.1 Recent developments
In the previous section, we referred to the increase in capacity of
primary schools in Burton. The County Council are pursuing a strategy
to increase the number of primary school places in Burton by around
1,000 over a ten year period from 2011. This is explained in terms of
the increase in the number of births locally in the past few years. The
existing stock of schools coped up to the academic year 2012 by
utilising existing accommodation to provide temporary increases in
capacity. More permanent spaces were planned from September 2013
and have now been implemented. Three proposals have been
9Planned and actual numbers as of July 2013

The Burton upon Trent School Planning Study Part 1 Managing demographic growth and increasing education opportunities
323137/BPI/MBS/P1/D 24 October 2013 323137/PK/PW/TB
29
implemented by the County Council and the most recent primary
projections have updated PANs:
Table 3.14: Recent Primary School proposals
School Revised PAN Additional
places provided
Scientia Academy (Area 1) 60 420
St Modwen’s (Area 1) 60 210
Christchurch Primary School (Area 2)
45 195
The implemented proposals have relocated St Modwen’s Catholic
Primary school to a new, larger 420 place school off Tutbury Road; built
a new 420 place primary academy at Belvedere Park (now Scientia
Academy); and increased the age range and capacity at Christchurch
Primary School (formerly an infants’ school) providing an additional 195
places.
There is also a proposal to enlarge River View Primary and Nursery
School by 105 permanent places from September 2014 (Area 3). The
school has a current PAN of 45 and a net capacity of 330, which
includes a temporary increase in capacity to accommodate higher pupil
numbers over the last two years. The proposals will increase the PAN
to 60 and the net capacity to 420.
3.4.2 Before 2013
A number of temporary actions were undertaken to accommodate the
increased pupil numbers in Burton in the short term while additional
permanent places were being provided. A number of schools provided
temporary places in 2011/12 and 2012/13. For September 2011, 50
additional Reception places were offered (20 at Victoria Primary and 30
at Outwoods Primary School). Further, an additional 70 places were
provided at Outwoods Primary School (30 places), St Modwen’s
Catholic Primary (30 places) and Victoria Community School (10
places), in excess of the PAN for Reception intakes in September 2012.
River View Primary School admitted up to 15 pupils in excess of its
PAN for the Reception intake in September 2012 and an additional 15
places were also offered for the Reception intake in September 2013.
Consequently, a number of significant actions have been taken.
However, it is recognised that there is no real further capacity in the

The Burton upon Trent School Planning Study Part 1 Managing demographic growth and increasing education opportunities
323137/BPI/MBS/P1/D 24 October 2013 323137/PK/PW/TB
30
area to accommodate short term increases in capacity on current
school sites. This report later discusses that there is also extremely
limited potential to expand existing schools to accommodate further
permanent growth in the demand for school places in the light of
further, significant housing development.
3.4.3 Births data10
A table showing Burton births for Reception intakes 2007/08 to 2016/17
for each school in the five planning/cluster areas is summarised in
Appendix C.
A child born in 2002/03 would be of Reception age in 2007/08. The
tables below compare the number of children born in an area to the
number of children in the Reception intake in schools in that area 5
years later (the 13/14 and 14/15 intakes shown in the table below are
projections):
Area 1 is shown as an example:
Table 3.15: Area 1 Births & Projected Intake
Birth Yr 00/01 01/02 02/03 03/04 04/05 05/06 06/07 07/08 08/09 09/10
Births 435 439 402 439 451 441 495 501 559 540
Intake Yr
05/06 06/07 07/08 08/09 09/10 10/11 11/12 12/13 13/14 14/15
Intakes 456 457 447 481 489 478 539 545 609 588
This shows an increase in the births of 105 or nearly 24% over the last
10 years, resulting in a projected increase in the reception intake of
intake of 132 or nearly 30%.
We can also look at the increase in the intake across Burton upon Trent
and the short – medium term projection:
Table 3.16: Total (inc. Richard Crosse VA Primary School)
Intake Year
07/08 08/09 09/10 10/11 11/12 12/13 13/14 14/15 15/16 16/17
Number 991 1081 1034 1051 1166 1181 1228 1190 1179 1238
10 Please refer to the note on Birth data and its purpose in planning school places in the
section on Methods.

The Burton upon Trent School Planning Study Part 1 Managing demographic growth and increasing education opportunities
323137/BPI/MBS/P1/D 24 October 2013 323137/PK/PW/TB
31
Thus, there is a projected increase in the number of Reception Year
pupils in Burton over a 10 year period of nearly 25% (+247). That is
without taking account of the significant increase in the housing stock
that is forecast from the Local Plan.
3.5 Forecast of demand for school places – primary &
secondary
A forecast of the demand for school places in primary and secondary
sectors can be produced, based on what is known about the numbers
on roll now and into the future, and also taking account of the planned
increase in the housing stock in East Staffordshire, specifically in
Burton upon Trent.
As things are, and as seen, there are pressures on school places in the
primary sector as a consequence of the increase in the number of births
and the number of under 5s in the area. Similar pressure is occurring
on the secondary sector as the higher pupil numbers that have been
seen at reception intake of the last few years, an earlier ‘pupil wave’,
will be seen from 2015/16.
The County Council’s methodology and spread sheet based model
projects the numbers on roll in Burton schools and also forecasts the
demand for school places. To project demand for places factoring in
new housing developments, the number of new dwellings planned and
the timing of their release in the Burton area is taken into account. The
model uses the best and most up to date information on the number of
children in the area and the latest information from the Borough Council
on the numbers, trajectory and location of new dwellings over the
planning period 2012-2030.
A summary of the output from the Staffordshire primary projection and
forecast and the secondary projection and forecast is shown in
Appendix C.
The model shows the current capacity of schools (it takes account of
the recent and planned increases in primary schools in Burton too), and
the projected and forecast numbers on roll up to 2030, with or without
new housing included. The consequent supply or shortage of places is
also expressed in terms of the number of forms of entry potentially
needed for both sectors. The focus is on forms of entry of school places
rather than ‘new schools’ needed, as growth may be achieved by

The Burton upon Trent School Planning Study Part 1 Managing demographic growth and increasing education opportunities
323137/BPI/MBS/P1/D 24 October 2013 323137/PK/PW/TB
32
expanding existing schools, new schools or a combination of the two.
This will be considered in Part 2 of this report.
The predicted need is expressed mainly in terms of forms of entry to
schools (FE). 1 form of entry = 30 pupils per school year. It is a
convenient way of expressing the demand for school places. A two
forms of entry primary school will have 420 places (60 pupil places a
year over 7 years, Reception to Year 6 = 420). An 8.0 FE secondary
school for students aged 11-16 will have a capacity of 1,200 (8 x 30 x 5
years, Year 7 to 11 = 1,200) plus post-16 pupils.
The forms of entry are derived by dividing the total number of Year R
(Reception) in primary schools and Y7 in secondary schools by 30
places. Reference may also be made to total capacity in schools, where
appropriate, recognising that the increasing pupil numbers are in the
intake years in both primary and secondary.
3.5.1 Primary sector pupil place planning
The County Council has implemented proposals that have provided an
additional 930 primary school places from September 2013 onwards.
Across Burton as a whole, the demand for primary places is likely to
continue to increase even without any new housing being built, in
relation to the higher births over the last four years which has
necessitated the additional 930 places provided.
It is necessary to consider the primary school projections for the urban
areas of Burton (Areas 1, 2, 3 & 5) separately to Area 4, which covers
the surrounding rural area to the north and the west. This is because
the schools in Burton Area 4 primarily serve a rural area, such as a
village or local community.
The National Audit Office recommends authorities to allow at least 5%
surplus in the system for flexibility and to ensure a degree of parental
choice.
Without housing:
The table in Appendix C shows where the most shortage of places in
the primary sector is projected to occur. In Area 1, there is a shortage of
21 places for the Reception intake from 2017. This does not take into
account the NAO recommended minimum 5% surplus, which would
require a total of 51 additional places.

The Burton upon Trent School Planning Study Part 1 Managing demographic growth and increasing education opportunities
323137/BPI/MBS/P1/D 24 October 2013 323137/PK/PW/TB
33
There is also pressure in Areas 2 and 5. The places available shown in
the table below are based on the capacity and PANs as they will be
from September 2014 onwards.
Burton Areas 1, 2, 3 and 5
As at January 2013 there were 6,228 pupils on roll but indicative pupil
numbers for January 2014 indicate pupil numbers in the region of
6,475, an increase of 247 or 4% in a year.
Capacity in areas 1, 2, 3 & 5, as at January 2013, was 6,296 places.
From September 2014 there will be total capacity of 7,211 places and a
combined PAN of 1,041. The table below indicates the shortfall of
places based on the reception capacity from September 2014 onwards.
Table 3.17: Primary sector shortages without housing – Burton Areas 1, 2, 3 & 5 total
No new housing
2015/16 2020/21 2025/26 2030/31
Total Pupil Nos 6841 7364 7366 7366
Reception Pupils Projected
1018 1052 1052 1052
Supply/shortage of Reception places
23 -11 -11 -11
FE equivalent (- if shortage)
0.8 -0.4 -0.4 -0.4
This shows the further increase in demand for places in Burton urban
area before 2020 even with the recent increase in school capacity in the
town and without any increase in the stock of housing.
In line with the NAO recommendation to allow at least 5% surplus in the
system for flexibility and to ensure a degree of parental choice, this
would equate to a total requirement for 64 additional Reception places,
totalling 1,105 Reception places across these areas.
Consideration needs to be given to the fact that the town has many
natural and man-made boundaries such as highways, rivers and
railways which is why it is necessary to plan the places required for
each individual cluster area separately.
Burton Area 4
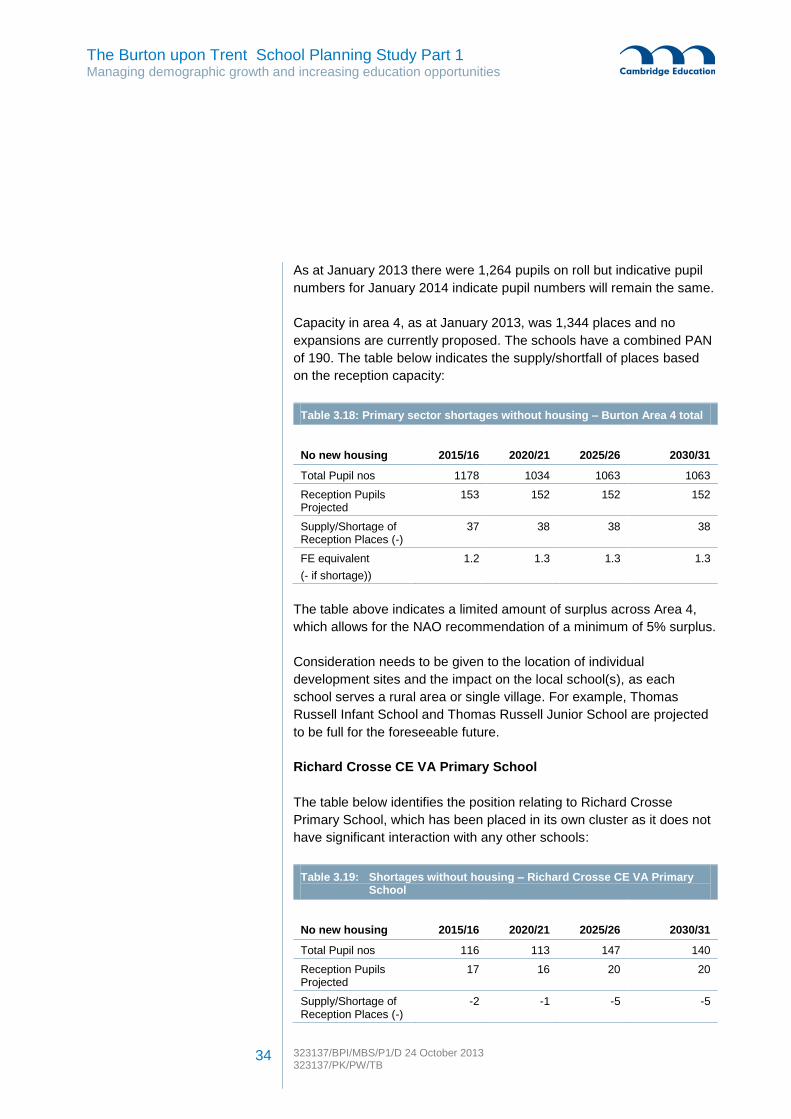
The Burton upon Trent School Planning Study Part 1 Managing demographic growth and increasing education opportunities
323137/BPI/MBS/P1/D 24 October 2013 323137/PK/PW/TB
34
As at January 2013 there were 1,264 pupils on roll but indicative pupil
numbers for January 2014 indicate pupil numbers will remain the same.
Capacity in area 4, as at January 2013, was 1,344 places and no
expansions are currently proposed. The schools have a combined PAN
of 190. The table below indicates the supply/shortfall of places based
on the reception capacity:
Table 3.18: Primary sector shortages without housing – Burton Area 4 total
No new housing
2015/16 2020/21 2025/26 2030/31
Total Pupil nos 1178 1034 1063 1063
Reception Pupils Projected
153 152 152 152
Supply/Shortage of Reception Places (-)
37 38 38 38
FE equivalent
(- if shortage))
1.2 1.3 1.3 1.3
The table above indicates a limited amount of surplus across Area 4,
which allows for the NAO recommendation of a minimum of 5% surplus.
Consideration needs to be given to the location of individual
development sites and the impact on the local school(s), as each
school serves a rural area or single village. For example, Thomas
Russell Infant School and Thomas Russell Junior School are projected
to be full for the foreseeable future.
Richard Crosse CE VA Primary School
The table below identifies the position relating to Richard Crosse
Primary School, which has been placed in its own cluster as it does not
have significant interaction with any other schools:
Table 3.19: Shortages without housing – Richard Crosse CE VA Primary School
No new housing
2015/16 2020/21 2025/26 2030/31
Total Pupil nos 116 113 147 140
Reception Pupils Projected
17 16 20 20
Supply/Shortage of Reception Places (-)
-2 -1 -5 -5

The Burton upon Trent School Planning Study Part 1 Managing demographic growth and increasing education opportunities
323137/BPI/MBS/P1/D 24 October 2013 323137/PK/PW/TB
35
Table 3.19: Shortages without housing – Richard Crosse CE VA Primary School
No new housing
2015/16 2020/21 2025/26 2030/31
FE equivalent
(- if shortage))
-0.1 0.0 -0.2 -0.2
With housing
The projections become forecasts when proposed new housing in
Burton is taken into account. This was updated in September 2013 and
is the Borough Council’s view of the requirement for new dwellings on a
number of sites across the whole of the East Staffordshire district over
the planning period, 2012-31. The Council will have a development
allowance of 10,284 units between 2012-31, comprising allocated sites
and windfalls. Extant permissions and completions to date are
additional to this figure. In total the council needs to accommodate a
housing requirement of 11,648 over the plan period, which equates to
613 dwellings per annum.
The Housing Growth figures by site are shown in Appendix D and those
that relate to Burton are included in the school roll forecasts. So there
can be confidence in the figures for the next few years, as these are
based in the main on known new housing. Beyond that, the forecasts
include trajectories of proposed developments outlined in the Local
Plan, and are therefore based on assumptions about the number of
dwellings and their completion over a long period and as set out in the
Local Plan prepared by the Borough Council. However, the overall
requirements in relation to these developments should remain the
same.
These new housing figures have been built into the school roll
forecasting model for the Burton area, with sites allocated to the five
individual primary school planning areas, as well as the secondary
planning area that covers Burton as a whole. The housing model also
makes clear the assumptions about the rate of development. A
standard pupil yield factor of 3 pupils per school year per 100 dwellings
is also applied.
We comment elsewhere – and indeed this view is supported by some
research into yield factors from new developments in Staffordshire
carried out by County staff – that this is on the cautious side. 21 pupils
of primary age per 100 houses in the primary sector compares with 28-
A standard pupil yield factor
of 3 pupils per school year
per 100 dwellings is also
applied.

The Burton upon Trent School Planning Study Part 1 Managing demographic growth and increasing education opportunities
323137/BPI/MBS/P1/D 24 October 2013 323137/PK/PW/TB
36
30 used by other shire counties. Additionally, Staffordshire’s own data
is showing higher yields from recently completed housing elsewhere in
the county. Nor is there any recognition of the different pupil yield from
different housing types, size and tenure in the forecasting model at this
stage. But we agree that, for the purposes of this exercise – a long term
view of pupil yield from new development, the bulk of which has yet to
be agreed – the 3 per school year assumption – is an adequate figure
for these purposes.
The timing of growth in the demand for school places accompanying
new development is hard to predict. Much will depend on the intensity
of development – if a large number of the planned dwellings are
provided in a very short time span of, say, less than five years, a peak
will come sooner and may be more intense in the needs it creates.
However, a steady stream of new housing is assumed each year for
these planning purposes.
With potential new housing taken into account, the forecast for the
primary schools across Burton is for a deficit of places to start from
2016.
By primary cluster area, the shortage is potentially greatest in Area 1
(north Burton) where a shortage of 7.6 FE is forecast by 2020,
increasing to 8.6 FE by 2030. A forecast shortage of 1.6 FE is projected
in Area 2 (south Burton) by 2020, increasing to 3.8 FE by 2030.
Burton 1, 2, 3 and 5
From September 2014 there will be total capacity of 7,211 places and a
combined PAN of 1,041. The table below indicates the shortfall of
places based on the reception capacity from September 2014 onwards.
Table 3.20: Primary sector shortages with new housing – Burton Areas 1, 2, 3 and 5 total
With new housing 2015/16 2020/21 2025/26 2030/31
Total Pupil nos. 7058 8533 8976 9221
Reception Pupils Projected
1049 1219 1282 1317
Supply/ shortage of places (-)
-8 -178 -241 -276
FE equivalent (- if shortage)
-0.3 -5.9 -8 -9

The Burton upon Trent School Planning Study Part 1 Managing demographic growth and increasing education opportunities
323137/BPI/MBS/P1/D 24 October 2013 323137/PK/PW/TB
37
This also shows a further increase in demand for places in Burton
urban area with a significant increase in housing and a rise in the
number of primary age children of around 3,000 pupils or 48% over the
planning period, compared to 2012/13 pupil numbers.
With the effects of new housing and in the longer term, there is a need
for over 9.0 FE, which is the equivalent of 9 new 1.0 FE primary
schools. This is without factoring in the NAO recommendation to allow
at least 5% surplus in the system for flexibility and to ensure a degree
of parental choice. Allowing for this surplus, this would equate to a total
requirement for 342 additional Reception places (11.4 FE), totalling
1,383 Reception places required across these areas.
A strategic solution is necessary for the area to allow the additional
primary school places to be delivered. This may result in larger schools
being built as delivering multiple small schools may have higher total
costs and land requirements.
Consideration also needs to be given to the fact that the town has many
natural and man-made boundaries such as highways, rivers and
railways which is why it is necessary to plan the places required for
each individual cluster area separately.
The options by individual planning areas are discussed in Part 2 of this
report.
Burton 4
Capacity in area 4, as at January 2013, was 1,344 places and no
expansions are currently proposed. The schools have a combined PAN
of 190. The table below indicates the supply/shortfall of places based
on the reception capacity. There is a limited amount of new housing
development.
Table 3.21: Primary sector shortages with housing – Burton Area 4 total
With new housing 2015/16 2020/21 2025/26 2030/31
Total Pupil nos. 1206 1153 1203 1203
Reception Pupils Projected
157 169 172 172
Supply/ shortage of places (-)
33 21 18 18
FE equivalent (- if shortage)
1.1 0.7 0.6 0.6
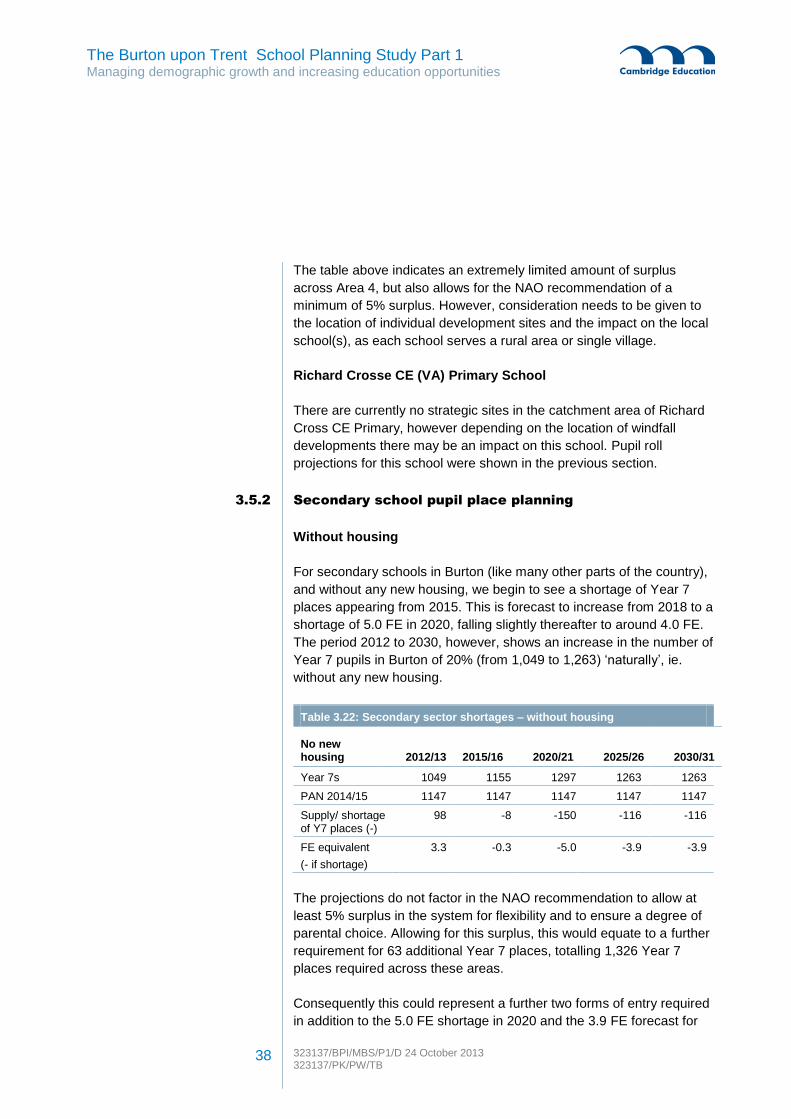
The Burton upon Trent School Planning Study Part 1 Managing demographic growth and increasing education opportunities
323137/BPI/MBS/P1/D 24 October 2013 323137/PK/PW/TB
38
The table above indicates an extremely limited amount of surplus
across Area 4, but also allows for the NAO recommendation of a
minimum of 5% surplus. However, consideration needs to be given to
the location of individual development sites and the impact on the local
school(s), as each school serves a rural area or single village.
Richard Crosse CE (VA) Primary School
There are currently no strategic sites in the catchment area of Richard
Cross CE Primary, however depending on the location of windfall
developments there may be an impact on this school. Pupil roll
projections for this school were shown in the previous section.
3.5.2 Secondary school pupil place planning
Without housing
For secondary schools in Burton (like many other parts of the country),
and without any new housing, we begin to see a shortage of Year 7
places appearing from 2015. This is forecast to increase from 2018 to a
shortage of 5.0 FE in 2020, falling slightly thereafter to around 4.0 FE.
The period 2012 to 2030, however, shows an increase in the number of
Year 7 pupils in Burton of 20% (from 1,049 to 1,263) ‘naturally’, ie.
without any new housing.
Table 3.22: Secondary sector shortages – without housing
No new housing
2012/13 2015/16 2020/21 2025/26 2030/31
Year 7s 1049 1155 1297 1263 1263
PAN 2014/15 1147 1147 1147 1147 1147
Supply/ shortage of Y7 places (-)
98 -8 -150 -116 -116
FE equivalent
(- if shortage)
3.3 -0.3 -5.0 -3.9 -3.9
The projections do not factor in the NAO recommendation to allow at
least 5% surplus in the system for flexibility and to ensure a degree of
parental choice. Allowing for this surplus, this would equate to a further
requirement for 63 additional Year 7 places, totalling 1,326 Year 7
places required across these areas.
Consequently this could represent a further two forms of entry required
in addition to the 5.0 FE shortage in 2020 and the 3.9 FE forecast for
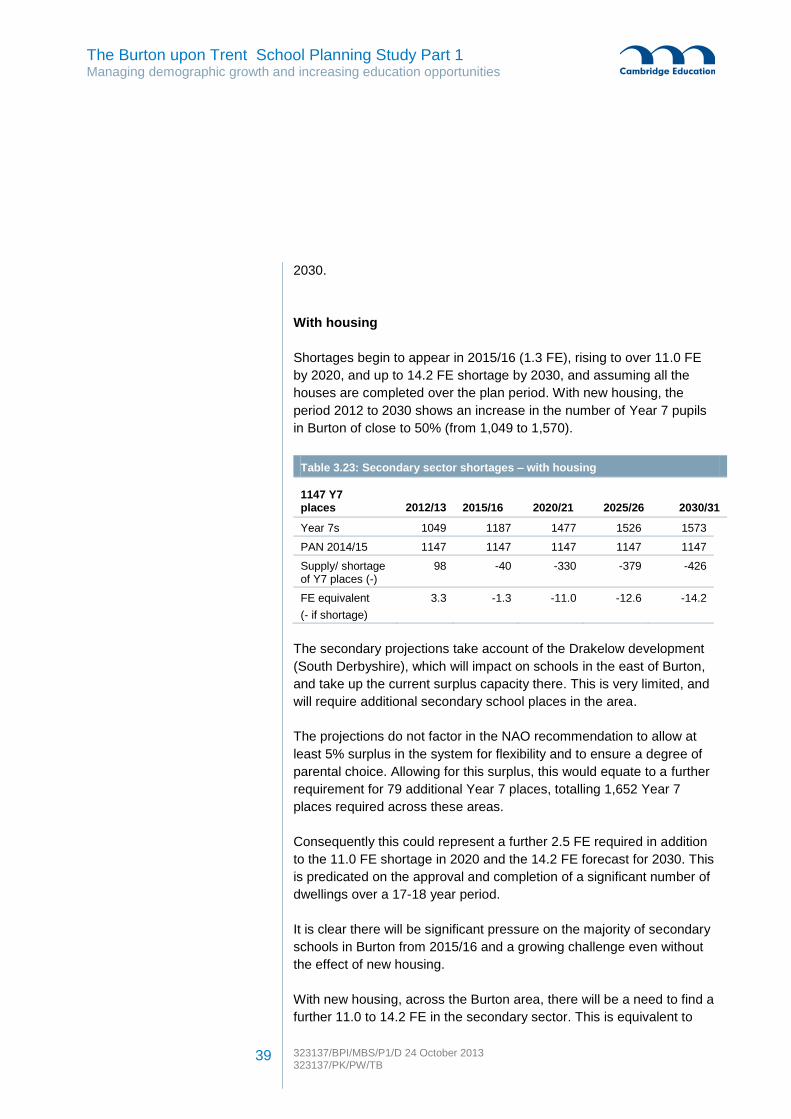
The Burton upon Trent School Planning Study Part 1 Managing demographic growth and increasing education opportunities
323137/BPI/MBS/P1/D 24 October 2013 323137/PK/PW/TB
39
2030.
With housing
Shortages begin to appear in 2015/16 (1.3 FE), rising to over 11.0 FE
by 2020, and up to 14.2 FE shortage by 2030, and assuming all the
houses are completed over the plan period. With new housing, the
period 2012 to 2030 shows an increase in the number of Year 7 pupils
in Burton of close to 50% (from 1,049 to 1,570).
Table 3.23: Secondary sector shortages – with housing
1147 Y7 places
2012/13 2015/16 2020/21 2025/26 2030/31
Year 7s 1049 1187 1477 1526 1573
PAN 2014/15 1147 1147 1147 1147 1147
Supply/ shortage of Y7 places (-)
98 -40 -330 -379 -426
FE equivalent
(- if shortage)
3.3 -1.3 -11.0 -12.6 -14.2
The secondary projections take account of the Drakelow development
(South Derbyshire), which will impact on schools in the east of Burton,
and take up the current surplus capacity there. This is very limited, and
will require additional secondary school places in the area.
The projections do not factor in the NAO recommendation to allow at
least 5% surplus in the system for flexibility and to ensure a degree of
parental choice. Allowing for this surplus, this would equate to a further
requirement for 79 additional Year 7 places, totalling 1,652 Year 7
places required across these areas.
Consequently this could represent a further 2.5 FE required in addition
to the 11.0 FE shortage in 2020 and the 14.2 FE forecast for 2030. This
is predicated on the approval and completion of a significant number of
dwellings over a 17-18 year period.
It is clear there will be significant pressure on the majority of secondary
schools in Burton from 2015/16 and a growing challenge even without
the effect of new housing.
With new housing, across the Burton area, there will be a need to find a
further 11.0 to 14.2 FE in the secondary sector. This is equivalent to
The Burton upon Trent School Planning Study Part 1 Managing demographic growth and increasing education opportunities
323137/BPI/MBS/P1/D 24 October 2013 323137/PK/PW/TB
40
one, possibly two, new 6/7 FE secondary schools. Building in a 5%
surplus for flexibility would require an additional 2.5 FE.
The scope for expansion from within the existing stock of schools or
from new developments or a mixture of the two is addressed in Part 2
of this report.

The Burton upon Trent School Planning Study Part 1 Managing demographic growth and increasing education opportunities
323137/BPI/MBS/P1/D 24 October 2013 323137/PK/PW/TB
41
This section looks at the existing schools in Burton on Trent, and
summarises the potential to expand these schools, informed by our
understanding of both current EFA funding methodologies and recent
outturn figures for newly completed schools in the Midlands and across
England.
4.1 Primary Schools
Staffordshire policy seeks to secure the best possible educational
outcomes for all children, and places primary schools at the heart of its
local communities. It is therefore a key focus for the local authority to
ensure that pupil place planning is paramount in growth areas when
new communities are created and the consequential needs are met as
efficiently as possible.
With many local authorities there is a presumption of a two forms of
entry model (ie. 420 places) unless there are special circumstances that
make this unavoidable. However, due to the rural nature of the county,
this is not necessarily the case for Staffordshire, which, as a minimum,
would not normally build a new primary school smaller than one form of
entry. There is no explicit policy in Staffordshire, rather a preference
not to build a new primary school any smaller than 1.0 FE. There is
more of a sense of working jointly with schools to develop the best
solution for each area and individual school, rather than trying to
impose a top-down approach.
In reference to expanding existing primary schools, the authority notes
that some schools prefer to grow to a full form of entry, rather than a 0.5
FE. For example, a school of 45 PAN may be happy to increase to 60
PAN as it allows for easier organisation of classes. Conversely, a
school of 30 PAN may not want to increase to 45 PAN as it means a
change to mixed aged teaching. However, this is not a general rule and
it comes down to individual schools. Further, there are no explicit
preferences in relation to secondary school provision, rather a general
willingness to work with such schools.
For all growth areas where development will be integrated within
existing communities, there are limits on the scope to expand existing
schools. If at all possible, there is also a need to avoid the risk (and
costs) of transporting young children some distance.
Within Burton, over the planning period and assuming the completion of
new housing over that period, there is a forecast demand for additional
4 School Infrastructure Assessment

The Burton upon Trent School Planning Study Part 1 Managing demographic growth and increasing education opportunities
323137/BPI/MBS/P1/D 24 October 2013 323137/PK/PW/TB
42
primary school places that is equivalent to 9.0 FE, especially in
planning areas 1 & 2, with a further 2.5 FE being suggested to allow a
modest surplus, in line with NAO recommendations, to permit flexibility
in the system.
4.2 Secondary Schools
Within Burton, over the planning period and assuming the completion of
new housing over that period, there is a forecast demand for additional
secondary school places that is equivalent to 11.0 to 14.2 FE. This
includes the impact of the Drakelow development in South Derbyshire,
which will generate up to 2.0 FE of additional pupils as parents look to
Burton schools for secondary education. Additionally another 2.5 FE
are also suggested for the secondary sector to allow flexibility.
4.3 Assessment of Existing Stock
For each primary planning area and for the secondary sector, we have
looked at the capacity of the existing stock of schools; we have also
summarised the ability to increase capacity at individual sites, based on
a desktop study.
In effect, it provides a risk assessment on the scope for expansion
based on this information – though recognising the long term nature of
the planning scenario on which this analysis is based.
This will be looked at further in Part 2 of this report.
4.3.1 Primary Area 1
There is capacity of 4,028 places and a combined PAN of 574, with
3,409 pupils on roll at January 2013. Indicative pupil numbers for
January 2014 are around 3,554 pupils on roll. There are 14 schools, as
listed in Appendix A.
Table 4.1 Primary Area 1 – forecast need
With housing There is a forecast need for up to an additional 1 FE by 2015/16. By 2020/21, this will increase up to 4.3 FE. This rises to 5.3 FE by the end of the period, and without any surplus built in.
Without housing There is a projected need for an additional 0.5 -1.0 FE from 2017 onwards and without any surplus built in.

The Burton upon Trent School Planning Study Part 1 Managing demographic growth and increasing education opportunities
323137/BPI/MBS/P1/D 24 October 2013 323137/PK/PW/TB
43
Desktop studies indicate that there may be potential to expand schools
in this area by up to a maximum of 3.5 FE, although there are
significant constraints that would need to be overcome, for example,
Sport England requirements, and potential highways implications and
associated costs.
This is against a forecast increase in demand of 5.3 FE by 2030/31.
This would indicate a considerable difference and consequently new
primary school provision will be required in this area.
4.3.2 Primary Area 2
There are currently 1,220 primary age pupils on roll as at January 2013.
Additional places were provided from September 2013 onwards,
providing a total capacity for this area of 1,323 places and a combined
PAN of 197. Indicative pupil numbers for January 2014 are 1,280.
Table 4.2: Primary Area 2 – forecast need
With housing Numbers are forecast to increase over the planning period with a shortage of 0.4 FE forecast from 2015/16 which increases to a shortage of over 1.6 FE by 2020/21, thereafter to a shortage of 3.8 FE by 2030/31, the end of the planning period and without any surplus built in.
Without housing There is a forecast balance of supply and demand over the planning period, albeit with no allowance for any surplus.
Desktop studies indicate that there may be potential to expand schools
in this area by up to a maximum of 0.5 FE, although there are
significant constraints that would need to be overcome, for example,
Sport England requirements, potential highways implications and
associated costs.
This is against a forecast increase in demand of 3.8 FE by 2030/31.
This would indicate a considerable difference and consequently new
primary school provision will be required in this area.
4.3.3 Primary Area 3
As at January 2013, there were 890 primary age pupils on roll with 960
places (including EFA funded places).

The Burton upon Trent School Planning Study Part 1 Managing demographic growth and increasing education opportunities
323137/BPI/MBS/P1/D 24 October 2013 323137/PK/PW/TB
44
Proposals are being implemented to enlarge River View Primary School
from September 2014, to accommodate the significant rise in the
number of children being born and living in this area. This will increase
the net capacity in the area to 1,050 places, and the PAN to 150.
Table 4.3: Primary Area 3 – forecast need
With housing Numbers are forecast to increase over the planning period with a minimal shortage that appears by 2016/17, and remains until the end of the planning period, and without any surplus built in.
Without housing
There is a forecast balance of supply and demand over the planning period, albeit with no allowance for any surplus.
Desktop studies indicate that there is very limited or no potential to
expand schools in this area.
4.3.4 Primary Area 4
There were 1,264 primary age pupils on roll at January 2013 with 1,344
places and a combined PAN of 190.
Table 4.4: Primary Area 4 – forecast need
With housing Numbers are forecast to remain stable over the planning period with reception intakes of around 170. There is sufficiency of forms of entry.
Without housing There is a forecast surplus equivalent to 1.0 FE or more from 2017.
There are eight schools in Area 4, which is located in the rural area to
the north and west of Burton.
Consideration needs to be given to the location of individual
development sites and the impact on the local school(s), as each
school serves a rural area or single village.
4.3.5 Primary Area 5
As at January 2013 there were 709 pupils on roll, with 810 places and a
combined PAN of 120. January 2014 indicative pupil numbers are
around 734.
Table 4.5: Primary Area 5 – forecast need
With housing Reception intakes are forecast to fluctuate around an average

The Burton upon Trent School Planning Study Part 1 Managing demographic growth and increasing education opportunities
323137/BPI/MBS/P1/D 24 October 2013 323137/PK/PW/TB
45
Table 4.5: Primary Area 5 – forecast need
of 120 pupils over the planning period. There is a forecast balance of supply and demand over the planning period, albeit with no allowance for any surplus.
Without housing There is a forecast balance of supply and demand over the planning period, albeit with no allowance for any surplus.
Whilst there is only projected to be a negligible deficit of places there is
no surplus currently built in. It would therefore be prudent to make
additional provision to allow some flexibility.
There are three schools in Area 5 as shown in the profiles.
4.3.6 Secondary schools
Burton has six secondary schools with five high school catchment areas
and a Catholic secondary, which serves a wider area across all the
catchment areas as well as outside the Staffordshire County Council
boundary. There is some, but not complete, correspondence between
the primary clusters and the secondary/high school catchment areas.
In summary there were 6,386 on roll (as at January 2013) with a
capacity of 7,159/7,399. There is a combined PAN for Year 7 in
2014/15 of 1,147.
Table 4.6: Burton Secondary Schools – forecast need
With housing Forecasts indicate that there will be a shortage of places in the secondary sector, which will begin in 2015/16 (a need for 1.3 FE), rising gradually to 2019/20 (8.1 FE needed) but rising after that to 10.3 FE in 2022/23 and potentially to 14.2 FE by the end of the planning period
Without housing
There are limited places up to 2017/18 and a shortage thereafter – 1.6 FE in 2018/19, rising to 5.0 FE in 2020/21 and stabilising at 3.9 FE from 2024/25 onwards and without any surplus built in.
Desktop studies indicate that it may be possible to enlarge existing
schools by around 7.0 FE, although there are likely to be considerable
infrastructural and planning issues which could have significant financial
implications and prevent/limit expansion.
Whilst there is some potential for enlargement of existing schools, and
a willingness to expand from a number of schools in the area, desktop
studies indicate that it is not possible to meet the full requirement of
14.2 additional FE on existing school sites, and therefore it is likely that

The Burton upon Trent School Planning Study Part 1 Managing demographic growth and increasing education opportunities
323137/BPI/MBS/P1/D 24 October 2013 323137/PK/PW/TB
46
a new secondary school will be required to accommodate the level of
housing growth proposed across Burton.
4.3.7 Special schools
It is difficult to forecast the demand for additional places in special
schools. The authority may well have a policy of making provision in
Special Resource Provision units in mainstream schools. However
there remain young people for whom provision must be made in special
schools within the authority or elsewhere when provision cannot be
made by the authority in its own schools.
Our assumption is that – in line with national averages – some 1.0 –
2.0% of young people aged 4 to 15 will need provision in Special
Schools, predicting that from the additional dwellings there will be 30-60
young people over and above existing numbers in Burton.
As described earlier, Fountains Primary School and High School are
co-located special schools in Burton, which cater for 2 – 19 year olds,
with 90 places in the primary phase (with some nursery provision) and
130 in the High School11
. An additional pressure for the school is its net
importing from other counties, especially Derbyshire, because of the
proximity of the border. Additionally, a local Derbyshire Special School
has gone into a category and this has also increased demand on
Fountains.
We understand that both Fountains Primary and High School sites are
constrained, so that expansion would not be feasible on either site.
4.4 Issues for consideration
4.4.1 Optimal school size and the impact on learning outcomes
There has been considerable debate on the issue of whether school
size has a direct impact on the academic achievement of pupils. With
regard to secondary schools, figures show the number of "titan" schools
11 Planned and actual numbers as of July 2013

The Burton upon Trent School Planning Study Part 1 Managing demographic growth and increasing education opportunities
323137/BPI/MBS/P1/D 24 October 2013 323137/PK/PW/TB
47
with more than 2,000 pupils has more than quadrupled in the last 15
years. At the same time, the number with 1,500 to 1,999 pupils has
doubled.
Whilst studies have shown that dramatic changes in a school's size
may change the characteristics of a school's learning environment, in
respect of pupil attainment measured by exam results, and for
attendance, larger schools appear to do better up to some optimal
school size12
but estimates of this point or range are insufficiently
precise to be very useful.
The implications of different school sizes on student behaviours are
also unclear. There is some evidence that teachers and pupils at
smaller schools are more likely to have a positive perception of their
‘school environment’. Additionally, it has also been found that, in a
number of cases, larger schools make it easier for certain students to
be somewhat 'anonymous’ – behaviour is likely to be worse around
people who don't know who they are – and hence is difficult to bring
them to account. However, with regard to the financial implications,
costs per pupil appear to decrease as school size increases.
Whilst there is little good quality research evidence to justify policies
that aim to change or mandate particular school sizes, there do appear
to be optimal sizes for some outcomes. Consequently school
stakeholders (eg. parents and the local community) should be made
aware that dramatic changes in a school’s size may change the
characteristics of its learning environment.
In the primary sector, the number of supersize primary schools – some
of which have more than 1,000 pupils – has soared by 60% in three
years, triggering a fierce debate among educationists about significant
numbers of young children not getting the attention they need.
Department for Education statistics show that the number of primary
schools with 700 or more pupils amounts to 130 today compared with
80 three years ago. For example, Barclay Primary School in Leyton,
east London, already one of the largest with 1,200 pupils, is expanding
to 1,600 from September 2014.
The super-sized primaries are clustered in the most deprived parts of
the country, in particular east London and inner-city Birmingham, where
poorer young families can find less expensive housing. The average
12
Estimates of optimal secondary school size range from 600 to 2000 pupils
The Burton upon Trent School Planning Study Part 1 Managing demographic growth and increasing education opportunities
323137/BPI/MBS/P1/D 24 October 2013 323137/PK/PW/TB
48
size of a primary school has crept up from 181 pupils in 1985 to 250 in
2013.
There are strong views on both sides of the argument, with those
favouring smaller schools advocating no larger than 420 pupil primary
schools (ie. 2.0 FE x 7 year groups), while those advocating larger
schools point out that their size is not a barrier to delivering good
education and care, and that class sizes are the same as in other
smaller schools and issues such as playground management are
effectively dealt with to ensure access enjoyment for all pupils.
It will therefore be important to consider the overall context of any
school under consideration for expansion and whether there is
willingness and/or the capacity (both physically and educationally) to
support and manage what will undoubtedly be a stressful period during
the planning and construction phase.
4.4.2 Multi storey primary schools
There has been a similar long running debate on the advantages and
disadvantages of multi-storey primary schools. Staffordshire County
Council has recently built a 3-storey primary school in Burton on the
former Christchurch Infants School, which is now Christchurch Primary
School.
A study undertaken by Cambridge University in 201013
did not conclude
in favour of either multi or single-storey buildings but it provided an
overview of the advantages and disadvantages of multi-storey schools,
which are outlined below:
Access
Advantages:
To external spaces on a compact site, building vertically can enable
more ground floor outdoor space to be utilised for school members
and for the local community.
Additional outdoor spaces can be provided on balconies and
verandas and by using roof space. Verandas can also provide
shade and cover for outdoor areas underneath.
Parental access can be facilitated through good use of large
communal spaces/receptions at the ‘heart of the school’ an
13
Investigation into the choice of single or multi-storey design solutions for new-build primary schools
and the implications for the quality and delivery of education, Cambridge University , 2010

The Burton upon Trent School Planning Study Part 1 Managing demographic growth and increasing education opportunities
323137/BPI/MBS/P1/D 24 October 2013 323137/PK/PW/TB
49
advantage being that parents enter the whole school rather than
only one part and therefore can have a stronger sense of the
connections between a diverse community.
Disadvantages:
External access to outdoors from upper storeys may be
compromised, although other solutions are possible. Lack of direct
access to outdoors may have increased disadvantages for younger
children (and the implications for implementing the Early Years
Foundation Stage curriculum). However this can be resolved if
younger children occupy the ground floor.
If access is via several staircases, movement time between
sessions can become significant. Exiting the school entirely during
an emergency will require special consideration.
Parental access may be hindered by reduced opportunities for
contact whilst picking up children or collecting them. If poorly
designed, internal access can encumber connectedness and
visibility through a building. Provision of resources to provide
access for all children – eg. lifts are expensive to install and
maintain.
Visibility
Advantages:
Several storeys, especially if designed to create an interior range of
sight lines, can provide visual connections to the school community
as a whole and to the outside neighbourhood.
Children could be provided with views beyond the site as well as
within by seeing different parts of the school from above and below.
The multi-functional central spaces that are created, when the
school is organised around a central open stairway, offer flexible
space for additional performance or other social or professional
gathering events.
Security
Advantage:
A compact multi-storey school may provide more security than a
single storey site due to the fewer entrances needed and external
ground level area to control.
Cost
Advantage:

The Burton upon Trent School Planning Study Part 1 Managing demographic growth and increasing education opportunities
323137/BPI/MBS/P1/D 24 October 2013 323137/PK/PW/TB
50
Less surface area may result in a less expensive project. Roofs are
costly to repair and less roof space reduces long term costs for roof
maintenance.
Disadvantage:
Foundations can be costly; access; maintenance eg. cleaning
windows, repairing roofs due to the need to deploy more
specialised equipment.
Sustainability
Advantage:
More compact buildings may be more energy efficient and
sustainable in terms of building resources
Disadvantage:
Greater challenge to draw on natural light and ventilation in multi-
storey buildings and extra movement through a school may raise
noise levels.
Community
Advantage:
Building high can enable the accommodation of offices and other
spaces to support multi-agency/community activities.
Pedagogy
Disadvantages:
Institutional feel or formality of the building can have an influence on
pedagogical practice.
Careful thought is required to give children and adults freedom of
access to a variety of learning spaces and resources.
In considering the construction of new primary schools (and, in some
cases, extending existing schools), it will therefore be important to take
account of the impact on any/all of the above elements.

The Burton upon Trent School Planning Study Part 1 Managing demographic growth and increasing education opportunities
323137/BPI/MBS/P1/D 24 October 2013 323137/PK/PW/TB
51
5.1 Overview
As a strategic commissioning authority Staffordshire County Council is
working closely with East Staffordshire Borough Council, as the Local
Planning Authority, to ensure that sufficient school places are available
in the right locations, to meet changing demand; and that sufficient
finance is available to secure school places in high quality
environments.
The birth rate in Burton is increasing and to accommodate the
increased pupil numbers the County Council has invested over £20
million to implement the following proposals:
relocate and enlarge St. Modwen's Catholic Primary School to a
new, larger 420 place school off Tutbury Road;
build a new 420 place primary academy at Belvedere Park, known
as Scientia Academy;
increase the age range and capacity at Christchurch Community
Infants School to become Christchurch Primary School providing an
additional 195 places; and
enlarge River View Primary and Nursery School by 105 places.
These proposals have provided a total of 930 additional places from
September 2013 to alleviate the significant pressure on primary school
places in Burton upon Trent, and will meet the projected demand for
places from pupils already living in the area. The River View
enlargement is on-going and will be fully implemented by September
2014.
However, this study, commissioned by East Staffordshire Borough
Council and Staffordshire County Council, confirms that the investment
will not be sufficient to accommodate pupils generated from any future
residential developments.
The significant basic need pressure for additional school places
currently being seen at primary school level will impact on the
secondary schools in Burton from 2015/16 onwards from the pupils
already living within the Burton area. Any residential development in the
Burton upon Trent area will require additional school places in excess
of those required for the basic need pressures. Projections show that by
2018/19 there will be insufficient secondary school places at existing
schools to accommodate the children currently living in the area.
5 Conclusion
..the provision of an
additional 930 places from
September 2013 will not be
sufficient to accommodate
pupils generated from any
future residential
developments.

The Burton upon Trent School Planning Study Part 1 Managing demographic growth and increasing education opportunities
323137/BPI/MBS/P1/D 24 October 2013 323137/PK/PW/TB
52
The proposed residential developments will increase pupil numbers
further and necessitate additional secondary school places at an earlier
date than if no further housing were built. Additional places will be
provided through expansion to existing schools and by safeguarding a
site for a future new secondary school.
The school age population of Burton upon Trent is projected to increase
even without any additional new housing being built. There were 7,608
children in primary schools in January 2013 (age range from Reception
to Year 6). This is projected to increase to 8,545 by 2020 and to 8,569
by 2030. There will be a total of 8,660 primary school places from
September 2014.
Within secondary schools in Burton, there were 1,049 children admitted
to Year 7 in 2012/13, the first year of their secondary education. The
numbers are projected to increase to 1,297 by 2020 and then to 1,263
by 2030. There are currently 1,147 Year 7 places.
The Borough Council’s Housing growth policy for 2012-2031 is for an
additional 11,648 dwellings across the whole of the Borough or around
613 per year over the planning period, the bulk of which will be in
Burton and takes account of recent completions and extant permissions
(Appendix D).
When the effect of new housing is taken into account, the number of
children in primary schools (Reception Year to Year 6) in Burton is
forecast to increase from 7,608 in 2012 to 9,833 in 2020 and 10,564 in
2030. Even though the County Council has recently expanded the
number of primary places in Burton, this was only sufficient to
accommodate the children currently living in the area and not any
further housing. With the effects of housing, there is a need to create an
additional 5.9 FE to primary schools by 2020, rising to 9.1 FE by 2030,
assuming the housing that is required is built and completed over that
period.
Similarly, in secondary schools, the numbers of Year 7s are forecast to
increase from 1,049 in January 2013 to 1,477 in 2020 and 1,573 by
2030 when new housing in both East Staffordshire and South
Derbyshire is taken into account. Shortages begin to appear from 2015
onwards. That is equivalent to an additional 14.2 FE, or two additional
secondary schools.
The scope to increase the size of existing schools to meet the increase
in demand is extremely limited, as noted earlier in the report. There is

The Burton upon Trent School Planning Study Part 1 Managing demographic growth and increasing education opportunities
323137/BPI/MBS/P1/D 24 October 2013 323137/PK/PW/TB
53
also only a limited number of surplus places in the system at present,
particularly in the areas identified for housing growth.
There are five primary school planning areas or clusters in Burton.
In Area 1, the centre and north of the town, there is a forecast need for
an additional 1.0 FE by 2015/16; for 4.3 FE by 2020/21; and for 5.3 FE
by 2030/31. This is without allowing for the NAO recommended 5%
surplus to be built in.
The appraisal of the current schools in the area suggests that it may be
possible to expand schools up to a maximum total of 3.5 FE, although
there are significant constraints that would need to be overcome, for
example, Sport England requirements, potential highways implications,
and associated costs.
There is a need for detailed feasibility work and discussion with heads
and governors. Even if 3.5 FE can be added to existing schools in the
area, it points to a need for the remaining provision to be delivered in
new school(s) on a site(s) to be identified. This will be considered
further in Part 2 of this report.
In Area 2, the Branston area of the town, there is a forecast need for an
additional 0.4 FE by 2015/16, 1.6 FE by 2020/21 and 3.8 FE by
2030/31. This is without allowing for the NAO recommended 5%
surplus to be built in.
The appraisal of the current schools in the area suggests that it may be
possible to expand schools up to a maximum total of 0.5 FE, although
there are significant constraints that would need to be overcome, for
example, Sport England requirements, potential highways implications,
and associated costs.
There is a need for detailed feasibility work and discussion with heads
and governors. Even if 0.5 FE can be added to existing schools in the
area, it points to a need for the remaining provision to be delivered in
new school(s) on a site(s) to be identified. This will be considered
further in Part 2 of this report.
In Area 3, the south east area of Burton numbers are forecast to
increase over the planning period with a minimal shortage that appears
by 2016/17, and remains until the end of the planning period. There is
projected to be no surplus to allow for the NAO recommended 5%
surplus to be built in.

The Burton upon Trent School Planning Study Part 1 Managing demographic growth and increasing education opportunities
323137/BPI/MBS/P1/D 24 October 2013 323137/PK/PW/TB
54
Desktop studies indicate that there is very limited or no potential to
expand schools in this area other than the proposals currently being
implemented to address the current need at River View Primary School.
In Area 4, the rural area to the north and west of Burton, there are
broadly sufficient places to meet the demand both with and without the
effects of new housing in the primary sector, though there is little if any
surplus.
However, consideration needs to be given to the location of individual
development sites and the impact on the local school(s), as each
school serves a rural area or single village, taking into consideration the
NAO recommended 5% surplus to be built in.
In Area 5, the area to the East of Burton, by 2016/17 and through to the
end of the planning period, supply matches demand with or without
housing. However, there is projected to be no surplus to allow for the
NAO recommended 5% surplus to be built in.
The table below summarises these projections:
Table 5.1
Primary FE Required
Area 1 FE
required
Area 2 FE
Required
Area 3 FE
Required
Area 4 FE
Required
Area 5 FE
Required
2015/16 1 0.4
2020/21 4.3 1.6
2030/31 5.3 3.8
Potential FE from existing schools
3.5 0.5 0 - -
FE required from new builds
1.8 3.3 0 0 0
Plus 5% Surplus
1.2 0.5 0.3 0 0.2
In Secondary schools, as we have seen, the forecast demand for
places with the effect of new housing is equivalent to an additional 14.2
FE, or the equivalent of two additional secondary schools.
There is limited surplus capacity at present in Burton’s secondary
schools and, where that is the case, it tends to be outside the area for
housing growth. That said, schools in the east of the town can be
expected to meet some of the demand for secondary school places as

The Burton upon Trent School Planning Study Part 1 Managing demographic growth and increasing education opportunities
323137/BPI/MBS/P1/D 24 October 2013 323137/PK/PW/TB
55
a result of new housing in South Derbyshire and this is factored into the
forecasts.
The analysis of the potential to expand existing secondary schools
indicates that there are potentially some major constraints (planning
and highways) at particular sites. We have also provided an analysis of
the merits or otherwise of creating very large schools and point to the
choices to be made in what is increasingly a ‘market’ for the supply of
school places.
Assuming that constraints can be overcome, there appears to be some
scope to expand secondary schools by around 7.0 FE, as noted earlier
in the report. It is also recognised the two academies, one in the north
of the Burton area, the other in the south, may aspire to increase their
forms of entry.
One planning scenario would be for a modest growth from within the
existing stock of secondary schools and a new secondary school of 7.0
FE on a site to be identified, the balance of 7.2 FE being made up from
the expansion of existing schools. The options will be considered
further in Part 2 of this report.
5.2 New School Provision
Primary
The Borough Council has identified in the Local Plan that new primary
school provision will be located in the following areas:
Branston Locks, Burton upon Trent
Branston Depot, Burton upon Trent
Land at Upper Outwoods, Burton upon Trent
Land West of Uttoxeter and/or Hazelwalls Farm, Uttoxeter
In addition, it is expected that new primary school provision will be
provided by enlarging a local school or one located within land to the
south of Branston, Burton upon Trent
Secondary
East Staffordshire Borough Council is working in partnership with the
County Council to determine the location for a potential new secondary
One planning scenario
would be for a modest
growth from within the
existing stock of secondary
schools and a new
secondary school of 7.0 FE

The Burton upon Trent School Planning Study Part 1 Managing demographic growth and increasing education opportunities
323137/BPI/MBS/P1/D 24 October 2013 323137/PK/PW/TB
56
school in Burton upon Trent. If necessary, land will be safeguarded in a
Site Allocations DPD.
Staffordshire County Council will also work in partnership with local
schools, the Borough Council and academies to bring forward
extensions to existing primary and secondary schools.
5.3 Summary review of potential school expansion
Given the very detailed information we have received, together with the
opportunity to meet with a number of Borough and County Council
officers, we have reviewed the potential opportunities for extending
schools in Burton on Trent.
Desktop studies of the current school stock in both primary and
secondary sectors indicate that, whilst there is limited potential for some
schools to expand, in general the site and infrastructural issues at many
of the sites would make any expansion impossible/very difficult and/or
costly. Additionally, the resulting accommodation at those sites would
not necessarily reflect the needs and aspirations of individual schools or
make a positive impact on the lives and attainment of their pupils.
Indeed, at some sites, any further development would undoubtedly
adversely impact either the internal or external learning environments
the schools are able to provide.
New schools in the Burton on Trent area will be required if the projected
pupil numbers are to be adequately provided for in both the primary and
secondary sectors over the next decade and beyond.
We understand that this is currently being discussed by both
Staffordshire County Council and East Staffordshire Borough Council,
although potential sites have not been specifically identified, other than
the new primary schools to be delivered within the strategic sites
referred to in Appendix D.
These issues are addressed in more detail in Part 2 of this report.
The alternative option of
building new schools in the
Burton on Trent area should
therefore be seriously
considered if the projected
pupil numbers are to be
adequately provided for in
both the primary and
secondary sectors over the
next decade and beyond.

Appendix A: Burton Primary School Data

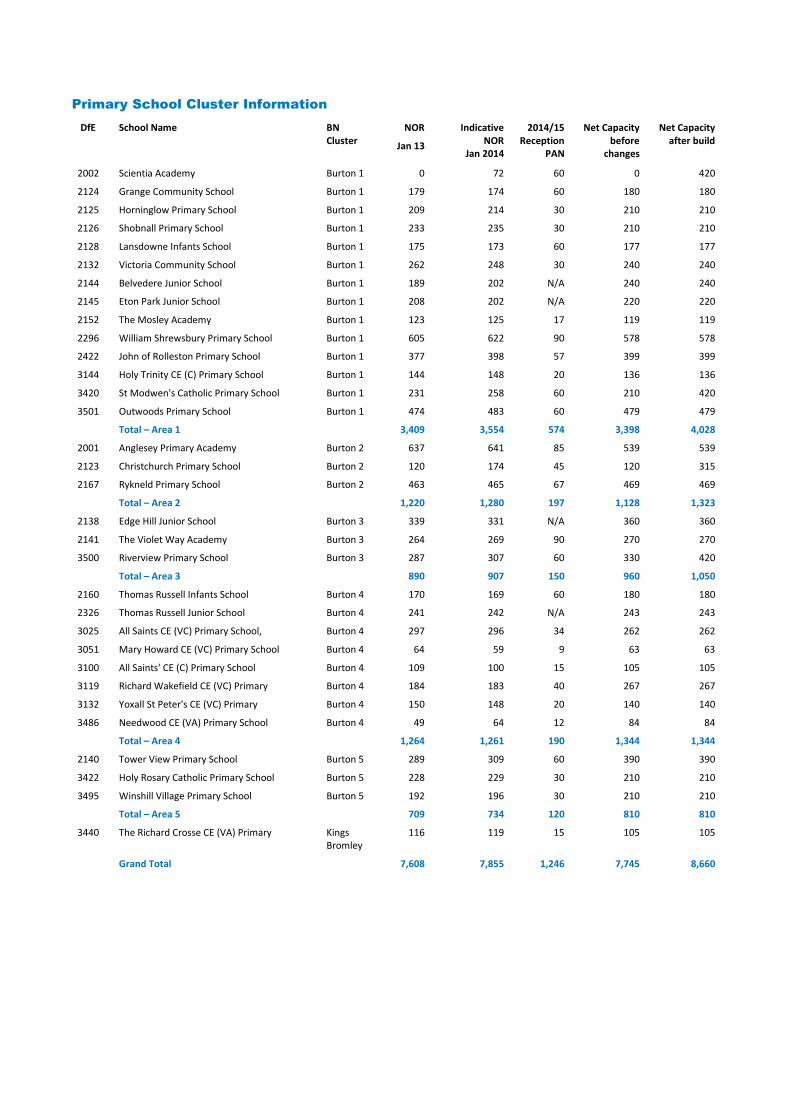
Primary School Cluster Information
DfE School Name BN Cluster
NOR
Jan 13
Indicative NOR
Jan 2014
2014/15 Reception
PAN
Net Capacity before
changes
Net Capacity after build
2002 Scientia Academy Burton 1 0 72 60 0 420
2124 Grange Community School Burton 1 179 174 60 180 180
2125 Horninglow Primary School Burton 1 209 214 30 210 210
2126 Shobnall Primary School Burton 1 233 235 30 210 210
2128 Lansdowne Infants School Burton 1 175 173 60 177 177
2132 Victoria Community School Burton 1 262 248 30 240 240
2144 Belvedere Junior School Burton 1 189 202 N/A 240 240
2145 Eton Park Junior School Burton 1 208 202 N/A 220 220
2152 The Mosley Academy Burton 1 123 125 17 119 119
2296 William Shrewsbury Primary School Burton 1 605 622 90 578 578
2422 John of Rolleston Primary School Burton 1 377 398 57 399 399
3144 Holy Trinity CE (C) Primary School Burton 1 144 148 20 136 136
3420 St Modwen's Catholic Primary School Burton 1 231 258 60 210 420
3501 Outwoods Primary School Burton 1 474 483 60 479 479
Total – Area 1 3,409 3,554 574 3,398 4,028
2001 Anglesey Primary Academy Burton 2 637 641 85 539 539
2123 Christchurch Primary School Burton 2 120 174 45 120 315
2167 Rykneld Primary School Burton 2 463 465 67 469 469
Total – Area 2 1,220 1,280 197 1,128 1,323
2138 Edge Hill Junior School Burton 3 339 331 N/A 360 360
2141 The Violet Way Academy Burton 3 264 269 90 270 270
3500 Riverview Primary School Burton 3 287 307 60 330 420
Total – Area 3 890 907 150 960 1,050
2160 Thomas Russell Infants School Burton 4 170 169 60 180 180
2326 Thomas Russell Junior School Burton 4 241 242 N/A 243 243
3025 All Saints CE (VC) Primary School, Burton 4 297 296 34 262 262
3051 Mary Howard CE (VC) Primary School Burton 4 64 59 9 63 63
3100 All Saints' CE (C) Primary School Burton 4 109 100 15 105 105
3119 Richard Wakefield CE (VC) Primary Burton 4 184 183 40 267 267
3132 Yoxall St Peter's CE (VC) Primary Burton 4 150 148 20 140 140
3486 Needwood CE (VA) Primary School Burton 4 49 64 12 84 84
Total – Area 4 1,264 1,261 190 1,344 1,344
2140 Tower View Primary School Burton 5 289 309 60 390 390
3422 Holy Rosary Catholic Primary School Burton 5 228 229 30 210 210
3495 Winshill Village Primary School Burton 5 192 196 30 210 210
Total – Area 5 709 734 120 810 810
3440 The Richard Crosse CE (VA) Primary Kings Bromley
116 119 15 105 105
Grand Total 7,608 7,855 1,246 7,745 8,660

Notes:
Burton 4 is a cluster of schools located in the rural area surrounding Burton. They have been grouped purely on the basis that they are
outside the main town area but do not necessarily interact in terms of pupil movement.
Richard Crosse has been placed in its own cluster as it does not have significant interaction with any other schools
Eton Park Junior School; Fountains Primary and High School; Horninglow Primary; John of Rolleston; Lansdowne Infants; Outwoods
Primary; William Shrewsbury: Trust name to be ‘Burton Co-operative Learning Trust.
Grange Community and Belvedere Junior Schools: Federation from 1st September 2013 - Governing Body will be known as the
Federation for Grange and Belvedere Community Schools.
Indicative numbers on roll for January 2014 provided by Staffordshire County Council based on information available as at 16 October
2013.

Primary Cluster Group 1
*The Mosley School is now The Mosley Academy

Primary Cluster Group 2
*Anglesey Foundation School is now Anglesey Primary Academy

Primary Cluster Group 3
*(C) Crown Copyright and database rights 2011.Ordnance Survey 100019422. You are not permitted to
copy, sub-license, distribute or sell any of this data to third parties in any form. Use of this data is
subject to the terms and conditions shown at www.staffordshire.gov.uk/maps.

Primary Group Cluster 4

Primary Group Cluster 5


Appendix B: Burton Secondary School Data
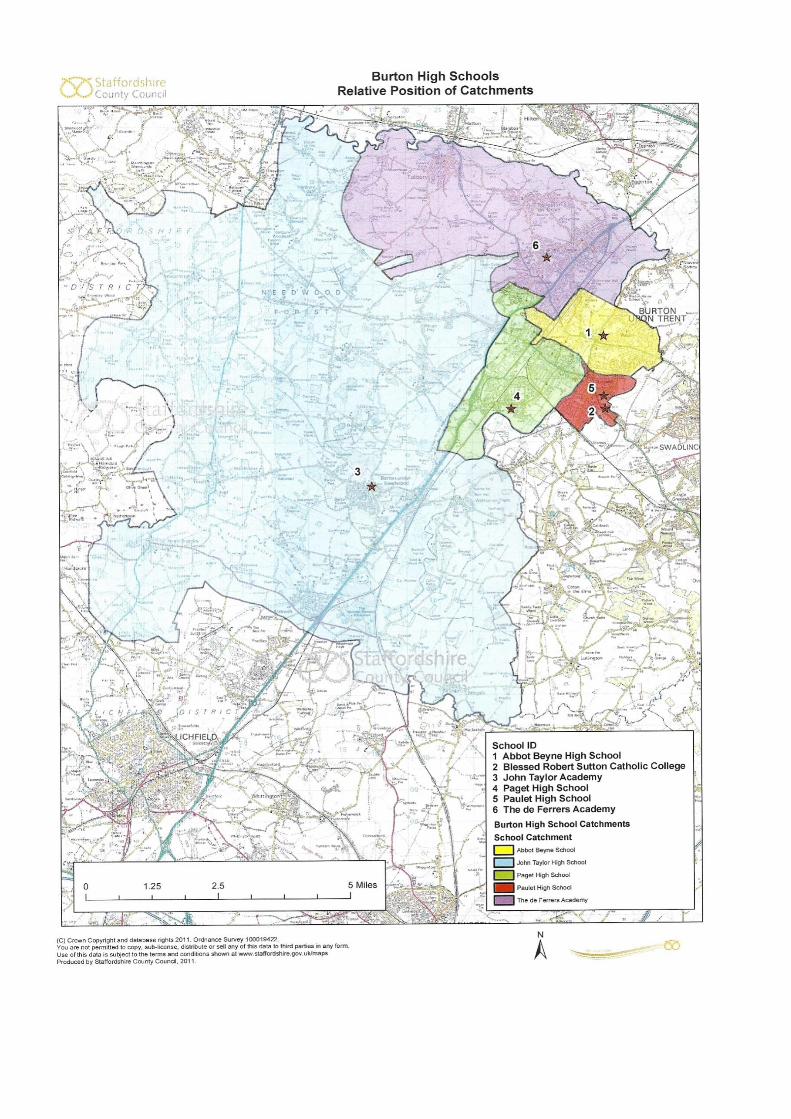
Burton Secondary School Catchment Areas


Appendix C: Burton Births and Projected School
Place Requirements

Births by Relative Reception Intake Year
Area 1 Births
Intake Yr 2007/08 2008/09 2009/10 2010/11 2011/12 2012/13 2013/14 2014/15 2015/16 2016/17
Number 402 439 451 441 495 501 559 540 527 576
Area 2 Births
Intake Yr 2007/08 2008/09 2009/10 2010/11 2011/12 2012/13 2013/14 2014/15 2015/16 2016/17
Number 230 242 227 249 278 284 261 263 287 277
Area 3 Births
Intake Yr 2007/08 2008/09 2009/10 2010/11 2011/12 2012/13 2013/14 2014/15 2015/16 2016/17
Number 131 130 132 117 132 160 150 150 148 158
Area 4 Births
Intake Yr 2007/08 2008/09 2009/10 2010/11 2011/12 2012/13 2013/14 2014/15 2015/16 2016/17
Number 127 145 130 130 138 130 134 102 113 101
Area 5 Births
Intake Yr 2007/08 2008/09 2009/10 2010/11 2011/12 2012/13 2013/14 2014/15 2015/16 2016/17
Number 94 115 91 108 118 103 121 128 102 120
Richard Crosse School Births
Intake Yr 2007/08 2008/09 2009/10 2010/11 2011/12 2012/13 2013/14 2014/15 2015/16 2016/17
Number 7 10 3 6 5 3 3 7 2 6
Total (Incl. Richard Crosse School) Births
Intake Yr 2007/08 2008/09 2009/10 2010/11 2011/12 2012/13 2013/14 2014/15 2015/16 2016/17
Number 991 1081 1034 1051 1166 1181 1228 1190 1179 1238
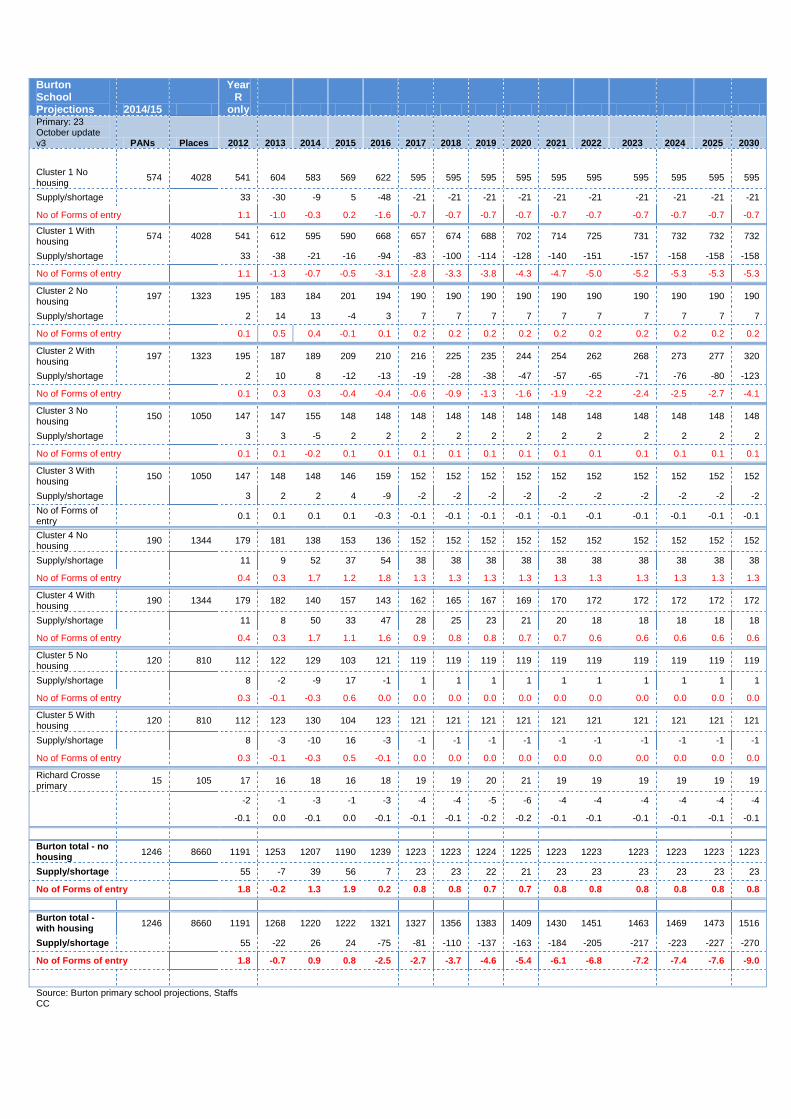
Burton School Projections 2014/15
Year R
only Primary: 23 October update v3 PANs Places 2012 2013 2014 2015 2016 2017 2018 2019 2020 2021 2022 2023 2024 2025 2030
Cluster 1 No housing
574 4028 541 604 583 569 622 595 595 595 595 595 595 595 595 595 595
Supply/shortage 33 -30 -9 5 -48 -21 -21 -21 -21 -21 -21 -21 -21 -21 -21
No of Forms of entry 1.1 -1.0 -0.3 0.2 -1.6 -0.7 -0.7 -0.7 -0.7 -0.7 -0.7 -0.7 -0.7 -0.7 -0.7
Cluster 1 With housing
574 4028 541 612 595 590 668 657 674 688 702 714 725 731 732 732 732
Supply/shortage 33 -38 -21 -16 -94 -83 -100 -114 -128 -140 -151 -157 -158 -158 -158
No of Forms of entry 1.1 -1.3 -0.7 -0.5 -3.1 -2.8 -3.3 -3.8 -4.3 -4.7 -5.0 -5.2 -5.3 -5.3 -5.3
Cluster 2 No housing
197 1323 195 183 184 201 194 190 190 190 190 190 190 190 190 190 190
Supply/shortage 2 14 13 -4 3 7 7 7 7 7 7 7 7 7 7
No of Forms of entry 0.1 0.5 0.4 -0.1 0.1 0.2 0.2 0.2 0.2 0.2 0.2 0.2 0.2 0.2 0.2
Cluster 2 With housing
197 1323 195 187 189 209 210 216 225 235 244 254 262 268 273 277 320
Supply/shortage 2 10 8 -12 -13 -19 -28 -38 -47 -57 -65 -71 -76 -80 -123
No of Forms of entry 0.1 0.3 0.3 -0.4 -0.4 -0.6 -0.9 -1.3 -1.6 -1.9 -2.2 -2.4 -2.5 -2.7 -4.1
Cluster 3 No housing
150 1050 147 147 155 148 148 148 148 148 148 148 148 148 148 148 148
Supply/shortage 3 3 -5 2 2 2 2 2 2 2 2 2 2 2 2
No of Forms of entry 0.1 0.1 -0.2 0.1 0.1 0.1 0.1 0.1 0.1 0.1 0.1 0.1 0.1 0.1 0.1
Cluster 3 With housing
150 1050 147 148 148 146 159 152 152 152 152 152 152 152 152 152 152
Supply/shortage 3 2 2 4 -9 -2 -2 -2 -2 -2 -2 -2 -2 -2 -2
No of Forms of entry
0.1 0.1 0.1 0.1 -0.3 -0.1 -0.1 -0.1 -0.1 -0.1 -0.1 -0.1 -0.1 -0.1 -0.1
Cluster 4 No housing
190 1344 179 181 138 153 136 152 152 152 152 152 152 152 152 152 152
Supply/shortage 11 9 52 37 54 38 38 38 38 38 38 38 38 38 38
No of Forms of entry 0.4 0.3 1.7 1.2 1.8 1.3 1.3 1.3 1.3 1.3 1.3 1.3 1.3 1.3 1.3
Cluster 4 With housing
190 1344 179 182 140 157 143 162 165 167 169 170 172 172 172 172 172
Supply/shortage 11 8 50 33 47 28 25 23 21 20 18 18 18 18 18
No of Forms of entry 0.4 0.3 1.7 1.1 1.6 0.9 0.8 0.8 0.7 0.7 0.6 0.6 0.6 0.6 0.6
Cluster 5 No housing
120 810 112 122 129 103 121 119 119 119 119 119 119 119 119 119 119
Supply/shortage 8 -2 -9 17 -1 1 1 1 1 1 1 1 1 1 1
No of Forms of entry 0.3 -0.1 -0.3 0.6 0.0 0.0 0.0 0.0 0.0 0.0 0.0 0.0 0.0 0.0 0.0
Cluster 5 With housing
120 810 112 123 130 104 123 121 121 121 121 121 121 121 121 121 121
Supply/shortage 8 -3 -10 16 -3 -1 -1 -1 -1 -1 -1 -1 -1 -1 -1
No of Forms of entry 0.3 -0.1 -0.3 0.5 -0.1 0.0 0.0 0.0 0.0 0.0 0.0 0.0 0.0 0.0 0.0
Richard Crosse primary
15 105 17 16 18 16 18 19 19 20 21 19 19 19 19 19 19
-2 -1 -3 -1 -3 -4 -4 -5 -6 -4 -4 -4 -4 -4 -4
-0.1 0.0 -0.1 0.0 -0.1 -0.1 -0.1 -0.2 -0.2 -0.1 -0.1 -0.1 -0.1 -0.1 -0.1
Burton total - no housing
1246 8660 1191 1253 1207 1190 1239 1223 1223 1224 1225 1223 1223 1223 1223 1223 1223
Supply/shortage 55 -7 39 56 7 23 23 22 21 23 23 23 23 23 23
No of Forms of entry 1.8 -0.2 1.3 1.9 0.2 0.8 0.8 0.7 0.7 0.8 0.8 0.8 0.8 0.8 0.8
Burton total -with housing
1246 8660 1191 1268 1220 1222 1321 1327 1356 1383 1409 1430 1451 1463 1469 1473 1516
Supply/shortage 55 -22 26 24 -75 -81 -110 -137 -163 -184 -205 -217 -223 -227 -270
No of Forms of entry 1.8 -0.7 0.9 0.8 -2.5 -2.7 -3.7 -4.6 -5.4 -6.1 -6.8 -7.2 -7.4 -7.6 -9.0
Source: Burton primary school projections, Staffs CC

Burton School Projections Secondaries 2014/15 Year
7s
PANs Y7 Places
2012 2013 2014 2015 2016 2017 2018 2019 2020 2021 2022 2023 2024 2025 2030
Burton total - no housing
1147 1147 1049 1052 1032 1155 1093 1130 1194 1234 1297 1239 1226 1288 1263 1263 1263
Supply/shortage 98 95 115 -8 54 17 -47 -87 -150 -92 -79 -141 -116 -116 -116
No of Forms of entry 3.27 3.2 3.8 -0.3 1.8 0.6 -1.6 -2.9 -5.0 -3.1 -2.6 -4.7 -3.9 -3.9 -3.9
Burton total -with housing
1147 1147 1049 1064 1049 1187 1162 1228 1322 1389 1477 1444 1455 1534 1518 1526 1573
Supply/shortage 98 83 98 -40 -15 -81 -175 -242 -330 -297 -308 -387 -371 -379 -426
No of Forms of entry 3.27 2.8 3.3 -1.3 -0.5 -2.7 -5.8 -8.1 -11.0 -9.9 -10.3 -12.9 -12.4 -12.6 -14.2
Pupil yield from Drakelow development included in Secondary projections
Source: Burton secondary school projections, Staffs CC
October update v3

Appendix D: Housing Requirements

STRATEGIC POLICY 4
Distribution of Housing Growth 2012 – 2031
Land is allocated to meet to meet the housing provision of Strategic Policy 3 in accordance with the following distribution1:
New strategic allocations in the Local Plan
Main Towns: Units
Burton upon Trent Greenfield Brownfield
LSOB Branston Locks Tutbury Road/Harehedge Lane Beamhill/Outwoods Guinevere Avenue Branston Depot Bargates/Molson Molson Coors Middle Yard, Hawkins Lane Derby Road Pirelli
660
2580 500 950 100 483 350 300 250 300
Total 6473
Uttoxeter Greenfield Brownfield
Uttoxeter West Stone Road Hazelwalls Brookside Industrial Estate JCB, Pinfold Road
700 100 350 150 257
Total 1557
Tier 1: Strategic Villages:
Barton under Needwood Rolleston on Dove Rocester Tutbury
Efflinch Lane College Fields Site XXXX Burton Road
130 100 90 224
Total 544
1 This table is based upon the land supply situation at the start of the plan period: 1 April 2012. At that time
none of the sites in Strategic Policy 4 had permission granted.

Windfall/Development allowance assigned to settlements in the Local Plan
Main Towns: 1359 windfall allowance (minimum)
Tier 1: Strategic Villages: Development allowance (minimum)
Barton under Needwood Rolleston on Dove Rocester Tutbury
25 25 25 26
Tier 2: Local Service Villages: Development allowance (minimum)
Abbots Bromley Yoxall Marchington Mayfield Denstone Draycott in the Clay
40 40 20 20 20 20
Tier 3: Small Villages and other settlements
Housing Exceptions allowance – see Strategic Policy 18
Bramshall, Stramshall, Church Leigh, Hanbury, Ellastone, Newborough, Kingstone, Anslow, Rangemore, Tatenhill, Stubwood, Stanton, Lower Leigh, Withington, Wootton.
90 (minimum)
Total 1710
Grand Total 10284
The Council will have a development allowance of 10,284 units 2012-31 comprising
allocated sites and windfalls, as shown above. Extant permissions and completions to date
are additional to this figure. In total the Council needs to accommodate a housing
requirement of 11,648 over the plan period which is 613 dwellings per annum across the
whole of the area served by the Borough Council.