Embed Size (px)
Citation preview
The Burden of NeurologicalDiseases, Disorders and Injuries in Canada
The Burden of Neurological Diseases, Disorders and Injuries in Canada
F é d é ration des sciences neurologiques du Canada
canadian neurological sciences Federation
CANADIAN BRAIN ANDNERVE HEALTH COALITION

The contents of this publication may be reproduced in whole or in part, provided
the intended use is for non-commercial purposes and full acknowledgement is
given to the Canadian Institute for Health Information.
Canadian Institute for Health Information
495 Richmond Road
Suite 600
Ottawa, Ontario
K2A 4H6
Phone: 613-241-7860
Fax: 613-241-8120
www.cihi.ca
ISBN 978-1-55465-025-5
© 2007 Canadian Institute for Health Information
How to cite this document:
Canadian Institute for Health Information, The Burden of Neurological Diseases,
Disorders and Injuries in Canada (Ottawa: CIHI, 2007).
Cette publication est aussi disponible en français sous le titre Le fardeau des
maladies, troubles et traumatismes neurologiques au Canada.
ISBN 978-1-55465-027-9
Table of Contents
About the Canadian Neurological Sciences Federation . . . . . . . . . . . . . . . . .ii
About the Canadian Brain and Nerve Health Coalition . . . . . . . . . . . . . . . . . .ii
About the Canadian Institute for Health Information . . . . . . . . . . . . . . . . . . .iii
Acknowledgements . . . . . . . . . . . . . . . . . . . . . . . . . . . . . . . . . . . . . . . . . . . . .iv
Report Overview . . . . . . . . . . . . . . . . . . . . . . . . . . . . . . . . . . . . . . . . . . . . . . . .1
Highlighted Neurological Diseases, Disorders and Injuries
Alzheimer’s Disease . . . . . . . . . . . . . . . . . . . . . . . . . . . . . . . . . . . . . . . . . . . . .19
Amyotrophic Lateral Sclerosis . . . . . . . . . . . . . . . . . . . . . . . . . . . . . . . . . . . . .27
Brain Tumours . . . . . . . . . . . . . . . . . . . . . . . . . . . . . . . . . . . . . . . . . . . . . . . . .35
Cerebral Palsy . . . . . . . . . . . . . . . . . . . . . . . . . . . . . . . . . . . . . . . . . . . . . . . . .43
Epilepsy . . . . . . . . . . . . . . . . . . . . . . . . . . . . . . . . . . . . . . . . . . . . . . . . . . . . . .51
Head Injury . . . . . . . . . . . . . . . . . . . . . . . . . . . . . . . . . . . . . . . . . . . . . . . . . . .59
Headaches . . . . . . . . . . . . . . . . . . . . . . . . . . . . . . . . . . . . . . . . . . . . . . . . . . . .67
Multiple Sclerosis . . . . . . . . . . . . . . . . . . . . . . . . . . . . . . . . . . . . . . . . . . . . . . .73
Parkinson’s Disease . . . . . . . . . . . . . . . . . . . . . . . . . . . . . . . . . . . . . . . . . . . . .83
Spinal Injuries . . . . . . . . . . . . . . . . . . . . . . . . . . . . . . . . . . . . . . . . . . . . . . . . .91
Stroke . . . . . . . . . . . . . . . . . . . . . . . . . . . . . . . . . . . . . . . . . . . . . . . . . . . . . . . .99
Other Neurological Conditions . . . . . . . . . . . . . . . . . . . . . . . . . . . . . . . . . . .107
Appendix A: CBANHC-Affiliated Voluntary Health Organizations . . . . . . . .119
Appendix B: Data Sources and Methods . . . . . . . . . . . . . . . . . . . . . . . . . . .121
Appendix C: Neurological Condition Codes . . . . . . . . . . . . . . . . . . . . . . . .127
i i
About the Canadian NeurologicalSciences Federation
The Canadian Neurological Sciences Federation (CNSF), formerly theCanadian Congress of Neurological Sciences (CCNS), is an organizationrepresenting four member societies: the Canadian Neurological Society, the Canadian Neurosurgical Society, the Canadian Society of ClinicalNeurophysiologists and the Canadian Association of Child Neurologists.CNSF’s mission is to enhance the care of patients with diseases of the nervoussystem through education, advocacy and improved methods of diagnosis,treatment and rehabilitation.
For more information, visit CNSF’s website at www.cnsfederation.org.
About the Canadian Brain and Nerve Health Coalition
The Canadian Brain and Nerve Health Coalition (CBANHC), established bythe former CCNS, is a coalition of several voluntary health organizations andpractitioners with an interest in neurological disorders. CBANHC is committedto improving the quality of life of Canadians by promoting access to cost-effective treatments, supporting research and education and promoting publicand government awareness of the incidence and impact of nervous systemdisorders and injuries.

i i ii i i
About the Canadian Institute for Health Information
The Canadian Institute for Health Information (CIHI) collects and analyzesinformation on health and health care in Canada and makes it publiclyavailable. Canada’s federal, provincial and territorial governments createdCIHI as a not-for-profit, independent organization dedicated to forging acommon approach to Canadian health information. CIHI’s goal: to providetimely, accurate and comparable information. CIHI’s data and reports informhealth policies, support the effective delivery of health services and raiseawareness among Canadians of the factors that contribute to good health.
For more information, visit our website at www.cihi.ca.
As of March 2007, the following individuals are members of CIHI’s Boardof Directors:
• Mr. Graham W. S. Scott, C.M., Q.C. (Chair)Senior Partner, McMillan BinchMendelsohn LLP
• Ms. Glenda Yeates (ex officio)President and CEO, CIHI
• Dr. Peter BarrettPhysician and Faculty, Universityof Saskatchewan Medical School
• Ms. Roberta EllisVice President, Prevention Division,Workers’ Compensation Board ofBritish Columbia
• Mr. Kevin EmpeyExecutive Vice President, ClinicalSupport and Corporate Services,University Health Network
• Dr. Ivan FellegiChief Statistician of Canada,Statistics Canada
• Ms. Nora KellyDeputy Minister, New BrunswickMinistry of Health and Wellness
• Ms. Alice KennedyCOO, Long Term Care, EasternHealth, Newfoundland and Labrador
• Mr. David LevinePresident and Director General,Agence de la santé et des servicessociaux de Montréal
• Mr. Gordon MacateeDeputy Minister, British ColumbiaMinistry of Health Services
• Mr. Malcolm MaxwellCEO, Northern Health Authority
• Dr. Cordell Neudorf (Acting Chair, CPHI Council)Chief Medical Health Officerand Vice-President, Research,Saskatoon Health Region
• Mr. Roger PaquetDeputy Minister, ministère de laSanté et des Services sociaux
• Dr. Brian PostlCEO, Winnipeg RegionalHealth Authority
• Mr. Morris RosenbergDeputy Minister, Health Canada
• Mr. Ron SapsfordDeputy Minister, Ministry of Healthand Long-Term Care, Ontario
• Ms. Sheila WeatherillPresident and CEO, Capital HealthAuthority, Edmonton, Alberta

i v
Acknowledgements
The Canadian Institute for Health Information (CIHI) would like to acknowledgeand thank many individuals and organizations that have contributed to thedevelopment of this report.
The editorial committee for this report included Charles Tator (CBANHC),Garth Bray (CNSF), Dan Morin (CNSF), Greg Webster (CIHI), Heather Dawson(CIHI) and Aleksandra Jokovic (CIHI).
Other CIHI staff who contributed to the report include Kira Leeb, Jocalyn Clark,Jennifer Frood, Sharon Gushue, Debbie Gibson, Maureen Kelly, Anne-Marie Robert,Farhad Mehrtash, Karin Sundararajan and Sara Grimwood.
Members of the CBANHC Steering Committee who contributed to thisreport include:
• Barbara BeckettAssistant Director (Ottawa), Instituteof Neuroscience, Mental Health andAddiction, Canadian Institutes ofHealth Research
• Dr. Garth BrayVice-President, CNSF
• Dr. Robert BrownstoneDirector, Canadian Association forNeuroscience
• Denise CrepinFormer National Executive Director,Epilepsy Canada
• Maureen DanielsCo-Chair, Canadian Alliance of BrainTumour Organizations
• Jack DiamondResearch Director, AlzheimerSociety of Canada
• Sally GreggFormer Executive Director CCNS
• Deanna GroetzingerVice-President, GovernmentRelations and Policy, MultipleSclerosis Society of Canada
• David HintonInterim Executive Director,Canadian Paraplegic Association
• Inez JabalpurwalaPresident and CEO, NeuroscienceCanada Foundation
• John KumpfExecutive Director, Ontario BrainInjury Association
• Mary LewisGovernment Relations, Heart andStroke Foundation of Ontario
• Dan MorinChief Executive Officer, CNSF
• Barry MunroPresident, Canadian SpinalResearch Organization
• Mireille ProvostPresident, Brain Injury Associationof Canada
• Darlene Schindel, NeurosurgicalNurse Coordinator, CanadianAssociation of Neuroscience Nurses
• Charles TatorChair, CBANHC
v
CBANHC and its multiple partners wish to acknowledge and thank the followingorganizations that provided financial support in the form of unrestricted grantstowards the development of this report: GlaxoSmithKline Inc., Janssen-Ortho Inc.,Lundbeck Canada, Medtronic of Canada Ltd., Novartis Pharmaceuticals andPfizer Canada Inc. The CBANHC-affiliated voluntary health organizations andCNSF members who contributed to the report are acknowledged in Appendix A.
CIHI, CBANHC and CNSF would like to acknowledge the support of the PublicHealth Agency of Canada (PHAC) and, most specifically, the following for theircontribution to the economic burden estimates: Stephanie Jackson, SylvieDesjardins, Marie-France Giguère, Hélène Roberge and Serge Tanguay.
PHAC is an agency of Health Canada and works closely with provinces andterritories to improve and protect the health of Canadians, and to help reducepressures on the health care system. The Agency is focused on more effectiveefforts to prevent chronic diseases, prevent injuries and provide leadership onemergency preparedness and response to public health emergencies andinfectious disease outbreaks. For more information, visit PHAC’s website atwww.phac-aspc.gc.ca.
It should be noted that the analyses and conclusions in this report do notnecessarily reflect the views or opinions of the individual members of CBANHC,CNSF or their affiliated organizations.
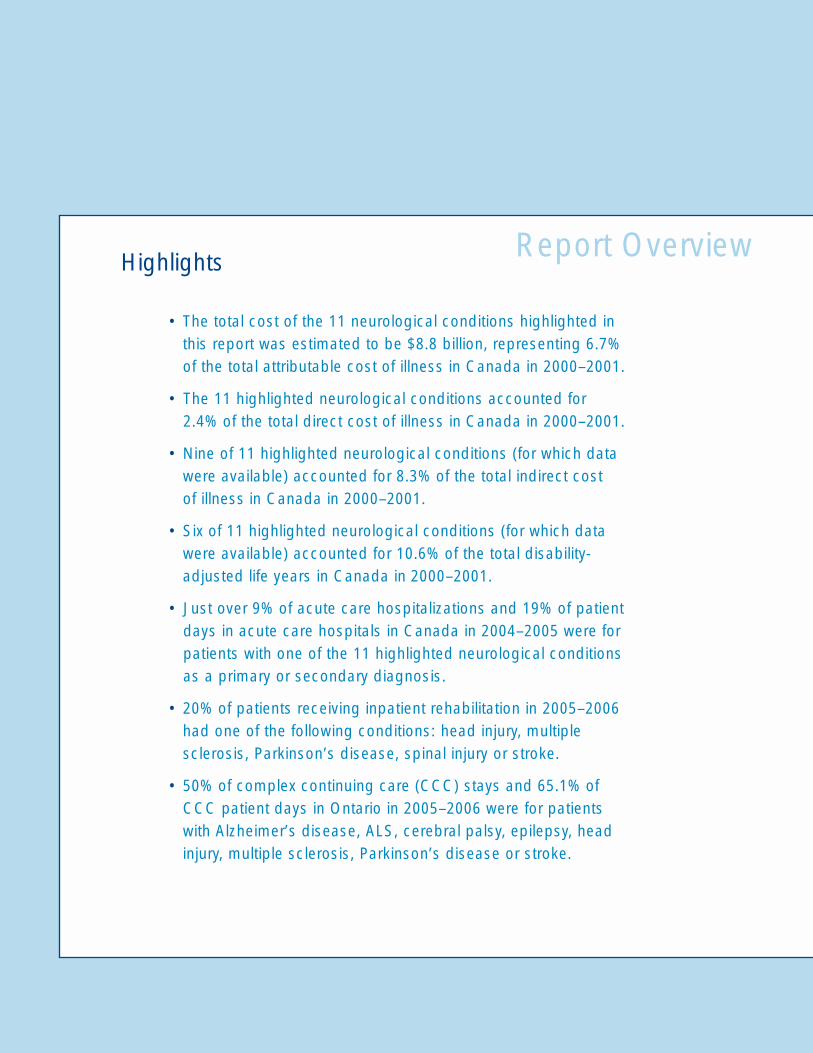
Highlights
• The total cost of the 11 neurological conditions highlighted inthis report was estimated to be $8.8 billion, representing 6.7%of the total attributable cost of illness in Canada in 2000–2001.
• The 11 highlighted neurological conditions accounted for 2.4% of the total direct cost of illness in Canada in 2000–2001.
• Nine of 11 highlighted neurological conditions (for which datawere available) accounted for 8.3% of the total indirect cost of illness in Canada in 2000–2001.
• Six of 11 highlighted neurological conditions (for which datawere available) accounted for 10.6% of the total disability-adjusted life years in Canada in 2000–2001.
• Just over 9% of acute care hospitalizations and 19% of patientdays in acute care hospitals in Canada in 2004–2005 were forpatients with one of the 11 highlighted neurological conditionsas a primary or secondary diagnosis.
• 20% of patients receiving inpatient rehabilitation in 2005–2006had one of the following conditions: head injury, multiplesclerosis, Parkinson’s disease, spinal injury or stroke.
• 50% of complex continuing care (CCC) stays and 65.1% ofCCC patient days in Ontario in 2005–2006 were for patientswith Alzheimer’s disease, ALS, cerebral palsy, epilepsy, headinjury, multiple sclerosis, Parkinson’s disease or stroke.
Report Overview

The World Health Organization (WHO) reported in 2006
that “a large body of evidence shows that policy-makers
and health-care providers may be unprepared to cope
with the predicted rise in the prevalence of neurological
and other chronic disorders and the disability resulting from the
extension of life expectancy and ageing of populations globally.”1
Neurological diseases, disorders and injuries represent one of the leadingcauses of disability in the Canadian population. Very few neurologicalconditions are curable, and many worsen over time. They produce a rangeof symptoms and functional limitations that pose daily challenges to individualsand their families. In addition, neurological conditions pose an economicburden to society. Because the incidence of neurological conditions increaseswith age, this burden may magnify as Canada’s population ages.
To date, there has been little focus on the burden of neurological diseases,disorders and injuries in Canada. Recognizing this, the Canadian Brain andNerve Health Coalition partnered with the Canadian Institute for HealthInformation and the Public Health Agency of Canada to create this report.
This report is intended to improve understanding of the epidemiology of neuro-logical conditions and the economic impact on the Canadian health care systemand society. Using available data sources, estimates of the economic burden,disability-adjusted life years (DALYs) and hospital utilization associated with 11neurological conditions are provided in the report. The report serves as abaseline of information about the burden of neurological conditions across thecountry and provides a foundation for future research in this area.
The neurological conditions highlighted in the report are:
• Alzheimer’s disease • Amyotrophic lateral sclerosis• Brain tumours • Cerebral palsy• Epilepsy• Head injury
The report also provides a short summary of current literature providedfrom CBANHC-affiliated voluntary health organizations for an additional20 neurological conditions.
Report Overview
1
• Headaches• Multiple sclerosis• Parkinson’s disease• Spinal injuries• Stroke
The Burden of Neurological Diseases, Disorders and Injuries in Canada
222
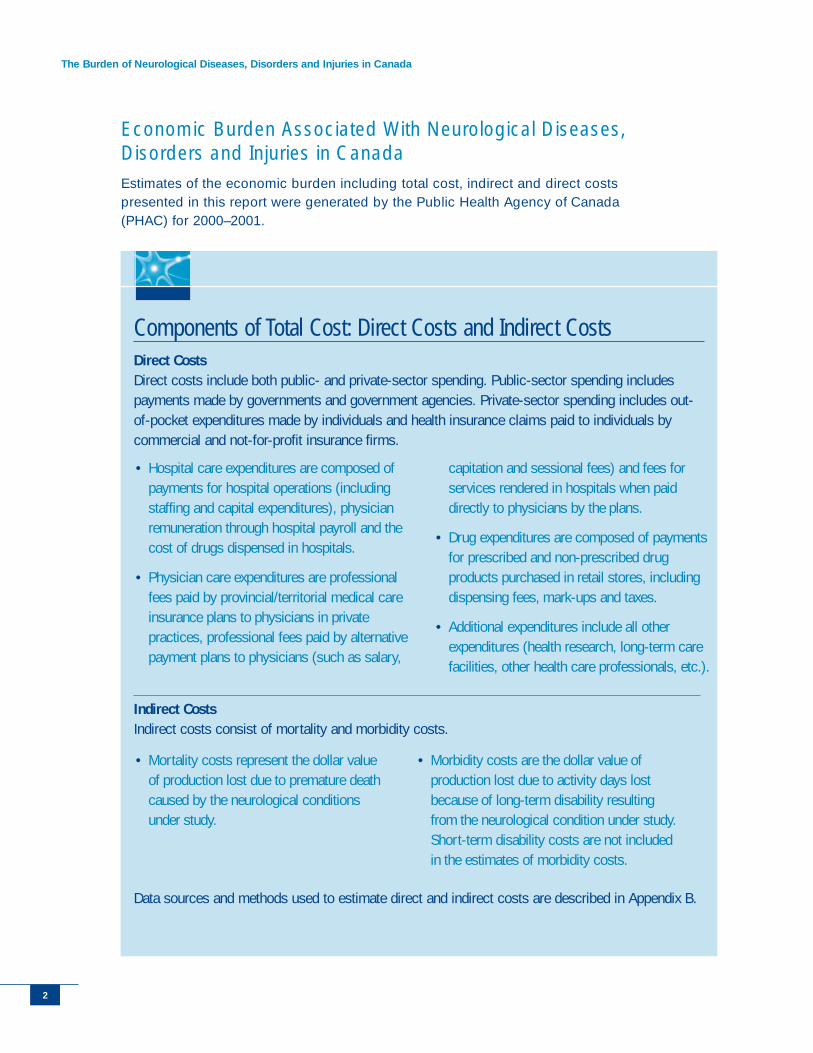
Economic Burden Associated With Neurological Diseases, Disorders and Injuries in Canada Estimates of the economic burden including total cost, indirect and direct costspresented in this report were generated by the Public Health Agency of Canada(PHAC) for 2000–2001.
Components of Total Cost: Direct Costs and Indirect CostsDirect CostsDirect costs include both public- and private-sector spending. Public-sector spending includespayments made by governments and government agencies. Private-sector spending includes out-of-pocket expenditures made by individuals and health insurance claims paid to individuals bycommercial and not-for-profit insurance firms.
Indirect CostsIndirect costs consist of mortality and morbidity costs.
Data sources and methods used to estimate direct and indirect costs are described in Appendix B.
• Hospital care expenditures are composed ofpayments for hospital operations (includingstaffing and capital expenditures), physicianremuneration through hospital payroll and thecost of drugs dispensed in hospitals.
• Physician care expenditures are professionalfees paid by provincial/territorial medical careinsurance plans to physicians in privatepractices, professional fees paid by alternativepayment plans to physicians (such as salary,
capitation and sessional fees) and fees forservices rendered in hospitals when paiddirectly to physicians by the plans.
• Drug expenditures are composed of paymentsfor prescribed and non-prescribed drugproducts purchased in retail stores, includingdispensing fees, mark-ups and taxes.
• Additional expenditures include all otherexpenditures (health research, long-term carefacilities, other health care professionals, etc.).
• Mortality costs represent the dollar valueof production lost due to premature deathcaused by the neurological conditionsunder study.
• Morbidity costs are the dollar value ofproduction lost due to activity days lostbecause of long-term disability resultingfrom the neurological condition under study.Short-term disability costs are not includedin the estimates of morbidity costs.
Report Overview
3
UnattributableCosts46.3%
OtherDiagnosticCategories
27.7%
Neoplasmsb
2.4%
Musculoskeletal Diseases 3.8%
Digestive Diseases 3.9%
Infectious andParasitic Diseases
1.5%
CardiovascularDiseasesa
6.6%RespiratoryDiseases
3.1%
EndocrineDisorders
2.5%
NeurologicalConditions
2.4%
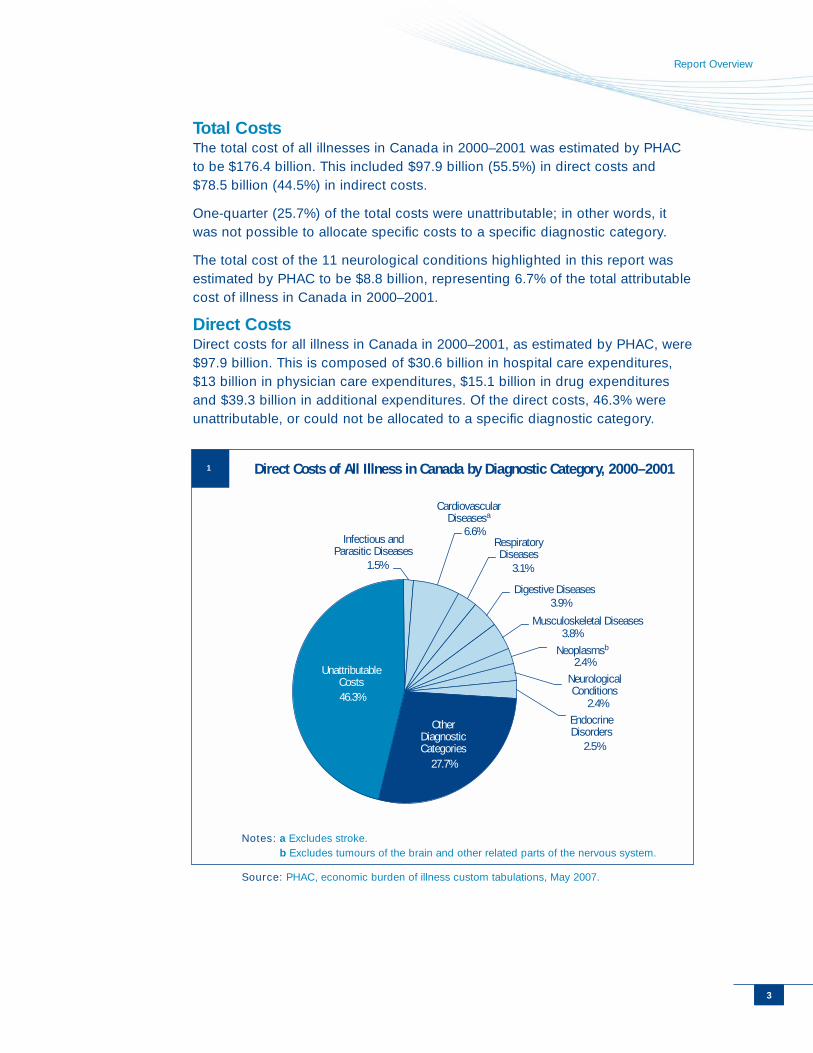
Total Costs The total cost of all illnesses in Canada in 2000–2001 was estimated by PHACto be $176.4 billion. This included $97.9 billion (55.5%) in direct costs and$78.5 billion (44.5%) in indirect costs.
One-quarter (25.7%) of the total costs were unattributable; in other words, itwas not possible to allocate specific costs to a specific diagnostic category.
The total cost of the 11 neurological conditions highlighted in this report wasestimated by PHAC to be $8.8 billion, representing 6.7% of the total attributablecost of illness in Canada in 2000–2001.
Direct CostsDirect costs for all illness in Canada in 2000–2001, as estimated by PHAC, were$97.9 billion. This is composed of $30.6 billion in hospital care expenditures,$13 billion in physician care expenditures, $15.1 billion in drug expendituresand $39.3 billion in additional expenditures. Of the direct costs, 46.3% wereunattributable, or could not be allocated to a specific diagnostic category.
33
1
Notes: a Excludes stroke.b Excludes tumours of the brain and other related parts of the nervous system.
Source: PHAC, economic burden of illness custom tabulations, May 2007.
Direct Costs of All Illness in Canada by Diagnostic Category, 2000–2001
The Burden of Neurological Diseases, Disorders and Injuries in Canada
444
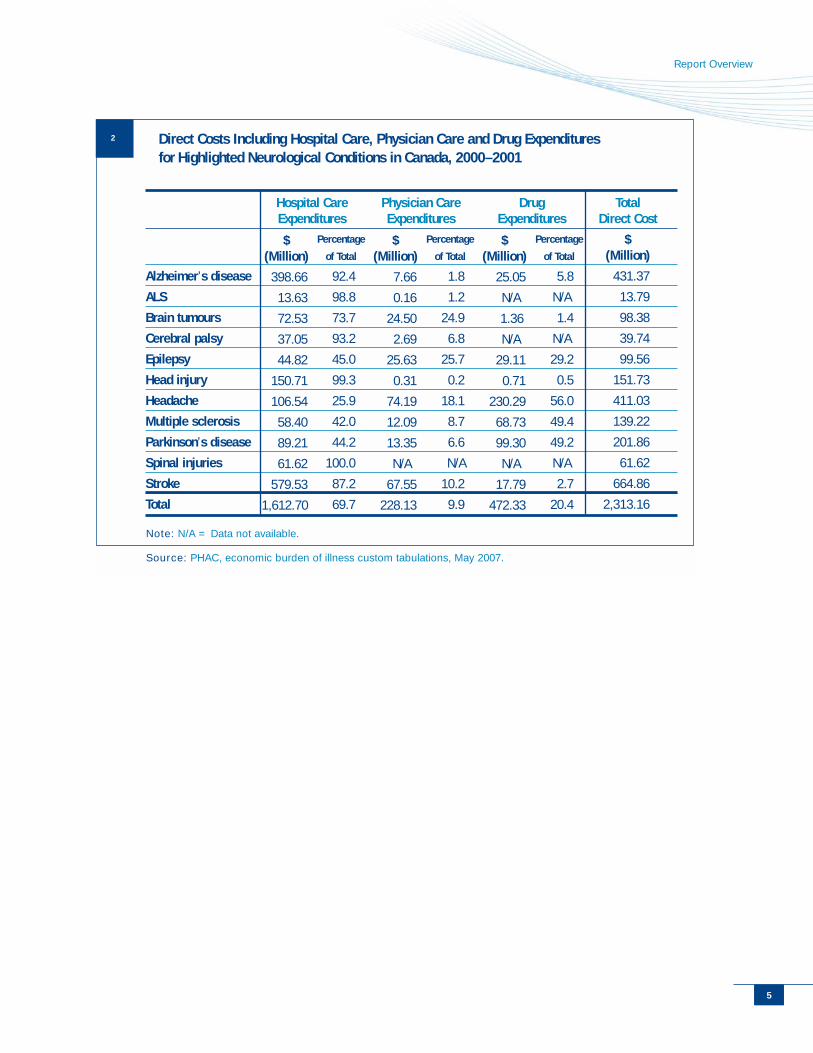
In 2000–2001, the direct costs associated with the 11 highlighted neurologicalconditions in Canada were estimated by PHAC to be $2.3 billion, representing2.4% of the direct costs of all illness. The neurological conditions made up5.3% of hospital care expenditures, 1.8% of physician care expenditures and3.1% of drug expenditures for all illness in Canada.
Hospital care expenditures accounted for just over two-thirds (69.7%) of thetotal attributable direct costs for the 11 highlighted neurological conditions.Drug expenditures comprised 20.4%, and physician care expenditures made up9.9%, of the total attributable direct costs.
Highlights of direct costs for the individual conditions:
• Stroke had the largest total direct costs (28.7%) among the 11 conditions,followed by Alzheimer’s disease (18.7%) and headaches (17.8%).
• Hospital care expenditures represented the largest component of thedirect costs for Alzheimer’s disease, ALS, brain tumours, cerebral palsy,head injury and stroke—ranging from 73.7% to 99.3%—and almost half ofthe direct costs for epilepsy, multiple sclerosis and Parkinson’s disease.
• Physician care expenditures made up the highest proportion of directcosts for epilepsy (25.7%), brain tumours (24.9%) and headache (18.1%).
• Drug expenditures accounted for about half of the direct costs forheadaches, multiple sclerosis and Parkinson’s disease.
PHAC notes the following limitations for drug expenditure estimates:
• Projected patterns of prescriptions by diagnostic category are based onsample data collected during patient visits to physicians,ii and do nottrack whether or not prescriptions are actually filled. As a result, thisdistribution may not reflect exact prescription drug usage patterns thatcontribute to expenditure estimates.
• Expenditures for the non-prescribed products could not be allocated todiagnostic categories since many of these over-the-counter drugs andpersonal health supplies could easily be allocated to more than onedisease category.
• Existing data do not include information on the number of non-prescription products being purchased in a given year in Canada.
Due to these limitations, drug expenditures for some of the neurologicalconditions may be underestimated.
i These samples are based on reporting periods of two consecutive days for four consecutive quarters by five regions
(Ontario, Quebec, the Maritimes, British Columbia and the Prairies) and eight physician specialities (general
practice/family medicine, internal medicine, psychiatry/neurology, obstetrics/gynecology, otolaryngology/ophthalmology,
surgery, pediatrics and dermatology).
Report Overview
555
Note: N/A = Data not available.
Source: PHAC, economic burden of illness custom tabulations, May 2007.
2 Direct Costs Including Hospital Care, Physician Care and Drug Expendituresfor Highlighted Neurological Conditions in Canada, 2000–2001
Alzheimer’s disease
ALS
Brain tumours
Cerebral palsy
Epilepsy
Head injury
Headache
Multiple sclerosis
Parkinson’s disease
Spinal injuries
Stroke
Total
Hospital CareExpenditures
Physician CareExpenditures
Drug Expenditures
Total Direct Cost
$(Million)
431.37
13.79
98.38
39.74
99.56
151.73
411.03
139.22
201.86
61.62
664.86
2,313.16
$(Million)
398.66
13.63
72.53
37.05
44.82
150.71
106.54
58.40
89.21
61.62
579.53
1,612.70
Percentage
of Total
92.4
98.8
73.7
93.2
45.0
99.3
25.9
42.0
44.2
100.0
87.2
69.7
$(Million)
7.66
0.16
24.50
2.69
25.63
0.31
74.19
12.09
13.35
N/A
67.55
228.13
Percentage
of Total
1.8
1.2
24.9
6.8
25.7
0.2
18.1
8.7
6.6
N/A
10.2
9.9
$(Million)
25.05
N/A
1.36
N/A
29.11
0.71
230.29
68.73
99.30
N/A
17.79
472.33
Percentage
of Total
5.8
N/A
1.4
N/A
29.2
0.5
56.0
49.4
49.2
N/A
2.7
20.4
The Burden of Neurological Diseases, Disorders and Injuries in Canada
666
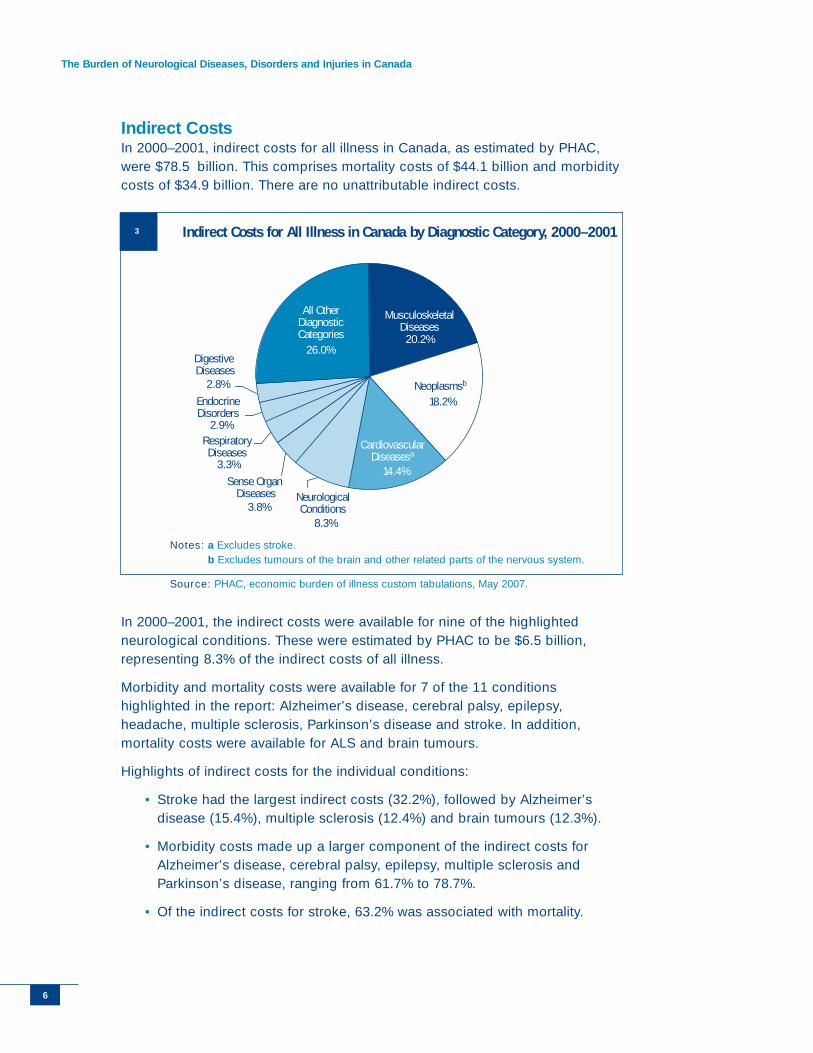
In 2000–2001, the indirect costs were available for nine of the highlightedneurological conditions. These were estimated by PHAC to be $6.5 billion,representing 8.3% of the indirect costs of all illness.
Morbidity and mortality costs were available for 7 of the 11 conditionshighlighted in the report: Alzheimer’s disease, cerebral palsy, epilepsy,headache, multiple sclerosis, Parkinson’s disease and stroke. In addition,mortality costs were available for ALS and brain tumours.
Highlights of indirect costs for the individual conditions:
• Stroke had the largest indirect costs (32.2%), followed by Alzheimer’sdisease (15.4%), multiple sclerosis (12.4%) and brain tumours (12.3%).
• Morbidity costs made up a larger component of the indirect costs forAlzheimer’s disease, cerebral palsy, epilepsy, multiple sclerosis andParkinson’s disease, ranging from 61.7% to 78.7%.
• Of the indirect costs for stroke, 63.2% was associated with mortality.
MusculoskeletalDiseases
20.2%
Neoplasmsb
18.2%
CardiovascularDiseasesa
14.4%
RespiratoryDiseases
3.3%
EndocrineDisorders
2.9%
All OtherDiagnosticCategories
26.0%Digestive Diseases
2.8%
NeurologicalConditions
8.3%
Sense Organ Diseases
3.8%
Indirect Costs for All Illness in Canada by Diagnostic Category, 2000–2001
Notes: a Excludes stroke.b Excludes tumours of the brain and other related parts of the nervous system.
Source: PHAC, economic burden of illness custom tabulations, May 2007.
3
Indirect CostsIn 2000–2001, indirect costs for all illness in Canada, as estimated by PHAC,were $78.5 billion. This comprises mortality costs of $44.1 billion and morbiditycosts of $34.9 billion. There are no unattributable indirect costs.
Report Overview
777
Disability-Adjusted Life Years (DALYs) Associated WithNeurological Disease, Disorders and Injuries in CanadaThe Global Burden of Disease study conducted in 2002 by the WHO, the WorldBank and the Harvard School of Public Health determined that neurologicaland psychiatric conditions accounted for 38.3% of the DALYs worldwide.2 Thisproportion was higher in developed countries, such as Canada.2 According tothe WHO 2006 report, in 2005, neurological conditionsiii contributed to 6.3% ofthe global burden of disease as measured bythe DALYs, compared to slightly over 5% forHIV/AIDS and malignant neoplasms, andaround 4% for ischemic heart diseases andrespiratory diseases.1 In the grouping ofcountries including Canada, neurologicalconditions constituted 10.9% of the DALYsfor all illnesses and were found to be a majorcause of lost years of healthy life (YDL).1
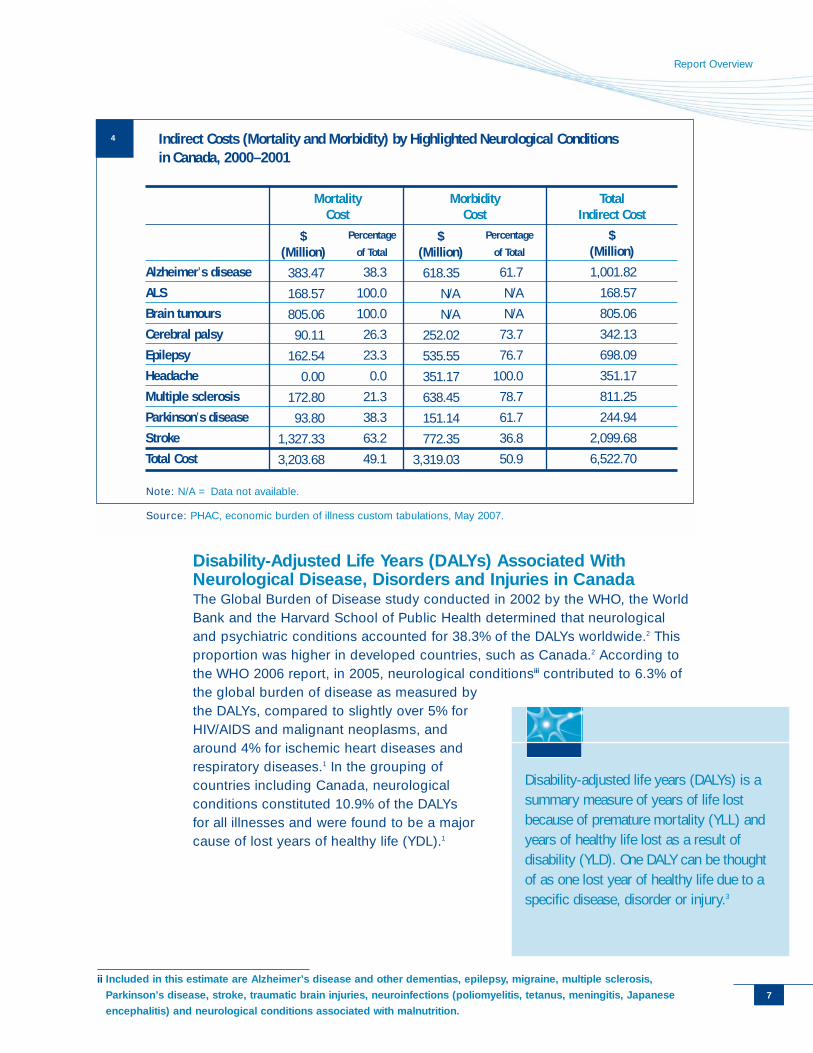
Note: N/A = Data not available.
Source: PHAC, economic burden of illness custom tabulations, May 2007.
4 Indirect Costs (Mortality and Morbidity) by Highlighted Neurological Conditionsin Canada, 2000–2001
Disability-adjusted life years (DALYs) is asummary measure of years of life lostbecause of premature mortality (YLL) andyears of healthy life lost as a result ofdisability (YLD). One DALY can be thoughtof as one lost year of healthy life due to aspecific disease, disorder or injury.3
ii Included in this estimate are Alzheimer’s disease and other dementias, epilepsy, migraine, multiple sclerosis,
Parkinson’s disease, stroke, traumatic brain injuries, neuroinfections (poliomyelitis, tetanus, meningitis, Japanese
encephalitis) and neurological conditions associated with malnutrition.
Alzheimer’s disease
ALS
Brain tumours
Cerebral palsy
Epilepsy
Headache
Multiple sclerosis
Parkinson’s disease
Stroke
Total Cost
Mortality Cost
Morbidity Cost
Total Indirect Cost
$(Million)
1,001.82
168.57
805.06
342.13
698.09
351.17
811.25
244.94
2,099.68
6,522.70
$(Million)
383.47
168.57
805.06
90.11
162.54
0.00
172.80
93.80
1,327.33
3,203.68
Percentage
of Total
38.3
100.0
100.0
26.3
23.3
0.0
21.3
38.3
63.2
49.1
$(Million)
618.35
N/A
N/A
252.02
535.55
351.17
638.45
151.14
772.35
3,319.03
Percentage
of Total
61.7
N/A
N/A
73.7
76.7
100.0
78.7
61.7
36.8
50.9
The Burden of Neurological Diseases, Disorders and Injuries in Canada
888
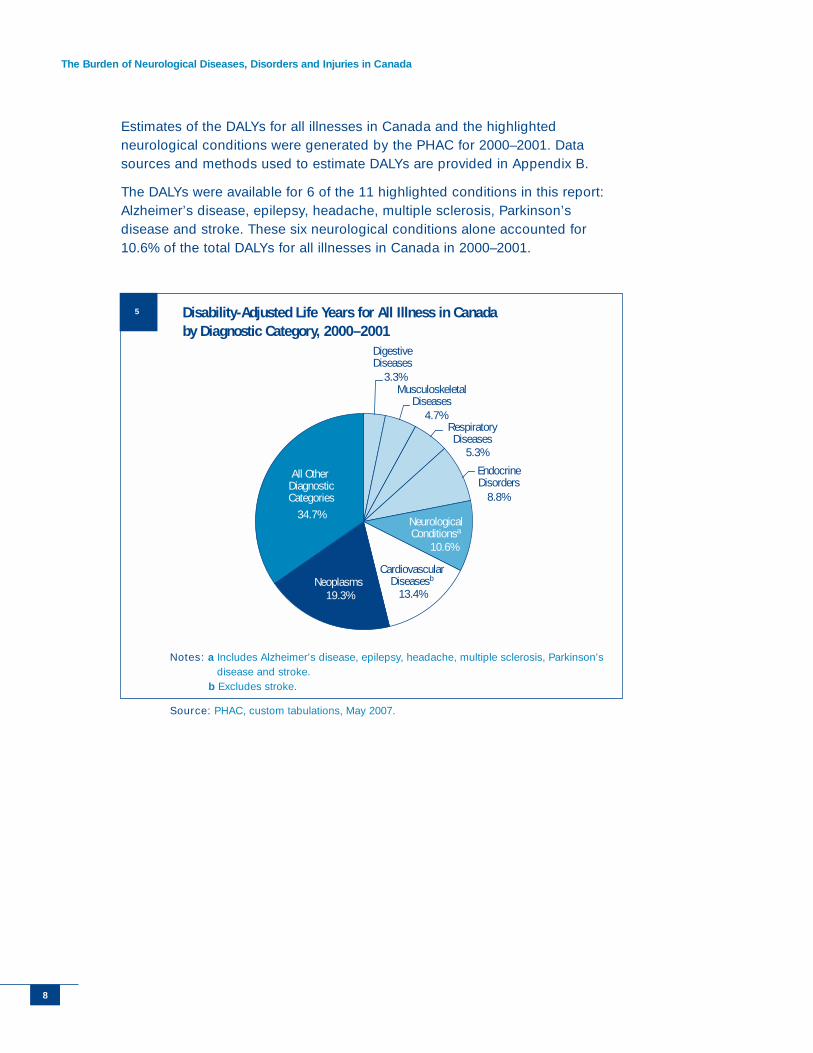
Estimates of the DALYs for all illnesses in Canada and the highlightedneurological conditions were generated by the PHAC for 2000–2001. Datasources and methods used to estimate DALYs are provided in Appendix B.
The DALYs were available for 6 of the 11 highlighted conditions in this report:Alzheimer’s disease, epilepsy, headache, multiple sclerosis, Parkinson’sdisease and stroke. These six neurological conditions alone accounted for10.6% of the total DALYs for all illnesses in Canada in 2000–2001.
DigestiveDiseases
3.3%Musculoskeletal
Diseases4.7%
RespiratoryDiseases
5.3%
EndocrineDisorders
8.8%
NeurologicalConditionsa
10.6%
CardiovascularDiseasesb
13.4%Neoplasms
19.3%
All Other DiagnosticCategories
34.7%
13.4%
Disability-Adjusted Life Years for All Illness in Canada by Diagnostic Category, 2000–2001
Notes: a Includes Alzheimer’s disease, epilepsy, headache, multiple sclerosis, Parkinson’sdisease and stroke.
b Excludes stroke.
Source: PHAC, custom tabulations, May 2007.
5
Report Overview
999
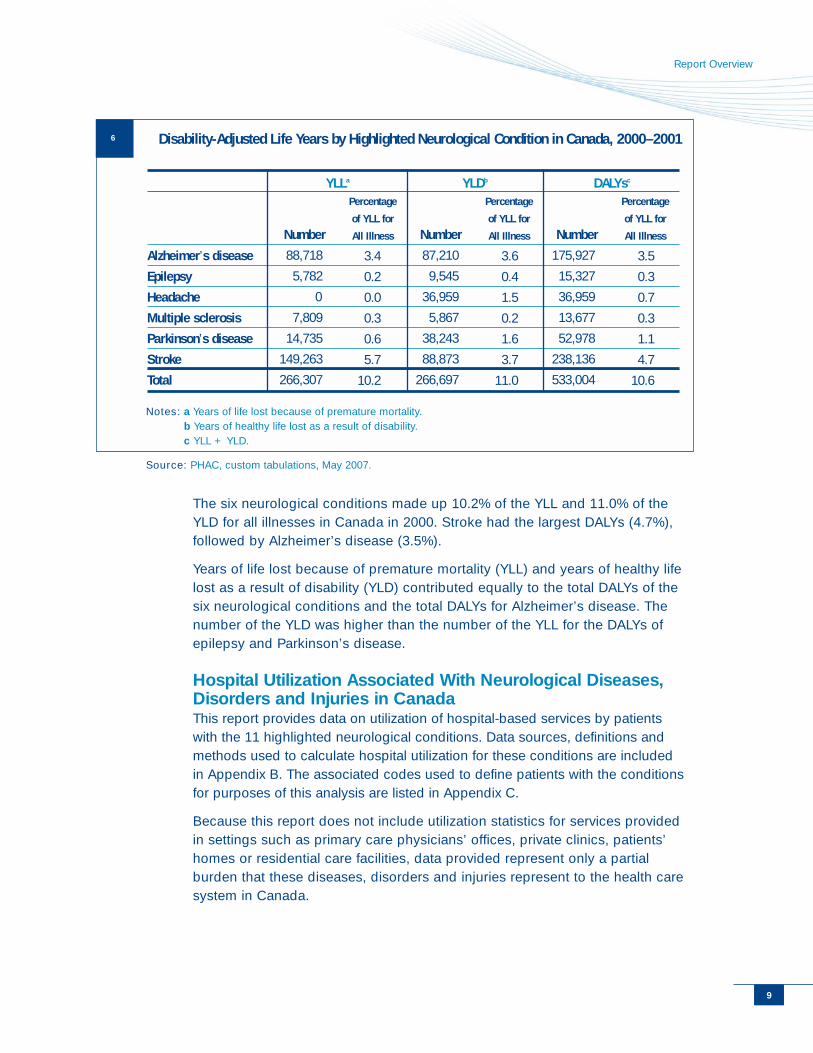
The six neurological conditions made up 10.2% of the YLL and 11.0% of theYLD for all illnesses in Canada in 2000. Stroke had the largest DALYs (4.7%),followed by Alzheimer’s disease (3.5%).
Years of life lost because of premature mortality (YLL) and years of healthy lifelost as a result of disability (YLD) contributed equally to the total DALYs of thesix neurological conditions and the total DALYs for Alzheimer’s disease. Thenumber of the YLD was higher than the number of the YLL for the DALYs ofepilepsy and Parkinson’s disease.
Hospital Utilization Associated With Neurological Diseases,Disorders and Injuries in CanadaThis report provides data on utilization of hospital-based services by patients with the 11 highlighted neurological conditions. Data sources, definitions andmethods used to calculate hospital utilization for these conditions are included in Appendix B. The associated codes used to define patients with the conditionsfor purposes of this analysis are listed in Appendix C.
Because this report does not include utilization statistics for services providedin settings such as primary care physicians’ offices, private clinics, patients’ homes or residential care facilities, data provided represent only a partialburden that these diseases, disorders and injuries represent to the health caresystem in Canada.
Notes: a Years of life lost because of premature mortality.b Years of healthy life lost as a result of disability.c YLL + YLD.
Source: PHAC, custom tabulations, May 2007.
6 Disability-Adjusted Life Years by Highlighted Neurological Condition in Canada, 2000–2001
Alzheimer’s disease
Epilepsy
Headache
Multiple sclerosis
Parkinson’s disease
Stroke
Total
Number
88,718
5,782
0
7,809
14,735
149,263
266,307
Percentage
of YLL for
All Illness
3.4
0.2
0.0
0.3
0.6
5.7
10.2
Number
87,210
9,545
36,959
5,867
38,243
88,873
266,697
Percentage
of YLL for
All Illness
3.6
0.4
1.5
0.2
1.6
3.7
11.0
Number
175,927
15,327
36,959
13,677
52,978
238,136
533,004
Percentage
of YLL for
All Illness
3.5
0.3
0.7
0.3
1.1
4.7
10.6
YLLa YLDb DALYsc
The Burden of Neurological Diseases, Disorders and Injuries in Canada
101010
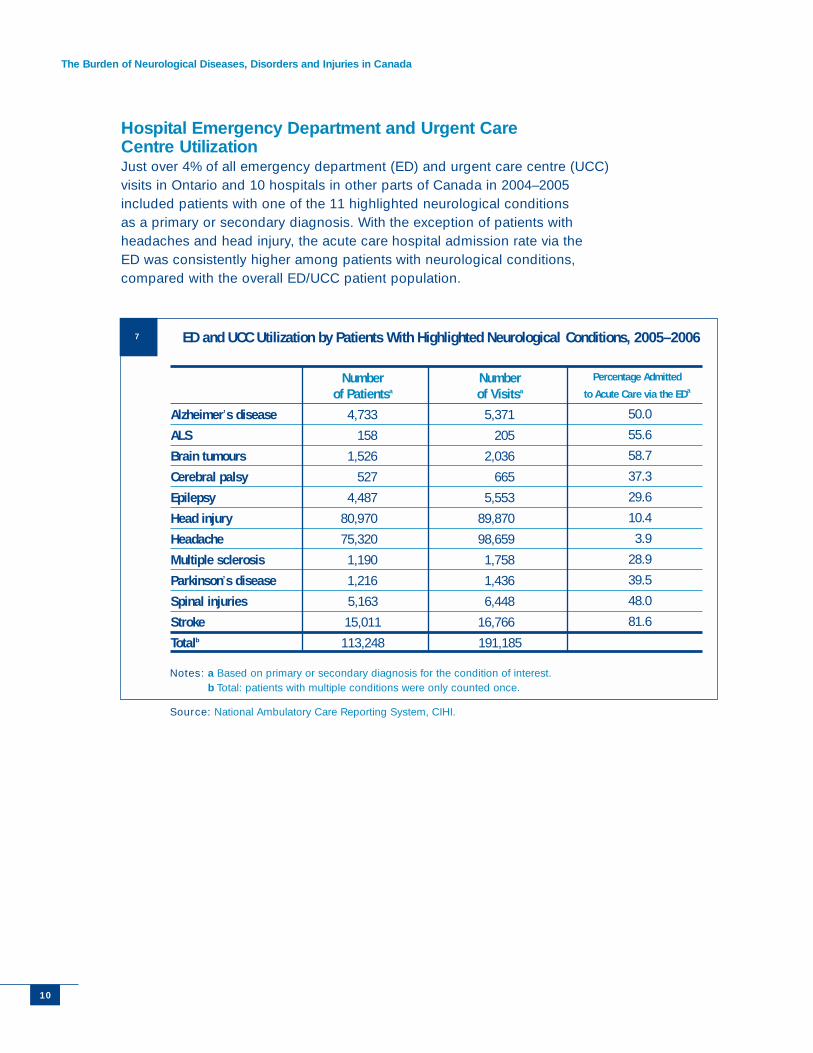
Hospital Emergency Department and Urgent Care Centre UtilizationJust over 4% of all emergency department (ED) and urgent care centre (UCC)visits in Ontario and 10 hospitals in other parts of Canada in 2004–2005included patients with one of the 11 highlighted neurological conditions as a primary or secondary diagnosis. With the exception of patients withheadaches and head injury, the acute care hospital admission rate via the ED was consistently higher among patients with neurological conditions,compared with the overall ED/UCC patient population.
Notes: a Based on primary or secondary diagnosis for the condition of interest.b Total: patients with multiple conditions were only counted once.
Source: National Ambulatory Care Reporting System, CIHI.
7 ED and UCC Utilization by Patients With Highlighted Neurological Conditions, 2005–2006
Alzheimer’s disease
ALS
Brain tumours
Cerebral palsy
Epilepsy
Head injury
Headache
Multiple sclerosis
Parkinson’s disease
Spinal injuries
Stroke
Totalb
Number of Patientsa
4,733
158
1,526
527
4,487
80,970
75,320
1,190
1,216
5,163
15,011
113,248
Number of Visitsa
5,371
205
2,036
665
5,553
89,870
98,659
1,758
1,436
6,448
16,766
191,185
Percentage Admitted
to Acute Care via the EDa
50.0
55.6
58.7
37.3
29.6
10.4
3.9
28.9
39.5
48.0
81.6
Report Overview
111111
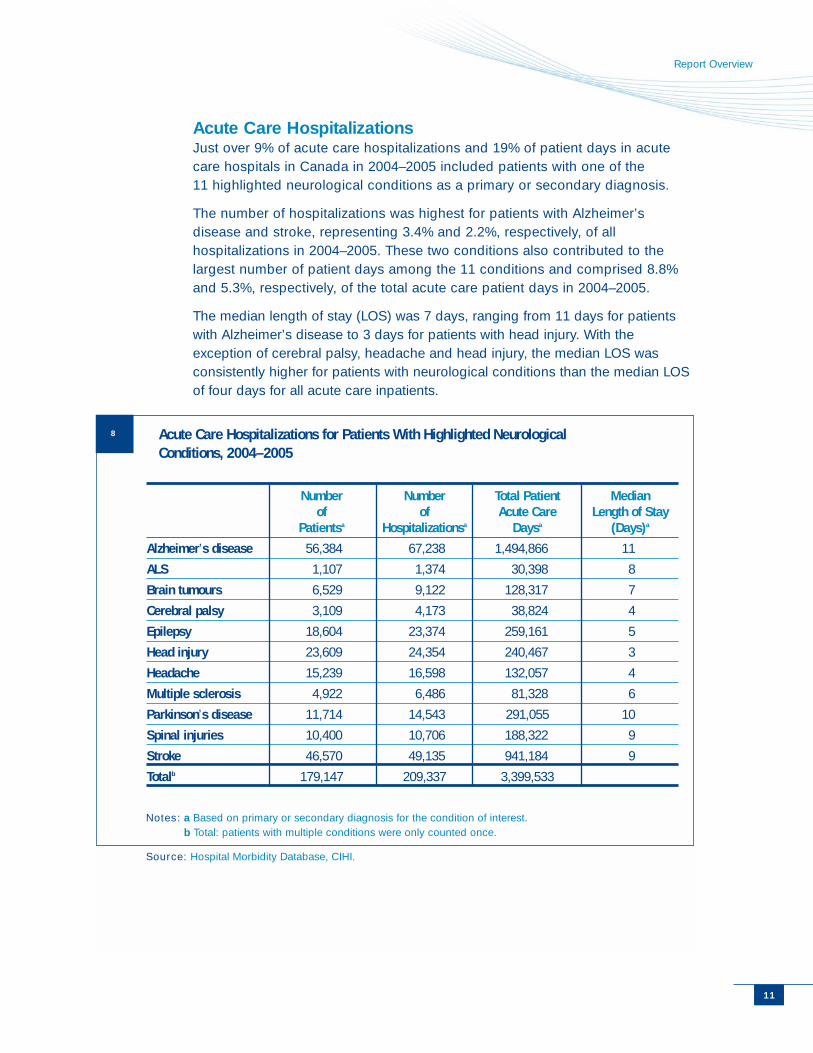
Acute Care HospitalizationsJust over 9% of acute care hospitalizations and 19% of patient days in acutecare hospitals in Canada in 2004–2005 included patients with one of the 11 highlighted neurological conditions as a primary or secondary diagnosis.
The number of hospitalizations was highest for patients with Alzheimer’sdisease and stroke, representing 3.4% and 2.2%, respectively, of allhospitalizations in 2004–2005. These two conditions also contributed to thelargest number of patient days among the 11 conditions and comprised 8.8%and 5.3%, respectively, of the total acute care patient days in 2004–2005.
The median length of stay (LOS) was 7 days, ranging from 11 days for patientswith Alzheimer’s disease to 3 days for patients with head injury. With theexception of cerebral palsy, headache and head injury, the median LOS wasconsistently higher for patients with neurological conditions than the median LOSof four days for all acute care inpatients.
Notes: a Based on primary or secondary diagnosis for the condition of interest.b Total: patients with multiple conditions were only counted once.
Source: Hospital Morbidity Database, CIHI.
8 Acute Care Hospitalizations for Patients With Highlighted NeurologicalConditions, 2004–2005
Alzheimer’s disease
ALS
Brain tumours
Cerebral palsy
Epilepsy
Head injury
Headache
Multiple sclerosis
Parkinson’s disease
Spinal injuries
Stroke
Totalb
Number of
Patientsa
56,384
1,107
6,529
3,109
18,604
23,609
15,239
4,922
11,714
10,400
46,570
179,147
Number of
Hospitalizationsa
67,238
1,374
9,122
4,173
23,374
24,354
16,598
6,486
14,543
10,706
49,135
209,337
Total PatientAcute Care
Daysa
1,494,866
30,398
128,317
38,824
259,161
240,467
132,057
81,328
291,055
188,322
941,184
3,399,533
Median Length of Stay
(Days)a
11
8
7
4
5
3
4
6
10
9
9
The Burden of Neurological Diseases, Disorders and Injuries in Canada
121212
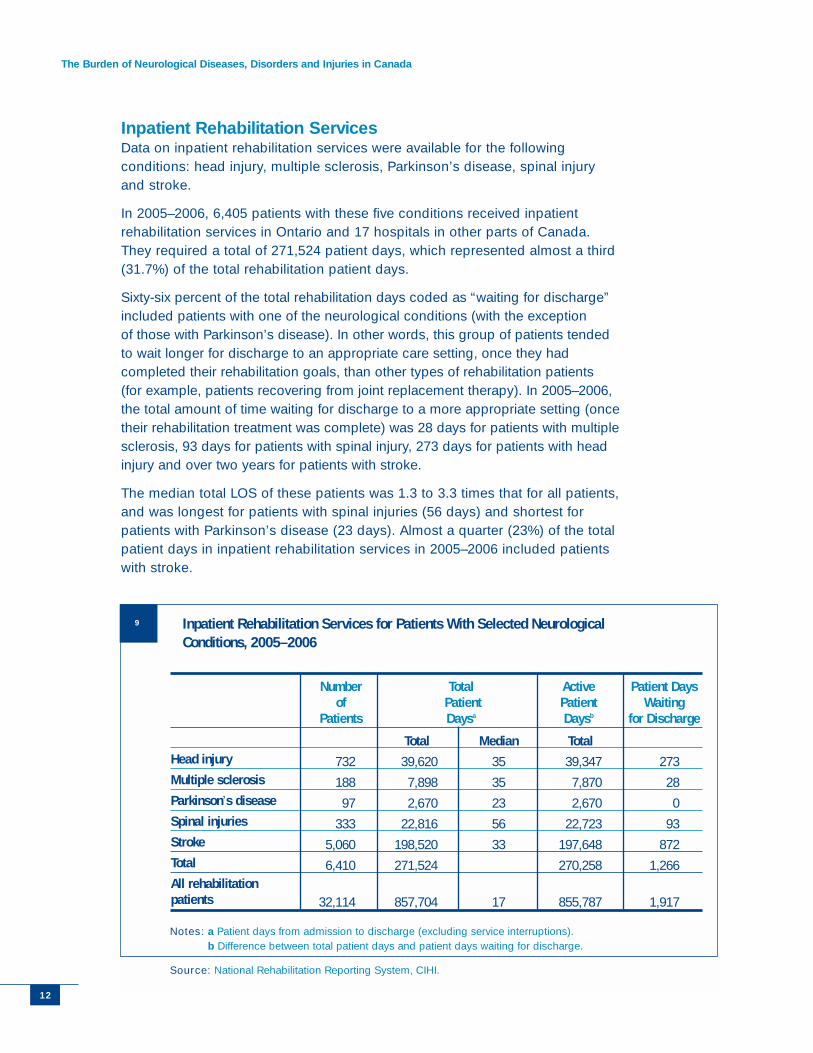
Inpatient Rehabilitation ServicesData on inpatient rehabilitation services were available for the followingconditions: head injury, multiple sclerosis, Parkinson’s disease, spinal injuryand stroke.
In 2005–2006, 6,405 patients with these five conditions received inpatientrehabilitation services in Ontario and 17 hospitals in other parts of Canada.They required a total of 271,524 patient days, which represented almost a third(31.7%) of the total rehabilitation patient days.
Sixty-six percent of the total rehabilitation days coded as “waiting for discharge”included patients with one of the neurological conditions (with the exception of those with Parkinson’s disease). In other words, this group of patients tendedto wait longer for discharge to an appropriate care setting, once they hadcompleted their rehabilitation goals, than other types of rehabilitation patients (for example, patients recovering from joint replacement therapy). In 2005–2006,the total amount of time waiting for discharge to a more appropriate setting (oncetheir rehabilitation treatment was complete) was 28 days for patients with multiplesclerosis, 93 days for patients with spinal injury, 273 days for patients with headinjury and over two years for patients with stroke.
The median total LOS of these patients was 1.3 to 3.3 times that for all patients,and was longest for patients with spinal injuries (56 days) and shortest forpatients with Parkinson’s disease (23 days). Almost a quarter (23%) of the totalpatient days in inpatient rehabilitation services in 2005–2006 included patientswith stroke.
Notes: a Patient days from admission to discharge (excluding service interruptions).b Difference between total patient days and patient days waiting for discharge.
Source: National Rehabilitation Reporting System, CIHI.
9 Inpatient Rehabilitation Services for Patients With Selected NeurologicalConditions, 2005–2006
Head injury
Multiple sclerosis
Parkinson’s disease
Spinal injuries
Stroke
Total
All rehabilitation patients
732
188
97
333
5,060
6,410
32,114
Total
39,620
7,898
2,670
22,816
198,520
271,524
857,704
Median
35
35
23
56
33
17
Total
39,347
7,870
2,670
22,723
197,648
270,258
855,787
273
28
0
93
872
1,266
1,917
Number Total Active Patient Days of Patient Patient Waiting
Patients Daysa Daysb for Discharge
Report Overview
131313
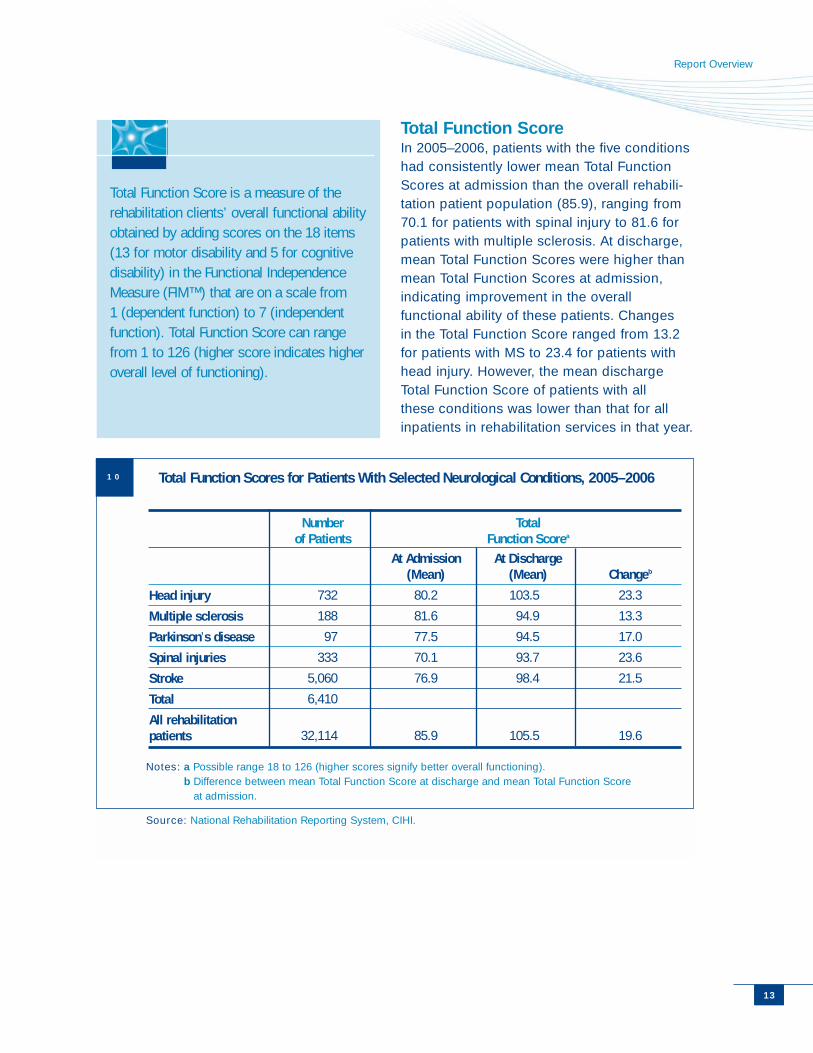
Total Function Score In 2005–2006, patients with the five conditionshad consistently lower mean Total FunctionScores at admission than the overall rehabili-tation patient population (85.9), ranging from70.1 for patients with spinal injury to 81.6 forpatients with multiple sclerosis. At discharge,mean Total Function Scores were higher thanmean Total Function Scores at admission,indicating improvement in the overallfunctional ability of these patients. Changesin the Total Function Score ranged from 13.2for patients with MS to 23.4 for patients withhead injury. However, the mean dischargeTotal Function Score of patients with allthese conditions was lower than that for allinpatients in rehabilitation services in that year.
Total Function Score is a measure of therehabilitation clients’ overall functional abilityobtained by adding scores on the 18 items(13 for motor disability and 5 for cognitivedisability) in the Functional IndependenceMeasure (FIM™) that are on a scale from1 (dependent function) to 7 (independentfunction). Total Function Score can rangefrom 1 to 126 (higher score indicates higheroverall level of functioning).
Notes: a Possible range 18 to 126 (higher scores signify better overall functioning).b Difference between mean Total Function Score at discharge and mean Total Function Score
at admission.
Source: National Rehabilitation Reporting System, CIHI.
10 Total Function Scores for Patients With Selected Neurological Conditions, 2005–2006
Head injury
Multiple sclerosis
Parkinson’s disease
Spinal injuries
Stroke
Total
All rehabilitationpatients
732
188
97
333
5,060
6,410
32,114
At Admission(Mean)
80.2
81.6
77.5
70.1
76.9
85.9
At Discharge(Mean)
103.5
94.9
94.5
93.7
98.4
105.5
Changeb
23.3
13.3
17.0
23.6
21.5
19.6
Number Totalof Patients Function Scorea
The Burden of Neurological Diseases, Disorders and Injuries in Canada
141414
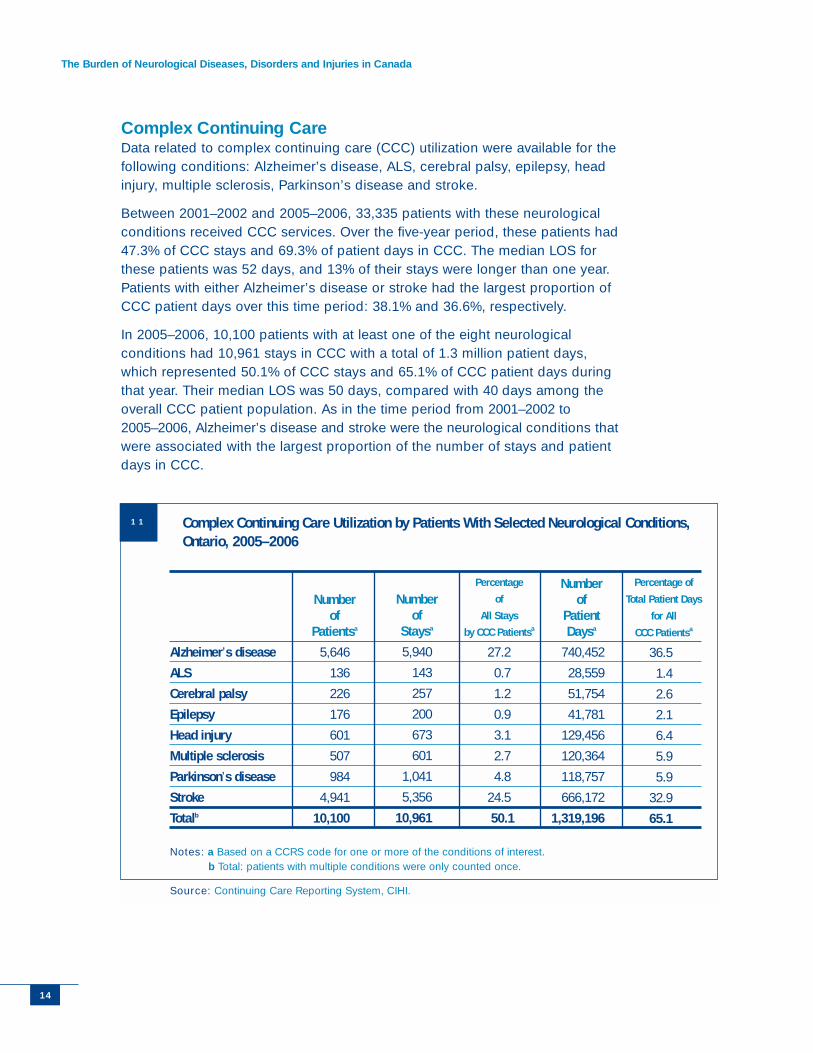
Complex Continuing CareData related to complex continuing care (CCC) utilization were available for thefollowing conditions: Alzheimer’s disease, ALS, cerebral palsy, epilepsy, headinjury, multiple sclerosis, Parkinson’s disease and stroke.
Between 2001–2002 and 2005–2006, 33,335 patients with these neurologicalconditions received CCC services. Over the five-year period, these patients had47.3% of CCC stays and 69.3% of patient days in CCC. The median LOS forthese patients was 52 days, and 13% of their stays were longer than one year.Patients with either Alzheimer’s disease or stroke had the largest proportion ofCCC patient days over this time period: 38.1% and 36.6%, respectively.
In 2005–2006, 10,100 patients with at least one of the eight neurologicalconditions had 10,961 stays in CCC with a total of 1.3 million patient days,which represented 50.1% of CCC stays and 65.1% of CCC patient days duringthat year. Their median LOS was 50 days, compared with 40 days among theoverall CCC patient population. As in the time period from 2001–2002 to2005–2006, Alzheimer’s disease and stroke were the neurological conditions thatwere associated with the largest proportion of the number of stays and patientdays in CCC.
Notes: a Based on a CCRS code for one or more of the conditions of interest.b Total: patients with multiple conditions were only counted once.
Source: Continuing Care Reporting System, CIHI.
11 Complex Continuing Care Utilization by Patients With Selected Neurological Conditions,Ontario, 2005–2006
Alzheimer’s disease
ALS
Cerebral palsy
Epilepsy
Head injury
Multiple sclerosis
Parkinson’s disease
Stroke
Totalb
Number of
Patientsa
5,646
136
226
176
601
507
984
4,941
10,100
Number of
Staysa
5,940
143
257
200
673
601
1,041
5,356
10,961
Percentage
of
All Stays
by CCC Patientsa
27.2
0.7
1.2
0.9
3.1
2.7
4.8
24.5
50.1
Number of
Patient Daysa
740,452
28,559
51,754
41,781
129,456
120,364
118,757
666,172
1,319,196
Percentage of
Total Patient Days
for All
CCC Patientsa
36.5
1.4
2.6
2.1
6.4
5.9
5.9
32.9
65.1
Report Overview
151515
The Way Forward: Understanding the Burden ofNeurological Conditions in CanadaUsing the most current data from existing data sources, new information andanalyses to illustrate the economic burden, DALYs and hospital utilizationassociated with neurological diseases, disorders and injuries in Canadahave been presented in this report. However, there are some limitations tothis analysis:
• The direct costs of the neurological diseases, disorders and injuries inthis report include only expenditures for hospital care, physician care anddrugs. By excluding other direct costs, such as costs for transportationand medical devices such as braces, splints, walkers and wheelchairs,the economic burden associated with these conditions is underestimated.
• Limitations to the way drug expenditures are calculated may underestimatetrue prescription drug expenditures, and costs for over-the-counter drugsand personal health supplies, for some of the neurological conditions.
• The indirect costs presented in the report may be a conservative estimateof the morbidity and mortality costs associated with neurologicalconditions because cost data were available for only 7 of the 11conditions. Only mortality costs were provided for ALS and brain tumours,and morbidity costs include only long-term disability costs.
• Indirect costs do not include the value of time lost from work and leisureactivities by family members or friends who help care for the person withthe neurological condition of interest.
• The DALYs were estimated for only 6 of the 11 highlighted conditions,and therefore the information that the report provides is a partial pictureof the impact of these conditions based on this measure.
The health system utilization information is limited to hospital-based care anddoes not reflect utilization associated with community-based care, such as careprovided in general practitioners’ offices, private clinics and patients’ homes.This is partly due to the limited scope of this report and partly due to the lackof comprehensive information about community-based care for the conditionsexamined in the report. Considering this and that the data for the ED/UCCvisits, inpatient rehabilitation services and CCC are primarily limited to hospitalsin Ontario, the report provides only a partial picture of the burden thatneurological diseases, disorders and injuries represent to the Canadianhealth care system.
The Burden of Neurological Diseases, Disorders and Injuries in Canada
161616
Possible Areas for Future StudyThe burden of the 11 highlighted neurological diseases, disorders and injuriespresented in the report is not the full picture of the impact that these conditionshave on individuals, communities, society and the health care system in Canada.Nevertheless, the report provides information that will serve as a baseline infuture research involving these conditions, as well as insight about the data gapsand the improvements required to establish a comprehensive picture. Theinformation provided for the 11 highlighted conditions is an important indicationof the likely magnitude of the total burden of neurological diseases, disordersand injuries in Canada.
Areas for future study that could provide additional information to supportdiscussion around the burden of neurological diseases, disorders and injuriesinclude the following:
• Explore continuity and pathways of care (for example, acute carehospitalization and transfer to rehabilitation or CCC) for patients withneurological conditions.
• Examine how factors such as severity of illness, comorbidities and qualityof care influence the patterns of health care utilization by patients withneurological conditions.
• Understand the health outcomes associated with the care received bypatients with neurological conditions (for example, Total FunctionalScores of patients who have and have not had inpatient rehabilitation).
• Measure more comprehensively the economic burden of neurologicalconditions and the effects they have on the quality of life of these patients.
• Explore the effect of timely access to care and early diagnosis andtreatment on the onset of neurological conditions and the development of disability.
• Explore gaps in data and potential solutions that would lead to morecomprehensive information about the burden of neurological conditionsoutside of those examined in detail in this report.
Report Overview
171717
References
1 World Health Organization, Neurological Disorders: Public Health Challenges(Switzerland: WHO Press, 2006), [online], cited February 28, 2007, from<http://www.who.int/mental_health/neurology/neurological_disorders_report_web.pdf>.
2 C. J. L. Murray and A. D. Lopez, eds., The Global Burden of Disease: A Compre-hensive Assessment of Mortality and Disability From Diseases, Injuries and RiskFactors in 1990 and Projected to 2020 (Cambridge, MA: Harvard School of PublicHealth on behalf of the World Health Organization and the World Bank, 1996)(Global Burden of Disease and Injury Series, Vol. I).
3 World Health Organization, Estimates of Mortality, YLL, YLD and DALYs by Sex, Ageand Cause for 14 WHO Subregions for 2002 as Reported in the World Health Report2004, Annex Tables (Geneva: WHO, 2004), [online], cited January 26, 2007, from<http://www.who.int/healthinfo/bodgbod/2002revised/e>.
Highlights
• Alzheimer’s disease and other dementias accounted for $431.4 million in direct costs and $1 billion in indirectcosts in Canada in 2000–2001.
• 50% of patients with Alzheimer’s disease visiting EDsin Ontario in 2005–2006 were admitted to acutecare hospitals.
• The number of acute care hospitalizations across Canadafor patients with Alzheimer’s disease increased by 38%between 2000–2001 and 2004–2005.
• Almost 9% of patient days in Canadian acute carehospitals for patients aged 19 and older included patients with Alzheimer’s disease as a primary orsecondary condition in 2004–2005.
Alzheimer’s Disease
What Is Alzheimer’s Disease?Alzheimer’s disease (AD) is a progressive degenerative
disease characterized by a general decline in mental
abilities involving memory, language and logical thinking.1
Accumulations of dense, irregular deposits (called “plaques”) in
certain regions of the brain and thread-like “tangles” within
individual neurons are the pathological hallmarks of AD.1,2
According to the Alzheimer Society of Canada, AD is more common thanany other type of dementia (64% of all cases in Canada).3 The Society alsoestimates that there are approximately 280,000 Canadians over the age of 65with AD.3 A study by the Canadian Study of Health and Aging Working Groupestimates that 60,000 new cases of dementia occur each year.4
The prevalence and incidence of dementia increase with age.2 Women are at a higher risk of developing AD, partly because they live longer than men.5
AD has also been associated with previous head injury, high cholesterol andfamily history.2 In addition, there are risk factors (such as smoking, lack ofexercise, poor nutrition, genetic predisposition and lower social status) that areless firmly established.6,7
Signs and SymptomsThe signs and symptoms of AD gradually worsen over time.1 Symptoms mayinclude confusion and memory loss, disorientation and changes in mood andbehaviour.1 As the disease progresses, patients usually develop difficulty withactivities of daily living, agitation and depression, difficulties recognizing familyand friends, loss of speech and, eventually, total dependence on others.1
Diagnosis and TreatmentsAD is diagnosed with fair certainty through medical history, blood and urinetests (to rule out other forms of dementia), neuropsychological tests formemory and problem-solving and brain imaging.1 However, post-mortemexamination of the brain is required for a definitive diagnosis of the disease.1
Alzheimer’s Disease
1919
The Burden of Neurological Diseases, Disorders and Injuries in Canada
20
There is currently no cure for AD. However, several medications are availablethat can delay the progression of the disease and improve the symptoms ofdepression, agitation and sleep problems.1 Cognitive rehabilitation, duringwhich individuals are taught new strategies to recall important information andgo about their daily tasks, is also used as part of treatment.
Economic Burden The PHAC estimates that total costs associated with AD in 2000–2001 were$1.4 billion.
• Direct costs were $431.4 million: $398.7 million (92.4%) for hospital care,$7.7 million (1.8%) for physician care and $25.1 million (5.8%) for drugs.
• Indirect costs were $1 billion: $383.5 million (38.3%) in mortality cost and$618.4 million (61.7%) in morbidity cost.
Disability-Adjusted Life Years (DALYs)The PHAC estimates that in 2000–2001, AD and other dementias were associated with almost 176,000DALYs, accounting for 3.5% of the DALYs for allillnesses in Canada. The years of life lost due topremature mortality and the years of healthy life lostdue to disability represented almost equal parts ofthe DALYs for AD and other dementias: 50.4% and49.6%, respectively.
Hospital UtilizationCIHI data were used to provide information onemergency department (ED) and urgent care centre(UCC) visits, and acute care and complex continuingcare (CCC) hospitalizations for patients with AD.
Disability-adjusted life years (DALYs)is a summary measure of years of lifelost because of premature mortality(YLL) and years of healthy life lost asa result of disability (YLD). One DALYcan be thought of as one lost year ofhealthy life due to a specific disease,disorder or injury.
Alzheimer’s Disease
2121
0
10
20
30
40
50
50–59 60–69 70–79 80–89 90+Age (Years)
Perc
enta
ge o
f Pat
ient
s
ED/UCC Inpatient Acute Care Complex Continuing Care
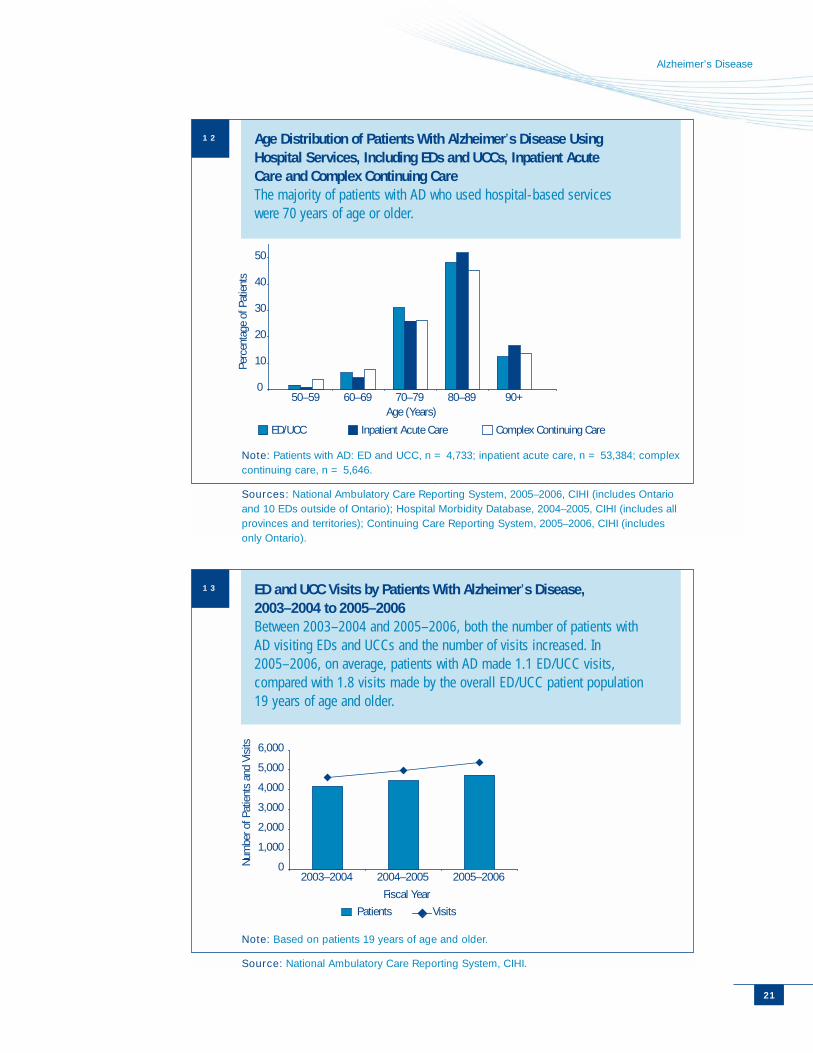
Age Distribution of Patients With Alzheimer’s Disease Using Hospital Services, Including EDs and UCCs, Inpatient Acute Care and Complex Continuing CareThe majority of patients with AD who used hospital-based serviceswere 70 years of age or older.
Note: Patients with AD: ED and UCC, n = 4,733; inpatient acute care, n = 53,384; complexcontinuing care, n = 5,646.
Sources: National Ambulatory Care Reporting System, 2005–2006, CIHI (includes Ontarioand 10 EDs outside of Ontario); Hospital Morbidity Database, 2004–2005, CIHI (includes allprovinces and territories); Continuing Care Reporting System, 2005–2006, CIHI (includesonly Ontario).
0
1,000
2,000
3,000
4,000
5,000
6,000
2003–2004 2004–2005 2005–2006
Fiscal Year
Num
ber o
f Pat
ient
s an
d Vi
sits
Patients Visits
ED and UCC Visits by Patients With Alzheimer’s Disease, 2003–2004 to 2005–2006Between 2003–2004 and 2005–2006, both the number of patients with AD visiting EDs and UCCs and the number of visits increased. In2005–2006, on average, patients with AD made 1.1 ED/UCC visits,compared with 1.8 visits made by the overall ED/UCC patient population 19 years of age and older.
Note: Based on patients 19 years of age and older.
Source: National Ambulatory Care Reporting System, CIHI.
12
13
The Burden of Neurological Diseases, Disorders and Injuries in Canada
22
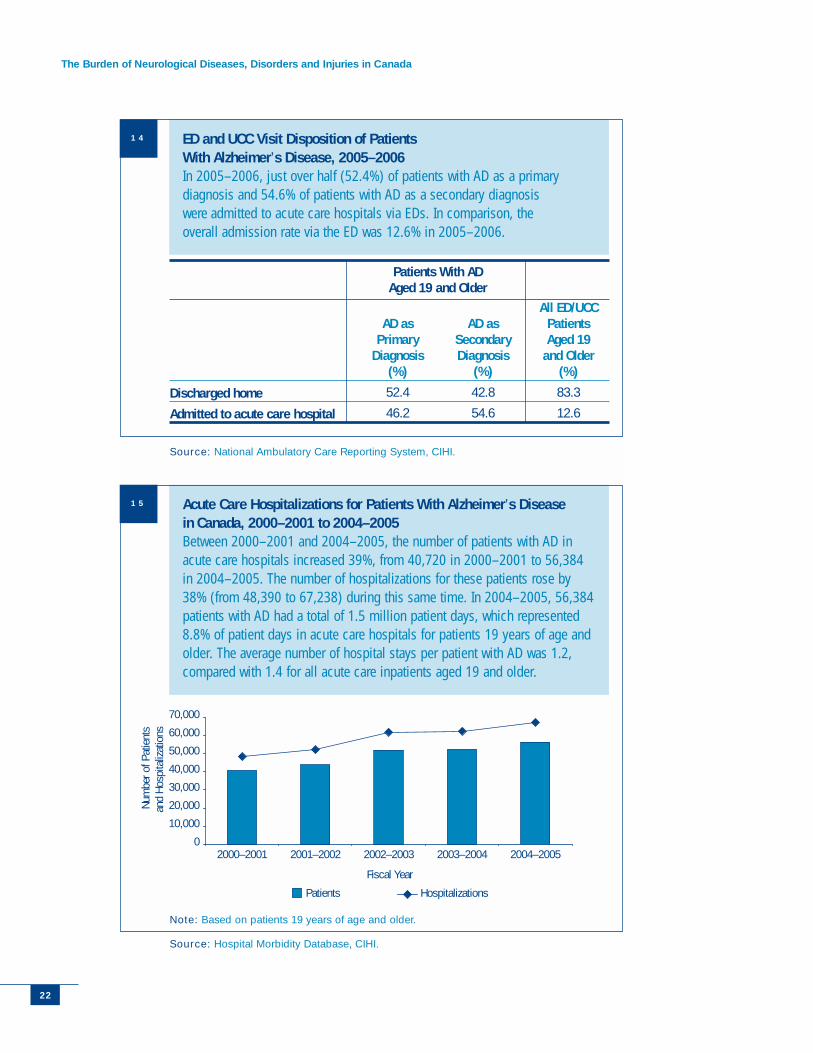
ED and UCC Visit Disposition of Patients With Alzheimer’s Disease, 2005–2006In 2005–2006, just over half (52.4%) of patients with AD as a primarydiagnosis and 54.6% of patients with AD as a secondary diagnosiswere admitted to acute care hospitals via EDs. In comparison, theoverall admission rate via the ED was 12.6% in 2005–2006.
Source: National Ambulatory Care Reporting System, CIHI.
0
10,000
20,000
30,000
40,000
50,000
60,000
70,000
2000–2001 2001–2002 2002–2003 2003–2004 2004–2005
Fiscal Year
Num
ber o
f Pat
ient
san
d Ho
spita
lizat
ions
Patients Hospitalizations
Acute Care Hospitalizations for Patients With Alzheimer’s Diseasein Canada, 2000–2001 to 2004–2005Between 2000–2001 and 2004–2005, the number of patients with AD inacute care hospitals increased 39%, from 40,720 in 2000–2001 to 56,384in 2004–2005. The number of hospitalizations for these patients rose by38% (from 48,390 to 67,238) during this same time. In 2004–2005, 56,384patients with AD had a total of 1.5 million patient days, which represented8.8% of patient days in acute care hospitals for patients 19 years of age andolder. The average number of hospital stays per patient with AD was 1.2,compared with 1.4 for all acute care inpatients aged 19 and older.
Note: Based on patients 19 years of age and older.
Source: Hospital Morbidity Database, CIHI.
Patients With AD Aged 19 and Older
Discharged home
Admitted to acute care hospital
AD as Primary
Diagnosis(%)
52.4
46.2
AD asSecondaryDiagnosis
(%)
42.8
54.6
All ED/UCCPatients Aged 19
and Older(%)
83.3
12.6
14
15
Alzheimer’s Disease
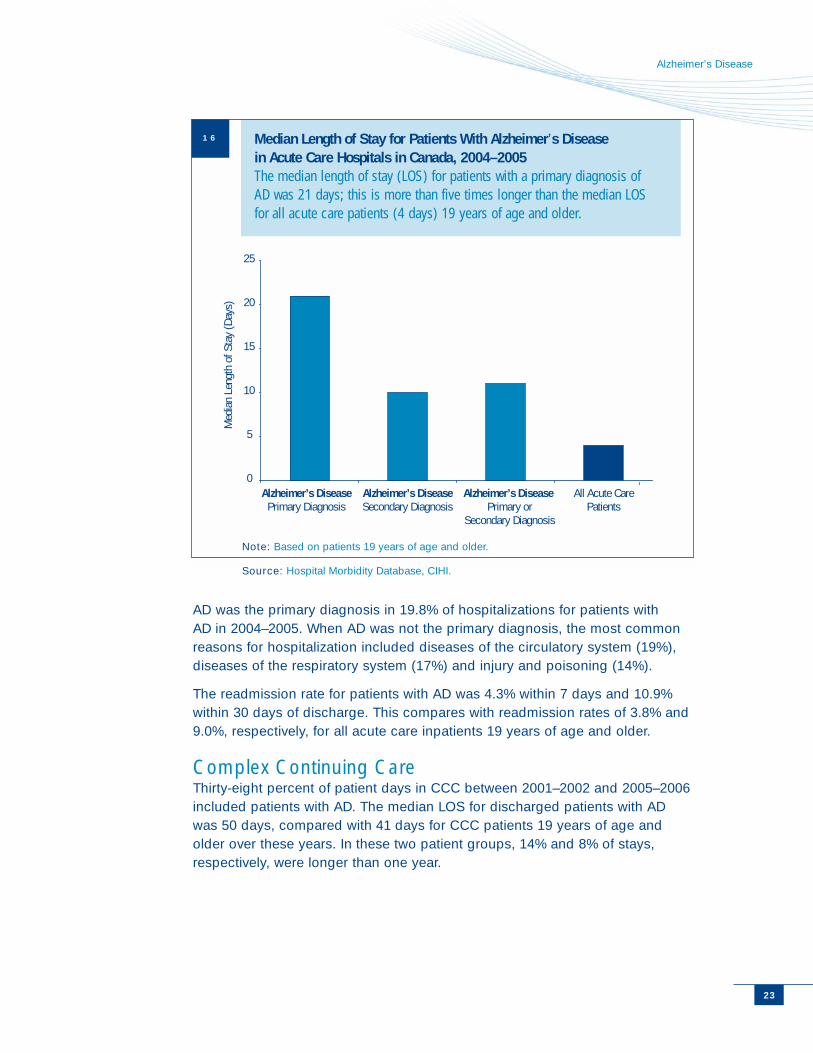
AD was the primary diagnosis in 19.8% of hospitalizations for patients withAD in 2004–2005. When AD was not the primary diagnosis, the most commonreasons for hospitalization included diseases of the circulatory system (19%),diseases of the respiratory system (17%) and injury and poisoning (14%).
The readmission rate for patients with AD was 4.3% within 7 days and 10.9%within 30 days of discharge. This compares with readmission rates of 3.8% and9.0%, respectively, for all acute care inpatients 19 years of age and older.
Complex Continuing Care Thirty-eight percent of patient days in CCC between 2001–2002 and 2005–2006included patients with AD. The median LOS for discharged patients with ADwas 50 days, compared with 41 days for CCC patients 19 years of age andolder over these years. In these two patient groups, 14% and 8% of stays,respectively, were longer than one year.
23
0
5
10
15
20
25
Alzheimer’s DiseasePrimary Diagnosis
Alzheimer’s DiseaseSecondary Diagnosis
Alzheimer’s Disease Primary or
Secondary Diagnosis
All Acute CarePatients
Med
ian
Leng
th o
f Sta
y (D
ays)
Median Length of Stay for Patients With Alzheimer’s Disease in Acute Care Hospitals in Canada, 2004–2005The median length of stay (LOS) for patients with a primary diagnosis ofAD was 21 days; this is more than five times longer than the median LOSfor all acute care patients (4 days) 19 years of age and older.
16
Note: Based on patients 19 years of age and older.
Source: Hospital Morbidity Database, CIHI.
The Burden of Neurological Diseases, Disorders and Injuries in Canada
24
0
500,000
1,000,000
1,500,000
2,000,000
2,500,000
2001–2002 2002–2003 2003–2004 2004–2005 2005–2006
Fiscal Year
Patie
nt D
ays
Patients With Alzheimers All Patients
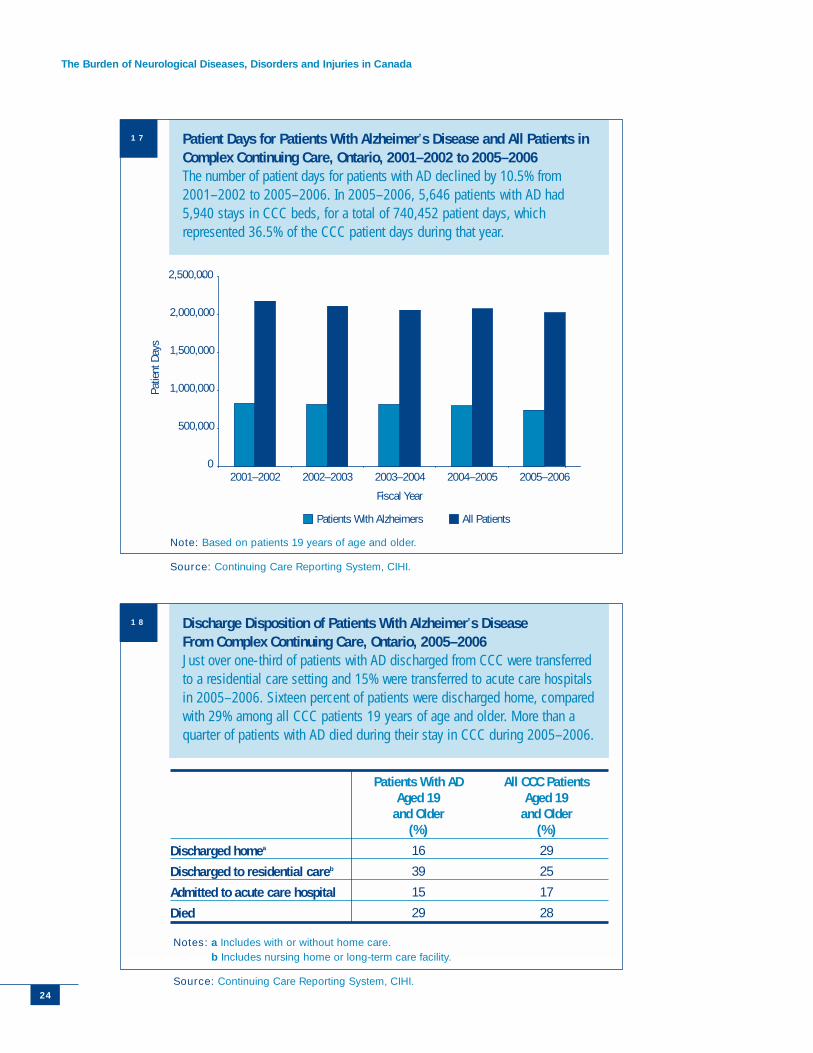
Patient Days for Patients With Alzheimer’s Disease and All Patients inComplex Continuing Care, Ontario, 2001–2002 to 2005–2006 The number of patient days for patients with AD declined by 10.5% from2001–2002 to 2005–2006. In 2005–2006, 5,646 patients with AD had5,940 stays in CCC beds, for a total of 740,452 patient days, whichrepresented 36.5% of the CCC patient days during that year.
Note: Based on patients 19 years of age and older.
Source: Continuing Care Reporting System, CIHI.
Discharge Disposition of Patients With Alzheimer’s Disease From Complex Continuing Care, Ontario, 2005–2006Just over one-third of patients with AD discharged from CCC were transferredto a residential care setting and 15% were transferred to acute care hospitalsin 2005–2006. Sixteen percent of patients were discharged home, comparedwith 29% among all CCC patients 19 years of age and older. More than aquarter of patients with AD died during their stay in CCC during 2005–2006.
Notes: a Includes with or without home care.b Includes nursing home or long-term care facility.
Source: Continuing Care Reporting System, CIHI.
Discharged homea
Discharged to residential careb
Admitted to acute care hospital
Died
Patients With AD Aged 19
and Older(%)
16
39
15
29
All CCC Patients Aged 19
and Older(%)
29
25
17
28
18
17
Alzheimer’s Disease
References
1 L. M. Stevens, C. Lynm and R. M. Glass, “Alzheimer’s Disease,” Journal of theAmerican Medical Association 286, 17 (2001): p. 2194.
2 J. L. Cummings and G. Cole, “Alzheimer’s Disease,” Journal of the American MedicalAssociation 287, 18 (2002): pp. 2335–2338.
3 Alzheimer Society of Canada, Common Questions (Toronto: Alzheimer Societyof Canada, 2006), [online], cited April 26, 2006, from <http://www.alzheimer.ca/english/misc/faqs.htm>.
4 The Canadian Study of Health and Aging Working Group, “The Incidence of Dementiain Canada,” Neurology 55 (2000): pp. 66–73.
5 Health Canada, The Health of Senior Women (Ottawa: Health Canada, 1999), [online],cited April 26, 2006, from <http://www.hc-sc.gc.ca/hl-vs/pubs/women-femmes/seniors-aines e.html>.
6 J. Lindsay et al., “Risk Factors for Alzheimer’s Disease: A Progressive Analysis Fromthe Canadian Study of Health and Aging,” American Journal of Epidemiology 156, 5(2002): pp. 445–453.
7 J. V. Bowler et al., “Factors Affecting the Age of Onset and Rate of Progression ofAlzheimer’s Disease,” Journal of Neurology, Neurosurgery, and Psychiatry 65 (1998):pp. 184–190.
25
Highlights
• Amyotrophic lateral sclerosis accounted for $13.8 millionin direct costs and $168.6 million in indirect costs inCanada in 2000–2001.
• More than half of patients with ALS visiting EDs in Ontario in 2005–2006 were admitted to acute care hospitals.
• The number of acute care hospitalizations across Canadafor patients with ALS increased 5.8% between 2000–2001and 2004–2005.
• In 2004–2005, the median LOS for patients with ALS inacute care hospitals in Canada was eight days, comparedwith four days for all inpatients 19 years of age and older.
• The median LOS for patients with ALS discharged fromCCC in Ontario in 2005–2006 was 120 days, comparedwith 40 days for all patients 19 years of age and older.
Amyotrophic Lateral Sclerosis
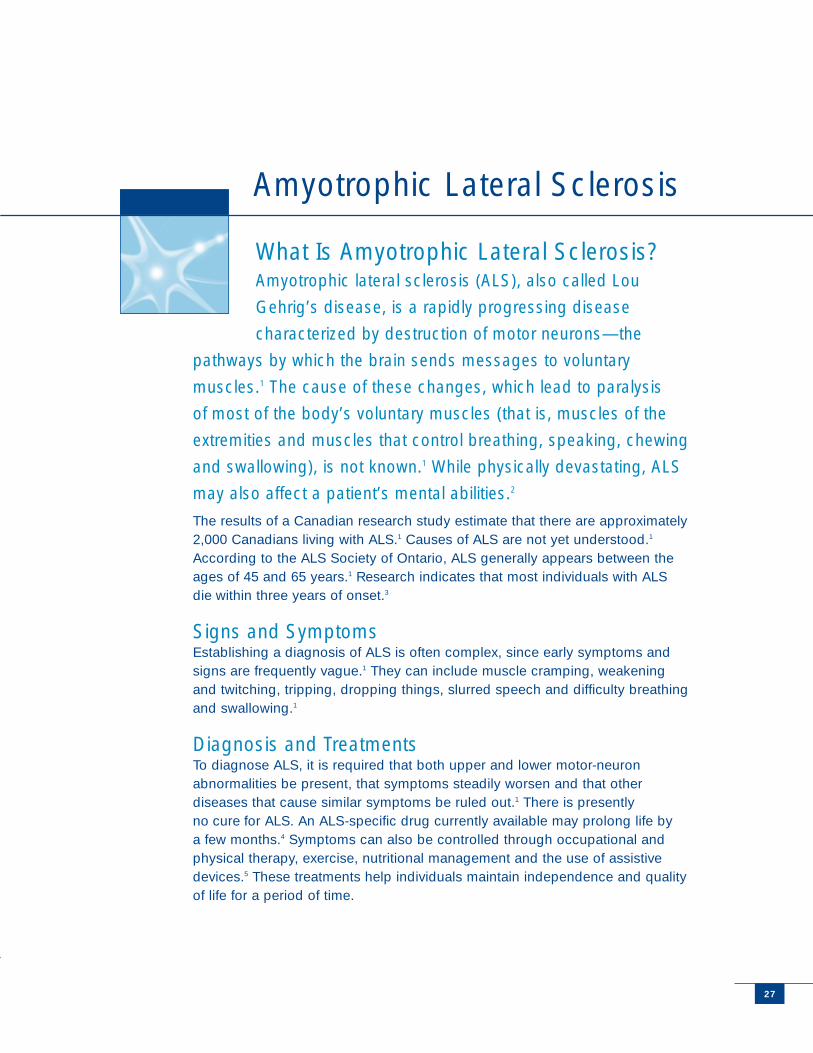
What Is Amyotrophic Lateral Sclerosis?Amyotrophic lateral sclerosis (ALS), also called Lou
Gehrig’s disease, is a rapidly progressing disease
characterized by destruction of motor neurons—the
pathways by which the brain sends messages to voluntary
muscles.1 The cause of these changes, which lead to paralysis
of most of the body’s voluntary muscles (that is, muscles of the
extremities and muscles that control breathing, speaking, chewing
and swallowing), is not known.1 While physically devastating, ALS
may also affect a patient’s mental abilities.2
The results of a Canadian research study estimate that there are approximately2,000 Canadians living with ALS.1 Causes of ALS are not yet understood.1
According to the ALS Society of Ontario, ALS generally appears between theages of 45 and 65 years.1 Research indicates that most individuals with ALSdie within three years of onset.3
Signs and Symptoms Establishing a diagnosis of ALS is often complex, since early symptoms andsigns are frequently vague.1 They can include muscle cramping, weakeningand twitching, tripping, dropping things, slurred speech and difficulty breathingand swallowing.1
Diagnosis and TreatmentsTo diagnose ALS, it is required that both upper and lower motor-neuronabnormalities be present, that symptoms steadily worsen and that otherdiseases that cause similar symptoms be ruled out.1 There is presentlyno cure for ALS. An ALS-specific drug currently available may prolong life by a few months.4 Symptoms can also be controlled through occupational andphysical therapy, exercise, nutritional management and the use of assistivedevices.5 These treatments help individuals maintain independence and qualityof life for a period of time.
Amyotrophic Lateral Sclerosis
2727
The Burden of Neurological Diseases, Disorders and Injuries in Canada
28
Economic Burden The PHAC estimates that the total costs associated with ALS in 2000–2001were $182.4 millon. This estimate does not include drug expenditures ormorbidity costs because data were not available.
• Direct costs were $13.8 million: $13.6 million for hospital care and$0.2 million for physician care.
• Mortality costs were $168.6 million.
Hospital UtilizationCIHI data were used to provide information on emergency department (ED) andurgent care centre (UCC) visits, acute care hospitalizations and hospital-basedcontinuing care for patients with ALS.
0
5
10
15
20
25
30
35
19–29 30–39 40–49 50–59 60–69 70–79 80–89 90+
Age (Years)
Perc
enta
ge o
f Pat
ient
s
ED/UCC Inpatient Acute Care Complex Continuing Care
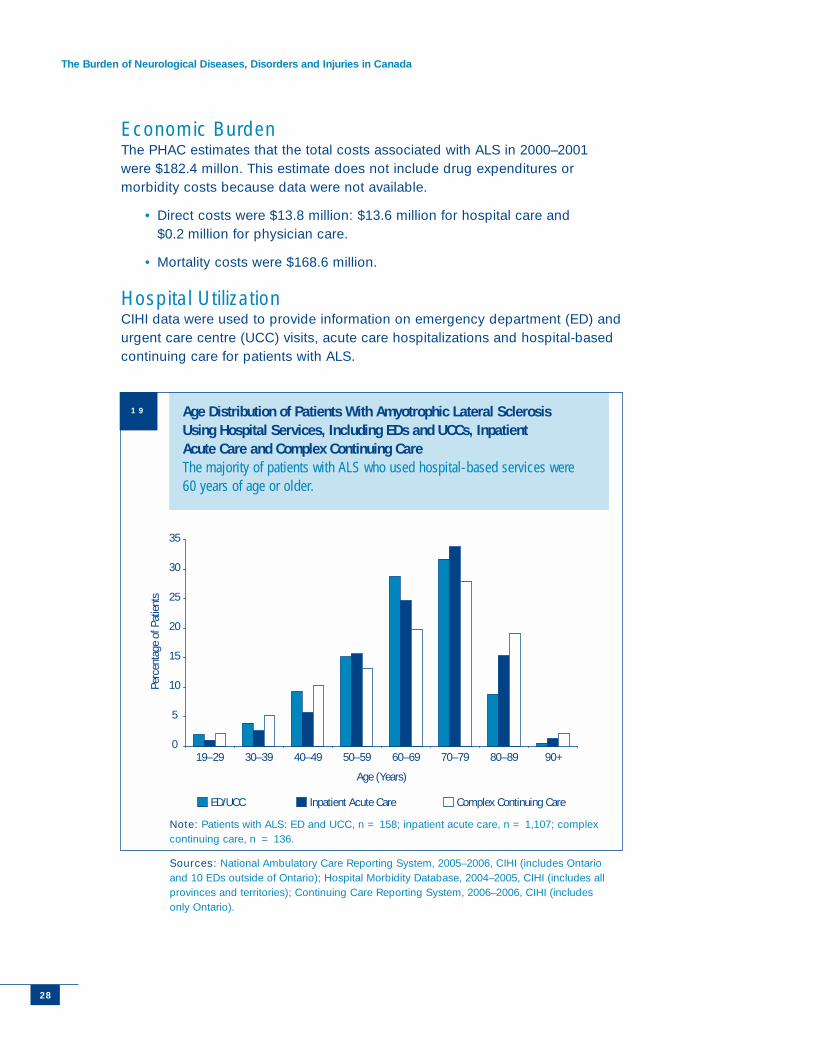
Age Distribution of Patients With Amyotrophic Lateral Sclerosis Using Hospital Services, Including EDs and UCCs, Inpatient Acute Care and Complex Continuing Care The majority of patients with ALS who used hospital-based services were60 years of age or older.
Note: Patients with ALS: ED and UCC, n = 158; inpatient acute care, n = 1,107; complexcontinuing care, n = 136.
Sources: National Ambulatory Care Reporting System, 2005–2006, CIHI (includes Ontarioand 10 EDs outside of Ontario); Hospital Morbidity Database, 2004–2005, CIHI (includes allprovinces and territories); Continuing Care Reporting System, 2006–2006, CIHI (includesonly Ontario).
19
29
Amyotrophic Lateral Sclerosis
0
50
100
150
200
250
300
2002–2003 2003–2004 2004–2005 2005–2006
Fiscal Year
Num
ber o
f Pat
ient
s an
d Vi
sits
Patients Visits
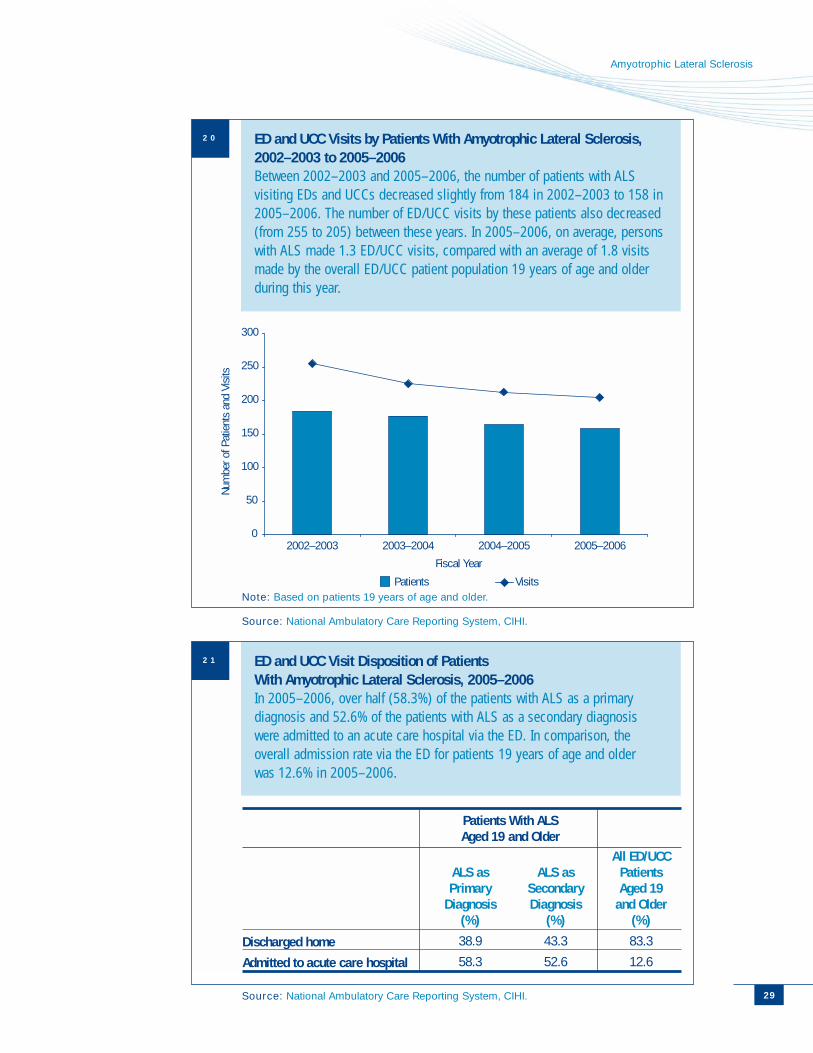
ED and UCC Visits by Patients With Amyotrophic Lateral Sclerosis,2002–2003 to 2005–2006Between 2002–2003 and 2005–2006, the number of patients with ALSvisiting EDs and UCCs decreased slightly from 184 in 2002–2003 to 158 in2005–2006. The number of ED/UCC visits by these patients also decreased(from 255 to 205) between these years. In 2005–2006, on average, personswith ALS made 1.3 ED/UCC visits, compared with an average of 1.8 visitsmade by the overall ED/UCC patient population 19 years of age and olderduring this year.
Note: Based on patients 19 years of age and older.
Source: National Ambulatory Care Reporting System, CIHI.
ED and UCC Visit Disposition of Patients With Amyotrophic Lateral Sclerosis, 2005–2006In 2005–2006, over half (58.3%) of the patients with ALS as a primarydiagnosis and 52.6% of the patients with ALS as a secondary diagnosis were admitted to an acute care hospital via the ED. In comparison, theoverall admission rate via the ED for patients 19 years of age and olderwas 12.6% in 2005–2006.
Source: National Ambulatory Care Reporting System, CIHI.
Patients With ALS Aged 19 and Older
Discharged home
Admitted to acute care hospital
ALS as Primary
Diagnosis(%)
38.9
58.3
ALS asSecondaryDiagnosis
(%)
43.3
52.6
All ED/UCCPatients Aged 19
and Older(%)
83.3
12.6
20
21
The Burden of Neurological Diseases, Disorders and Injuries in Canada
30
0
200
400
600
800
1,000
1,200
1,400
1,600
2000–2001 2001–2002 2002–2003 2003–2004 2004–2005
Fiscal Year
Num
ber o
f Pat
ient
s an
d Ho
spita
lizat
ions
Patients Hospitalizations
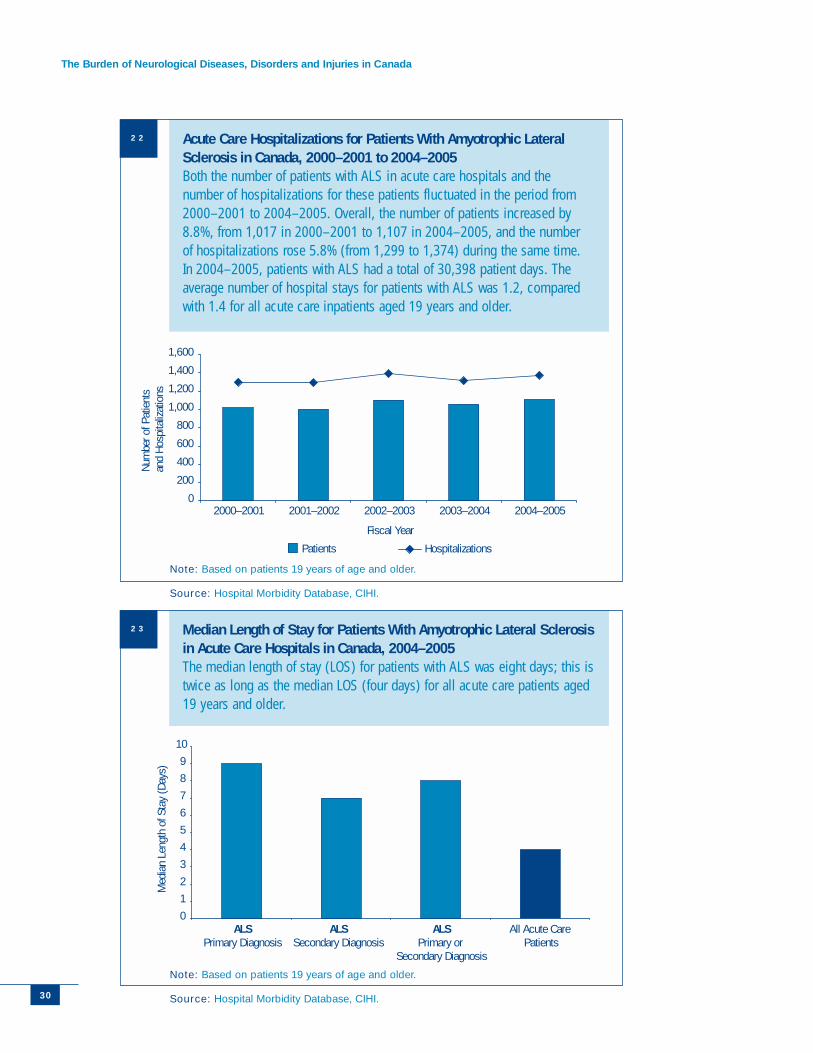
Acute Care Hospitalizations for Patients With Amyotrophic LateralSclerosis in Canada, 2000–2001 to 2004–2005Both the number of patients with ALS in acute care hospitals and thenumber of hospitalizations for these patients fluctuated in the period from2000–2001 to 2004–2005. Overall, the number of patients increased by8.8%, from 1,017 in 2000–2001 to 1,107 in 2004–2005, and the numberof hospitalizations rose 5.8% (from 1,299 to 1,374) during the same time.In 2004–2005, patients with ALS had a total of 30,398 patient days. Theaverage number of hospital stays for patients with ALS was 1.2, comparedwith 1.4 for all acute care inpatients aged 19 years and older.
Note: Based on patients 19 years of age and older.
Source: Hospital Morbidity Database, CIHI.
0
1
2
3
4
5
6
7
8
9
10
ALSPrimary Diagnosis
ALSSecondary Diagnosis
ALSPrimary or
Secondary Diagnosis
All Acute Care Patients
Med
ian
Leng
th o
f Sta
y (D
ays)
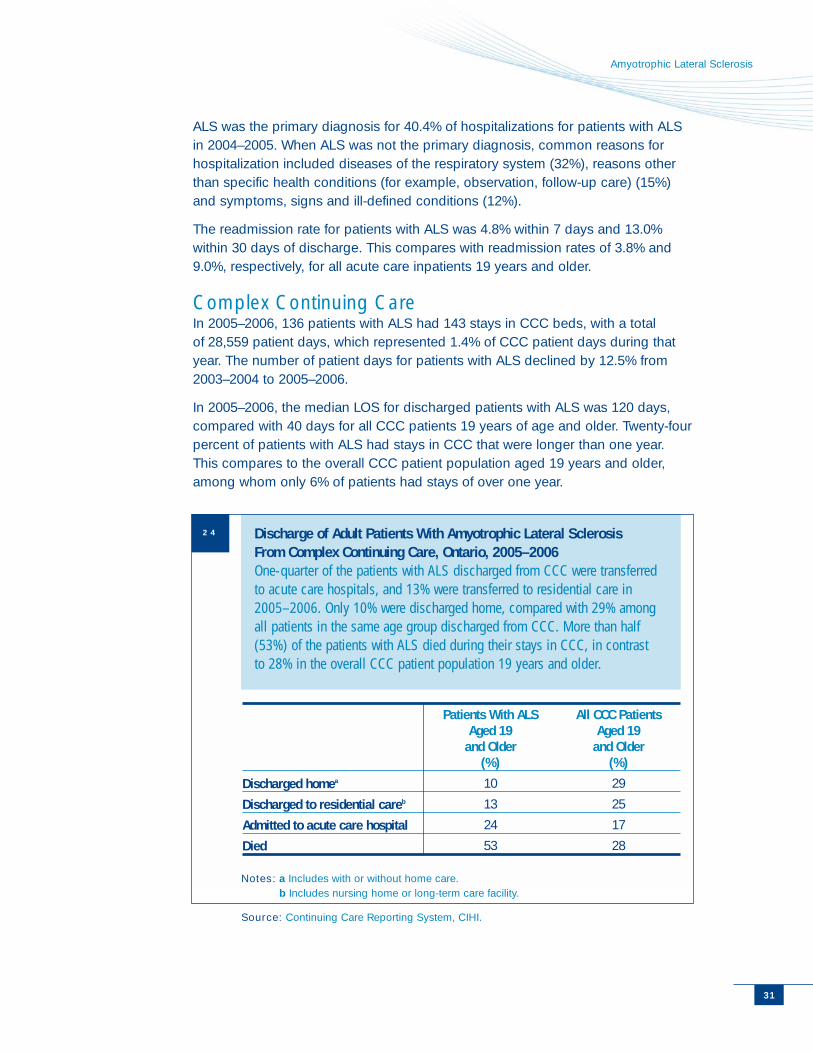
Median Length of Stay for Patients With Amyotrophic Lateral Sclerosisin Acute Care Hospitals in Canada, 2004–2005The median length of stay (LOS) for patients with ALS was eight days; this istwice as long as the median LOS (four days) for all acute care patients aged19 years and older.
Note: Based on patients 19 years of age and older.
Source: Hospital Morbidity Database, CIHI.
22
23
Amyotrophic Lateral Sclerosis
ALS was the primary diagnosis for 40.4% of hospitalizations for patients with ALSin 2004–2005. When ALS was not the primary diagnosis, common reasons forhospitalization included diseases of the respiratory system (32%), reasons otherthan specific health conditions (for example, observation, follow-up care) (15%)and symptoms, signs and ill-defined conditions (12%).
The readmission rate for patients with ALS was 4.8% within 7 days and 13.0%within 30 days of discharge. This compares with readmission rates of 3.8% and9.0%, respectively, for all acute care inpatients 19 years and older.
Complex Continuing Care In 2005–2006, 136 patients with ALS had 143 stays in CCC beds, with a totalof 28,559 patient days, which represented 1.4% of CCC patient days during thatyear. The number of patient days for patients with ALS declined by 12.5% from2003–2004 to 2005–2006.
In 2005–2006, the median LOS for discharged patients with ALS was 120 days,compared with 40 days for all CCC patients 19 years of age and older. Twenty-fourpercent of patients with ALS had stays in CCC that were longer than one year.This compares to the overall CCC patient population aged 19 years and older,among whom only 6% of patients had stays of over one year.
31
Discharge of Adult Patients With Amyotrophic Lateral Sclerosis From Complex Continuing Care, Ontario, 2005–2006One-quarter of the patients with ALS discharged from CCC were transferredto acute care hospitals, and 13% were transferred to residential care in2005–2006. Only 10% were discharged home, compared with 29% amongall patients in the same age group discharged from CCC. More than half(53%) of the patients with ALS died during their stays in CCC, in contrast to 28% in the overall CCC patient population 19 years and older.
Notes: a Includes with or without home care. b Includes nursing home or long-term care facility.
Source: Continuing Care Reporting System, CIHI.
Discharged homea
Discharged to residential careb
Admitted to acute care hospital
Died
Patients With ALS Aged 19
and Older(%)
10
13
24
53
All CCC Patients Aged 19
and Older(%)
29
25
17
28
24
The Burden of Neurological Diseases, Disorders and Injuries in Canada
32
References
1 ALS Society of Ontario, What Is ALS? (Toronto: ALS Society of Ontario, 2006), [online],cited April 26, 2006, from <http://www.alsont.ca/what_is_als.aspx>.
2 M. J. Strong, “ALS—Not What We Thought,” Archives of Neurology 63 (2006):pp. 319–320.
3 S. C. Bourke et al., “Effects of Non-Invasive Ventilation on Survival and Quality of Life in Patients With Amyotrophic Lateral Sclerosis: A Randomised Controlled Trial,”The Lancet 5 (2006): pp. 140–147.
4 R. G. Miller et al., “Riluzole for Amyotrophic Lateral Sclerosis (ALS)/Motor NeuronDisease (MND),” Cochrane Database of Systematic Reviews (2007): CD001447.
5 N. Lechtzin et al., “Hospitalization in Amyotrophic Lateral Sclerosis: Causes, Costsand Outcomes,” Neurology (2001): pp. 753–757.

Highlights
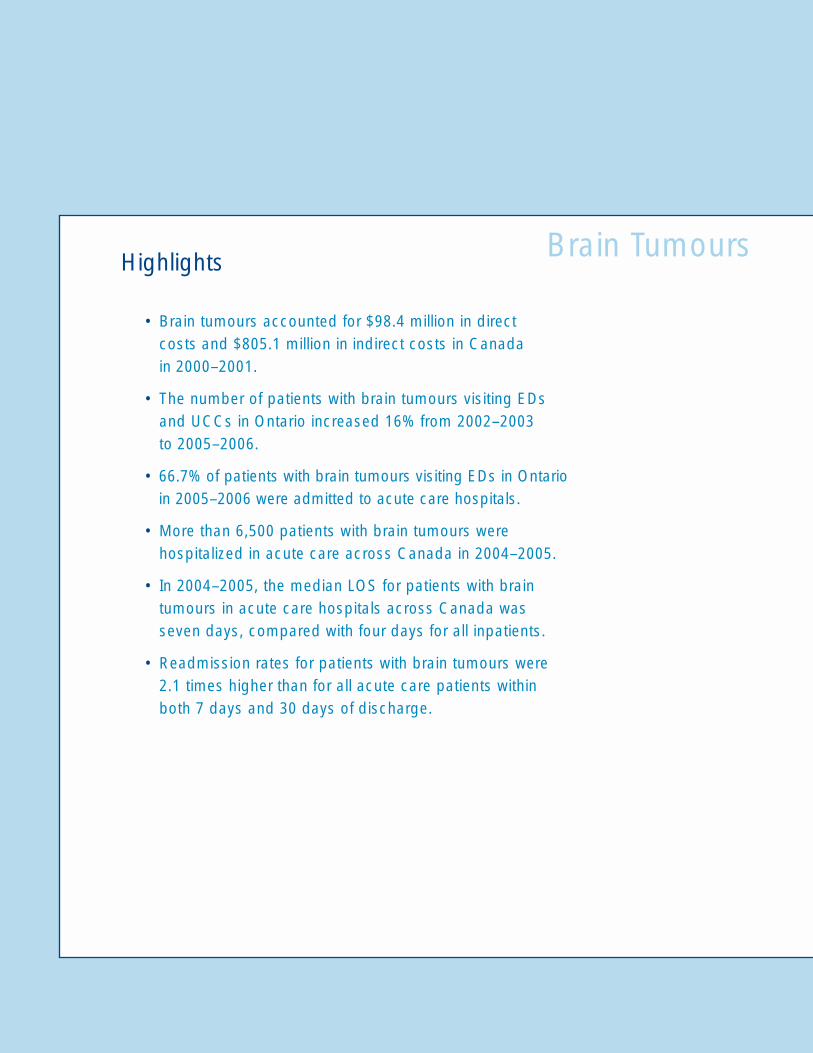
• Brain tumours accounted for $98.4 million in directcosts and $805.1 million in indirect costs in Canadain 2000–2001.
• The number of patients with brain tumours visiting EDsand UCCs in Ontario increased 16% from 2002–2003to 2005–2006.
• 66.7% of patients with brain tumours visiting EDs in Ontarioin 2005–2006 were admitted to acute care hospitals.
• More than 6,500 patients with brain tumours werehospitalized in acute care across Canada in 2004–2005.
• In 2004–2005, the median LOS for patients with braintumours in acute care hospitals across Canada wasseven days, compared with four days for all inpatients.
• Readmission rates for patients with brain tumours were2.1 times higher than for all acute care patients withinboth 7 days and 30 days of discharge.
Brain Tumours
What Are Brain Tumours?Brain tumours can be classified as non-aggressive
(benign) or aggressive (malignant). Benign brain
tumours usually originate from coverings of the brain
(meningiomas) or cells associated with nerves coming from the
brain (schwannomas and neurofibromas). There are two main
types of malignant brain tumour: primary (arising from brain
cells) and metastatic (having spread from tumours elsewhere in
the body).1 The most common form of malignant brain tumours
are gliomas.2 The occurrence and growth of brain tumours are
likely to be associated with a combination of genetic and
environmental factors.
According to the Brain Tumour Foundation of Canada, there are 55,000 Canadianssurviving with a brain tumour, and approximately 10,000 new cases are diagnosedeach year.3 The Foundation also reports that the incidence increases with age andthat brain tumours are now one of the most common types of pediatric cancer.3
In 2002, Statistics Canada reported that nearly 1,600 Canadians died of malignantbrain tumours.4
Signs and SymptomsThe signs and symptoms of brain tumours depend on their location and size.5 They include headache, nausea and vomiting, seizures, blurredvision, weakness in the extremities, slurred speech and decreased memory and concentration.1,5
Diagnosis and TreatmentsDiagnosis and identification of tumour type usually require brain imaging—computed tomography (CT) or magnetic resonance imaging (MRI)—and atissue sampling.1 Although benign tumours can be cured by surgical removal,there is currently no cure for most malignant brain tumours. Treatment is oftendifficult because of the location of brain tumours, but usually involves someform of surgery, radiation therapy or chemotherapy, or a combination of all three.1
Brain Tumours
3535
The Burden of Neurological Diseases, Disorders and Injuries in Canada
36
Tumour type, as well as the age of the patient and level of functioning, willdictate the type and order of treatment. Steroid medications are sometimesused to decrease brain swelling. Antiseizure medication may be given to treator prevent seizures associated with brain tumours.1
Because brain tumours and their treatment affect functioning of the brain andthe body, rehabilitation and psychosocial services are crucial. In the absenceof a cure, maintaining independence and quality of life for as long as possibleare paramount for both patients and their families.2
Economic Burden The PHAC estimates that the total costs associated with brain tumours in2000–2001 were $903.5 million.
• Direct costs were $98.4 million: $72.5 million (73.7%) for hospital care,$24.5 million (24.9%) for physician care and $1.4 million (1.4%) for drugs.
• Mortality costs were $805.06 million.
• Morbidity costs were not available for brain tumours.
The Canadian Alliance of Brain Tumour Organizations notes that “in addition tothe limitations related to estimates for drug expenditures identified by PHAC, itshould be noted that physicians practicing in the specialty of neurooncology,who prescribe the majority of medications for those people diagnosed withbrain tumours, are not included in the list of physicians for which the data fordrug estimates was gathered. Thus, given the numbers of patients withmalignant brain tumours in Canada and the known high cost of thechemotherapeutic agents used to treat such tumours, the estimates of drugcosts for the brain tumour population are considered to be underestimated.”6
37
Brain Tumours
Hospital UtilizationCIHI data were used to provide information on emergency department (ED) andurgent care centre (UCC) visits, and acute care hospitalizations for patients withbrain tumours.
0
5
10
15
20
25
0–18 19–29 30–39 40–49 50–59 60–69 70–79 80–89 90+
Age (Years)
Perc
enta
ge o
f Pat
ient
s
ED/UCC Inpatient Acute Care
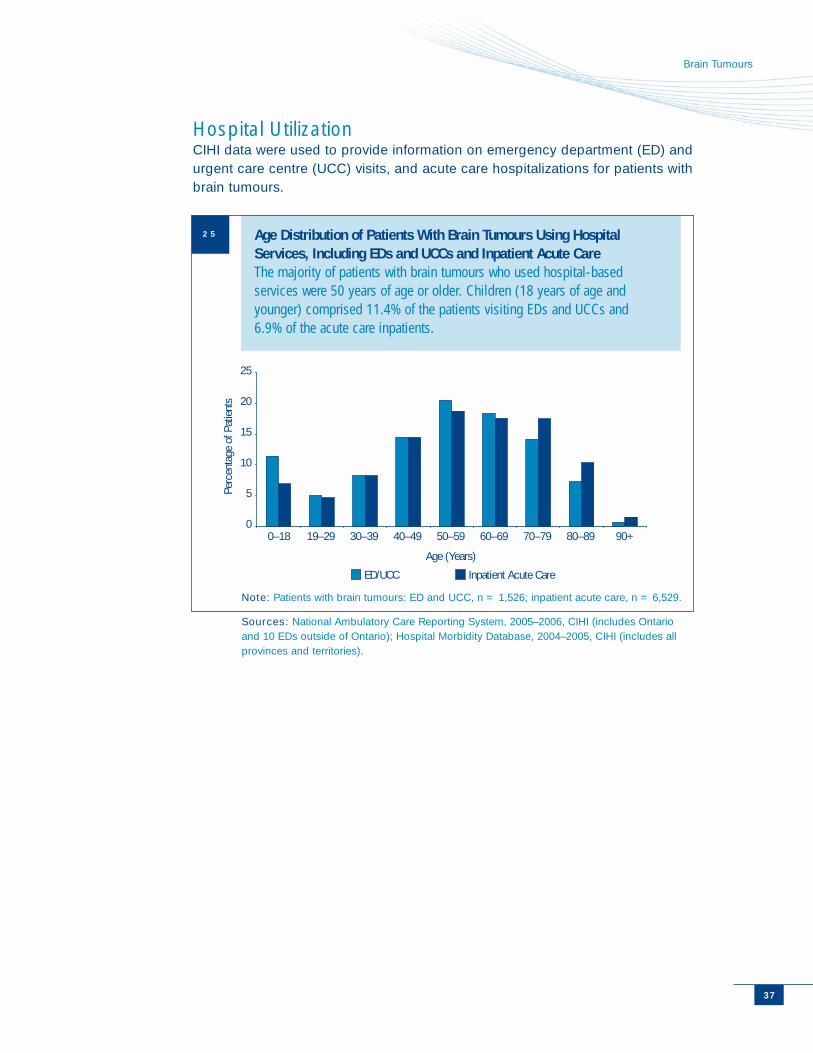
Age Distribution of Patients With Brain Tumours Using HospitalServices, Including EDs and UCCs and Inpatient Acute CareThe majority of patients with brain tumours who used hospital-basedservices were 50 years of age or older. Children (18 years of age andyounger) comprised 11.4% of the patients visiting EDs and UCCs and 6.9% of the acute care inpatients.
Note: Patients with brain tumours: ED and UCC, n = 1,526; inpatient acute care, n = 6,529.
Sources: National Ambulatory Care Reporting System, 2005–2006, CIHI (includes Ontarioand 10 EDs outside of Ontario); Hospital Morbidity Database, 2004–2005, CIHI (includes allprovinces and territories).
25
The Burden of Neurological Diseases, Disorders and Injuries in Canada
38
0
500
1,000
1,500
2,000
2,500
2002–2003 2003–2004 2004–2005 2005–2006Fiscal Year
Num
ber o
f Pat
ient
s an
d Vi
sits
Patients Visits
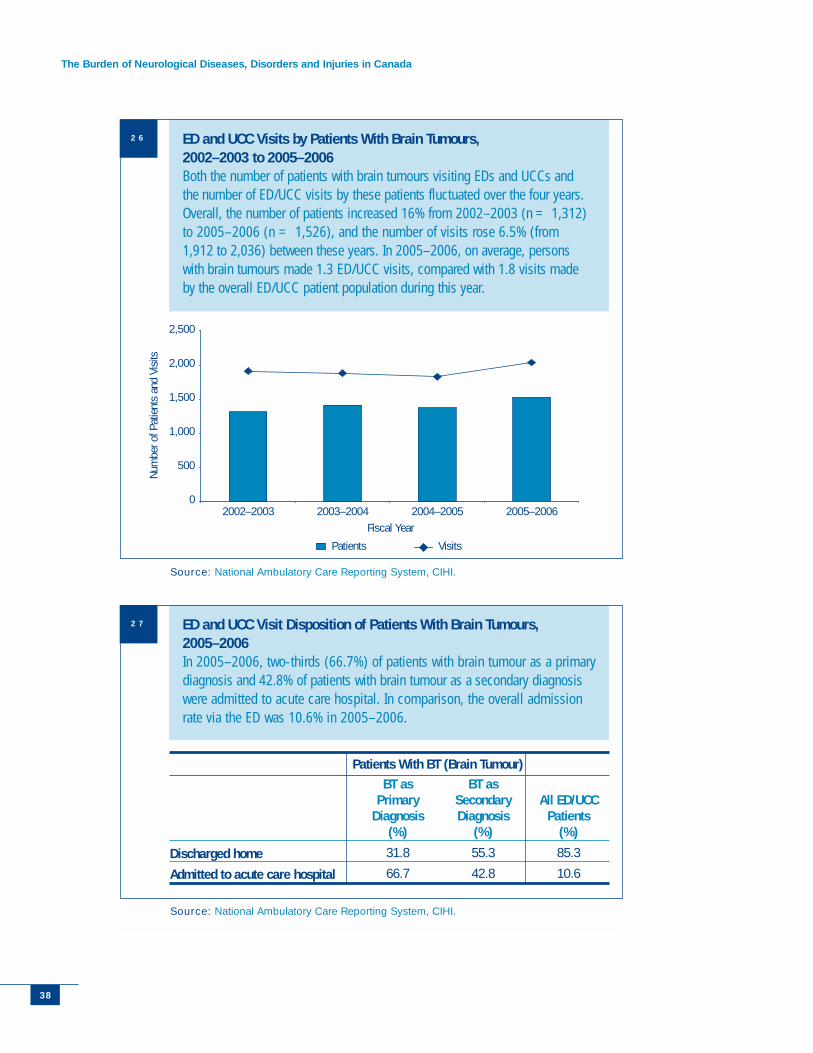
ED and UCC Visits by Patients With Brain Tumours, 2002–2003 to 2005–2006Both the number of patients with brain tumours visiting EDs and UCCs andthe number of ED/UCC visits by these patients fluctuated over the four years.Overall, the number of patients increased 16% from 2002–2003 (n = 1,312)to 2005–2006 (n = 1,526), and the number of visits rose 6.5% (from1,912 to 2,036) between these years. In 2005–2006, on average, personswith brain tumours made 1.3 ED/UCC visits, compared with 1.8 visits madeby the overall ED/UCC patient population during this year.
Source: National Ambulatory Care Reporting System, CIHI.
ED and UCC Visit Disposition of Patients With Brain Tumours,2005–2006In 2005–2006, two-thirds (66.7%) of patients with brain tumour as a primarydiagnosis and 42.8% of patients with brain tumour as a secondary diagnosiswere admitted to acute care hospital. In comparison, the overall admissionrate via the ED was 10.6% in 2005–2006.
Source: National Ambulatory Care Reporting System, CIHI.
26
27
Patients With BT (Brain Tumour)
Discharged home
Admitted to acute care hospital
BT as Primary
Diagnosis(%)
31.8
66.7
BT asSecondaryDiagnosis
(%)
55.3
42.8
All ED/UCCPatients
(%)
85.3
10.6
Brain Tumours
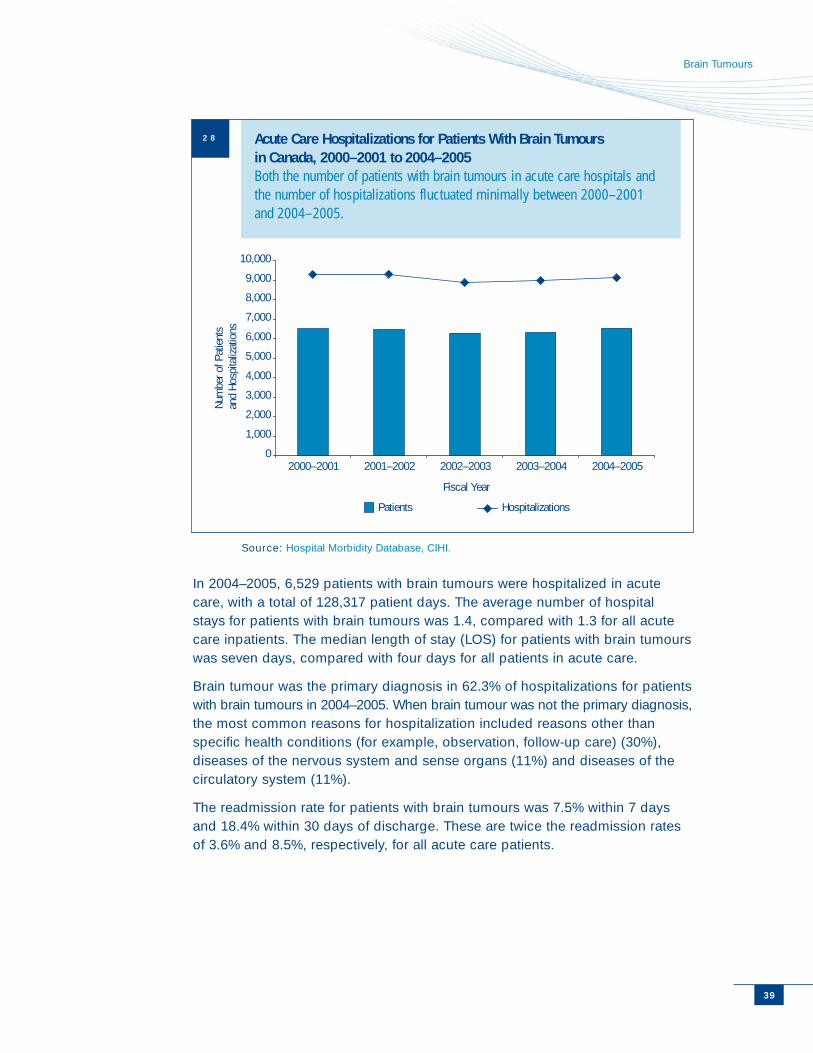
In 2004–2005, 6,529 patients with brain tumours were hospitalized in acutecare, with a total of 128,317 patient days. The average number of hospitalstays for patients with brain tumours was 1.4, compared with 1.3 for all acutecare inpatients. The median length of stay (LOS) for patients with brain tumourswas seven days, compared with four days for all patients in acute care.
Brain tumour was the primary diagnosis in 62.3% of hospitalizations for patientswith brain tumours in 2004–2005. When brain tumour was not the primary diagnosis,the most common reasons for hospitalization included reasons other thanspecific health conditions (for example, observation, follow-up care) (30%),diseases of the nervous system and sense organs (11%) and diseases of thecirculatory system (11%).
The readmission rate for patients with brain tumours was 7.5% within 7 daysand 18.4% within 30 days of discharge. These are twice the readmission ratesof 3.6% and 8.5%, respectively, for all acute care patients.
39
0
1,000
2,000
3,000
4,000
5,000
6,000
7,000
8,000
9,000
10,000
2000–2001 2001–2002 2002–2003 2003–2004 2004–2005
Fiscal Year
Num
ber o
f Pat
ient
s an
d Ho
spita
lizat
ions
Patients Hospitalizations
Acute Care Hospitalizations for Patients With Brain Tumours in Canada, 2000–2001 to 2004–2005Both the number of patients with brain tumours in acute care hospitals andthe number of hospitalizations fluctuated minimally between 2000–2001and 2004–2005.
Source: Hospital Morbidity Database, CIHI.
28
The Burden of Neurological Diseases, Disorders and Injuries in Canada
References
1 J. M. Torpy, C. Lynm and R. M. Glass, “Brain Tumors,” Journal of the AmericanMedical Association 293 (2005): p. 644.
2 S. M. Chang et al., “Patterns of Care for Adults With Newly Diagnosed MalignantGlioma,” Journal of the American Medical Association 293 (2005): pp. 557–564.
3 Brain Tumour Foundation of Canada, Facts About Brain Tumours (London:Brain Tumour Foundation of Canada), [online], cited April 27, 2006, from<http://www.braintumour.ca/braintumour.nsf/eng/FactSheet>.
4 Statistics Canada, “Chapter II: Neoplasms (C00-D48), by Age Group and Sex”in Causes of Death (Ottawa: Statistics Canada, 2002).
5 H. Snyder et al., “Signs and Symptoms of Patients With Brain Tumors Presenting tothe Emergency Department,” Journal of Emergency Medicine 11 (1993): pp. 253–258.
6 Personal communciation with Maureen Daniels, Co-Chair, Canadian Alliance of BrainTumour Organizations, May 25, 2007.
40

Highlights
• Cerebral palsy accounted for $39.7 million in direct costsand $342 million in indirect costs in Canada in 2000–2001.
• 37.3% of patients with cerebral palsy visiting EDs in Ontarioin 2005–2006 were admitted to acute care hospitals.
• The number of acute care hospitalizations across Canadafor patients with cerebral palsy decreased by 16.7% from2000–2001 to 2004–2005.
Cerebral Palsy
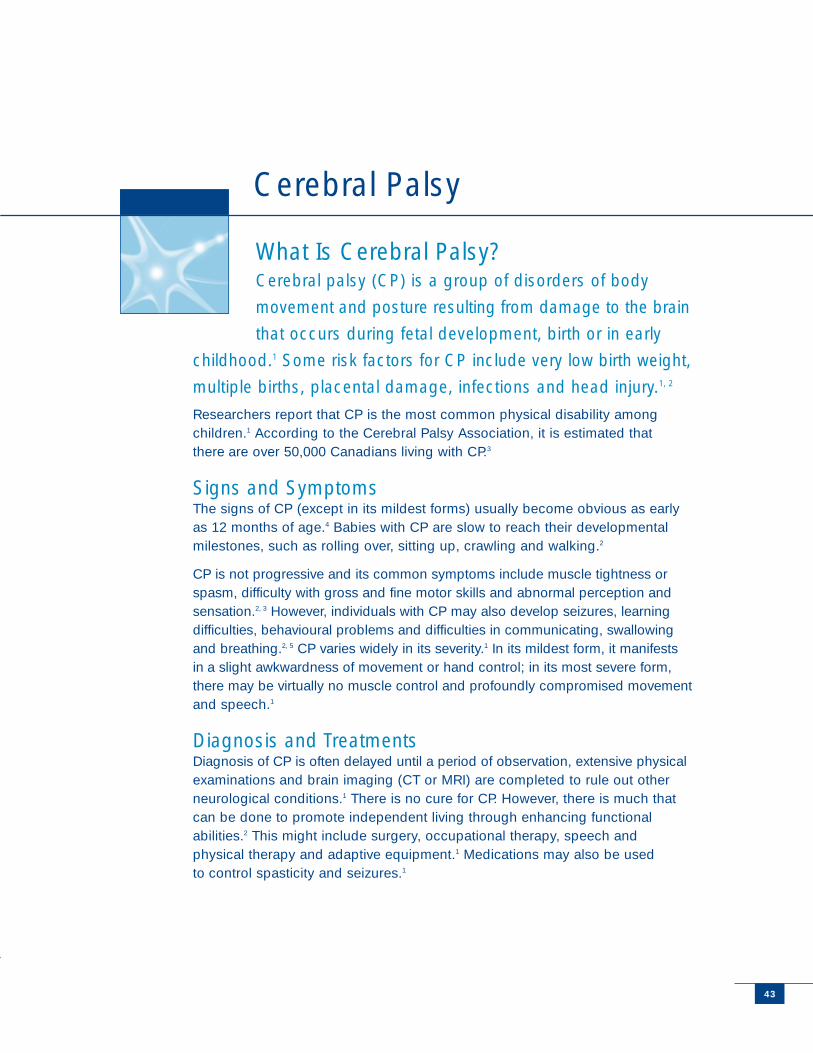
What Is Cerebral Palsy? Cerebral palsy (CP) is a group of disorders of body
movement and posture resulting from damage to the brain
that occurs during fetal development, birth or in early
childhood.1 Some risk factors for CP include very low birth weight,
multiple births, placental damage, infections and head injury.1, 2
Researchers report that CP is the most common physical disability amongchildren.1 According to the Cerebral Palsy Association, it is estimated thatthere are over 50,000 Canadians living with CP.3
Signs and SymptomsThe signs of CP (except in its mildest forms) usually become obvious as earlyas 12 months of age.4 Babies with CP are slow to reach their developmentalmilestones, such as rolling over, sitting up, crawling and walking.2
CP is not progressive and its common symptoms include muscle tightness orspasm, difficulty with gross and fine motor skills and abnormal perception andsensation.2, 3 However, individuals with CP may also develop seizures, learningdifficulties, behavioural problems and difficulties in communicating, swallowingand breathing.2, 5 CP varies widely in its severity.1 In its mildest form, it manifestsin a slight awkwardness of movement or hand control; in its most severe form,there may be virtually no muscle control and profoundly compromised movementand speech.1
Diagnosis and Treatments Diagnosis of CP is often delayed until a period of observation, extensive physicalexaminations and brain imaging (CT or MRI) are completed to rule out otherneurological conditions.1 There is no cure for CP. However, there is much thatcan be done to promote independent living through enhancing functionalabilities.2 This might include surgery, occupational therapy, speech andphysical therapy and adaptive equipment.1 Medications may also be usedto control spasticity and seizures.1
Cerebral Palsy
4343
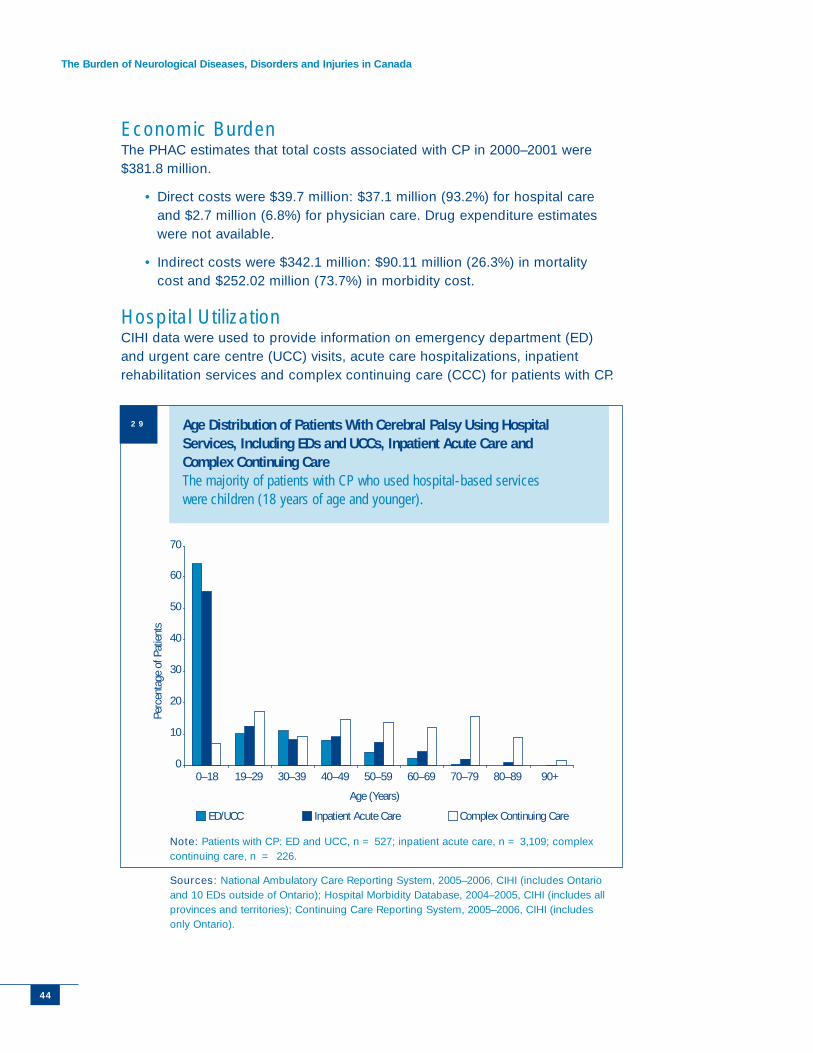
The Burden of Neurological Diseases, Disorders and Injuries in Canada
44
Economic Burden The PHAC estimates that total costs associated with CP in 2000–2001 were$381.8 million.
• Direct costs were $39.7 million: $37.1 million (93.2%) for hospital careand $2.7 million (6.8%) for physician care. Drug expenditure estimateswere not available.
• Indirect costs were $342.1 million: $90.11 million (26.3%) in mortalitycost and $252.02 million (73.7%) in morbidity cost.
Hospital UtilizationCIHI data were used to provide information on emergency department (ED)and urgent care centre (UCC) visits, acute care hospitalizations, inpatientrehabilitation services and complex continuing care (CCC) for patients with CP.
0
10
20
30
40
50
60
70
0–18 19–29 30–39 40–49 50–59 60–69 70–79 80–89 90+
Age (Years)
Perc
enta
ge o
f Pat
ient
s
ED/UCC Inpatient Acute Care Complex Continuing Care
Age Distribution of Patients With Cerebral Palsy Using HospitalServices, Including EDs and UCCs, Inpatient Acute Care and Complex Continuing Care The majority of patients with CP who used hospital-based serviceswere children (18 years of age and younger).
Note: Patients with CP: ED and UCC, n = 527; inpatient acute care, n = 3,109; complexcontinuing care, n = 226.
Sources: National Ambulatory Care Reporting System, 2005–2006, CIHI (includes Ontarioand 10 EDs outside of Ontario); Hospital Morbidity Database, 2004–2005, CIHI (includes allprovinces and territories); Continuing Care Reporting System, 2005–2006, CIHI (includesonly Ontario).
29
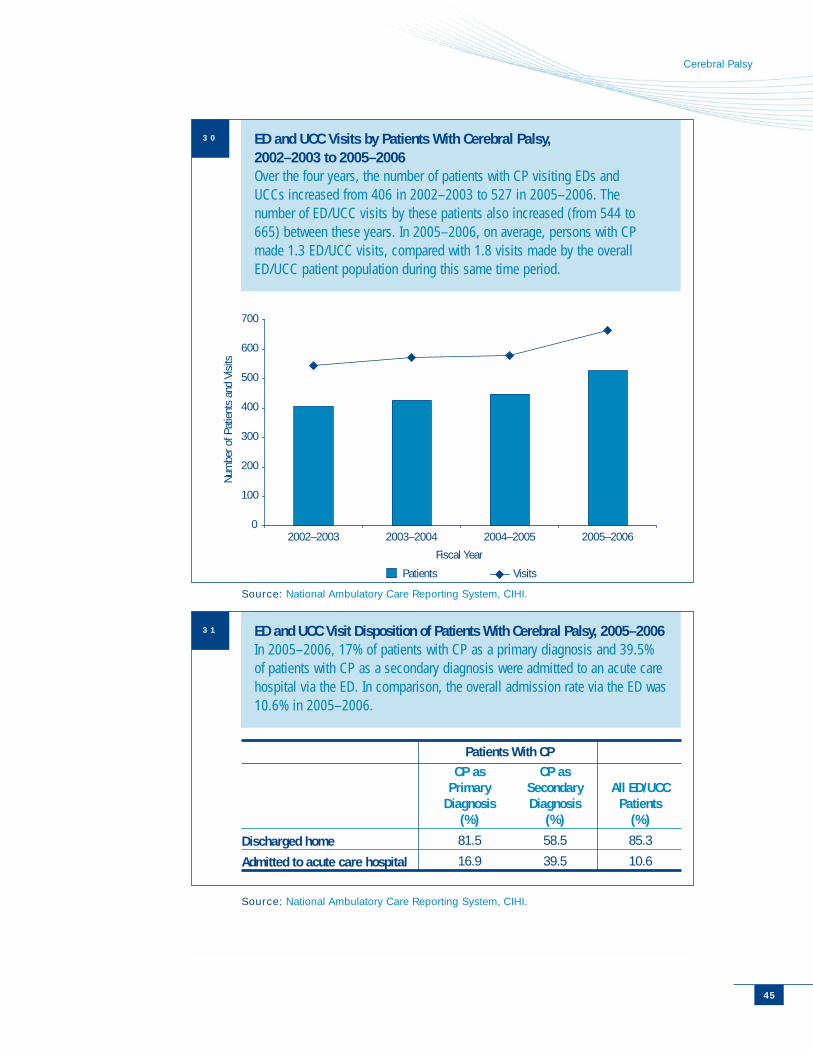
45
Cerebral Palsy
0
100
200
300
400
500
600
700
2002–2003 2003–2004 2004–2005 2005–2006
Fiscal Year
Num
ber o
f Pat
ient
s an
d Vi
sits
Patients Visits
ED and UCC Visits by Patients With Cerebral Palsy, 2002–2003 to 2005–2006Over the four years, the number of patients with CP visiting EDs andUCCs increased from 406 in 2002–2003 to 527 in 2005–2006. Thenumber of ED/UCC visits by these patients also increased (from 544 to665) between these years. In 2005–2006, on average, persons with CPmade 1.3 ED/UCC visits, compared with 1.8 visits made by the overallED/UCC patient population during this same time period.
Source: National Ambulatory Care Reporting System, CIHI.
ED and UCC Visit Disposition of Patients With Cerebral Palsy, 2005–2006In 2005–2006, 17% of patients with CP as a primary diagnosis and 39.5%of patients with CP as a secondary diagnosis were admitted to an acute carehospital via the ED. In comparison, the overall admission rate via the ED was10.6% in 2005–2006.
Source: National Ambulatory Care Reporting System, CIHI.
Patients With CP
Discharged home
Admitted to acute care hospital
CP as Primary
Diagnosis(%)
81.5
16.9
CP asSecondaryDiagnosis
(%)
58.5
39.5
All ED/UCCPatients
(%)
85.3
10.6
30
31
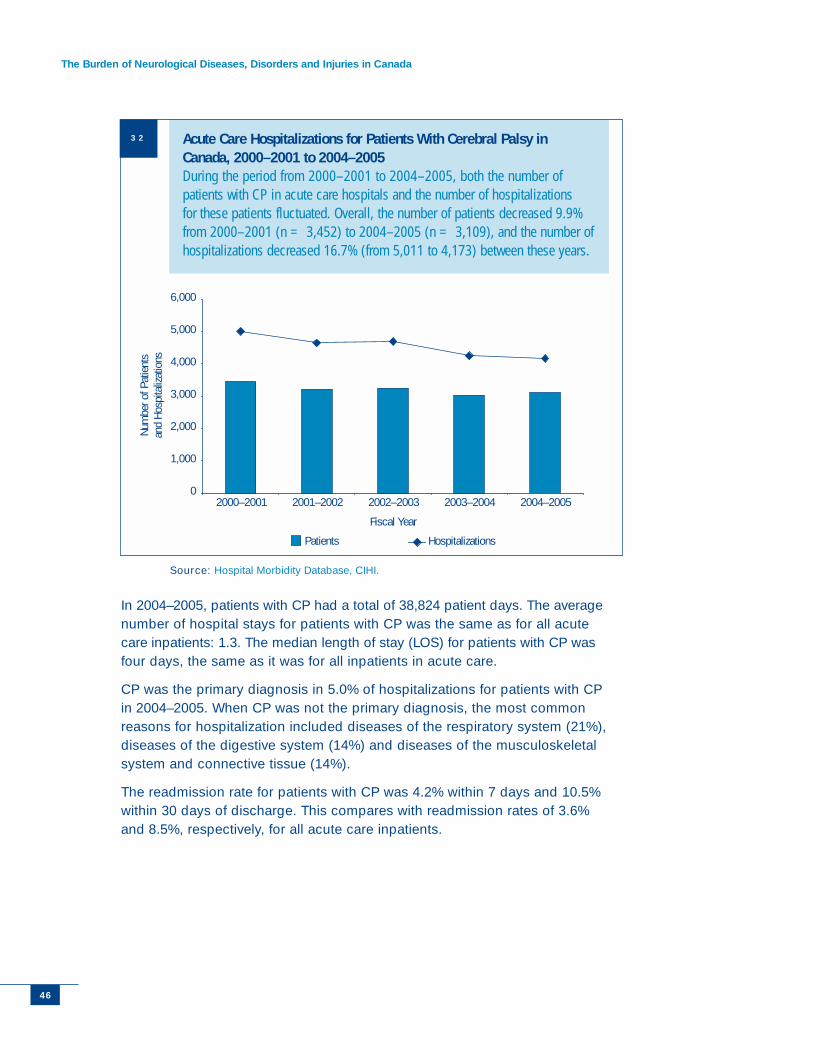
The Burden of Neurological Diseases, Disorders and Injuries in Canada
In 2004–2005, patients with CP had a total of 38,824 patient days. The averagenumber of hospital stays for patients with CP was the same as for all acutecare inpatients: 1.3. The median length of stay (LOS) for patients with CP wasfour days, the same as it was for all inpatients in acute care.
CP was the primary diagnosis in 5.0% of hospitalizations for patients with CPin 2004–2005. When CP was not the primary diagnosis, the most commonreasons for hospitalization included diseases of the respiratory system (21%),diseases of the digestive system (14%) and diseases of the musculoskeletalsystem and connective tissue (14%).
The readmission rate for patients with CP was 4.2% within 7 days and 10.5%within 30 days of discharge. This compares with readmission rates of 3.6%and 8.5%, respectively, for all acute care inpatients.
46
0
1,000
2,000
3,000
4,000
5,000
6,000
2000–2001 2001–2002 2002–2003 2003–2004 2004–2005
Fiscal Year
Num
ber o
f Pat
ient
san
d Ho
spita
lizat
ions
Patients Hospitalizations
Acute Care Hospitalizations for Patients With Cerebral Palsy inCanada, 2000–2001 to 2004–2005During the period from 2000–2001 to 2004–2005, both the number ofpatients with CP in acute care hospitals and the number of hospitalizationsfor these patients fluctuated. Overall, the number of patients decreased 9.9%from 2000–2001 (n = 3,452) to 2004–2005 (n = 3,109), and the number ofhospitalizations decreased 16.7% (from 5,011 to 4,173) between these years.
Source: Hospital Morbidity Database, CIHI.
32
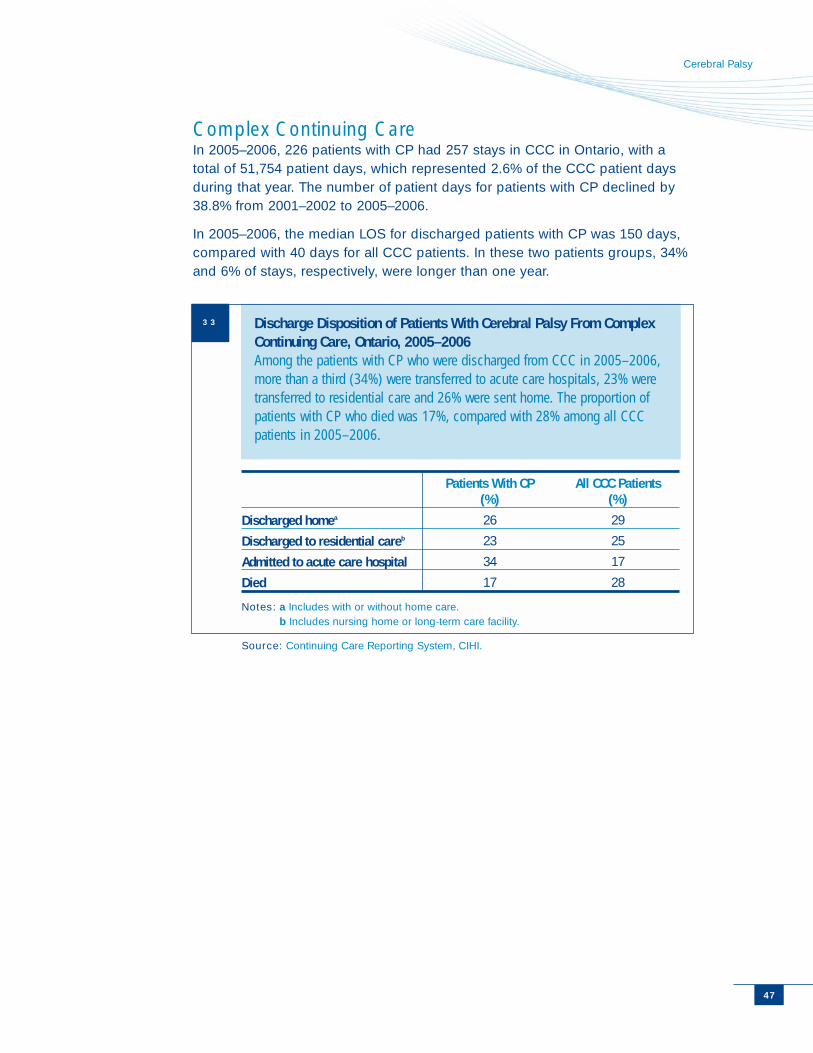
Cerebral Palsy
Complex Continuing CareIn 2005–2006, 226 patients with CP had 257 stays in CCC in Ontario, with atotal of 51,754 patient days, which represented 2.6% of the CCC patient daysduring that year. The number of patient days for patients with CP declined by38.8% from 2001–2002 to 2005–2006.
In 2005–2006, the median LOS for discharged patients with CP was 150 days,compared with 40 days for all CCC patients. In these two patients groups, 34%and 6% of stays, respectively, were longer than one year.
47
Discharge Disposition of Patients With Cerebral Palsy From ComplexContinuing Care, Ontario, 2005–2006Among the patients with CP who were discharged from CCC in 2005–2006,more than a third (34%) were transferred to acute care hospitals, 23% weretransferred to residential care and 26% were sent home. The proportion ofpatients with CP who died was 17%, compared with 28% among all CCCpatients in 2005–2006.
Notes: a Includes with or without home care.b Includes nursing home or long-term care facility.
Source: Continuing Care Reporting System, CIHI.
Discharged homea
Discharged to residential careb
Admitted to acute care hospital
Died
Patients With CP (%)
26
23
34
17
All CCC Patients (%)
29
25
17
28
33
The Burden of Neurological Diseases, Disorders and Injuries in Canada
48
References
1 L. A. Koman, B. Paterson-Smith and J. S. Shilt, “Cerebral Palsy,” The Lancet 363 (2004): pp. 1619–1631.
2 United Cerebral Palsy, Cerebral Palsy: Facts and Figures (Washington, D.C.:UCP, 2001), [online], cited February 15, 2006, from <http://www.ucp.org/ucp_generaldoc.cfm/1/9/37/37-37/447>.
3 N. Colledge, A Guide to Cerebral Palsy (New Westminster, B.C.: Cerebral PalsyAssociation of British Columbia, 2004), [online], cited February 15, 2006, from<http://www.ofcp.on.ca/guide.html>.
4 P. Rosenbaum, “Cerebral Palsy: What Parents and Doctors Want to Know,” BritishMedical Journal 326 (2003): pp. 970–974.
5 M. Linenberg, Medical Issues and Cerebral Palsy (Toronto: Ontario Federation for Cerebral Palsy, 2003), [online], cited February 15, 2006, from <http://www.ofcp.on.ca/pdf/medical_book.pdf>.

Highlights
• Epilepsy accounted for $99.6 million in direct costs and$698.1 million in indirect costs in Canada in 2000–2001.
• The number of visits to EDs in Ontario by patientswith epilepsy decreased 11.9% from 2002–2003to 2005–2006.
• Around 30% of patients with epilepsy visiting EDs in Ontarioin 2005–2006 were admitted to acute care hospitals.
• The number of acute care hospitalizations across Canadafor patients with epilepsy increased 7.2% from 2000–2001to 2004–2005.
Epilepsy
What Is Epilepsy?Epilepsy is a group of neurological disorders charac-
terized by sudden, brief and recurrent seizures resulting
from abnormal discharges of electrical activity in the
brain.1 There are two main types of epilepsy: partial (affecting
part of the brain) and generalized (affecting the whole brain).1
While all forms of epilepsy are characterized by some form of
seizure, not all seizures are indicative of epilepsy.1
A national study estimates that epilepsy affects approximately 0.6% (175,000) ofCanadians, and that the incidence is highest during childhood and among theelderly.3 Approximately 15,500 new cases are diagnosed each year, accordingto Epilepsy Canada.1 According to the World Health Organization, epilepsy is agrowing worldwide public health problem.4
Signs and SymptomsSigns and symptoms of seizures vary:
• Simple partial seizures are divided into four main categories (motor,sensory, autonomic and psychic) and are not associated with alterationsof consciousness or amnesia.1
• Complex partial seizures involve altered behaviour and awareness andsome change in consciousness, followed by amnesia.1
• Generalized absence seizures (formerly called “petit mal seizures”) arecharacterized by a complete loss of awareness lasting usually less than10 seconds and are not preceded by a warning.1
• Tonic-clonic seizures (formerly called “grand mal seizures”) are ageneralized convulsion, which occur in two phases: tonic (manifestedin muscle stiffening and loss of consciousness) and clonic (manifestedin jerking and twitching of the body extremities). After the seizure,consciousness returns slowly and the individual is often confusedor disoriented.1
Because the symptoms of seizures are often dramatic, those with epilepsymay encounter social limitations and experience poor quality of life.5
Epilepsy
5151
The Burden of Neurological Diseases, Disorders and Injuries in Canada
52
Diagnosis and TreatmentsSince there is no specific diagnostic test, a detailed medical history isessential in deciding whether seizures are epileptic, and if so, whetherthey are partial or generalized.6 Electroencephalograms (EEGs) and brainimaging—computed tomography (CT) and magnetic resonance imaging(MRI)—help in identifying the type of epilepsy and determining the presenceof structural lesions causing seizures.3,6
Epilepsy may be treated with drugs, surgery or diet.7 Drug therapy is effectivein about two-thirds of patients.8 Among these, appoximately 70% becomeseizure-free using a single anti-epileptic drug.8 However, medication side effects(fatigue, allergies, weight gain or loss, changes in mood and memoryproblems) are common and can be disruptive.6 Some types of epilepsy,especially those that affect only one area of the brain, can be treated withsurgery.9 In a recent clinical trial, about half of the participants with temporallobe epilepsy became seizure-free following surgery, compared with 8% ofparticipants in the drug-therapy group.7
Economic Burden The PHAC estimates that total costs associated with epilepsy in 2000–2001were $797.7 million.
• Direct costs were $99.6 million: $44.8 million (45%) for hospital care,$25.6 million (25.7%) for physician care and $29.1 million (29.2 %)for drugs.
• Indirect costs associated with epilepsy were $698.1 million: $162.5 million(23.3%) in mortality cost and $535.6 million (76.7%) in morbidity cost.
Disability-Adjusted Life Years (DALYs) In 2000–2001, PHAC estimates that epilepsy wasassociated with more than 15,000 DALYs, accountingfor 0.3% of the DALYs for all illnesses in Canada.The years of healthy life lost due to disabilityrepresented a larger part (62.3%) of the DALYs forepilepsy than the years of life lost due to prematuremortality (37.7%).
Disability-adjusted life years (DALYs)is a summary measure of years of lifelost because of premature mortality(YLL) and years of healthy life lost asa result of disability (YLD). One DALYcan be thought of as one lost year ofhealthy life due to a specific disease,disorder or injury.
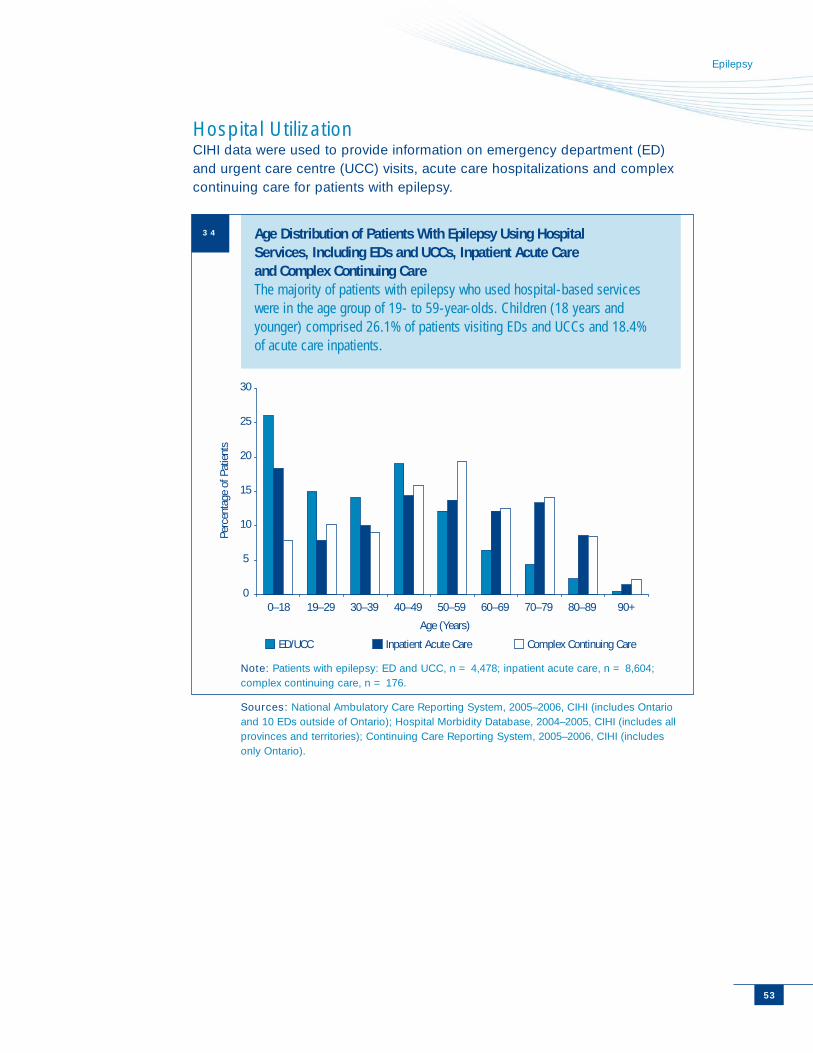
53
Epilepsy
Hospital UtilizationCIHI data were used to provide information on emergency department (ED)and urgent care centre (UCC) visits, acute care hospitalizations and complexcontinuing care for patients with epilepsy.
0
5
10
15
20
25
30
0–18 19–29 30–39 40–49 50–59 60–69 70–79 80–89 90+
Age (Years)
Perc
enta
ge o
f Pat
ient
s
ED/UCC Inpatient Acute Care Complex Continuing Care
Age Distribution of Patients With Epilepsy Using Hospital Services, Including EDs and UCCs, Inpatient Acute Care and Complex Continuing Care The majority of patients with epilepsy who used hospital-based serviceswere in the age group of 19- to 59-year-olds. Children (18 years andyounger) comprised 26.1% of patients visiting EDs and UCCs and 18.4% of acute care inpatients.
Note: Patients with epilepsy: ED and UCC, n = 4,478; inpatient acute care, n = 8,604;complex continuing care, n = 176.
Sources: National Ambulatory Care Reporting System, 2005–2006, CIHI (includes Ontarioand 10 EDs outside of Ontario); Hospital Morbidity Database, 2004–2005, CIHI (includes allprovinces and territories); Continuing Care Reporting System, 2005–2006, CIHI (includesonly Ontario).
34
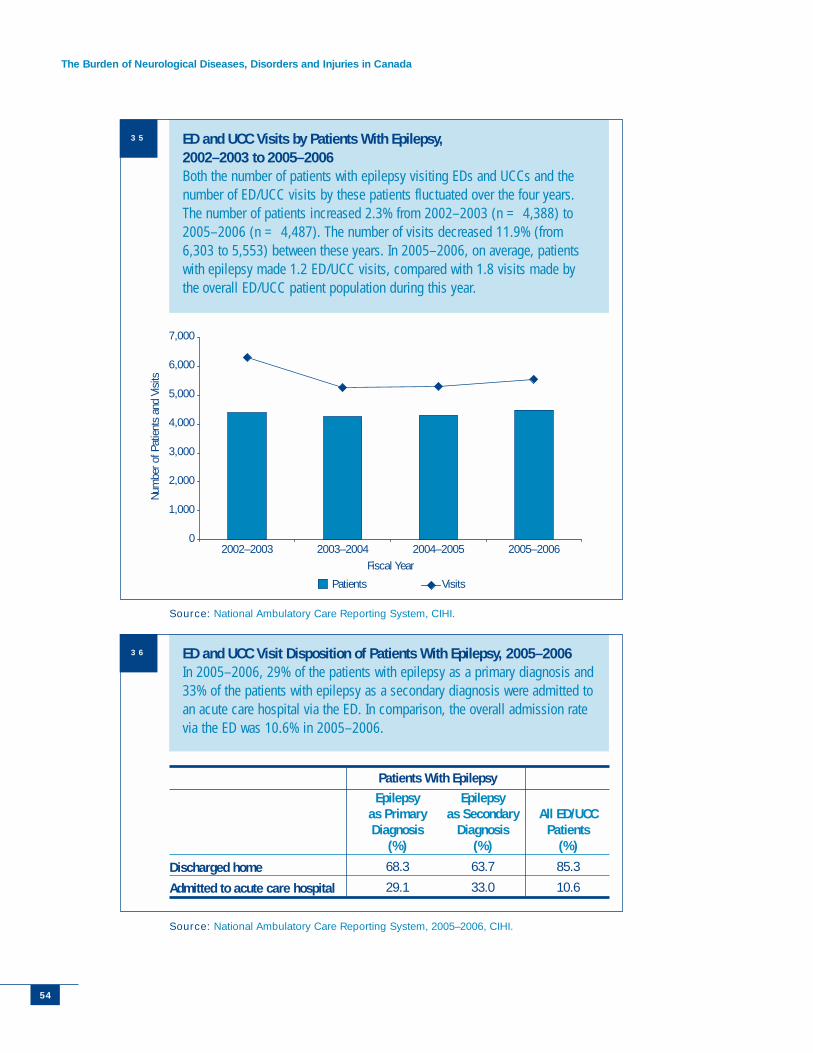
The Burden of Neurological Diseases, Disorders and Injuries in Canada
54
0
1,000
2,000
3,000
4,000
5,000
6,000
7,000
2002–2003 2003–2004 2004–2005 2005–2006Fiscal Year
Num
ber o
f Pat
ient
s an
d Vi
sits
Patients Visits
ED and UCC Visits by Patients With Epilepsy, 2002–2003 to 2005–2006Both the number of patients with epilepsy visiting EDs and UCCs and thenumber of ED/UCC visits by these patients fluctuated over the four years.The number of patients increased 2.3% from 2002–2003 (n = 4,388) to2005–2006 (n = 4,487). The number of visits decreased 11.9% (from6,303 to 5,553) between these years. In 2005–2006, on average, patientswith epilepsy made 1.2 ED/UCC visits, compared with 1.8 visits made bythe overall ED/UCC patient population during this year.
Source: National Ambulatory Care Reporting System, CIHI.
ED and UCC Visit Disposition of Patients With Epilepsy, 2005–2006In 2005–2006, 29% of the patients with epilepsy as a primary diagnosis and33% of the patients with epilepsy as a secondary diagnosis were admitted toan acute care hospital via the ED. In comparison, the overall admission ratevia the ED was 10.6% in 2005–2006.
Source: National Ambulatory Care Reporting System, 2005–2006, CIHI.
Patients With Epilepsy
Discharged home
Admitted to acute care hospital
Epilepsy as Primary Diagnosis
(%)
68.3
29.1
Epilepsy as Secondary
Diagnosis(%)
63.7
33.0
All ED/UCCPatients
(%)
85.3
10.6
35
36
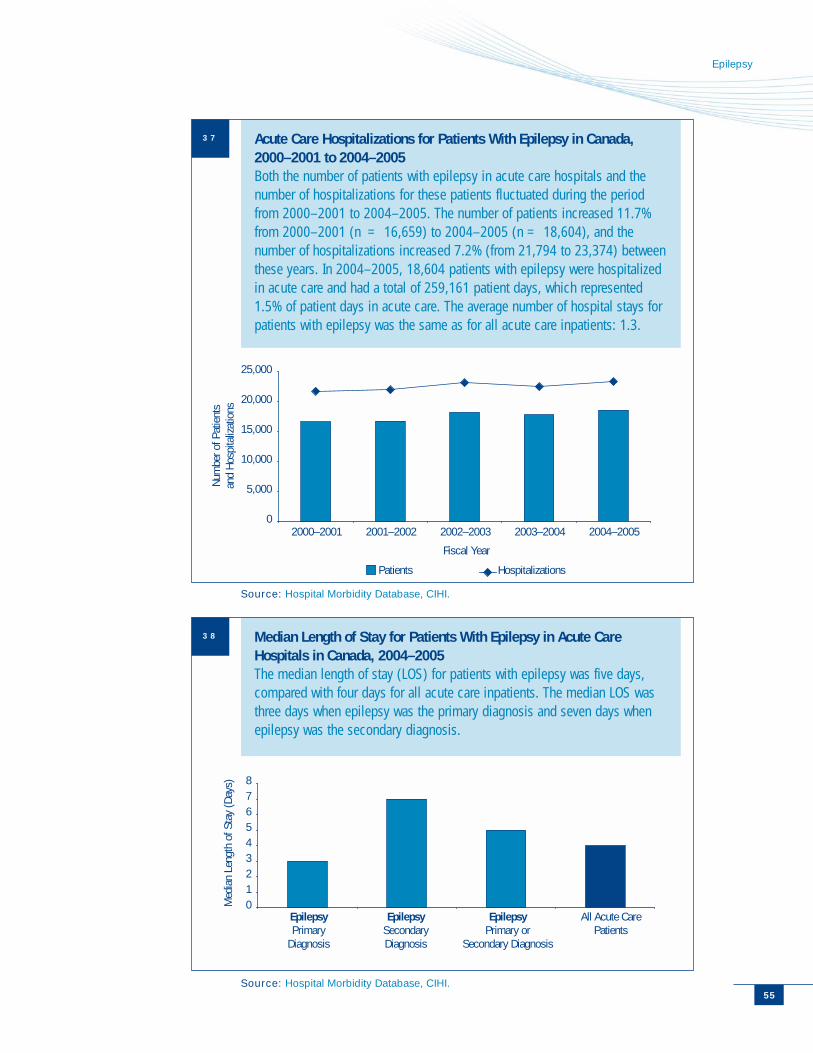
Epilepsy
55
0
5,000
10,000
15,000
20,000
25,000
2000–2001 2001–2002 2002–2003 2003–2004 2004–2005
Fiscal Year
Num
ber o
f Pat
ient
san
d Ho
spita
lizat
ions
Patients Hospitalizations
Acute Care Hospitalizations for Patients With Epilepsy in Canada,2000–2001 to 2004–2005Both the number of patients with epilepsy in acute care hospitals and thenumber of hospitalizations for these patients fluctuated during the periodfrom 2000–2001 to 2004–2005. The number of patients increased 11.7%from 2000–2001 (n = 16,659) to 2004–2005 (n = 18,604), and thenumber of hospitalizations increased 7.2% (from 21,794 to 23,374) betweenthese years. In 2004–2005, 18,604 patients with epilepsy were hospitalizedin acute care and had a total of 259,161 patient days, which represented1.5% of patient days in acute care. The average number of hospital stays forpatients with epilepsy was the same as for all acute care inpatients: 1.3.
Source: Hospital Morbidity Database, CIHI.
012345678
EpilepsyPrimary
Diagnosis
EpilepsySecondaryDiagnosis
EpilepsyPrimary or
Secondary Diagnosis
All Acute CarePatients
Med
ian
Leng
th o
f Sta
y (D
ays)
Median Length of Stay for Patients With Epilepsy in Acute CareHospitals in Canada, 2004–2005The median length of stay (LOS) for patients with epilepsy was five days,compared with four days for all acute care inpatients. The median LOS wasthree days when epilepsy was the primary diagnosis and seven days whenepilepsy was the secondary diagnosis.
Source: Hospital Morbidity Database, CIHI.
38
37
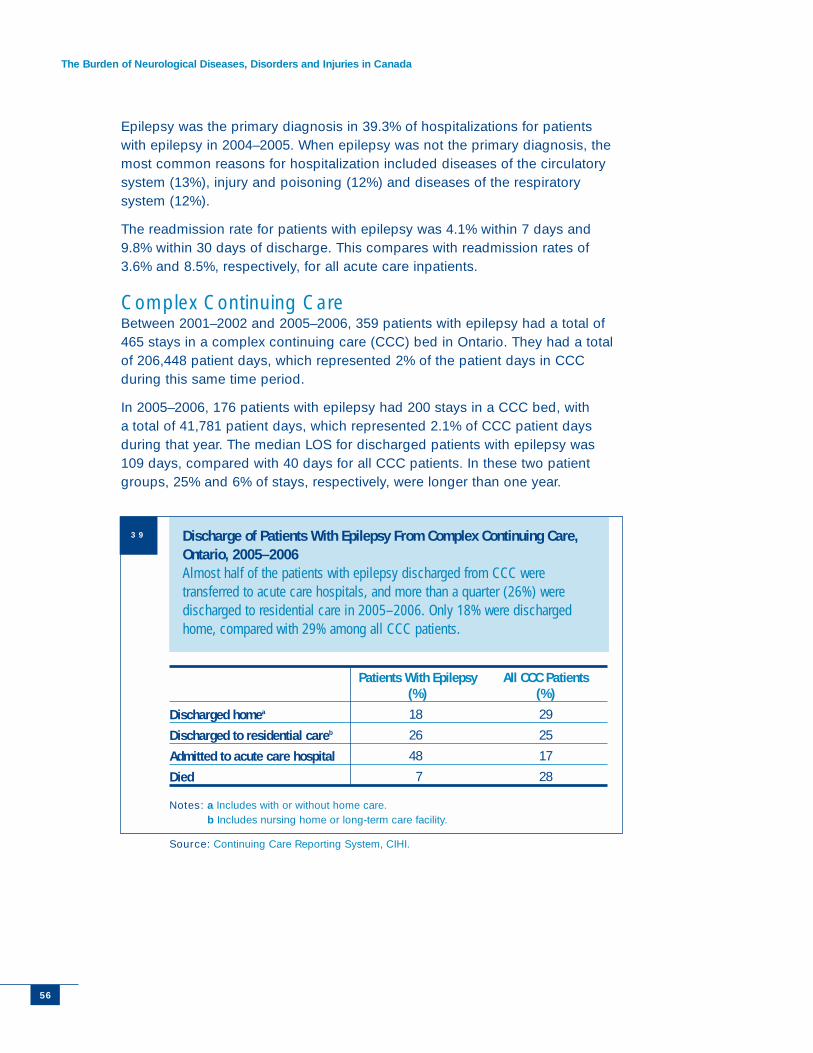
The Burden of Neurological Diseases, Disorders and Injuries in Canada
Epilepsy was the primary diagnosis in 39.3% of hospitalizations for patientswith epilepsy in 2004–2005. When epilepsy was not the primary diagnosis, themost common reasons for hospitalization included diseases of the circulatorysystem (13%), injury and poisoning (12%) and diseases of the respiratorysystem (12%).
The readmission rate for patients with epilepsy was 4.1% within 7 days and9.8% within 30 days of discharge. This compares with readmission rates of3.6% and 8.5%, respectively, for all acute care inpatients.
Complex Continuing CareBetween 2001–2002 and 2005–2006, 359 patients with epilepsy had a total of465 stays in a complex continuing care (CCC) bed in Ontario. They had a totalof 206,448 patient days, which represented 2% of the patient days in CCCduring this same time period.
In 2005–2006, 176 patients with epilepsy had 200 stays in a CCC bed, witha total of 41,781 patient days, which represented 2.1% of CCC patient daysduring that year. The median LOS for discharged patients with epilepsy was109 days, compared with 40 days for all CCC patients. In these two patientgroups, 25% and 6% of stays, respectively, were longer than one year.
56
Discharge of Patients With Epilepsy From Complex Continuing Care,Ontario, 2005–2006Almost half of the patients with epilepsy discharged from CCC weretransferred to acute care hospitals, and more than a quarter (26%) weredischarged to residential care in 2005–2006. Only 18% were dischargedhome, compared with 29% among all CCC patients.
Notes: a Includes with or without home care. b Includes nursing home or long-term care facility.
Source: Continuing Care Reporting System, CIHI.
Discharged homea
Discharged to residential careb
Admitted to acute care hospital
Died
Patients With Epilepsy (%)
18
26
48
7
All CCC Patients (%)
29
25
17
28
39
Epilepsy
57
References
1 Epilepsy Canada, Types of Seizures (Toronto: Epilepsy Canada, 2005), [online], citedApril 26, 2007, from <http://www.epilepsy.ca/eng/content/types.html>.
2 J. F. Tellez-Zenteno et al., “National and Regional Prevalence of Self-Reported Epilepsyin Canada,” Epilepsia 45 (2004): pp. 1623–1629.
3 Epilepsy Canada, Epilepsy Facts (Toronto: Epilepsy Canada, 2005), [online], cited May31, 2006, from <http://www.epilepsy.ca/eng/mainSet.html>.
4 A. Janca, “WHO Global Campaigns: A Way Forward in Addressing Public HealthImportance of Common Neurological Disorders,” Annals of General HospitalPsychiatry 3 (2004): p. 9.
5 S. Wiebe et al., “Burden of Epilepsy: The Ontario Health Survey,” Canadian Journalof Neurological Sciences 26 (1999): pp. 263–270.
6 S. M. LaRoche and S. L. Helmers, “The New Antiepileptic Drugs: Clinical Applications,”Journal of the American Medical Association 291 (2004): pp. 615–620.
7 Epilepsy Canada, Other Therapies (Toronto: Epilepsy Canada, 2005), [online], citedApril 27, 2007, from <http://www.epilepsy.ca/eng/content/other.html>.
8 P. Kwan and M. J. Brodie, “Early Identification of Refractory Epilepsy,” New EnglandJournal of Medicine 342 (2000): pp. 314–319.
9 S. Wiebe, et al., “A Randomized Controlled Trial of Surgery for Temporal-Lobe Epilepsy,”New England Journal of Medicine 345 (2001): pp. 311–318.
Highlights
• Head injuries accounted for $151.7 million in direct costsin Canada in 2000–2001.
• More than 10% of patients with head injury visiting EDs inOntario in Canada in 2005–2006 were admitted to acutecare hospitals.
• Just over 2% of all patients in inpatient rehabilitationservices in Ontario in 2005–2006 had head injury.
• 6.4% of CCC patient days in Ontario in 2005–2006included patients with head injury.
• Patients with head injuries visiting EDs and UCCs in2005–2006, and hospitalized in acute care in Canadain 2004–2005, were predominantly male: 60.6% and67.3%, respectively.
Head Injury
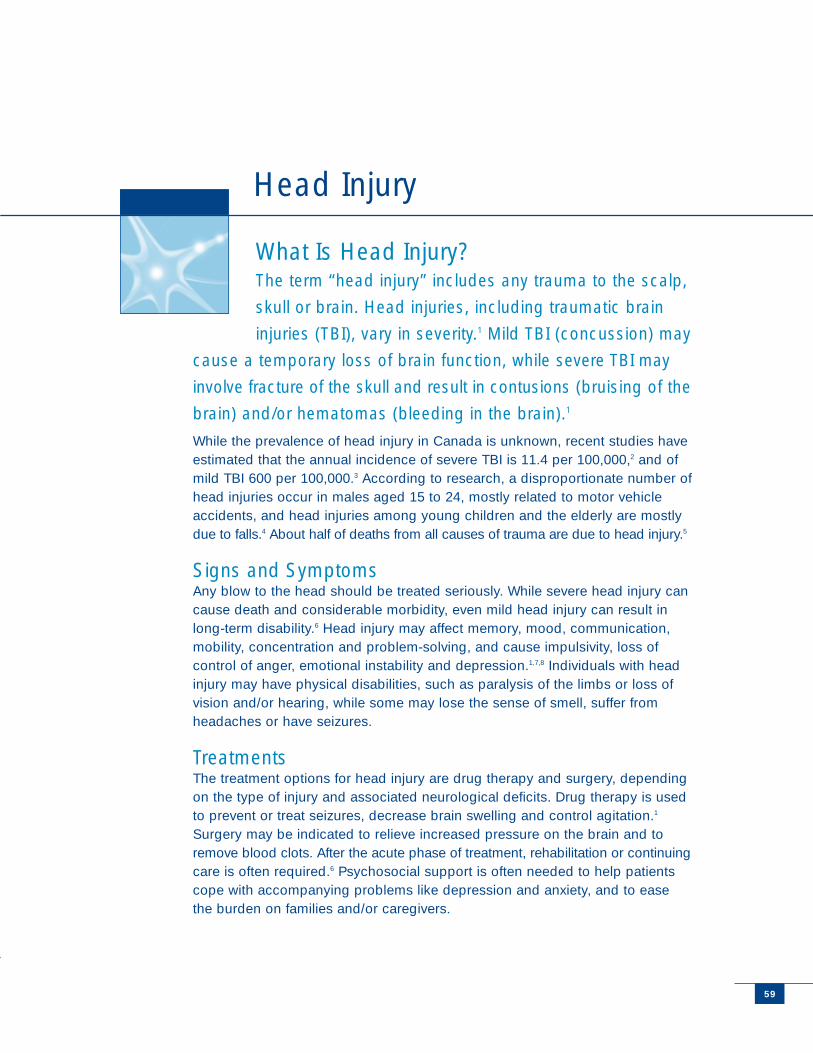
What Is Head Injury?The term “head injury” includes any trauma to the scalp,
skull or brain. Head injuries, including traumatic brain
injuries (TBI), vary in severity.1 Mild TBI (concussion) may
cause a temporary loss of brain function, while severe TBI may
involve fracture of the skull and result in contusions (bruising of the
brain) and/or hematomas (bleeding in the brain).1
While the prevalence of head injury in Canada is unknown, recent studies haveestimated that the annual incidence of severe TBI is 11.4 per 100,000,2 and ofmild TBI 600 per 100,000.3 According to research, a disproportionate number ofhead injuries occur in males aged 15 to 24, mostly related to motor vehicleaccidents, and head injuries among young children and the elderly are mostlydue to falls.4 About half of deaths from all causes of trauma are due to head injury.5
Signs and SymptomsAny blow to the head should be treated seriously. While severe head injury cancause death and considerable morbidity, even mild head injury can result inlong-term disability.6 Head injury may affect memory, mood, communication,mobility, concentration and problem-solving, and cause impulsivity, loss ofcontrol of anger, emotional instability and depression.1,7,8 Individuals with headinjury may have physical disabilities, such as paralysis of the limbs or loss ofvision and/or hearing, while some may lose the sense of smell, suffer fromheadaches or have seizures.
TreatmentsThe treatment options for head injury are drug therapy and surgery, dependingon the type of injury and associated neurological deficits. Drug therapy is usedto prevent or treat seizures, decrease brain swelling and control agitation.1
Surgery may be indicated to relieve increased pressure on the brain and toremove blood clots. After the acute phase of treatment, rehabilitation or continuingcare is often required.6 Psychosocial support is often needed to help patientscope with accompanying problems like depression and anxiety, and to easethe burden on families and/or caregivers.
Head Injury
5959
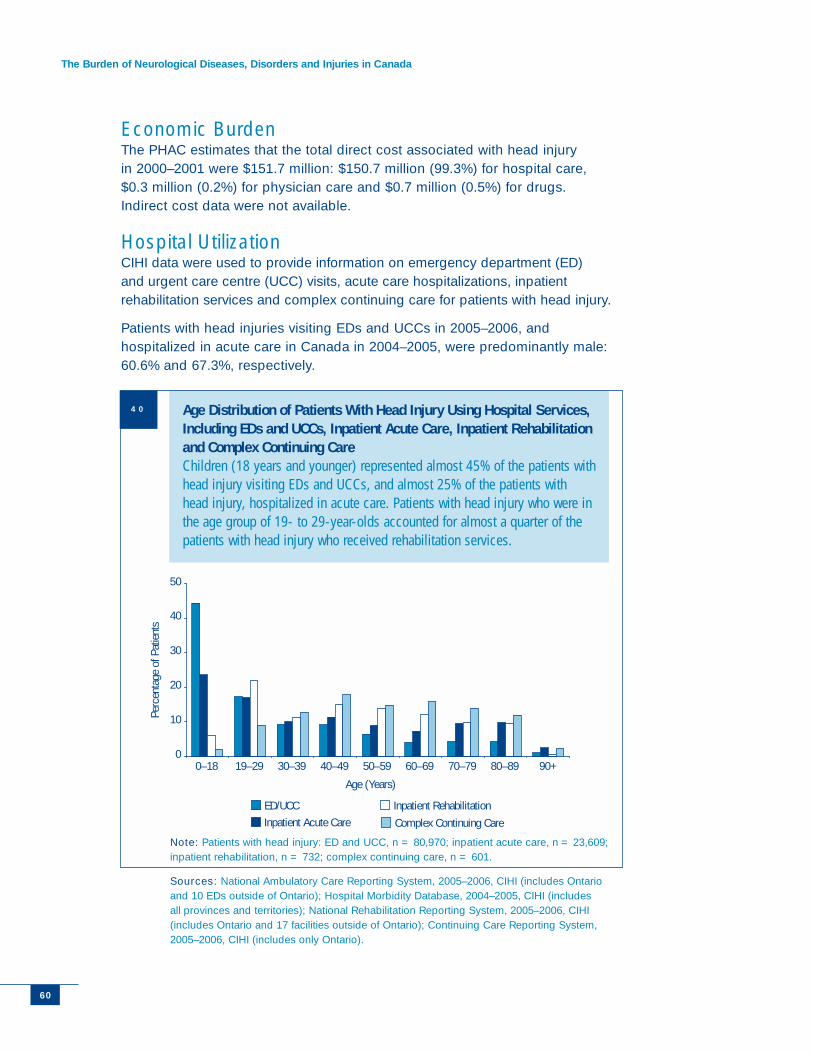
The Burden of Neurological Diseases, Disorders and Injuries in Canada
60
Economic Burden The PHAC estimates that the total direct cost associated with head injury in 2000–2001 were $151.7 million: $150.7 million (99.3%) for hospital care, $0.3 million (0.2%) for physician care and $0.7 million (0.5%) for drugs. Indirect cost data were not available.
Hospital UtilizationCIHI data were used to provide information on emergency department (ED)and urgent care centre (UCC) visits, acute care hospitalizations, inpatientrehabilitation services and complex continuing care for patients with head injury.
Patients with head injuries visiting EDs and UCCs in 2005–2006, andhospitalized in acute care in Canada in 2004–2005, were predominantly male:60.6% and 67.3%, respectively.
0
10
20
30
40
50
0–18 19–29 30–39 40–49 50–59 60–69 70–79 80–89 90+
Age (Years)
Perc
enta
ge o
f Pat
ient
s
ED/UCCInpatient Acute Care
Inpatient Rehabilitation
Complex Continuing Care
Age Distribution of Patients With Head Injury Using Hospital Services,Including EDs and UCCs, Inpatient Acute Care, Inpatient Rehabilitationand Complex Continuing Care Children (18 years and younger) represented almost 45% of the patients withhead injury visiting EDs and UCCs, and almost 25% of the patients withhead injury, hospitalized in acute care. Patients with head injury who were inthe age group of 19- to 29-year-olds accounted for almost a quarter of thepatients with head injury who received rehabilitation services.
Note: Patients with head injury: ED and UCC, n = 80,970; inpatient acute care, n = 23,609;inpatient rehabilitation, n = 732; complex continuing care, n = 601.
Sources: National Ambulatory Care Reporting System, 2005–2006, CIHI (includes Ontarioand 10 EDs outside of Ontario); Hospital Morbidity Database, 2004–2005, CIHI (includesall provinces and territories); National Rehabilitation Reporting System, 2005–2006, CIHI(includes Ontario and 17 facilities outside of Ontario); Continuing Care Reporting System,2005–2006, CIHI (includes only Ontario).
40
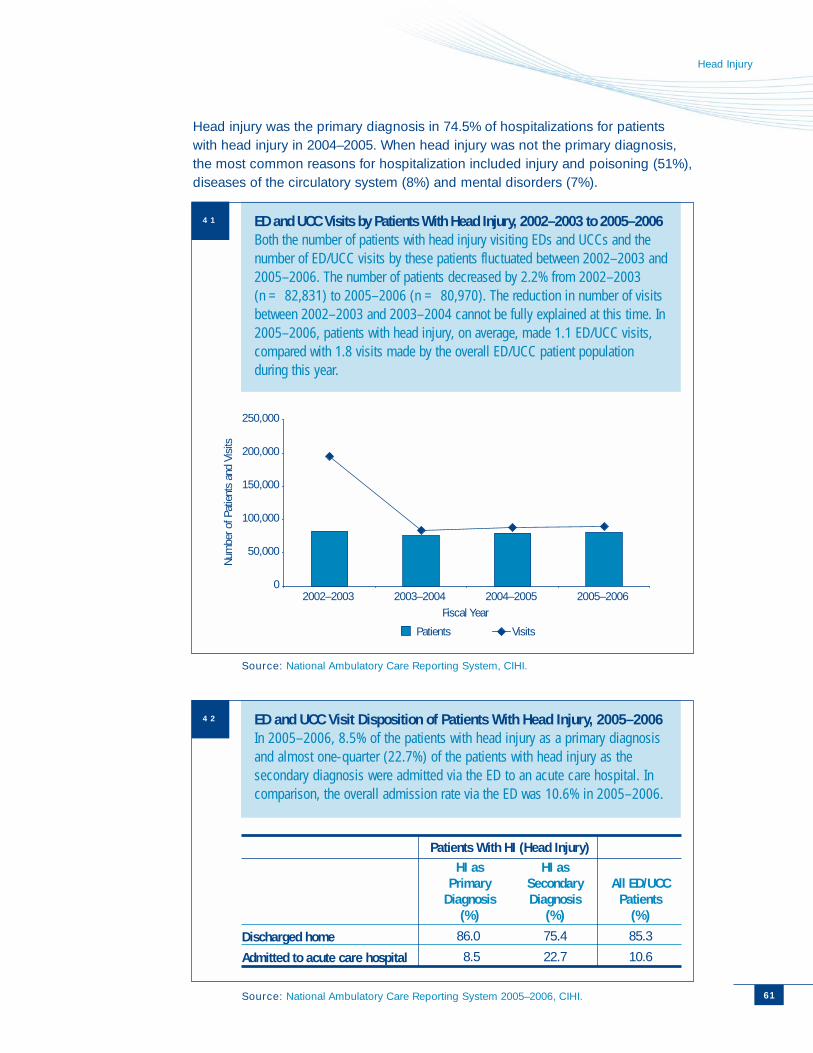
61
Head Injury
Head injury was the primary diagnosis in 74.5% of hospitalizations for patientswith head injury in 2004–2005. When head injury was not the primary diagnosis,the most common reasons for hospitalization included injury and poisoning (51%),diseases of the circulatory system (8%) and mental disorders (7%).
0
50,000
100,000
150,000
200,000
250,000
2002–2003 2003–2004 2004–2005 2005–2006Fiscal Year
Num
ber o
f Pat
ient
s an
d Vi
sits
Patients Visits
ED and UCC Visits by Patients With Head Injury, 2002–2003 to 2005–2006Both the number of patients with head injury visiting EDs and UCCs and thenumber of ED/UCC visits by these patients fluctuated between 2002–2003 and2005–2006. The number of patients decreased by 2.2% from 2002–2003(n = 82,831) to 2005–2006 (n = 80,970). The reduction in number of visitsbetween 2002–2003 and 2003–2004 cannot be fully explained at this time. In2005–2006, patients with head injury, on average, made 1.1 ED/UCC visits,compared with 1.8 visits made by the overall ED/UCC patient populationduring this year.
Source: National Ambulatory Care Reporting System, CIHI.
ED and UCC Visit Disposition of Patients With Head Injury, 2005–2006In 2005–2006, 8.5% of the patients with head injury as a primary diagnosisand almost one-quarter (22.7%) of the patients with head injury as thesecondary diagnosis were admitted via the ED to an acute care hospital. Incomparison, the overall admission rate via the ED was 10.6% in 2005–2006.
Source: National Ambulatory Care Reporting System 2005–2006, CIHI.
Patients With HI (Head Injury)
Discharged home
Admitted to acute care hospital
HI as Primary
Diagnosis(%)
86.0
8.5
HI asSecondaryDiagnosis
(%)
75.4
22.7
All ED/UCCPatients
(%)
85.3
10.6
41
42
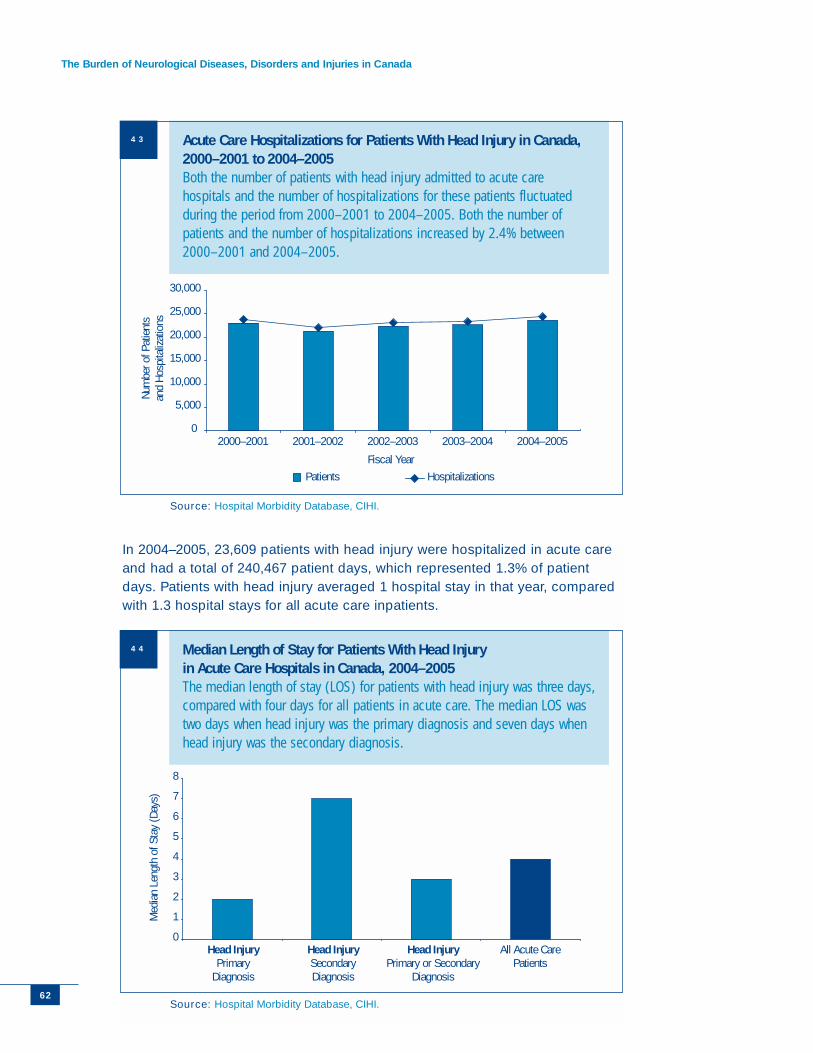
The Burden of Neurological Diseases, Disorders and Injuries in Canada
62
0
5,000
10,000
15,000
20,000
25,000
30,000
2000–2001 2001–2002 2002–2003 2003–2004 2004–2005
Fiscal Year
Num
ber o
f Pat
ient
san
d Ho
spita
lizat
ions
Patients Hospitalizations
Acute Care Hospitalizations for Patients With Head Injury in Canada,2000–2001 to 2004–2005Both the number of patients with head injury admitted to acute carehospitals and the number of hospitalizations for these patients fluctuatedduring the period from 2000–2001 to 2004–2005. Both the number ofpatients and the number of hospitalizations increased by 2.4% between2000–2001 and 2004–2005.
Source: Hospital Morbidity Database, CIHI.
0
1
2
3
4
5
6
7
8
Head InjuryPrimary
Diagnosis
Head InjurySecondaryDiagnosis
Head InjuryPrimary or Secondary
Diagnosis
All Acute CarePatients
Med
ian
Leng
th o
f Sta
y (D
ays)
Median Length of Stay for Patients With Head Injury in Acute Care Hospitals in Canada, 2004–2005The median length of stay (LOS) for patients with head injury was three days,compared with four days for all patients in acute care. The median LOS wastwo days when head injury was the primary diagnosis and seven days whenhead injury was the secondary diagnosis.
Source: Hospital Morbidity Database, CIHI.
43
44
In 2004–2005, 23,609 patients with head injury were hospitalized in acute careand had a total of 240,467 patient days, which represented 1.3% of patientdays. Patients with head injury averaged 1 hospital stay in that year, comparedwith 1.3 hospital stays for all acute care inpatients.
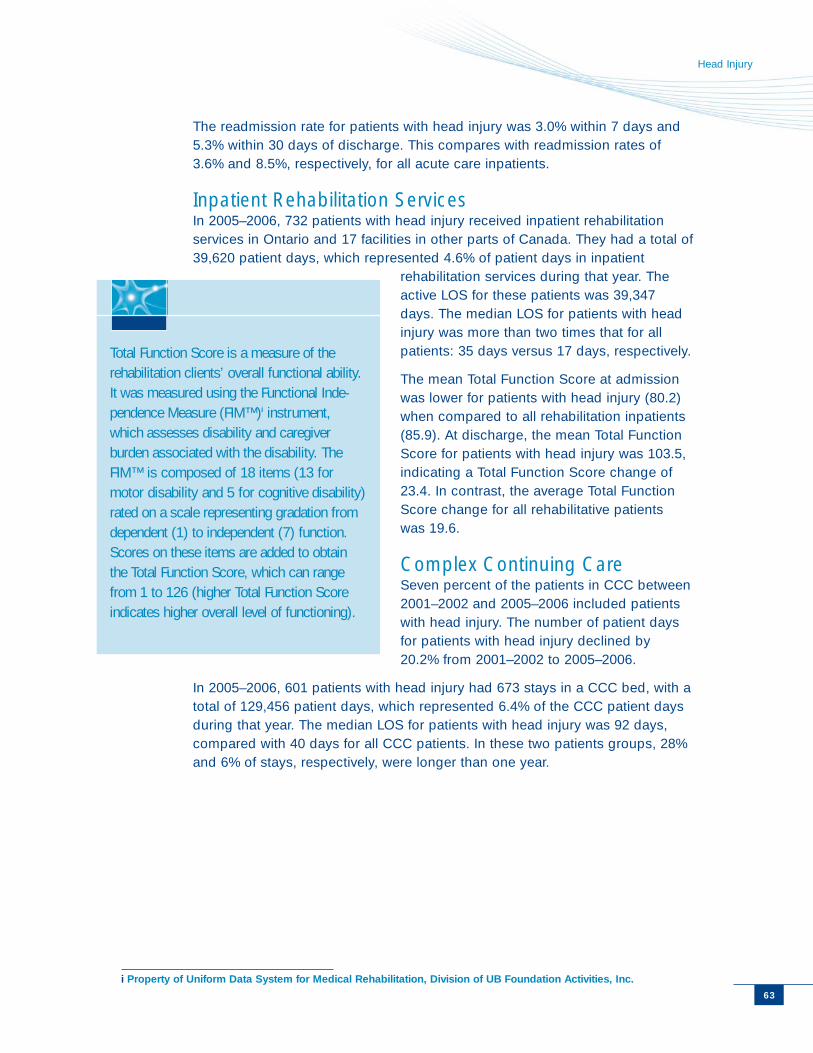
Head Injury
The readmission rate for patients with head injury was 3.0% within 7 days and5.3% within 30 days of discharge. This compares with readmission rates of3.6% and 8.5%, respectively, for all acute care inpatients.
Inpatient Rehabilitation Services In 2005–2006, 732 patients with head injury received inpatient rehabilitationservices in Ontario and 17 facilities in other parts of Canada. They had a total of39,620 patient days, which represented 4.6% of patient days in inpatient
rehabilitation services during that year. Theactive LOS for these patients was 39,347days. The median LOS for patients with headinjury was more than two times that for allpatients: 35 days versus 17 days, respectively.
The mean Total Function Score at admissionwas lower for patients with head injury (80.2)when compared to all rehabilitation inpatients(85.9). At discharge, the mean Total FunctionScore for patients with head injury was 103.5,indicating a Total Function Score change of23.4. In contrast, the average Total FunctionScore change for all rehabilitative patients was 19.6.
Complex Continuing Care Seven percent of the patients in CCC between2001–2002 and 2005–2006 included patientswith head injury. The number of patient daysfor patients with head injury declined by20.2% from 2001–2002 to 2005–2006.
In 2005–2006, 601 patients with head injury had 673 stays in a CCC bed, with atotal of 129,456 patient days, which represented 6.4% of the CCC patient daysduring that year. The median LOS for patients with head injury was 92 days,compared with 40 days for all CCC patients. In these two patients groups, 28%and 6% of stays, respectively, were longer than one year.
63
Total Function Score is a measure of therehabilitation clients’ overall functional ability.It was measured using the Functional Inde-pendence Measure (FIM™)i instrument,which assesses disability and caregiverburden associated with the disability. TheFIM™ is composed of 18 items (13 formotor disability and 5 for cognitive disability)rated on a scale representing gradation fromdependent (1) to independent (7) function.Scores on these items are added to obtainthe Total Function Score, which can rangefrom 1 to 126 (higher Total Function Scoreindicates higher overall level of functioning).
i Property of Uniform Data System for Medical Rehabilitation, Division of UB Foundation Activities, Inc.
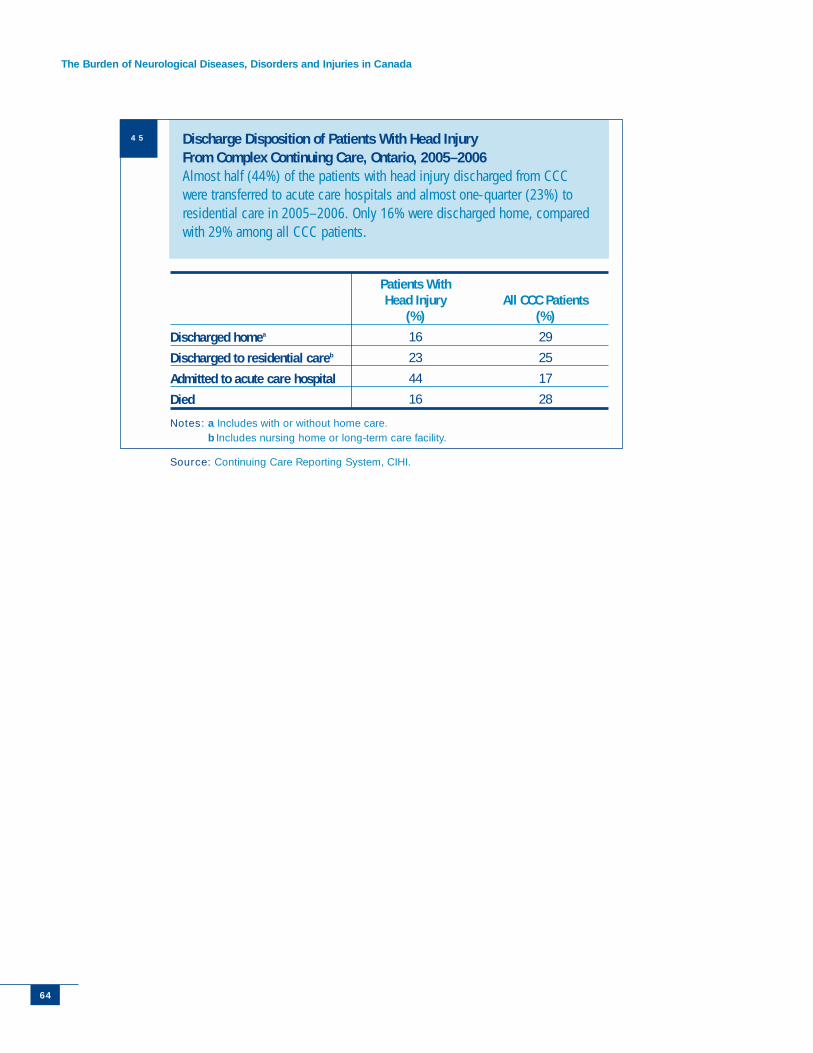
The Burden of Neurological Diseases, Disorders and Injuries in Canada
64
Discharge Disposition of Patients With Head Injury From Complex Continuing Care, Ontario, 2005–2006Almost half (44%) of the patients with head injury discharged from CCCwere transferred to acute care hospitals and almost one-quarter (23%) toresidential care in 2005–2006. Only 16% were discharged home, comparedwith 29% among all CCC patients.
Notes: a Includes with or without home care.b Includes nursing home or long-term care facility.
Source: Continuing Care Reporting System, CIHI.
Discharged homea
Discharged to residential careb
Admitted to acute care hospital
Died
Patients With Head Injury
(%)
16
23
44
16
All CCC Patients (%)
29
25
17
28
45
Head Injury
References
1 J. M. Torpy, C. L. Lynm and R. M. Glass, “Head Injury,” Journal of the AmericanMedical Association 294 (2005): p. 1580.
2 D. A. Zygun et al., “Severe Traumatic Brain Injury in a Large Canadian Health Region,”The Canadian Journal of Neurological Sciences 32 (2005): pp. 87–92.
3 J. D. Cassidy et al., “Incidence, Risk Factors and Prevention of Mild Traumatic BrainInjury: Results of the WHO Collaborating Centre Task Force on Mild Traumatic BrainInjury,” Journal of Rehabilitation Medicine 43 Suppl (2004): pp. 28–60.
4 W. Pickett, C. Ardern and R. J. Brison, “A Population-Based Study of Potential BrainInjuries Requiring Emergency Care,” Canadian Medical Association Journal 165(2001): pp. 288–292.
5 J. F. Kraus, “Epidemiology of Head Injury,” in Head Injury, Third Edition, P. R. Cooper(ed.) (Baltimore: Williams and Wilkins, 1993) pp. 1–25.
6 J. Wasserberg, “Treating Head Injuries,” British Medial Journal 325 (2002):pp. 454–455.
7 J. Leon-Carrion et al., “Epidemiology of Traumatic Brain Injury and SubarachnoidHemorrhage,” Pituitary 8 (2005): pp. 197–202.
8 S. Fleminger and J. Ponsford, “Long Term Outcome After Traumatic Brain Injury,”British Medical Journal 331 (2005): pp. 1419–1420.
65
Highlights
• Headaches accounted for $411 million in direct costs and$351.2 million in indirect costs in Canada in 2000–2001.
• The number of patients with headaches visiting EDs inOntario increased 8.2% from 2002–2003 to 2005–2006.
• The number of acute care hospitalizations acrossCanada for patients with headaches decreased 19%from 2000–2001 to 2004–2005.
Headaches
What Are Headaches?Headaches can be classified into two main types:
primary headaches (tension, migraine or cluster)
and secondary headaches caused by other medical
conditions and medication overuse (for example, for treatment
of primary headaches).1
Tension headaches occur in up to 80% to 90% of individuals, accordingto published reports.1,2 Researchers estimate that the annual prevalence ofmigraines is 18% to 33% in women and 6% to 13% in men, and that clusterheadaches affect 0.1% of the population.3,4 Reports indicate that migraines aremore prevalent among those 20 to 50 years of age.1 All primary headachescan be associated with considerable distress, disability, diminished qualityof life and financial costs.1
Signs and Symptoms Typical symptoms of tension headaches are mild to moderate pressure andtightness, often like a band around the head.1 Migraine headaches involvea moderate to severe throbbing or pulsating pain, usually on one side ofthe head, often accompanied by nausea, vomiting and sensitivity to lightor sound.1 Menstruation, stress, anxiety and head and neck trauma maypredispose patients to migraine attacks.1,5 Cluster headaches are usuallyexcruciating, with a penetrating quality.1 They are frequently recurrent, short-lasting and always occur on one side of the head, accompanied by tearing,redness of the eye, nasal congestion and swelling.1,2 Medication-overuseheadaches are often more frequent upon awakening, and tend to beexacerbated by physical exertion.1
Diagnosis and TreatmentsPrimary headaches can usually be diagnosed with a detailed clinical assessmentand symptom diaries.1 To diagnose secondary headaches, a comprehensiveneurologic examination and tests are required to determine the underlying causeof the headache.1
There are currently no cures for primary headaches, but a variety of drugsare available for symptom management.1 For secondary headaches, the bestapproach is to treat the underlying cause.1
Headaches
6767
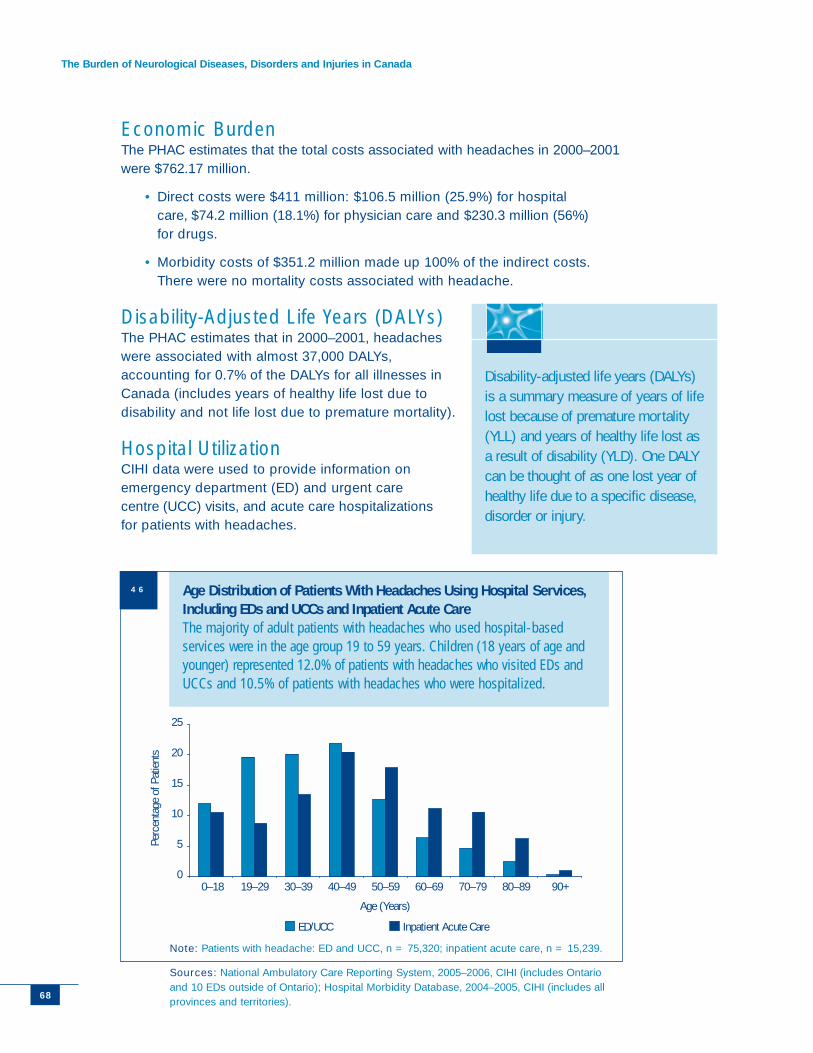
The Burden of Neurological Diseases, Disorders and Injuries in Canada
68
Economic Burden The PHAC estimates that the total costs associated with headaches in 2000–2001were $762.17 million.
• Direct costs were $411 million: $106.5 million (25.9%) for hospitalcare, $74.2 million (18.1%) for physician care and $230.3 million (56%)for drugs.
• Morbidity costs of $351.2 million made up 100% of the indirect costs.There were no mortality costs associated with headache.
Disability-Adjusted Life Years (DALYs)The PHAC estimates that in 2000–2001, headacheswere associated with almost 37,000 DALYs,accounting for 0.7% of the DALYs for all illnesses inCanada (includes years of healthy life lost due todisability and not life lost due to premature mortality).
Hospital UtilizationCIHI data were used to provide information onemergency department (ED) and urgent carecentre (UCC) visits, and acute care hospitalizationsfor patients with headaches.
0
5
10
15
20
25
0–18 19–29 30–39 40–49 50–59 60–69 70–79 80–89 90+
Age (Years)
Perc
enta
ge o
f Pat
ient
s
ED/UCC Inpatient Acute Care
Age Distribution of Patients With Headaches Using Hospital Services,Including EDs and UCCs and Inpatient Acute CareThe majority of adult patients with headaches who used hospital-basedservices were in the age group 19 to 59 years. Children (18 years of age andyounger) represented 12.0% of patients with headaches who visited EDs andUCCs and 10.5% of patients with headaches who were hospitalized.
Note: Patients with headache: ED and UCC, n = 75,320; inpatient acute care, n = 15,239.
Sources: National Ambulatory Care Reporting System, 2005–2006, CIHI (includes Ontarioand 10 EDs outside of Ontario); Hospital Morbidity Database, 2004–2005, CIHI (includes allprovinces and territories).
Disability-adjusted life years (DALYs)is a summary measure of years of lifelost because of premature mortality(YLL) and years of healthy life lost asa result of disability (YLD). One DALYcan be thought of as one lost year ofhealthy life due to a specific disease,disorder or injury.
46
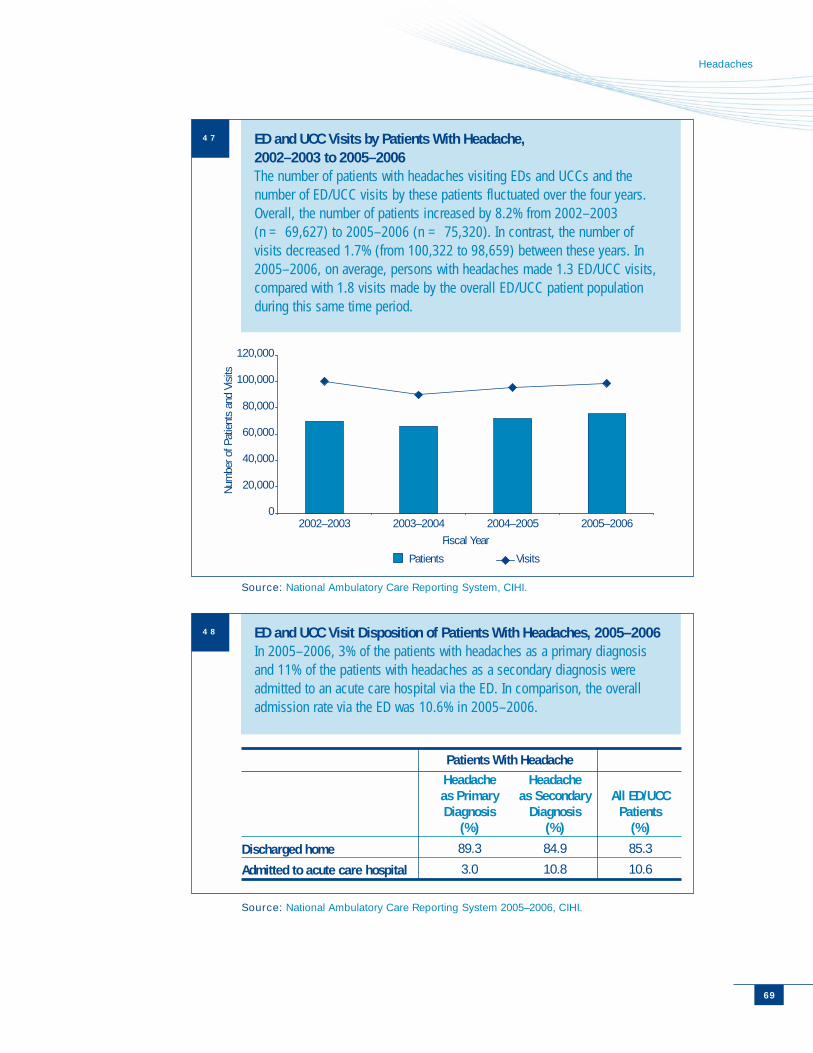
69
Headaches
0
20,000
40,000
60,000
80,000
100,000
120,000
2002–2003 2003–2004 2004–2005 2005–2006Fiscal Year
Num
ber o
f Pat
ient
s an
d Vi
sits
Patients Visits
ED and UCC Visits by Patients With Headache, 2002–2003 to 2005–2006The number of patients with headaches visiting EDs and UCCs and thenumber of ED/UCC visits by these patients fluctuated over the four years.Overall, the number of patients increased by 8.2% from 2002–2003(n = 69,627) to 2005–2006 (n = 75,320). In contrast, the number ofvisits decreased 1.7% (from 100,322 to 98,659) between these years. In2005–2006, on average, persons with headaches made 1.3 ED/UCC visits,compared with 1.8 visits made by the overall ED/UCC patient populationduring this same time period.
Source: National Ambulatory Care Reporting System, CIHI.
ED and UCC Visit Disposition of Patients With Headaches, 2005–2006In 2005–2006, 3% of the patients with headaches as a primary diagnosisand 11% of the patients with headaches as a secondary diagnosis wereadmitted to an acute care hospital via the ED. In comparison, the overalladmission rate via the ED was 10.6% in 2005–2006.
Source: National Ambulatory Care Reporting System 2005–2006, CIHI.
Patients With Headache
Discharged home
Admitted to acute care hospital
Headache as Primary Diagnosis
(%)
89.3
3.0
Headache as Secondary
Diagnosis(%)
84.9
10.8
All ED/UCCPatients
(%)
85.3
10.6
47
48
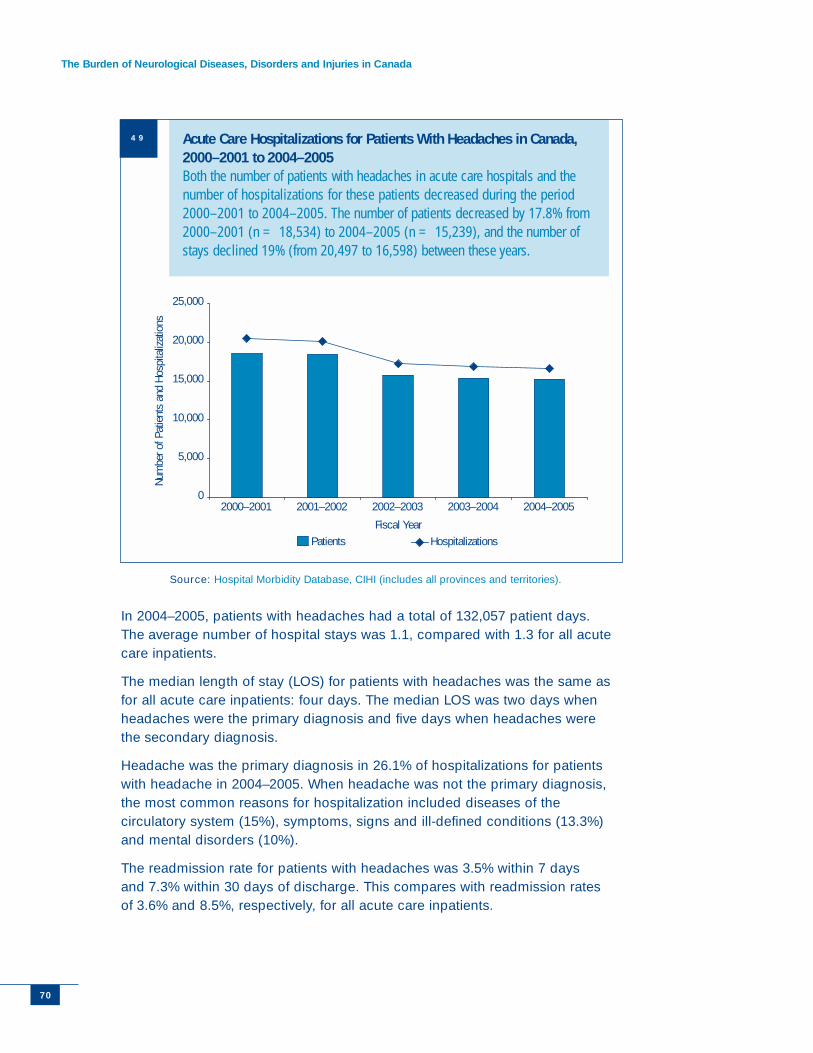
The Burden of Neurological Diseases, Disorders and Injuries in Canada
In 2004–2005, patients with headaches had a total of 132,057 patient days.The average number of hospital stays was 1.1, compared with 1.3 for all acutecare inpatients.
The median length of stay (LOS) for patients with headaches was the same asfor all acute care inpatients: four days. The median LOS was two days whenheadaches were the primary diagnosis and five days when headaches werethe secondary diagnosis.
Headache was the primary diagnosis in 26.1% of hospitalizations for patientswith headache in 2004–2005. When headache was not the primary diagnosis,the most common reasons for hospitalization included diseases of thecirculatory system (15%), symptoms, signs and ill-defined conditions (13.3%)and mental disorders (10%).
The readmission rate for patients with headaches was 3.5% within 7 daysand 7.3% within 30 days of discharge. This compares with readmission ratesof 3.6% and 8.5%, respectively, for all acute care inpatients.
70
0
5,000
10,000
15,000
20,000
25,000
2000–2001 2001–2002 2002–2003 2003–2004 2004–2005
Fiscal Year
Num
ber o
f Pat
ient
s an
d Ho
spita
lizat
ions
Patients Hospitalizations
Acute Care Hospitalizations for Patients With Headaches in Canada,2000–2001 to 2004–2005Both the number of patients with headaches in acute care hospitals and thenumber of hospitalizations for these patients decreased during the period2000–2001 to 2004–2005. The number of patients decreased by 17.8% from2000–2001 (n = 18,534) to 2004–2005 (n = 15,239), and the number ofstays declined 19% (from 20,497 to 16,598) between these years.
Source: Hospital Morbidity Database, CIHI (includes all provinces and territories).
49
Headaches
References
1 T. J. Steiner and M. Fontebasso, “Headache,” British Medical Journal 325 (2002):pp. 881–886.
2 B. K. Rasmussen et al., “Epidemiology of Headache in a General Population:A Prevalence Study,” Journal of Clinical Epidemiology 44 (1991): pp. 1147–1157.
3 R. Cady and D. Dodick, “Diagnosis and Treatment of Migraine,” Mayo ClinicProceedings 77 (2002): pp. 255–261.
4 A. Bahra, A. Ma and P. J. Goadsby, “Cluster Headache: A Prospective Clinical StudyWith Diagnostic Implications,” Neurology 58 (2002): pp. 354–361.
5 S. K. Bal and G. R. Hollingworth, “Headache,” British Medical Journal 330 (2005): p. 346.
71
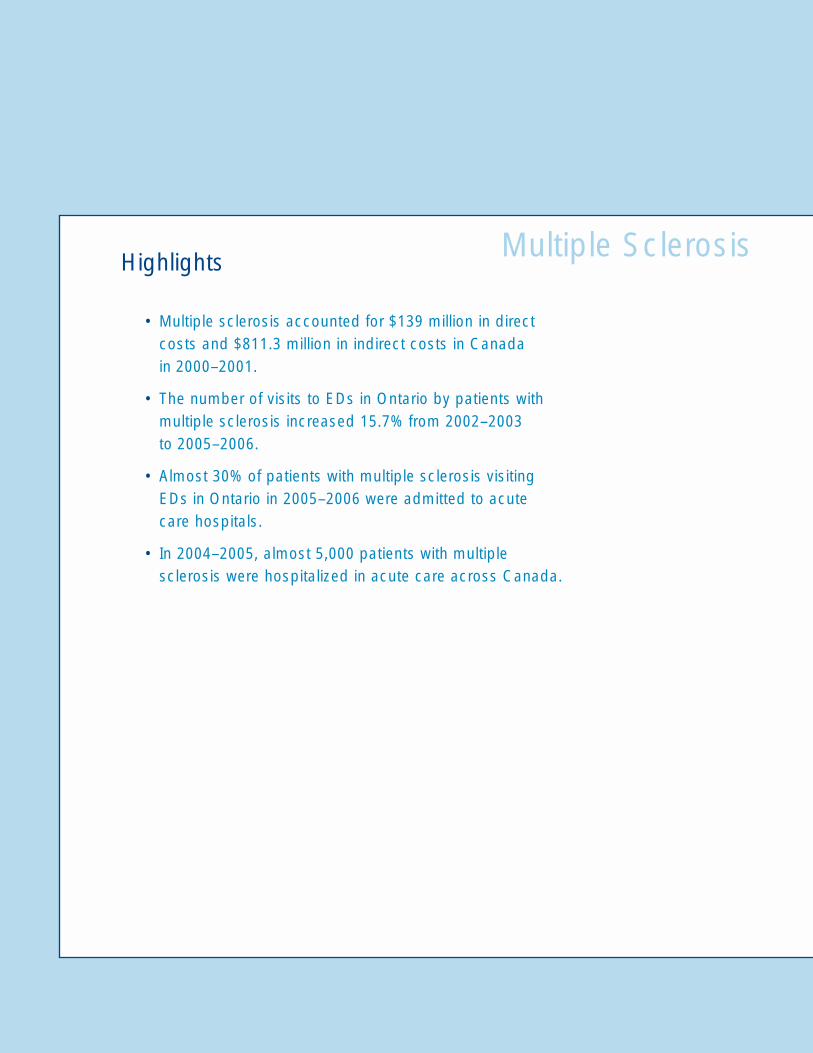
Highlights
• Multiple sclerosis accounted for $139 million in directcosts and $811.3 million in indirect costs in Canadain 2000–2001.
• The number of visits to EDs in Ontario by patients withmultiple sclerosis increased 15.7% from 2002–2003to 2005–2006.
• Almost 30% of patients with multiple sclerosis visitingEDs in Ontario in 2005–2006 were admitted to acute care hospitals.
• In 2004–2005, almost 5,000 patients with multiplesclerosis were hospitalized in acute care across Canada.
Multiple Sclerosis
What Is Multiple Sclerosis?Multiple sclerosis (MS) is a disabling disease resulting
from the inflammation and damage of nerve cells
of the brain and spinal cord.1,2 There are two main
types of MS: relapsing-remitting MS (characterized by episodic
relapses and remissions) and primary-progressive MS (charac-
terized by a steady, slow progression).1 The relapsing-remitting
MS is more frequent, occurring in 85% of patients.1 The cause
of MS is not known, but probably involves genetic, viral and
environmental factors.2
According to research, MS is the most common disabling neurological conditionin young adults worldwide.1 It affects up to three times as many women as men,with a typical age of onset between 20 and 50 years, according to a publishedreport.2 The Multiple Sclerosis Society of Canada estimates that there arecurrently 55,000 to 75,000 patients with MS in Canada; this is one of thehighest prevalence rates of MS in the world.3
Signs and SymptomsThe first symptoms of MS may be the disruption of vision in one eye and changeof sensation.1 New symptoms occur months or years later, and can include visiondifficulties, muscle weakness, loss of balance and coordination, pain, extremefatigue, bladder and bowel problems and changes in cognitive functions.1,2
These symptoms tend to vary in severity. Approximately 15% of people withrelapsing-remitting MS experience minimal disability 15 years after diagnosis.This form of MS is referred to as benign MS.1 However, many patients withrelapsing-remitting MS eventually enter a phase of steady worsening knownas secondary-progressive MS.1
Multiple Sclerosis
7373
The Burden of Neurological Diseases, Disorders and Injuries in Canada
74
Diagnosis and TreatmentsMS is diagnosed on the basis of evidence of two disease episodes, and isachieved through a detailed medical history and neurological examination.1,2
Diagnosis is confirmed by brain and spinal cord imaging (magnetic resonanceimaging or MRI).2
The treatment of MS is aimed at relieving symptoms, preventing disease relapseand patient rehabilitation.1,4 The disease-modifying medications mainly benefitpatients with the relapsing-remitting MS and are more effective when introducedearly.1 These medications reduce the frequency and severity of relapses and thusslow the progression of disability.4 Patients with MS also require therapies foraccompanying conditions, such as pain, fatigue, depression and bladder/bowelproblems.1,2 Occupational therapy, rehabilitation services and psychosocialsupport are often needed to help with activities of daily living and diminishedquality of life.2
Economic Burden The PHAC estimates that the total costs associated with MS in 2000–2001 were$950.5 million.
• Direct costs were $139.2 million: $58.4 million (42%) for hospital care,$12.1 million (8.7%) for physician care and $68.7 million (49.4%)for drugs.
• Indirect costs were $811.3 million: $172.8 million (21.3%) in mortalitycosts and $638.45 million (78.7%) in morbidity costs.
Disability-Adjusted Life YearsThe PHAC estimates that in 2000–2001, MS wasassociated with 13,677 DALYs. The years of life lostdue to premature mortality represented a largercomponent (57.1%) of the DALYs for MS than theyears of healthy life lost due to disability (42.9%).
Disability-adjusted life years (DALYs)is a summary measure of years of lifelost because of premature mortality(YLL) and years of healthy life lost asa result of disability (YLD). One DALYcan be thought of as one lost year ofhealthy life due to a specific disease,disorder or injury.
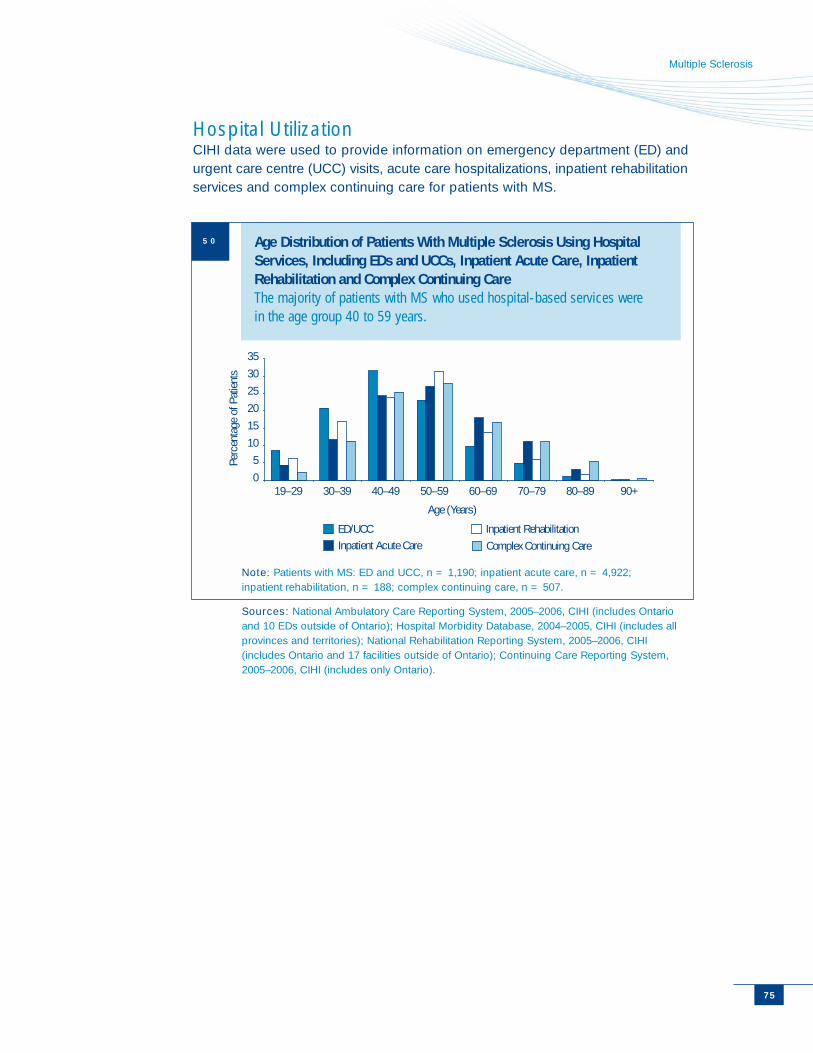
75
Multiple Sclerosis
Hospital UtilizationCIHI data were used to provide information on emergency department (ED) andurgent care centre (UCC) visits, acute care hospitalizations, inpatient rehabilitationservices and complex continuing care for patients with MS.
0
5
10
15
20
25
30
35
19–29 30–39 40–49 50–59 60–69 70–79 80–89 90+
Age (Years)
Perc
enta
ge o
f Pat
ient
s
ED/UCCInpatient Acute Care
Inpatient RehabilitationComplex Continuing Care
Age Distribution of Patients With Multiple Sclerosis Using HospitalServices, Including EDs and UCCs, Inpatient Acute Care, InpatientRehabilitation and Complex Continuing Care The majority of patients with MS who used hospital-based services werein the age group 40 to 59 years.
Note: Patients with MS: ED and UCC, n = 1,190; inpatient acute care, n = 4,922;inpatient rehabilitation, n = 188; complex continuing care, n = 507.
Sources: National Ambulatory Care Reporting System, 2005–2006, CIHI (includes Ontarioand 10 EDs outside of Ontario); Hospital Morbidity Database, 2004–2005, CIHI (includes allprovinces and territories); National Rehabilitation Reporting System, 2005–2006, CIHI(includes Ontario and 17 facilities outside of Ontario); Continuing Care Reporting System,2005–2006, CIHI (includes only Ontario).
50
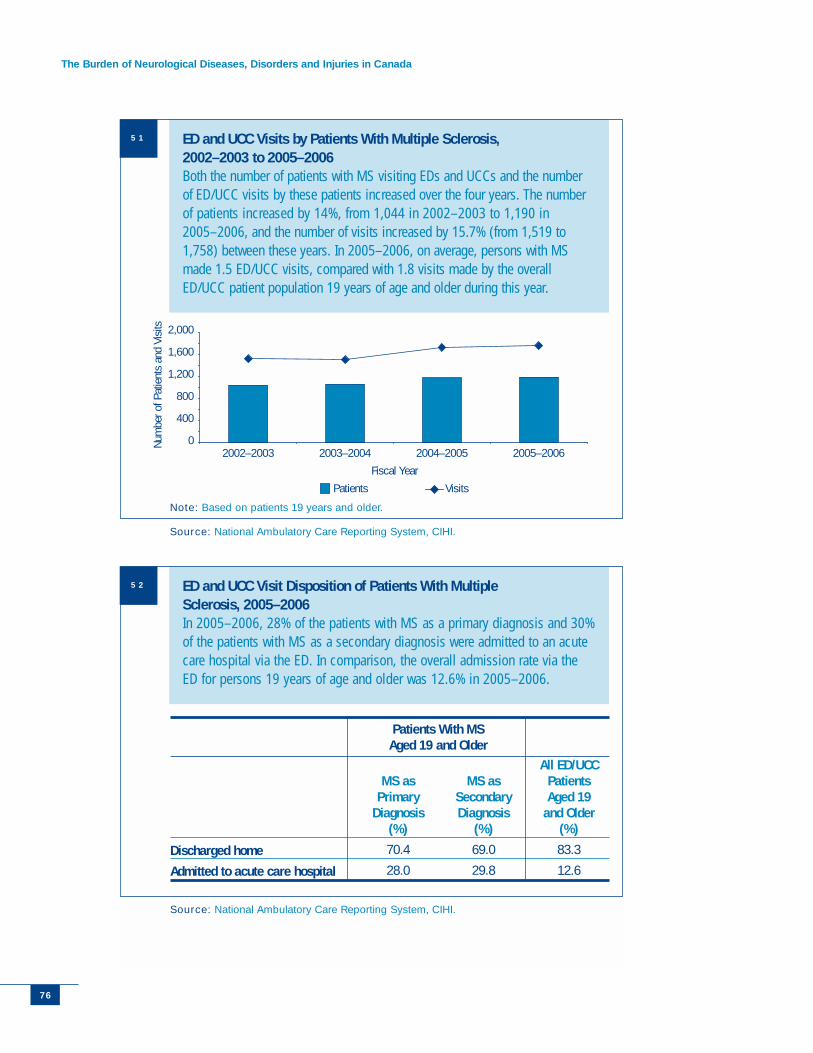
The Burden of Neurological Diseases, Disorders and Injuries in Canada
76
ED and UCC Visit Disposition of Patients With MultipleSclerosis, 2005–2006In 2005–2006, 28% of the patients with MS as a primary diagnosis and 30%of the patients with MS as a secondary diagnosis were admitted to an acutecare hospital via the ED. In comparison, the overall admission rate via theED for persons 19 years of age and older was 12.6% in 2005–2006.
Source: National Ambulatory Care Reporting System, CIHI.
52
Patients With MS Aged 19 and Older
Discharged home
Admitted to acute care hospital
MS as Primary
Diagnosis(%)
70.4
28.0
MS asSecondaryDiagnosis
(%)
69.0
29.8
All ED/UCCPatients Aged 19
and Older(%)
83.3
12.6
0
400
800
1,200
1,600
2,000
2002–2003 2003–2004 2004–2005 2005–2006
Fiscal Year
Num
ber o
f Pat
ient
s an
d Vi
sits
Patients Visits
ED and UCC Visits by Patients With Multiple Sclerosis, 2002–2003 to 2005–2006Both the number of patients with MS visiting EDs and UCCs and the numberof ED/UCC visits by these patients increased over the four years. The numberof patients increased by 14%, from 1,044 in 2002–2003 to 1,190 in2005–2006, and the number of visits increased by 15.7% (from 1,519 to1,758) between these years. In 2005–2006, on average, persons with MSmade 1.5 ED/UCC visits, compared with 1.8 visits made by the overallED/UCC patient population 19 years of age and older during this year.
Note: Based on patients 19 years and older.
Source: National Ambulatory Care Reporting System, CIHI.
51
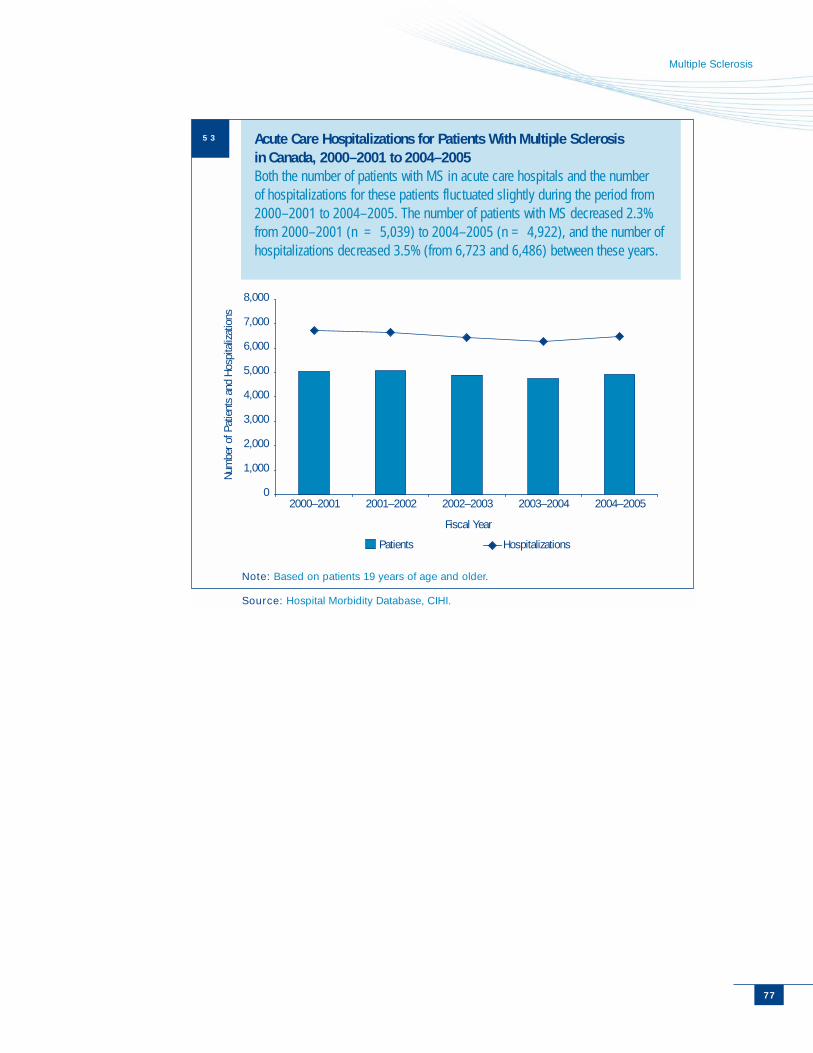
Multiple Sclerosis
77
0
1,000
2,000
3,000
4,000
5,000
6,000
7,000
8,000
2000–2001 2001–2002 2002–2003 2003–2004 2004–2005
Fiscal Year
Num
ber o
f Pat
ient
s an
d Ho
spita
lizat
ions
Patients Hospitalizations
Acute Care Hospitalizations for Patients With Multiple Sclerosisin Canada, 2000–2001 to 2004–2005Both the number of patients with MS in acute care hospitals and the numberof hospitalizations for these patients fluctuated slightly during the period from2000–2001 to 2004–2005. The number of patients with MS decreased 2.3%from 2000–2001 (n = 5,039) to 2004–2005 (n = 4,922), and the number ofhospitalizations decreased 3.5% (from 6,723 and 6,486) between these years.
Note: Based on patients 19 years of age and older.
Source: Hospital Morbidity Database, CIHI.
53
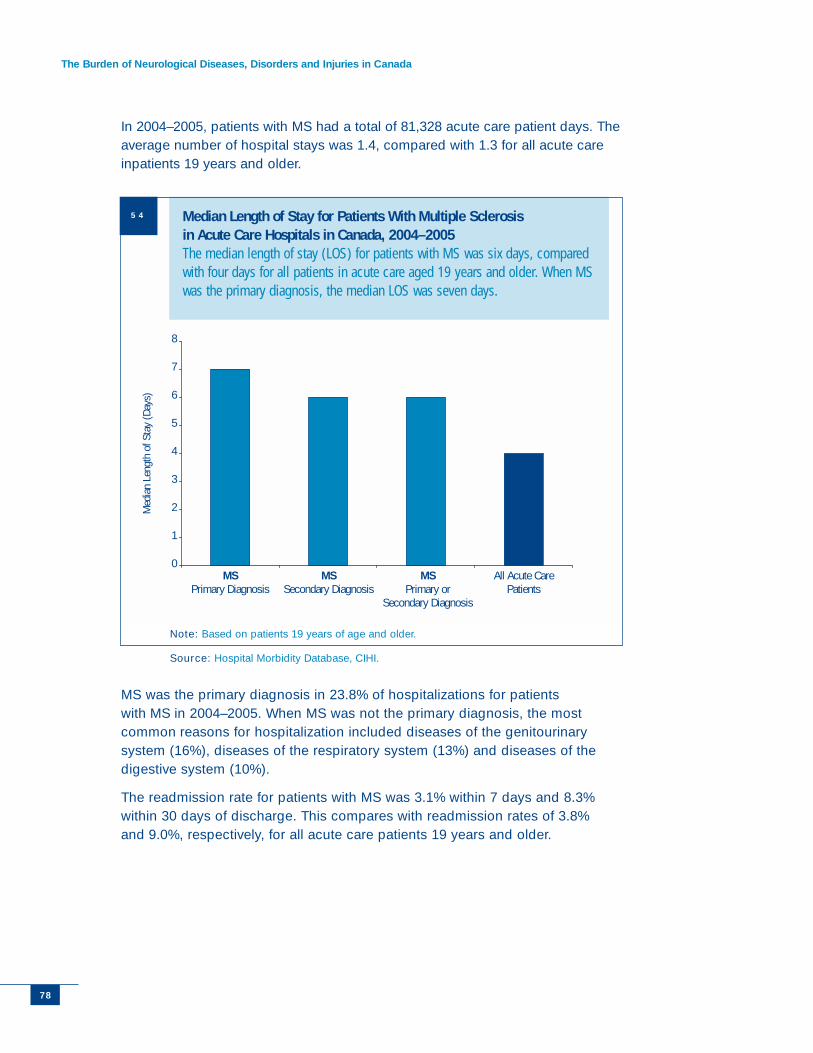
The Burden of Neurological Diseases, Disorders and Injuries in Canada
In 2004–2005, patients with MS had a total of 81,328 acute care patient days. Theaverage number of hospital stays was 1.4, compared with 1.3 for all acute careinpatients 19 years and older.
MS was the primary diagnosis in 23.8% of hospitalizations for patientswith MS in 2004–2005. When MS was not the primary diagnosis, the mostcommon reasons for hospitalization included diseases of the genitourinarysystem (16%), diseases of the respiratory system (13%) and diseases of thedigestive system (10%).
The readmission rate for patients with MS was 3.1% within 7 days and 8.3%within 30 days of discharge. This compares with readmission rates of 3.8%and 9.0%, respectively, for all acute care patients 19 years and older.
78
0
1
2
3
4
5
6
7
8
MSPrimary Diagnosis
MSSecondary Diagnosis
MSPrimary or
Secondary Diagnosis
All Acute CarePatients
Med
ian
Leng
th o
f Sta
y (D
ays)
Median Length of Stay for Patients With Multiple Sclerosis in Acute Care Hospitals in Canada, 2004–2005The median length of stay (LOS) for patients with MS was six days, comparedwith four days for all patients in acute care aged 19 years and older. When MSwas the primary diagnosis, the median LOS was seven days.
Note: Based on patients 19 years of age and older.
Source: Hospital Morbidity Database, CIHI.
54
Multiple Sclerosis
Inpatient Rehabilitation ServicesIn 2005–2006, 188 patients with MS had a total of7,898 inpatient rehabilitation patient days in Ontarioand 17 hospitals in other parts of Canada. Theirmedian LOS was 35 days, compared with 17 daysfor all patients 19 years of age and over.
The mean Total Function Score at admission forpatients with MS (81.6) was lower than the meanTotal Function Score for all rehabilitation patients19 years of age and over (85.9). At discharge, themean Total Function Score for patients with MS was94.9, indicating a Total Function Score change of13.2 points. In contrast, the Total Function Scorechange for all rehabilitation patients 19 years andover was 19.6.
79
Total Function Score is a measureof the rehabilitation clients’ overallfunctional ability. It was measuredusing the Functional IndependenceMeasure (FIM™)i instrument, whichassesses disability and caregiverburden associated with the disability.The FIM™ is composed of 18 items(13 for motor disability and 5 forcognitive disability) rated on ascale representing gradation fromdependent (1) to independent (7)function. Scores on these items areadded to obtain the Total FunctionScore, which can range from 1 to126 (a higher Total Function Scoreindicates a higher overall levelof functioning).
i Property of Uniform Data System for Medical Rehabilitation, Division of UB Foundation Activities, Inc.
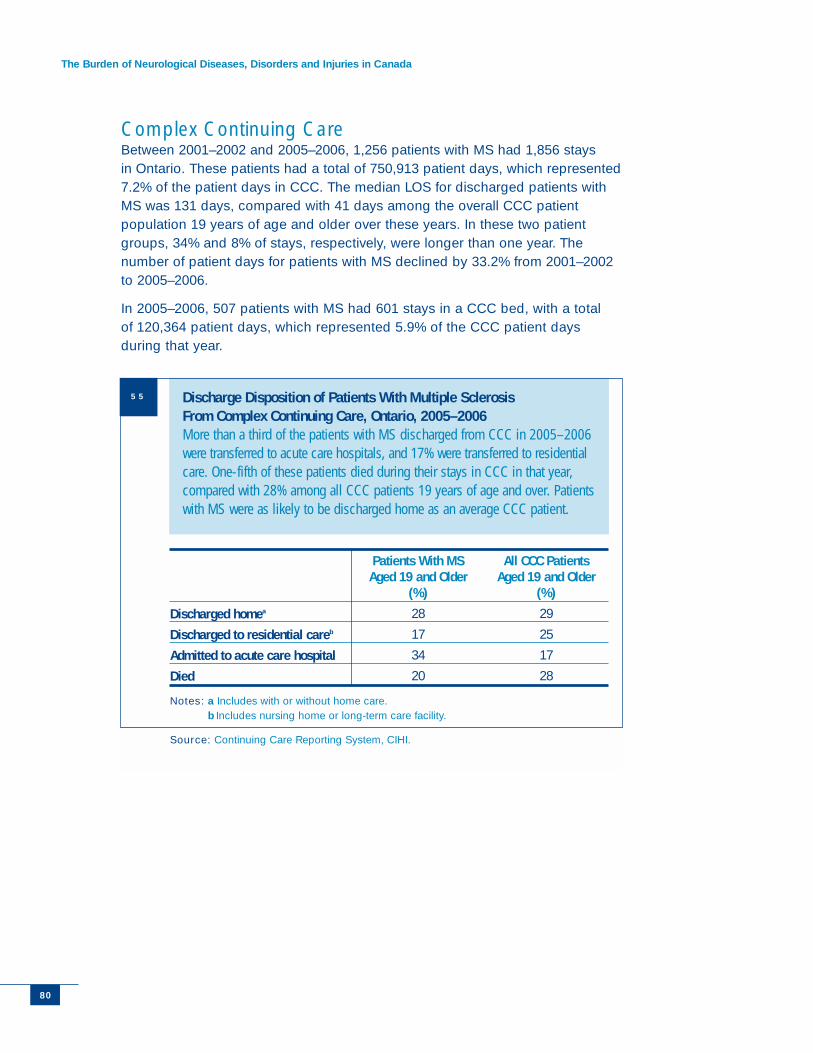
The Burden of Neurological Diseases, Disorders and Injuries in Canada
8080
Complex Continuing CareBetween 2001–2002 and 2005–2006, 1,256 patients with MS had 1,856 staysin Ontario. These patients had a total of 750,913 patient days, which represented7.2% of the patient days in CCC. The median LOS for discharged patients withMS was 131 days, compared with 41 days among the overall CCC patientpopulation 19 years of age and older over these years. In these two patientgroups, 34% and 8% of stays, respectively, were longer than one year. Thenumber of patient days for patients with MS declined by 33.2% from 2001–2002to 2005–2006.
In 2005–2006, 507 patients with MS had 601 stays in a CCC bed, with a totalof 120,364 patient days, which represented 5.9% of the CCC patient daysduring that year.
Discharge Disposition of Patients With Multiple Sclerosis From Complex Continuing Care, Ontario, 2005–2006More than a third of the patients with MS discharged from CCC in 2005–2006were transferred to acute care hospitals, and 17% were transferred to residentialcare. One-fifth of these patients died during their stays in CCC in that year,compared with 28% among all CCC patients 19 years of age and over. Patientswith MS were as likely to be discharged home as an average CCC patient.
Notes: a Includes with or without home care.b Includes nursing home or long-term care facility.
Source: Continuing Care Reporting System, CIHI.
55
Discharged homea
Discharged to residential careb
Admitted to acute care hospital
Died
Patients With MS Aged 19 and Older
(%)
28
17
34
20
All CCC Patients Aged 19 and Older
(%)
29
25
17
28
Multiple Sclerosis
81
References
1 T. J. Murray, “Diagnosis and Treatment of Multiple Sclerosis,” British Medical Journal332 (2006): pp. 525–527.
2 S. Ringold, C. Lynm and R. M. Glass, “Multiple Sclerosis,” Journal of the AmericanMedical Association 293 (2005): p. 514.
3 Multiple Sclerosis Society of Canada, Estimated Number of Canadians With MultipleSclerosis Re-examined (Toronto: Multiple Sclerosis Society of Canada, 2005), [online],cited May 10, 2006, from <http://www.mssociety.ca/en/releases/NR_May06.htm>.
4 Multiple Sclerosis Society of Canada, Treatments (Toronto: Multiple Sclerosis Societyof Canada, 2005), [online], cited May 10, 2006, from <http://www.mssociety.ca/en/treatments/default.htm>.
Highlights
• Parkinson’s disease accounted for $201.9 millionin direct costs and $245 million in indirect costs inCanada in 2000–2001.
• The number of visits to EDs in Ontario by patients withParkinson’s disease increased 10.5% between 2002–2003and 2005–2006.
• Almost 40% of patients with Parkinson’s disease visitingEDs in Ontario in 2005–2006 were admitted to acute care hospitals.
• The number of acute care hospitalizations across Canadafor patients with Parkinson’s disease decreased 10.6%from 2000–2001 to 2004–2005.
Parkinson’s Disease
What Is Parkinson’s Disease?Parkinson’s disease (PD) is a slowly progressing neuro-
degenerative disease that affects muscle movement and
control, leading to severe limitations in daily activity and
quality of life.1 PD results from the loss of nerve cells in the part
of the brain called the substantia nigra.2 These nerve cells supply
the neurotransmitter dopamine, which acts as a messenger
between the cells of the brain that control the body’s movements.2
According to the Parkinson Society Canada, nearly 100,000 Canadians havePD, and it affects 1% of the population over age 65 and 2% of those aged 70 and older.2,3 Because it is more common among the elderly, the numbers of new cases of PD are expected to rise as the population ages.2
Signs and Symptoms Symptoms and signs of PD often appear around the age of 60, but canoccasionally present in much younger people.3 Symptoms tend to fluctuateand intensify over time.2 Individuals often experience significant disability10 to 15 years after they have been diagnosed with PD.2
Common indications of PD include tremors on one side of the body whenat rest, bradykinesia (slow movements) and stiff or rigid muscles.2 Two ofthese must be present to make the diagnosis.2 In addition, a person with PDmay experience depression and anxiety, handwriting difficulties, diminishedvoice volume, fatigue and sleep disorders, numbness and pain.2 Typically, thesymptoms and signs move from one to both sides of the body with a decreasein mobility, leading to reliance on others for activities of daily living.2
Diagnosis and TreatmentsPD is diagnosed through clinical assessment based on a medical history and acomplete neurological examination.2 There are no blood or diagnostic imagingtests that can definitively diagnose PD at this time.2
Parkinson’s Disease
8383
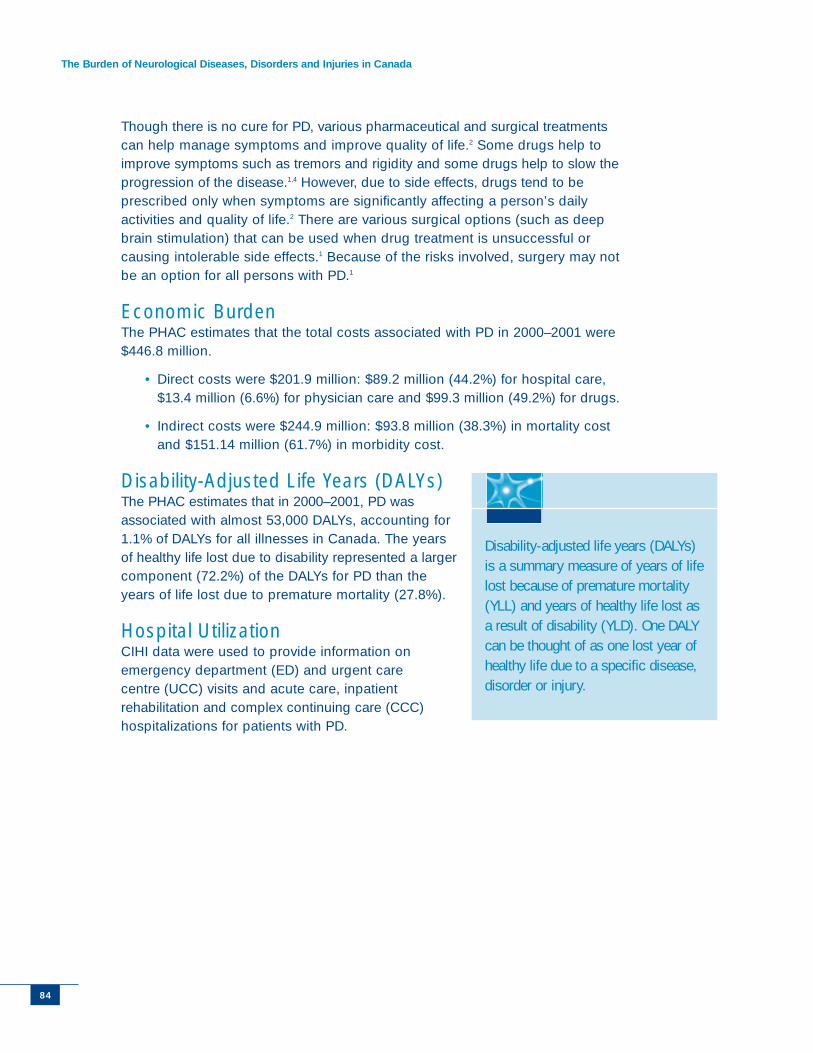
The Burden of Neurological Diseases, Disorders and Injuries in Canada
84
Though there is no cure for PD, various pharmaceutical and surgical treatmentscan help manage symptoms and improve quality of life.2 Some drugs help toimprove symptoms such as tremors and rigidity and some drugs help to slow theprogression of the disease.1,4 However, due to side effects, drugs tend to beprescribed only when symptoms are significantly affecting a person’s dailyactivities and quality of life.2 There are various surgical options (such as deepbrain stimulation) that can be used when drug treatment is unsuccessful orcausing intolerable side effects.1 Because of the risks involved, surgery may notbe an option for all persons with PD.1
Economic Burden The PHAC estimates that the total costs associated with PD in 2000–2001 were$446.8 million.
• Direct costs were $201.9 million: $89.2 million (44.2%) for hospital care,$13.4 million (6.6%) for physician care and $99.3 million (49.2%) for drugs.
• Indirect costs were $244.9 million: $93.8 million (38.3%) in mortality costand $151.14 million (61.7%) in morbidity cost.
Disability-Adjusted Life Years (DALYs)The PHAC estimates that in 2000–2001, PD wasassociated with almost 53,000 DALYs, accounting for1.1% of DALYs for all illnesses in Canada. The yearsof healthy life lost due to disability represented a largercomponent (72.2%) of the DALYs for PD than theyears of life lost due to premature mortality (27.8%).
Hospital UtilizationCIHI data were used to provide information onemergency department (ED) and urgent carecentre (UCC) visits and acute care, inpatientrehabilitation and complex continuing care (CCC)hospitalizations for patients with PD.
Disability-adjusted life years (DALYs)is a summary measure of years of lifelost because of premature mortality(YLL) and years of healthy life lost asa result of disability (YLD). One DALYcan be thought of as one lost year ofhealthy life due to a specific disease,disorder or injury.
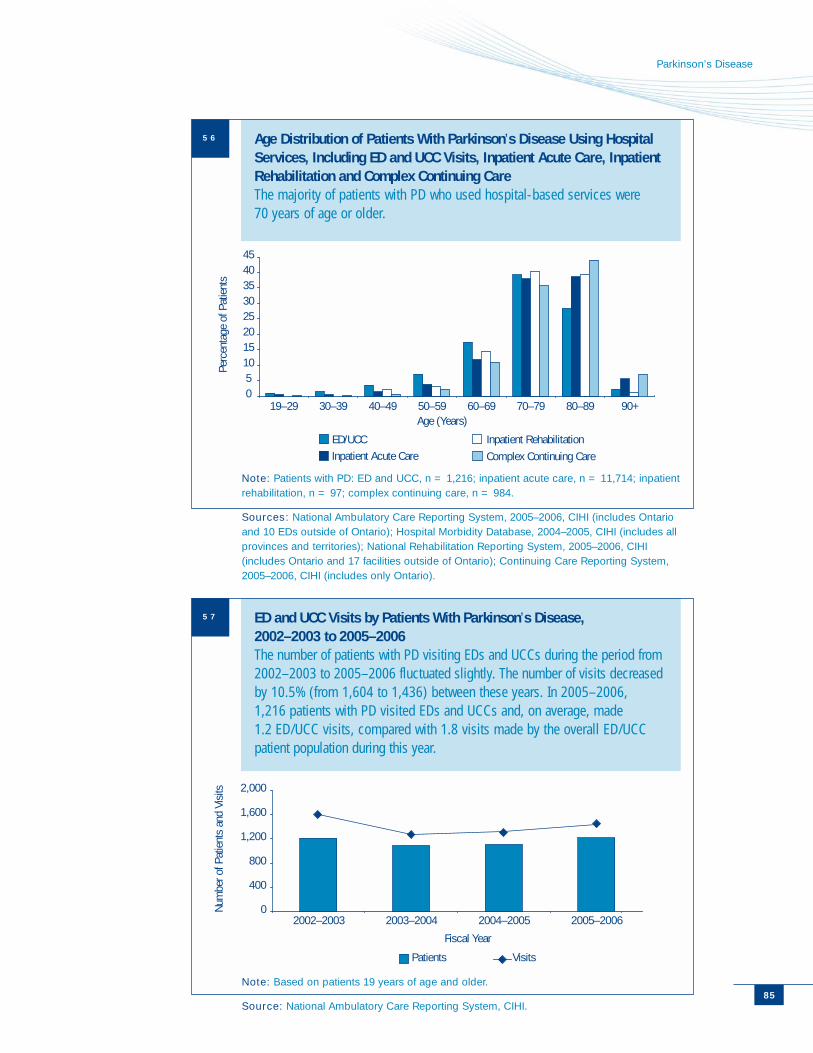
85
Parkinson’s Disease
051015202530354045
19–29 30–39 40–49 50–59 60–69 70–79 80–89 90+Age (Years)
Perc
enta
ge o
f Pat
ient
s
ED/UCCInpatient Acute Care
Inpatient RehabilitationComplex Continuing Care
Age Distribution of Patients With Parkinson’s Disease Using HospitalServices, Including ED and UCC Visits, Inpatient Acute Care, InpatientRehabilitation and Complex Continuing Care The majority of patients with PD who used hospital-based services were70 years of age or older.
Note: Patients with PD: ED and UCC, n = 1,216; inpatient acute care, n = 11,714; inpatientrehabilitation, n = 97; complex continuing care, n = 984.
Sources: National Ambulatory Care Reporting System, 2005–2006, CIHI (includes Ontarioand 10 EDs outside of Ontario); Hospital Morbidity Database, 2004–2005, CIHI (includes allprovinces and territories); National Rehabilitation Reporting System, 2005–2006, CIHI(includes Ontario and 17 facilities outside of Ontario); Continuing Care Reporting System,2005–2006, CIHI (includes only Ontario).
56
0
400
800
1,200
1,600
2,000
2002–2003 2003–2004 2004–2005 2005–2006
Fiscal Year
Num
ber o
f Pat
ient
s an
d Vi
sits
Patients Visits
ED and UCC Visits by Patients With Parkinson’s Disease, 2002–2003 to 2005–2006The number of patients with PD visiting EDs and UCCs during the period from2002–2003 to 2005–2006 fluctuated slightly. The number of visits decreasedby 10.5% (from 1,604 to 1,436) between these years. In 2005–2006,1,216 patients with PD visited EDs and UCCs and, on average, made1.2 ED/UCC visits, compared with 1.8 visits made by the overall ED/UCCpatient population during this year.
Note: Based on patients 19 years of age and older.
Source: National Ambulatory Care Reporting System, CIHI.
57
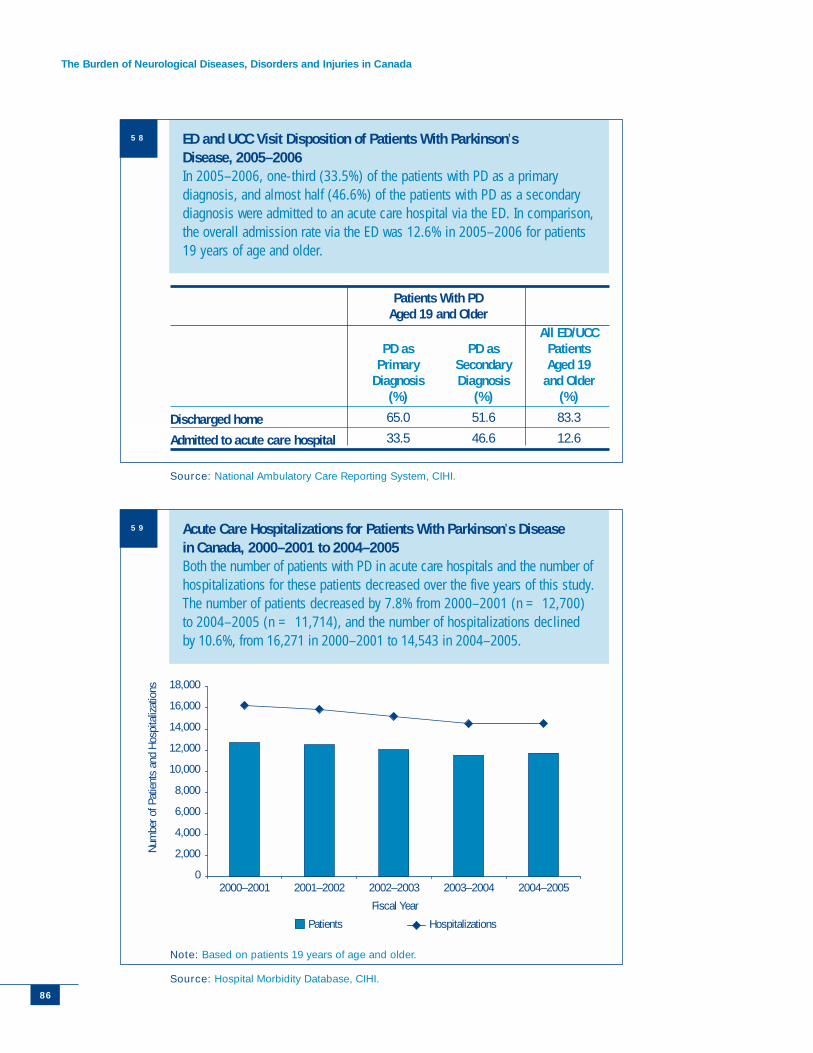
The Burden of Neurological Diseases, Disorders and Injuries in Canada
86
ED and UCC Visit Disposition of Patients With Parkinson’sDisease, 2005–2006In 2005–2006, one-third (33.5%) of the patients with PD as a primarydiagnosis, and almost half (46.6%) of the patients with PD as a secondarydiagnosis were admitted to an acute care hospital via the ED. In comparison,the overall admission rate via the ED was 12.6% in 2005–2006 for patients19 years of age and older.
Source: National Ambulatory Care Reporting System, CIHI.
58
0
2,000
4,000
6,000
8,000
10,000
12,000
14,000
16,000
18,000
2000–2001 2001–2002 2002–2003 2003–2004 2004–2005
Fiscal Year
Num
ber o
f Pat
ient
s an
d Ho
spita
lizat
ions
Patients Hospitalizations
Acute Care Hospitalizations for Patients With Parkinson’s Diseasein Canada, 2000–2001 to 2004–2005Both the number of patients with PD in acute care hospitals and the number ofhospitalizations for these patients decreased over the five years of this study.The number of patients decreased by 7.8% from 2000–2001 (n = 12,700)to 2004–2005 (n = 11,714), and the number of hospitalizations declinedby 10.6%, from 16,271 in 2000–2001 to 14,543 in 2004–2005.
Note: Based on patients 19 years of age and older.
Source: Hospital Morbidity Database, CIHI.
59
Patients With PD Aged 19 and Older
Discharged home
Admitted to acute care hospital
PD as Primary
Diagnosis(%)
65.0
33.5
PD asSecondaryDiagnosis
(%)
51.6
46.6
All ED/UCCPatients Aged 19
and Older(%)
83.3
12.6
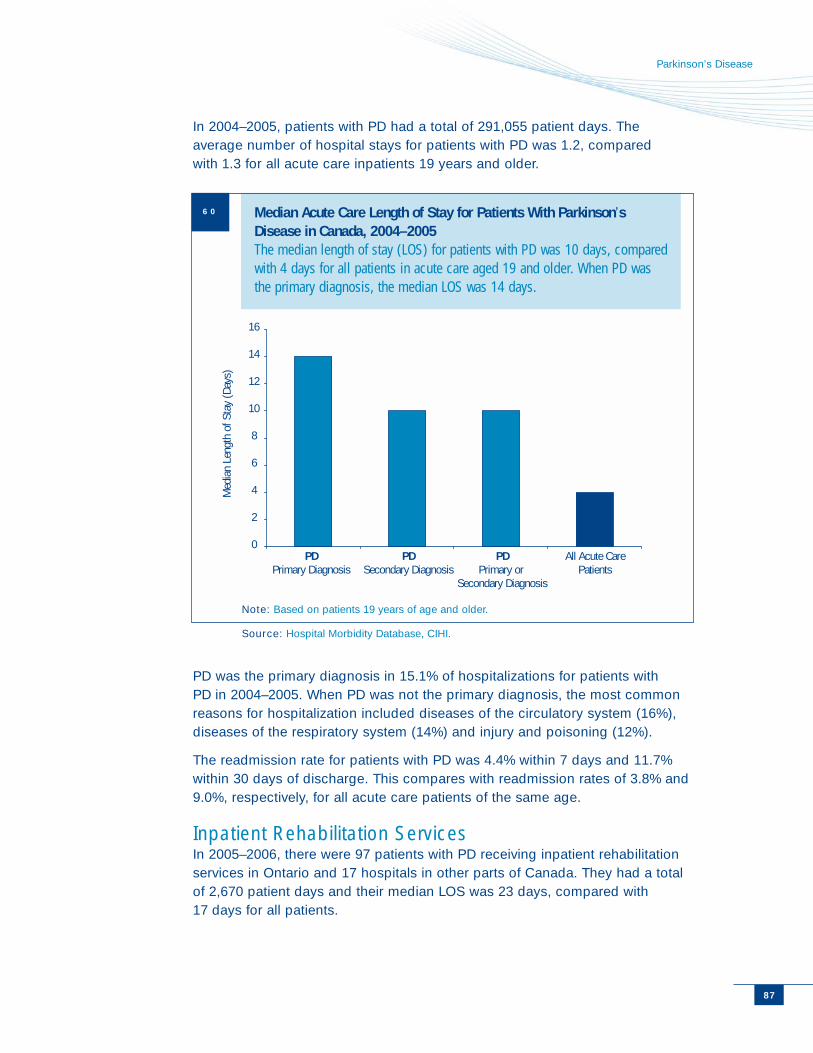
Parkinson’s Disease
In 2004–2005, patients with PD had a total of 291,055 patient days. Theaverage number of hospital stays for patients with PD was 1.2, comparedwith 1.3 for all acute care inpatients 19 years and older.
PD was the primary diagnosis in 15.1% of hospitalizations for patients withPD in 2004–2005. When PD was not the primary diagnosis, the most commonreasons for hospitalization included diseases of the circulatory system (16%),diseases of the respiratory system (14%) and injury and poisoning (12%).
The readmission rate for patients with PD was 4.4% within 7 days and 11.7%within 30 days of discharge. This compares with readmission rates of 3.8% and9.0%, respectively, for all acute care patients of the same age.
Inpatient Rehabilitation ServicesIn 2005–2006, there were 97 patients with PD receiving inpatient rehabilitationservices in Ontario and 17 hospitals in other parts of Canada. They had a totalof 2,670 patient days and their median LOS was 23 days, compared with17 days for all patients.
87
0
2
4
6
8
10
12
14
16
PDPrimary Diagnosis
PDSecondary Diagnosis
PDPrimary or
Secondary Diagnosis
All Acute CarePatients
Med
ian
Leng
th o
f Sta
y (D
ays)
Median Acute Care Length of Stay for Patients With Parkinson’sDisease in Canada, 2004–2005The median length of stay (LOS) for patients with PD was 10 days, comparedwith 4 days for all patients in acute care aged 19 and older. When PD wasthe primary diagnosis, the median LOS was 14 days.
Note: Based on patients 19 years of age and older.
Source: Hospital Morbidity Database, CIHI.
60
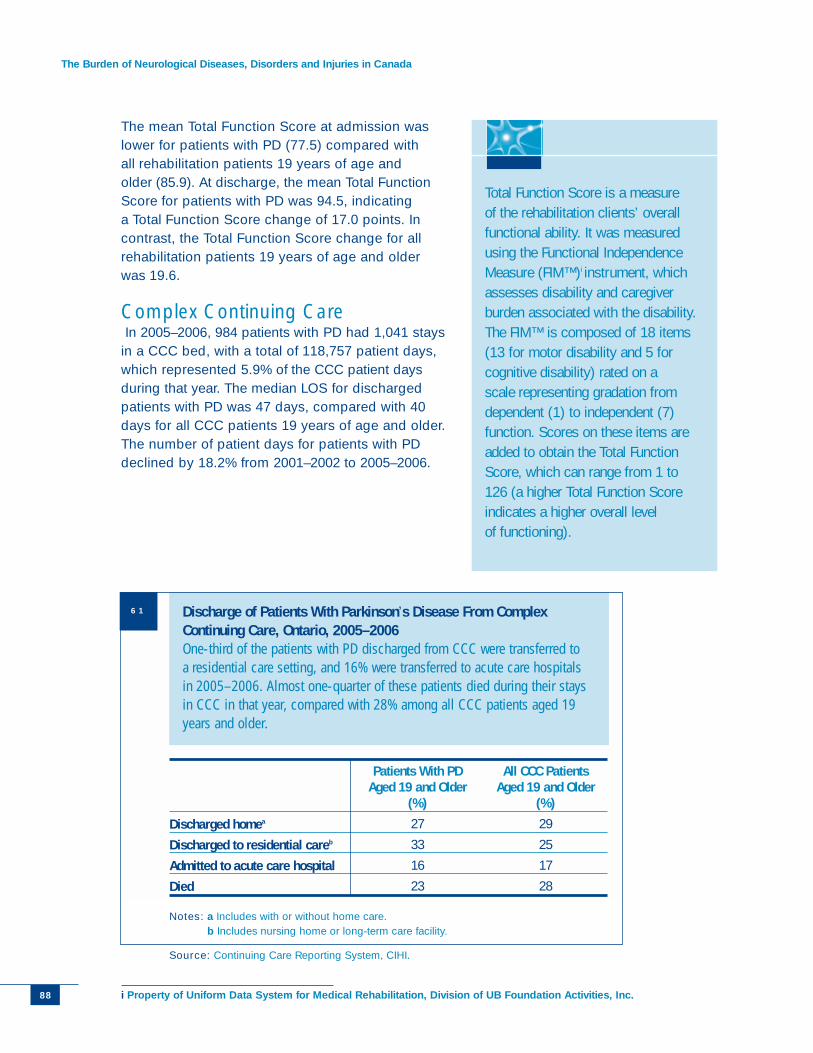
The Burden of Neurological Diseases, Disorders and Injuries in Canada
The mean Total Function Score at admission waslower for patients with PD (77.5) compared withall rehabilitation patients 19 years of age andolder (85.9). At discharge, the mean Total FunctionScore for patients with PD was 94.5, indicatinga Total Function Score change of 17.0 points. Incontrast, the Total Function Score change for allrehabilitation patients 19 years of age and olderwas 19.6.
Complex Continuing CareIn 2005–2006, 984 patients with PD had 1,041 stays
in a CCC bed, with a total of 118,757 patient days,which represented 5.9% of the CCC patient daysduring that year. The median LOS for dischargedpatients with PD was 47 days, compared with 40days for all CCC patients 19 years of age and older.The number of patient days for patients with PDdeclined by 18.2% from 2001–2002 to 2005–2006.
88
Discharge of Patients With Parkinson’s Disease From ComplexContinuing Care, Ontario, 2005–2006One-third of the patients with PD discharged from CCC were transferred toa residential care setting, and 16% were transferred to acute care hospitalsin 2005–2006. Almost one-quarter of these patients died during their staysin CCC in that year, compared with 28% among all CCC patients aged 19years and older.
Notes: a Includes with or without home care.b Includes nursing home or long-term care facility.
Source: Continuing Care Reporting System, CIHI.
61
Total Function Score is a measureof the rehabilitation clients’ overallfunctional ability. It was measuredusing the Functional IndependenceMeasure (FIM™)i instrument, whichassesses disability and caregiverburden associated with the disability.The FIM™ is composed of 18 items(13 for motor disability and 5 forcognitive disability) rated on ascale representing gradation fromdependent (1) to independent (7)function. Scores on these items areadded to obtain the Total FunctionScore, which can range from 1 to126 (a higher Total Function Scoreindicates a higher overall levelof functioning).
i Property of Uniform Data System for Medical Rehabilitation, Division of UB Foundation Activities, Inc.
Discharged homea
Discharged to residential careb
Admitted to acute care hospital
Died
Patients With PD Aged 19 and Older
(%)
27
33
16
23
All CCC Patients Aged 19 and Older
(%)
29
25
17
28
Parkinson’s Disease
References
1 J. M. Torpy, C. Lynm and R. M. Glass, “Parkinson’s Disease,” Journal of the AmericanMedical Association 291 (2004): p. 390.
2 Health Canada and Parkinson Society Canada, Parkinson’s Disease: Social andEconomic Impact, 2003 (Health Canada and Parkinson Society Canada, 2003).
3 Parkinson Society of Canada, What Is Parkinson’s Disease?: 2002 (Toronto:Parkinson Society of Canada, 2005), [online], cited May 11, 2006, from<http://www.parkinson.ca/pd/parkinson.html>.
4 J. M. Miyasaki et al., “Practice Parameter: Initiation of Treatment for Parkinson’sDisease: An Evidence-Based Review,” Neurology 58 (2002): pp. 11–17.
89
Highlights
• Hospital costs for spinal injuries accounted for $61.6 million in Canada in 2000–2001.
• Almost 50% of patients with spinal injuries visitingEDs in Ontario in 2005–2006 were admitted to acute care hospitals.
• The number of acute care hospitalizations acrossCanada for patients with spinal injuries increased8.7% from 2000–2001 to 2004–2005.
Spinal Injuries
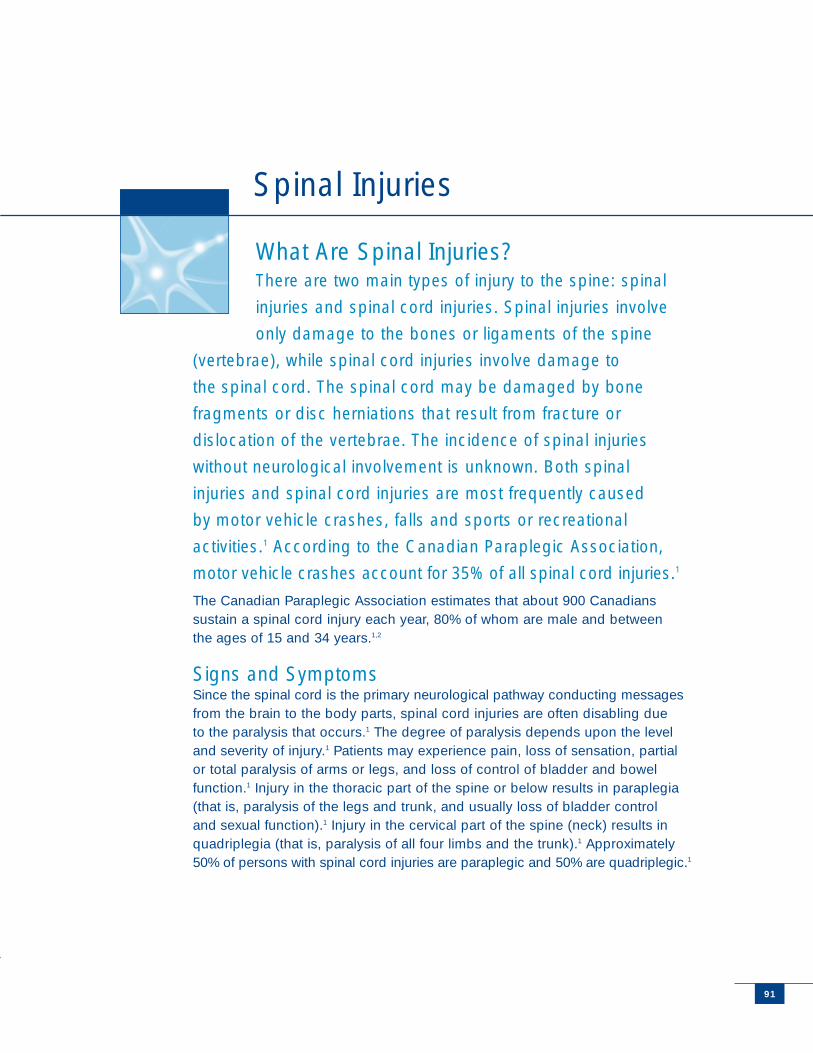
What Are Spinal Injuries?There are two main types of injury to the spine: spinal
injuries and spinal cord injuries. Spinal injuries involve
only damage to the bones or ligaments of the spine
(vertebrae), while spinal cord injuries involve damage to
the spinal cord. The spinal cord may be damaged by bone
fragments or disc herniations that result from fracture or
dislocation of the vertebrae. The incidence of spinal injuries
without neurological involvement is unknown. Both spinal
injuries and spinal cord injuries are most frequently caused
by motor vehicle crashes, falls and sports or recreational
activities.1 According to the Canadian Paraplegic Association,
motor vehicle crashes account for 35% of all spinal cord injuries.1
The Canadian Paraplegic Association estimates that about 900 Canadianssustain a spinal cord injury each year, 80% of whom are male and betweenthe ages of 15 and 34 years.1,2
Signs and Symptoms Since the spinal cord is the primary neurological pathway conducting messagesfrom the brain to the body parts, spinal cord injuries are often disabling dueto the paralysis that occurs.1 The degree of paralysis depends upon the leveland severity of injury.1 Patients may experience pain, loss of sensation, partialor total paralysis of arms or legs, and loss of control of bladder and bowelfunction.1 Injury in the thoracic part of the spine or below results in paraplegia(that is, paralysis of the legs and trunk, and usually loss of bladder controland sexual function).1 Injury in the cervical part of the spine (neck) results inquadriplegia (that is, paralysis of all four limbs and the trunk).1 Approximately50% of persons with spinal cord injuries are paraplegic and 50% are quadriplegic.1
Spinal Injuries
9191
The Burden of Neurological Diseases, Disorders and Injuries in Canada
92
Diagnosis and TreatmentsSpinal injuries are diagnosed by a neurological examination that measuresmotor and sensory functions and by X-ray and digital imaging—computedtomography (CT) and magnetic resonance imaging (MRI).3
Although there is no cure for spinal cord injuries, early treatment can reducethe severity of injury and improve prospects of recovery.3 After resuscitation,the initial treatment involves bracing and/or surgery directed toward preventingfurther injury of the spinal cord, and pain management. Surgery may be requiredto relieve compression of the spinal cord and to stabilize the spine.3 Steroidmedication may be administered to reduce swelling and optimize neurologicalfunction. Once the patient and the spine are stable, intensive rehabilitation(including physical and occupational therapy) is initiated. Counselling andsupport groups are also helpful for patients and families in coping with limitationsin daily activities and diminished quality of life.
Economic Burden The PHAC estimates that in 2000–2001 the hospital costs associated withspinal injuries were $61.6 million. Direct hospital costs were the only categoryof cost estimates available for spinal injury.
Hospital UtilizationCIHI data were used to provide information on emergency department (ED)and urgent care centre (UCC) visits, acute care hospitalizations and inpatientrehabilitation services for patients with spinal injuries.
In 2005–2006, 48.4% of patients with spinal injuries visiting EDs were male, andmales represented 56.1% of patients with spinal injuries hospitalized in acutecare. Almost three-fifths (58.4%) of male patients with spinal injuries visitingEDs and UCCs were in the 19-to-59 age group, while female patients withspinal injuries visiting EDs and UCCs were predominantly in the 60-and-overage group (63.3%).
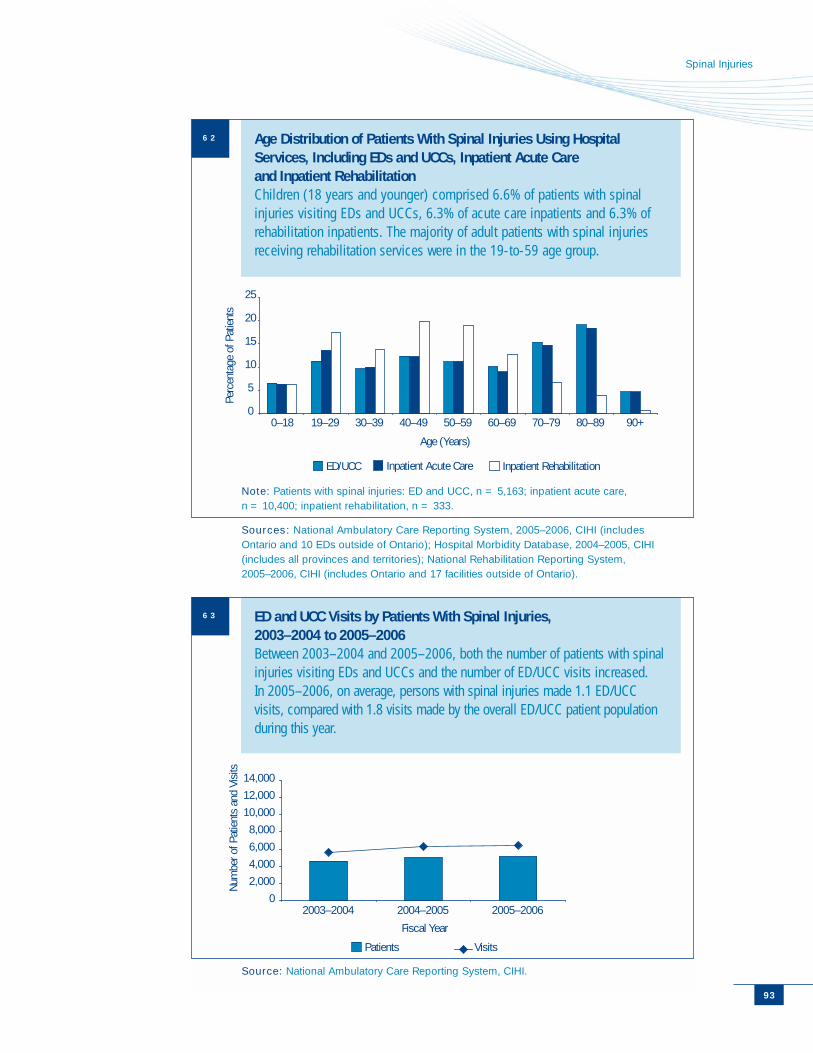
93
Spinal Injuries
0
5
10
15
20
25
0–18 19–29 30–39 40–49 50–59 60–69 70–79 80–89 90+
Age (Years)
Perc
enta
ge o
f Pat
ient
s
ED/UCC Inpatient Acute Care Inpatient Rehabilitation
Age Distribution of Patients With Spinal Injuries Using HospitalServices, Including EDs and UCCs, Inpatient Acute Care and Inpatient RehabilitationChildren (18 years and younger) comprised 6.6% of patients with spinalinjuries visiting EDs and UCCs, 6.3% of acute care inpatients and 6.3% ofrehabilitation inpatients. The majority of adult patients with spinal injuriesreceiving rehabilitation services were in the 19-to-59 age group.
Note: Patients with spinal injuries: ED and UCC, n = 5,163; inpatient acute care,n = 10,400; inpatient rehabilitation, n = 333.
Sources: National Ambulatory Care Reporting System, 2005–2006, CIHI (includesOntario and 10 EDs outside of Ontario); Hospital Morbidity Database, 2004–2005, CIHI(includes all provinces and territories); National Rehabilitation Reporting System,2005–2006, CIHI (includes Ontario and 17 facilities outside of Ontario).
62
0
2,000
4,000
6,000
8,000
10,000
12,000
14,000
2003–2004 2004–2005 2005–2006
Fiscal Year
Num
ber o
f Pat
ient
s an
d Vi
sits
Patients Visits
ED and UCC Visits by Patients With Spinal Injuries, 2003–2004 to 2005–2006Between 2003–2004 and 2005–2006, both the number of patients with spinalinjuries visiting EDs and UCCs and the number of ED/UCC visits increased. In 2005–2006, on average, persons with spinal injuries made 1.1 ED/UCCvisits, compared with 1.8 visits made by the overall ED/UCC patient populationduring this year.
Source: National Ambulatory Care Reporting System, CIHI.
63
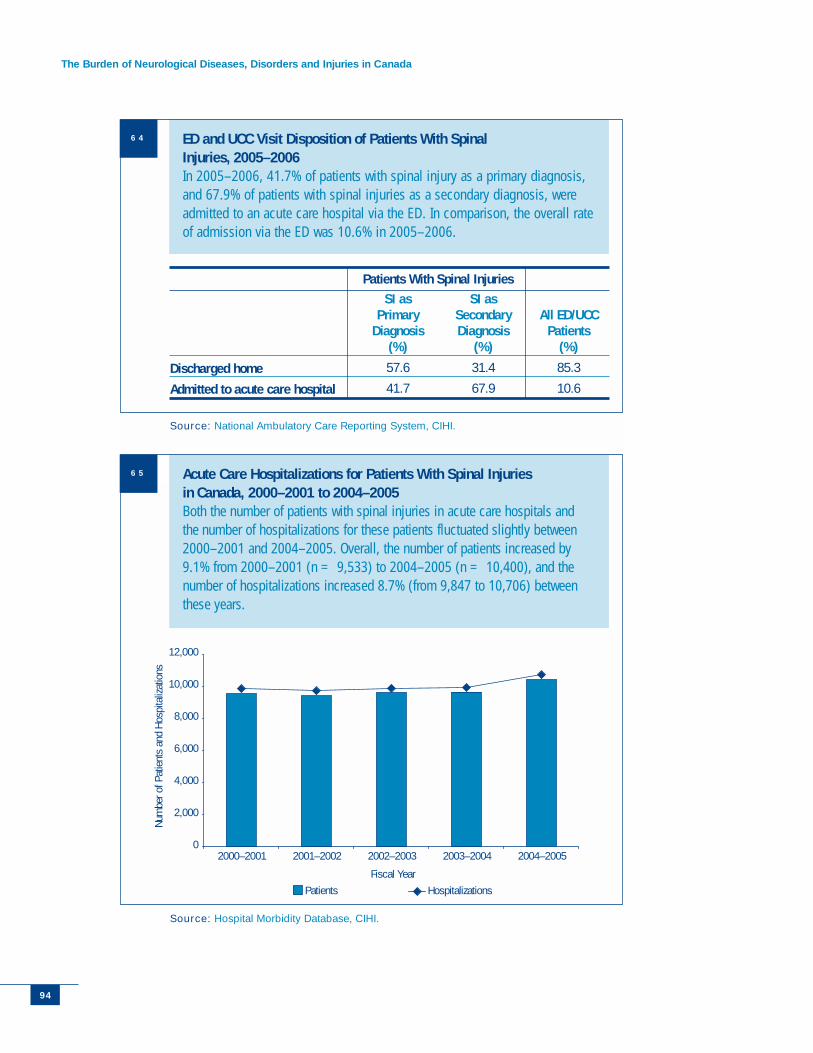
The Burden of Neurological Diseases, Disorders and Injuries in Canada
94
ED and UCC Visit Disposition of Patients With SpinalInjuries, 2005–2006In 2005–2006, 41.7% of patients with spinal injury as a primary diagnosis,and 67.9% of patients with spinal injuries as a secondary diagnosis, wereadmitted to an acute care hospital via the ED. In comparison, the overall rateof admission via the ED was 10.6% in 2005–2006.
Source: National Ambulatory Care Reporting System, CIHI.
64
0
2,000
4,000
6,000
8,000
10,000
12,000
2000–2001 2001–2002 2002–2003 2003–2004 2004–2005
Fiscal Year
Num
ber o
f Pat
ient
s an
d Ho
spita
lizat
ions
Patients Hospitalizations
Acute Care Hospitalizations for Patients With Spinal Injuriesin Canada, 2000–2001 to 2004–2005Both the number of patients with spinal injuries in acute care hospitals andthe number of hospitalizations for these patients fluctuated slightly between2000–2001 and 2004–2005. Overall, the number of patients increased by9.1% from 2000–2001 (n = 9,533) to 2004–2005 (n = 10,400), and thenumber of hospitalizations increased 8.7% (from 9,847 to 10,706) betweenthese years.
Source: Hospital Morbidity Database, CIHI.
65
Patients With Spinal Injuries
Discharged home
Admitted to acute care hospital
SI as Primary
Diagnosis(%)
57.6
41.7
SI as SecondaryDiagnosis
(%)
31.4
67.9
All ED/UCCPatients
(%)
85.3
10.6
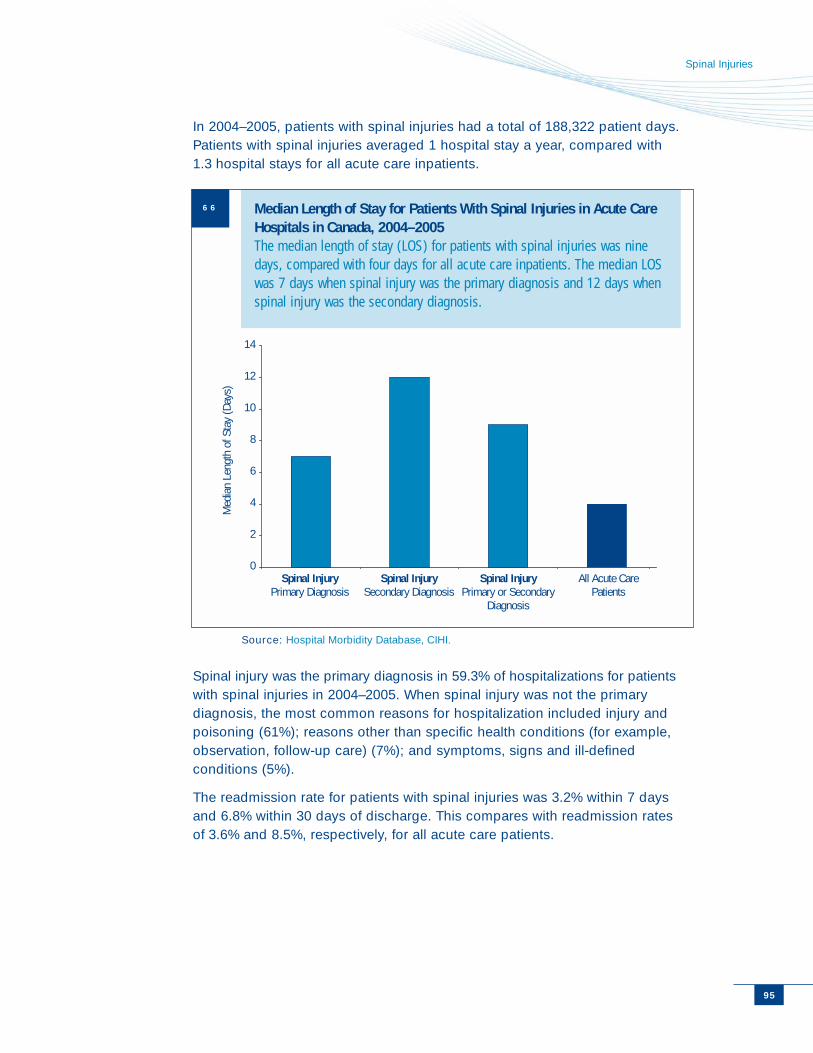
Spinal Injuries
In 2004–2005, patients with spinal injuries had a total of 188,322 patient days.Patients with spinal injuries averaged 1 hospital stay a year, compared with1.3 hospital stays for all acute care inpatients.
Spinal injury was the primary diagnosis in 59.3% of hospitalizations for patientswith spinal injuries in 2004–2005. When spinal injury was not the primarydiagnosis, the most common reasons for hospitalization included injury andpoisoning (61%); reasons other than specific health conditions (for example,observation, follow-up care) (7%); and symptoms, signs and ill-definedconditions (5%).
The readmission rate for patients with spinal injuries was 3.2% within 7 daysand 6.8% within 30 days of discharge. This compares with readmission ratesof 3.6% and 8.5%, respectively, for all acute care patients.
95
0
2
4
6
8
10
12
14
Spinal InjuryPrimary Diagnosis
Spinal InjurySecondary Diagnosis
Spinal InjuryPrimary or Secondary
Diagnosis
All Acute CarePatients
Med
ian
Leng
th o
f Sta
y (D
ays)
Median Length of Stay for Patients With Spinal Injuries in Acute CareHospitals in Canada, 2004–2005The median length of stay (LOS) for patients with spinal injuries was ninedays, compared with four days for all acute care inpatients. The median LOSwas 7 days when spinal injury was the primary diagnosis and 12 days whenspinal injury was the secondary diagnosis.
Source: Hospital Morbidity Database, CIHI.
66
The Burden of Neurological Diseases, Disorders and Injuries in Canada
Inpatient Rehabilitation ServicesIn 2005–2006, 333 patients with spinal injuries received inpatient rehabilitationservices in Ontario and 17 hospitals in other parts of Canada. They had atotal of 22,816 patient days, which represented 2.7% of patient days in inpatientrehabilitation services during that year. The active LOS for these patients was22,723 days, meaning that they had to continue their stays in rehabilitationservices for 93 days in total after being ready to be discharged. The medianLOS for patients with spinal injuries was 56 days, compared with 17 days forall patients.
The mean Total Function Score atadmission was lower for patientswith spinal injuries (70.1) comparedwith all rehabilitation patients (85.9).At discharge, the mean Total FunctionScore for patients with spinal injurieswas 93.7, indicating a Total FunctionScore change of 23.6. In contrast,the Total Function Score change forall patients was 19.6.
96
Total Function Score is a measureof the rehabilitation clients’ overallfunctional ability. It was measuredusing the Functional IndependenceMeasure (FIM™)i instrument, whichassesses disability and caregiverburden associated with the disability.The FIM™ is composed of 18 items(13 for motor disability and 5 forcognitive disability) rated on ascale representing gradation fromdependent (1) to independent (7)function. Scores on these items areadded to obtain the Total FunctionScore, which can range from 1 to126 (a higher Total Function Scoreindicates a higher overall levelof functioning).
i Property of Uniform Data System for Medical Rehabilitation, Division of UB Foundation Activities, Inc.
Spinal Injuries
References
1 Canadian Paraplegic Association, Spinal Cord Injury (Ottawa: CanadianParaplegic Association, 2000), [online], cited October 31, 2005, from<http://www.canparaplegic.org/national/level2.tpl?var1 = story&var2 = 8.00>.
2 Canadian Paraplegic Association, Spinal Cord Injury (Ottawa: Canadian ParaplegicAssociation, 2000), [online], cited October 31, 2005, from <http://canparaplegic.org/national/level2.tpl?var1 = story&var2 = 20001027122552>.
3 S. DeCorwin et al., Life After a Spinal Cord Injury (Montréal: Association des paraplé-giques du Québec, 2002), p. 15.
97
Highlights
• Stroke accounted for $665 million in direct costs and$2.1 billion in indirect costs in Canada in 2000–2001.
• Stroke accounted for 4.7% of the DALYs for all illnessesin Canada in 2000–2001.
• The number of visits to EDs in Ontario by patients withstroke decreased 7.2% from 2002–2003 to 2005–2006.
• More than 80% of patients with stroke visiting EDs in Ontario in 2005–2006 were admitted to acute care hospitals.
• The number of acute care hospitalizations in Canadafor patients with stroke decreased 6.2% from 2000–2001to 2004–2005.
• Just over 5% of patient days in Canadian acute carehospitals in 2004–2005 included patients with stroke as a primary or secondary diagnosis.
• 23% of inpatient rehabilitation days in Ontario and 17 hospitals elsewhere in Canada in 2005–2006 includedpatients with stroke.
• Among the five conditions in the report, the largestproportion of CCC patient days in 2005–2006 wasassociated with patients discharged with stroke (32.9%).
Stroke
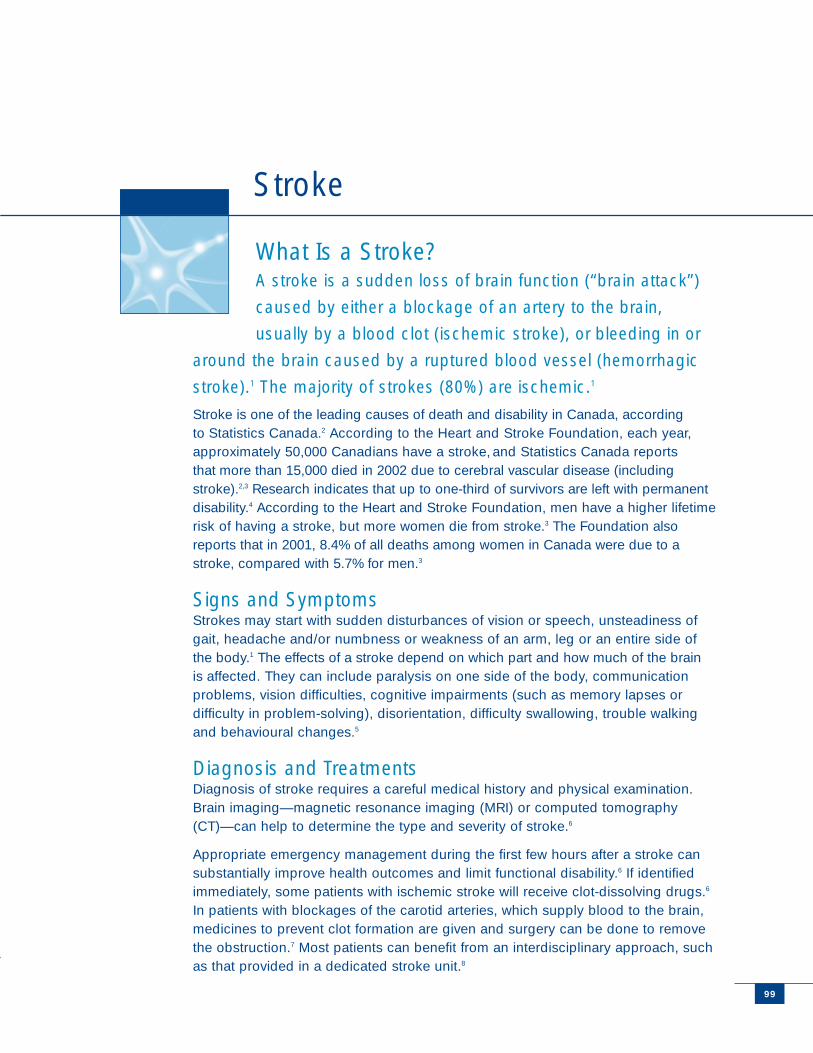
What Is a Stroke?A stroke is a sudden loss of brain function (“brain attack”)
caused by either a blockage of an artery to the brain,
usually by a blood clot (ischemic stroke), or bleeding in or
around the brain caused by a ruptured blood vessel (hemorrhagic
stroke).1 The majority of strokes (80%) are ischemic.1
Stroke is one of the leading causes of death and disability in Canada, accordingto Statistics Canada.2 According to the Heart and Stroke Foundation, each year,approximately 50,000 Canadians have a stroke, and Statistics Canada reportsthat more than 15,000 died in 2002 due to cerebral vascular disease (includingstroke).2,3 Research indicates that up to one-third of survivors are left with permanentdisability.4 According to the Heart and Stroke Foundation, men have a higher lifetimerisk of having a stroke, but more women die from stroke.3 The Foundation alsoreports that in 2001, 8.4% of all deaths among women in Canada were due to astroke, compared with 5.7% for men.3
Signs and SymptomsStrokes may start with sudden disturbances of vision or speech, unsteadiness ofgait, headache and/or numbness or weakness of an arm, leg or an entire side ofthe body.1 The effects of a stroke depend on which part and how much of the brainis affected. They can include paralysis on one side of the body, communicationproblems, vision difficulties, cognitive impairments (such as memory lapses ordifficulty in problem-solving), disorientation, difficulty swallowing, trouble walkingand behavioural changes.5
Diagnosis and TreatmentsDiagnosis of stroke requires a careful medical history and physical examination.Brain imaging—magnetic resonance imaging (MRI) or computed tomography(CT)—can help to determine the type and severity of stroke.6
Appropriate emergency management during the first few hours after a stroke cansubstantially improve health outcomes and limit functional disability.6 If identifiedimmediately, some patients with ischemic stroke will receive clot-dissolving drugs.6
In patients with blockages of the carotid arteries, which supply blood to the brain,medicines to prevent clot formation are given and surgery can be done to removethe obstruction.7 Most patients can benefit from an interdisciplinary approach, suchas that provided in a dedicated stroke unit.8
Stroke
9999
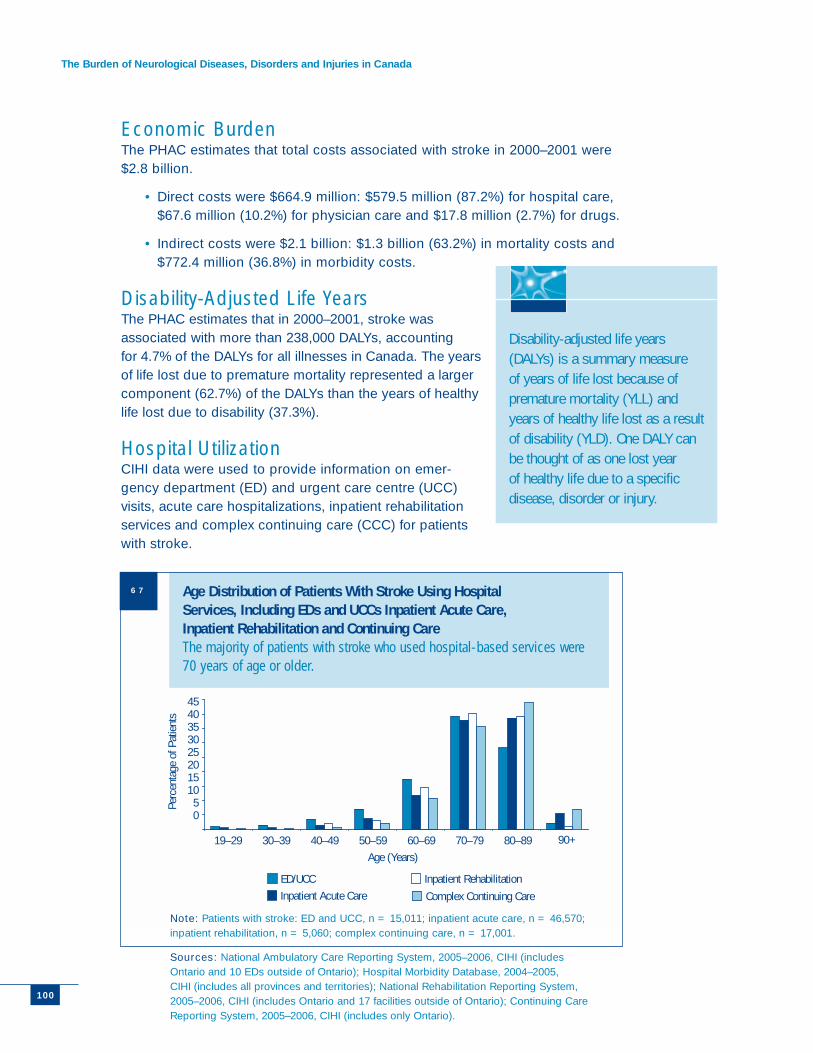
The Burden of Neurological Diseases, Disorders and Injuries in Canada
100
Economic Burden The PHAC estimates that total costs associated with stroke in 2000–2001 were$2.8 billion.
• Direct costs were $664.9 million: $579.5 million (87.2%) for hospital care,$67.6 million (10.2%) for physician care and $17.8 million (2.7%) for drugs.
• Indirect costs were $2.1 billion: $1.3 billion (63.2%) in mortality costs and$772.4 million (36.8%) in morbidity costs.
Disability-Adjusted Life YearsThe PHAC estimates that in 2000–2001, stroke was associated with more than 238,000 DALYs, accountingfor 4.7% of the DALYs for all illnesses in Canada. The yearsof life lost due to premature mortality represented a largercomponent (62.7%) of the DALYs than the years of healthylife lost due to disability (37.3%).
Hospital UtilizationCIHI data were used to provide information on emer-gency department (ED) and urgent care centre (UCC)visits, acute care hospitalizations, inpatient rehabilitationservices and complex continuing care (CCC) for patientswith stroke.
19–29 30–39 40–49 50–59 60–69 70–79 80–89 90+
Age (Years)
Perc
enta
ge o
f Pat
ient
s
ED/UCCInpatient Acute Care
Inpatient Rehabilitation
Complex Continuing Care
4540353025201510
50
Age Distribution of Patients With Stroke Using Hospital Services, Including EDs and UCCs Inpatient Acute Care, Inpatient Rehabilitation and Continuing Care The majority of patients with stroke who used hospital-based services were70 years of age or older.
Note: Patients with stroke: ED and UCC, n = 15,011; inpatient acute care, n = 46,570;inpatient rehabilitation, n = 5,060; complex continuing care, n = 17,001.
Sources: National Ambulatory Care Reporting System, 2005–2006, CIHI (includesOntario and 10 EDs outside of Ontario); Hospital Morbidity Database, 2004–2005,CIHI (includes all provinces and territories); National Rehabilitation Reporting System,2005–2006, CIHI (includes Ontario and 17 facilities outside of Ontario); Continuing CareReporting System, 2005–2006, CIHI (includes only Ontario).
Disability-adjusted life years(DALYs) is a summary measureof years of life lost because ofpremature mortality (YLL) andyears of healthy life lost as a resultof disability (YLD). One DALY canbe thought of as one lost yearof healthy life due to a specificdisease, disorder or injury.
67
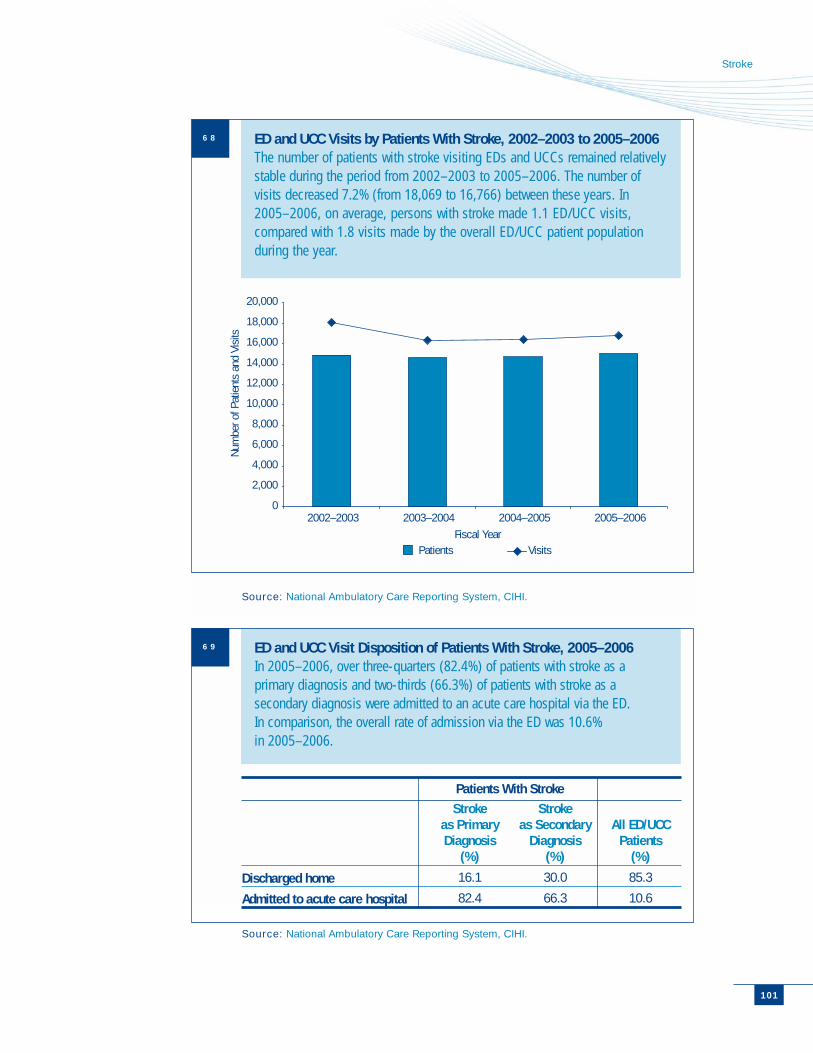
101
Stroke
0
2,000
4,000
6,000
8,000
10,000
12,000
14,000
16,000
18,000
20,000
2002–2003 2003–2004 2004–2005 2005–2006Fiscal Year
Num
ber o
f Pat
ient
s an
d Vi
sits
Patients Visits
ED and UCC Visits by Patients With Stroke, 2002–2003 to 2005–2006The number of patients with stroke visiting EDs and UCCs remained relativelystable during the period from 2002–2003 to 2005–2006. The number ofvisits decreased 7.2% (from 18,069 to 16,766) between these years. In2005–2006, on average, persons with stroke made 1.1 ED/UCC visits,compared with 1.8 visits made by the overall ED/UCC patient populationduring the year.
Source: National Ambulatory Care Reporting System, CIHI.
68
ED and UCC Visit Disposition of Patients With Stroke, 2005–2006In 2005–2006, over three-quarters (82.4%) of patients with stroke as aprimary diagnosis and two-thirds (66.3%) of patients with stroke as asecondary diagnosis were admitted to an acute care hospital via the ED. In comparison, the overall rate of admission via the ED was 10.6% in 2005–2006.
Source: National Ambulatory Care Reporting System, CIHI.
69
Patients With Stroke
Discharged home
Admitted to acute care hospital
Strokeas Primary Diagnosis
(%)
16.1
82.4
Strokeas Secondary
Diagnosis(%)
30.0
66.3
All ED/UCCPatients
(%)
85.3
10.6
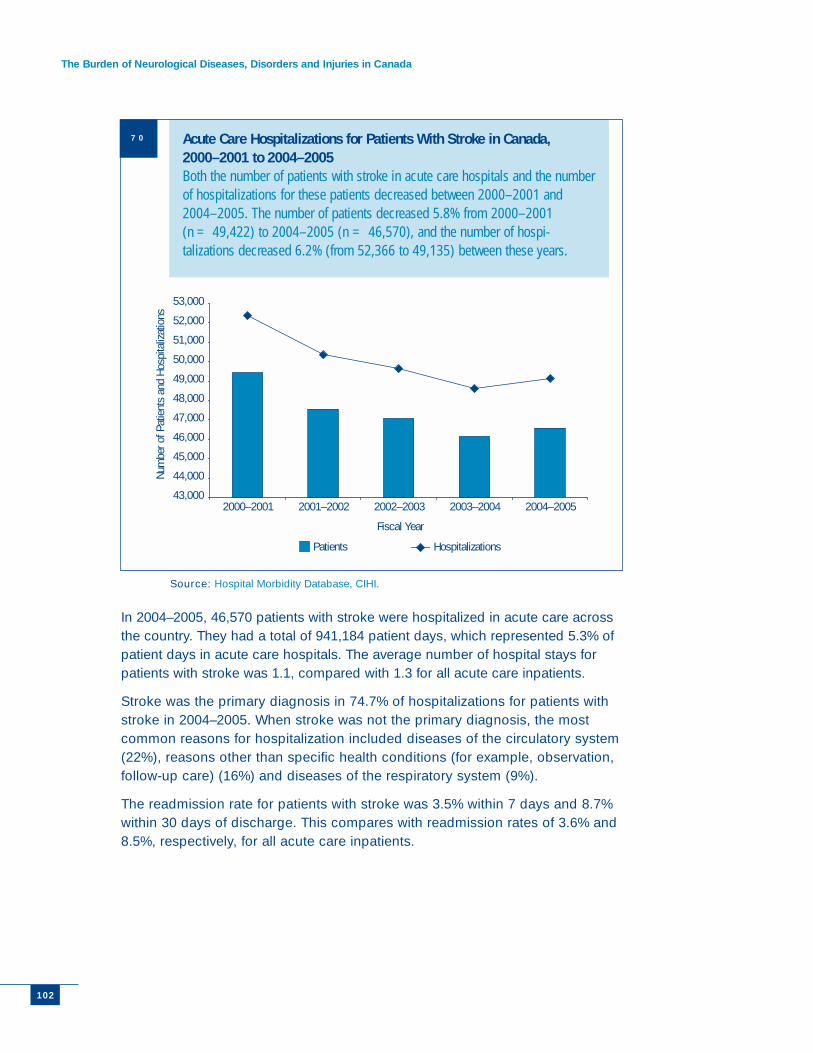
The Burden of Neurological Diseases, Disorders and Injuries in Canada
In 2004–2005, 46,570 patients with stroke were hospitalized in acute care acrossthe country. They had a total of 941,184 patient days, which represented 5.3% ofpatient days in acute care hospitals. The average number of hospital stays forpatients with stroke was 1.1, compared with 1.3 for all acute care inpatients.
Stroke was the primary diagnosis in 74.7% of hospitalizations for patients withstroke in 2004–2005. When stroke was not the primary diagnosis, the mostcommon reasons for hospitalization included diseases of the circulatory system(22%), reasons other than specific health conditions (for example, observation,follow-up care) (16%) and diseases of the respiratory system (9%).
The readmission rate for patients with stroke was 3.5% within 7 days and 8.7%within 30 days of discharge. This compares with readmission rates of 3.6% and8.5%, respectively, for all acute care inpatients.
102
43,000
44,000
45,000
46,000
47,000
48,000
49,000
50,000
51,000
52,000
53,000
2000–2001 2001–2002 2002–2003 2003–2004 2004–2005
Fiscal Year
Num
ber o
f Pat
ient
s an
d Ho
spita
lizat
ions
Patients Hospitalizations
Acute Care Hospitalizations for Patients With Stroke in Canada,2000–2001 to 2004–2005Both the number of patients with stroke in acute care hospitals and the numberof hospitalizations for these patients decreased between 2000–2001 and2004–2005. The number of patients decreased 5.8% from 2000–2001(n = 49,422) to 2004–2005 (n = 46,570), and the number of hospi-talizations decreased 6.2% (from 52,366 to 49,135) between these years.
Source: Hospital Morbidity Database, CIHI.
70
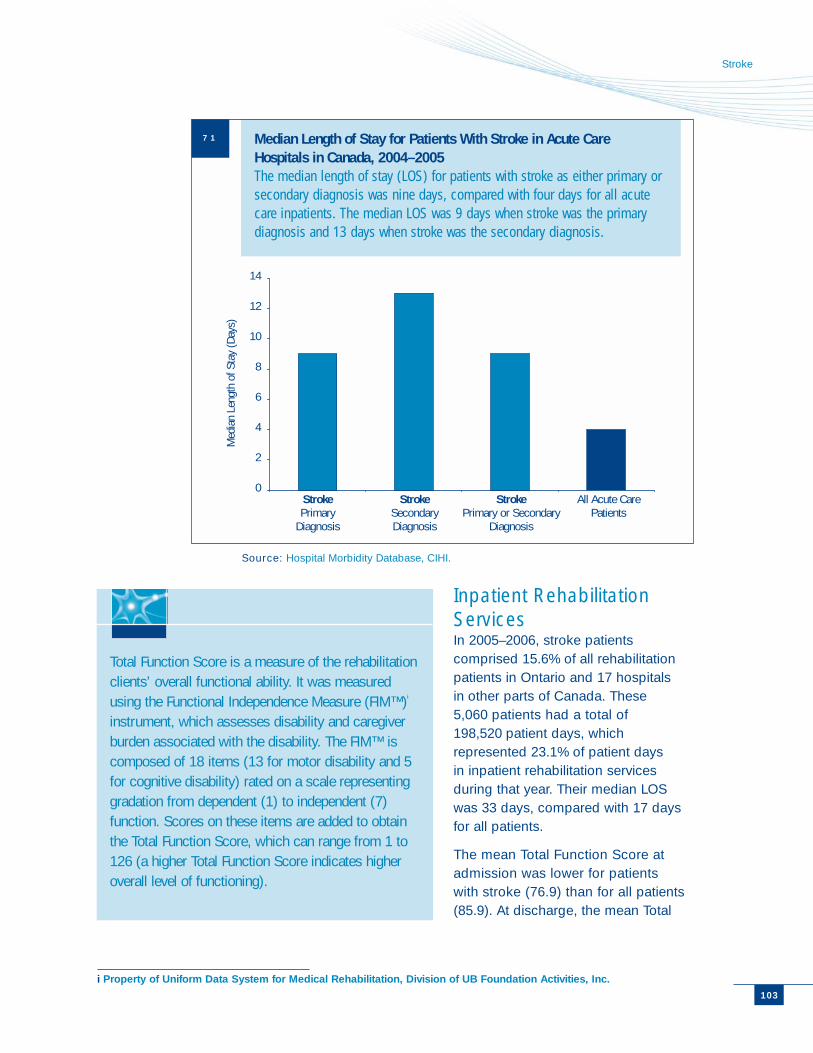
Stroke
Inpatient RehabilitationServices In 2005–2006, stroke patients comprised 15.6% of all rehabilitationpatients in Ontario and 17 hospitalsin other parts of Canada. These5,060 patients had a total of198,520 patient days, whichrepresented 23.1% of patient days in inpatient rehabilitation servicesduring that year. Their median LOSwas 33 days, compared with 17 daysfor all patients.
The mean Total Function Score atadmission was lower for patientswith stroke (76.9) than for all patients(85.9). At discharge, the mean Total
103
0
2
4
6
8
10
12
14
StrokePrimary
Diagnosis
StrokeSecondaryDiagnosis
StrokePrimary or Secondary
Diagnosis
All Acute CarePatients
Med
ian
Leng
th o
f Sta
y (D
ays)
Median Length of Stay for Patients With Stroke in Acute CareHospitals in Canada, 2004–2005The median length of stay (LOS) for patients with stroke as either primary orsecondary diagnosis was nine days, compared with four days for all acutecare inpatients. The median LOS was 9 days when stroke was the primarydiagnosis and 13 days when stroke was the secondary diagnosis.
Source: Hospital Morbidity Database, CIHI.
71
Total Function Score is a measure of the rehabilitationclients’ overall functional ability. It was measuredusing the Functional Independence Measure (FIM™)i
instrument, which assesses disability and caregiverburden associated with the disability. The FIM™ iscomposed of 18 items (13 for motor disability and 5for cognitive disability) rated on a scale representinggradation from dependent (1) to independent (7)function. Scores on these items are added to obtainthe Total Function Score, which can range from 1 to126 (a higher Total Function Score indicates higheroverall level of functioning).
i Property of Uniform Data System for Medical Rehabilitation, Division of UB Foundation Activities, Inc.
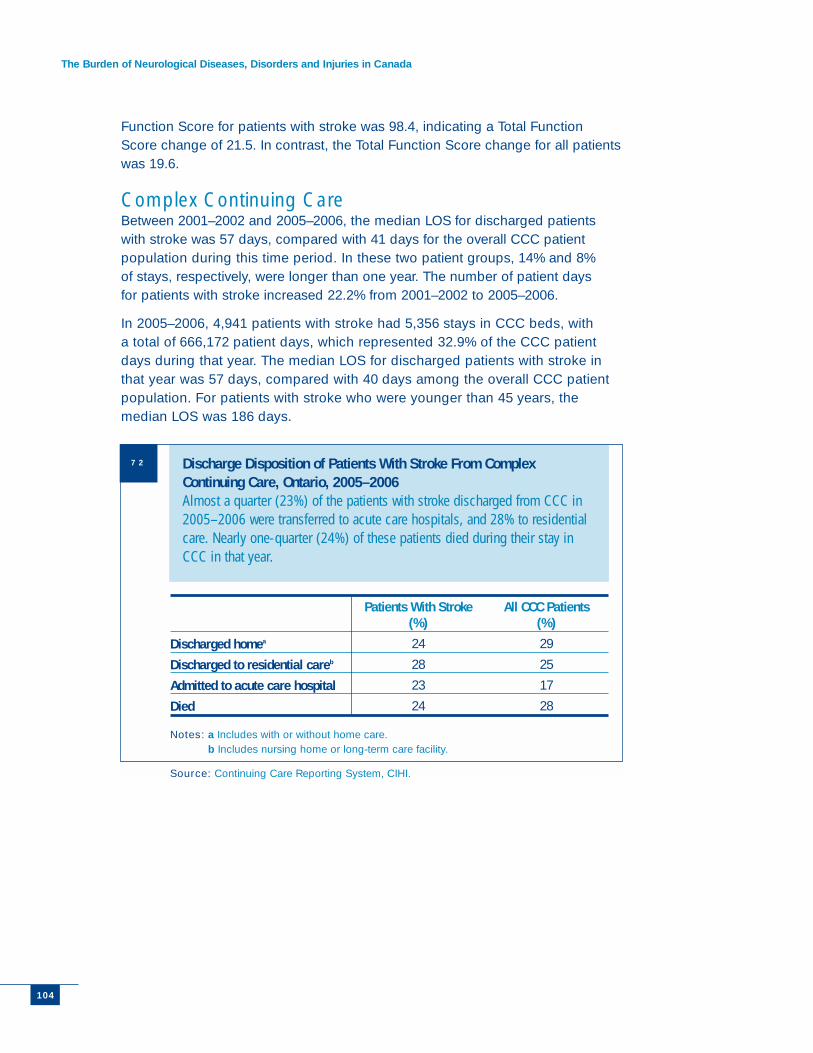
The Burden of Neurological Diseases, Disorders and Injuries in Canada
Function Score for patients with stroke was 98.4, indicating a Total FunctionScore change of 21.5. In contrast, the Total Function Score change for all patientswas 19.6.
Complex Continuing CareBetween 2001–2002 and 2005–2006, the median LOS for discharged patients with stroke was 57 days, compared with 41 days for the overall CCC patientpopulation during this time period. In these two patient groups, 14% and 8% of stays, respectively, were longer than one year. The number of patient daysfor patients with stroke increased 22.2% from 2001–2002 to 2005–2006.
In 2005–2006, 4,941 patients with stroke had 5,356 stays in CCC beds, with a total of 666,172 patient days, which represented 32.9% of the CCC patientdays during that year. The median LOS for discharged patients with stroke inthat year was 57 days, compared with 40 days among the overall CCC patientpopulation. For patients with stroke who were younger than 45 years, themedian LOS was 186 days.
104
Discharge Disposition of Patients With Stroke From ComplexContinuing Care, Ontario, 2005–2006Almost a quarter (23%) of the patients with stroke discharged from CCC in2005–2006 were transferred to acute care hospitals, and 28% to residentialcare. Nearly one-quarter (24%) of these patients died during their stay inCCC in that year.
Notes: a Includes with or without home care.b Includes nursing home or long-term care facility.
Source: Continuing Care Reporting System, CIHI.
72
Discharged homea
Discharged to residential careb
Admitted to acute care hospital
Died
Patients With Stroke (%)
24
28
23
24
All CCC Patients (%)
29
25
17
28
Stroke
105
References
1 M. Y. Hwang, R. M. Glass and J. Molter, “How Do You Know When Someone Is Havinga Stroke?,” Journal of the American Medical Association 279 (1998): p. 1324.
2 Statistics Canada, Mortality—Summary of List of Causes (Ottawa: StatisticsCanada, 2003).
3 Heart and Stroke Foundation of Canada, Stroke Statistics, (Ottawa: Heart andStroke Foundation of Canada, 2006), [online], cited March 14, 2006, from<http://ww2.heartandstroke.ca/Page.asp?PageID=33&ArticleID= 428&Src=stroke&From=SubCategory>.
4 F. O’Rourke et al., “Current and Future Concepts in Stroke Prevention,” CanadianMedical Association Journal 170 (2004): pp. 1123–1133.
5 Heart and Stroke Foundation of Canada, Effects of a Stroke (Ottawa: Heartand Stroke Foundation of Canada, 2006), [online], cited April 27, 2007, from<http://ww2.heartandstroke.ca/Page.asp?PageID=1965&Article ID=4840&Src=stroke&From=SubCategory>.
6 Canadian Stroke Network and Heart and Stroke Foundation of Canada, Canadian BestPractice Recommendations for Stroke Care (Ottawa: Canadian Stroke Network andthe Heart and Stroke Foundation, 2006).
7 Heart and Stroke Foundation of Canada, Surgery and Other Procedures (Ottawa:Heart and Stroke Foundation of Canada, 2006), [online], cited April 27, 2007, from<http://ww2.heartandstroke.ca/Page.asp?PageID=1965&ArticleID=4875&Src=stroke&From=SubCategory>.
8 Cochrane Review, “Stroke Unit Trialists’ Collaboration: Organized Inpatient (StrokeUnit) Care for Stroke,” The Cochrane Library, Issue 3 (2002), [online], cited January 8,2003, from <http://www.updatesoftware.com/>.

The previous chapters illustrate the economic costs and
health services utilization associated with 11 neurological
conditions in Canada. The main determinant in the
selection of these conditions was the availability and
comprehensiveness of data. Many other neurological conditions
cause significant disability and therefore represent a burden to
individuals, communities, society and health care in Canada. In
this chapter, 20 of these other conditions are reviewed briefly to
acknowledge their importance. However, additional data would
be required to quantify their social and economic burden, as well
as their impact on the health care system.
Attention Deficit Hyperactivity DisorderAttention deficit hyperactivity disorder (ADHD) is a condition that involvesthree related sets of symptoms that impair development, including inattention,hyperactivity and impulsiveness, and is further sub-classified based upon thesesymptoms.1 ADHD most likely results from a chemical imbalance in the brain,possibly due to a deficiency of dopamine or noradrenaline.2 For children whomeet the diagnostic criteria of ADHD, the treatment of choice is a combinationof medication, special education and psychosocial interventions, includingindividual, group and family counselling.
ADHD is the most commonly diagnosed health condition in children, affecting3% to 9% of school-aged children, and is more common in boys than in girls.2,3
ADHD affects up to 4% of adults worldwide.2
AutismAutism is defined behaviourally, with difficulties in social communication,interaction and imagination.4 Children with autism often exhibit a restricted range of interests and have commonly recognized repetitive behaviours and manner-isms.4 They are often hypersensitive or hyposensitive to the environment.4
Symptoms vary from mild peculiarities to a severe developmental disorder. The manifestations of autism also tend to change over time.4
Other Neurological Conditions
107107
The Burden of Neurological Diseases, Disorders and Injuries in Canada
108
The diagnosis of autism is based on the individual’s history, focusing ondevelopment and core behaviours, and observation of the individual indifferent settings.4 Treatment strategies usually require a multidisciplinarychild development team.4 Pharmacotherapy is used to control comorbidconditions such as obsessive-compulsive disorder, seizures or ADHD.
Recent estimates suggest that the incidence of autism is 30 to 60 cases per10,000.5 There has been an increase in the prevalence of autism over time,which may be due to improvements in diagnosis and a broadening of thedefinition of the various autism disorders.5
Bell’s PalsyBell’s palsy is the most common facial paralysis.6,7 It is an abrupt, isolatedweakness of one side of the face.6 The etiology of Bell’s palsy remainscontroversial, but the most common cause is understood to be an infection ofthe facial nerve by herpes viruses (herpes simplex or herpes zoster).6 Diagnosisof Bell’s palsy relies mainly on clinical information and examination.6 Althoughmany patients recover without treatment, the best outcomes are achieved whencortico-steroids and anti-viral medications are given within 72 hours of theonset of symptoms.6
In the United Kingdom, the incidence of Bell’s palsy is estimated at 20 casesper 100,000.6 While Bell’s palsy can occur at any age, studies have shownthat it often occurs among persons between the ages of 10 and 45.6,7 Menand women are affected equally, although pregnant women experience ahigher incidence (45 cases per 100,000).6
Complex Regional Pain SyndromeComplex regional pain syndrome (CRPS) is a chronic condition of intense painin an arm or leg that usually develops following trauma or immobilization.8 Thereare two types: CRPS type I (also called reflex sympathetic dystrophy), whichdoes not have obvious nerve lesions, and CRPS type II (causalgia), whichoccurs after a defined peripheral nerve injury.9 Like most chronic pain conditions,the best treatment is a combination of functional restoration and medications,along with a multidisciplinary approach.9 Limited information is available aboutthe epidemiology of CRPS.10
Congenital Anomalies of the Central Nervous System and SpineCongenital anomalies of the central nervous system and spine include neurologicalconditions such as neural tube defects and hydrocephalus, which developduring the growth of the fetus and are present at birth. Other anomalies, suchas syringomyelia, may not be seen at birth and may not produce symptomsuntil adulthood. More sophisticated technology for prenatal screening andgenetic counselling and increased prenatal intake of folic acid have led to a
Other Neurological Conditions
109109
decline in births with neural tube defects.11,12 For example, in Canada, the rateof neural tube defects (which produce anencephaly and various forms of spinabifida) declined from about 11.1 to 5.6 per 100,000 live births between 1989and 1999 as a result of these preventative measures.13
Creutzfeldt-Jakob DiseaseCreutzfeldt-Jakob disease (CJD) is a rare, degenerative and fatal brain disease.14
It is caused by alterations in prions, which are proteins normally present inthe brain and other tissues.14 There are three main types of CJD: sporadic,hereditary and acquired.14,15 In sporadic CJD, accounting for 85% of patients,no preventable risk factors have been identified, although recent evidencehas suggested a possible genetic predisposition.14 In hereditary CJD, makingup 5% to 10% of patients, the patient has a family history of the disease and/ora genetic marker for the disease shows up in tests. In acquired CJD (1% ofpatients) the disease is spread through exposure to brain or nervous tissue,usually via a medical procedure.14 New variant CJD, which has occurred inGreat Britain and other parts of Europe, may result from human ingestion ofcontaminated beef.14 This form of the disease begins primarily with psychiatricsymptoms, affects younger people and has a longer duration.14
There is currently no specific diagnostic test for CJD other than brain biopsy.14
The diagnosis is inferred from the clinical course of the disease and investigationssuch as cerebrospinal fluid (CSF) examination, electroencephalogram (EEG)and magnetic resonance imaging (MRI).14 Because there is no cure ortreatment for CJD, these investigations are also important to rule out treatableforms of dementia.14
CJD affects one person per million worldwide.14 It usually affects people later in life and runs a rapid course; 90% of patients die within one year.14
Degenerative Disorders of the SpineDegeneration of the spine is common at any age, but is most frequent amongthose over 60 years old. An estimated 80% of adults experience back pain atsome point in their lives.16 Degenerative processes affecting intervertebral discsand joints of the spine can be accelerated by overuse or injury. This can resultin acute herniation or arthritic disorders of the spine.
Degenerative disorders of the spine are usually treated with rest in the acutestage, exercise for strengthening of the spinal, abdominal and limb muscles,non-steroidal anti-inflammatory medication, muscle relaxants, analgesics andrelevant life style changes.17
The Burden of Neurological Diseases, Disorders and Injuries in Canada
Global Developmental DelayGlobal developmental delay is a set within a broader category of developmentaldisabilities. It is defined as a significant delay in two or more of the followingdevelopmental areas: motor, speech and language, cognition, social/personaland activities of daily living.18 Significant delays are defined as performance thatis two standard deviations or greater below the mean on age-appropriate,standardized testing.18
Global developmental delay can affect up to 1% to 3% of children underfive years of age.18
Treatment strategies for children with global developmental delay are basedon the etiology of the delay. This is determined by brain MRI, metabolic andgenetic testing, EEG and exploration for toxic exposure.
Huntington’s DiseaseHuntington’s disease (HD) is a genetic brain disorder that causes progressivephysical, cognitive and emotional deterioration.19 HD causes the death of cellsin specific parts of the brain: the caudate, the putamen and, eventually, thecerebral cortex.19 As the disease progresses, people with HD have moredifficulty controlling their movements, remembering the recent past, makingdecisions and controlling their emotions.19
A diagnosis of HD is determined after neurological and psychological tests, brainimaging—computed tomography (CT) or MRI—and genetic testing.19 There arecurrently no treatments that will slow down or stop the progression of HD.19
The Huntington Society of Canada estimates that 1 in every 10,000 Canadianshas HD, and approximately 5 in every 10,000 are at risk of developing HD.19
The HD gene is dominant, meaning that parents with HD have a 50% chance of passing it on to each child, who is considered to be “at risk.” Both male andfemale children are at the same risk of inheriting the gene.19 Symptoms usuallystart to manifest between 30 and 45 years of age, but can appear as early as 5 years of age or as late as 70 years of age and older.19
HydrocephalusHydrocephalus is a disease characterized by enlargement of the ventriclesof the brain.20 Cerebrospinal fluid (CSF), which is produced in the ventricles,normally circulates into the space outside the brain and spinal cord, where itacts as a cushion and plays a role in both supplying nutrients to the nervoussystem and removing waste materials.20 Hydrocephalus occurs when thenormal flow of CSF is blocked or CSF reabsorption is impaired.20 Symptomsand signs, including head enlargement in infants, are caused by the pressureof the enlarged ventricles on the brain.21 Hydrocephalus is most commonly
110
Other Neurological Conditions
a congenital disorder (often associated with other neurological disorders suchas spina bifida), but it can also be caused by brain hemorrhage, meningitis orhead trauma.21,22
Hydrocephalus is diagnosed by brain imaging—ultrasound (in infants), CTscanning or MRI.21 The most effective treatment is surgical insertion of a shuntto divert the CSF into another body cavity, such as the peritoneal cavity, whereit can be reabsorbed.21
According to the Hydrocephalus Association, hydrocephalus occurs in 2 out ofevery 1,000 births.20 A 1998 study suggests that the total annual cost of care ofhydrocephalus, excluding outpatient and community-based care, is $3.5 millionin Manitoba alone.22
Hypoxic-Ischemic Encephalopathy (Anoxic Encephalopathy)Hypoxic-ischemic encephalopathy, also known as anoxic encephalopathy, isa clinical state that occurs when the brain is severely deprived of oxygen forfive minutes or longer. Hypoxic-ischemic encephalopathy is usually causedby cardiac arrest, but can also result from birth injury, drowning, severehemorrhage, suffocation, carbon monoxide poisoning and diseases thatparalyze the respiratory muscles.
Although MRI and electrophysiological testing can detect changes that correlatewith anoxic encephalopathy, the diagnosis is mainly based on clinical criteria.Following cardiac resuscitation, the level of supportive care provided dependson the clinical state of the patient.
Hypoxic-ischemic brain damage is the leading cause of morbidity andmortality among patients with cardiac arrest who are initially resuscitated.23
Perinatal hypoxic-ischemic encephalopathy occurs in between 1 and 8 ofevery 1,000 births of more than 34 weeks of gestation.24 Of full-term infantsshowing hypoxic-ischemic encephalopathy, about a fifth die during thenewborn period and 25% of those who survive have permanentneuropsychological deficits.25
Idiopathic Intracranial HypertensionIdiopathic intracranial hypertension (previously known as benign intracranialhypertension or pseudotumour cerebri) involves increased intracranialpressure of an unknown cause.26
The overall incidence of idiopathic intracranial hypertension is estimated tobe about 1 per 100,000.27 It occurs most commonly in overweight women andthose with excessive intake of vitamin A and the use of certain medications (forexample, endocrine drugs or tetracycline).26 Among overweight women aged
111
The Burden of Neurological Diseases, Disorders and Injuries in Canada
20 to 44, the incidence of this condition in the United States is estimated to be15 to 19 per 100,000.26 The incidence tends to be higher in people with arterialhypertension and polycystic ovary syndrome.26
Diagnostic criteria require that other causes of intracranial hypertension (suchas brain tumours) be excluded.26 Evidence-based management strategies foridiopathic intracranial hypertension are not available. The main aim of treatmentis to prevent the loss of vision, since this condition leads to blindness in 10% ofpatients.26 Surgery may be needed to remove pressure on the optic nerve andweight reduction is often indicated.26
Muscular DystrophiesThe muscular dystrophies represent a heterogeneous group of disordersthat involve muscle wasting and weakness.28 They are all inherited and areclassified into three main groups: Duchenne-type, facioscapulohumeral and limbgirdle.28 Duchenne-type, the most common muscular dystrophy, primarilyaffects boys and occurs in 1 per 3,500 live male births.29 Diagnostic tests formuscular dystrophies usually include measuring creatinine kinase levels,electromyography, ultrasonography, muscle biopsy and genetic testing.28
Myasthenia GravisMyasthenia gravis is an autoimmune disease that causes the gradual loss ofmuscle strength and function.30 In myasthenia gravis, antibodies are generatedthat destroy the receptors in the neuromuscular junction, the area where nervetransmission causes a muscle to contract.30 This results in exercise-inducedmuscle weakness and fatigue.30 Myasthenia gravis affects everyone in its ownway, and each patient could have weakness in a different group of muscles.30
The prevalence of myasthenia gravis in the U.S. is approximately 14 per100,000.31 Among women, the incidence is highest in the age groups 20 to30 years and 70 years and older.31,32 On the other hand, among men, it ishighest in the age group 60 to 70 years.31 A variety of treatment modalitiesare used to control the symptoms of myasthenia gravis.30
Peripheral NeuropathyPeripheral neuropathy can be inherited or acquired, but always involvesdamage to the peripheral nervous system, which transmits informationconcerning motor, sensory or autonomic functions between the centralnervous system (brain and spinal cord) and other parts of the body. Thereare more than 100 types of peripheral neuropathy, each with its own set ofsymptoms and prognosis. Inherited peripheral neuropathy is caused by geneticmutations or errors in the genetic code. The most common cause of acquiredneuropathy is diabetes mellitus; other causes are alcoholism, nutritionaldeficiencies, physical injury, toxins, tumours, autoimmune responses andvascular and metabolic disorders.33,34,35,36
112
Other Neurological Conditions
The estimated prevalence of peripheral neuropathy ranges from 2,400 to8,000 per 100,000.34 It has been estimated that more than 17 million peoplein the U.S. and Europe have diabetes-related polyneuropathy.37
The symptoms in acute neuropathies (for example, Guillain-Barré syndrome)are characterized by symptoms that appear suddenly, progress quickly andfade slowly as the damaged nerves recover.33 Chronic neuropathies involvesymptoms that manifest gradually and develop slowly.33
The diagnosis of peripheral neuropathy is usually based on clinical history,physical examination and neurophysiological tests, including nerve conductionstudies and electromyography (EMG).35 These tests help to determine the partof the nerve that is affected and the extent of damage.35 In some instances,nerve biopsy is necessary to establish a diagnosis.35 Treatment of peripheralneuropathy depends on the cause of the disorder.36
Sleep DisordersThe sleep disorders are a group of conditions that share the symptom ofexcessive daytime sleepiness. There are two main types of sleep disorder:narcolepsy and sleep apnea. Narcolepsy is characterized by “recurrent attacksof irresistible sleep” that are variably associated with cataplexy (loss of muscletone in response to laughter or other emotion) and episodes of transientparalysis or hallucinations at the onset of sleep (hypnogogic paralysis orhallucinations).38 Narcolepsy is associated with decreased levels of sleep-relatedchemicals called hypocretins.39 The incidence of narcolepsy in a U.S. study wasestimated to be 1.4 per 100,000.39,40
Sleep apnea, which may be caused by neurological disorders (central sleepapnea) or upper airway obstruction (obstructive sleep apnea or OSA), is acondition in which there are abnormal interruptions in breathing during sleep.Depending on the definition criteria, the prevalence of OSA ranges from 1% to4% and is more common in men than in women.41 The incidence of centralsleep apnea is about one-tenth of that of OSA.42
Nocturnal polysomnography is important for determining the type of sleepdisorder. The management of narcolepsy involves pharmacologic, educationaland lifestyle interventions. Moderate to severe sleep apnea is often treated with nasal continuous positive airway pressure.
Spinocerebellar AtaxiasSpinocerebellar ataxias (SCAs) are hereditary degenerative disorderscharacterized by unsteady gait and poor coordination of hands, speechand eye movement.43 At least 24 different types of SCA are recognized,and in 12 of these, gene mutations have been identified.44 A study in theNetherlands estimated the prevalence of SCA to be 3 per 100,000.43
113
The Burden of Neurological Diseases, Disorders and Injuries in Canada
Clinical assessment, including a detailed family history and genetic testing, isrequired for the diagnosis of SCA. There is currently no therapy available toprevent SCA, but management by a multidisciplinary team can help patientsand their families deal with the effects of these disorders.44
SyringomyeliaSyringomyelia is a disorder in which a cyst forms within the spinal cord thatusually contains cerebrospinal fluid and can expand over time, causing damageto neurons and nerve fibres in the spinal cord.45 It is classified as “primary”(unrelated to any other disease state) or “secondary” to another disorder,such as spinal injury, meningitis, congenital anomalies or spinal cord tumours.45,46
According to the Canadian Syringomyelia Network, the disease is less commonthan multiple sclerosis.47 Early diagnosis of syringomyelia can be establishedwith MRI. Treatment may require surgical intervention.48
Tourette SyndromeTourette syndrome is an inherited neurological or neurochemical disordercharacterized by motor and phonic tics, which are involuntary, rapid, suddenmovements or vocalizations that occur repeatedly at irregular intervals.49
Tics usually appear around age 3 to 8 years, with a mean age of onset of6 years.50,51 The cause of Tourette syndrome is unknown, although there isstrong evidence that genetic factors may play a role.50,52 Comorbid conditionsinclude ADHD, obsessive-compulsive disorder or both.50 About 16% of patientswith Tourette syndrome have insomnia, and 26% of patients have anger-controlproblems.50 Once considered a rare condition, the prevalence of Tourette’ssyndrome is now estimated to be between 31 and 157 per 1,000 childrenaged 13 to 14 years.50 The male-to-female ratio is about 4 to 1.51 If the ticsare serious enough to interfere with function, medications can alleviatethe symptoms.50
Trigeminal NeuralgiaTrigeminal neuralgia is a disorder of the trigeminal nerve (the nerve of theface), characterized by severe, intermittent pain in the face.53 The causeof this disorder is believed to be compression of the trigeminal nerve rootby blood vessels where the nerve exits the brain stem.54 Trigeminal neuralgiacan also be secondary to multiple sclerosis or benign lesions at the base ofthe brain.53
Trigeminal neuralgia is rare before the age of 50. Its prevalence increaseswith age and is highest after the age of 70.54,55 The age-adjusted incidenceof trigeminal neuralgia is approximately 6 per 100,000 for women and 3 per100,000 for men in the U.S.55
Anti-epileptic medications control the symptoms of trigeminal neuralgia in mostpatients. However, surgery is sometimes necessary for pain relief. It involveseither moving the blood vessel that causes nerve compression or destroyingnerve fibres.55
114
Other Neurological Conditions
References
1 Canadian Attention-Deficit/Hyperactivity Disorder Resource Alliance, “Introduction,” inCanadian AD/HD Practice Guidelines, First Edition (Toronto: 2005), pp. iv–1.
2 T. E. Wilens, S. V. Faraone and J. Biederman, “Attention-Deficit/Hyperactivity Disorderin Adults,” Journal of the American Medical Association 292 (2006): pp. 619–623.
3 S. Parmet, C. Lynm and R. M. Glass, “Attention-Deficit/Hyperactivity Disorder,” Journalof the American Medical Association 288 (2002): p. 1804.
4 G. Baird, H. Cass and V. Slonims, “Diagnosis of Autism,” British Medical Journal 327(2003): pp. 488–493.
5 M. Rutter, “Incidence of Autism Spectrum Disorders: Changes Over Time and TheirMeaning,” Acta Paediatrica 94 (2005): pp. 2–15.
6 N. J. Holland and G. M. Weiner, “Recent Developments in Bell’s Palsy,” British MedicalJournal 329 (2004): pp. 553–557.
7 J. Piercy, “Bell’s Palsy,” British Medical Journal 330 (2005): p. 1374.
8 R. N. Harden, “Pharmacotherapy of Complex Regional Pain Syndrome,” AmericanJournal of Physical Medicine & Rehabilitation 84 (2005): pp. S17–S28.
9 H. Merskey and N. Bogduk, Classification of Chronic Pain: Descriptions of ChronicPain Syndromes and Definitions of Pain Terms, 2nd edition (Seattle, WA: IASP Press,1994), pp. 40–43.
10 Sandroni et al., “Complex Regional Pain Syndrome Type I: Incidence and Prevalencein Olmsted County, A Population Based Study,” Pain 103 (2003): pp. 199–207.
11 Y. Guo and T. T. Wong, “Screening of Fetal CNS Anomalies by MR Imaging,” Child’sNervous System 19 (2003): pp. 410–414.
12 J. G. Ray et al., “Association of Neural Tube Defects and Folic Acid Food Fortificationin Canada,” The Lancet 360 (2002): pp. 2047–2048.
13 Health Canada, Congenital Anomalies in Canada—A Perinatal Health Report, 2002(Ottawa: Health Canada, 2002), [online], cited April 4, 2006, from <http://www.phac-aspc.gc.ca/publicat/cac-acc02/pdf/cac2002_e.pdf>.
14 National Institute of Neurological Disorders and Stroke, Creutzfeldt-Jakob DiseaseFact Sheet (Bethesda, MD: National Institute of Neurological Disorders and Stroke,2003), [online], cited April 3, 2006, from <www.ninds.nih.gov/disorders/cjd/detail_cjd.htm>.
15 G. Mallucci and J. Collinge, “Update on Creutzfeldt-Jakob Disease,” Current Opinionin Neurology 17 (2004): pp. 641–647.
16 M. Gallucci et al., “Degenerative Disorders of the Spine,” European Radiology 15(2005): pp. 591–598.
17 J. S. Roh et al., “Degenerative Disorders of the Lumbar and Cervical Spine,” Journal ofOrthopedic Clinic of North America 36 (2005): pp. 255–262.
18 M. Shevell et al., ”Practice Parameter: Evaluation of the Child With GlobalDevelopment Delay,” Neurology 60 (2003): pp. 367–380.
19 Huntington Society of Canada, What Is Huntington Disease? A Brief Description(Kitchener: Huntington Society of Canada, 2004), [online], cited April 13, 2006, from<http://www.hsc-ca.org/english/pdf/What_is_HD.pdf>.
20 Hydrocephalus Association, What Is Hydrocephalus? (San Francisco, CA:Hydrocephalus Association, 2002), [online], cited April 3, 2006, from<http://www.hydroassoc.org/information/information.htm>.
115
The Burden of Neurological Diseases, Disorders and Injuries in Canada
21 Mayo Foundation for Medical Education and Research, Hydrocephalus (Rochester,MN: Mayo Foundation for Medical Education and Research, 2005), [online], cited April3, 2006, from <http://www.mayoclinic.com/health/hydrocephalus/DS00393>.
22 M. R. Del Bigio, “Epidemiology and Direct Economic Impact of Hydrocephalus:A Community Based Study,” Canadian Journal of Neurological Sciences 25 (1998):pp. 123–126.
23 C. Madl and M. Holzer, “Brain Function After Resuscitation From Cardiac Arrest,”Current Opinion in Critical Care 10 (2004): pp. 213–217.
24 C. Y. Spong, “Therapy for Hypoxic Ischemic Encephalopathy,” Obstetrics andGynecology 106 (2005): pp. 1226–1227.
25 R. C. Vannucci and J. M. Perlman, “Interventions for Perinatal Hypoxic-IschemicEncephalopathy,” Pediatrics 100 (1997): pp. 1004–1014.
26 A. K. Ball and C. E. Clarke, “Idiopathic Intracranial Hypertension,” The Lancet 5(2006): pp. 433–442.
27 M. K. Matthews, R. C. Sergott and P. J. Savino, “Pseudotumor Cerebri,” CurrentOpinions in Ophthalmology 14 (2003): pp. 364–370.
28 A. E. H. Emery, “The Muscular Dystrophies,” The Lancet 359 (2002): pp. 687–695.
29 R. M. Lovering, N. C. Porter and R. J. Bloch, “The Muscular Dystrophies: From Genesto Therapies,” Physical Therapy 85 (2005): pp. 1372–1388.
30 J. M. Torpy, T. J. Glass and R. M. Glass, “Myasthenia Gravis,” Journal of the AmericanMedical Association 293 (2005): p. 1940.
31 K. Scherer, R. S. Bedlack and D. L. Simel, “Does This Patient Have MyastheniaGravis?,” Journal of the American Medical Association 293 (2005): pp. 1906–1914.
32 R. D. Adams, M. Victor and A. H. Ropper, “Myasthenia Gravis and Related Disordersof Neuromuscular Transmission,” in Principles of Neurology 6th Edition (New York:McGraw-Hill Health Professions Division, 1997), pp. 159–162.
33 National Institute of Neurological Disorders and Stroke, Muscular DystrophyInformation Page (Bethesda, MD: National Institute of Neurological Disorders andStroke, 2005), [online], cited November 3, 2005, from <http://www.ninds.nih.gov/disorders/md/md.htm>.
34 R. A. C. Hughes, “Peripheral Neuropathy,” British Medical Journal 324 (2002):pp. 466–469.
35 A. N. Poncelet, “An Algorithm for the Evaluation of Peripheral Neuropathy,” AmericanFamily Physician 57 (1998): pp. 755–764.
36 Penn State Milton S. Hershey Medical Center College of Medicine, PeripheralNeuropathy (Hershey, PA: Penn State Milton S. Hershey Medical Centre College ofMedicine, 2004), [online], cited November 3, 2005, from <http://www.hmc.psu.edu/healthinfo/pq/peripheralneuropathy.htm>.
37 J. Barrett, Peripheral Neuropathy (Farmington Hills, MI: Gale Research, 1999), [online],cited May 11, 2007, from <http://findarticles.com/p/articles/mi_g2601/is_0010/ai_2601001045/print>.
38 M. Victor and A. H. Ropper, Adam and Victor’s Priniciples of Neurology, 7th edition,(New York: McGraw-Hill Health Professions Division, 2001) p. 421.
39 A. Culebras, Narcolepsy (San Diego, CA: MedLink Corporation, 2006), [online], citedJuly 27, 2006, from <http://www.medlink.com/cip.asp?uid=MTL0003N>.
40 M. H. Silber et al., “The Epidemiology of Narcolepsy in Olmsted County, Minnesota:A Population-Based Study,” Sleep 25 (2002): pp. 197–202.
116
Other Neurological Conditions
41 E. Lugaresi, C. Lombardi, Obstructive Sleep Apnea (San Diego, CA:MedLink Corporation, 2005), [online], cited September 24, 2005, from<http://www.medlink.com/medlinkcontent.asp>.
42 S. Stevens and J. J. Herdegen, Central Sleep Apnea (San Diego, CA:MedLink Corporation, 2005), [online], cited September 24, 2005, from<http://www.medlink.com/medlinkcontent.asp>.
43 B. P. C. van de Warrenburg et al., “Spinocerebellar Ataxias in the Netherlands:Prevalence and Age at Onset Variance Analysis,” Neurology 58 (2002): pp. 702–718.
44 L. Schols et al., “Autosomal Dominant Cerebellar Ataxias: Clinical Features, Genetics,and Pathogenesis,” The Lancet 3 (2004): pp. 291–304.
45 J. Klekamp, “The Pathophysiology of Syringomyelia—Historical Overview and CurrentConcept,” Acta Neurochirurgica (Wien) 144 (2002): pp. 649–664.
46 P. Steinbok, “Clinical Features of Chiari I Malformations,” Child’s Nervous System 20(2004): pp. 329–331.
47 Canadian Syringomyelia Network, What Is Syringomyelia? (Markham, Ontario:Canadian Syringomyelia Network, 2006), [online], cited July 28, 2006, from<http://www.csn.ca/>.
48 J. M. Eule et al., “Malformation Associated With Syringomyelia and Scoliosis: ATwenty-Year Review of Surgical and Nonsurgical Treatment in a Pediatric Population,”Spine 27 (2002): pp. 1451–1455.
49 U. Chowdhury and I. Heyman, “Tourette’s Syndrome in Children,” British MedicalJournal 329 (2004): pp.1356–1357.
50 J. F. Leckman, “Tourette’s Syndrome,” The Lancet 360 (2002): pp. 1577–1586.
51 R. D. Freeman et al., “An International Perspective on Tourette Syndrome: SelectedFindings From 3,500 Individuals in 22 Countries,” Developmental Medicine and ChildNeurology 42 (2000): pp. 436–447.
52 C. L. Barr and P. Sandor, “Current Status of Genetic Studies of Gilles de la TouretteSyndrome,” Canadian Journal of Psychiatry 43 (1998): pp. 351–357.
53 A. Truini, F. Galeotti and G. Cruccu, “New Insight Into Trigeminal Neuralgia,” TheJournal of Headache and Pain 6 (2005): pp. 237–239.
54 A. M. Kaufmann and M. Patel, A Complete Guide to Trigeminal Neuralgia (Winnipeg:Centre for Cranial Nerve Disorders, 2001), [online], cited April 24, 2007, from<http://www.umanitoba.ca/cranial_nerves/trigeminal_neuralgia/manuscript/overview.html>.
55 J. M. Zakrzewska and B. C. Lopez, “Trigeminal Neuralgia,” Clinical Evidence 14(2003): pp. 1669–1677.
117

The Canadian Neurological Sciences Federation (CNSF)
would like to thank the following agencies and voluntary
health organizations for their participation in the
Canadian Brain and Nerve Health Coalition (CBANHC).
• Acoustic Neuroma Association of Canada• ALS Society of Canada• Alzheimer Society of Canada• Autism Society Canada• Brain Injury Association of Canada• Brain Injury Association of Alberta• Brain Tumour Foundation of Canada• Canadian Alliance of Brain Tumour Organizations• Canadian Association for Neuroscience• Canadian Association of Neuroscience Nurses• Canadian Brain Tissue Bank• Canadian Congress of Neurological Sciences• Canadian Continence Foundation• Canadian Down Syndrome Society, National Office• Canadian Institutes of Health Research• Canadian Paraplegic Association• Canadian Psychiatric Research Foundation• Canadian Reflex Sympathetic Dystrophy Network• Canadian Spinal Research Organization• Canadian Syringomyelia Network• Canadian von Hippel–Lindau Family Alliance• Central Okanagan Brain Injury Society• Cerebral Palsy Association of British Columbia• Epilepsy Canada• Heart and Stroke Foundation of Canada• Heart and Stroke Foundation of Ontario• Huntington Society of Canada• Institute of Neurosciences, Mental Health and Addiction • Multiple Sclerosis Society of Canada• Muscular Dystrophy Canada• Myasthenia Gravis Coalition of Canada
Appendix ACBANHC-Affiliated Voluntary Health Organizations
119
The Burden of Neurological Diseases, Disorders and Injuries in Canada
120
• NeuroScience Canada Foundation• Ontario Brain Injury Association• Parkinson Society Canada• Regroupement des associations de personnes traumatisées cranio-
cérébrales du Québec• Rick Hansen Foundation (Man in Motion)• Spina Bifida and Hydrocephalus Association of Canada• ThinkFirst Foundation of Canada • Tourette Syndrome Foundation of Canada• Tuberous Sclerosis Canada
The CNSF also acknowledges, with appreciation, the following membersof CNSF and representatives of the CBANHC-affiliated voluntary healthorganizations for their contribution to the neurological condition chapters:
• Feri Dehdar, Cerebral Palsy Association of British Columbia• Ivy Lim-Carter, Parkinson Society Canada• Jane McCarthy, ALS Society of Canada • Irene Worthington, Headache Network of Canada• Heidi Bernhardt, Canadian ADHD Resource Alliance• Dr. Derek Fewer, CNSF• Dr. Manouchehr Javidan, CNSF• Ean Robertson, Huntington Society of Canada• Rosie Wartecker, Tourette Syndrome Foundation of Canada• Dr. Jerome Yager, CNSF
Hospital UtilizationHospital utilization was assessed through analyses
of CIHI data related to emergency department (ED)
and urgent care centre (UCC) visits and acute care,
inpatient rehabilitation and complex continuing care
(CCC) hospitalizations.
ED and UCC VisitsData SourceED/UCC visits and patient characteristics were determined based on CIHI’sNational Ambulatory Care Reporting System (NACRS), which includesdemographic, diagnostic and procedural information from hospital EDs andUCCs in Ontario and selected hospitals in other parts of Canada (in 2005–2006,five from Nova Scotia, three from British Columbia, one from Prince EdwardIsland and one from the Yukon Territory). Submission to NACRS is mandatoryin Ontario.
Inclusion Criteria• Records of patients with a valid health card number for 2001–2002 to
2005–2006 with the following conditions of interest:
- Alzheimer’s disease, amyotrophic lateral sclerosis, multiple sclerosisand Parkinson’s disease records of patients 19 years of age andolder; and
- Brain tumours, cerebral palsy, epilepsy, head injuries, headaches,spinal injuries and stroke for patients of any age.
Conditions of Interest • Conditions are identified using the ICD-9 or ICD-10 codes submitted to
CIHI (Appendix C).
• Conditions were categorized as either:
- Primary diagnosis: when the condition of interest was recorded in thepatient chart as the main reason for the visit; or
- Secondary diagnosis: when the condition of interest was recorded inthe patient chart but it was not the main reason for the visit.
• As such, in one visit, a patient record may reflect that the patient hasmore than one condition of interest.
Appendix BData Sources and Methods
121
The Burden of Neurological Diseases, Disorders and Injuries in Canada
122
Acute Care HospitalizationsData SourceAcute care hospitalizations and patient characteristics were determined basedon CIHI’s Hospital Morbidity Database (HMDB), which includes demographic,diagnostic and procedural information for patients discharged from acute carehospitals in all provinces and territories.
Inclusion Criteria• Records for patients with a valid health card number for 2000–2001 to
2004–2005 with the following conditions of interest:
- Alzheimer’s disease, amyotrophic lateral sclerosis, multiple sclerosis, andParkinson’s disease records of patients 19 years of age and older; and
- Brain tumours, cerebral palsy, epilepsy, head injuries, headaches,spinal injuries, and stroke for patients of any age.
Conditions of Interest • Conditions are identified using the ICD-9 or ICD-10 codes submitted to
CIHI (Appendix C).
• Conditions were categorized as either:
- Primary diagnosis: when the condition of interest was recorded in thepatient chart as the main reason for the hospitalization; or
- Secondary diagnosis: when the condition of interest was recorded inthe patient chart but it was not the main reason for the hospitalization.
• As such, for one hospitalization, a patient record may reflect that thepatient has more than one condition of interest.
Hospitalization Characteristics • Length of stay (LOS) was determined for hospitalizations in 2004–2005.
In the case of multiple visits where the neurological condition of interestwas the primary diagnosis, LOS was based on the final hospitalizationin the year.
• Readmission following an index discharge was determined for2003–2004. It was based on the first record of hospitalization in the year,when the neurological condition of interest was either the primary or thesecondary diagnosis. When a patient was readmitted or transferred toanother acute care hospital within 24 hours, this was considered thesame hospitalization. A same-day readmission was not considered to bea new episode of care.
Appendix B: Data Sources and Methods
123
Inpatient Rehabilitation Services Data SourceInpatient rehabilitation patients were identified using CIHI’s NationalRehabilitation Reporting System (NRS), which includes administrative,sociodemographic, clinical and functional status information for patientsin a designated general or specialized inpatient rehabilitation bed in anacute care hospital, or a rehabilitation hospital in Ontario and selectedhospitals in the other parts of Canada (in 2005–2006: five in British Columbia,six in Alberta, three in Saskatchewan, one in New Brunswick, two in NovaScotia and one in Newfoundland). Submission to NRS in Ontario is mandatory.
Inclusion Criteria• Records for patients with a valid health card number in 2005–2006.
• Records for patients with planned discharges.
• Records with discharge Functional Independence Measures (FIM™)i scores.
Conditions of Interest • Conditions for which data are available include head injury, multiple
sclerosis, Parkinson’s disease, spinal injuries and stroke.
• Conditions were identified using the Rehabilitation Client Group (RCG)ii
codes (Appendix C), which best describe the primary reason for the admission.
Hospitalization Characteristics• Length of stay (LOS) was calculated in two ways: total LOS excluding
service interruptions, and active LOS (total LOS excluding days waitingfor discharge).
• Total Function Scoreiii was determined from the admission anddischarge records.
• Total Function Score is a measure of the rehabilitation patients’ overallfunctional ability. It was measured using the Functional IndependenceMeasure (FIM™) instrument,iv which assesses disability and caregiverburden associated with the disability. The FIM™ is composed of 18 items(13 for motor disability and 5 for cognitive disability) rated on a scalerepresenting gradation from dependent (1) to independent (7) function.Scores on these items are added to obtain the Total Function Score,which can range from 1 to 126 (higher Total Function Score indicateshigher overall level of functioning).
i Property of Uniform Data System for Medical Rehabilitation, Division of UB Foundation Activities, Inc.
ii Adapted with permission from the UDSMR impairment codes. Copyright Uniform Data System for
Medical Rehabilitation, a division of UB Foundation Activities, Inc., all rights reserved.
iii Based on data collected using the FIM™.
iv Property of Uniform Data System for Medical Rehabilitation, Division of UB Foundation Activities, Inc.
The Burden of Neurological Diseases, Disorders and Injuries in Canada
124
Complex Continuing CareData SourceCCC patients were identified using CIHI’s Continuing Care Reporting System(CCRS) database. Data from CCC hospitals in Ontario (where submission toCCRS is mandatory) were used.
Inclusion Criteria• Records for patients with a valid health card number from all submitting
CCCs in Ontario for 2001–2002 to 2005–2006.
• Records with a complete assessment, including diagnostic information.(The assessment is mandatory if the patient stays in the facility 14 days ormore; in 2005–2006, 18% of residents did not receive assessments andtherefore were not included in the analysis).
Conditions of Interest• Alzheimer’s disease, amyotrophic lateral sclerosis (ALS), cerebral palsy,
epilepsy, head injuries, multiple sclerosis, Parkinson’s disease and stroke.Data for ALS were available starting in 2003–2004.
• Conditions were identified using the coding scheme specific to CCRS(Appendix C). In one CCC stay, a patient record may reflect more thanone condition of interest.
Hospitalization Characteristics• Bed days (that is, days of care provided to patients in CCC beds) were
based on individual episodes of care. In the case where a patient left fora short visit to acute care and then came back, two separate visits wererecorded. They were also based on patients who had complete episodes(that is, were discharged from CCC). If a patient had more than onecomplete episode, bed days were based on the last visit.
• Discharge information was based on the last visit if a patient had morethan one complete episode.
Appendix B: Data Sources and Methods
125
Estimates of Economic Burden andDisability-Adjusted Life Years (DALYs) Estimates of economic burden (including direct costs and indirectcosts) and the DALYs were calculated by the Public Health Agencyof Canada for 2000–2001.
Direct CostsData SourceCIHI’s National Health Expenditure Trends 1975–2004, Table C.1.1, Total HealthExpenditures by Use of Funds, was used.1
MethodsCost components were distributed by diagnostic category using additional datasources. Specific details regarding cost distribution are available from PHAC.
Indirect Costs Data SourceLabour market data were used.
MethodsIncluded in calculations were the following economic variables: the averageannual income2 and the average value of unpaid work3 (both take into accountthe employment and unemployment rates); the average supplementary income4
and the value of labour income (added to account for wage supplements such asCanada/Quebec Pension Plan or CCP/QPP, workers’ compensation, employmentinsurance funds); the average annual labour productivity growth ratev in theCanadian business sector.5 Indirect costs do not include value of time lost fromwork and leisure activities by family members or friends who help care for theperson with the neurological conditions of interest.
Estimates of the Disability-Adjusted Life Years
Data SourceDALYs were determined based on the WHO (World Health Organization)workbook, which includes data for North America on incidence, distribution andduration associated with the different stages of disease, when available.6
MethodsThe WHO workbook data were updated to include Canadian preference scores,which indicate the relative preference for a health state compared with full health.These scores help understand how Canadians view the various aspects offunctional health (for example, pain, discomfort, physical functioning, fatigue).
v The 2.2% average annual productivity growth rate reflects the economic performance for
Canadian businesses for the last five years.
References1 Canadian Institute for Health Information, National Health Expenditure Trends
1975–2004, (Ottawa: CIHI, 2004).
2 Statistics Canada, 2000 General Social Survey (Ottawa: Statistics Canada, 2001).
3 Statistics Canada, 1998 Survey of Labour and Income Dynamics (Ottawa: StatisticsCanada, 1998).
4 Statistics Canada, Cansim Table 382-0006: Wages, Salaries and Supplementary LabourIncome 2000 (Ottawa: Statistics Canada, 2000).
5 Statistics Canada, Microeconomic Analysis Division, Productivity and Labour Cost(Custom tabulations) (Ottawa: Statistics Canada, 2000).
6 World Health Organization and The World Bank, The Global Burden of Disease: AComprehensive Assessment of Mortality and Disability From Diseases, Injuries andRisk Factors in 1990 and Projected to 2020 (Global Burden of Disease and InjurySeries, Vol. I), C. J. L. Murray and A. D. Lopez, eds., (Cambridge, MA: Harvard Schoolof Public Health, 1996).
The Burden of Neurological Diseases, Disorders and Injuries in Canada
126
The following table lists the codes used to identify
patients with the neurological conditions presented
in the report. Records of patients visiting emergency
departments/urgent care centres and of those
discharged from acute care hospitals were identified using
the ICD-9, ICD-9-CM and ICD-10-CA codes. Records of
patients receiving inpatient rehabilitation services were
identified using the Rehabilitation Client Group codes
and those receiving complex continuing care services
were identified using the codes from the Continuing Care
Reporting System coding scheme.
Appendix CNeurological Condition Codes
127
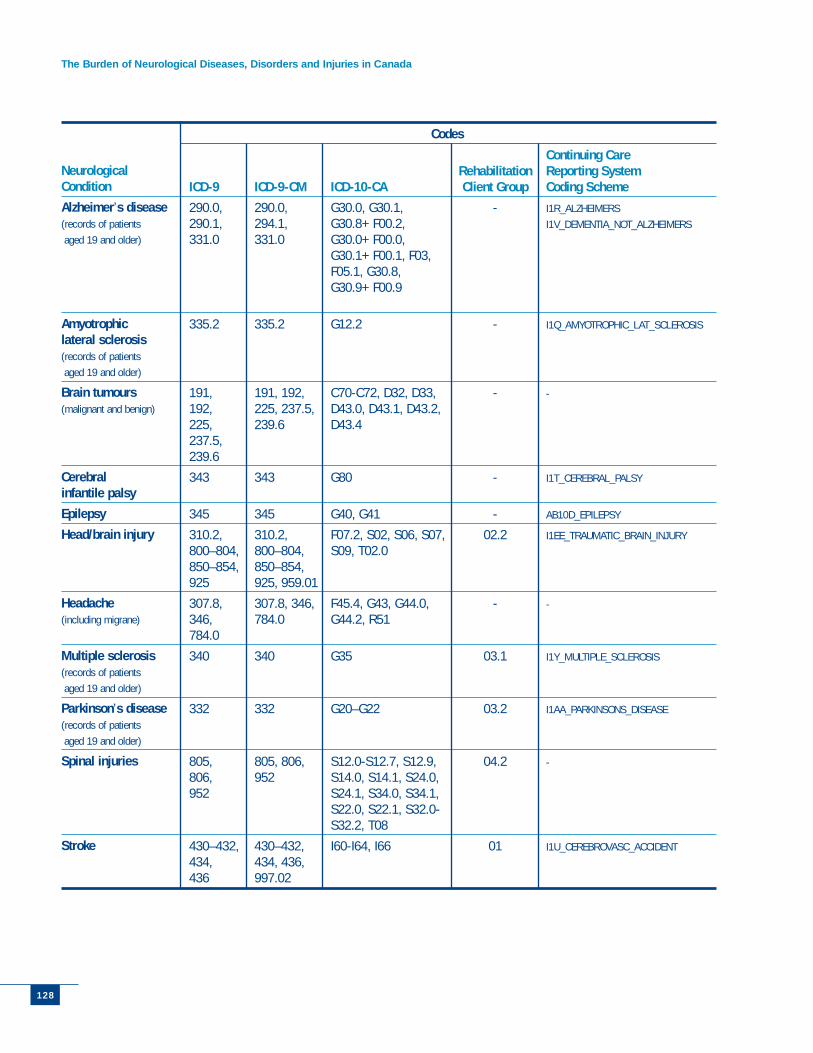
The Burden of Neurological Diseases, Disorders and Injuries in Canada
128
Neurological Condition
Alzheimer’s disease(records of patients
aged 19 and older)
Amyotrophic lateral sclerosis(records of patients
aged 19 and older)
Brain tumours (malignant and benign)
Cerebral infantile palsy
Epilepsy
Head/brain injury
Headache(including migrane)
Multiple sclerosis(records of patients
aged 19 and older)
Parkinson’s disease(records of patients
aged 19 and older)
Spinal injuries
Stroke
Codes
ICD-9
290.0,290.1, 331.0
335.2
191, 192, 225, 237.5, 239.6
343
345
310.2,800–804,850–854,925
307.8,346,784.0
340
332
805, 806, 952
430–432,434, 436
ICD-9-CM
290.0,294.1, 331.0
335.2
191, 192,225, 237.5,239.6
343
345
310.2,800–804,850–854,925, 959.01
307.8, 346,784.0
340
332
805, 806,952
430–432,434, 436,997.02
ICD-10-CA
G30.0, G30.1,G30.8+F00.2,G30.0+F00.0,G30.1+F00.1, F03,F05.1, G30.8,G30.9+F00.9
G12.2
C70-C72, D32, D33,D43.0, D43.1, D43.2,D43.4
G80
G40, G41
F07.2, S02, S06, S07,S09, T02.0
F45.4, G43, G44.0,G44.2, R51
G35
G20–G22
S12.0-S12.7, S12.9,S14.0, S14.1, S24.0,S24.1, S34.0, S34.1,S22.0, S22.1, S32.0-S32.2, T08
I60-I64, I66
RehabilitationClient Group
-
-
-
-
-
02.2
-
03.1
03.2
04.2
01
Continuing Care Reporting System Coding Scheme
I1R_ALZHEIMERS
I1V_DEMENTIA_NOT_ALZHEIMERS
I1Q_AMYOTROPHIC_LAT_SCLEROSIS
-
I1T_CEREBRAL_PALSY
AB10D_EPILEPSY
I1EE_TRAUMATIC_BRAIN_INJURY
-
I1Y_MULTIPLE_SCLEROSIS
I1AA_PARKINSONS_DISEASE
-
I1U_CEREBROVASC_ACCIDENT