Embed Size (px)
Citation preview

This article was downloaded by: [77.38.244.106]On: 22 April 2014, At: 10:57Publisher: Taylor & FrancisInforma Ltd Registered in England and Wales Registered Number: 1072954Registered office: Mortimer House, 37-41 Mortimer Street, London W1T 3JH, UK
Environmental SciencesPublication details, including instructions for authors andsubscription information:http://www.tandfonline.com/loi/nens19
The Built Environment InducedUrban Heat Island Effect inRapidly Urbanizing Arid Regions –A Sustainable Urban EngineeringComplexityJay S. Golden aa Sustainable Technologies Program, Consortium forthe Study of Rapidly Urbanizing Regions, Arizona StateUniversity , Tempe, AZ, USAPublished online: 02 Feb 2010.
To cite this article: Jay S. Golden (2004) The Built Environment Induced Urban Heat IslandEffect in Rapidly Urbanizing Arid Regions – A Sustainable Urban Engineering Complexity,Environmental Sciences, 1:4, 321-349, DOI: 10.1080/15693430412331291698
To link to this article: http://dx.doi.org/10.1080/15693430412331291698
PLEASE SCROLL DOWN FOR ARTICLE
Taylor & Francis makes every effort to ensure the accuracy of all the information(the “Content”) contained in the publications on our platform. However, Taylor& Francis, our agents, and our licensors make no representations or warrantieswhatsoever as to the accuracy, completeness, or suitability for any purposeof the Content. Any opinions and views expressed in this publication are theopinions and views of the authors, and are not the views of or endorsed byTaylor & Francis. The accuracy of the Content should not be relied upon andshould be independently verified with primary sources of information. Taylor andFrancis shall not be liable for any losses, actions, claims, proceedings, demands,costs, expenses, damages, and other liabilities whatsoever or howsoever causedarising directly or indirectly in connection with, in relation to or arising out of theuse of the Content.
This article may be used for research, teaching, and private study purposes.Any substantial or systematic reproduction, redistribution, reselling, loan, sub-licensing, systematic supply, or distribution in any form to anyone is expressly

forbidden. Terms & Conditions of access and use can be found at http://www.tandfonline.com/page/terms-and-conditions
Dow
nloa
ded
by [
77.3
8.24
4.10
6] a
t 10:
57 2
2 A
pril
2014
Environmental Sciences2003/2004, Vol. 1, No. 4, pp. 321–349
RESEARCH ARTICLE
The Built Environment Induced Urban HeatIsland Effect in Rapidly Urbanizing AridRegions – A Sustainable Urban Engineering Complexity
Jay S. GoldenSustainable Technologies Program, Consortium for the Study of RapidlyUrbanizing Regions, Arizona State University, Tempe, AZ, USA
ABSTRACT
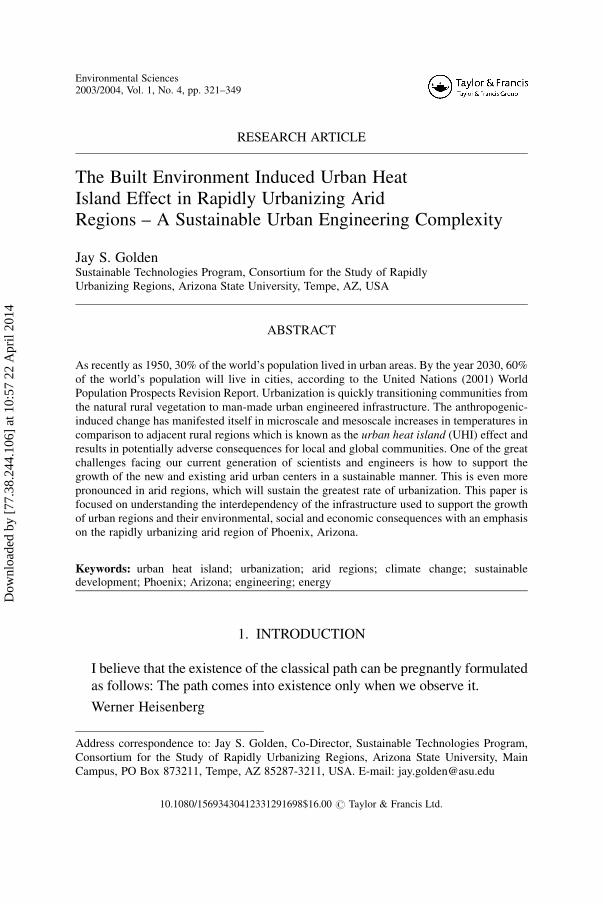
As recently as 1950, 30% of the world’s population lived in urban areas. By the year 2030, 60%of the world’s population will live in cities, according to the United Nations (2001) WorldPopulation Prospects Revision Report. Urbanization is quickly transitioning communities fromthe natural rural vegetation to man-made urban engineered infrastructure. The anthropogenic-induced change has manifested itself in microscale and mesoscale increases in temperatures incomparison to adjacent rural regions which is known as the urban heat island (UHI) effect andresults in potentially adverse consequences for local and global communities. One of the greatchallenges facing our current generation of scientists and engineers is how to support thegrowth of the new and existing arid urban centers in a sustainable manner. This is even morepronounced in arid regions, which will sustain the greatest rate of urbanization. This paper isfocused on understanding the interdependency of the infrastructure used to support the growthof urban regions and their environmental, social and economic consequences with an emphasison the rapidly urbanizing arid region of Phoenix, Arizona.
Keywords: urban heat island; urbanization; arid regions; climate change; sustainabledevelopment; Phoenix; Arizona; engineering; energy
1. INTRODUCTION
I believe that the existence of the classical path can be pregnantly formulated
as follows: The path comes into existence only when we observe it.
Werner Heisenberg
Address correspondence to: Jay S. Golden, Co-Director, Sustainable Technologies Program,Consortium for the Study of Rapidly Urbanizing Regions, Arizona State University, MainCampus, PO Box 873211, Tempe, AZ 85287-3211, USA. E-mail: [email protected]
10.1080/15693430412331291698$16.00 # Taylor & Francis Ltd.
Dow
nloa
ded
by [
77.3
8.24
4.10
6] a
t 10:
57 2
2 A
pril
2014

The importance of the statement by Heisenberg (1927) is his argument that
every concept has a meaning only in terms of the experiments used to measure
it. Sustainable development is an often-used term but one that requires the user
to associate it with a defined problem. This article intends to advance the
concept that the Phoenix, Arizona region, which is one of the world’s most
rapidly urbanizing arid regions, risks measurably high social, economic and
environmental consequences associated with a growth-induced urban heat
island (UHI) effect. The region provides researchers a platform to explore
scientifically mitigation strategies for global cities in terms of sustainable
development.
The beginnings of the modern-day sustainable development movement
can be traced back to the 1960s and Rachel Carson’s book The Silent Spring
(Carson, 1962). In the following years a number of publications, including
Paul Erlich’s Population Bomb (Erlich, 1968) and the Club of Rome’s Limits
to Growth (Meadows, 1972) drew attention to global development issues. In
1986, the UN held meetings of the World Commission on Environment and
Development to study the dynamics of global environmental degradation and
make recommendations to ensure the long-term viability of human society.
The Commission was chaired by Gro Harlem Brundtland, who at the time
was the Prime Minister of Norway. The product of this meeting was their
report, Our Common Future (1987). The Brundtland Report, as it came to
be known, was the benchmark for thinking about the global environment
and the first to popularize the term ‘sustainable development’. It was de-
fined as ‘development that meets the needs of the present without com-
promising the ability of future generations to meet their own needs (UN
1986)’.
The 1992 Conference on Environment and Development held in Rio de
Janeiro (also called the Earth Summit, 1992, or the Rio Summit) focused
on environment and development issues. More than 35,000 people
attended, including 106 heads of state or governments and 9,000 journalists
(United Nations, 1997). The Conference led to a number of important
conventions including those on biodiversity and climate change, as well as
to Agenda 21, a sustainable development action plan for various levels of
government. The most recent international sustainable development
conference was held in 2002 in Johannesburg, South Africa. The World
Summit on Sustainable Development (WSSD) focused on the issues of
poverty reduction.
322 JAY S. GOLDEN
Dow
nloa
ded
by [
77.3
8.24
4.10
6] a
t 10:
57 2
2 A
pril
2014

2. URBAN POPULATION DYNAMICS
International attention paid to sustainable development has occurred at a time
when urban areas are gaining an estimated 67 million people per year – about
1.3 million every week. By 2030, approximately 5 billion people are expected
to live in urban areas – 60% of the projected global population of 8.3 billion
(United Nations, 2002a). Most of the world’s future population growth will
occur in arid regions of the world (Baker et al., 2004) as presented in Table 1.
The urban population of developing countries is projected to grow at an
average annual rate of 2.4%, twice the rate of 1.2% in the developed world.
The urban population of developed countries will grow faster than their
total population and these countries will remain far more urbanized than the
developing world. Urban growth in developing countries is more rapid and, in
absolute numbers, much greater. Research of rapid urbanization is important
due to the far-reaching impacts urban centers create on the environment not
only within the urban core but extending to regions that supply the consumed
materials such as energy and water (McMichael et al., 2002). In many cases,
these natural resources are consumed by the urban core to offset the urban
heat impacts.
Urban areas take up just 2% of the Earth’s surface but account for an
unbalanced amount of resource usage. For example, urban areas account for
about 75% of industrial wood use, and 60% of the water withdrawn is for
human use (O’Meara, 1999). The extent of urban impacts upon the
environment increases not only as population grows but also as per capita
Table 1. Urban population dynamics. Source: United Nations (2002b).
Population (in millions)
1975 2000 2030 % Urban
Region Urban Rural Urban Rural Urban Rural 1975 2000 2030
Africa 102 304 295 498 787 702 25 37 53Asia 592 1805 1376 2297 2679 2271 25 37 54Latin America and Caribbean 198 124 391 498 127 608 61 75 85Europe 455 221 534 193 540 131 67 73 80North America 180 64 243 71 335 61 74 77 84Oceania� 15 6 23 8 32 10 72 74 77
Note. �Oceania¼Australia, New Zealand, Melanesia, Micronesia, and Polynesia.
THE URBAN HEAT ISLAND EFFECT 323
Dow
nloa
ded
by [
77.3
8.24
4.10
6] a
t 10:
57 2
2 A
pril
2014

demand for resources rises, both from industries and consumers. Additionally,
the number of households has grown even faster than the population itself,
reflecting a trend to smaller families and thus a decline in the average number
of people per household. Analyzing data from 141 countries, a recent study
calculated that the annual growth in the number of households (at 3.1%) was
much more rapid than population growth itself (at 1.8%) between 1985 and
2000 (Hinrichsen et al., 2002). As regions transform from rural agricultural to
urban built environments, various climate changes become manifest. First,
native vegetation that provide shade and evapotranspiration are removed.
Secondly, engineered materials used to transform the land to accommodate
shelter, mobility, sanitation, and culture transform the surfaces that comprise
the urban setting. These lower albedo (darker) and impervious surface
properties can include streets, roofs, walls, lawns, landscape and parking lots.
Additionally, urban geometry begins to manifest itself, impacting air flows
and radiative characteristics.
Groups of urban buildings, which are generally made of engineered
materials (glass, metal) with sharp edges, generally contain larger buildings
with mixed height and dimensions. Commercial buildings and high rise multi-
family units typically are taller and display high thermal mass and unique
canyons which increase the impact of the built environment on urban climate
(Arnfield et al., 2003). It is the combinations of these designs that impact air
flow above and within urban environments. These impacts, which have both
beneficial and negative impacts based on the local scale setting, include
atmospheric turbulence, shading and various radiation parameters such as
albedo and emissivity (Grimmond & Oke, 1999). An additional considera-
tion is that global rapid urbanization is taking place at a time that one of the
most contentious international issues facing sustainable development has
emerged – global climate change. Global warming gases, which contribute
to the trend of climate change, transmit incoming radiation from the sun
but absorb and trap the infrared radiation subsequently emitted from the
Earth’s surface.
As a result, the presence of these gases in the atmosphere raises
temperatures near the Earth’s surface. Naturally occurring substances such
as carbon dioxide (CO2) and water vapor are global warmers but the
phenomenon of global warming has been intensified by the release of
additional CO2 and other gases to the atmosphere as a result of industrial
activity, such as energy production. In 1988, the International Panel on
Climate Change (IPCC) was founded under the auspices of the UN, with
324 JAY S. GOLDEN
Dow
nloa
ded
by [
77.3
8.24
4.10
6] a
t 10:
57 2
2 A
pril
2014
strong support from the international community including the Mulroney,
Reagan, and elder Bush administrations. It is part of the UN Environment
Programme (UNEP) and the World Meteorological Organization (WMO).
The IPCC has issued three Assessment Reports to date (IPCC 1990, 1996,
2001).
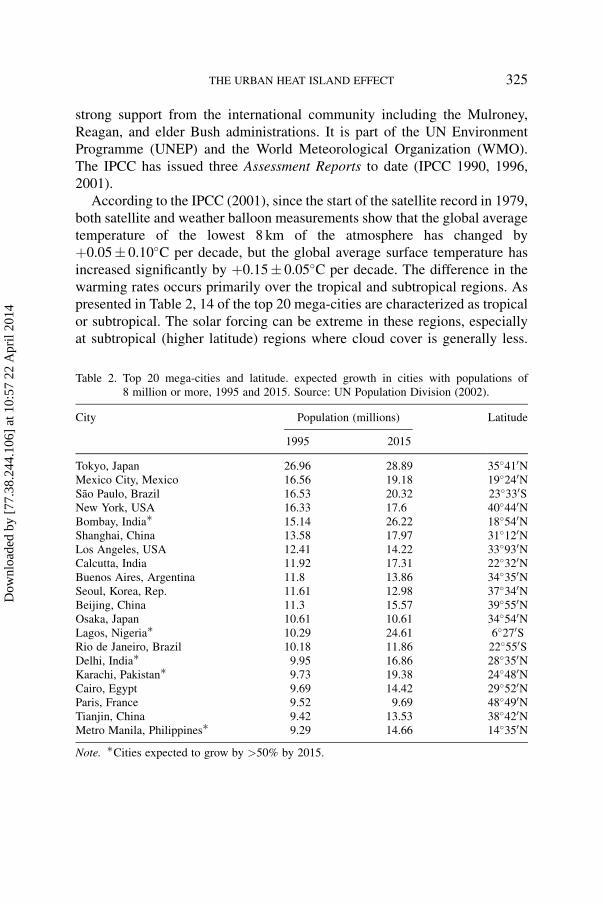
According to the IPCC (2001), since the start of the satellite record in 1979,
both satellite and weather balloon measurements show that the global average
temperature of the lowest 8 km of the atmosphere has changed by
þ0.05� 0.10�C per decade, but the global average surface temperature has
increased significantly by þ0.15� 0.05�C per decade. The difference in the
warming rates occurs primarily over the tropical and subtropical regions. As
presented in Table 2, 14 of the top 20 mega-cities are characterized as tropical
or subtropical. The solar forcing can be extreme in these regions, especially
at subtropical (higher latitude) regions where cloud cover is generally less.
Table 2. Top 20 mega-cities and latitude. expected growth in cities with populations of8 million or more, 1995 and 2015. Source: UN Population Division (2002).
City Population (millions) Latitude
1995 2015
Tokyo, Japan 26.96 28.89 35�410NMexico City, Mexico 16.56 19.18 19�240NSao Paulo, Brazil 16.53 20.32 23�330SNew York, USA 16.33 17.6 40�440NBombay, India� 15.14 26.22 18�540NShanghai, China 13.58 17.97 31�120NLos Angeles, USA 12.41 14.22 33�930NCalcutta, India 11.92 17.31 22�320NBuenos Aires, Argentina 11.8 13.86 34�350NSeoul, Korea, Rep. 11.61 12.98 37�340NBeijing, China 11.3 15.57 39�550NOsaka, Japan 10.61 10.61 34�540NLagos, Nigeria� 10.29 24.61 6�270SRio de Janeiro, Brazil 10.18 11.86 22�550SDelhi, India� 9.95 16.86 28�350NKarachi, Pakistan� 9.73 19.38 24�480NCairo, Egypt 9.69 14.42 29�520NParis, France 9.52 9.69 48�490NTianjin, China 9.42 13.53 38�420NMetro Manila, Philippines� 9.29 14.66 14�350N
Note. �Cities expected to grow by >50% by 2015.
THE URBAN HEAT ISLAND EFFECT 325
Dow
nloa
ded
by [
77.3
8.24
4.10
6] a
t 10:
57 2
2 A
pril
2014

Heat trapping and modifying the surface energy budget is likely to have an
amplified effect upon these areas.
3. ENGINEERED ENVIRONMENTS AND THE UHI
The urban built environment – the nexus of architecture, engineering, and
commerce – is one of the main attractors of population shifts from rural to
urban areas. As the dynamics of this population shift occur, the 21st century
phenomenon of rapid urbanization is creating extreme changes in land use that
result in unintended environmental, economic, and social consequences. In
urban areas, buildings and paved surfaces have gradually replaced preexisting
natural landscapes. As a result, roads and rooftops absorb solar energy,
causing the surface temperature of urban structures to become 50–70�F higher
than the ambient air temperatures (Taha et al., 1992). As surfaces throughout a
community or city become hotter, overall ambient air temperatures increase in
the urban region greater than that in the rural region �Tu� r. This
phenomenon, known as an urban heat island (UHI), can raise temperatures
in a city from 2 to 8�F (Bornstein, 1987; Chandler, 1965; Landsberg, 1981;
Oke, 1987). This localized regional effect is in addition to IPCC (1996)
estimates that put the potential of global warming to be þ1.4�C to þ5.0�C(þ2.5�F to þ10.4�F) over the next 100 years, in addition to the 0.6�Ctemperature increase already observed during the 20th century. As presented
Fig. 1. Potential for increased hot weather due to global climate. Source: IPCC, 2001, ClimateChange, Third Assessment Report.
326 JAY S. GOLDEN
Dow
nloa
ded
by [
77.3
8.24
4.10
6] a
t 10:
57 2
2 A
pril
2014

in Figure 1, climate change in the form of global warming may increase
frequency of temperature extremes and the UHI effect may prolong the
duration of these events.
The first known documentation of the UHI is attributed to Luke Howard in
The Climate of London, Deduced from Meteorological Observations, Made in
the Metropolis and at Various Places around It in three volumes (Howard,
1833). As rural areas become urban, the region replaces existing vegetation
with paved surfaces, which results in the Sun’s energy heating the man-made
surfaces rather than being used for evapotranspiration (Taha, 1997). Urban–
rural temperature differences are usually greatest after sunset or overnight,
and smallest, sometimes even negative, after sunrise or during the morning or
early afternoon. The hottest temperatures are generally found in areas with the
least vegetation and the greatest urban development (heat island reduction
initiative, US Environmental Protection Agency, 2004). The urban environ-
ment, with its impervious paved surfaces and reduced vegetation, causes less
of the incoming radiant energy from the sun to be reflected from urban areas
and, likewise, less of this energy is converted to latent energy associated with
evaporation or transpiration of moisture. Compounding this effect is that the
larger volume of asphalt, brick, concrete, and other materials gives urban areas
a much higher thermal storage capacity than natural surfaces. One result is
that large amounts of energy are stored in the urban canopy during the day and
released after sunset – the hysteresis lag effect. Anthropogenic sources in the
urban environment generate additional heat by way of air conditioning,
automobiles, and machinery. Hence, urban temperatures tend to remain
relatively high into the evening hours (Oke, 1987; Sailor & Pavlova, 2003).
Hansen et al. (1998) estimate that albedo changes have resulted in a forcing
of �0.4 W m�2, about half of which is estimated to have occurred in the
industrial era. They performed a simulation with pre-industrial vegetation
replaced by current land-use patterns and found the global mean forcing to be
�0.21 W m�2, with the largest contributions coming from deforested areas in
Eurasia and North America. Assuming that half of the land clearance occurred
after the Industrial Revolution this equates to a forcing of �0.10 W m�2 by
land use over this period. These changes are mainly attributed to modifications
from existing landscape to man-made infrastructure which results in
decreasing surface albedo, as a result of roads and buildings. Increases in
cloud cover cause further localized reductions in the net surface short-wave
radiation in some regions. However, some areas exhibit higher temperatures
in their dry season, consistent with a decrease in evapotranspiration due to
THE URBAN HEAT ISLAND EFFECT 327
Dow
nloa
ded
by [
77.3
8.24
4.10
6] a
t 10:
57 2
2 A
pril
2014

reduced access of soil moisture. This would be consistent with an arid desert
climate.
In addition to anthropogenic heat, urban geometry has changed net
radiation and altered convection due to slowing winds near buildings (Voogt &
Oke, 1997). Changes in land use can also exert other kinds of climatic
impacts, for example, changes in roughness length, turbulent fluxes, soil
moisture, and heat budgets (IPCC, 2001).
Two types of UHI can be distinguished: (1) the canopy-layer heat island
and (2) the boundary-layer heat island (Oke, 1979). The canopy layer consists
of air between the roughness elements (e.g., streets) with an upper boundary
just below roof level. The boundary layer is situated above the canopy layer,
with the lower boundary subject to the influence of the urban surface (Weng &
Taylor, 2003). The focus of this paper is geared towards the complexities
within the urban canyon layer, which is roughly from ground to roof level
(Oke, 1987). This is the layer in which the engineered environment has the
most pronounced effect, as the airflow and energy exchanges are controlled by
microscale, site-specific characteristics (Arnfield, 2002). By contrast, the
urban boundary layer above the roof level is affected by the land-use zones
and mesoscale phenomenon and controlled by processes operating at larger
spatial and temporal scales (Oke, 1981, 1987). From an engineering perspec-
tive, more refined mesoscale modeling can be achieved by quantifying the
volumetric and climatic state of the man-made materials comprising the urban
region. Additionally, continued engineering schemes used in the ongoing
urbanization of the region can be modified to meet the sustainable
development trilogy. That is, by addressing the UHI, policy makers at all
levels will be able to craft policies, incentives and regulations that meet
economic, social and environmental imperatives.
4. PHOENIX, ARIZONA AS A PLATFORM OF STUDY
The State of Arizona, located in the southwest corner of the United States, is
famous for one of the Seven Wonders of the World, the Grand Canyon. It is the
sixth largest state in land area (113,635 square miles) in the United States.
Arizona is an arid land with average annual rainfall varying from three inches
in Yuma in the southwest corner to seven inches in Phoenix in the center of the
state. At statehood in 1912, Arizona was populated by approximately 200,000
people and had a population density of two people per square mile. Over the
328 JAY S. GOLDEN
Dow
nloa
ded
by [
77.3
8.24
4.10
6] a
t 10:
57 2
2 A
pril
2014

last 100 years, the ratio between Arizona’s rural and urban populations has
essentially reversed. In 1900, less than 20% of the state’s population lived in
an urban setting; in 2000, more than 88% live in an urban setting.
Since 1990, the fastest growing region in the United States has been the West,
increasing by 19.7% or 10.4 million people, to total 63.2 million (US Census,
2002). Of the top 10 US cities by per cent of population growth from 1990 to
2000, six are Western cities, with Arizona at a 40% growth rate. Phoenix,
Fig. 2. The rapid urbanization of the greater Phoenix region from 1912 to 1995. Source:CAP LTER, 1998.
THE URBAN HEAT ISLAND EFFECT 329
Dow
nloa
ded
by [
77.3
8.24
4.10
6] a
t 10:
57 2
2 A
pril
2014

Arizona which dates back to 700 AD when the region was home to the Pueblo
Indians, is now the nation’s fifth-largest city, recently overtaking Philadelphia in
population, as presented in Figures 2–4. The regional population increased from
1,600,000 in 1980 to 2,238,000 in 1990; the population reached 3,379,000 as of
July 2001, an annual gain of 101,400 people since 1990 (Housing and Urban
Development, 2002).
The city of Phoenix is now larger than Los Angeles, California in geographic
extent, surpassing 484 square miles. The region lacks a well developed and
mature urban downtown core. Rather the region is defined by multiple cities and
towns which connect to the city of Phoenix via a distribution network of roads
Fig. 3. US Census population data for Phoenix, Arizona (bottom line) and Maricopa County(top line). Source: US Census (2000).
Fig. 4. Density changes in the 15 largest US metropolitan areas 1982–1997. Source: BrookingInstitution (2001) and Solimar Research Group (2001).
330 JAY S. GOLDEN
Dow
nloa
ded
by [
77.3
8.24
4.10
6] a
t 10:
57 2
2 A
pril
2014

and highways. Researchers have examined multiple ASTER satellite thermal
imagery and identified that roads, highways and parking lot pavements form the
largest percentage of the man-made urban fabric with the highest nocturnal
surface temperatures in the region as a function of the hysteresis lag effect.
The study area of the greater Phoenix region comprises the two county
region of Maricopa and Pinal of central Arizona (146,000 square miles,
37,813 km2). The rapid urbanization of the region also brings a multiple set of
population research parameters including increased density of housing.
Phoenix led the major 15 metro areas in the United States in the percentage
change of urbanized density from 1982 to 1997 (Fulton, Pendall, Nguyen, &
Harrison, 2001). In part this can be explained as a function of the expanding
geographic region dominated by closely built single-family housing units.
As depicted by actual climate readings in Figure 6, the semi-tropical region
of Phoenix, Arizona is characterized by a daytime oasis effect and a very
strong hysteresis lag effect at night. Daytime temperatures in comparison to
the desert rural setting in Phoenix are influenced by urbanization as well as by
Fig. 5. ASTER thermal imagery isolating the top 20% temperature range for the surface of thePhoenix region. Sky Harbor International Airport as well as the network of roads,highways and corner shopping centers present the highest volume of the man-madeurban fabric with elevated surface temperatures (source: Stefanov & Golden, 2003).
THE URBAN HEAT ISLAND EFFECT 331
Dow
nloa
ded
by [
77.3
8.24
4.10
6] a
t 10:
57 2
2 A
pril
2014

the addition of residential and agricultural irrigation (Balling & Brazel, 1989).
The urban portions have a pronounced higher maximum minimum mean than
the rural area �Tu� r which is the UHI effect (Bornstein, 1987; Chandler,
1965; Landsberg, 1981; Oke, 1987). Over the 20th century, average annual
temperatures in the arid subtropical Phoenix region (33�260N, 112�W) have
increased 3.1�F (Brazel, Selover, Vose, & Heiser, 2000). However the urban
portions of the region have realized mean annual temperature increases of
7.6�F, a rate of three times the total region mean increase.
A comparison of the Phoenix region annual minimum high temperatures to
a representative rural setting (Figure 7) presents a very pronounced UHI effect
that corresponds to the rapid urbanization of the urban region. Official daily
temperatures from the National Weather Service Station at Phoenix Sky
Harbor International Airport were compared with those from the National
Park Service Casa Grande Ruins, the first national archaeological preserve in
the United States. This rural site is located approximately 60 miles southeast
of Phoenix and has remained rural in characteristic with a native desert setting
and vegetation (creosote bush, white buresage and salt bush). The temperature
readings at the airport (urban setting) reflects the change in location of the
weather station within the boundaries of the airport in 1978 (central), 1994
(northeast of runways) and 1997 (south of the runways).
Fig. 6. The Phoenix region UHI effect presenting a daytime oasis effect and a night-timehysteresis lag effect (source: Zehnder & Golden, 2004).
332 JAY S. GOLDEN
Dow
nloa
ded
by [
77.3
8.24
4.10
6] a
t 10:
57 2
2 A
pril
2014

The 0.86�F per decade warming rate for Phoenix is one of the highest in the
world for a population of its size and can be compared with other cities to
highlight the effects of rapid urbanization in the region. For example, Los
Angeles’s rate was 0.8�F per decade; San Francisco, 0.2�F per decade;
Tucson, 0.6�F per decade; Baltimore, 0.2�F per decade; Washington, 0.5�F per
decade; Shanghai, 0.2�F per decade; and Tokyo, 0.6�F per decade (Hansen
et al., 1999).
Phoenix has an average of 89 days per year of greater than 100�F (37.7�C)
and has experienced 143 days of greater than 100�F (37.7�C) as recently as
1989. The region reaches extremely hazardous temperatures as evidenced with
an official daytime high of 122�F (50.4�C) in 1990 and 121�F (49.4�C) in 1995.
These late day/early evening spikes, in conjunction with the hysteresis diurnal,
weekly and monthly heat storage lags, amplify the UHI effect. Additionally,
the influences of the engineered urban fabric, including the projection of
anthropogenic heat sources can further exacerbate the complete diurnal cycle.
5. SUSTAINABLE IMPERATIVES AND THE UHI
Roseland (1997) argued that sustainable cities represent an ethical goal and
direction for a community but that planners who use the sustainable
development trilogy (environmental, economic and social imperatives) have
found much inspiration but little guidance. Policy makers need a hierarchical
Fig. 7. Rapid urbanization and the Phoenix, Arizona regional UHI.
THE URBAN HEAT ISLAND EFFECT 333
Dow
nloa
ded
by [
77.3
8.24
4.10
6] a
t 10:
57 2
2 A
pril
2014

mitigation scheme or set of indicators to address the UHI effect within a
sustainable development context. Researchers from Arizona State University
and the Cambridge-MIT Institute (CMI) sponsored Engineering for Sustain-
able Development Programme at the University of Cambridge have under-
taken a joint multi-disciplinary effort to further understand the dynamics of
urban climate and the UHI effect as well as to examine mitigation strategy
alternatives that can be deployed by policy makers in rapidly urbanizing
regions globally.
A first step in this process is to understand the initial impacts, both positive
and negative, in regards to the pronounced UHI effect in the Phoenix region
(Figure 8). Secondly, researchers will volumetrically and spatially identify the
various man-made and natural geologic/vegetative materials that comprise
the urban fabric of the Phoenix region via remote sensing and on-site
documentation. Thirdly, the research will identify which existing surface
materials independently and by their 3-D arrangement induce the most
retained heat and therefore experience the most hysteresis lag effect of heat
storage over a 24 h period – hence explaining the UHI. Fourth, researchers will
undertake an extensive evaluation of existing and emerging materials and
technologies that can potentially mitigate the hysteresis lag effect. Those
results will be modeled in step 6 from the micro-scale to the local scale and
eventually on a mesoscale interaction model.
Finally, working with community stake-holders on an international basis, a
hierarchical mitigation structure will be developed based on environmental,
economic and social considerations. This will take the form similar to a Life
Cycle Management guidebook. During initial evaluations of Phoenix,
researchers have identified multiple impediments to achieving a sustainable
balance between rapid urbanization and quality of life. Phoenix is:
� moving into the seventh consecutive year of drought in an already arid
region of less than 7 inches of rain per year;
� a federal non-attainment area for ground-level ozone;
� seeing increased costs of electricity and fuel; and
� experiencing increasing levels of childhood and adult obesity – potentially
worsened by the influence of high temperatures throughout the diurnal
cycle which limit the ability to be outdoors.
Understanding these regional imperatives allow researchers to undertake the
development of strategies to mitigate the UHI in respect to the sustainable
imperatives of environment, economics and social well being.
334 JAY S. GOLDEN
Dow
nloa
ded
by [
77.3
8.24
4.10
6] a
t 10:
57 2
2 A
pril
2014

5.1. Water ResourcesThe US Southwest provides a compelling example of the importance of
understanding the linkages between climate, water resources and society
(Morehouse, 2000). This paper expands that concept to include that society’s
selection and use of engineered materials and the resultant UHI effect also
provides an understanding of the integrated sciences of climate and water
resources, utilizing the arid Phoenix region as an example for global arid
regions.
The Phoenix region, which lies in the Sonoran Desert, receives an aver-
age of 18 cm per year of rainfall (Figure 9). However, as a result of 6 years
of below-average precipitation including 2002, which was the driest water
year for many parts of the state, Arizona Governor Napolitano signed
Executive Order 2003–12, establishing the Arizona Drought Task Force, on
20 March 2003 (McPhee et al., 2004). The Executive Order requires that a
short-term drought plan be prepared to respond to potable water needs, as
well as non-potable needs for agricultural operations, wildlife and wildfire
mitigation. The Order also requires that the State develop a long-term,
comprehensive plan to provide for drought planning efforts throughout
the state and a coordinated response framework. This longer-term effort is
Fig. 8. The potential impacts associated with UHI (source: Golden, 2004).
THE URBAN HEAT ISLAND EFFECT 335
Dow
nloa
ded
by [
77.3
8.24
4.10
6] a
t 10:
57 2
2 A
pril
2014

intended to recognize and build upon existing drought efforts, and reduce
the impact of drought on economic activities, communities and habitat
throughout the state. The final major assignment is the development of a
conservation strategy that focuses on education, technology transfer and
assistance.
Approximately 70% of Phoenix’s municipal water (from surface and
groundwater supplies) is used for landscape irrigation at a per capita water
consumption of 880 l per day, among the highest in the world (Baker et al.,
2004). Preliminary research of residential water usage has indicated that the
hysteresis lag effect does influence the amount of water consumed. This takes
into consideration the evaporation rate of water from residential pools and
irrigation as well as potable water usage in households (Figure 10). The city of
Tempe was selected as a study area since it is a mature and landlocked
community with minimal household census growth. Further research is
seeking to quantify the water use impacts of the UHI hysteresis lag effect as a
function of urbanization.
Fig. 9. US seasonal drought outlook 2004 (source: National Oceanic and AtmosphericAdministration).
336 JAY S. GOLDEN
Dow
nloa
ded
by [
77.3
8.24
4.10
6] a
t 10:
57 2
2 A
pril
2014

5.2. EnergyThe hysteresis lag effect as a function of the UHI promotes the use of
additional power consumption for mechanical cooling in buildings (Figure 11).
Where historically, Phoenix residents were able to reduce the demand for
night-time mechanical cooling as temperature decreased, they now must rely
on mechanical cooling through a greater portion of the diurnal cycle as a result
of the hysteresis lag. The first consequence is that the residential and
commercial sector accounts for about one-third of carbon emissions from
fossil-fuel combustion. Its share of the total emissions has increased at 1.8%
since 1971, which is faster than in other sectors (Price et al., 1998). Despite
improved technology and the adoption of improved technology in many
countries, energy use in buildings has grown more rapidly than total energy
demand from 1971 to 1995, with commercial building energy registering the
greatest annual percentage growth (3.0% vs 2.2% in residential buildings,
IPCC, 2001).
Additionally, increased power consumption due to the UHI results in the
additional usage of water. The arid Phoenix region is primarily served by
thermoelectric power generation. The major energy sources in Arizona for
2002 were coal (40.3%) and nuclear (32.8%). Coal-derived electricity is
primarily generated by the SRP Navajo plant (2,250 MW), APS Cholla plant
(995 MW), SRP Coronado (785 MW) and the SRP Agua Fria plant (626 MW).
The nation’s largest nuclear power plant, APS Palo Verde (three pressurized
light water reactors) is located just west of the Phoenix metropolitan region
with a generation capacity of 3,733 MW, which can serve 4 million customers.
Conventional power plants use large amounts of water for the condensing
Fig. 10. A linear trend analysis of residential water usage and minimum temperature (source:Golden, 2004).
THE URBAN HEAT ISLAND EFFECT 337
Dow
nloa
ded
by [
77.3
8.24
4.10
6] a
t 10:
57 2
2 A
pril
2014

portion of the thermodynamic cycle. For coal plants, water is also used to
clean and process fuel. The total consumptive use of water for thermoelectric
power plants in the western US has a range of 1.4 l per kWh to 2.3 l per kWh
(Gipe, 1995; Torcellini et al., 2004). This takes into consideration that ther-
moelectric power plants use approximately 5% of their gross generation to
power equipment as well as additional distribution and line losses (Energy
Information Administration, 1996).
In Arizona, thermoelectric power water withdrawals in 2000 equaled
74 million gallons per day (MG per day) of groundwater and 26 MG per day of
surface water – the equivalent of 113,000 acre-fee per year (US Geological
Survey, 2004a, 2004b). One effort towards sustainability has been implemented
by the operators of Palo Verde Nuclear Generating Station (PVNGS) who
utilize tertiary treated water from the main wastewater treatment plant for the
Phoenix region. In 1999, the water reclamation facility at PVNGS received a
total of 22,558,664,730 gallons of treated effluent. UHI researcher goals are to
identify designs, materials and technologies which minimize electricity
demands for cooling via UHI mitigation – a more proactive sustainable
engineered approach.
Beyond water usage, increased electricity generation by power plants as a
result of the UHI leads to higher emissions of sulfur dioxide, carbon
monoxide, nitrous oxides, and suspended particulates, as well as CO2, a
greenhouse gas known to contribute to global warming and climate change.
The increased use of fossil fuels to support mechanical cooling will no doubt
play a key role in the development of urbanizing regions in developing
countries that encounter the UHI effects. China witnessed its initial production
Fig. 11. Peak electricity demand and the impact of temperatures to cooling degree days.
338 JAY S. GOLDEN
Dow
nloa
ded
by [
77.3
8.24
4.10
6] a
t 10:
57 2
2 A
pril
2014

of those household air conditioners in the year 1978 when no more than 223
air conditioners of this type were manufactured. However, restricted by the
capacity of production and development as well as the industrial policies of
China, the total production in 1980 remained less than 20 thousand. In the
1990s, especially during the recent years, the industry of household air
conditioners has undergone such a dramatic expansion that the total
production soared to 0.22 million in 1990, to 18.2667 million in 2000 and
to 23.1288 million in 2001, during which the annual increase has remained
above 20%. Today, the production of air conditioners (for both domestic use
and export) in China has approximated one-third of the global total (Air
Conditioning Industry Report, 2002).
5.3. HealthBecause extremes of summertime heat are thought to have a greater impact on
human health than any other form of severe weather in the US (Changnon
et al., 1996), more frequent occurrences of extreme heat as a function of the
UHI will have important global public health implications. This consequence
was evident by the estimated 35,000 people who died during the European
heatwave of August 2003 (see Table 3) and the Chicago heatwave in July
Table 3. The human toll of heat waves: selected examples from Europe in August 2003.Source: Earth Policy Institute (2003).
Country Fatalities Other details
France 14,802 Temperatures soared to 104�F in parts of the country; temperaturesin Paris were the highest since record-keeping began in 1873
Germany 7,000 High temperatures of up to 105.4�F, the hottest since records beganin 1901, raised mortality some 10% above average
Spain 4,230 High temperatures coupled with elevated ground-level ozoneconcentrations exceeding the European Union’s health-risk threshold
Italy 4,175 Temperatures in parts of the country averaged 16�F higher thanprevious year
UK 2,045 The first triple-digit (Fahrenheit) temperatures were recorded inLondon
Netherlands 1,400 Temperatures ranged some 14�F warmer than normalPortugal 1,316 Temperatures were above 104�F throughout much of the countryBelgium 150 Temperatures exceeded any in the Royal Meteorological Society’s
records dating back to 1833
Total 35,118
THE URBAN HEAT ISLAND EFFECT 339
Dow
nloa
ded
by [
77.3
8.24
4.10
6] a
t 10:
57 2
2 A
pril
2014

1995, which is thought to have caused 465 deaths (Kunkel et al., 1996, Larsen,
2003). Heatwaves claim more lives each year than floods, tornadoes and
hurricanes combined (McMichael and Beaglehole, 2000).
The Chicago heatwave of 13–16 July 1995 (3-day average mean
temperature of 91.16�F or 32.86�C) death toll was in part contributed by
elevated temperatures and a loss of electricity to over 49,000 households. A
similar risk for the Phoenix region can best be presented by evaluating the
region’s diurnal temperatures from 14–16 July 2003. The Phoenix region
experienced sustained diurnal temperatures (with humidity variance) for the
3-day period with an average mean temperature of 104.67�F (40.37�C).
During one diurnal cycle, the minimum temperature was 96�F (35.5�C) and
the following day (16 July 2004) had a maximum of 117�F (47.2�C). The
region was fortunate to have a robust electricity system that could serve this
peak demand. Without the impact of lost residential electricity, the number of
heat-related deaths in Arizona for the period of 1992–2002 reached 570. The
distribution of those deaths trends with the summer months of increased
temperatures. Although a portion of the deaths are as a result of illegal
Fig. 12. Deaths from excessive natural heat in Arizona (source: Arizona Department of HealthServices – Bureau of Public Statistics).
340 JAY S. GOLDEN
Dow
nloa
ded
by [
77.3
8.24
4.10
6] a
t 10:
57 2
2 A
pril
2014

migration through the desert outside of Phoenix, the largest percentage of
deaths during this period are from Arizona residents (Figure 12). It was found
that 60.3% of the resident deaths occurred in the Central counties of the state
(Phoenix region) during the study period. In addition to heat deaths, the City
of Phoenix Fire Department reported over 500 heat-related incidents in 2001
alone (ADHS, 2002).
The temperature impacts associated with the UHI are increased by the
selection of engineered materials deployed in the urban regions. Anthro-
pogenic resiliency in our modern world is heavily dependent on mechanical
cooling systems. Interruptions of these systems as a result of peak demand,
storm events or malicious activity can result in catastrophic impacts. As
regional population and the UHI increase, the risk of a power outage is real.
It is unknown how many heat-related deaths the region might experience if
there were to be a loss of household electricity. Similar for developing coun-
tries that will rapidly urbanize yet do not have the same robust electrical
infrastructure.
Finally, regional health in global settings that experience summer daytime
heat islands can be impacted as the daytime UHI often accelerates the
formation of harmful smog, as ozone precursors such as nitrous oxides (NOx)
and volatile organic compounds (VOCs) combine photochemically to produce
ground-level ozone (SOS, 1995).
5.4. Societal FactorsBoth anthropogenic influences and mitigation strategies in regards to the UHI
must account for societal influences. Arizona as a border state to Mexico and
the developing countries of Latin and South America showed a net positive
migration of 113,527 Hispanic immigrants for the period of 1995–2000. This
number is the largest for any mountain or pacific state excluding California
(US Census, 2003, Special Report). The number also does not reflect un-
documented migrants. For the greater Phoenix region, Hispanics/Latinos
represent 24.8% of the regional population and that percentage is expected to
grow. The region is also home to 21 Native American tribes, whose sovereign
Nations comprise over a quarter of the state land including areas within the
Phoenix region. The opportunities to develop mitigation strategies for the
region must reflect these yet to be defined varied and changing demographic
realities. Similarly, as regions around the globe face variations of the UHI
effect (daytime, nighttime or a combination), the parameters that reflect the
societal influences must be accounted for in the mitigation process.
THE URBAN HEAT ISLAND EFFECT 341
Dow
nloa
ded
by [
77.3
8.24
4.10
6] a
t 10:
57 2
2 A
pril
2014
Governmental and communal institution plans for managing urban growth
impact society in many ways, with the burden of urban environmental
problems invariably falling disproportionately on the poor or disadvantaged
(Hardoy et al., 1992). This inequity can be manifested in the inability to have
safe water or secure solid-waste disposal. In regards to the Phoenix regional
UHI effect, social economics come into play when those who cannot afford
the capital costs or operating costs of air conditioning or climate-controlled
shelter can face increased risks of extreme heat. Additionally, the influence of
affluence on the inability to mitigate the UHI as a result of construction
methods, spatial design, technologies, and purchasing power for shelter and
urban landscape/forestry need to be examined. Research in the Phoenix region
indicates that socioeconomic status is a useful predictor of perennial
landscape vegetation in residential neighborhoods and that the lower eco-
nomic neighborhoods will have lower amounts of residential landscape – a
potential low-cost micro-scale UHI mitigation strategy (Hope et al., 2003;
Martin et al., 2003).
5.5. EconomicsRecent research has indicated that if current UHI mitigation strategies could
realize a 1.8–3.6�F decrease in average temperature, the annual energy
savings could reach $26 million for three demonstration US cities (Konopacki
& Akbari, 2000). In areas of high solar capacity, such as the desert southwest,
modeling the adaptation of renewables such as photovoltaics within
mitigation strategies merits due to the enhanced benefits to the environment.
According to an EPA report (US Environmental Protection Agency, 2001), the
heat island in Los Angeles, California raises ozone concentrations by 10–15%
and contributes to millions of dollars in medical expenses due to respiratory
and other problems. The same report indicates that heat-island reduction
measures could alleviate $360 million per year of the city’s smog-related
expenses. In the arid southwest, extreme temperatures present other sets of
economic impacts. As one example, the US Federal Aviation Administration
requirements restrict planes from taking off when temperatures reach 120�F(48.9�C) due to a lack of appropriate procedures. The economic impacts are
significant for the region since Phoenix Sky Harbor International Airport is the
fifth busiest airport in the world for takeoffs and landings and contributes over
$20B (US) annually to the region. The first such restriction occurred when
temperatures reached 122�F (50�C) on 26 June 1990 and halted airport
operations.
342 JAY S. GOLDEN
Dow
nloa
ded
by [
77.3
8.24
4.10
6] a
t 10:
57 2
2 A
pril
2014

6. MITIGATION
The changing dynamics of increased urbanization has resulted in the transition
toward a more man-made and engineered infrastructure. The resulting change
in energy balance and increase of anthropogenic heat has led to the creation
of UHIs. Various studies have advanced three primary mitigation strategies:
(1) urban forestry, (2) cool roofs and (3) cool pavements.
Urban forestry is touted as a means to increase evapotranspiration while
providing daytime shading (Pielke & Avissar, 1990; US Environmental
Protection Agency, 2003; urban forests – McPherson, 1994, 2001). Examples
of its application include direct shading of housing (south and west) to provide
shade. Additionally, many jurisdictions are incorporating urban tree planting
in parking lots to reach a 50% canopy coverage in the lots. The Lawrence
Berkeley National Laboratory has estimated that within 10–15 years – the
time it takes a tree to grow to a useful size – trees placed in strategic locations
will reduce heating and cooling costs by an average of 10–20%. Yet, in an arid
region, the issues of water balance are essential in evaluating regional policies
and ordinances as are the issues of night-time radiation trapping due to the
canopy effect.
Reflective paving (Ting & Koomey, 2001) has also recently been
introduced into the mitigation hierarchy. Two mechanisms for creating a
cool pavement are increased surface reflectance, which reduces the solar
radiation absorbed by the pavement, and increased permeability, which cools
the pavement either through increased convection, lower thermal storage or
evaporation of water.
Cool roofing (Akbari & Sezgen, 1993; Bretz & Akbari, 1997; Parker et al.,
1994) is another form of UHI mitigation. This approach has modeled the
impacts of increasing albedo on rooftops (Bass et al., 2002). Akbari’s research
found that black roofs typically have a 6% rate of reflectivity and low emis-
sivity values while highly reflective white roof membranes can have reflec-
tivity and emissivity values greater than 80%.
As strong as each of the above listed and other mitigation techniques might
be at a given demonstration location, for any of these strategies to be effective
in national or international context, they must be vetted in association with the
given localized economic, environmental and social structure of a community.
Global arid regions such as Phoenix, Arizona face water balance questions
that could preclude the utilization of a given mitigation strategy such as
increased urban forestry. Urban forestry mitigation would require extensive
THE URBAN HEAT ISLAND EFFECT 343
Dow
nloa
ded
by [
77.3
8.24
4.10
6] a
t 10:
57 2
2 A
pril
2014

planting of new and potentially non-native vegetation throughout the region.
However, this mitigation strategy should be balanced by the potential benefit
via increased carbon sequestration gained from an increase in regional
vegetation. This benefit is important as the Phoenix region has a well
documented CO2 dome (Idso & Balling, 2001). Additionally, for any
mitigation policy or regulation to be effective, there must be a mechanism for
its implementation with funding a major obstacle.
7. DISCUSSION
Policy makers in urbanized and urbanizing regions can create opportunities to
reduce the coupled impacts associated with rapid urbanization and changing
urban climates as exemplified by the UHI effect. These opportunities can be
based upon sound science and engineering and with a strong economic
foundation (Figure 13). However, for policy makes on an international basis to
Fig. 13. The influence of the engineered environment and urbanization (adopted fromMeadows, 1992).
344 JAY S. GOLDEN
Dow
nloa
ded
by [
77.3
8.24
4.10
6] a
t 10:
57 2
2 A
pril
2014

garner multi-party consensus within the construct of their geo-political bound-
aries, understanding UHI causation and mitigation strategies should be presen-
ted in an integrative and interdependent manner. Potential UHI impacts based
on the geographic and economic complexities are presented in Figure 13.
Research to date has been structured to gain a greater understanding of the
complexities of the UHI effect with respect to mesoscale interactions
primarily at the urban boundary layer (Brazel, 2003; Oke, 1987). The
interdependencies and interactions of the built environment with climatic and
atmospheric sciences is a driving basis for the variations in the severity of the
UHI effect. However, for policies to be developed and implemented at the
local level, there must be an understanding of materials, technologies and
practices which are under the control of the policy-making branch. There
currently exists an opportunity within the engineering and scientific
communities to develop a robust understanding of the coupled volumetric
and material make-up of surface materials within an urban region and their
impacts on the UHI effect. This multi-disciplinary research effort aims to
develop engineering-based policies constructed in a holistic framework based
on environmental, social and economic sustainable imperatives for use by
communities around the globe.
ACKNOWLEDGEMENTS
The author expresses his sincere appreciation to Professor Peter Guthrie, Director of the Centrefor Sustainable Development at the University of Cambridge, Department of Engineering andDr Anthony Brazel, Department of Geography and the Center for Environmental Studies atArizona State University for their ongoing insights and support.
REFERENCES
ADHS. (2002). Operation heat wave. Phoenix, AZ: Arizona Department of Health Services.Air Conditioning Industry Report. (2002). The research report on China’s air conditioner
industry. All China Marketing Research Co. Ltd jointly with Asia Information.Shanghai, PR China: Friedl Business Information Partners Publishers.
Akbari, H., & Sezgen, O. (1993). Energy efficiency and the environment: Innovative ways toimprove air quality in the Los Angeles basin. Berkeley, CA: Lawrence Berkeley NationalLaboratory.
Arnfield, A.J. (2002). Two decades of urban climate research: A review of turbulence,exchanges of energy and water, and the urban heat island. International Journal ofClimatology, 23, 1–26.
THE URBAN HEAT ISLAND EFFECT 345
Dow
nloa
ded
by [
77.3
8.24
4.10
6] a
t 10:
57 2
2 A
pril
2014

Arnfield, A.J., Herbert, J.M., & Johnson, G.T. (1999). Urban canyon heat source and sinkstrength variations: A simulation-based sensitivity study. Sydney: Congress ofBiometerology and International Conference on Urban Climate, WMO.
Baker, L.A., Brazel, A.T., & Westerfhoff, P. (2004). Environmental consequences of rapidurbanization in warm, arid lands: Case study of Phoenix, Arizona (USA). In Sustainablecities 2004 – Sienna, Italy.
Balling, R.C., & Brazel, S.W. (1989). Time and space characteristics of the Phoenix urban heatisland. Journal of the Arizona–Nevada Academy of Science, 21, 75–81.
Bass, B., Krayenhoff, S., & Martilli, A. (2002). Mitigating the urban heat island with green roofinfrastructure. Urban Heat Island Summit: Toronto.
Bornstein, R. (1987). Mean diurnal circulation and thermodynamic evolution of urbanboundary layers. In Modeling the urban boundary layer, American MeteorologicalSociety, Boston, MA, pp. 52–94.
Brazel, A. (2003). Future climate in central Arizona: Heat and the role of urbanization(Research Vignette No. 2). Tempe, AZ: Consortium for the Study of Rapidly UrbanizingRegions.
Brazel, A., Selover, N., Vose, R., & Heiser, G. (2000). The tale of two climates – Baltimore andPhoenix urban LTER sites. Climate Research, 15, 123–135.
Bretz, S., & Akbari, H. (1997). Long-term performance of high-albedo roof coatings. Energyand Buildings – Special Issue on Urban Heat Islands and Cool Communities, 25,159–167.
Brundtland, G. (Ed.). (1987). Our common future: The World Commission on Environment andDevelopment. Oxford: Oxford University Press.
CAP LTER. (1998). Central Arizona Phoenix – Long Term Ecologica Research.Carlson, R.L. (1962). Silent spring. Boston, MA: Houghton Mifflin.Chandler, T.J. (1965). The climate of London. London: Hutchinson.Changnon, S.A., Kunkel, K.E., & Reinke, B.C. (1996). Impacts and responses to the 1995
heat wave: A call to action. Bulletin of the American Meteorological Society, 77,1497–1506.
Earth Policy Institute. http://www.earth-policy.org/updates/update29_data.htmEnergy Information Administration. (1996). Electric Power Annual 1995. U.S. Department of
Energy: Washington D.C.Erlich, P.R. (1968). The population bomb. New York: Ballantine Books.Fulton, W., Pendall, R., Nguyen, M., & Harrison, A. (2001). Who sprawls most? How growth
patterns differ across the U.S. Washington, DC: The Brookings Institution, Center onUrban and Metropolitan Policy.
Gipe, P. (1995). Wind energy comes of age. Hoboken: John Wiley & Sons.Grimmond, C.S.B., & Oke, T.R. (1999). Aerodynamic properties of urban areas derived from
analysis of surface form. Journal of Applied Meteorology, 38, 1262–1292.Hansen, J.W., Hodges, A.W., & Jones, J.W. (1998). ENSO influences on agriculture in the
southeastern US. Journal of Climate, 11, 404–411.Hardoy, J., Mitlin, D., & Satterthwaite, D. (1992). Environmental problems in third world cities.
London: Earthscan.Heisenberg, W. (1927). Uber den anschaulichen Inhalt der quantentheoretischen Kinematick
und Mechanik. Zeitschrift fur Physik, 43, 172–198.Hinrichsen, D., Blackburn, R., & Robey, B. (2002). Population growth and urbanization: Cities
at the forefront. Baltimore, MD: Johns Hopkins University.
346 JAY S. GOLDEN
Dow
nloa
ded
by [
77.3
8.24
4.10
6] a
t 10:
57 2
2 A
pril
2014

Hope, D., Zhu, W., Gries, C., Oleson, J., Kaye, J., Brimm, N.B., Jenerette, D., & Kinzig, A.(2003). Spatial variation in soil nitrate concentrations across an urban ecosystem.Knoxville, TN: Urban Ecosyst.
Housing and Urban Development. (2002). American housing survey for the Phoenixmetropolitan area: 2002. Current housing reports. Washington, DC: US Departmentof Housing and Urban Development – Office of Policy Development and Research.
Howard, L. (1833). The climate of London, deduced from meteorological observations, made inthe metropolis and at various places around it.
Idso, C.D., & Balling, R.C. (2001). An intensive two-week study of an urban CO2 Dome.Atmospheric Research, 35, 995–1000.
IPCC. (1990). In J. Houghton, J. Jenkins, & J. Ephraums (Eds.), IPCC first assessment report.Scientific assessment of climate change – report of working group I. Cambridge:Cambridge University Press.
IPCC. (1995). In J. Houghton, L. Meira Filho, B. Callender, N. Harris, A. Kattenberg, &K. Maskell (Eds.). IPCC second assessment report. Climate change 1995: The science ofclimate change. Cambridge: Cambridge University Press.
IPCC. (2001). In J. Houghton, Y. Ding, Y. Griggs, M. Noguer, P. van der Linden, & D. Xiaosu(Eds.), Climate change 2001: The scientific basis. Contribution of Working Group I tothe Third Assessment Report of the Intergovernmental Panel on Climate Change.Cambridge: Cambridge University Press.
Konopacki, S., & Akbari, H. (2000). Energy savings calculations for heat island reductionstrategies in Baton Rouge, Sacramento and Salt Lake City. Berkeley, CA: LawrenceBerkeley National Laboratory, LBNL-45368.
Kunkel, K.E., Changnon, S.A., Reinke, B.C., & Arritt, R.W. (1996). The July 1995 heat wave inthe Midwest: A climatic perspective and critical weather factors. Bulletin of theAmerican Meteorological Society, 77, 1507–1518.
Landsberg, H.E. (1981). The urban climate (Vol. 28). International Geophysical Series.London: Academic Press.
Larsen, J. (2003). Record heatwave in Europe takes 35,000 lives – For greater losses may lieahead. Earth Policy Institute.
Martin, C.A., Warren, P., & Kinzig, A.P. (2003). Neighborhood socioeconomic statusis a useful predictor of perennial landscape vegetation in residential neighbor-hoods and embedded small parks of Phoenix, AZ. Landscape and UrbanPlanning. (DOI: 10.1016/j.landurbplan.2003.10.034, published online 14 December2003).
McMichael, A.J., & Beaglehole, R. (2000). The changing global context of public health.Lancet, 356, 495–499.
McMichael, A.J., Butler, C., & Ahern, M.J. (2002). Environment as a global public good forhealth. In R. Beaglehole, N. Drager, & R. Smith (Eds.), Global public goods for health,World Health Organization and United Nations Development Programme Collaboration.Oxford: Oxford University Press.
McPhee, J., Comrie, A., & Garfin, G. (2004). A climatology of drought for Arizona. In 84thAnnual Meeting of the American Meteorological Society Proceedings, Seattle.
McPherson, E.G. (1994). Cooling urban heat islands with sustainable landscapes. InH.P. Rutherford, R.A. Rowntree, & P.C. Muick (Eds.), The ecological city: Preserv-ing and restoring urban biodiversity (pp. 161–171). Amherst: University ofMassachusetts Press.
THE URBAN HEAT ISLAND EFFECT 347
Dow
nloa
ded
by [
77.3
8.24
4.10
6] a
t 10:
57 2
2 A
pril
2014

McPherson, E.G. (2001). New advances in quantifying the environmental benefits oftrees. In G.A. Bradley (Ed.), Investing in natural capital: Proceedings of the 2001urban-forest conference; 2001 September 5–8; Washington DC: American Forests:20–22.
Meadows, D.L., Meadows, D.H., & Ronders, J. (1993). Beyond the limits: Confronting globalcollapse, envisioning a sustainable future. Chelsea Green Publishing, Vermont.
Morehouse, B.J. (2000). Climate impacts on urban water resources in the southwest:The importance of context. Journal of the American Water Resources Association,36, 265–277.
Oke, T.R. (1979). Review of urban climatology, 1973–1976. WMO Technical Note no. 169.WMO No. 539. Geneva: World Meteorological Organization.
Oke, T.R. (1981). Canyon geometry and the nocturnal heat island: Comparison of scale modeland field observations. Journal of Climatology, 1, 237–254.
Oke, T.R. (1987). Boundary layer climates (2nd ed.). London: Routledge.O’Meara, M. (1999). Reinventing cities for people and the planet (Worldwatch Institute
paper 147). Washington, DC, Worldwatch Institute, 1999. Retrieved 9 July 1999 from:http://www.worldwatch.org/pubs/paper/147.html
Parker, D.S., Barkaszi, S.F., & Sonne, J.K. (1994). Phase II: measured cooling energy savingsfrom reflective roof coatings applied to Florida residences, FSEC-CR-111-94. CapeCanaveral, FL: Florida Solar Energy Center.
Pielke, R.A., & Avissar, R. (1990). Influence of landscape structure on local and regionalclimate. Landscape Ecology, 4, 133–135.
Price, L., Michaelis, L., Worrell, E., & Khrushch, M. (1998). Sectoral trends and driving forcesof global energy use and greenhouse gas emissions. Mitigation and AdaptationStrategies for Global Chang, 3, 263–319.
Roseland, M. (1997). Dimension of the eco-city. Cities, 14, 197–202.Sailor, D.J., & Pavlova, A. (2003). Air conditioning market saturation and long term response of
residential cooling energy demand to climate change. Energy – the InternationalJournal, 28, 941–951.
Samuels, R. (2003). Urban heat islands. Submission to House of Representatives Standing Com-mittee on Environment and Heritage Sustainable Cities 2025 Inquiry, Sydney, Australia.
SOS. (1995). The state of the southern oxidants study: Policy-relevant findings in ozonepollution research 1984–1994. Raleigh, NC: Southern Oxidants Study.
Taha, H. (1997). Modeling the impacts of increased urban vegetation on the ozone air quality inthe south coast air basin. Atmospheric Environment, 30, 3423–3430.
Taha, H., Sailor, D., & Akbari, H. (1992). High-albedo materials for reducing building coolingenergy use. Berkeley, CA: Lawrence Berkeley National Laboratory Report No. 312721UC-350: 71.
Ting, M., & Koomey, J. (2001). Preliminary evaluation of the lifecycle costs and marketbarriers of reflective pavements. Berkeley, CA: Lawrence Berkeley National Laboratory,LBNL-45864.
Torcellini, P., Long, N., & Judkoff, R. (2004). Consumptive water use for us power production.Golden: National Renewable Energy Laboratory, NREL/CP-550–35190.
United Nations. (2001). World Population Prospects 1950–2050: The 2000 Revision. Database,Department of economic and social affairs, population division, New York.
United Nations. (2002a). World urbanization prospects – the 2001 revision data table andhighlights. New York: Department of Economic and Social Affairs.
348 JAY S. GOLDEN
Dow
nloa
ded
by [
77.3
8.24
4.10
6] a
t 10:
57 2
2 A
pril
2014
United Nations. (2002b). Population report. Population distribution by region, 1975, 2000,2030.
United Nations Population Division. (2002). Urban agglomerations, 1950–2015.US Census. (2002). US census 2002. US Census Bureau. Washington, DC: US Department of
Commerce.US Census. (2003). Migration by race and Hispanic origin: 1995–2000. Washington, DC: US
Census Bureau – US Department of Commerce.US Environmental Protection Agency. (2001). Inside the greenhouse. A state and local resource
on global warming. Washington, DC: EPA 430-N-01–002.US Environmental Protection Agency. (2004). Urban heat island reduction initia-
tive. Washington, DC. Available: http://yosemite.epa.gov/oar/globalwarming.nsf/0/85256d7a00686a5a85256bfe0057a212?OpenDocument
US Geological Survey. (2004a). National handbook for recommended methods for water dataacquisition (Chapter 11). Washington, DC: US Geological Survey.
US Geological Survey. (2004b). Estimated use of water in the United States in 1990.Thermoelectric power water use. Table 24. USGS web site, http://water.usgs.gov/watuse/tables/pttab.st.html
Voogt, J.A., & Oke, T.R. (1997). Complete urban surface temperatures. Journal of AppliedMeteorology, 36, 1117–1132.
Weng, W., & Taylor, P.A. (2003). On modeling the 1-D atmospheric boundary layer.Boundary-Layer Meteorology, 107, 371–400.
THE URBAN HEAT ISLAND EFFECT 349
Dow
nloa
ded
by [
77.3
8.24
4.10
6] a
t 10:
57 2
2 A
pril
2014