Embed Size (px)
Citation preview
1
Conflict Between Urbanizing Gallatin County and Natural Resources. MSU-Land Resource and Environmental Studies 2018 Capstone Report
Prof: William Kleindl
The Fall 2018 Land Resources and Environmental Services (LRES) Capstone Class
focused on the conflict between urbanizing Gallatin County and its natural resources. Gallatin
County, the Cities of Bozeman and Belgrade and the Montana Aquatic Resources Service met
with the students early in the semester share their questions and concerns regarding urbanization
of the region. These questions help guide the students look deeper into our local issues. The
following are the final reports of the student groups and will provide:
Why We Need Wetlands: Prioritizing Water Resources for the Future of Bozeman
Application of a Landscape Disturbance Index to Evaluate the Best Places to Develop in
Gallatin County, Montana
Effect of Urbanization on Groundwater Resources in the Gallatin Valley
Rapid Urbanization: Methods of Mitigating Ecosystem Stressors in the Gallatin Valley of
Montana
In late November, the Capstone students presented their findings back to those planners
and managers and will follow up with final reports at the end of the semester. The students also
presented to the LRES freshmen to show how their education can be beneficial to our
community after they finish their degree programs. A PDF of these presentations are also
included in a separate file on this website.
2
Why We Need Wetlands: Prioritizing Water Resources for the Future of
Bozeman Zane Ashford, Ethan Gager, Damion Lynn, Leah Simantel, and Nicolette Standley
Introduction Bozeman, Montana, “America’s fastest growing mid-sized city” (Kendall, 2018), has
been growing in population at a rate of over 4.3% per year. Between the years of 2000 and 2016,
approximately 17,000 new residents moved to the City of Bozeman (Monares, 2018). To
accommodate this growth, preemptive planning is critical for effective management of natural
resources. Specifically, because of Bozeman’s semi-arid environment, water use efficiency must
be prioritized to maximize water resource conservation. Water scarcity will likely be a
consequence of the rapid urbanization for residents of Bozeman and the surrounding Gallatin
Valley. An additional outcome of this development is that natural wetlands are quickly
disappearing - and attempts to replace these wetlands and the ecosystem services that they
provide often fall short of community needs and expectations.
Hydrogeologic Setting Bozeman, Montana and the Gallatin Valley are bordered by four mountain ranges: the
Bridger Range to the East, Gallatin Range to the South, Madison Range to the Southwest, and
the Tobacco Root Range to the West. Additionally, the Horseshoe Hills border the North side of
the Valley and the Madison Plateau borders the West (English & Baker, 2004). At an elevation
of 4,800 feet and with an average precipitation of 12-18 inches per year, with a climate
characterized by cool, wet winters and warm, dry summers, Bozeman is semi-arid (City of
Bozeman Water Department, 2018). This below-national-average precipitation yields little water
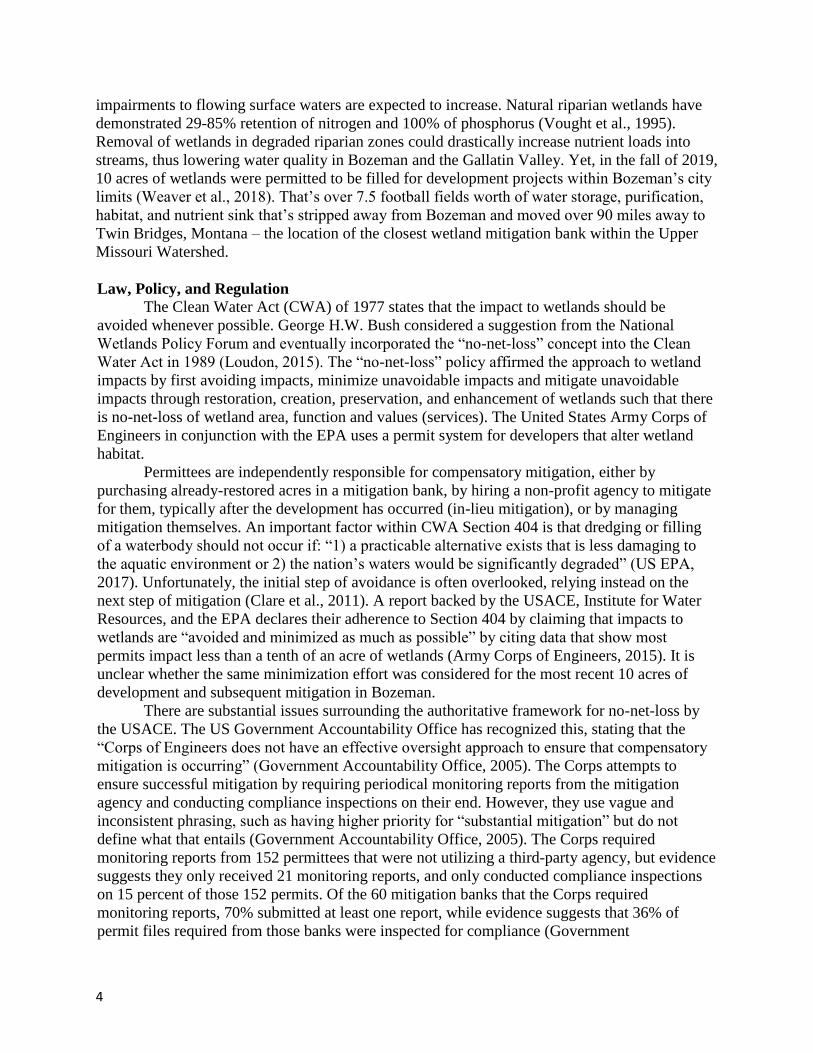
for the community; however, the mountain ranges
receive significantly more precipitation in the form
of snow, providing the majority of the city’s
drinking water. The primary water source for the
City of Bozeman is snowmelt from the Gallatin
Range that eventually drains into Sourdough and
Hyalite Creeks and provide about 85% of the City’s
consumptive water. The remaining 15% comes from
a spring at the headwaters of Lyman Creek on the
Southwest side of the Bridger Mountains. After this
water is treated at either of the two water treatment
plants, roughly two billion gallons run through the
253 miles of pipelines beneath the City toward
homes and businesses (City of Bozeman Water
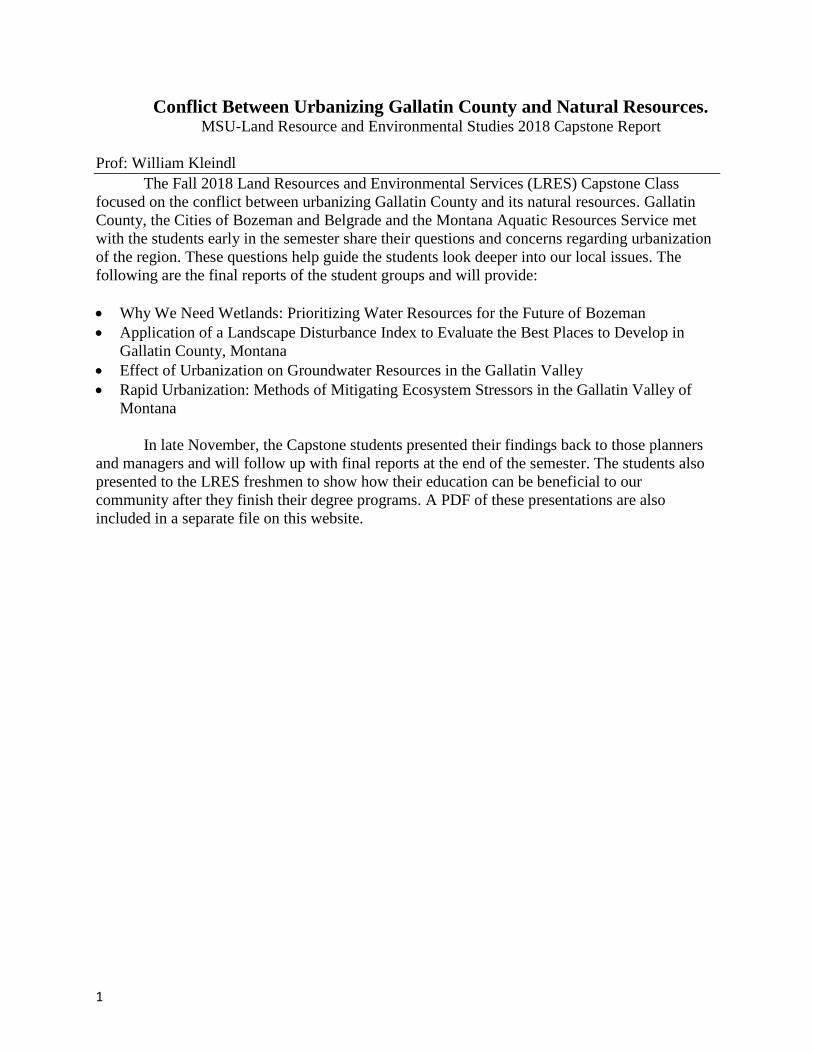
Department, 2018). The mountain ranges support
ground and surface water throughout the valley and
the Lower Gallatin Watershed, seen in Figure 1, that
support agriculture needs (Hackett, 1960). With the
increasing water demand due to population growth
and agricultural needs, coupled with the predicted
decrease in snowpack water supply because of
Figure 1. Map of the Gallatin Watershed
(GLWQD, 2017).
3
climate change, Bozeman will not meet its water demand as soon as 2030 (City of Bozeman
Water Department, 2018).
Bozeman Wetland Services Wetlands are an often-overlooked resource that is at risk of urbanization. While wetlands
may be viewed as major limitations in terms of development, they are the most biodiverse
natural systems. Wetlands are described as distinct ecosystems, inundated or saturated by surface
or groundwater at a frequency and duration sufficient to support hydrophilic, or water-loving,
vegetation (US EPA, 2015). Characterized by hydric soils, these ecosystems are dominated by
anaerobic processes below the surface. Consequently, wetlands provide an atypical low-oxygen
environment that allows for many natural processes that are dependent on saturated conditions.
Wetlands provide a vast array of ecosystem services, described as processes from the
natural environment and properly-functioning ecosystems that directly benefit human well-being.
For instance, wetlands in the Bozeman area are an important component of water storage,
availability, and quality. In an area where snowmelt is the dominant source of water, local
storage of this resource is imperative. In times of high river stage and flooding, typically in the
late Spring and early Summer months, wetlands can act as a sponge (Gallatin Local Water
Quality District [GLWQD], 2004). They retain the vast influx of water, purify it, recharge the
surrounding aquifers and later discharge to our rivers, providing fresh and clean water for
months following the climax runoff. Wetlands above cities provide storage while downstream
wetlands retain water that runs through the town, filtering out contaminants sourced from urban
land cover.
Wetlands filter sediments by providing an environment that can break down pollutants
(Matthews & Endress, 2008). They play a role in nutrient and heavy metal retention by trapping
excess sediment, which can act as a transport mechanism for metals. There are many wetland
plants that can take up these metals, removing them from waterways and supporting human
health (Patenaude et al., 2015).
Carbon cycling is also impacted by wetlands; of all the terrestrial ecosystems, wetlands
have the highest carbon density (Kayranli et al., 2010). Due to the anoxic conditions, wetlands
are typically characterized by a low decomposition rate. Coupling this with their high
productivity, wetlands can sequester atmospheric carbon in sediments and detritus, or organic
matter (Nahlik & Fennessy, 2016). When assessing their ecological value, it is important to note
their function as a carbon sink, especially when considering the mounting impacts of climate
change.
The wide-reaching benefits of wetlands are often undervalued; within Montana, they
provide essential habitat for several threatened or endangered species, including the piping
plover, peregrine falcon, and grizzly bear. Many big game populations depend on resources
found in wetlands, such as white-tailed and mule deer, moose, and antelope (Kendy, 1996).
Given their contributions to outdoor recreation and game species habitat, wetlands can provide
important socioeconomic benefits as well as ecological ones.
Bozeman’s Need for Wetland Services According to the Water Quality Integrated Report (2018), river and stream test results
from all waterways in the lower Gallatin Watershed have shown only partial support of aquatic
life. Additionally, 82% have shown only partial support of primary contact recreation due, in
part, to excess phosphorus, nitrogen, nitrate/nitrite, E. coli, and sedimentation/siltation. By
replacing the wetlands with more impervious services through urbanization and development,
4
impairments to flowing surface waters are expected to increase. Natural riparian wetlands have
demonstrated 29-85% retention of nitrogen and 100% of phosphorus (Vought et al., 1995).
Removal of wetlands in degraded riparian zones could drastically increase nutrient loads into
streams, thus lowering water quality in Bozeman and the Gallatin Valley. Yet, in the fall of 2019,
10 acres of wetlands were permitted to be filled for development projects within Bozeman’s city
limits (Weaver et al., 2018). That’s over 7.5 football fields worth of water storage, purification,
habitat, and nutrient sink that’s stripped away from Bozeman and moved over 90 miles away to
Twin Bridges, Montana – the location of the closest wetland mitigation bank within the Upper
Missouri Watershed.
Law, Policy, and Regulation The Clean Water Act (CWA) of 1977 states that the impact to wetlands should be
avoided whenever possible. George H.W. Bush considered a suggestion from the National
Wetlands Policy Forum and eventually incorporated the “no-net-loss” concept into the Clean
Water Act in 1989 (Loudon, 2015). The “no-net-loss” policy affirmed the approach to wetland
impacts by first avoiding impacts, minimize unavoidable impacts and mitigate unavoidable
impacts through restoration, creation, preservation, and enhancement of wetlands such that there
is no-net-loss of wetland area, function and values (services). The United States Army Corps of
Engineers in conjunction with the EPA uses a permit system for developers that alter wetland
habitat.
Permittees are independently responsible for compensatory mitigation, either by
purchasing already-restored acres in a mitigation bank, by hiring a non-profit agency to mitigate
for them, typically after the development has occurred (in-lieu mitigation), or by managing
mitigation themselves. An important factor within CWA Section 404 is that dredging or filling
of a waterbody should not occur if: “1) a practicable alternative exists that is less damaging to
the aquatic environment or 2) the nation’s waters would be significantly degraded” (US EPA,
2017). Unfortunately, the initial step of avoidance is often overlooked, relying instead on the
next step of mitigation (Clare et al., 2011). A report backed by the USACE, Institute for Water
Resources, and the EPA declares their adherence to Section 404 by claiming that impacts to
wetlands are “avoided and minimized as much as possible” by citing data that show most
permits impact less than a tenth of an acre of wetlands (Army Corps of Engineers, 2015). It is
unclear whether the same minimization effort was considered for the most recent 10 acres of
development and subsequent mitigation in Bozeman.
There are substantial issues surrounding the authoritative framework for no-net-loss by
the USACE. The US Government Accountability Office has recognized this, stating that the
“Corps of Engineers does not have an effective oversight approach to ensure that compensatory
mitigation is occurring” (Government Accountability Office, 2005). The Corps attempts to
ensure successful mitigation by requiring periodical monitoring reports from the mitigation
agency and conducting compliance inspections on their end. However, they use vague and
inconsistent phrasing, such as having higher priority for “substantial mitigation” but do not
define what that entails (Government Accountability Office, 2005). The Corps required
monitoring reports from 152 permittees that were not utilizing a third-party agency, but evidence
suggests they only received 21 monitoring reports, and only conducted compliance inspections
on 15 percent of those 152 permits. Of the 60 mitigation banks that the Corps required
monitoring reports, 70% submitted at least one report, while evidence suggests that 36% of
permit files required from those banks were inspected for compliance (Government
5
Accountability Office, 2005). The GA Office asserts that “Because [USACE] do not always
specify the requirements of compensatory mitigation in the permits, they had no legal recourse
for noncompliance” (2005). Whether the Corps has improved their administration of wetland
mitigation has not been updated by the GA office, but more recent literature would suggest
performance standards are still not consistently met (Clare et al., 2011). This GA Office report is
dated but goes to show the USACE has not had a great track record as far as clarity of statements
is concerned. These vague and open-ended specifications for mitigation projects can lead to
mounting detrimental effects on ecosystem services, and ultimately can result in sweeping
violations of the no-net-loss policy, without any legal repercussions.
Wetland mitigation sites are typically monitored for a minimum of five years to
determine if they meet ecosystem service performance standards initially decided upon by the
EPA and USACE. It is assumed by many assessment protocols, including the Montana Wetland
Assessment Protocol (Berglund & McEldowney, 2008) and Washington State version
(Washington State Department of Ecology, 2006), that after the first five years of meeting
wetland mitigation success criteria, the wetlands will continue to meet these standards
indefinitely. However, mitigated wetlands often show signs of a decrease in compliance over
time. In 2012, researchers surveyed 30 different compensatory mitigation wetlands that were
between 8-20 years post-construction in order to determine if they were, in fact, meeting
performance standards (Van den Bosch & Matthews, 2017). Only 65% of these wetlands met
project-specific performance standards after the five-year monitoring period; upon return to
these sites several years later, only 53% of the performance standards were met. This suggests an
overall decrease in performance, in terms of wetland ecosystem function and services. (Clare et
al., 2011).
These studies provided evidence for the need of an increased duration of monitoring of
constructed compensatory wetlands and emphasized the importance of keeping constructed
wetlands as close as possible to natural wetlands. Similarly, one study found that 5 years of
monitoring is not sufficient to guarantee the biotic integrity of wetland compensation sites,
because vegetation richness often fails to meet performance standards (Robertson et al., 2017). If
the City of Bozeman wishes to ensure that mitigation is fully replacing those wetlands which are
lost, the monitoring time for such compensatory wetlands should increase in order to improve
the success rate of wetland performance and function. A possible option is to require mitigation
bank monitoring every year for 5 years, and beyond that every 2 years for a total period of at
least 6 years. Ecosystem services could be left to degrade otherwise, if there is no cumulative
evidence supporting the need for additional mitigation and restoration efforts.
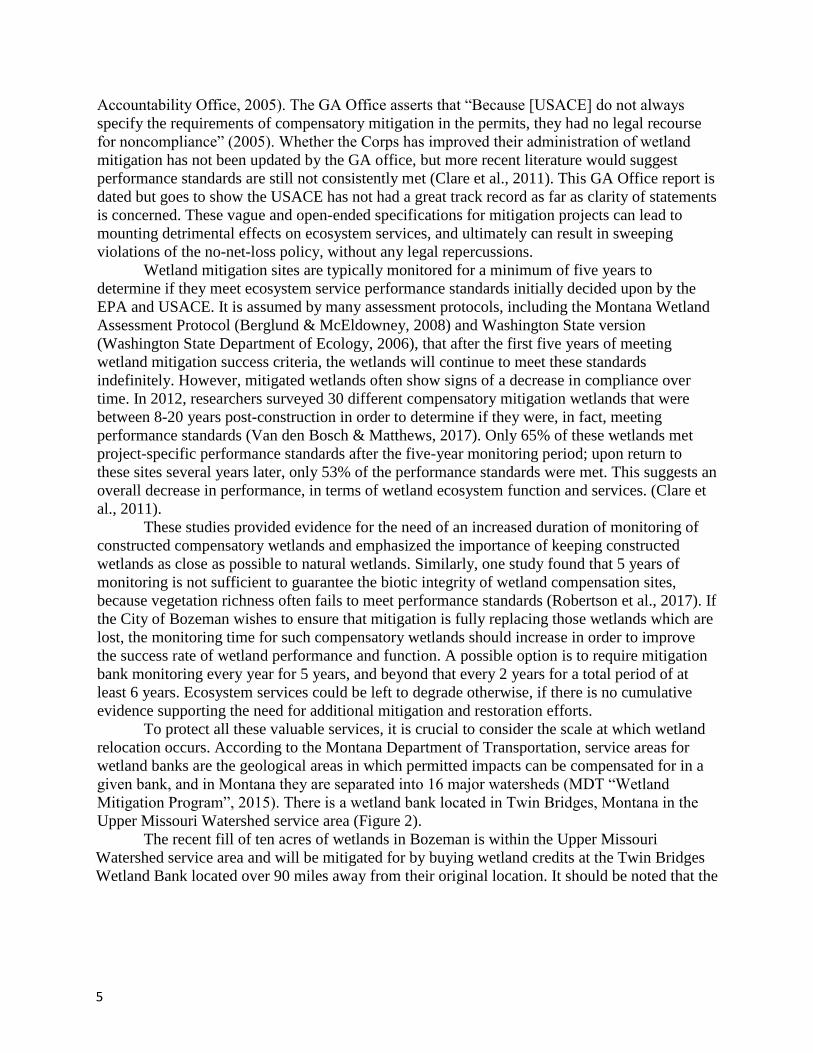
To protect all these valuable services, it is crucial to consider the scale at which wetland
relocation occurs. According to the Montana Department of Transportation, service areas for
wetland banks are the geological areas in which permitted impacts can be compensated for in a
given bank, and in Montana they are separated into 16 major watersheds (MDT “Wetland
Mitigation Program”, 2015). There is a wetland bank located in Twin Bridges, Montana in the
Upper Missouri Watershed service area (Figure 2).
The recent fill of ten acres of wetlands in Bozeman is within the Upper Missouri
Watershed service area and will be mitigated for by buying wetland credits at the Twin Bridges
Wetland Bank located over 90 miles away from their original location. It should be noted that the
6
term ’service area’ means the area the
bank serves; it does not mean that it is
an area where ecosystem services are
kept relative throughout. There are
negative repercussions associated with
mitigating 90 miles away. Among
these are the localized loss of
ecological services in Bozeman,
challenges with relocation of wildlife,
and the outsourcing of highly valued
socioeconomic benefits, to name just a
few. Spatially shifting our mitigated
wetlands to Twin Bridges calls into
question the validity of the term
‘mitigation’: at what scale does
effective management of our aquatic
resources exist?
The Benefits of Localizing Mitigation
The satisfaction of the ‘no-net-
loss’ requirement of the Clean Water
Act hinges on several assumptions.
The first is that the ensuing mitigation
project will be successful and meet all
outlined performance standards upon
completion (US EPA, 2014). Secondly,
it is assumed that the parameters used to define success for a mitigation project will be
appropriate. As previously mentioned, studies have shown that a key factor in wetland mitigation
success is proximity to the impact site.
The likelihood of meeting these end goals is greatly enhanced by constructing the
compensatory wetland near the damaged wetland it is replacing (Kozich & Halvorsen, 2012;
Murphy, et al., 2009). Often, this is referred to as the ‘environmentally preferable method’ of
wetlands mitigation, where the compensatory wetland is constructed on-site. When determining
the location of compensatory mitigation projects, the EPA emphasizes taking a “watershed
approach” for the purpose of maintaining hydrologic integrity (US EPA, 2014). The scale of this
approach and the definition of the watershed should be considered for future land use decisions
in the Bozeman area, for numerous reasons.
There are many benefits to keeping compensatory wetlands projects localized. For
example, a 2017 study found that compensatory wetlands constructed near their natural
counterparts performed much better with respect to floristic quality than those that were
nonadjacent (Van den Bosch & Matthews, 2017). This suggests that proximity plays a crucial
role in the successful restoration of wetland plant communities, which contribute to the integrity
of wetland systems and improvement of local water quality. There is further supporting evidence
of this from Kozich and Halvorsen (2012): they found that on-site wetland restoration projects
were far more likely to be compliant with performance standards than wetlands that were newly
created elsewhere.
Figure 2. Displays one of the 16 service areas in Montana, the
Upper Missouri Watershed (UMW) amongst the mitigation
bank, Bozeman, and smaller HUC8 watersheds. Source:
RIBITS, 2018
7
Other comparative studies have found that if a mitigation wetland is constructed too far
away, it results in exacerbated loss of ecological services (Balcombe et al., 2005). A glaring
example is the hydrologic functions that are removed from a landscape when a wetland is filled;
as mentioned previously, wetlands are incredibly important to water quality, availability, and
storage. They filter contaminants, acting like a sponge during times of high flows, and replenish
groundwater aquifers. When a compensatory wetland is constructed off-site, the community
must find a replacement for these functions elsewhere, and this often puts more pressure on local
water treatment facilities – especially in rapidly-growing urban areas such as Bozeman.
There is also the problem of wildlife relocation. It is unreasonable to assume that wildlife
populations dependent on local wetland habitat will be able to migrate to a new wetland project
nearly 100 miles away. It is likely that the local wildlife will simple lose density through
extirpation. Within Montana, wetlands provide critical habitat for several threatened or
endangered species. The U.S. Fish and Wildlife Service estimates that up to 43 percent of
threatened and endangered species rely directly or indirectly on wetlands for survival (US EPA,
2014). If development needs determine that filling a wetland is the only option, the most
beneficial action for local wildlife species is on-site mitigation to alleviate permanent habitat
loss.
It is unfortunate that the relocation of Bozeman, Montana’s wetlands over 90 miles away
is not a rare case of off-site compensation; frequently, mitigation projects are not adjacent to the
ecosystems they are supposed to be replacing (Murphy et al., 2009). Further complications arise
when compensatory wetlands for several different development projects are condensed into one
centrally-located site, employing a “two birds with one stone” approach. This exhibits a blatant
lack of consideration for different types of wetlands and their varying functions, as these
ecosystems are highly complex. It is resulting in far greater losses of ecological services, even
with the guarantee that the mitigation efforts will meet project goals (Murphy et al., 2009).
Additionally, on-site mitigation projects provide a much better reference site to judge the success
of restoration – there is massive variation across any landscape, involving vegetation, hydrologic
regimes, and soil types. When mitigation projects take place miles away, it becomes increasingly
difficult to establish appropriate parameters for success.
There are several socioeconomic benefits that come with on-site wetlands mitigation, in
addition to ecological ones. In many areas, the mitigation industry has been privatized, and it
would be more beneficial to keep that funding circulating in Bozeman rather than outsourcing it
to other areas such as Twin Bridges. Construction of local mitigation wetlands also creates jobs,
which would be a welcome addition in the face of rampant urban growth, and it would boost the
local economy. Finally, it is important to consider the long-term effects: the greater the
population in Bozeman, the more reliance the city will have on water treatment facilities and
services. Maintaining urban wetlands within Bozeman city limits will have long-lasting positive
impacts on the community, especially ecological services involving water quality and storage.
This will result in the city saving money in the long run and can alleviate pressure on our current
water treatment centers as it has with the local Story Mill wetland effort.
A compensatory wetland must be constructed within the same service area as the site
being damaged; however, service area size can vary greatly depending on the location and
overseeing agency (see Figure 2). The U.S. Army Corps of Engineers maintains that wetland
mitigation requirements are satisfied by relocating them to Twin Bridges; however, though it is
legal to continue mitigation there, it would be much more beneficial to require on-site mitigation
projects for future development in Bozeman. All too often, the no-net-loss policy is being
8
violated due to poor prioritization. For example, one study found that local control over wetland
mitigation may place little value in hydrologic function and ecological services, and instead the
decision of where to mitigate is strongly influenced by administrative boundaries (BenDor &
Brozović, 2007). These are practices best avoided in the future, given the rising dependence of
Bozeman’s population on the services provided by our remaining wetland resources.
The United States Geological Survey created a hierarchical system to better define and
classify water resources, typically referred to as Hydrologic Unit Codes (HUC). These unit codes
range in scale from subwatershed all the way up to the regional scale. Currently, Bozeman’s
wetland resources are being managed at the HUC4 subregion scale that are about 16,800 square
mile area (see Figure 2). Recall, the EPA encourages management agencies to adopt a watershed
approach when determining locations for compensatory wetlands, which is more appropriate to a
HUC10 scale, or about 227 square miles. Based on this reasoning, HUC4 is too large of a scale
to be truly effective at upholding the no-net-loss policy; to meet a watershed approach it is
suggested here that future mitigation projects in Bozeman be managed at a minimum of HUC10.
Future Mitigation in the Bozeman Area: Prioritizing Avoidance
As previously mentioned, the first and arguably most important step, avoidance, is often
ignored during wetland mitigation projects (Clare et al., 2011). While “no-net-loss” aims to
ensure that filled wetlands are replaced, it is unsure that reconstructed wetlands are providing the
same quality of ecosystem services as the natural wetland itself. This policy only “ensures
wetlands conservation at minimum economic and political cost” (Clare et al., 2011). The Army
Corps of Engineers denies less than one percent of permits, only further perpetuating the notion
that compensation, over avoidance or minimization, is the preferred mechanism for achieving
the “no-net-loss” goal. Five key factors were determined as critical to the shift from avoidance
toward compensation (adapted from Clare et al., 2011):
a. A lack of agreement on what constitutes “avoidance”;
b. Land-use planners do not identify and prioritize wetlands in advance of development;
c. Wetlands are economically undervalued;
d. The belief that technology can solve problems with wetland creation and restoration,
resulting in exacerbated wetland loss;
e. Requirements for compensation are inadequately enforced.
These factors can be addressed at a local scale in order to prioritize avoidance, such as
using land use analysis to determine areas with highly valued wetlands. Development could
potentially be prohibited in these areas, forcing developers to look elsewhere and protecting our
remaining natural wetlands. This could change the future of development in Bozeman to reflect
the proper value of our natural resources.
Bozeman City Municipal Code Bozeman’s current municipal code outlining review standards for the approval of activity
in a regulated wetland concur with CWA Section 404, which states the mitigation sequence as 1)
avoidance, 2) minimization, and 3) compensation. However, the municipal code employs the use
of the word “or,” and does not emphasize that these review standards should follow a sequential
order, leaving it open to the developer to choose whatever step is most convenient for them. The
review standards read as follows:
9
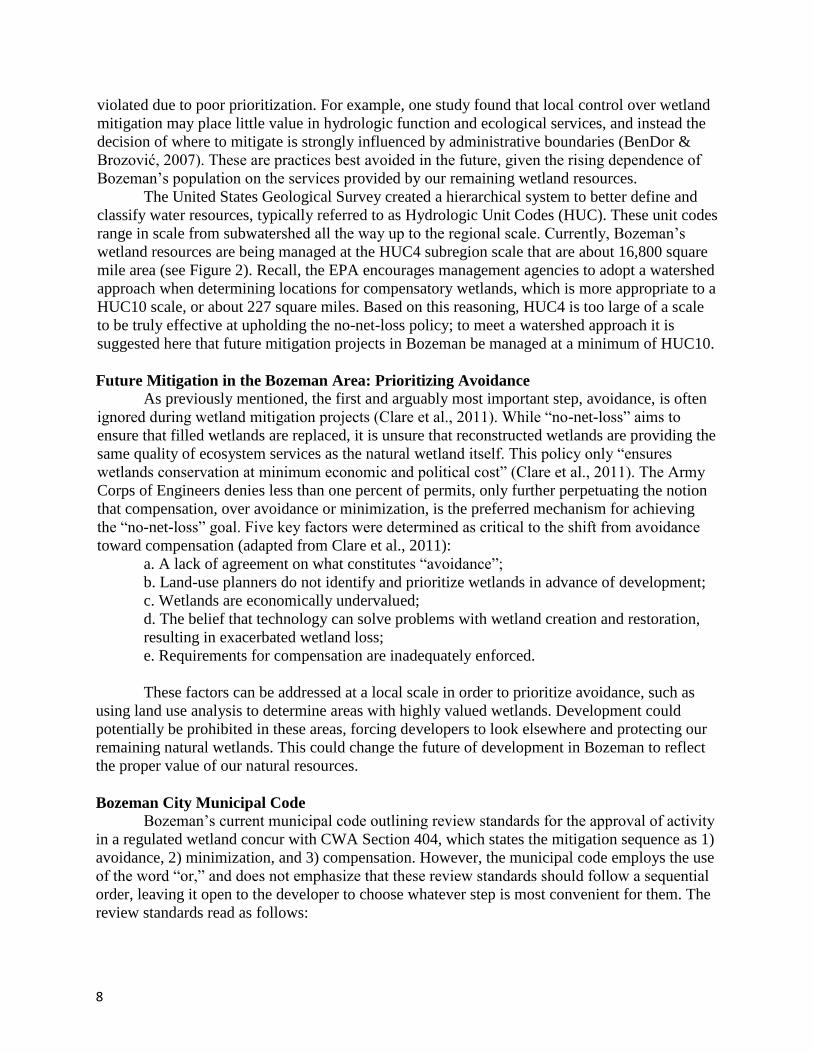
“The review authority may approve, conditionally approve or deny a regulated activity in a
regulated wetland if:
1. The applicant has demonstrated that all adverse impacts on a wetland have been avoided;
or
2. The applicant has demonstrated that any adverse impact on a wetland has been
minimized…, or
3. The applicant has demonstrated that the project is in the public interest… “(Bozeman
City Ordinance, 2018).
To further protect Bozeman’s aquatic resources, it is recommended that the language of
this ordinance be altered to reflect the sequential nature of wetlands mitigation. The highest
priority should be placed in avoidance of existing wetlands.
Wetland Rating Assessment and Enforcement of a Critical Area Ordinance A wetland rating system such as that used by Washington State could be helpful in
identifying wetland sensitivity, rarity, and functions and can aid local agencies and governments
in protecting and managing wetlands. This rating system separates wetlands into four different
categories based on a functional score determined by “their sensitivity to disturbance, their
significance, their rarity, our ability to replace them, and the functions they provide” (Clare et al.,
2011). Based on the category that a wetland is placed in, actions to protect these higher priority
wetlands can be taken. For example, the City of Bellingham, Washington uses this rating system
to protect wetlands through their Critical Area Ordinance (Ch. 16.55 Critical Areas | Bellingham
Municipal Code). In this ordinance, areas that have been determined as critical are allowed
limited impacts and alterations by regulating land use and development using permits. To retain
a permit, one must show “an inability to avoid or reduce impacts, before restoration and
compensation of impacts will be allowed” (Ch. 16.55 Critical Areas | Bellingham Municipal
Code).
Similarly, Klickitat County, Washington use their Critical Area Ordinance to “provide
guidance for protecting those wetlands necessary to maintain the public health, safety, and
welfare” (Sauter et al., 2017). This includes wetlands that greatly reduce erosion, siltation,
flooding, and water pollution, as well as those that provide critical fish and wildlife habitat and
aquifer recharge. If impacts are unavoidable and compensatory mitigation must occur, the
ordinance states that “[if] mitigation is located off-site, the wetland mitigation plan shall assess
whether an appropriate location has been identified to adequately replace lost wetland functions
at the site of impact.” Should Bozeman choose to adopt its own Critical Area Ordinance or
follow a wetland rating system such as the example shown below, the protection of wetlands
could be greatly increased.
Wetland Classification These local governments use Washington State’s Wetland Rating System that assesses
wetlands and places them into four categories based on their size, functions, services, and
rareness. The local governments then can use these categories to determine buffer size and
mitigation replacement ratios. To provide our local Gallatin Valley governments an example of
how this could assist with their wetland management we adapted the 1991 Washington State
Wetlands Rating System for Eastern Washington (McMillan, 1991) for use in Gallatin County,
MT. Washington State currently uses an updated 2014 version (Hruby, 2014), however we used
10
the simplified 1991 method because it is more conducive for a spatial analysis, while the 2014
version is more focused towards on-site analysis. This rating system was used as a guide and
several shapefiles were overlaid to create a map of various resources, land uses, and important
features across Gallatin County. Next, the adapted scoring of the Washington rating system was
modified to score Gallatin County’s wetlands. This system differentiated wetlands into four
distinct groups of 1-4. Each class had different broad definitions to assist in understanding the
rating system. Category 1 wetlands are uncommon and comprise a small percentage of the
wetlands in the state while containing habitat for rare or endangered species or providing
irreplaceable functions and services that are unable to be replicated within a human lifetime.
Wetlands classified as Category 2 are difficult to replace, as well as provide many ecosystem
functions and services. Category 3 wetlands provide important functions and services; while
more common, they tend to be smaller and less diverse than Category 2 wetlands. Category 4
wetlands are small, isolated, lack diversity, and should be capable of replication in a mitigation
bank (McMillan, 1991) Determining between class two and three was beyond the scope of this
spatial exercise, so they were categorized together. These sensitivity rankings can be used by
managers to determine wetlands fit for consideration of mitigation.
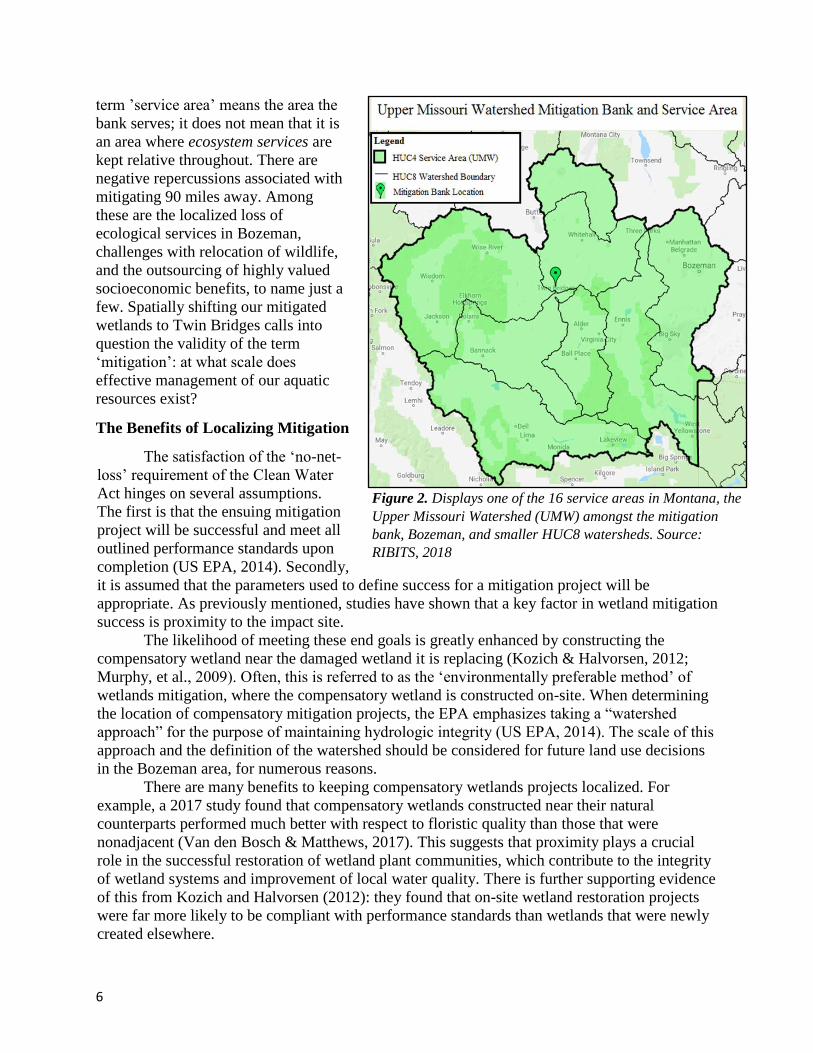
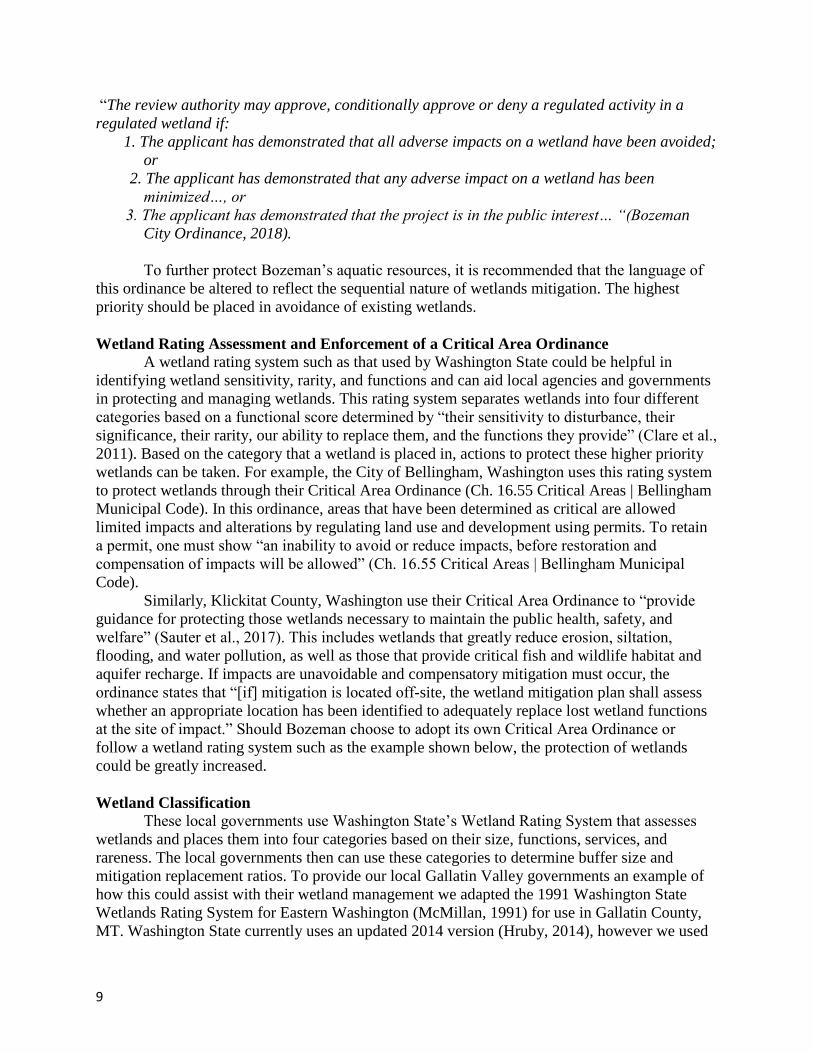
To categorize Gallatin County’s wetlands, shapefiles containing pertinent information
were utilized, such as: land cover, National Wetland Inventory (NWI) classification, urban areas,
occurrences of threatened or endangered species, and presences of rare or special species to
Montana. Any wetlands that had
occurrences of threatened or endangered
plant species, wildlife, or fish were
categorized as Class 1. Sites rated as high-
quality native wetlands by the Natural
Heritage Program or documented as
migratory bird habitat were also classified
as Category 1 wetlands by the Washington
rating system; however, these shapefiles
were not included in the assessment for
Gallatin County, due to inability to find
appropriate shapefiles. Category 2/3
wetlands are determined by containing
state listed sensitive plants, wildlife, and
fish (McMillan, 1991). Differentiating
between Category 2 and 3 requires data
collected from on-site visits which were
not performed for this study, contributing
to the decision to merge wetlands of
Categories 2 and 3. Lastly, Category 4
wetlands were classified as less than 2
acres and hydrologically isolated, however,
because of the scope of this project, we
made some assumptions about hydrological
connectivity. If, and when, this project
moves forward, we would refine these parameters.
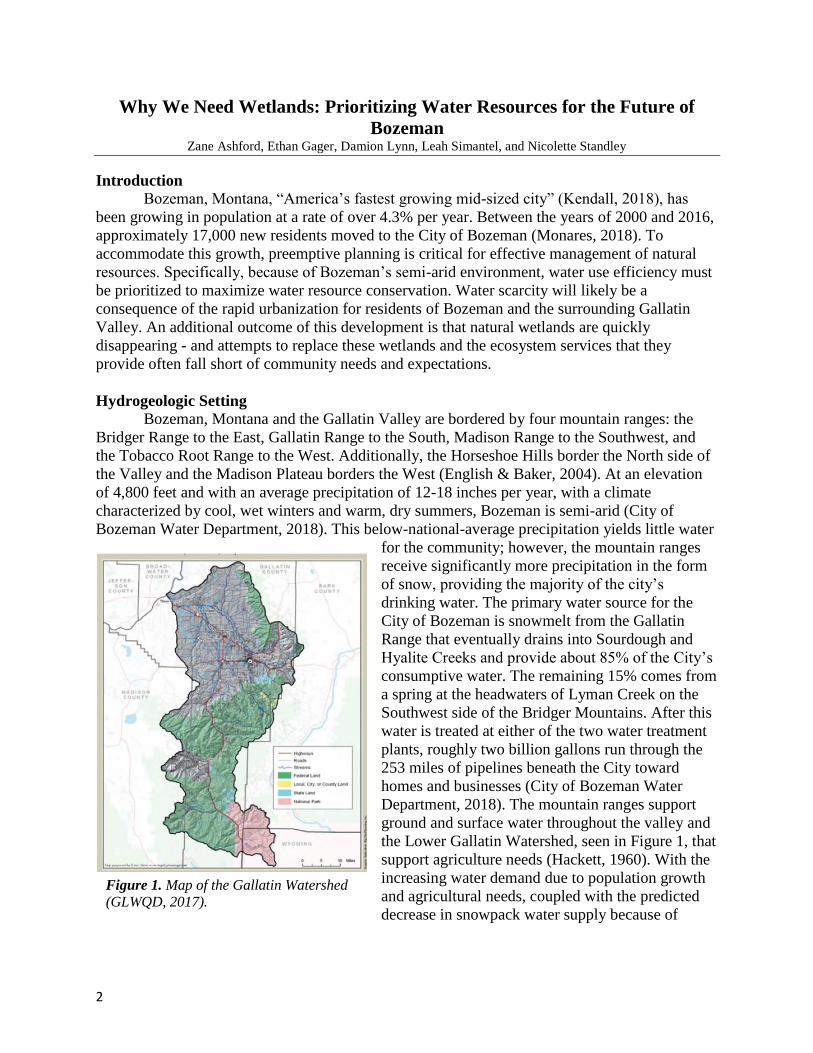
Figure 3. Wetlands surrounding Bozeman, Montana.
11
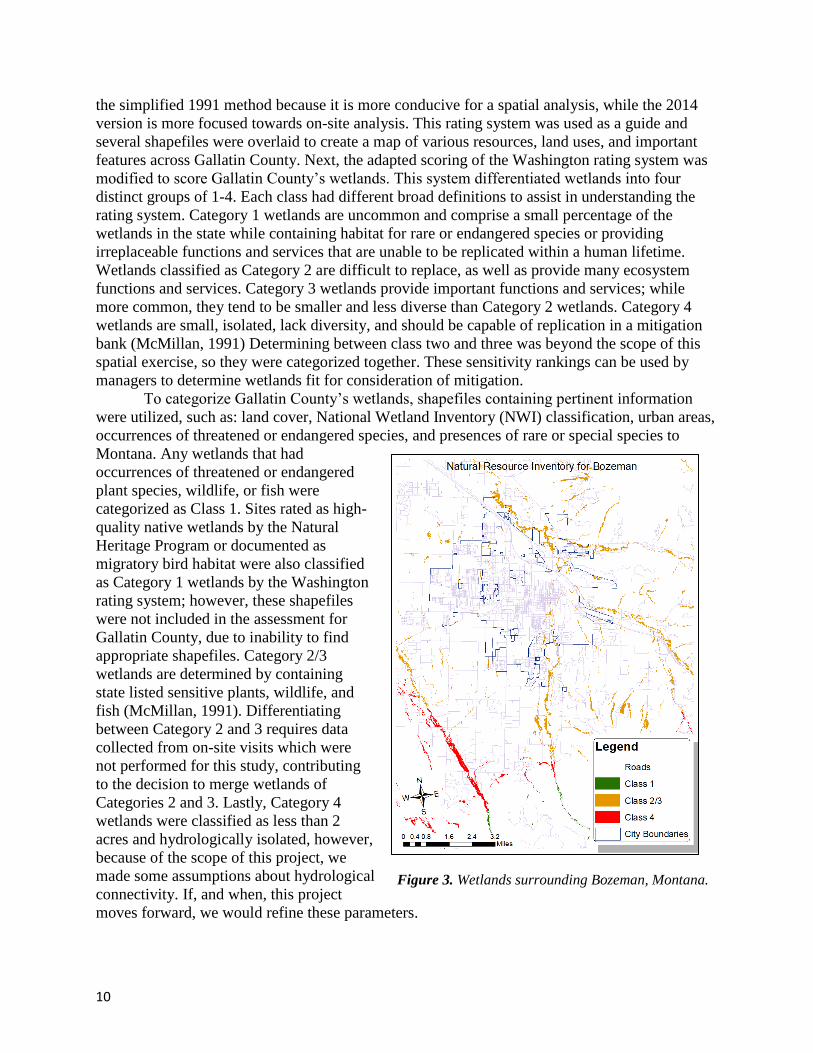
Use of Wetland Classification Once the category of each wetland
was calculated, the Washington
assessment provided buffer or set-back
size and replacement ratios for mitigation
banking. Replacement ratios are meant to
guide the full replacement of wetlands
damaged by necessary and unavoidable
impacts. Buffers that should be in place
for each class are as follows: Category 1
buffer (width of 200-300 ft), Category 2
(100-200 ft), Category 3 (50-100ft), and
Category 4 (25-50 ft). Transforming this
to the simplified model meant slightly
altering the buffer zones and ratios (Table
1). In the Washington assessment,
replacement ratios for Category 2 and 3
are grouped together based on plant type,
forming the basis for the combination of
Categories 2 and 3 for the Montana
assessment.
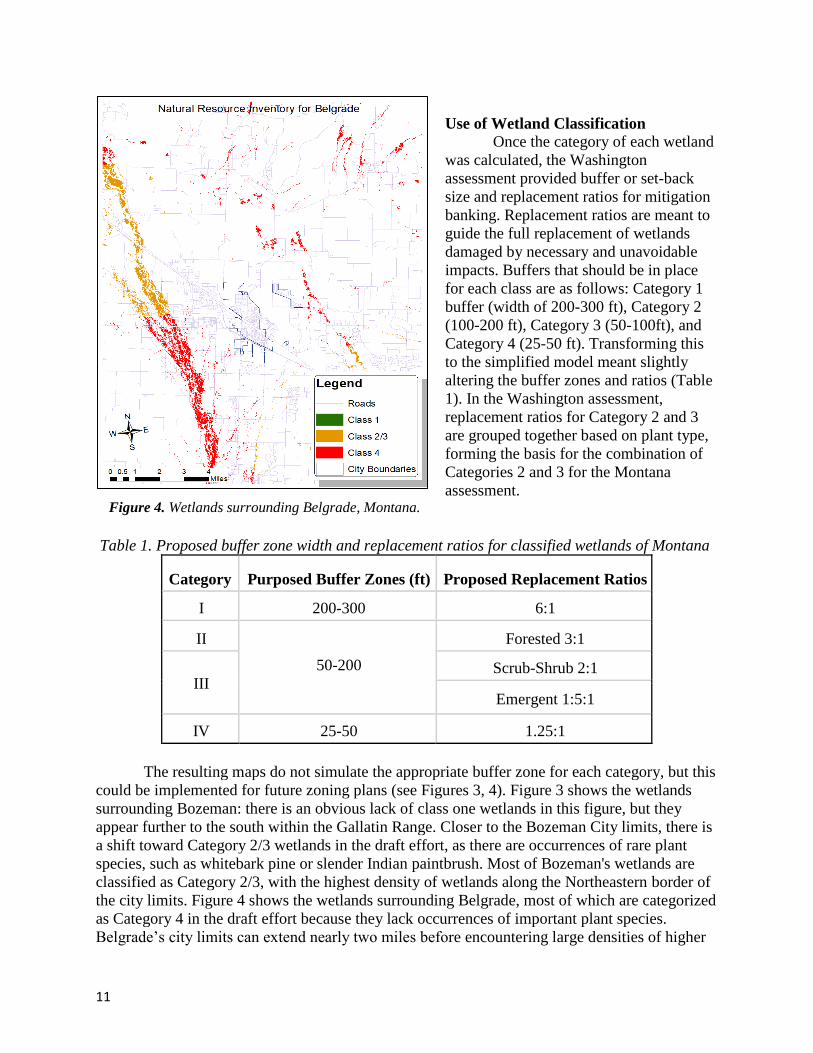
Table 1. Proposed buffer zone width and replacement ratios for classified wetlands of Montana
Category Purposed Buffer Zones (ft) Proposed Replacement Ratios
I 200-300 6:1
II
50-200
Forested 3:1
III Scrub-Shrub 2:1
Emergent 1:5:1
IV 25-50 1.25:1
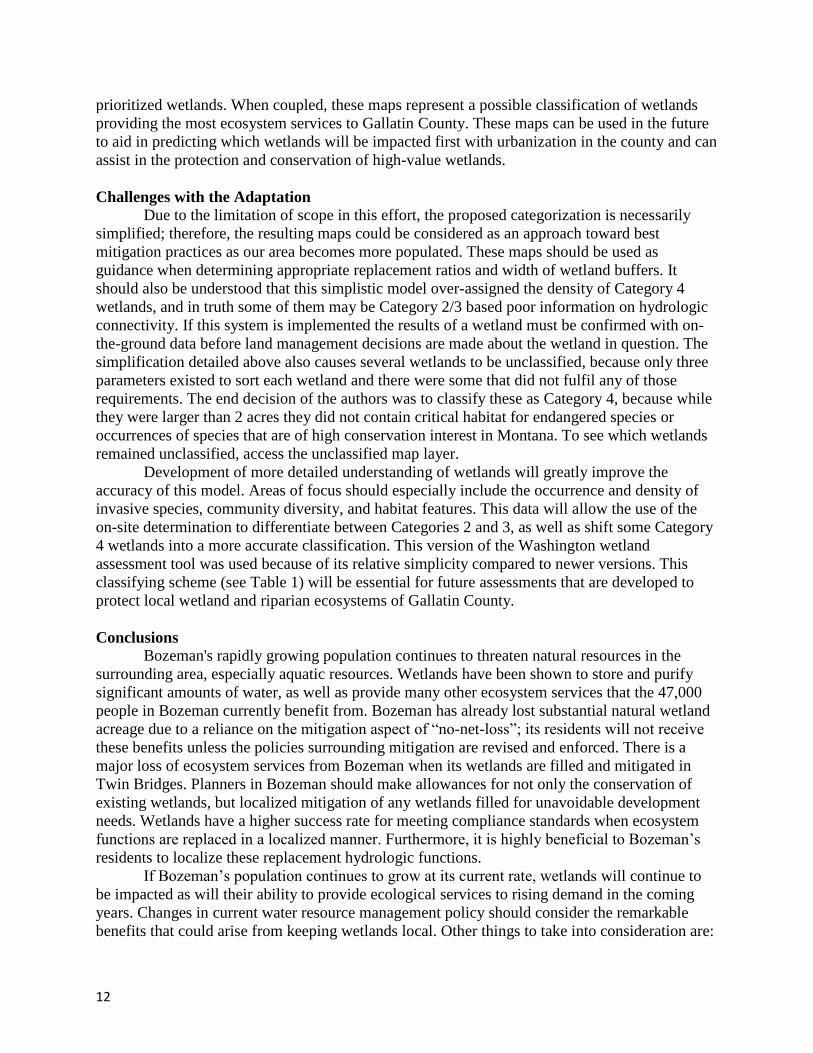
The resulting maps do not simulate the appropriate buffer zone for each category, but this
could be implemented for future zoning plans (see Figures 3, 4). Figure 3 shows the wetlands
surrounding Bozeman: there is an obvious lack of class one wetlands in this figure, but they
appear further to the south within the Gallatin Range. Closer to the Bozeman City limits, there is
a shift toward Category 2/3 wetlands in the draft effort, as there are occurrences of rare plant
species, such as whitebark pine or slender Indian paintbrush. Most of Bozeman's wetlands are
classified as Category 2/3, with the highest density of wetlands along the Northeastern border of
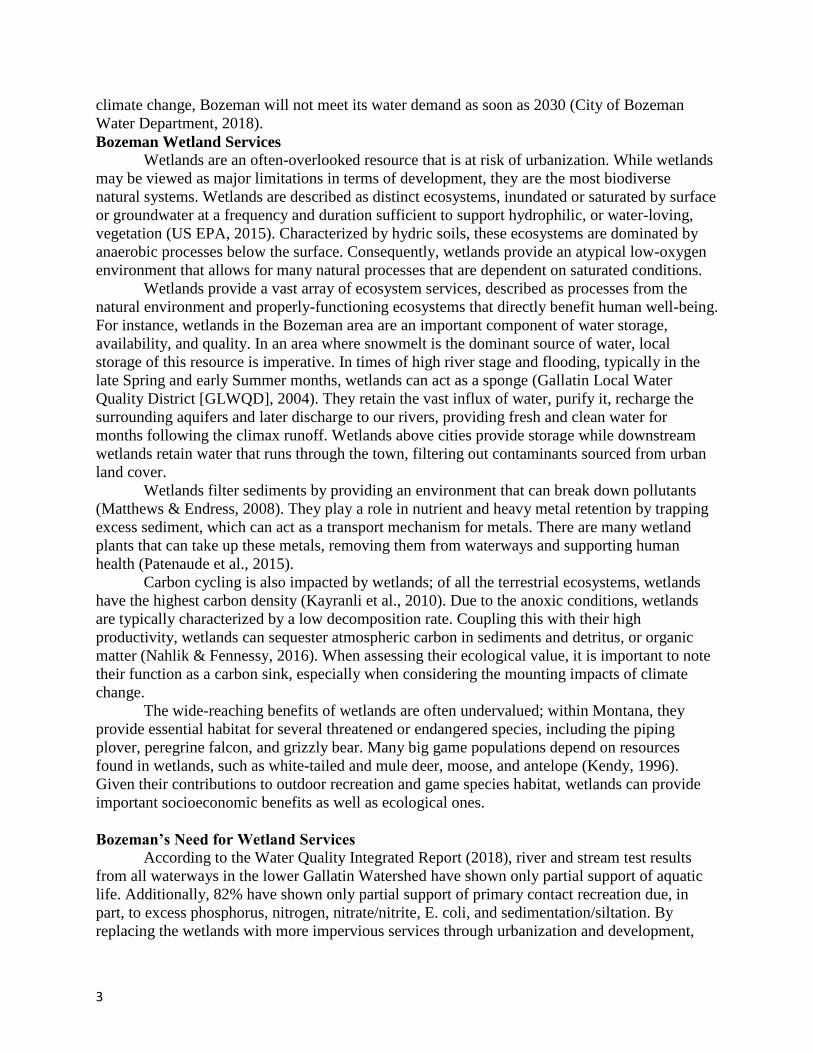
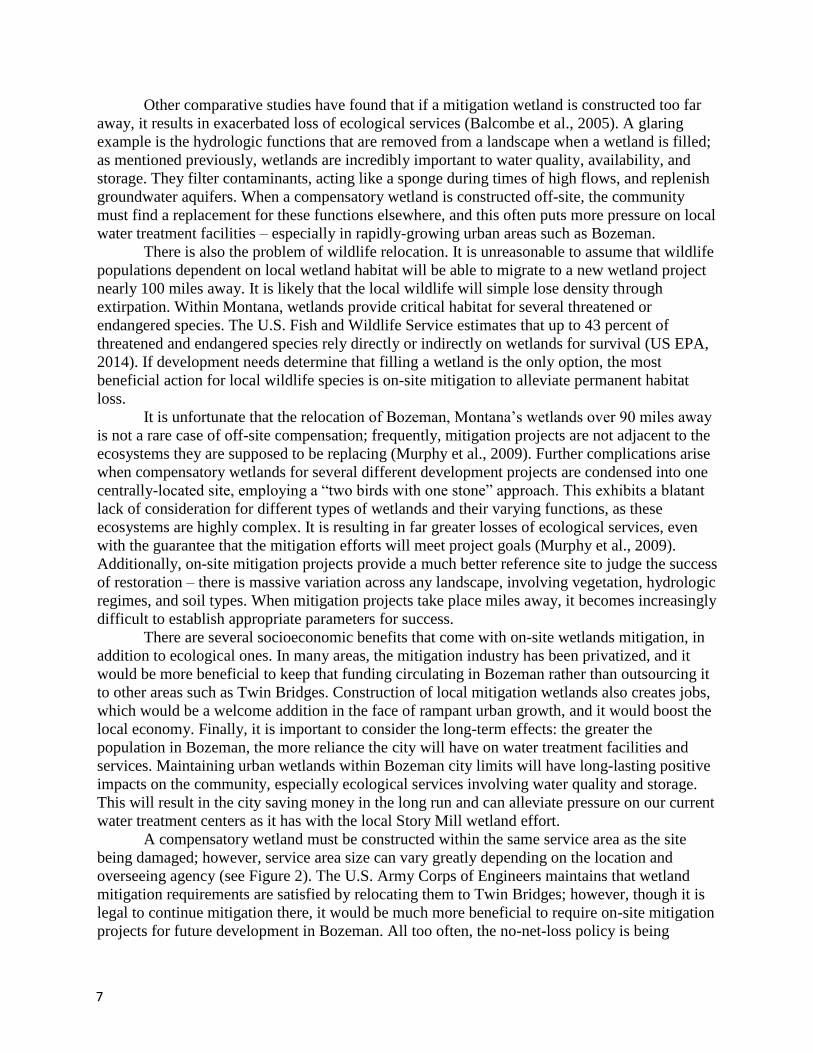
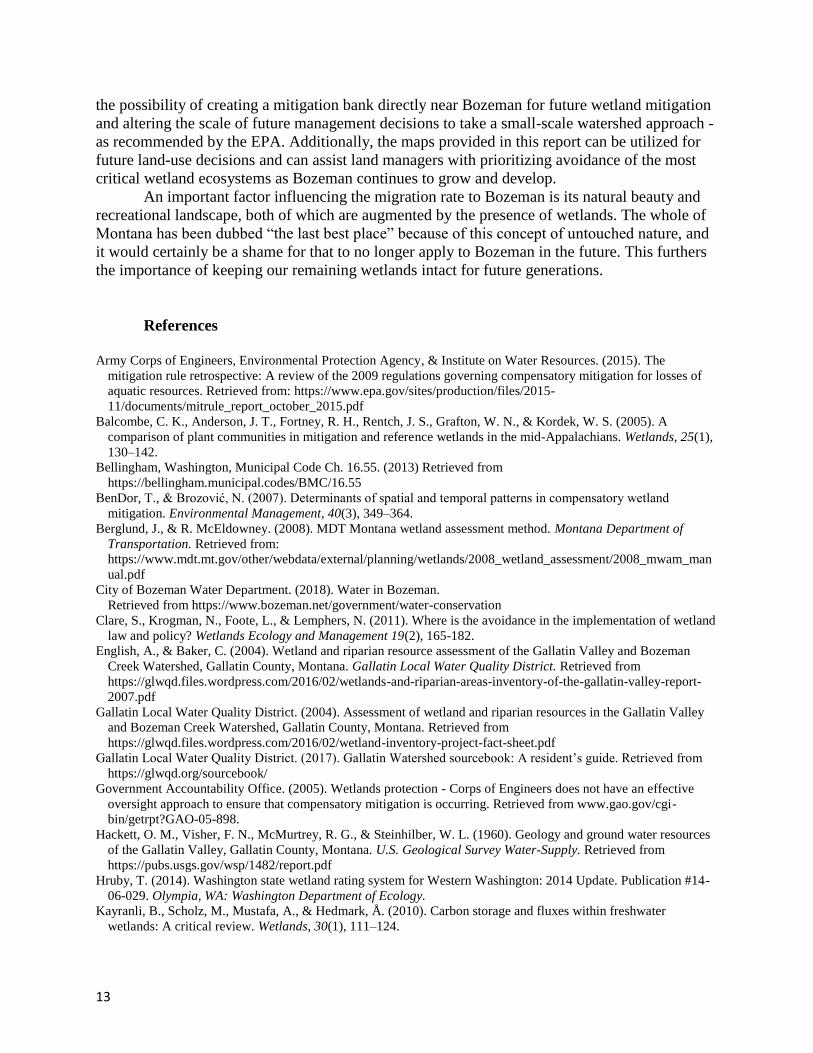
the city limits. Figure 4 shows the wetlands surrounding Belgrade, most of which are categorized
as Category 4 in the draft effort because they lack occurrences of important plant species.
Belgrade’s city limits can extend nearly two miles before encountering large densities of higher
Figure 4. Wetlands surrounding Belgrade, Montana.
12
prioritized wetlands. When coupled, these maps represent a possible classification of wetlands
providing the most ecosystem services to Gallatin County. These maps can be used in the future
to aid in predicting which wetlands will be impacted first with urbanization in the county and can
assist in the protection and conservation of high-value wetlands.
Challenges with the Adaptation Due to the limitation of scope in this effort, the proposed categorization is necessarily
simplified; therefore, the resulting maps could be considered as an approach toward best
mitigation practices as our area becomes more populated. These maps should be used as
guidance when determining appropriate replacement ratios and width of wetland buffers. It
should also be understood that this simplistic model over-assigned the density of Category 4
wetlands, and in truth some of them may be Category 2/3 based poor information on hydrologic
connectivity. If this system is implemented the results of a wetland must be confirmed with on-
the-ground data before land management decisions are made about the wetland in question. The
simplification detailed above also causes several wetlands to be unclassified, because only three
parameters existed to sort each wetland and there were some that did not fulfil any of those
requirements. The end decision of the authors was to classify these as Category 4, because while
they were larger than 2 acres they did not contain critical habitat for endangered species or
occurrences of species that are of high conservation interest in Montana. To see which wetlands
remained unclassified, access the unclassified map layer.
Development of more detailed understanding of wetlands will greatly improve the
accuracy of this model. Areas of focus should especially include the occurrence and density of
invasive species, community diversity, and habitat features. This data will allow the use of the
on-site determination to differentiate between Categories 2 and 3, as well as shift some Category
4 wetlands into a more accurate classification. This version of the Washington wetland
assessment tool was used because of its relative simplicity compared to newer versions. This
classifying scheme (see Table 1) will be essential for future assessments that are developed to
protect local wetland and riparian ecosystems of Gallatin County.
Conclusions Bozeman's rapidly growing population continues to threaten natural resources in the
surrounding area, especially aquatic resources. Wetlands have been shown to store and purify
significant amounts of water, as well as provide many other ecosystem services that the 47,000
people in Bozeman currently benefit from. Bozeman has already lost substantial natural wetland
acreage due to a reliance on the mitigation aspect of “no-net-loss”; its residents will not receive
these benefits unless the policies surrounding mitigation are revised and enforced. There is a
major loss of ecosystem services from Bozeman when its wetlands are filled and mitigated in
Twin Bridges. Planners in Bozeman should make allowances for not only the conservation of
existing wetlands, but localized mitigation of any wetlands filled for unavoidable development
needs. Wetlands have a higher success rate for meeting compliance standards when ecosystem
functions are replaced in a localized manner. Furthermore, it is highly beneficial to Bozeman’s
residents to localize these replacement hydrologic functions.
If Bozeman’s population continues to grow at its current rate, wetlands will continue to
be impacted as will their ability to provide ecological services to rising demand in the coming
years. Changes in current water resource management policy should consider the remarkable
benefits that could arise from keeping wetlands local. Other things to take into consideration are:
13
the possibility of creating a mitigation bank directly near Bozeman for future wetland mitigation
and altering the scale of future management decisions to take a small-scale watershed approach -
as recommended by the EPA. Additionally, the maps provided in this report can be utilized for
future land-use decisions and can assist land managers with prioritizing avoidance of the most
critical wetland ecosystems as Bozeman continues to grow and develop.
An important factor influencing the migration rate to Bozeman is its natural beauty and
recreational landscape, both of which are augmented by the presence of wetlands. The whole of
Montana has been dubbed “the last best place” because of this concept of untouched nature, and
it would certainly be a shame for that to no longer apply to Bozeman in the future. This furthers
the importance of keeping our remaining wetlands intact for future generations.
References
Army Corps of Engineers, Environmental Protection Agency, & Institute on Water Resources. (2015). The
mitigation rule retrospective: A review of the 2009 regulations governing compensatory mitigation for losses of
aquatic resources. Retrieved from: https://www.epa.gov/sites/production/files/2015-
11/documents/mitrule_report_october_2015.pdf
Balcombe, C. K., Anderson, J. T., Fortney, R. H., Rentch, J. S., Grafton, W. N., & Kordek, W. S. (2005). A
comparison of plant communities in mitigation and reference wetlands in the mid-Appalachians. Wetlands, 25(1),
130–142.
Bellingham, Washington, Municipal Code Ch. 16.55. (2013) Retrieved from
https://bellingham.municipal.codes/BMC/16.55
BenDor, T., & Brozović, N. (2007). Determinants of spatial and temporal patterns in compensatory wetland
mitigation. Environmental Management, 40(3), 349–364.
Berglund, J., & R. McEldowney. (2008). MDT Montana wetland assessment method. Montana Department of
Transportation. Retrieved from:
https://www.mdt.mt.gov/other/webdata/external/planning/wetlands/2008_wetland_assessment/2008_mwam_man
ual.pdf
City of Bozeman Water Department. (2018). Water in Bozeman.
Retrieved from https://www.bozeman.net/government/water-conservation
Clare, S., Krogman, N., Foote, L., & Lemphers, N. (2011). Where is the avoidance in the implementation of wetland
law and policy? Wetlands Ecology and Management 19(2), 165-182.
English, A., & Baker, C. (2004). Wetland and riparian resource assessment of the Gallatin Valley and Bozeman
Creek Watershed, Gallatin County, Montana. Gallatin Local Water Quality District. Retrieved from
https://glwqd.files.wordpress.com/2016/02/wetlands-and-riparian-areas-inventory-of-the-gallatin-valley-report-
2007.pdf
Gallatin Local Water Quality District. (2004). Assessment of wetland and riparian resources in the Gallatin Valley
and Bozeman Creek Watershed, Gallatin County, Montana. Retrieved from
https://glwqd.files.wordpress.com/2016/02/wetland-inventory-project-fact-sheet.pdf
Gallatin Local Water Quality District. (2017). Gallatin Watershed sourcebook: A resident’s guide. Retrieved from
https://glwqd.org/sourcebook/
Government Accountability Office. (2005). Wetlands protection - Corps of Engineers does not have an effective
oversight approach to ensure that compensatory mitigation is occurring. Retrieved from www.gao.gov/cgi-
bin/getrpt?GAO-05-898.
Hackett, O. M., Visher, F. N., McMurtrey, R. G., & Steinhilber, W. L. (1960). Geology and ground water resources
of the Gallatin Valley, Gallatin County, Montana. U.S. Geological Survey Water-Supply. Retrieved from
https://pubs.usgs.gov/wsp/1482/report.pdf
Hruby, T. (2014). Washington state wetland rating system for Western Washington: 2014 Update. Publication #14-
06-029. Olympia, WA: Washington Department of Ecology.
Kayranli, B., Scholz, M., Mustafa, A., & Hedmark, Å. (2010). Carbon storage and fluxes within freshwater
wetlands: A critical review. Wetlands, 30(1), 111–124.
14
Kendall, L. (2018). Bozeman area again ranked fastest-growing of its size in the nation. Bozeman Daily Chronicle.
Retrieved from https://www.bozemandailychronicle.com/news/bozeman-area-again-ranked-fastest-growing-of-
its-size-in/article_881f7994-a3d7-5f68-b85c-5875d2c0749a.html
Kendy, E. (1996). Montana wetland resources. National Water Summary–Wetland Resources, 1-6. Retrieved from
https://www.fws.gov/wetlands/data/Water-Summary-Reports/National-Water-Summary-Wetland-Resources-
Montana.pdf
Kozich, A. T., & Halvorsen, K. E. (2012). Compliance with wetland mitigation standards in the upper peninsula of
Michigan, USA. Environmental Management; New York, 50(1), 97–105.
Loudon, D. (2015). Analysis of coastal wetland geography and policy in Humboldt Bay: Adapting wetland policies
for a changing climate. Retrieved from http://humboldt-
dspace.calstate.edu/bitstream/handle/10211.3/163243/Loudon_Dylan_Fall2015.pdf?sequence=1
Matthews, J. W., & Endress, A. G. (2008). Performance criteria, compliance success, and vegetation development in
compensatory mitigation wetlands. Environmental Management; New York, 41(1), 130–141.
McMillan, A. (1991). Washington state wetlands rating system for eastern Washington. Department of Ecology
State of Washington. Retrieved from https://fortress.wa.gov/ecy/publications/SummaryPages/91058.html
Monares, F. (2018). Bozeman headed toward 50,000 population, for better or worse. Bozeman Daily Chronicle.
Retrieved from https://www.bozemandailychronicle.com/news/county/bozeman-headed-toward-population-for-
better-or-worse/article_8891e43f-8111-5f75-9908-67dc94168263.html
Montana Department of Transportation. (2015). Wetland mitigation program. Montana State Official Website.
Retrieved from https://mdt.mt.gov/publications/datastats/wetlands.shtml
Murphy, J., Goldman-Carter, J., & Sibbing, J. (2009). New mitigation rule promises more of the same: Why the new
Corps and EPA mitigation rule will fail to protect our aquatic resources adequately. Stetson Law Review, 38, 26.
Nahlik, A. M., & Fennessy, M. S. (2016). Carbon storage in US wetlands. Nature Communications, 7, 13835.
Patenaude, T., Smith, A. C., & Fahrig, L. (2015). Disentangling the effects of wetland cover and urban development
on quality of remaining wetlands. Urban Ecosystems; Salzburg, 18(3), 663–684.
Regulatory In-Lieu Fee and Bank Information Tracking System (RIBITS). (2018). Banks & ILF Sites. Retrieved
from ribits.usace.army.mil
Robertson, M., Galatowitsch, S., & Matthews, J. (2017). Longitudinal evaluation of vegetation richness and cover at
wetland compensation sites: Implications for regulatory monitoring under the Clean Water Act. Wetlands Ecology
and Management, 26(6), 1089-1105.
Sauter, D., Johnston, R.F., & Sizemore, J. (2017). An ordinance of Klickitat County, Washington relating to land
use and zoning: Critical area review and evaluation consistent with the Growth Management Act (GMA); and
amending ordinance no. O012704. Klickitat County Board of Commissioners.
Retrieved from https://klickitatcounty.org/DocumentCenter/View/338/Critical-Areas-Ordinance-?bidld=.Accessed
US EPA Office of Inspector General. (2014). EPA needs to clarify its claim of “No-Net-Loss” of wetlands. Report
no. 14-P-0191 Retrieved from https://www.epa.gov/sites/production/files/2015-09/documents/20140416-14-p-
0191_glance.pdf
US EPA. (2015). Section 404 of the Clean Water Act: How wetlands are defined and identified [Overviews and
factsheets]. Retrieved from https://www.epa.gov/cwa-404/section-404-clean-water-act-how-wetlands-are-defined-
and-identified
US EPA. (2017). Section 404 Permit Program. US EPA website. Retrieved from https://www.epa.gov/cwa-
404/section-404-permit-program
Van den Bosch, K., & Matthews, J. W. (2017). An assessment of long-term compliance with performance standards
in compensatory mitigation wetlands. Environmental Management, 59(4), 546–556.
Vought, L. B., Pinay, G., Fuglsang, A., & Ruffinoni, C. (1995). Structure and function of buffer strips from a water
quality. Landscape and Urban Planning, 31(1), 323-331.
Washington State Department of Ecology, U.S. Army Corps of Engineers Seattle District, & U.S. Environmental
Protection Agency Region 10. (2006). Wetland mitigation in Washington State – Part 2: Developing mitigation
plans (Version 1). Washington State Department of Ecology Publication #06-06-011b. Retrieved from:
https://fortress.wa.gov/ecy/publications/documents/0606011b.pdf
Weaver, W., Deford, L., & Byorth, P. (2018). Gallatin Valley losing wetlands to growth and development. Bozeman
Daily Chronicle. Retrieved from https://www.bozemandailychronicle.com/opinions/guest_columnists/gallatin-
valley-losing-wetlands-to-growth-and-development/article_8aecc292-6330-54f8-87da-867463b62603.html
15
Application of a Landscape Disturbance Index to Evaluate the Best Places to
Develop in Gallatin County, Montana
Brody Wallace, Eric Stratton, and Laura Mooney
Introduction Bozeman, Montana is growing at a rate of 4.2%, and is the fastest growing micropolitan
area in the U.S. with receiving almost 4,000 new residents from 2016-2017 (U.S. Census Bureau,
2018). The U.S. Census Bureau estimates the Gallatin County will have 55,000 new residents by
2045 (Kendall et al., 2018). Although this growth does indicate a strong economy, the
opportunities for its residents comes with an environmental penalty. This increased urbanization
has expanded onto historic agriculture lands and natural areas. Wetlands are an example of a
natural area that has a very important part of an ecosystem. They provide many ecosystem
services including, aquifer recharge, water storage, flood control, sediment control, nutrient
removal, erosion control, habitat for wildlife and plants, recreation, and visual and aesthetic
pleasure (City of Bozeman, 2016). Undeveloped areas adjacent to development can also
experience secondary effects that originate from the development. The greater the development,
the greater the intensity of impacts. These impacts come from a combination of air and
waterborne pollutants, physical damage, and changes in the suite of environmental conditions
(Brown et al., 2005).
The policy of no-net loss of wetlands was initiated under President George H. W. Bush in
1988. This executive order requires no-net-loss of wetland area, functions and values. If wetlands
are filled under benefit of federal permits, that fill must be mitigated for to ensure no-net-loss.
Wetland banks are intended to provide mitigation by selling credits for that acreage with the
intention of replacing total acres of wetlands and the functions and values of those wetlands that
are lost (Sibbing, n.d.). Here in Bozeman, the closest wetland mitigation bank is 90 miles away.
As recently as 2018, the U.S. Army Corps of Engineers permitted the fill of over 10 acres
of wetlands in Bozeman for residential and commercial development (Weaver et al., 2018). The
loss of wetlands has the potential to negatively impacts local aquatic functions in the Gallatin
Valley. For instance, development on wetlands can decrease surface water storage and
groundwater recharge. As impervious area increases, the velocity and volume of surface runoff
increases and there is a corresponding decrease in infiltration (Arnold et al., 1996). Additionally,
as these wetlands are turned to residential areas, there is a decrease in the ability of the landscape
to remove excess nutrients and pollutants. There is also an increase in nutrients from the overuse
of lawn fertilizers. The Department of Environmental Quality already determined that 14
tributaries of the Gallatin River do not meet the applicable water quality standards due to
excessive sediment and nutrients (Bullock et al., 2013). As Gallatin Valley continues to grow,
the problems with water storage, nutrient removal and atheistic pleasure will increase. It is
important for our City to be active about these problems and not reactive when the issues require
attention. To respond to the growth in Gallatin County it will become essential to develop growth
plans to ensure the least impact options regarding soil, wetland, and forest quality be taken in
Gallatin County as it continues to grow.
Project Idea Since development is inevitable we are interested in finding the least impact locations for
future development within Gallatin County. We will focus on using Geographical Information
Systems (GIS) approach to create a land disturbance index (LDI) that will aid in Gallatin
16
County’s developmental planning. Our criteria for the best places to develop includes avoiding
wetlands, prime farmland; land that is available and has the best combination of physical and
chemical properties for producing food, feed, forage, fiber, or oilseed crops (National Resources
Inventory, 1997), and preferably on already disturbed land. We plan to use current development
mechanisms that are being employed in the City in combination with parameters we think are
important to consider. Our parameters will be combined in GIS to create a land disturbance
index. This method assigns numerical values to various types of land (agricultural, urban,
natural, etc.), therefore allowing planners to assess environmental quality over a spatial scale.
Using this method of assessment, planners can make more informed decisions about land use.
They can also use LDI values to determine the overall quality of different types of landscape,
and how changes might affect the system. Planners may consider the level of disturbance in
different areas, or the distance between higher levels of disturbance, to evaluate human impact.
This method may also indicate when and where mitigation efforts are most needed. Maps created
using the LDI method may assist in urban planning, as they provide a quantified and easily
understandable compilation of environmental quality and anthropogenic impacts (Decker et al.,
2017). Using preexisting data layers such as soils, wetlands, land use/cover, waterways, roads,
and digital elevation models, a model of optimal land use will be developed. The model will
emphasize preservation of prime farmland, wetlands, and existing greenspace while identifying
the best areas for residential and commercial development. Land disturbance indexes have been
used to reflect land use and determine the least or most human impacted areas. The LDI can then
be used to recommend sites for development based on their land disturbance values.
LDI Development Urban planning that considers possible environmental damages can be cost effective over
time. For the most effective results, planners and scientists suggest that cities shouldn’t plan to
avoid building challenges and increase the ease of growth, but to maximize the overall
productivity of the land. By doing this, planners may be able to find a balance between
sustainable growth and meeting the greater needs of the community (McCormack, 1974). In
Bozeman, city planning ideas do not need to be completely reimagined. Other cities have had
success in city planning through strategic zoning, regulations, and mapping. Emulating places
that have been through intense growth periods and still retained healthy wetlands and maximized
ecosystem productivity may save Gallatin County planners time, money and reduce the need for
a trial-and-error approach. Wetlands, for instance, are protected by local, state, and federal laws.
Applicants with development proposals that may adversely affect wetlands must apply
mitigation sequencing before permitting agencies consider compensatory mitigation options. In
Washington, permitting agencies require applicants to show that they have followed the
mitigation sequence and worked first to avoid and minimize impacts to wetlands wherever
practicable.
Mitigation sequencing includes: 1. Avoiding the impact altogether by not taking a certain action or parts of an action.
2. Minimizing impacts by limiting the degree or magnitude of the action and its implementation by using
appropriate technology, or by taking affirmative steps to avoid or reduce impacts.
3. Rectifying the impact by repairing, rehabilitating, or restoring the affected environment.
4. Reducing or eliminating the impact over time through preservation and maintenance operations during
the life of the action.
5. Compensating for the impact by replacing, enhancing, or providing substitute resources or environments.
6. Monitoring the impact and taking appropriate corrective measures.
17
Avoiding and minimizing impacts becomes even more important when rare, high quality, or
difficult to replace resources are involved (Washington State Dept. of Ecology, n.d.). Avoidance
is often overlooked in the City of Bozeman even though wetlands provide benefits to the
ecosystem. Because of this issue, we placed greater importance on the protection of wetlands
when building our LDI. Using the LDI to evaluate where wetlands occur around the county can
help developers better achieve avoidance rather than relying on the later steps of mitigation or
compensation. Similarly, other factors can also be prioritized when defining LDI values which is
why we created three separate scenarios with the LDI framework that we built. The three
scenarios specifically highlight different land uses that might receive higher values depending on
the user’s interests. The first scenario focused on placing value on farmland, forests, and
wetlands. This scenario represents where development is most suitable when considering all
parameters important. Our second scenario placed importance on just the farmlands. This would
be useful for developers as they continue to expand west of Bozeman because there is an
abundance of prime farmland that they would remove from the agricultural economy of the
County. The scenario prioritizes prime farmland might steer development away from this fertile
land, and to areas that were previously degraded, or have less of an agriculture potential. The
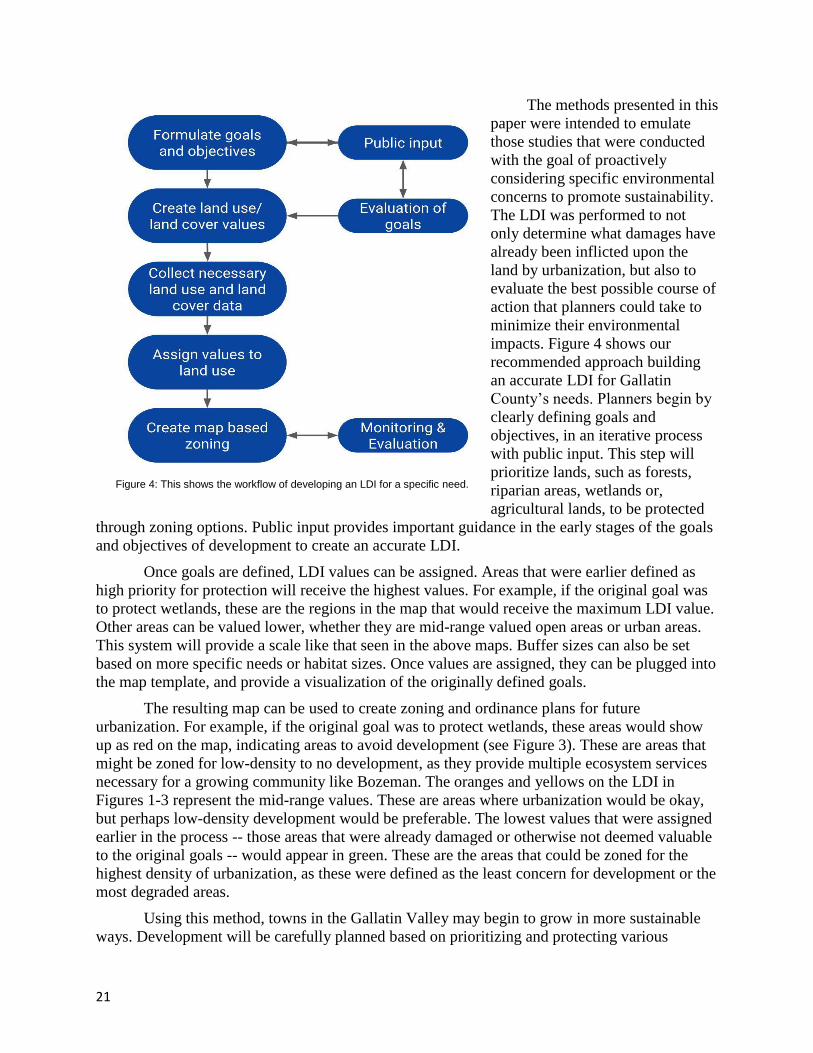
third scenario we made prioritizes forests and wetlands. This would most likely be used by
developers or city planners that are most concerned with the loss of ecosystem services from our
immediate surrounding. As mentioned earlier, ecosystem services are vital to any city and
become increasingly important as the population in Gallatin County continues to grow. The
flexibility of the model we built makes it easy to change any of the LDI values to better suit any
user’s needs. This also allows for the framework to be continually improved and adapted as the
needs of the county develop and change.
Methods
Conceptually the LDI is a simple process. All layers used: soils, wetlands, land cover,
City boundaries, and roads in the LDI were converted to a raster projected in NAD 83 Montana
state plane with 30 by 30-meter cells. Each cell in all layers were assigned a value of 0-100 with
0 being completely degraded land and 100 being prime land in the farm land scenario (Table 1).
The rasterized layers were then run through a cell statistic tool and a mean value for each cell
location was calculated into a new raster that was the basis for the LDI. After which a DEM of
Gallatin County was built using a mosaic of National Elevation Datasets. This DEM was used to
build a slope raster that was used to mask slopes at or greater than 15%, the max slope to be
considered for development in the model. Although on a macro scale of the project the LDI is
straightforward, considerable and specific preparation had to be done on each layer used to build
the LDI.
Soil:
Soils data was acquired for the Gallatin County from Web soil survey (Gallatin County
GIS, 2005). This layer did not have the soil suitability for farming, so that data was obtained
from the NRCS (NRCS, n.d.), converted to a table, and joined to the Gallatin County Soil data.
This added a “farm class”, attribute to every soil in the county. The farm class attribute was then
reclassed and used in the statistic step of the LDI model.
18
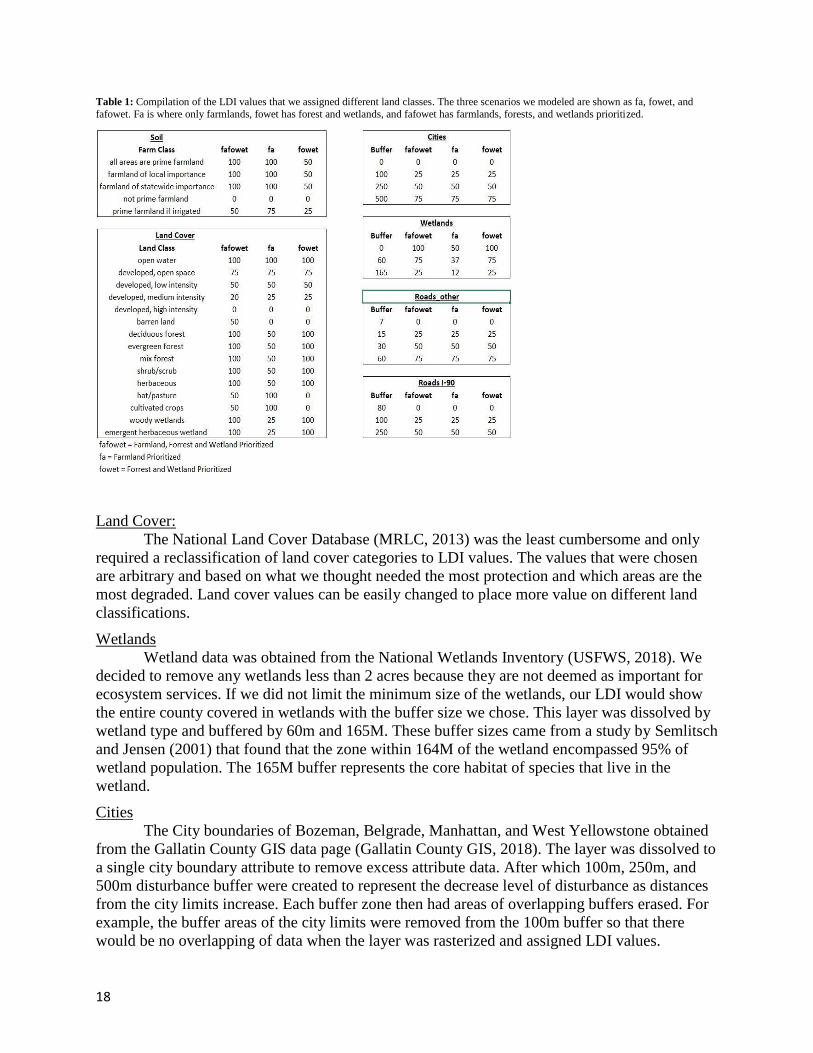
Table 1: Compilation of the LDI values that we assigned different land classes. The three scenarios we modeled are shown as fa, fowet, and
fafowet. Fa is where only farmlands, fowet has forest and wetlands, and fafowet has farmlands, forests, and wetlands prioritized.
Land Cover:
The National Land Cover Database (MRLC, 2013) was the least cumbersome and only
required a reclassification of land cover categories to LDI values. The values that were chosen
are arbitrary and based on what we thought needed the most protection and which areas are the
most degraded. Land cover values can be easily changed to place more value on different land
classifications.
Wetlands
Wetland data was obtained from the National Wetlands Inventory (USFWS, 2018). We
decided to remove any wetlands less than 2 acres because they are not deemed as important for
ecosystem services. If we did not limit the minimum size of the wetlands, our LDI would show
the entire county covered in wetlands with the buffer size we chose. This layer was dissolved by
wetland type and buffered by 60m and 165M. These buffer sizes came from a study by Semlitsch
and Jensen (2001) that found that the zone within 164M of the wetland encompassed 95% of
wetland population. The 165M buffer represents the core habitat of species that live in the
wetland.
Cities
The City boundaries of Bozeman, Belgrade, Manhattan, and West Yellowstone obtained
from the Gallatin County GIS data page (Gallatin County GIS, 2018). The layer was dissolved to
a single city boundary attribute to remove excess attribute data. After which 100m, 250m, and
500m disturbance buffer were created to represent the decrease level of disturbance as distances
from the city limits increase. Each buffer zone then had areas of overlapping buffers erased. For
example, the buffer areas of the city limits were removed from the 100m buffer so that there
would be no overlapping of data when the layer was rasterized and assigned LDI values.
19
Roads
Using Road data from Gallatin County GIS (Gallatin County GIS, 2018) dirt roads,
driveways, and roads within city limits, were the LDI score was already 0, were removed to
prevent redundancy and to acknowledge that a dirt road in the woods would have a negligible
impact when compared to a major road. Using aerial imagery, the average width of the different
road types was measured and used to make a buffer that represent the actual size of the feature
because the layer consisted of line features which does not contain any width information. I-90
was removed from the trimmed road data and converted to its own individual layer as it is a
major highway and needed a larger buffer than smaller roads. 1-90 received a buffer of 100M
and 250M to emphasize the importance of protecting areas further from the road corridor. The
smaller roads were given a buffered at 60M and 30M based on the findings from a study by C.
Murcia (1995).
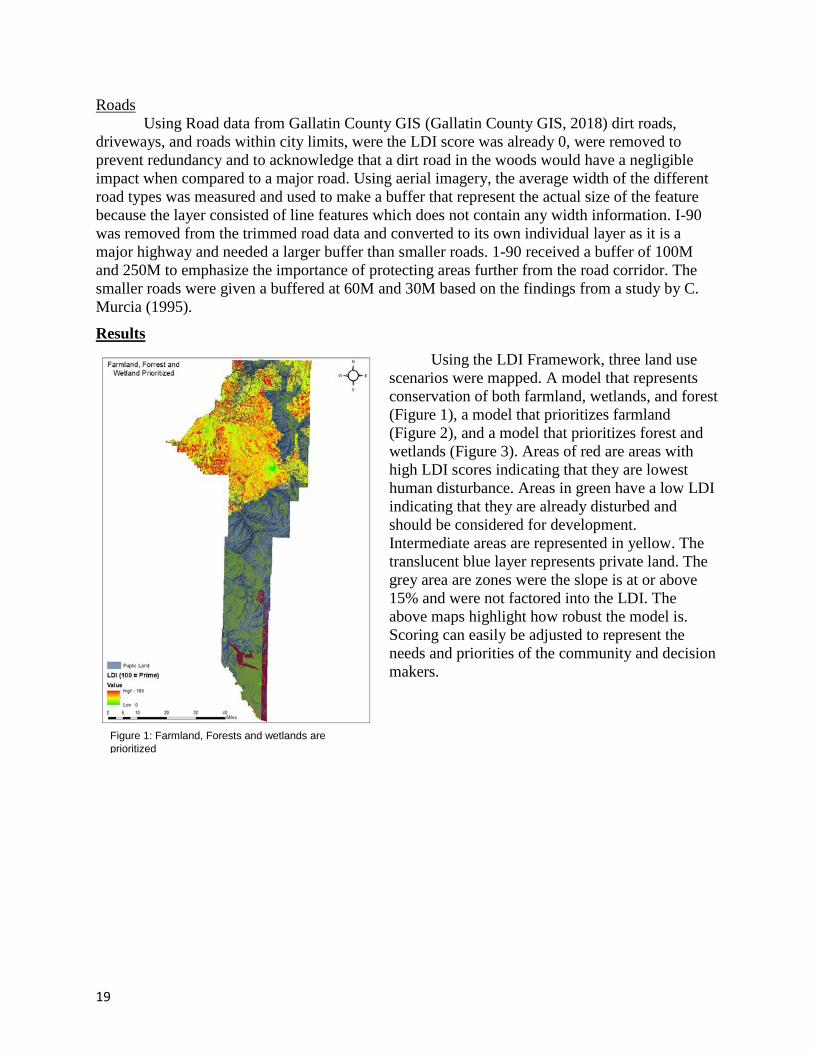
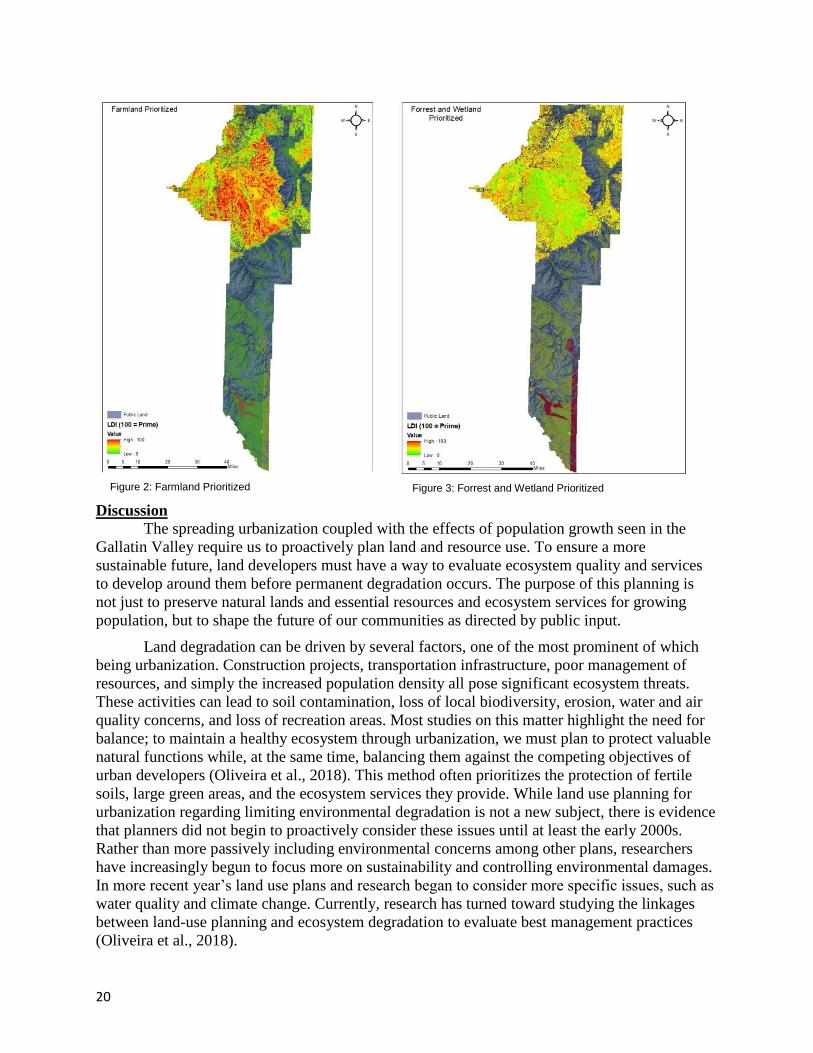
Results
Using the LDI Framework, three land use
scenarios were mapped. A model that represents
conservation of both farmland, wetlands, and forest
(Figure 1), a model that prioritizes farmland
(Figure 2), and a model that prioritizes forest and
wetlands (Figure 3). Areas of red are areas with
high LDI scores indicating that they are lowest
human disturbance. Areas in green have a low LDI
indicating that they are already disturbed and
should be considered for development.
Intermediate areas are represented in yellow. The
translucent blue layer represents private land. The
grey area are zones were the slope is at or above
15% and were not factored into the LDI. The
above maps highlight how robust the model is.
Scoring can easily be adjusted to represent the
needs and priorities of the community and decision
makers.
Figure 1: Farmland, Forests and wetlands are
prioritized
20
Discussion The spreading urbanization coupled with the effects of population growth seen in the
Gallatin Valley require us to proactively plan land and resource use. To ensure a more
sustainable future, land developers must have a way to evaluate ecosystem quality and services
to develop around them before permanent degradation occurs. The purpose of this planning is
not just to preserve natural lands and essential resources and ecosystem services for growing
population, but to shape the future of our communities as directed by public input.
Land degradation can be driven by several factors, one of the most prominent of which
being urbanization. Construction projects, transportation infrastructure, poor management of
resources, and simply the increased population density all pose significant ecosystem threats.
These activities can lead to soil contamination, loss of local biodiversity, erosion, water and air
quality concerns, and loss of recreation areas. Most studies on this matter highlight the need for
balance; to maintain a healthy ecosystem through urbanization, we must plan to protect valuable
natural functions while, at the same time, balancing them against the competing objectives of
urban developers (Oliveira et al., 2018). This method often prioritizes the protection of fertile
soils, large green areas, and the ecosystem services they provide. While land use planning for
urbanization regarding limiting environmental degradation is not a new subject, there is evidence
that planners did not begin to proactively consider these issues until at least the early 2000s.
Rather than more passively including environmental concerns among other plans, researchers
have increasingly begun to focus more on sustainability and controlling environmental damages.
In more recent year’s land use plans and research began to consider more specific issues, such as
water quality and climate change. Currently, research has turned toward studying the linkages
between land-use planning and ecosystem degradation to evaluate best management practices
(Oliveira et al., 2018).
Figure 3: Forrest and Wetland Prioritized Figure 2: Farmland Prioritized
21
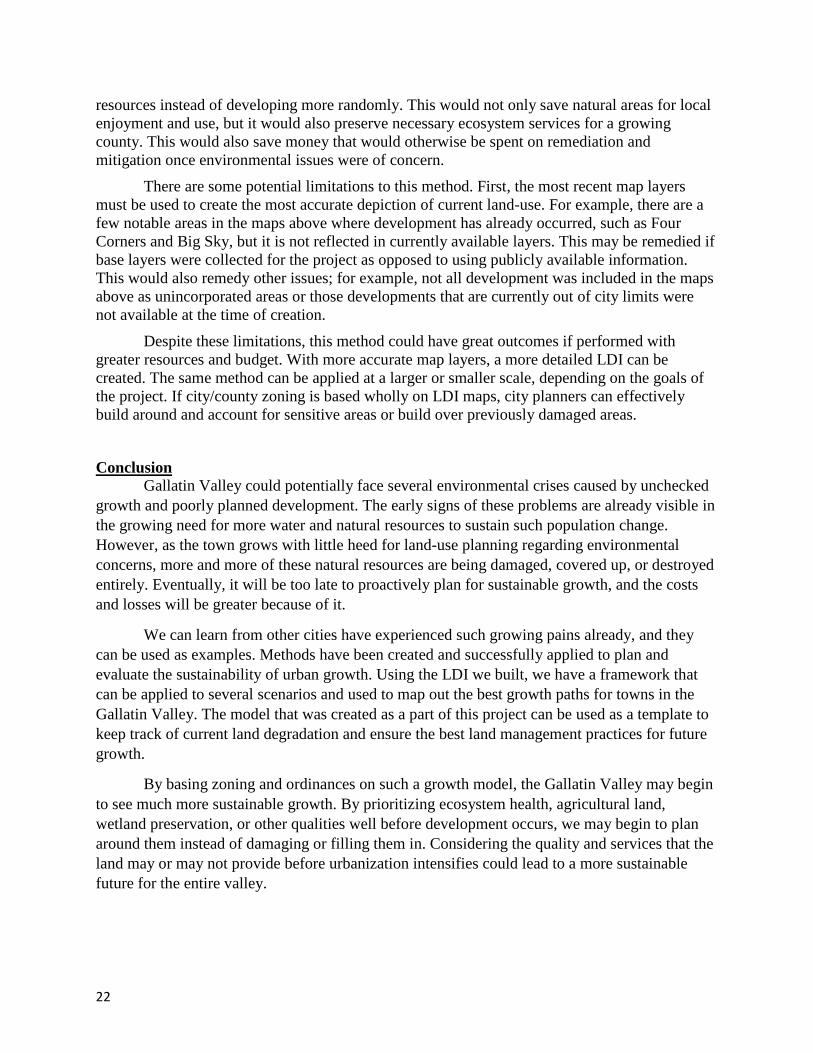
The methods presented in this
paper were intended to emulate
those studies that were conducted
with the goal of proactively
considering specific environmental
concerns to promote sustainability.
The LDI was performed to not
only determine what damages have
already been inflicted upon the
land by urbanization, but also to
evaluate the best possible course of
action that planners could take to
minimize their environmental
impacts. Figure 4 shows our
recommended approach building
an accurate LDI for Gallatin
County’s needs. Planners begin by
clearly defining goals and
objectives, in an iterative process
with public input. This step will
prioritize lands, such as forests,
riparian areas, wetlands or,
agricultural lands, to be protected
through zoning options. Public input provides important guidance in the early stages of the goals
and objectives of development to create an accurate LDI.
Once goals are defined, LDI values can be assigned. Areas that were earlier defined as
high priority for protection will receive the highest values. For example, if the original goal was
to protect wetlands, these are the regions in the map that would receive the maximum LDI value.
Other areas can be valued lower, whether they are mid-range valued open areas or urban areas.
This system will provide a scale like that seen in the above maps. Buffer sizes can also be set
based on more specific needs or habitat sizes. Once values are assigned, they can be plugged into
the map template, and provide a visualization of the originally defined goals.
The resulting map can be used to create zoning and ordinance plans for future
urbanization. For example, if the original goal was to protect wetlands, these areas would show
up as red on the map, indicating areas to avoid development (see Figure 3). These are areas that
might be zoned for low-density to no development, as they provide multiple ecosystem services
necessary for a growing community like Bozeman. The oranges and yellows on the LDI in
Figures 1-3 represent the mid-range values. These are areas where urbanization would be okay,
but perhaps low-density development would be preferable. The lowest values that were assigned
earlier in the process -- those areas that were already damaged or otherwise not deemed valuable
to the original goals -- would appear in green. These are the areas that could be zoned for the
highest density of urbanization, as these were defined as the least concern for development or the
most degraded areas.
Using this method, towns in the Gallatin Valley may begin to grow in more sustainable
ways. Development will be carefully planned based on prioritizing and protecting various
Figure 4: This shows the workflow of developing an LDI for a specific need.
22
resources instead of developing more randomly. This would not only save natural areas for local
enjoyment and use, but it would also preserve necessary ecosystem services for a growing
county. This would also save money that would otherwise be spent on remediation and
mitigation once environmental issues were of concern.
There are some potential limitations to this method. First, the most recent map layers
must be used to create the most accurate depiction of current land-use. For example, there are a
few notable areas in the maps above where development has already occurred, such as Four
Corners and Big Sky, but it is not reflected in currently available layers. This may be remedied if
base layers were collected for the project as opposed to using publicly available information.
This would also remedy other issues; for example, not all development was included in the maps
above as unincorporated areas or those developments that are currently out of city limits were
not available at the time of creation.
Despite these limitations, this method could have great outcomes if performed with
greater resources and budget. With more accurate map layers, a more detailed LDI can be
created. The same method can be applied at a larger or smaller scale, depending on the goals of
the project. If city/county zoning is based wholly on LDI maps, city planners can effectively
build around and account for sensitive areas or build over previously damaged areas.
Conclusion Gallatin Valley could potentially face several environmental crises caused by unchecked
growth and poorly planned development. The early signs of these problems are already visible in
the growing need for more water and natural resources to sustain such population change.
However, as the town grows with little heed for land-use planning regarding environmental
concerns, more and more of these natural resources are being damaged, covered up, or destroyed
entirely. Eventually, it will be too late to proactively plan for sustainable growth, and the costs
and losses will be greater because of it.
We can learn from other cities have experienced such growing pains already, and they
can be used as examples. Methods have been created and successfully applied to plan and
evaluate the sustainability of urban growth. Using the LDI we built, we have a framework that
can be applied to several scenarios and used to map out the best growth paths for towns in the
Gallatin Valley. The model that was created as a part of this project can be used as a template to
keep track of current land degradation and ensure the best land management practices for future
growth.
By basing zoning and ordinances on such a growth model, the Gallatin Valley may begin
to see much more sustainable growth. By prioritizing ecosystem health, agricultural land,
wetland preservation, or other qualities well before development occurs, we may begin to plan
around them instead of damaging or filling them in. Considering the quality and services that the
land may or may not provide before urbanization intensifies could lead to a more sustainable
future for the entire valley.
23
References
Ahmed, R., & Haroon, S. (2016). Derivation of ecological indicators for assessing landscape health and habitat
disturbance in Lower Barpani watershed of Assam (India). Forum Geografic; Craiova, XV(1), 80–90.
http://dx.doi.org/10.5775/fg.2016.018.i
Brown, M. T., & Vivas, M. B. (2005). LANDSCAPE DEVELOPMENT INTENSITY INDEX. Environmental
Monitoring and Assessment, 101(1–3), 289–309. https://doi.org/10.1007/s10661-005-0296-6
Bullock, S., & Stone-Manning, T. (2013). Lower Gallatin Planning Area TMDLs & Framework Water Quality
Improvement Plan, 268.
Bureau, U.S. Census. (2018). Dallas-Fort Worth-Arlington Has Largest Growth in the U.S. Retrieved October 3,
2018, from https://www.census.gov/newsroom/press-releases/2018/popest-metro-county.html
Chester L. Arnold Jr. & C. James Gibbons (1996) Impervious Surface Coverage: The Emergence of a Key
Environmental Indicator, Journal of the American Planning Association, 62:2, 243-258, DOI:
10.1080/01944369608975688
City of Bozeman, (2016). Bozeman UDC Re-Organization - Draft, 26.
Decker, K. L., Pocewicz, A., Harju, S., Holloran, M., Fink, M. M., Toombs, T. P., & Johnston, D. B. (2017).
Landscape disturbance models consistently explain variation in ecological integrity across large landscapes.
Ecosphere, 8(4), e01775. https://doi.org/10.1002/ecs2.1775
Gallatin County GIS. (2005). Data Available for Download. Retrieved from Gallatin County Montana:
http://gallatincomt.virtualtownhall.net/Public_Documents/gallatincomt_gis/Data%20Download%20Page
Gallatin County GIS. (2018). Data Available for Download. Retrieved from Gallatin County Montana:
http://gallatincomt.virtualtownhall.net/Public_Documents/gallatincomt_gis/Data%20Download%20Page
Gude, P., Economic Profile System (EPS). (2018). Retrieved October 13, 2018, from
https://headwaterseconomics.org/tools/economic-profile-system/
Humphries, H. C., Bourgeron, P. S., & Reynolds, K. M. (2010). Sensitivity Analysis of Land Unit Suitability for
Conservation Using a Knowledge-Based System. Environmental Management; New York, 46(2), 225–236.
http://dx.doi.org/10.1007/s00267-010-9520-4
Kendall, L., & Staff. (2018). Bozeman area again ranked fastest-growing of its size in the nation. Retrieved from
https://www.bozemandailychronicle.com/news/bozeman-area-again-ranked-fastest-growing-of-its-size-
Murcia, C. (1995). Edge effects in fragmented forests: implications for conservation. Trends in Ecology &
Evolution, 10(2), 58–62. https://doi.org/10.1016/S0169-5347(00)88977-6
MRLC, (Multi-Resolution Land Characteristics Consortium). (2013). National Land Cover Database. National Land
Cover Database (NLCD). http://www.mrlc.gov/index.php. Accessed 1 Sept 2013.
National Research Council. 2001. Compensating for Wetland Losses Under the Clean Water Act. Washington, DC:
The National Academies Press. https://doi.org/10.17226/10134.
NRCS. (N/A). Soil Data Access (SDA) Prime and other Important Farmlands. Retrieved from USDA:
https://www.nrcs.usda.gov/Internet/FSE_DOCUMENTS/nrcseprd1338623.html#top
National Resources Inventory. (1997). Prime Farm Land. Retrieved from Natrual Resources Conservation Service:
https://www.nrcs.usda.gov/wps/portal/nrcs/detail/null/?cid=nrcs143_014052
Okwuashi, O. & Ikediashi, D.I. (2013) – GIS-based simulation of land use change, Applied GIS, 10(1), 1-18
Oliveira, E., Tobias, S., Hersperger, A., Oliveira, E., Tobias, S., & Hersperger, A. M. (2018). Can Strategic Spatial
Planning Contribute to Land Degradation Reduction in Urban Regions? State of the Art and Future
Research. Sustainability, 10(4), 949. https://doi.org/10.3390/su10040949
Polzin, P. E. (2015). Gallatin County: Montana’s Economic Growth Leader. Montana Business Quarterly, 53(1), 19.
Reiss, K. C., Hernandez, E., & Brown, M. T. (2014). Application of the landscape development intensity (LDI)
index in wetland mitigation banking. Ecological Modelling.
https://doi.org/10.1016/j.ecolmodel.2013.04.017
Semlitsch, R. D., & Jensen, J. B. (2001). Core habitat, not buffer zone. National wetlands newsletter, 23(4), 5-6.
Sibbing, J. (n.d.). Nowhere Near No-Net-Loss. National Wildlife Federation. Retrieved from
https://www.nwf.org/~/media/PDFs/Wildlife/Nowhere_Near_No-Net-Loss.pdf
Smith, C. (n.d.). Washington State Department of Ecology - Avoidance & minimization. Retrieved December 3,
2018, from https://ecology.wa.gov/Water-Shorelines/Wetlands/Mitigation/Avoidance-and-minimization

24
USFWS (U. S. Fish and Wildlife Service). (2018). National Wetlands Inventory website. U.S. Department of the
Interior, Fish and Wildlife Service, Washington, D.C. http://www.fws.gov/wetlands/
Weaver, W., Deford, L., Byorth, P., & Columnists, Q. (2018). Gallatin Valley losing wetlands to growth and
development. Retrieved October 15, 2018, from
https://www.bozemandailychronicle.com/opinions/guest_columnists/gallatin-valley-losing-wetlands-to-
growth-and-development/article_8aecc292-6330-54f8-87da-867463b62603.html
Young, A. F. (2016). Adaptation actions for integrated climate risk management into urban planning: a new
framework from urban typologies to build resilience capacity in Santos (SP). City, Territory and
Architecture, 3(1), 12. https://doi.org/10.1186/s40410-016-0042-0
25
Effect of Urbanization on Groundwater Resources in the Gallatin Valley
Riley Elgerd, Edison Meece, Meghan Tomczyk, Taylor Zabel
Introduction
In agreement with the pressures that exist globally with population growth and natural
resource utilization, the trends of population growth in the Gallatin Valley bring an urgent need
for careful planning of water allocation and protection. The valley is situated between the
Bridger, Gallatin, and Madison mountain ranges. The Gallatin River, a sub-basin of the Upper
Missouri, is the largest order stream in the area, flowing north into the greater valley at Gallatin
gateway. It is runoff dependent and heavily influenced by snowpack quantity and melt timing.
The Gallatin River is met by many streams that flow out of the north end of Gallatin Range and
out of the west and south aspects of the Bridger range. Three significant streams that flow into
the Gallatin River are Hyalite Creek, Bozeman Creek, and Lyman Spring, and they are listed as
Bozeman’s current water sources according to the 2017 Water Quality Report (City of Bozeman,
2017). Hyalite Creek and Bozeman Creek are both runoff driven out of the Gallatin Range, and
Lyman Spring is a spring creek driven by groundwater pressure coming from the Bridger range.
Although these are currently viable water sources for Bozeman, it is predicted that there will be a
water shortage if the city population continues to grow at current rates. Beneath the Gallatin
Valley is an alluvium-based aquifer consisting of alluvium, material left by streams, and it is
highly permeable to water infiltration (Kendy & Bredehoeft, 2006).
Demographic studies show that the Gallatin Valley underwent population increases
upwards of thirty percent in the decade from 1990 to 2000 and in 2017 experienced an average
annual growth rate of 3.67 percent (Beland, 2001). Population increases are followed by a
variation of demands for water use in agriculture, municipal needs within a community and its
residents, and requirements for ecological and recreational values of our waters. This paper seeks
to assess variables that contribute to groundwater recharge and discuss the contemporary issues
associated with them, to better understand the relationship between urbanization and water use
and give insight on potential solutions to questions surrounding the subject. Answering the three
following questions concerning urban development and the connectedness of groundwater to
surface water in the Gallatin Valley will help achieve this goal:
1) How will changes in land cover affect water movement and groundwater recharge?
2) How do changes in irrigation methods affect recharge of groundwater?
3) How can groundwater pumping and the addition of exempt wells across the Gallatin
Valley affect groundwater levels?
“Increasing population numbers, expanding areas of irrigated agriculture and economic
development are drivers for an ever‐increasing demand for water worldwide . . . The resulting
lowering of groundwater levels can have devastating effects on natural stream flow, groundwater
fed wetlands and related ecosystems,” (Wada et al., 2010).
Changes in Surface Cover
26
Understanding how groundwater is affected by various factors is imperative for
forecasting potential water use scenarios, and for influencing potential management and water
budgeting plans in the future. Recharge is dependent on water use through evapotranspiration,
seasonal precipitation concerning amounts and distribution across different surfaces, and “the
capacity of the ground-water reservoir to store additional water” (Hackett et al., 1960). Land use
change in the Gallatin Valley has seen trends from natural land to agriculture and now to
developed urban areas. With this growth comes the need to examine water use and patterns of
watershed recharge as a function of land cover. One major factor of land cover in water balances
is the effect of impervious surfaces.
As an area experiences urbanization, there are increases in surfaces such as roads,
parking lots, buildings, and other developments. These surfaces reduce the amount of storm
water that can infiltrate into the groundwater supply and most of the water that would have
infiltrated ends up as surface runoff. Changing land from agricultural, wetland, and forest
systems to urban areas can alter hydrologic conditions present by typically increasing “the
volume and rate of surface runoff and [decreasing] groundwater recharge and base flow” (Tang
et al., 2005). Each definitive type of land use has a range of imperviousness, and each cover type
affects watershed recharge through infiltration of storm-water. By understanding how land use is
changing in the valley, and whether there are patterns associated with this change, potential
distributions of future land use can be accounted for and reviewed.
Changes in Irrigation
Agriculture is a significant contributor to water use around the world and has a pronounced
effect in more arid regions. In Montana, there are roughly 1.8 million acres of irrigated land as of
2013 (USDA, 2013). On this irrigated land roughly 2.5 million acre-feet of water, approximately
815 million gallons of water, is applied each year (USDA, 2013). Most of this water comes from
surface water diversion. In 2013, roughly 54,000 acre-feet, 3%, of water used for irrigation was
groundwater (USDA, 2013). This number has been decreasing since 2003 when approximately
96,000 acre-feet, 4.5% of irrigation water, was supplied by groundwater utilization (USDA,
2003).
Currently, three methods of irrigation are widely used throughout the United States: flood
irrigation, sprinkler irrigation, and drip irrigation. Each type of irrigation has several
subcategories, but they are negligible for the context of this study. Flood irrigation involves
either diverting water from a nearby source or pumping water from a groundwater source and
flooding the field with a layer of water. This layer of water then percolates down to the root zone
where it is absorbed by the plants. It is currently the most common method in Montana being
utilized on roughly 61% of irrigated land (USDA, 2013). One downfall is that flood irrigation is
50% efficient, meaning that only 50% of the water applied reaches the root zone (Water
Resources, Development and Management Service, 1989). The rest of the water is lost to
evaporation and percolation below the root zone. Although it has low efficiency, some of the
water that reaches the root will go past the root zone and reenter the aquifer, allowing for
groundwater recharge. In recent years as a response to its inefficiency, there has been a shift
towards sprinkler irrigation. The generally accepted efficiency of sprinkler irrigation ranges from
70-90%, depending on a few variables such as height of sprinkler, and pressure of application
(Rajan et al., 2011). Though the sprinklers are more efficient, less groundwater recharge occurs.
27
Groundwater Pumping
Groundwater is greatly relied on for agriculture, public supply, and industrial uses. However, a
common concern in this resource development is the effect groundwater pumping has on surface
flows. In fact, basin-wide groundwater development would occur over several decades, meaning
the effects of surface flow depletion would go unnoticed for many years in the future (Barlow &
Leake, 2012). Groundwater and surface water greatly correlate with each other, depending on the
depth of the groundwater table below and the state of the connection between the two. There are
two outcomes that the flow of water from above would cause: the surface water body either
drains or recharges the aquifer (Brunner et al., 2008). If the groundwater table keeps lowering,
then the discharge to the surface water will decrease.
In 1993 the Upper Missouri Basin was legislatively closed to any new surface water
appropriations, causing any new development to rely on groundwater as their water supply
(Dunne et al., 2016). Like many of the other U.S. western states, Montana has exempt well
provisions. These exempt wells refer “to groundwater withdrawals that are exempt from one or
more state law requirements that apply to water withdrawals generally” (Richardson, 2012).
Under Montana’s Water Use Act, there are three processes a well must follow to get exempt
from any permits that are required: the withdrawal rate does not exceed thirty-five gallons per
minute, the annual withdrawal does not exceed ten acre-feet per year, and the well cannot be
located within a controlled groundwater area (Ziemer et al., 2012). As Montana’s population
increases, so has the number of exempt wells drilled each year. “Out of Montana's 56 counties,
forty percent of exempt wells developed between 1991 and 2010 were concentrated in the four
fastest‐growing counties: Ravalli, Flathead, Gallatin, and Lewis and Clark” (Ziemer et al., 2012).
This expansion has raised concerns for senior water rights becoming impaired by the effects of
many exempt wells cumulatively causing a large withdrawal. Montana alone has been circling
this issue since the 1980s, with organizations and stakeholders wanting to propose several
possible solutions. The City of Belgrade also relies on groundwater for their water source, which
can only be recharged from water seeping down from higher elevated landscapes. The addition
of exempt wells across the valley adds further pressure on balancing water supply needs without
lowering groundwater levels.
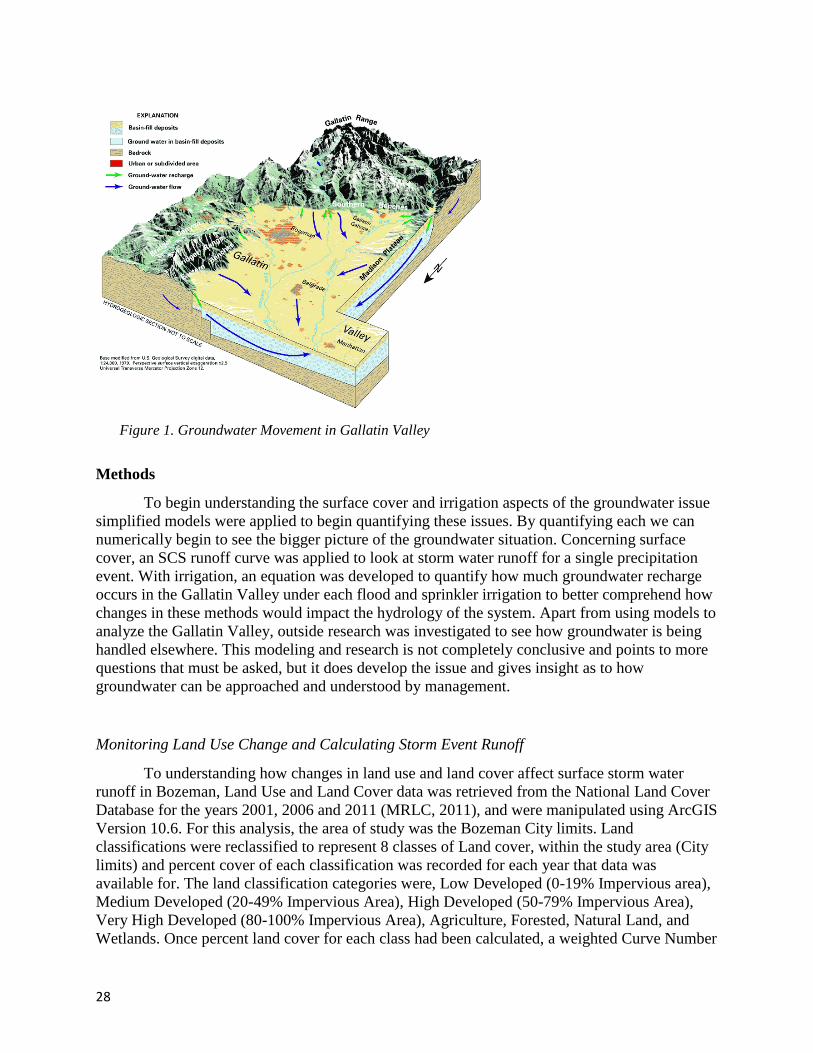
28
Methods
To begin understanding the surface cover and irrigation aspects of the groundwater issue
simplified models were applied to begin quantifying these issues. By quantifying each we can
numerically begin to see the bigger picture of the groundwater situation. Concerning surface
cover, an SCS runoff curve was applied to look at storm water runoff for a single precipitation
event. With irrigation, an equation was developed to quantify how much groundwater recharge
occurs in the Gallatin Valley under each flood and sprinkler irrigation to better comprehend how
changes in these methods would impact the hydrology of the system. Apart from using models to
analyze the Gallatin Valley, outside research was investigated to see how groundwater is being
handled elsewhere. This modeling and research is not completely conclusive and points to more
questions that must be asked, but it does develop the issue and gives insight as to how
groundwater can be approached and understood by management.
Monitoring Land Use Change and Calculating Storm Event Runoff
To understanding how changes in land use and land cover affect surface storm water
runoff in Bozeman, Land Use and Land Cover data was retrieved from the National Land Cover
Database for the years 2001, 2006 and 2011 (MRLC, 2011), and were manipulated using ArcGIS
Version 10.6. For this analysis, the area of study was the Bozeman City limits. Land
classifications were reclassified to represent 8 classes of Land cover, within the study area (City
limits) and percent cover of each classification was recorded for each year that data was
available for. The land classification categories were, Low Developed (0-19% Impervious area),
Medium Developed (20-49% Impervious Area), High Developed (50-79% Impervious Area),
Very High Developed (80-100% Impervious Area), Agriculture, Forested, Natural Land, and
Wetlands. Once percent land cover for each class had been calculated, a weighted Curve Number
Figure 1. Groundwater Movement in Gallatin Valley
29
(CN) was calculated for each year. Soil Conservation Survey Curve Number Method (Equation
1) is a method of calculating runoff (Qrunoff), which considers precipitation (P), soil hydrologic
groups, land cover classification, and hydrologic condition of the soil.
Equation 1: Runoff as a function of CN
Curve Numbers (CN) are a range of coefficients from 30-100 that represent the relative
runoff potential of a catchment area. Lower curve numbers indicate low potential runoff, while
higher curve numbers represent high runoff potential for a storm event. From the weighted curve
numbers, the potential maximum retention after runoff begins (S) (Equation 3), and Initial
Abstractions (Ia) (the maximum amount of storm water that is absorbed by a soil without
producing any runoff) can be calculated.
Equation 2: Maximum Retention after Runoff Begins
Equation 3: Initial Abstractions
For this scenario, precipitation was derived from meteorological data for Bozeman from
2001, 2006 and 2011. Single 24-hour storm events that took place around the same time each
year (13 June 2001 - 1.28 inches, 9 June 2006 – 1.23 inches, and 7 June 2011 – 1.22 inches)
under similar hydrologic conditions were averaged to maintain consistency in runoff
calculations. Therefore, we used an average of 1.24 inches was the accepted precipitation for this
analysis.
Irrigation Groundwater Recharge Method
With the irrigation model, the first goal was to generate an equation that could accurately
describe water use given all the variables that affect groundwater recharge through irrigation.
The variables that were considered were area of application (A) in acres, irrigation type (Gravity
(g), Sprinkler (s)), rate of water application on the field (R) in acre-feet per acre, and
groundwater recharge rate (Rc). All these variables were combined into one equation shown
below where (i) stands for a generalized irrigation type and Tw stands for total water taken out of
the system.
Equation 4: Tw=∑ [(Ai*Ri)-Rc]
The first part of the equation (AiRi) calculates the total amount of water applied to the
field. The recharge coefficient was then applied to the end to deduct the amount of water that
returns to the hydrologic system allowing for a calculation of the amount of water used for
irrigation for all methods of irrigation. Rc is not a constant therefore it must be calculated for
each irrigation type using the equation as follows since each method of irrigation has different
efficiencies.
Equation 5: RC= Σ ((AiRi (1-Ei))-Eo) +Gri)
30
In the case of equation 5, (E) stands for the efficiency of each irrigation method and (Gr)
represents the percentage of water that percolates past the root zone and reaches groundwater. Eo
calculates the equation using a version of the Penman-Monteith equation using temperature data
(Linacre, 1977). The equation is shown below. Tm is defined as the average Temperature (T) +
.006h where h is the elevation in meters. Td is the dew point temperature and A is the latitude
(Linacre, 1977). This equation generates evaporation is mm day-1. Therefore, by dividing by
0.312 yields the results in acre-feet per growing season based on a 95-day growing season.
Equation 6: Eo= (700 Tm/ (100-A)+15(T-Td))/ (80-T)
Gr is not a constant and therefore has to be calculated by the equation below.
Equation 7: Gr= Σ(((AiRiEi)*Ml*D)-St)
Ml represents the antecedent moisture level of the soil. For the context of this model, there are
only two levels of moisture: wet and dry. For dry conditions, the value of Ml is 1 meaning all the
water that no water is restricted from flowing, however for wet conditions the value of Ml
decreases to 0.8. This is because it was found that 20% less water percolates to 150 cm with a
wet antecedent moisture level (Mark Andrew Schaffer, 2011). St is referring to the soil texture,
meaning a sand, silt or loam. Each of these soils has a different water holding capacity. It was
found by a study done in California that loam, which is the most common soil type in the
Gallatin Valley has a water holding capacity of 1.5 inches of water per 36 inches (90 cm) of soil
(Marsha Mathews et al., 2016). D represents the number of days at each antecedent moisture
level. It was found that Gallatin County received rain on average 120 days out of the year
(Montana Climate Office, 2010).
Observed values were found in the USDA agricultural censuses so the calculations were
verified. To verify the calculations and calibrate the model, both observed and calculated values
were plotted on a graph. Watering rates were adjusted slightly to align the calculations for total
water applied with the observed values for total water applied. This was done because only
average watering rates were given and therefore there was some amount of error.
Once the amount of total water applied was verified, the amount of water that reached the
root zone was calculated by multiplying the total water applied by each irrigation method by
their respective efficiencies. These values were again summed to give the total amount of water
that reached the root zone. From here, the amount of groundwater recharge was calculated using
equation 5, 6 and 7. Surface water runoff was calculated using the first part of equation 5. Once
this was done, the amount of recharge was subtracted from the total amount of water applied to
give the total amount of water used. This procedure was then repeated for each year in the
censuses and survey.
Once all the years’ water usages were calculated, the next step was to scale the model
down to the Gallatin Valley. Gallatin County makes up roughly 1.26% of the state of Montana
and based on 2016 statistics from NASS (National Agricultural Statistics Service), the amount of
agricultural land is representative of that percentage. Therefore, each step in the procedure above
was the recalculated for Gallatin County by multiplying the respective values by 1.26% (0.0126).
There were a few assumptions that were made throughout the modeling process that need
to be noted. The first is that the efficiency of the irrigation method is based on the lowest
efficiency for the system including the transportation of water to the field. In the case of flood
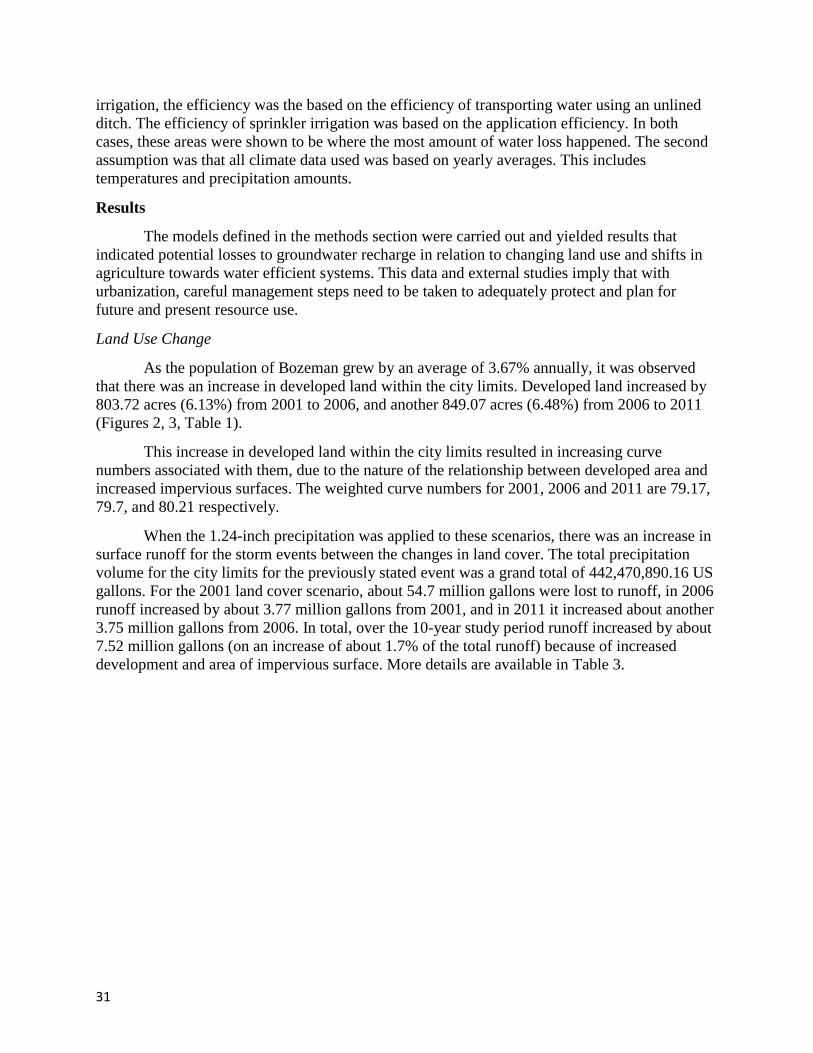
31
irrigation, the efficiency was the based on the efficiency of transporting water using an unlined
ditch. The efficiency of sprinkler irrigation was based on the application efficiency. In both
cases, these areas were shown to be where the most amount of water loss happened. The second
assumption was that all climate data used was based on yearly averages. This includes
temperatures and precipitation amounts.
Results
The models defined in the methods section were carried out and yielded results that
indicated potential losses to groundwater recharge in relation to changing land use and shifts in
agriculture towards water efficient systems. This data and external studies imply that with
urbanization, careful management steps need to be taken to adequately protect and plan for
future and present resource use.
Land Use Change
As the population of Bozeman grew by an average of 3.67% annually, it was observed
that there was an increase in developed land within the city limits. Developed land increased by
803.72 acres (6.13%) from 2001 to 2006, and another 849.07 acres (6.48%) from 2006 to 2011
(Figures 2, 3, Table 1).
This increase in developed land within the city limits resulted in increasing curve
numbers associated with them, due to the nature of the relationship between developed area and
increased impervious surfaces. The weighted curve numbers for 2001, 2006 and 2011 are 79.17,
79.7, and 80.21 respectively.
When the 1.24-inch precipitation was applied to these scenarios, there was an increase in
surface runoff for the storm events between the changes in land cover. The total precipitation
volume for the city limits for the previously stated event was a grand total of 442,470,890.16 US
gallons. For the 2001 land cover scenario, about 54.7 million gallons were lost to runoff, in 2006
runoff increased by about 3.77 million gallons from 2001, and in 2011 it increased about another
3.75 million gallons from 2006. In total, over the 10-year study period runoff increased by about
7.52 million gallons (on an increase of about 1.7% of the total runoff) because of increased
development and area of impervious surface. More details are available in Table 3.
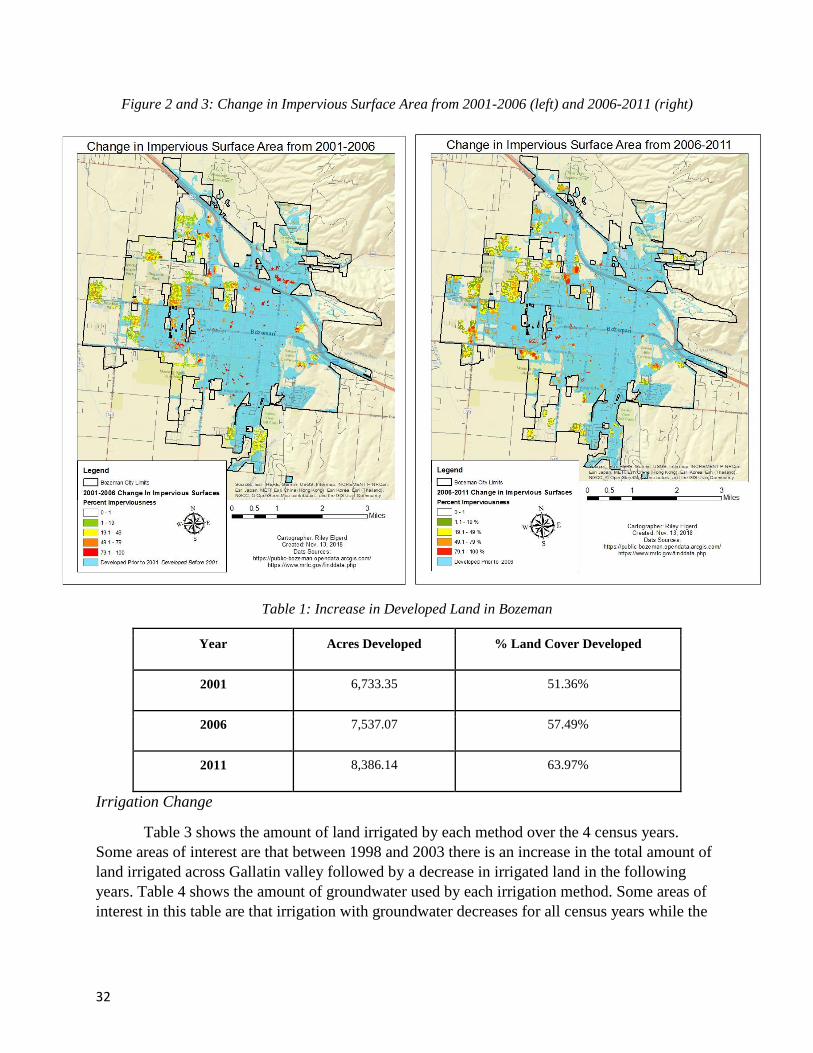
32
Figure 2 and 3: Change in Impervious Surface Area from 2001-2006 (left) and 2006-2011 (right)
Table 1: Increase in Developed Land in Bozeman
Year Acres Developed % Land Cover Developed
2001 6,733.35 51.36%
2006 7,537.07 57.49%
2011 8,386.14 63.97%
Irrigation Change
Table 3 shows the amount of land irrigated by each method over the 4 census years.
Some areas of interest are that between 1998 and 2003 there is an increase in the total amount of
land irrigated across Gallatin valley followed by a decrease in irrigated land in the following
years. Table 4 shows the amount of groundwater used by each irrigation method. Some areas of
interest in this table are that irrigation with groundwater decreases for all census years while the
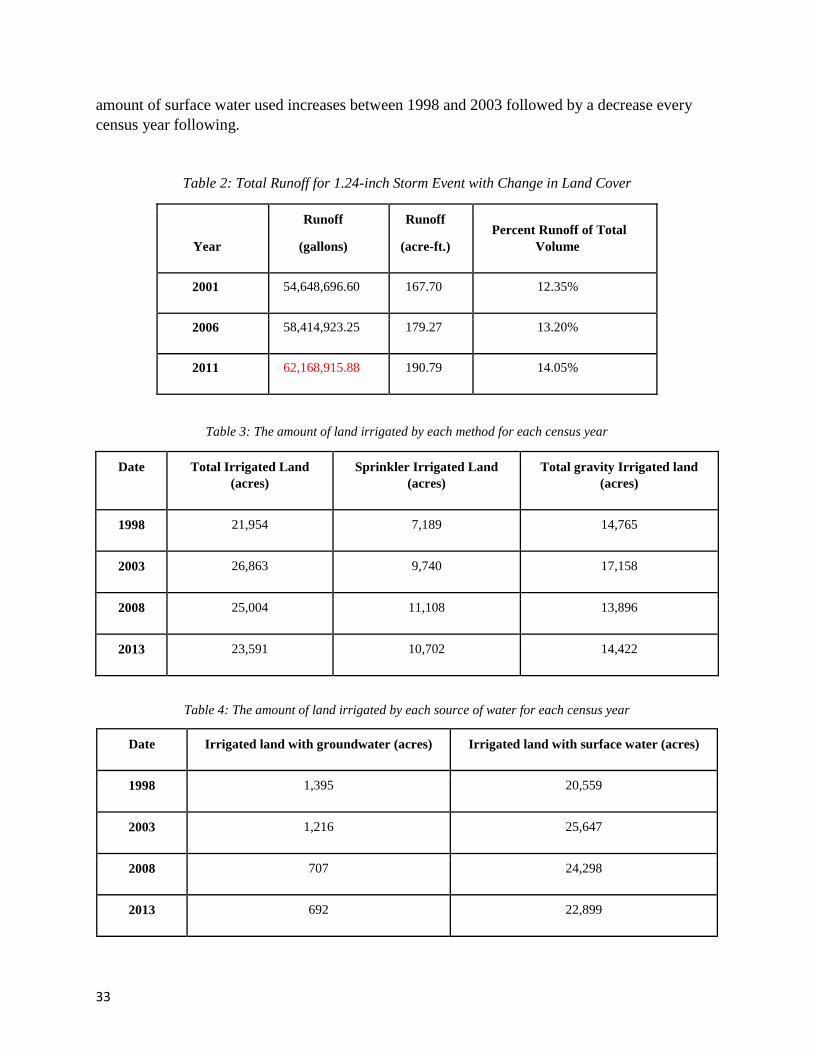
33
amount of surface water used increases between 1998 and 2003 followed by a decrease every
census year following.
Table 2: Total Runoff for 1.24-inch Storm Event with Change in Land Cover
Year
Runoff
(gallons)
Runoff
(acre-ft.)
Percent Runoff of Total
Volume
2001 54,648,696.60 167.70 12.35%
2006 58,414,923.25 179.27 13.20%
2011 62,168,915.88 190.79 14.05%
Table 3: The amount of land irrigated by each method for each census year
Date Total Irrigated Land
(acres)
Sprinkler Irrigated Land
(acres)
Total gravity Irrigated land
(acres)
1998 21,954 7,189 14,765
2003 26,863 9,740 17,158
2008 25,004 11,108 13,896
2013 23,591 10,702 14,422
Table 4: The amount of land irrigated by each source of water for each census year
Date Irrigated land with groundwater (acres) Irrigated land with surface water (acres)
1998 1,395 20,559
2003 1,216 25,647
2008 707 24,298
2013 692 22,899
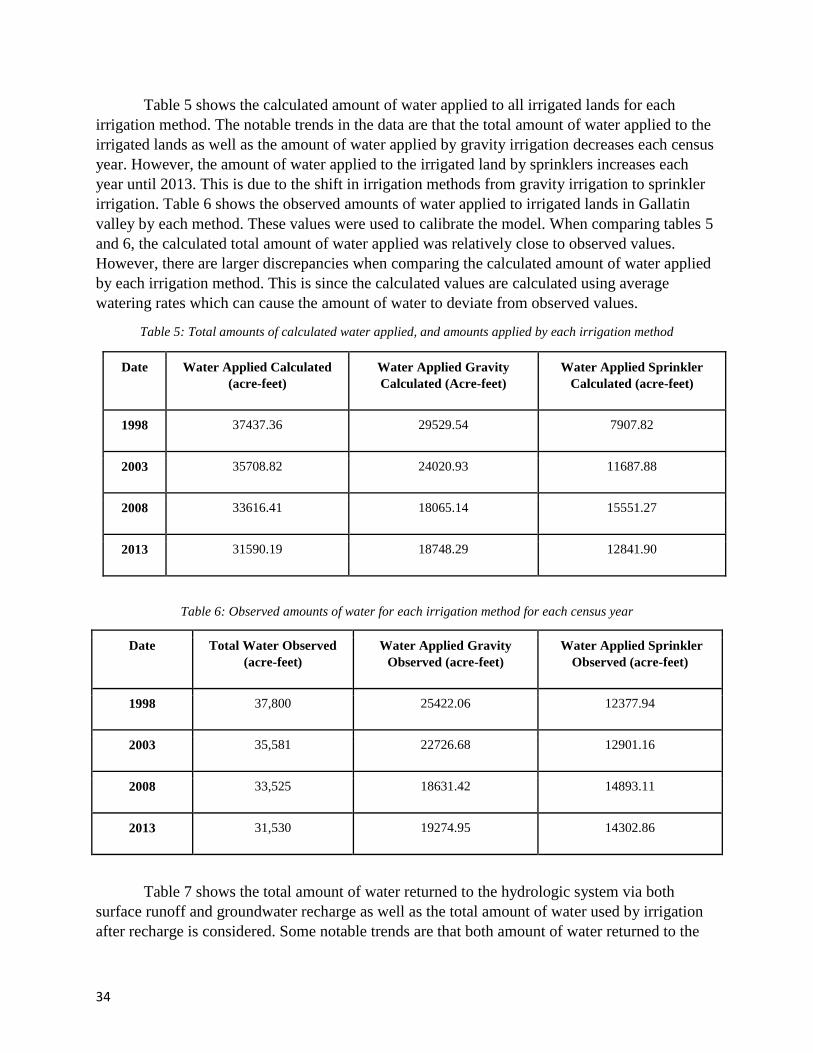
34
Table 5 shows the calculated amount of water applied to all irrigated lands for each
irrigation method. The notable trends in the data are that the total amount of water applied to the
irrigated lands as well as the amount of water applied by gravity irrigation decreases each census
year. However, the amount of water applied to the irrigated land by sprinklers increases each
year until 2013. This is due to the shift in irrigation methods from gravity irrigation to sprinkler
irrigation. Table 6 shows the observed amounts of water applied to irrigated lands in Gallatin
valley by each method. These values were used to calibrate the model. When comparing tables 5
and 6, the calculated total amount of water applied was relatively close to observed values.
However, there are larger discrepancies when comparing the calculated amount of water applied
by each irrigation method. This is since the calculated values are calculated using average
watering rates which can cause the amount of water to deviate from observed values.
Table 5: Total amounts of calculated water applied, and amounts applied by each irrigation method
Date Water Applied Calculated
(acre-feet)
Water Applied Gravity
Calculated (Acre-feet)
Water Applied Sprinkler
Calculated (acre-feet)
1998 37437.36 29529.54 7907.82
2003 35708.82 24020.93 11687.88
2008 33616.41 18065.14 15551.27
2013 31590.19 18748.29 12841.90
Table 6: Observed amounts of water for each irrigation method for each census year
Date Total Water Observed
(acre-feet)
Water Applied Gravity
Observed (acre-feet)
Water Applied Sprinkler
Observed (acre-feet)
1998 37,800 25422.06 12377.94
2003 35,581 22726.68 12901.16
2008 33,525 18631.42 14893.11
2013 31,530 19274.95 14302.86
Table 7 shows the total amount of water returned to the hydrologic system via both
surface runoff and groundwater recharge as well as the total amount of water used by irrigation
after recharge is considered. Some notable trends are that both amount of water returned to the
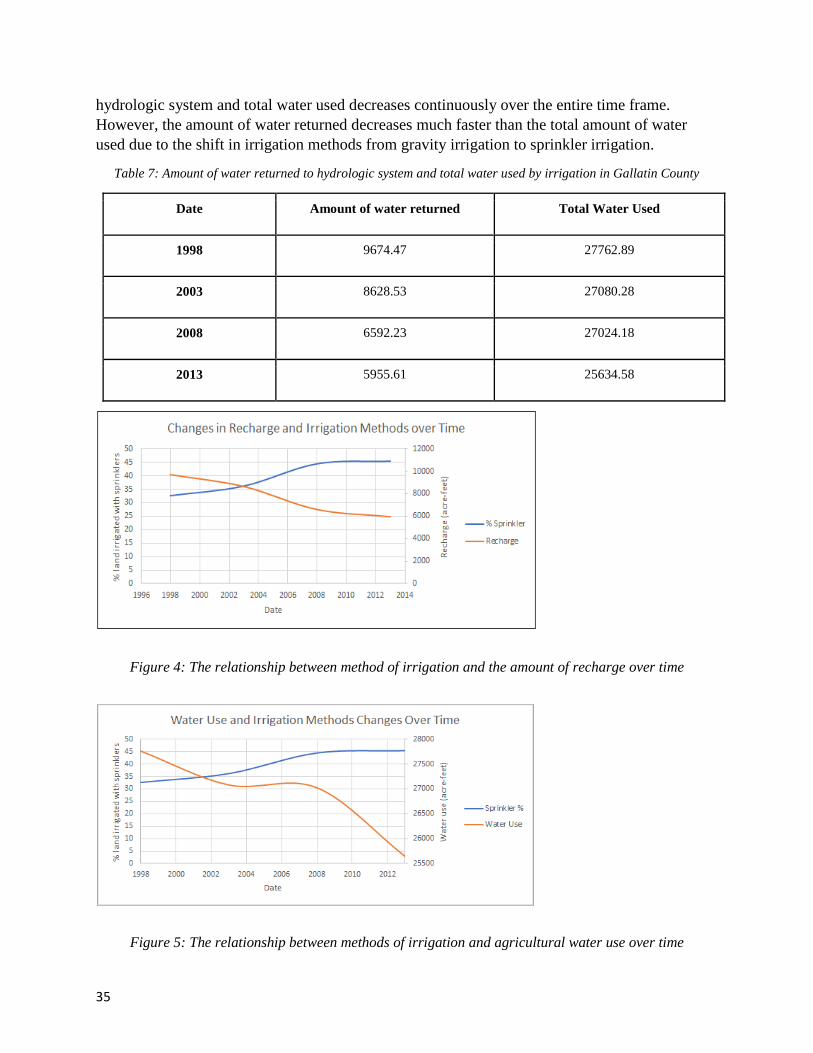
35
hydrologic system and total water used decreases continuously over the entire time frame.
However, the amount of water returned decreases much faster than the total amount of water
used due to the shift in irrigation methods from gravity irrigation to sprinkler irrigation.
Table 7: Amount of water returned to hydrologic system and total water used by irrigation in Gallatin County
Date Amount of water returned Total Water Used
1998 9674.47 27762.89
2003 8628.53 27080.28
2008 6592.23 27024.18
2013 5955.61 25634.58
Figure 4: The relationship between method of irrigation and the amount of recharge over time
Figure 5: The relationship between methods of irrigation and agricultural water use over time
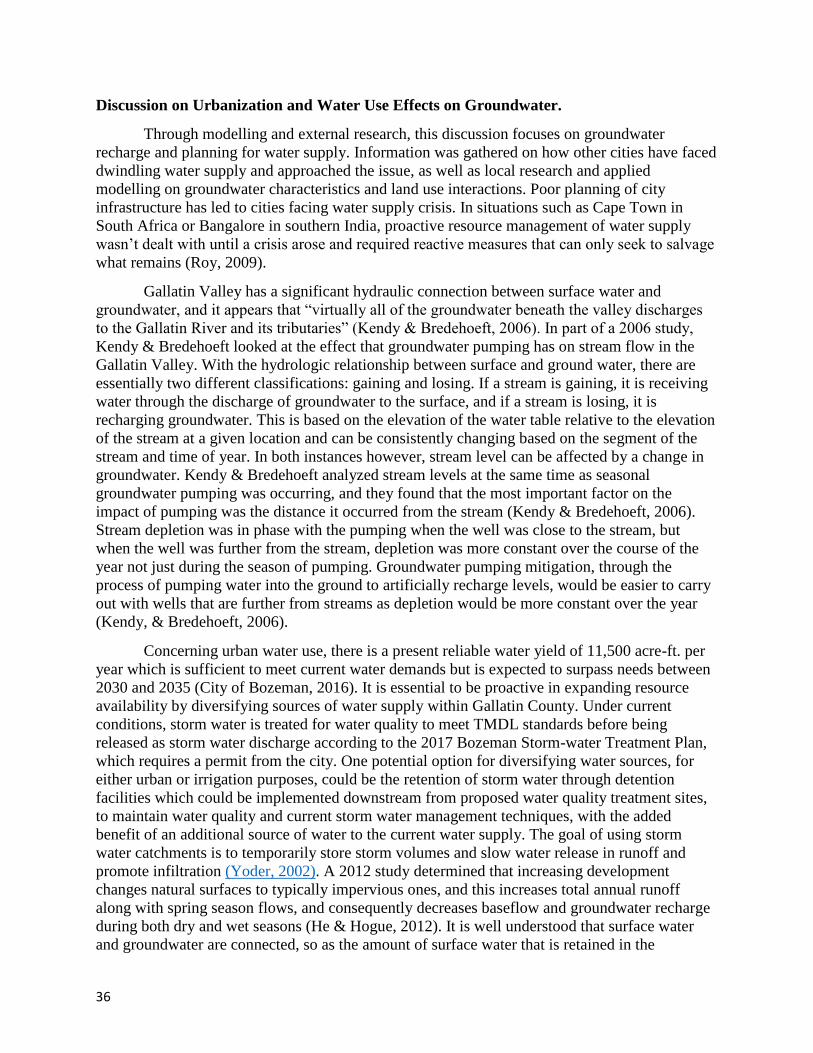
36
Discussion on Urbanization and Water Use Effects on Groundwater.
Through modelling and external research, this discussion focuses on groundwater
recharge and planning for water supply. Information was gathered on how other cities have faced
dwindling water supply and approached the issue, as well as local research and applied
modelling on groundwater characteristics and land use interactions. Poor planning of city
infrastructure has led to cities facing water supply crisis. In situations such as Cape Town in
South Africa or Bangalore in southern India, proactive resource management of water supply
wasn’t dealt with until a crisis arose and required reactive measures that can only seek to salvage
what remains (Roy, 2009).
Gallatin Valley has a significant hydraulic connection between surface water and
groundwater, and it appears that “virtually all of the groundwater beneath the valley discharges
to the Gallatin River and its tributaries” (Kendy & Bredehoeft, 2006). In part of a 2006 study,
Kendy & Bredehoeft looked at the effect that groundwater pumping has on stream flow in the
Gallatin Valley. With the hydrologic relationship between surface and ground water, there are
essentially two different classifications: gaining and losing. If a stream is gaining, it is receiving
water through the discharge of groundwater to the surface, and if a stream is losing, it is
recharging groundwater. This is based on the elevation of the water table relative to the elevation
of the stream at a given location and can be consistently changing based on the segment of the
stream and time of year. In both instances however, stream level can be affected by a change in
groundwater. Kendy & Bredehoeft analyzed stream levels at the same time as seasonal
groundwater pumping was occurring, and they found that the most important factor on the
impact of pumping was the distance it occurred from the stream (Kendy & Bredehoeft, 2006).
Stream depletion was in phase with the pumping when the well was close to the stream, but
when the well was further from the stream, depletion was more constant over the course of the
year not just during the season of pumping. Groundwater pumping mitigation, through the
process of pumping water into the ground to artificially recharge levels, would be easier to carry
out with wells that are further from streams as depletion would be more constant over the year
(Kendy, & Bredehoeft, 2006).
Concerning urban water use, there is a present reliable water yield of 11,500 acre-ft. per
year which is sufficient to meet current water demands but is expected to surpass needs between
2030 and 2035 (City of Bozeman, 2016). It is essential to be proactive in expanding resource
availability by diversifying sources of water supply within Gallatin County. Under current
conditions, storm water is treated for water quality to meet TMDL standards before being
released as storm water discharge according to the 2017 Bozeman Storm-water Treatment Plan,
which requires a permit from the city. One potential option for diversifying water sources, for
either urban or irrigation purposes, could be the retention of storm water through detention
facilities which could be implemented downstream from proposed water quality treatment sites,
to maintain water quality and current storm water management techniques, with the added
benefit of an additional source of water to the current water supply. The goal of using storm
water catchments is to temporarily store storm volumes and slow water release in runoff and
promote infiltration (Yoder, 2002). A 2012 study determined that increasing development
changes natural surfaces to typically impervious ones, and this increases total annual runoff
along with spring season flows, and consequently decreases baseflow and groundwater recharge
during both dry and wet seasons (He & Hogue, 2012). It is well understood that surface water
and groundwater are connected, so as the amount of surface water that is retained in the
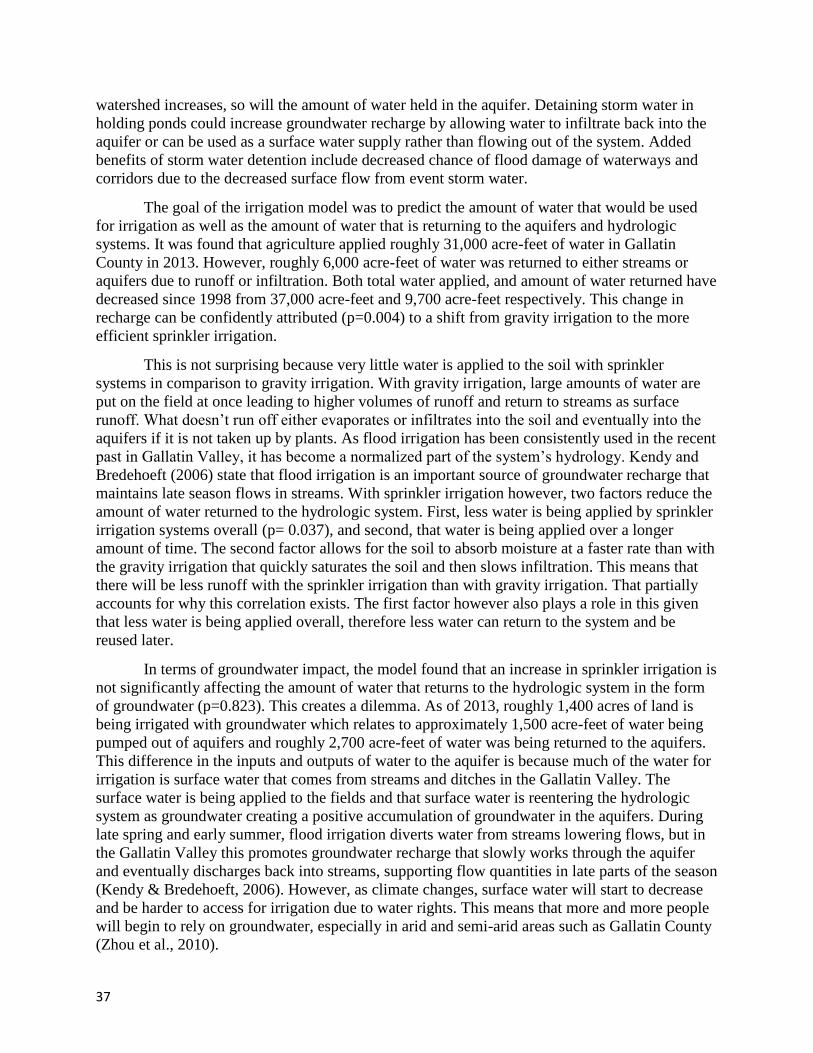
37
watershed increases, so will the amount of water held in the aquifer. Detaining storm water in
holding ponds could increase groundwater recharge by allowing water to infiltrate back into the
aquifer or can be used as a surface water supply rather than flowing out of the system. Added
benefits of storm water detention include decreased chance of flood damage of waterways and
corridors due to the decreased surface flow from event storm water.
The goal of the irrigation model was to predict the amount of water that would be used
for irrigation as well as the amount of water that is returning to the aquifers and hydrologic
systems. It was found that agriculture applied roughly 31,000 acre-feet of water in Gallatin
County in 2013. However, roughly 6,000 acre-feet of water was returned to either streams or
aquifers due to runoff or infiltration. Both total water applied, and amount of water returned have
decreased since 1998 from 37,000 acre-feet and 9,700 acre-feet respectively. This change in
recharge can be confidently attributed (p=0.004) to a shift from gravity irrigation to the more
efficient sprinkler irrigation.
This is not surprising because very little water is applied to the soil with sprinkler
systems in comparison to gravity irrigation. With gravity irrigation, large amounts of water are
put on the field at once leading to higher volumes of runoff and return to streams as surface
runoff. What doesn’t run off either evaporates or infiltrates into the soil and eventually into the
aquifers if it is not taken up by plants. As flood irrigation has been consistently used in the recent
past in Gallatin Valley, it has become a normalized part of the system’s hydrology. Kendy and
Bredehoeft (2006) state that flood irrigation is an important source of groundwater recharge that
maintains late season flows in streams. With sprinkler irrigation however, two factors reduce the
amount of water returned to the hydrologic system. First, less water is being applied by sprinkler
irrigation systems overall (p= 0.037), and second, that water is being applied over a longer
amount of time. The second factor allows for the soil to absorb moisture at a faster rate than with
the gravity irrigation that quickly saturates the soil and then slows infiltration. This means that
there will be less runoff with the sprinkler irrigation than with gravity irrigation. That partially
accounts for why this correlation exists. The first factor however also plays a role in this given
that less water is being applied overall, therefore less water can return to the system and be
reused later.
In terms of groundwater impact, the model found that an increase in sprinkler irrigation is
not significantly affecting the amount of water that returns to the hydrologic system in the form
of groundwater (p=0.823). This creates a dilemma. As of 2013, roughly 1,400 acres of land is
being irrigated with groundwater which relates to approximately 1,500 acre-feet of water being
pumped out of aquifers and roughly 2,700 acre-feet of water was being returned to the aquifers.
This difference in the inputs and outputs of water to the aquifer is because much of the water for
irrigation is surface water that comes from streams and ditches in the Gallatin Valley. The
surface water is being applied to the fields and that surface water is reentering the hydrologic
system as groundwater creating a positive accumulation of groundwater in the aquifers. During
late spring and early summer, flood irrigation diverts water from streams lowering flows, but in
the Gallatin Valley this promotes groundwater recharge that slowly works through the aquifer
and eventually discharges back into streams, supporting flow quantities in late parts of the season
(Kendy & Bredehoeft, 2006). However, as climate changes, surface water will start to decrease
and be harder to access for irrigation due to water rights. This means that more and more people
will begin to rely on groundwater, especially in arid and semi-arid areas such as Gallatin County
(Zhou et al., 2010).
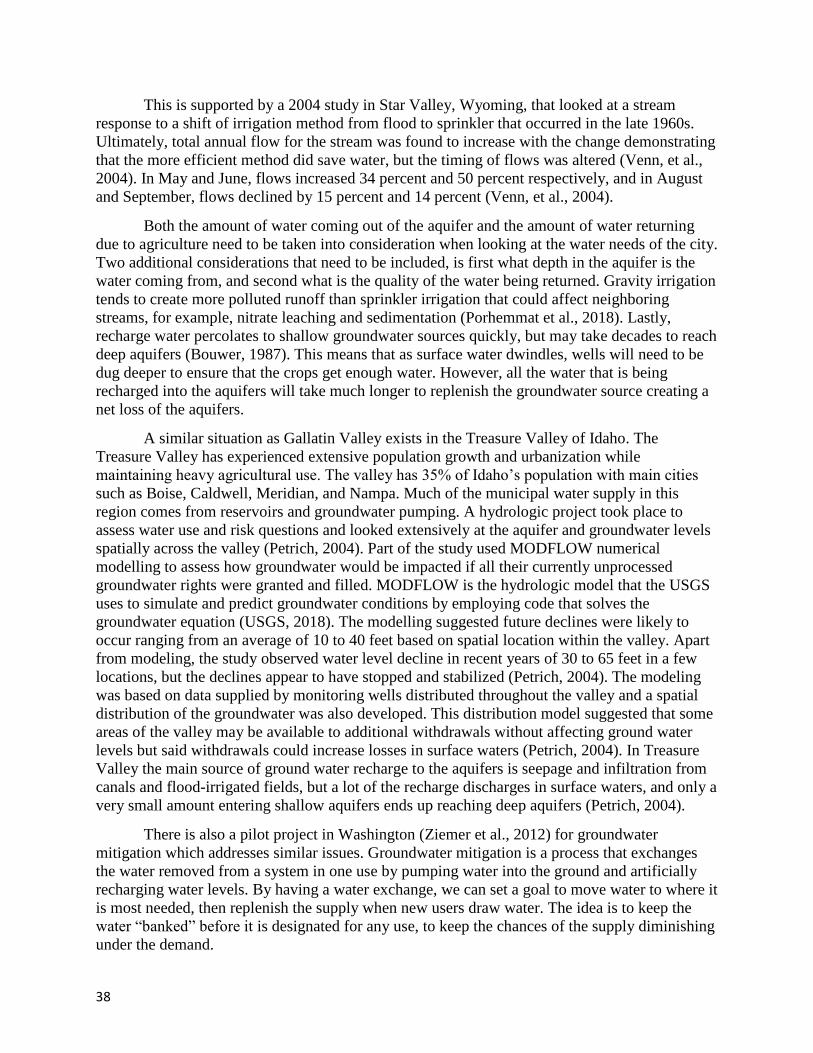
38
This is supported by a 2004 study in Star Valley, Wyoming, that looked at a stream
response to a shift of irrigation method from flood to sprinkler that occurred in the late 1960s.
Ultimately, total annual flow for the stream was found to increase with the change demonstrating
that the more efficient method did save water, but the timing of flows was altered (Venn, et al.,
2004). In May and June, flows increased 34 percent and 50 percent respectively, and in August
and September, flows declined by 15 percent and 14 percent (Venn, et al., 2004).
Both the amount of water coming out of the aquifer and the amount of water returning
due to agriculture need to be taken into consideration when looking at the water needs of the city.
Two additional considerations that need to be included, is first what depth in the aquifer is the
water coming from, and second what is the quality of the water being returned. Gravity irrigation
tends to create more polluted runoff than sprinkler irrigation that could affect neighboring
streams, for example, nitrate leaching and sedimentation (Porhemmat et al., 2018). Lastly,
recharge water percolates to shallow groundwater sources quickly, but may take decades to reach
deep aquifers (Bouwer, 1987). This means that as surface water dwindles, wells will need to be
dug deeper to ensure that the crops get enough water. However, all the water that is being
recharged into the aquifers will take much longer to replenish the groundwater source creating a
net loss of the aquifers.
A similar situation as Gallatin Valley exists in the Treasure Valley of Idaho. The
Treasure Valley has experienced extensive population growth and urbanization while
maintaining heavy agricultural use. The valley has 35% of Idaho’s population with main cities
such as Boise, Caldwell, Meridian, and Nampa. Much of the municipal water supply in this
region comes from reservoirs and groundwater pumping. A hydrologic project took place to
assess water use and risk questions and looked extensively at the aquifer and groundwater levels
spatially across the valley (Petrich, 2004). Part of the study used MODFLOW numerical
modelling to assess how groundwater would be impacted if all their currently unprocessed
groundwater rights were granted and filled. MODFLOW is the hydrologic model that the USGS
uses to simulate and predict groundwater conditions by employing code that solves the
groundwater equation (USGS, 2018). The modelling suggested future declines were likely to
occur ranging from an average of 10 to 40 feet based on spatial location within the valley. Apart
from modeling, the study observed water level decline in recent years of 30 to 65 feet in a few
locations, but the declines appear to have stopped and stabilized (Petrich, 2004). The modeling
was based on data supplied by monitoring wells distributed throughout the valley and a spatial
distribution of the groundwater was also developed. This distribution model suggested that some
areas of the valley may be available to additional withdrawals without affecting ground water
levels but said withdrawals could increase losses in surface waters (Petrich, 2004). In Treasure
Valley the main source of ground water recharge to the aquifers is seepage and infiltration from
canals and flood-irrigated fields, but a lot of the recharge discharges in surface waters, and only a
very small amount entering shallow aquifers ends up reaching deep aquifers (Petrich, 2004).
There is also a pilot project in Washington (Ziemer et al., 2012) for groundwater
mitigation which addresses similar issues. Groundwater mitigation is a process that exchanges
the water removed from a system in one use by pumping water into the ground and artificially
recharging water levels. By having a water exchange, we can set a goal to move water to where it
is most needed, then replenish the supply when new users draw water. The idea is to keep the
water “banked” before it is designated for any use, to keep the chances of the supply diminishing
under the demand.
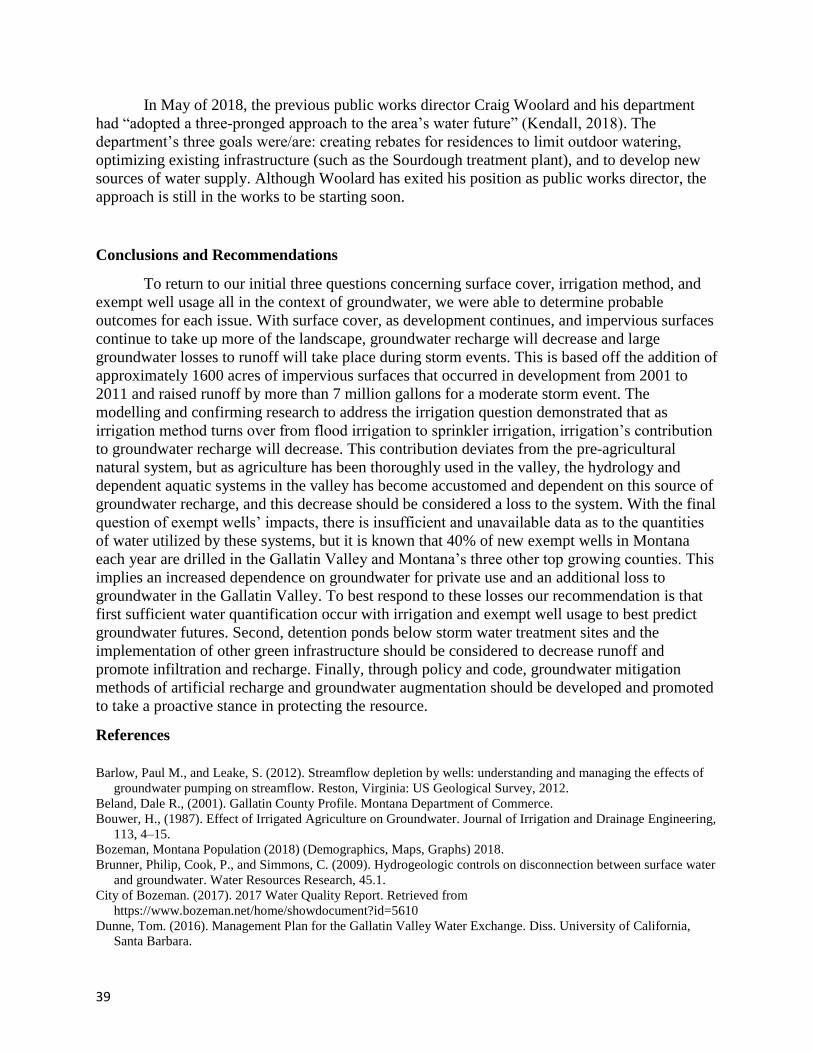
39
In May of 2018, the previous public works director Craig Woolard and his department
had “adopted a three-pronged approach to the area’s water future” (Kendall, 2018). The
department’s three goals were/are: creating rebates for residences to limit outdoor watering,
optimizing existing infrastructure (such as the Sourdough treatment plant), and to develop new
sources of water supply. Although Woolard has exited his position as public works director, the
approach is still in the works to be starting soon.
Conclusions and Recommendations
To return to our initial three questions concerning surface cover, irrigation method, and
exempt well usage all in the context of groundwater, we were able to determine probable
outcomes for each issue. With surface cover, as development continues, and impervious surfaces
continue to take up more of the landscape, groundwater recharge will decrease and large
groundwater losses to runoff will take place during storm events. This is based off the addition of
approximately 1600 acres of impervious surfaces that occurred in development from 2001 to
2011 and raised runoff by more than 7 million gallons for a moderate storm event. The
modelling and confirming research to address the irrigation question demonstrated that as
irrigation method turns over from flood irrigation to sprinkler irrigation, irrigation’s contribution
to groundwater recharge will decrease. This contribution deviates from the pre-agricultural
natural system, but as agriculture has been thoroughly used in the valley, the hydrology and
dependent aquatic systems in the valley has become accustomed and dependent on this source of
groundwater recharge, and this decrease should be considered a loss to the system. With the final
question of exempt wells’ impacts, there is insufficient and unavailable data as to the quantities
of water utilized by these systems, but it is known that 40% of new exempt wells in Montana
each year are drilled in the Gallatin Valley and Montana’s three other top growing counties. This
implies an increased dependence on groundwater for private use and an additional loss to
groundwater in the Gallatin Valley. To best respond to these losses our recommendation is that
first sufficient water quantification occur with irrigation and exempt well usage to best predict
groundwater futures. Second, detention ponds below storm water treatment sites and the
implementation of other green infrastructure should be considered to decrease runoff and
promote infiltration and recharge. Finally, through policy and code, groundwater mitigation
methods of artificial recharge and groundwater augmentation should be developed and promoted
to take a proactive stance in protecting the resource.
References
Barlow, Paul M., and Leake, S. (2012). Streamflow depletion by wells: understanding and managing the effects of
groundwater pumping on streamflow. Reston, Virginia: US Geological Survey, 2012.
Beland, Dale R., (2001). Gallatin County Profile. Montana Department of Commerce.
Bouwer, H., (1987). Effect of Irrigated Agriculture on Groundwater. Journal of Irrigation and Drainage Engineering,
113, 4–15.
Bozeman, Montana Population (2018) (Demographics, Maps, Graphs) 2018.
Brunner, Philip, Cook, P., and Simmons, C. (2009). Hydrogeologic controls on disconnection between surface water
and groundwater. Water Resources Research, 45.1.
City of Bozeman. (2017). 2017 Water Quality Report. Retrieved from
https://www.bozeman.net/home/showdocument?id=5610
Dunne, Tom. (2016). Management Plan for the Gallatin Valley Water Exchange. Diss. University of California,
Santa Barbara.
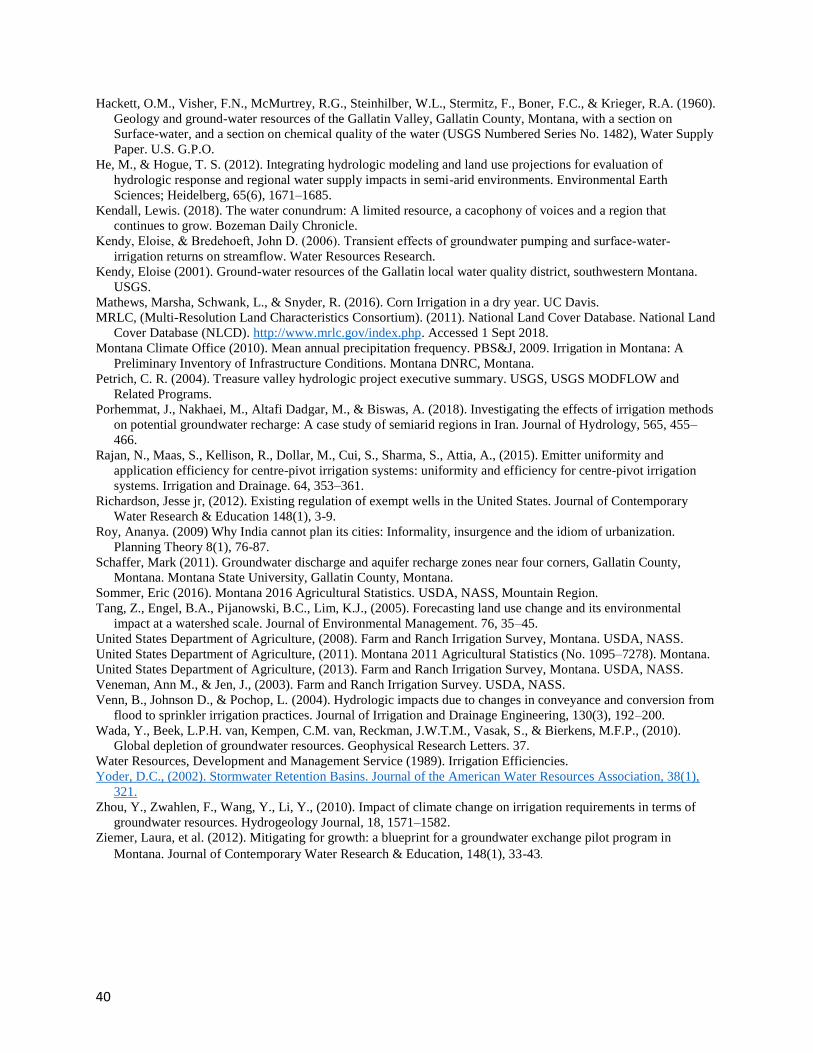
40
Hackett, O.M., Visher, F.N., McMurtrey, R.G., Steinhilber, W.L., Stermitz, F., Boner, F.C., & Krieger, R.A. (1960).
Geology and ground-water resources of the Gallatin Valley, Gallatin County, Montana, with a section on
Surface-water, and a section on chemical quality of the water (USGS Numbered Series No. 1482), Water Supply
Paper. U.S. G.P.O.
He, M., & Hogue, T. S. (2012). Integrating hydrologic modeling and land use projections for evaluation of
hydrologic response and regional water supply impacts in semi-arid environments. Environmental Earth
Sciences; Heidelberg, 65(6), 1671–1685.
Kendall, Lewis. (2018). The water conundrum: A limited resource, a cacophony of voices and a region that
continues to grow. Bozeman Daily Chronicle.
Kendy, Eloise, & Bredehoeft, John D. (2006). Transient effects of groundwater pumping and surface‐water‐
irrigation returns on streamflow. Water Resources Research.
Kendy, Eloise (2001). Ground-water resources of the Gallatin local water quality district, southwestern Montana.
USGS.
Mathews, Marsha, Schwank, L., & Snyder, R. (2016). Corn Irrigation in a dry year. UC Davis.
MRLC, (Multi-Resolution Land Characteristics Consortium). (2011). National Land Cover Database. National Land
Cover Database (NLCD). http://www.mrlc.gov/index.php. Accessed 1 Sept 2018.
Montana Climate Office (2010). Mean annual precipitation frequency. PBS&J, 2009. Irrigation in Montana: A
Preliminary Inventory of Infrastructure Conditions. Montana DNRC, Montana.
Petrich, C. R. (2004). Treasure valley hydrologic project executive summary. USGS, USGS MODFLOW and
Related Programs.
Porhemmat, J., Nakhaei, M., Altafi Dadgar, M., & Biswas, A. (2018). Investigating the effects of irrigation methods
on potential groundwater recharge: A case study of semiarid regions in Iran. Journal of Hydrology, 565, 455–
466.
Rajan, N., Maas, S., Kellison, R., Dollar, M., Cui, S., Sharma, S., Attia, A., (2015). Emitter uniformity and
application efficiency for centre-pivot irrigation systems: uniformity and efficiency for centre-pivot irrigation
systems. Irrigation and Drainage. 64, 353–361.
Richardson, Jesse jr, (2012). Existing regulation of exempt wells in the United States. Journal of Contemporary
Water Research & Education 148(1), 3-9.
Roy, Ananya. (2009) Why India cannot plan its cities: Informality, insurgence and the idiom of urbanization.
Planning Theory 8(1), 76-87.
Schaffer, Mark (2011). Groundwater discharge and aquifer recharge zones near four corners, Gallatin County,
Montana. Montana State University, Gallatin County, Montana.
Sommer, Eric (2016). Montana 2016 Agricultural Statistics. USDA, NASS, Mountain Region.
Tang, Z., Engel, B.A., Pijanowski, B.C., Lim, K.J., (2005). Forecasting land use change and its environmental
impact at a watershed scale. Journal of Environmental Management. 76, 35–45.
United States Department of Agriculture, (2008). Farm and Ranch Irrigation Survey, Montana. USDA, NASS.
United States Department of Agriculture, (2011). Montana 2011 Agricultural Statistics (No. 1095–7278). Montana.
United States Department of Agriculture, (2013). Farm and Ranch Irrigation Survey, Montana. USDA, NASS.
Veneman, Ann M., & Jen, J., (2003). Farm and Ranch Irrigation Survey. USDA, NASS.
Venn, B., Johnson D., & Pochop, L. (2004). Hydrologic impacts due to changes in conveyance and conversion from
flood to sprinkler irrigation practices. Journal of Irrigation and Drainage Engineering, 130(3), 192–200.
Wada, Y., Beek, L.P.H. van, Kempen, C.M. van, Reckman, J.W.T.M., Vasak, S., & Bierkens, M.F.P., (2010).
Global depletion of groundwater resources. Geophysical Research Letters. 37.
Water Resources, Development and Management Service (1989). Irrigation Efficiencies.
Yoder, D.C., (2002). Stormwater Retention Basins. Journal of the American Water Resources Association, 38(1),
321.
Zhou, Y., Zwahlen, F., Wang, Y., Li, Y., (2010). Impact of climate change on irrigation requirements in terms of
groundwater resources. Hydrogeology Journal, 18, 1571–1582.
Ziemer, Laura, et al. (2012). Mitigating for growth: a blueprint for a groundwater exchange pilot program in
Montana. Journal of Contemporary Water Research & Education, 148(1), 33-43.
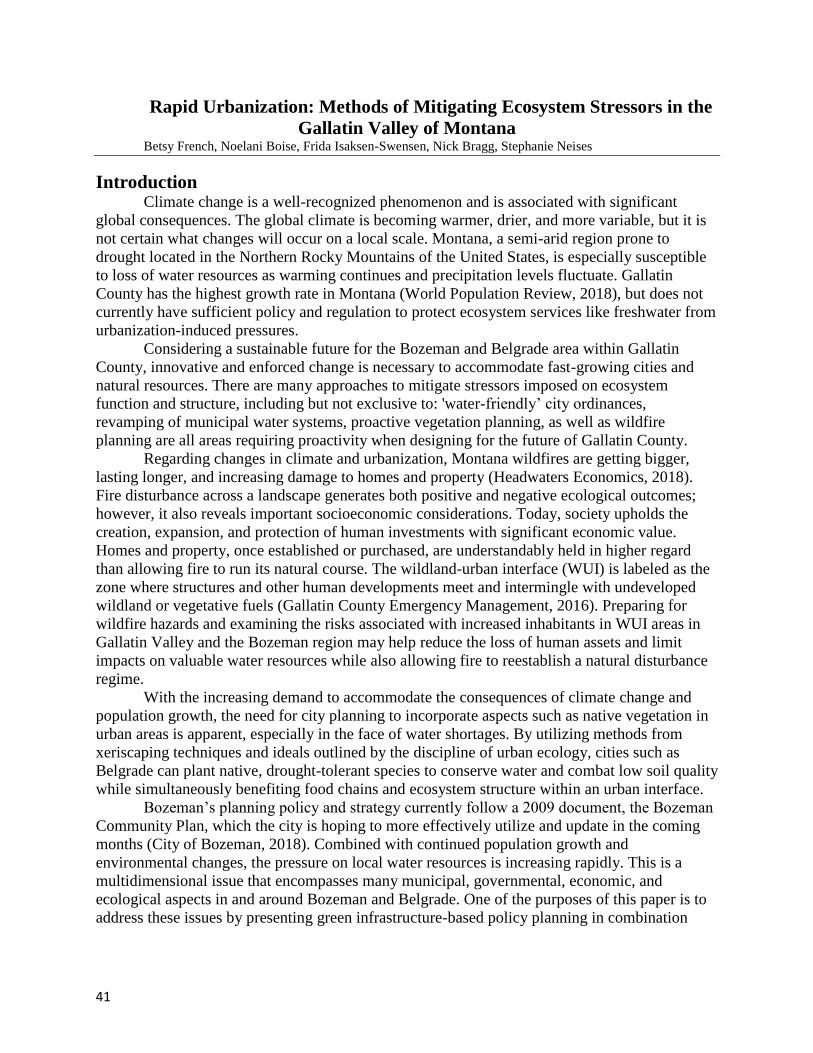
41
Rapid Urbanization: Methods of Mitigating Ecosystem Stressors in the
Gallatin Valley of Montana Betsy French, Noelani Boise, Frida Isaksen-Swensen, Nick Bragg, Stephanie Neises
Introduction Climate change is a well-recognized phenomenon and is associated with significant
global consequences. The global climate is becoming warmer, drier, and more variable, but it is
not certain what changes will occur on a local scale. Montana, a semi-arid region prone to
drought located in the Northern Rocky Mountains of the United States, is especially susceptible
to loss of water resources as warming continues and precipitation levels fluctuate. Gallatin
County has the highest growth rate in Montana (World Population Review, 2018), but does not
currently have sufficient policy and regulation to protect ecosystem services like freshwater from
urbanization-induced pressures.
Considering a sustainable future for the Bozeman and Belgrade area within Gallatin
County, innovative and enforced change is necessary to accommodate fast-growing cities and
natural resources. There are many approaches to mitigate stressors imposed on ecosystem
function and structure, including but not exclusive to: 'water-friendly’ city ordinances,
revamping of municipal water systems, proactive vegetation planning, as well as wildfire
planning are all areas requiring proactivity when designing for the future of Gallatin County.
Regarding changes in climate and urbanization, Montana wildfires are getting bigger,
lasting longer, and increasing damage to homes and property (Headwaters Economics, 2018).
Fire disturbance across a landscape generates both positive and negative ecological outcomes;
however, it also reveals important socioeconomic considerations. Today, society upholds the
creation, expansion, and protection of human investments with significant economic value.
Homes and property, once established or purchased, are understandably held in higher regard
than allowing fire to run its natural course. The wildland-urban interface (WUI) is labeled as the
zone where structures and other human developments meet and intermingle with undeveloped
wildland or vegetative fuels (Gallatin County Emergency Management, 2016). Preparing for
wildfire hazards and examining the risks associated with increased inhabitants in WUI areas in
Gallatin Valley and the Bozeman region may help reduce the loss of human assets and limit
impacts on valuable water resources while also allowing fire to reestablish a natural disturbance
regime.
With the increasing demand to accommodate the consequences of climate change and
population growth, the need for city planning to incorporate aspects such as native vegetation in
urban areas is apparent, especially in the face of water shortages. By utilizing methods from
xeriscaping techniques and ideals outlined by the discipline of urban ecology, cities such as
Belgrade can plant native, drought-tolerant species to conserve water and combat low soil quality
while simultaneously benefiting food chains and ecosystem structure within an urban interface.
Bozeman’s planning policy and strategy currently follow a 2009 document, the Bozeman
Community Plan, which the city is hoping to more effectively utilize and update in the coming
months (City of Bozeman, 2018). Combined with continued population growth and
environmental changes, the pressure on local water resources is increasing rapidly. This is a
multidimensional issue that encompasses many municipal, governmental, economic, and
ecological aspects in and around Bozeman and Belgrade. One of the purposes of this paper is to
address these issues by presenting green infrastructure-based policy planning in combination
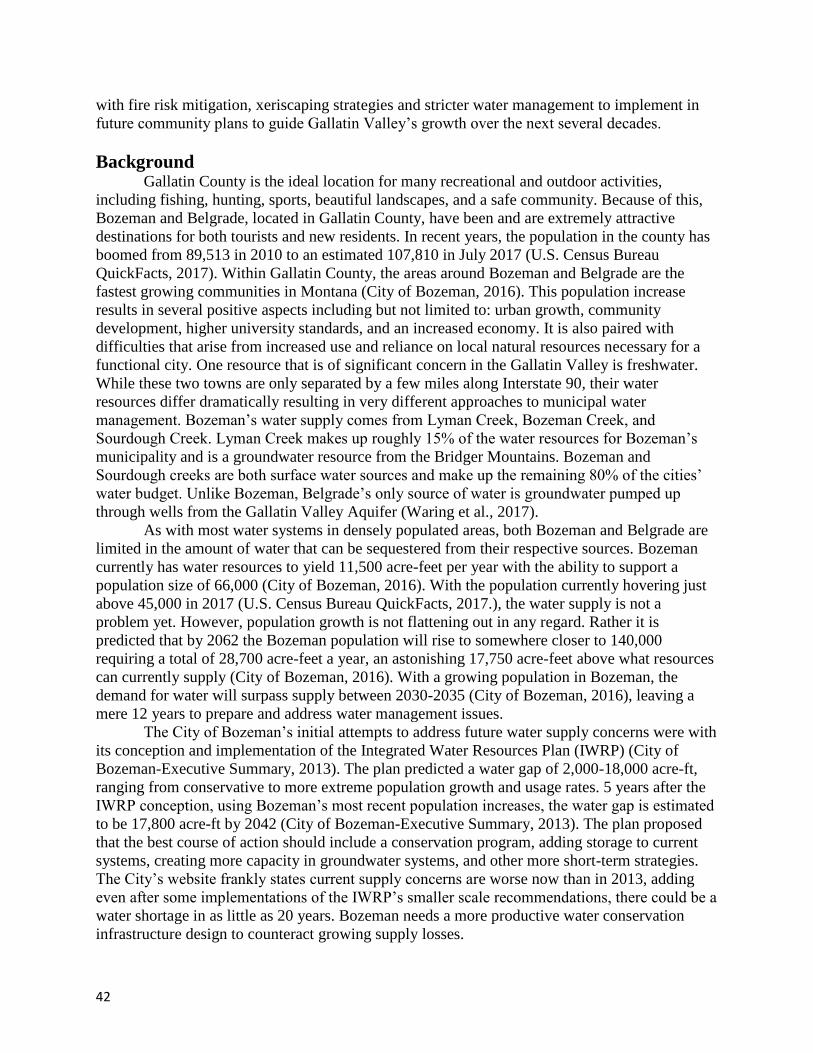
42
with fire risk mitigation, xeriscaping strategies and stricter water management to implement in
future community plans to guide Gallatin Valley’s growth over the next several decades.
Background Gallatin County is the ideal location for many recreational and outdoor activities,
including fishing, hunting, sports, beautiful landscapes, and a safe community. Because of this,
Bozeman and Belgrade, located in Gallatin County, have been and are extremely attractive
destinations for both tourists and new residents. In recent years, the population in the county has
boomed from 89,513 in 2010 to an estimated 107,810 in July 2017 (U.S. Census Bureau
QuickFacts, 2017). Within Gallatin County, the areas around Bozeman and Belgrade are the
fastest growing communities in Montana (City of Bozeman, 2016). This population increase
results in several positive aspects including but not limited to: urban growth, community
development, higher university standards, and an increased economy. It is also paired with
difficulties that arise from increased use and reliance on local natural resources necessary for a
functional city. One resource that is of significant concern in the Gallatin Valley is freshwater.
While these two towns are only separated by a few miles along Interstate 90, their water
resources differ dramatically resulting in very different approaches to municipal water
management. Bozeman’s water supply comes from Lyman Creek, Bozeman Creek, and
Sourdough Creek. Lyman Creek makes up roughly 15% of the water resources for Bozeman’s
municipality and is a groundwater resource from the Bridger Mountains. Bozeman and
Sourdough creeks are both surface water sources and make up the remaining 80% of the cities’
water budget. Unlike Bozeman, Belgrade’s only source of water is groundwater pumped up
through wells from the Gallatin Valley Aquifer (Waring et al., 2017).
As with most water systems in densely populated areas, both Bozeman and Belgrade are
limited in the amount of water that can be sequestered from their respective sources. Bozeman
currently has water resources to yield 11,500 acre-feet per year with the ability to support a
population size of 66,000 (City of Bozeman, 2016). With the population currently hovering just
above 45,000 in 2017 (U.S. Census Bureau QuickFacts, 2017.), the water supply is not a
problem yet. However, population growth is not flattening out in any regard. Rather it is
predicted that by 2062 the Bozeman population will rise to somewhere closer to 140,000
requiring a total of 28,700 acre-feet a year, an astonishing 17,750 acre-feet above what resources
can currently supply (City of Bozeman, 2016). With a growing population in Bozeman, the
demand for water will surpass supply between 2030-2035 (City of Bozeman, 2016), leaving a
mere 12 years to prepare and address water management issues.
The City of Bozeman’s initial attempts to address future water supply concerns were with
its conception and implementation of the Integrated Water Resources Plan (IWRP) (City of
Bozeman-Executive Summary, 2013). The plan predicted a water gap of 2,000-18,000 acre-ft,
ranging from conservative to more extreme population growth and usage rates. 5 years after the
IWRP conception, using Bozeman’s most recent population increases, the water gap is estimated
to be 17,800 acre-ft by 2042 (City of Bozeman-Executive Summary, 2013). The plan proposed
that the best course of action should include a conservation program, adding storage to current
systems, creating more capacity in groundwater systems, and other more short-term strategies.
The City’s website frankly states current supply concerns are worse now than in 2013, adding
even after some implementations of the IWRP’s smaller scale recommendations, there could be a
water shortage in as little as 20 years. Bozeman needs a more productive water conservation
infrastructure design to counteract growing supply losses.
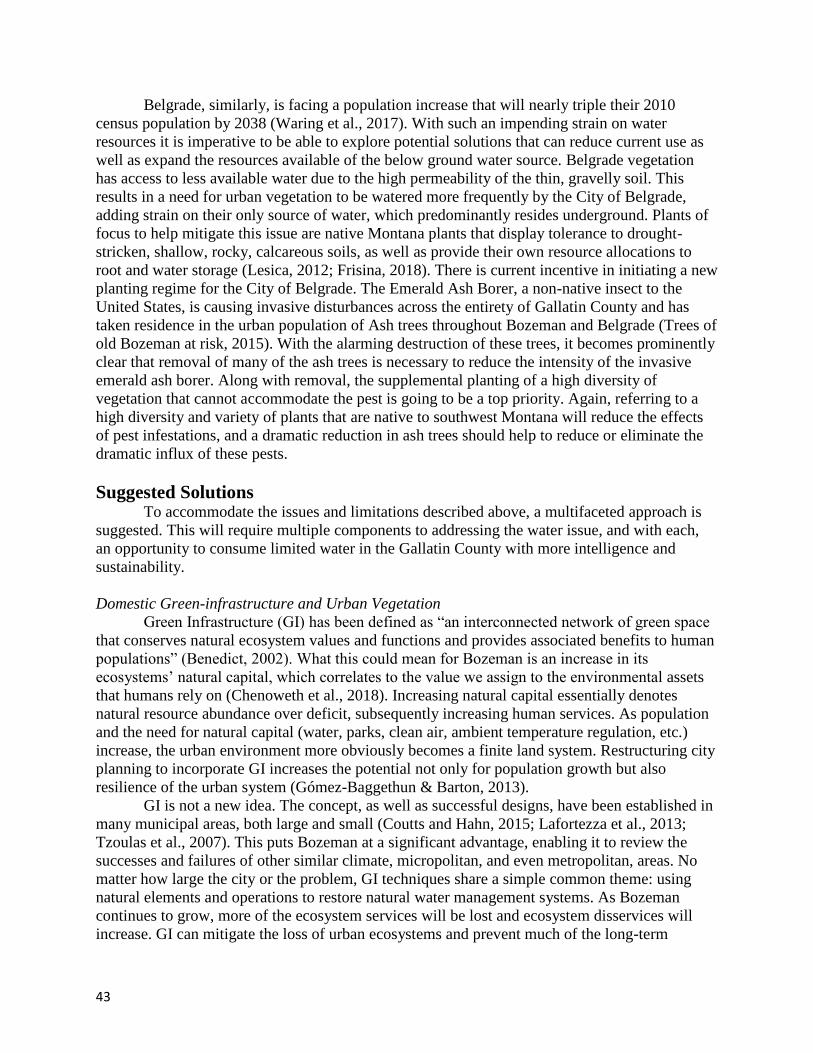
43
Belgrade, similarly, is facing a population increase that will nearly triple their 2010
census population by 2038 (Waring et al., 2017). With such an impending strain on water
resources it is imperative to be able to explore potential solutions that can reduce current use as
well as expand the resources available of the below ground water source. Belgrade vegetation
has access to less available water due to the high permeability of the thin, gravelly soil. This
results in a need for urban vegetation to be watered more frequently by the City of Belgrade,
adding strain on their only source of water, which predominantly resides underground. Plants of
focus to help mitigate this issue are native Montana plants that display tolerance to drought-
stricken, shallow, rocky, calcareous soils, as well as provide their own resource allocations to
root and water storage (Lesica, 2012; Frisina, 2018). There is current incentive in initiating a new
planting regime for the City of Belgrade. The Emerald Ash Borer, a non-native insect to the
United States, is causing invasive disturbances across the entirety of Gallatin County and has
taken residence in the urban population of Ash trees throughout Bozeman and Belgrade (Trees of
old Bozeman at risk, 2015). With the alarming destruction of these trees, it becomes prominently
clear that removal of many of the ash trees is necessary to reduce the intensity of the invasive
emerald ash borer. Along with removal, the supplemental planting of a high diversity of
vegetation that cannot accommodate the pest is going to be a top priority. Again, referring to a
high diversity and variety of plants that are native to southwest Montana will reduce the effects
of pest infestations, and a dramatic reduction in ash trees should help to reduce or eliminate the
dramatic influx of these pests.
Suggested Solutions
To accommodate the issues and limitations described above, a multifaceted approach is
suggested. This will require multiple components to addressing the water issue, and with each,
an opportunity to consume limited water in the Gallatin County with more intelligence and
sustainability.
Domestic Green-infrastructure and Urban Vegetation
Green Infrastructure (GI) has been defined as “an interconnected network of green space
that conserves natural ecosystem values and functions and provides associated benefits to human
populations” (Benedict, 2002). What this could mean for Bozeman is an increase in its
ecosystems’ natural capital, which correlates to the value we assign to the environmental assets
that humans rely on (Chenoweth et al., 2018). Increasing natural capital essentially denotes
natural resource abundance over deficit, subsequently increasing human services. As population
and the need for natural capital (water, parks, clean air, ambient temperature regulation, etc.)
increase, the urban environment more obviously becomes a finite land system. Restructuring city
planning to incorporate GI increases the potential not only for population growth but also
resilience of the urban system (Gómez-Baggethun & Barton, 2013).
GI is not a new idea. The concept, as well as successful designs, have been established in
many municipal areas, both large and small (Coutts and Hahn, 2015; Lafortezza et al., 2013;
Tzoulas et al., 2007). This puts Bozeman at a significant advantage, enabling it to review the
successes and failures of other similar climate, micropolitan, and even metropolitan, areas. No
matter how large the city or the problem, GI techniques share a simple common theme: using
natural elements and operations to restore natural water management systems. As Bozeman
continues to grow, more of the ecosystem services will be lost and ecosystem disservices will
increase. GI can mitigate the loss of urban ecosystems and prevent much of the long-term
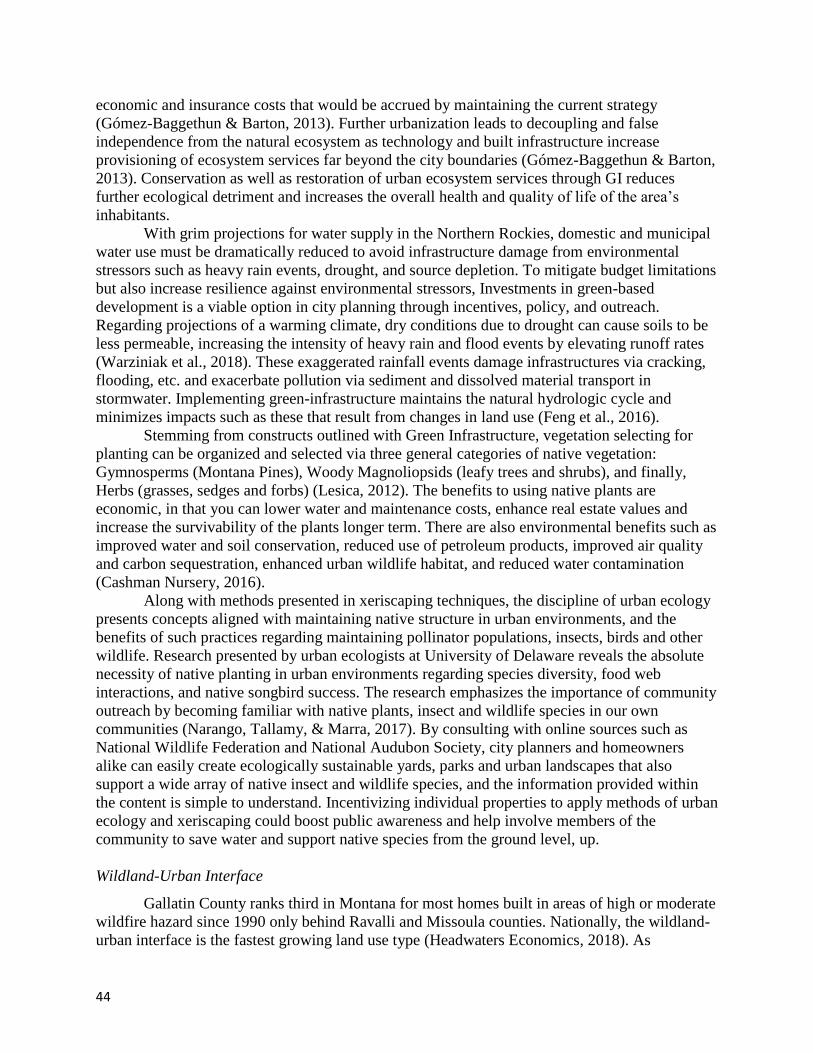
44
economic and insurance costs that would be accrued by maintaining the current strategy
(Gómez-Baggethun & Barton, 2013). Further urbanization leads to decoupling and false
independence from the natural ecosystem as technology and built infrastructure increase
provisioning of ecosystem services far beyond the city boundaries (Gómez-Baggethun & Barton,
2013). Conservation as well as restoration of urban ecosystem services through GI reduces
further ecological detriment and increases the overall health and quality of life of the area’s
inhabitants.
With grim projections for water supply in the Northern Rockies, domestic and municipal
water use must be dramatically reduced to avoid infrastructure damage from environmental
stressors such as heavy rain events, drought, and source depletion. To mitigate budget limitations
but also increase resilience against environmental stressors, Investments in green-based
development is a viable option in city planning through incentives, policy, and outreach.
Regarding projections of a warming climate, dry conditions due to drought can cause soils to be
less permeable, increasing the intensity of heavy rain and flood events by elevating runoff rates
(Warziniak et al., 2018). These exaggerated rainfall events damage infrastructures via cracking,
flooding, etc. and exacerbate pollution via sediment and dissolved material transport in
stormwater. Implementing green-infrastructure maintains the natural hydrologic cycle and
minimizes impacts such as these that result from changes in land use (Feng et al., 2016).
Stemming from constructs outlined with Green Infrastructure, vegetation selecting for
planting can be organized and selected via three general categories of native vegetation:
Gymnosperms (Montana Pines), Woody Magnoliopsids (leafy trees and shrubs), and finally,
Herbs (grasses, sedges and forbs) (Lesica, 2012). The benefits to using native plants are
economic, in that you can lower water and maintenance costs, enhance real estate values and
increase the survivability of the plants longer term. There are also environmental benefits such as
improved water and soil conservation, reduced use of petroleum products, improved air quality
and carbon sequestration, enhanced urban wildlife habitat, and reduced water contamination
(Cashman Nursery, 2016).
Along with methods presented in xeriscaping techniques, the discipline of urban ecology
presents concepts aligned with maintaining native structure in urban environments, and the
benefits of such practices regarding maintaining pollinator populations, insects, birds and other
wildlife. Research presented by urban ecologists at University of Delaware reveals the absolute
necessity of native planting in urban environments regarding species diversity, food web
interactions, and native songbird success. The research emphasizes the importance of community
outreach by becoming familiar with native plants, insect and wildlife species in our own
communities (Narango, Tallamy, & Marra, 2017). By consulting with online sources such as
National Wildlife Federation and National Audubon Society, city planners and homeowners
alike can easily create ecologically sustainable yards, parks and urban landscapes that also
support a wide array of native insect and wildlife species, and the information provided within
the content is simple to understand. Incentivizing individual properties to apply methods of urban
ecology and xeriscaping could boost public awareness and help involve members of the
community to save water and support native species from the ground level, up.
Wildland-Urban Interface
Gallatin County ranks third in Montana for most homes built in areas of high or moderate
wildfire hazard since 1990 only behind Ravalli and Missoula counties. Nationally, the wildland-
urban interface is the fastest growing land use type (Headwaters Economics, 2018). As
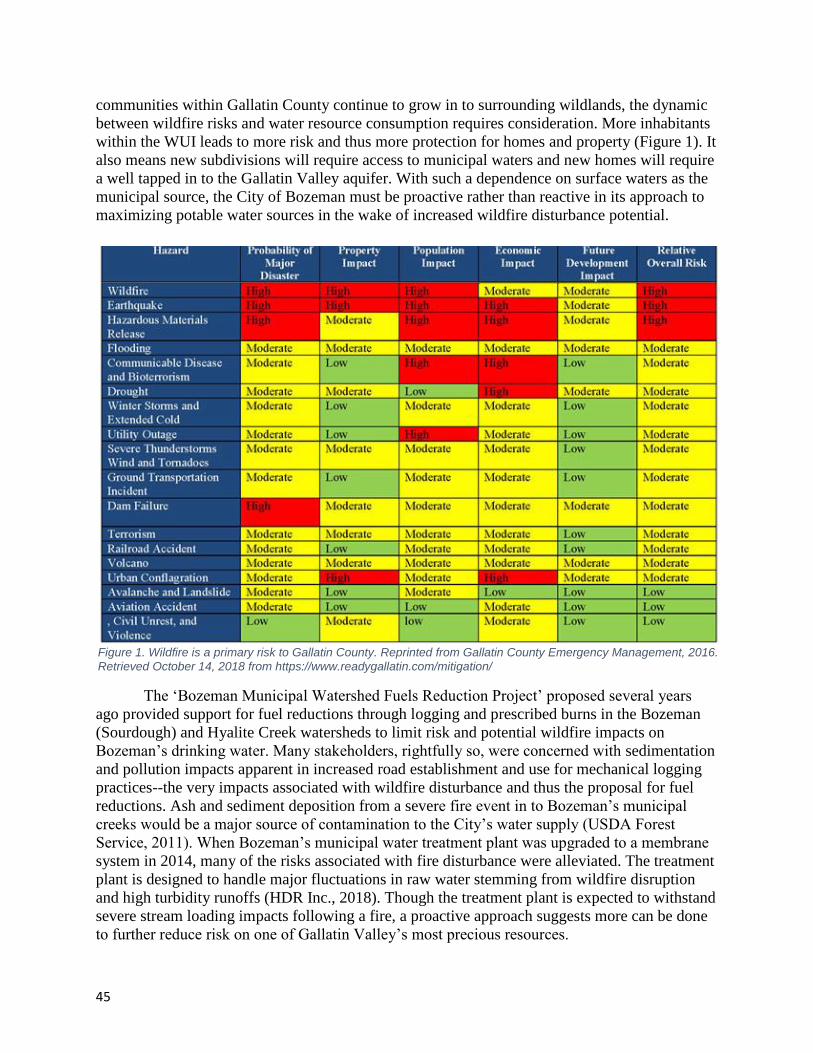
45
communities within Gallatin County continue to grow in to surrounding wildlands, the dynamic
between wildfire risks and water resource consumption requires consideration. More inhabitants
within the WUI leads to more risk and thus more protection for homes and property (Figure 1). It
also means new subdivisions will require access to municipal waters and new homes will require
a well tapped in to the Gallatin Valley aquifer. With such a dependence on surface waters as the
municipal source, the City of Bozeman must be proactive rather than reactive in its approach to
maximizing potable water sources in the wake of increased wildfire disturbance potential.
The ‘Bozeman Municipal Watershed Fuels Reduction Project’ proposed several years
ago provided support for fuel reductions through logging and prescribed burns in the Bozeman
(Sourdough) and Hyalite Creek watersheds to limit risk and potential wildfire impacts on
Bozeman’s drinking water. Many stakeholders, rightfully so, were concerned with sedimentation
and pollution impacts apparent in increased road establishment and use for mechanical logging
practices--the very impacts associated with wildfire disturbance and thus the proposal for fuel
reductions. Ash and sediment deposition from a severe fire event in to Bozeman’s municipal
creeks would be a major source of contamination to the City’s water supply (USDA Forest
Service, 2011). When Bozeman’s municipal water treatment plant was upgraded to a membrane
system in 2014, many of the risks associated with fire disturbance were alleviated. The treatment
plant is designed to handle major fluctuations in raw water stemming from wildfire disruption
and high turbidity runoffs (HDR Inc., 2018). Though the treatment plant is expected to withstand
severe stream loading impacts following a fire, a proactive approach suggests more can be done
to further reduce risk on one of Gallatin Valley’s most precious resources.
Figure 1. Wildfire is a primary risk to Gallatin County. Reprinted from Gallatin County Emergency Management, 2016.
Retrieved October 14, 2018 from https://www.readygallatin.com/mitigation/
46
Considerations for protecting and conserving water resources in the Bozeman area
include the aforementioned mechanical thinning and prescribed burning, but also hand thinning
and the burning of slash piles in watershed areas, water conservation incentives for users, fuel
thinning in the WUI where growth is projected to increase to reduce fire danger and water
consumption by thick vegetative stands, increased water storage as the climate warms and
precipitation patterns change, and implementing a municipal groundwater source.
Municipal Water Management
According to Belgrade’s 2017 Water Master Plan, an average of 30% of the water pumped from
the 6 (now 7) wells is unaccounted for (Waring et al., 2017). This is mirrored in Bozeman where
water loss averages around 20% (DNRC, 2015). While this is lower than Belgrade’s 30%, it is
still higher than the national average of 16% (EPA, 2015). These gaps in loss percentages reveal
that this is an area that can be focused upon and improved. With reducing water loss alone,
hundreds of acre-feet would be saved every year, allowing far more efficient water management
strategies to take place.
Reducing these losses is by no means easy or simple, but it is possible. While the national
average water loss for a municipality is 16%, the EPA estimates that of this percentage, up to
75% is recoverable (EPA, 2015). The question is how to go about implementing recovery plans.
In general, water loss is either real loss or apparent loss. Apparent loss indicates unmetered
distribution lines, meter errors, or illegal hookups to the water system, while real loss is system
leakage. In the case of Bozeman and Belgrade, it is assumed unmetered lines and meter errors
make up a negligible part of the water loss leaving the main culprit to be system leakage (Waring
et al., 2017).
Conclusion: Application and Proposals for the Gallatin Valley Green Infrastructure and Vegetation in Domestic Development Ordinances
Current Bozeman ordinances regarding water conservation are minimal and could be
reshaped to initiate compulsory activism in sustainability strategies. The only criteria for private
development are found in the Unified Development Code regarding landscaping, requiring that
the property “include one large canopy tree for each 50 feet of total street frontage”, that at least
2/3 of the area be vegetated with “natural grass, vegetative ground cover or other natural living
plant materials”, and that “all landscaped areas shall be perpetually maintained in a healthy
condition” (City of Bozeman, 2018). These ordinances could be evaluated and expanded on to
more specifically require reduced water use, using green infrastructure strategies, and reducing
fire risk.
Studies show that incorporating appropriate design with native plants can cut down on
water usage by 50%, maintenance and labor by 30%, fertilizers by 61%, fuel by 44% and
herbicides and pesticides by 22%. (Xeriscaping and Native Plants, 2009) Along with methods
presented in xeriscaping techniques, the discipline of urban ecology presents concepts aligned
with maintaining native structure in urban environments, and the benefits of such practices
regarding maintaining pollinator populations, insects, birds and other wildlife. Advice on
techniques for optimizing water use in Gallatin County involve changing the composition of
lawns and grass-covered areas from the use of a traditional Kentucky bluegrass to a blend of
native fescue grasses (Cashman Nursery, 2016). Much of the research utilized in the discipline of
urban planting revolves around the concept of xeriscaping. Xeriscaping can be prioritized into 7
47
steps: (Xeriscaping and Native Plants, 2009)
1. Plan and design comprehensively
2. Improve soil with amendments
3. Reduce lawn areas
4. Use appropriate plants and group them according to water/environmental needs
5. Irrigate efficiently
6. Use mulches and ground cover
7. Maintain the landscape with regularity
These steps can be initiated by the City and can be implemented onto individual properties using
financial incentives to motivate the public. In association with xeriscaping techniques, as
mentioned before, resources outlined by the National Wildlife Federation as well as the National
Audubon Society can easily help policy makers and citizens alike modify their landscaping
focuses to be, not only water-saving, but supportive of local species richness and structure.
Green infrastructure implementation, much like integration of xeriscaping techniques,
doesn’t inherently resonate with all members, or developers and legislators, of a community.
Motivating policy change, even beyond Bozeman, must incorporate some simple points to
appropriately address the importance, benefits, and level of application required with the
innovations. Below is a list of some of these key items and how some may be addressed with a
GI-based policy plan. It is important to recognize that there is not one approach to GI,
conservation, acquisition, or preservation that can save the world’s freshwater supply. Only a
vast combination of unique strategies will promote the ecosystem services and natural capital
people need to sustain their growing communities. Small steps can generate a larger change; a
few well-placed rain barrels can become trendy and has the potential to inspire members of the
public to partake in their own water catchment.
1. Policy posed for both the residents and the policy makers
a. Final goals need to meet political palatability and the Best Management Practice
b. Initiate a GI Policy Change campaign alongside an educational campaign of GI
c. Establish levels of authority that are needed based on the GI
2. Openly announce the problem to the residents and encourage responsible actions with
clearly outlined tasks- what can everyone do?
a. Policy prohibiting use of potable water on turf grass
3. Offer alternative practices to direct towards a BMP
a. If Bozeman does nothing, water is gone by 2020
b. If 2% of the population installs low-flow shower heads, water is gone by 2021
c. If all new developments are regulated with GI and grandfathered structural
conservation is increased, water is gone by 2050.
4. All rules/procedures must be in place before instituting- provides clear structure for how
to follow and why to follow. Start with regulations a for easier record keeping
5. Enforcement must be easy, and maintenance relatively easy
a. A tiered fee schedule for water use above set quantities
b. Water allotment based on space, not on plants on type of structure
i. Same amount of water allocated per 1 acre of turf grass as to 1 acre of
drought tolerant plants
c. Rain barrels maintained by the property owner, bioswales in public median areas
maintained by the city
48
Municipal water planning
Despite the differences in water resources between Bozeman and Belgrade, there are
overlaps in management angles that both municipalities can implement to work towards
conducting sustainable water management that can be used for many years to come. Regarding
reducing real municipal water loss there are a variety of tools available. These include but are not
limited to the American Water Works Association’s (AWWA) water auditing process, water
pressure management, and LeakFinder-ST: Advanced Acoustic Leak Detection System.
Ideally Bozeman and Belgrade would be able to use a combination of these methods to
sufficiently decrease their real water losses. However, limitations on available manpower, time,
training required to operate, and budget are all factors that play into what is realistic for both
municipalities. A good first step would be to conduct a full water audit in the form of the
AWWA’s M36 model. They are available on the AWWA website and are designed to be used in
the standard Microsoft Excel (Chastain-Howley, 2007). Expansions upon the initial release of the
program in 2000 have been made in the subsequent years to expand and dive more into the
intricacies involved in municipal water balance. In 2008, the AWWA’s M36 moved towards
putting numbers on apparent and real water loss rather than lumping both types of losses into a
single water loss percentage (Almy, 2016). This would be extremely useful in Bozeman and
Belgrade as neither city have published specifics on how much water is being lost in either
category and have instead gone with the original overall percentage of loss (Chastain-Howley,
2007).
While the software to self-audit are free and available online (Chastain-Howley, 2007)
costs can still range from $10,000-50,000 (Almy, 2016) once everything is factored in. Even
with high costs, the information provided by the analysis would allow for Bozeman and Belgrade
to hone in on exactly where they are losing water in their pipe systems. From the results of an
M36 water audit other tools can be prioritized based off what is most valuable and/or feasible for
each city.
If the costs of a water audit are too great for either municipality, a second route would be
to emphasize the water pressure management, especially if this is something that is already being
monitored. In general, there is a direct relationship between pipe pressure and pipe leakage,
meaning that the lower the pressure the lower the pipe break frequency and vice versa (Hunaidi
et al., 2004). An assumption that flow rate of fluid through an opening is proportional to pressure
is utilized in pipe systems but is only valid for a fixed area. A greater area and pressure leads to
more fluid flow. However, with pipe leak openings (cracks), greater pressure would cause an
expansion in the cracks leading to a greater area. In a scenario such as this, if the assumption
described above is in place for measuring the amount of water flowing, results would
underestimate the fluid flow in areas where cracks are present (Hunaidi et. al, 2004). To assuage
the situation, monitor and fix cracks as soon as detected, as well as keep pressure in the pipes as
low as possible while still maintaining function.
Once a water audit is completed, Bozeman and Belgrade can focus on locating leaks
using LeakfinderRT™ (Echologics, 2018). or similar technologies, pressure management, night
flow analysis, and/or acoustic surveying. An assortment of these methods could be implemented
based on what is best suited for either Bozeman or Belgrade.
49
Wildfire Risk Mitigation in the Wildland-Urban Interface
Based on a proactive approach to promoting water resource protection from wildfire
disturbance in Gallatin Valley, several recommendations will be made that may benefit Bozeman
both short and long term. First, hand thinning areas with significant ladder fuels, dead materials,
and canopy overlap in the appropriate season with ideal weather conditions will help reduce
potential fire severity within watershed areas. Leaving significant vegetative buffer zones will
prove beneficial in reducing sediment and debris loading from any disturbance. This
recommendation would take time to implement and reach a point where there was a valuable
impact on the watershed or landscape scales; however, it would alleviate concerns of mechanical
thinning and the addition of roads in roadless areas. The next recommendation is to actively thin
fuels in WUI areas where projected growth is expected. This tactic would prematurely reduce the
risk of losing homes or other structures in the event of a wildfire, potentially allow for the
harvest of merchantable timber, and decrease interception and consumption of water by large,
mature coniferous trees and other vegetation. Increasing water storage capacities would likely be
beneficial to support water distribution in the face of surface water disruption and declines in late
season water supply with a warming climate. Overall, wildfire disturbance in the Gallatin Valley
is one of the few natural disasters with the potential to impact Bozeman and its’ municipal water
supply. Due to this and the fact that municipal water sources will need to increase in future years
to support a growing population regardless, the implementation of groundwater sources as a
source of municipal water would be very beneficial if the City of Bozeman could obtain the
rights to appropriation. This, in turn, would influence Belgrade and its’ reliance on groundwater
municipalities thus increasing considerations for another municipal water source, likely surface
water, for them. Revealing that Bozeman’s water treatment plant may be able to handle a
significant influx of post-burn materials therefore reducing anthropogenic risks, an argument can
be made that these suggested measures may still be implemented to reduce pollution impacts
from an ecological and biological perspective.
Summary
When addressing the consequences of climate change, population growth and
urbanization, it is important to take note of the availability of freshwater within a given
landscape. Seeing as how there are solutions accessible to conserve and responsibly consume
water on an individual, city and county wide level, there is little excuse in leaving the concerns
of our future with water unaddressed. By addressing issues such as fire risk, water municipality,
green infrastructure, and urban vegetation, we can begin to establish more modern policy
initiatives and can begin to appropriately alleviate pressures on our water sources by
urbanization and climate change. By putting the various methods addressed above into
sustainable action, the Montana cities of Bozeman and Belgrade can hope to withstand the
unavoidable growth that is bound to continue in Gallatin County Montana.
50
References Almy, R. B. (2016). The Real Value of Water Audits. Journal of the New England Water Works Association;
Boston, 130(4), 257-265.
Cashman Nursery (2016). Effective Water Use. Retrieved from https://cashmannursery.com/gardening-
tips/2010/effective-water-use/
Chastain-Howley, A. (2007). Water Audits Got a Little Easier in 2006. American Water Works Association.
Journal; Denver, 99(2), 36-7.
Chenoweth, J., Anderson, A., Kumar P., Hunt, W., Chimbwandira, S., & Moore, T. (2018). The Interrelationship of
Green Infrastructure and Natural Capital. Land Use Policy 75 (June): 137–44.
https://doi.org/10.1016/j.landusepol.2018.03.021
City of Bozeman (2013). Integrated Water Management Plan: Bozeman Executive Summary. Retrieved from
https://www.bozeman.net/government/water-conservation/resources
City of Bozeman (2016). City of Bozeman Future Water Supply Planning. Retrieved from
https://leg.mt.gov/content/Committees/Interim/2015-2016/Water-Policy/Meetings/March-
2016/BozemanPacketOutline.pdf
City of Bozeman. (2018). Article 4: Community Design, Code of Ordinances. Retrieved from Bozeman, Montana
Municode Library.
Coutts, C., & Hahn, M. (2015). Green Infrastructure, Ecosystem Services, and Human Health. International Journal
of Environmental Research and Public Health 12 (8): 9768–98. https://doi.org/10.3390/ijerph120809768
DNRC (2015). Montana State Water Plan. Retrieved from
http://dnrc.mt.gov/divisions/water/management/docs/state-water-plan/2015_mt_water_plan.pdf
Echologics (2018). LeakFinderSTTM. Retrieved from
https://www.echologics.com/sites/echologics.com/files/LeakFinderST.pdf
EPA (2015). Water Audits and Water Loss Control for Public Water Systems. Retrieved from
https://www.epa.gov/sites/production/files/2015-04/documents/epa816f13002.pdf
Frisina, M., Wambolt, C., & Frisina, M., (2018). Animal & Range Sciences, Montana State University ARNR 438.
Bozeman, MT: August L. Hormay Wildlands Institute, Inc.
Gallatin County Emergency Management. (2016a). Mitigation. Retrieved, from
https://www.readygallatin.com/mitigation/
Gallatin County Emergency Management. (2016). Wildfire in Gallatin County. Retrieved October 14, 2018 from
https://www.readygallatin.com/community-resources/preparedness-information/wildfire-in-gallatin-county/
and https://www.readygallatin.com/mitigation/
Gómez-Baggethun, E., & Barton, D. (2013). Classifying and Valuing Ecosystem Services for Urban Planning.
Ecological Economics, Sustainable Urbanisation: A resilient future, 86 (February): 235–45.
https://doi.org/10.1016/j.ecolecon.2012.08.019.
HDR Inc. (2018). Hyalite/Sourdough Water Treatment Plant. Retrieved November 6, 2018, from
https://www.hdrinc.com/portfolio/hyalitesourdough-water-treatment-plant
Headwaters Economics. (2018). New Montana Homes Increase Wildfire Risks. Retrieved from
https://headwaterseconomics.org/wildfire/homes-risk/new-montana-homes-increase-wildfire-risks/
Hunaidi, O., Wang, A., Bracken, M., Gambino, T., & Fricke, C. (2004). Acoustic methods for
locating leaks in municipal water pipe networks. Retrieved from
http://citeseerx.ist.psu.edu/viewdoc/download?doi=10.1.1.6.3793&rep=rep1&type=pdf
Lafortezza, R., Davies, C., Sanesi, G. & Konijnendijk, C. (2013). Green Infrastructure as a Tool
to Support Spatial Planning in European Urban Regions. IForest - Biogeosciences and
Forestry 6 (3): 102. https://doi.org/10.3832/ifor0723-006.
Lesica, P., Lavin, M., & Stickney, P. F. (2012). Manual of Montana Vascular Plants. Fort
Worth: BRIT Press.
Narango, D. L., Tallamy, D. W., & Marra, P. P. (2017). Native plants improve breeding and
foraging habitat for an insectivorous bird. Biological Conservation, 213, 42–50.
https://doi.org/10.1016/j.biocon.2017.06.029
Outside Bozeman. (2009). Xeriscaping and Native Plants. Retrieved from
http://www.outsidebozeman.com/spring-2009/xeriscaping-and-native-plants
51
Tzoulas, K., Korpela, K., Venn, S., Yli-Pelkonen, V., Kaźmierczak, A., Niemela, J. & James, P.
(2007). Promoting Ecosystem and Human Health in Urban Areas Using Green
Infrastructure: A Literature Review. Landscape and Urban Planning 81 (3): 167–78.
https://doi.org/10.1016/j.landurbplan.2007.02.001.
United States Census Bureau (2017). QuickFacts Gallatin County, Montana; Montana.
Retrieved from
https://www.census.gov/quickfacts/fact/table/gallatincountymontana,mt/PST045217https:
//search.proquest.com/agricenvironm/docview/1943672484/8B267AF8854543D8PQ/3?a
ccountid=28148
Waring, K. (2017). Belgrade, Montana: 2017 Master Water Plan. TD&H Engineering.
Retrieved from http://www.ci.belgrade.mt.us/water/water- master-plan.pdf
World Population Review (2018). Population of Counties in Montana. Retrieved from
http://worldpopulationreview.com/us-counties/mt
USDA Forest Service. (2011). Bozeman Municipal Watershed Report. Retrieved from
https://www.fs.usda.gov/Internet/FSE_DOCUMENTS/stelprdb5341008.pdf