Embed Size (px)
Citation preview
The Bolivian Growth Experience in the Post-Washington Consensus EraSarah HaradonDave RogersAllison SchwartzPublic Policy 556: Macroeconomics April 11, 2007
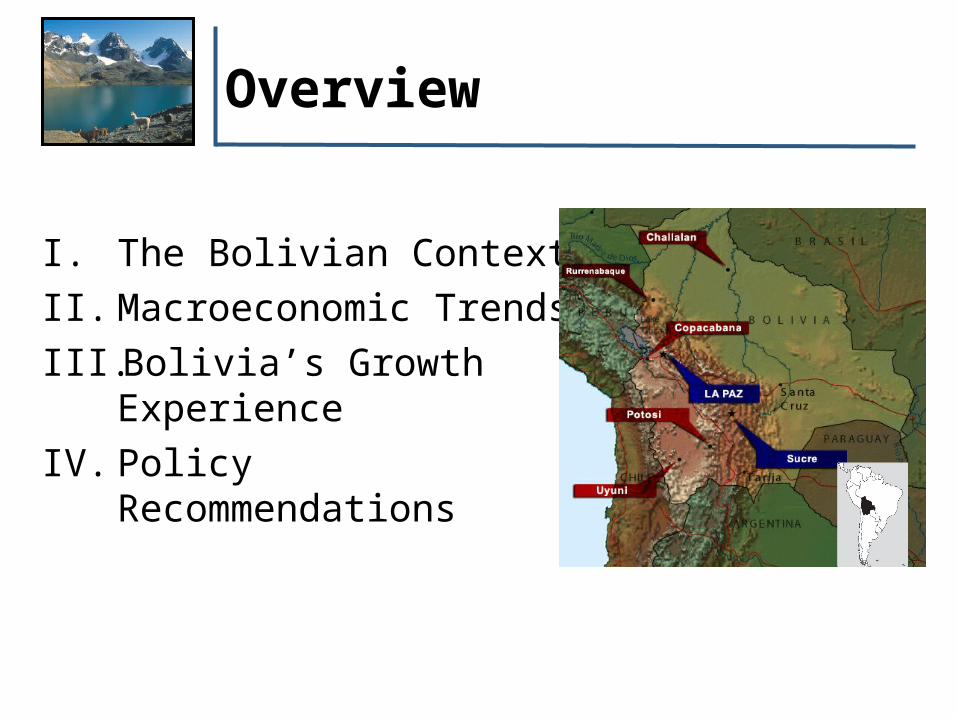
Overview
I. The Bolivian ContextII. Macroeconomic Trends III.Bolivia’s Growth
ExperienceIV. Policy
Recommendations

The Bolivian ContextPopulation:
– 9.8 million (approx. 50% indigenous, 50% European/mixed)– 23% of Bolivians live on less than $1 per day– High literacy (86%) but also high infant mortality (54%)
Economy: – Severe hyperinflation in mid 1980s– Implementation of Washington Consensus Reforms– 1 of 2 SA nations classified as Heavily Indebted Poor Country
– Service sector (51%) Industry (36%) Agriculture (13%)
Politics:– Peacefully transition to democracy in the early 1980s– Five different presidents from 2000 to 2006– Evo Morales, the first indigenous president, elected in 2005
Sources: U.S. State Department, Background Note: Bolivia (2007) and EIU, Country Report: Bolivia (2006)
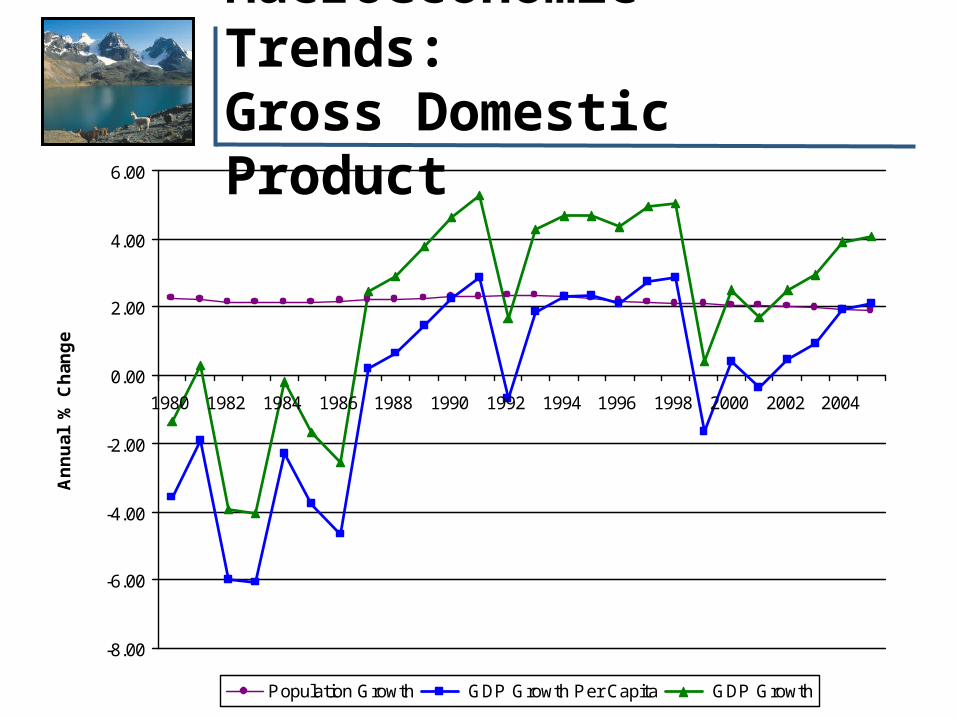
Macroeconomic Trends: Gross Domestic Product
-8.00
-6.00
-4.00
-2.00
0.00
2.00
4.00
6.00
1980 1982 1984 1986 1988 1990 1992 1994 1996 1998 2000 2002 2004
An
nu
al
% C
han
ge
Population Growth GDP Growth Per Capita GDP Growth
-7
-6
-5
-4
-3
-2
-1
0
1
2
3
4
An
nu
al %
Ch
ang
e in
GD
P P
er C
apit
a
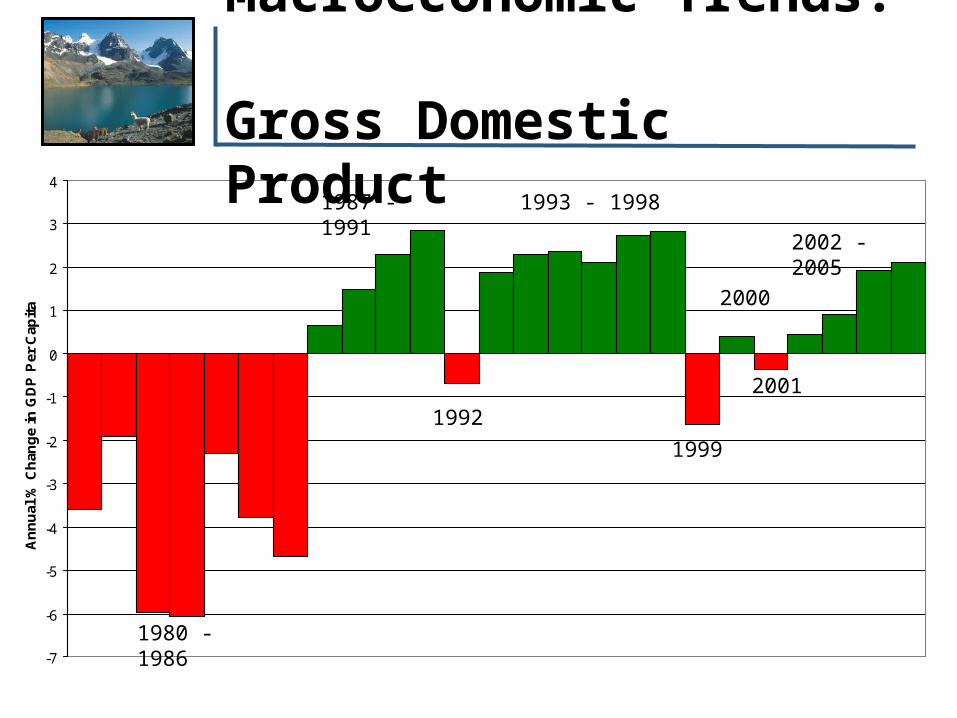
1980 - 1986
1987 - 1991 1993 - 1998
1992
1999
2000
2001
2002 - 2005
Macroeconomic Trends:
Gross Domestic Product

0%
10%
20%
30%
40%
50%
60%
1980 1982 1984 1986 1988 1990 1992 1994 1996 1998 2000 2002 2004
An
nu
al %
Ch
ang
eMacroeconomic Trends:
Inflation
Inflation peaked at 11,670% in 1985
YIKES!

-$800,000,000
-$600,000,000
-$400,000,000
-$200,000,000
$0
$200,000,000
$400,000,000
$600,000,000
1980 1982 1984 1986 1988 1990 1992 1994 1996 1998 2000 2002 2004
Trade Balance Current Account Balance
Macroeconomic Trends: Current Account and Trade Balances

$b -10,000
$b 0
$b 10,000
$b 20,000
$b 30,000
$b 40,000
$b 50,000
1984 1986 1988 1990 1992 1994 1996 1998 2000 2002 2004
Mil
lio
ns
of
Bo
livi
ano
s
Deficit/Surplus Revenue Expenditure
Data unavailable
Macroeconomic Trends: Revenues, Expenditures, and Deficits

Solow Growth Model
Endogenous Growth Model
Source: Professor Kathryn Dominguez
Growth Models
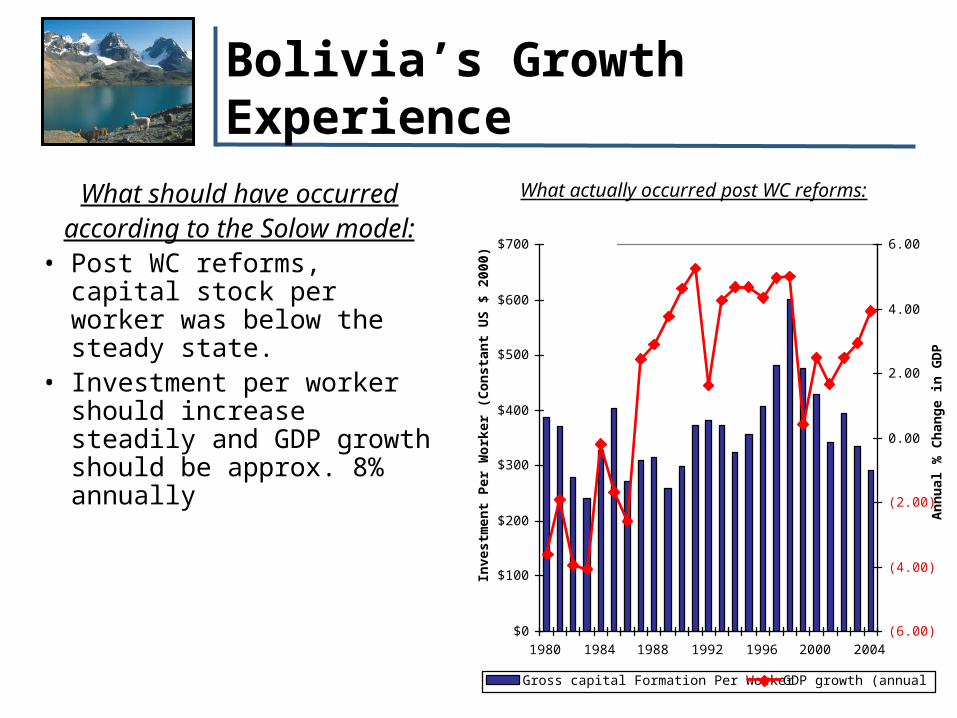
What should have occurredaccording to the Solow
model:• Post WC reforms, capital stock per worker was below the steady state.
• Investment per worker should increase steadily and GDP growth should be approx. 8% annually
What actually occurred post WC reforms:
$0
$100
$200
$300
$400
$500
$600
$700
1980 1984 1988 1992 1996 2000 2004
Inv
es
tme
nt
Pe
r W
ork
er
(Co
ns
tan
t U
S $
20
00
)
(6.00)
(4.00)
(2.00)
0.00
2.00
4.00
6.00
An
nu
al
% C
ha
ng
e i
n G
DP
Gross capital Formation Per Worker GDP growth (annual %)
Bolivia’s Growth Experience

• Bolivia ranks 115 on UNDP’s HDI, more than 20 places behind its nearest South American neighbor.
• Limited enrollment in secondary (88%) and tertiary (41%) education.• “Brain drain” phenomenon, negative net effect on annual GDP growth.
Sources: EIU, Bolivia Country Profile 2006; UNDP, Human Development Report: 2006; World Bank, Bolivia Data Profile and Report =International Migration, Remittances, and the Brain Drain
Bolivia’s Growth Experience: Lack of Human Capital

• Lack of a port, and poor infrastructure serves as a barrier to both attracting foreign investment and improving domestic productivity.
• Political instability may threaten Bolivia’s ability to secure FDI.
• FDI levels lag behind comparison nations such as Peru and Botswana.
Sources: Ahlquist, John; Asiedu, Elizabeth; EIU, Bolivia Country Profile 2006, and World Bank, World Development Indicators
(10)
(5)
0
5
10
15
20
25
1980 1982 1984 1986 1988 1990 1992 1994 1996 1998 2000 2002 2004An
nu
al P
erce
nt
Ch
ang
e
Bolivia Botsw ana Peru
Bolivia, Botswana, and Peru: Comparison of Annual Percent Change in FDI from 1980 - 2005
Bolivia’s Growth Experience: Lack of FDI
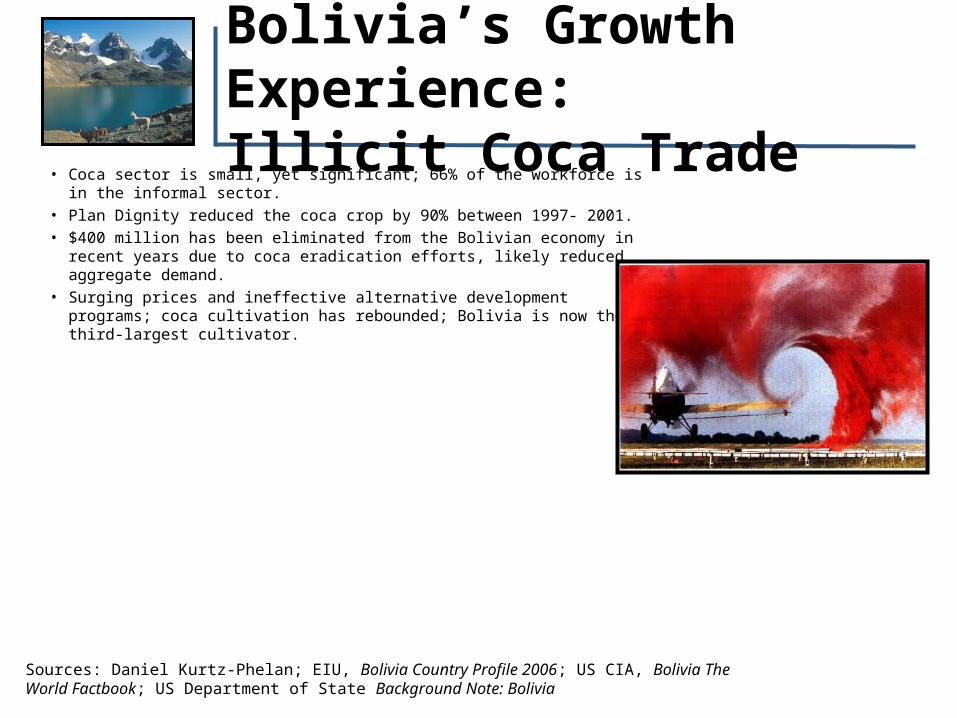
• Coca sector is small, yet significant; 66% of the workforce is in the informal sector.
• Plan Dignity reduced the coca crop by 90% between 1997- 2001.
• $400 million has been eliminated from the Bolivian economy in recent years due to coca eradication efforts, likely reduced aggregate demand.
• Surging prices and ineffective alternative development programs; coca cultivation has rebounded; Bolivia is now the third-largest cultivator.
Sources: Daniel Kurtz-Phelan; EIU, Bolivia Country Profile 2006; US CIA, Bolivia The World Factbook; US Department of State Background Note: Bolivia
Bolivia’s Growth Experience: Illicit Coca Trade

Recommendations
•Provide more opportunities and incentives for young people to attain secondary and tertiary level educations –Supply-side investments–Demand-side investments
(1) Invest in a skilled population by increasing resources for education and creating incentives at the secondary and tertiary levels.
Recommendations
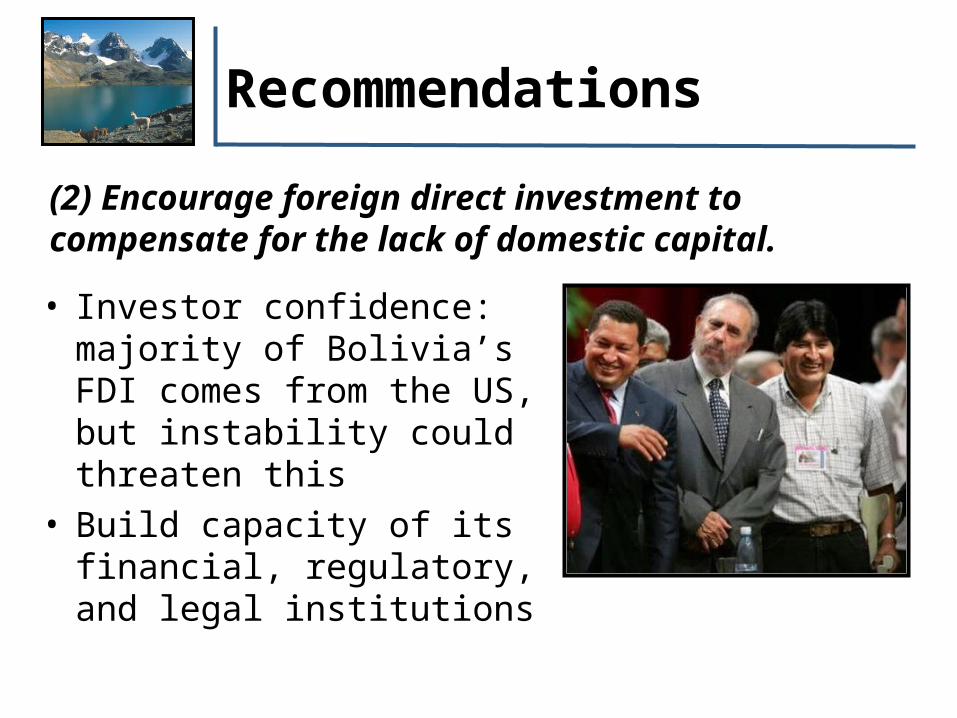
• Investor confidence: majority of Bolivia’s FDI comes from the US, but instability could threaten this
• Build capacity of its financial, regulatory, and legal institutions
(2) Encourage foreign direct investment to compensate for the lack of domestic capital.

Recommendations
• The coca issue must be addressed in order to promote political stability and boost investor confidence
• Include the international community on negotiating issues related to coca
• Promote more effective alternative development schemes
(3) Revisit coca eradication and alternative development projects.
Thank you!
Several images courtesy of Google images.