Embed Size (px)
Citation preview
1
Dr. Robert Bartels, Senior Research Engineer, Aeroelasticity Branch, LaRC
Co-investigators:
Mr. Rob Scott, Senior Research Engineer, Aeroelasticity Branch, LaRCMr. Timothy J. Allen, Boeing Research and Technology, Huntington BeachMr. Bradley W. Sexton, Boeing Research and Technology, St Louis
National Aeronautics and Space Administration
www.nasa.gov
The Boeing SUGAR Truss-Braced Wing Aircraft: Wind-Tunnel Data and Aeroelastic Analyses
NASA Ames Applied Modeling and Simulation SeminarApril 16, 2015
2
Outline
• Context and objectives
• Wind tunnel testing and validation data
• Analyses
– Structural Models
– Aerodynamic Modeling
– Mode Shape Transfer Between Dissimilar CSD/CFD Models
– Results
• Flutter Simulations with Linear Aerodynamics
• Sensitivity to structural model and angle of attack
• Conclusions
3
Outline
• Context and objectives
• Wind tunnel testing and validation data
• Analyses
– Structural Models
– Aerodynamic Modeling
– Mode Shape Transfer Between Dissimilar CSD/CFD Models
– Results
• Flutter Simulations with Linear Aerodynamics
• Sensitivity to structural model and angle of attack
• Conclusions
4
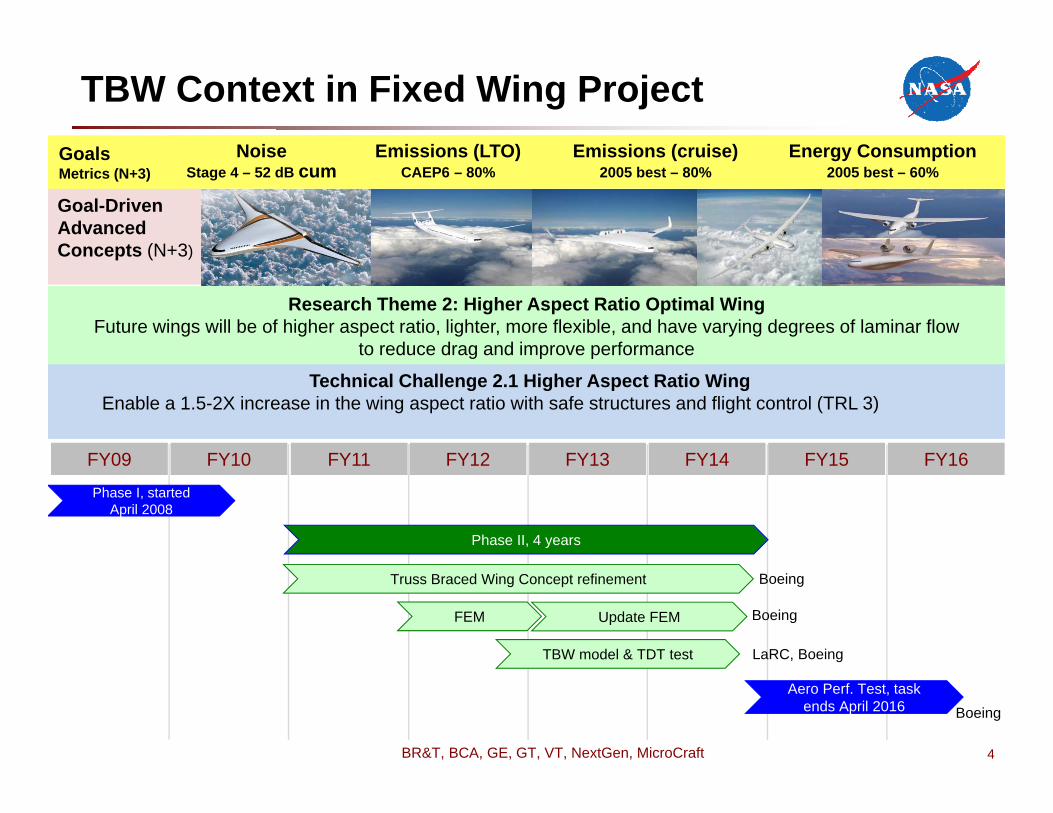
GoalsMetrics (N+3)
NoiseStage 4 – 52 dB cum
Emissions (LTO)CAEP6 – 80%
Emissions (cruise)2005 best – 80%
Energy Consumption2005 best – 60%
Research Theme 2: Higher Aspect Ratio Optimal WingFuture wings will be of higher aspect ratio, lighter, more flexible, and have varying degrees of laminar flow
to reduce drag and improve performance
Research Theme 2: Higher Aspect Ratio Optimal WingFuture wings will be of higher aspect ratio, lighter, more flexible, and have varying degrees of laminar flow
to reduce drag and improve performance
Goal-DrivenAdvancedConcepts (N+3)
TBW Context in Fixed Wing Project
Technical Challenge 2.1 Higher Aspect Ratio WingEnable a 1.5-2X increase in the wing aspect ratio with safe structures and flight control (TRL 3)
Phase I, started April 2008
Phase II, 4 years
FY09 FY10 FY11 FY14
FEM
TBW model & TDT test
Aero Perf. Test, task ends April 2016
Truss Braced Wing Concept refinement
LaRC, Boeing
Boeing
FY12 FY13 FY15 FY16
Update FEM
Boeing
Boeing
BR&T, BCA, GE, GT, VT, NextGen, MicroCraft
5
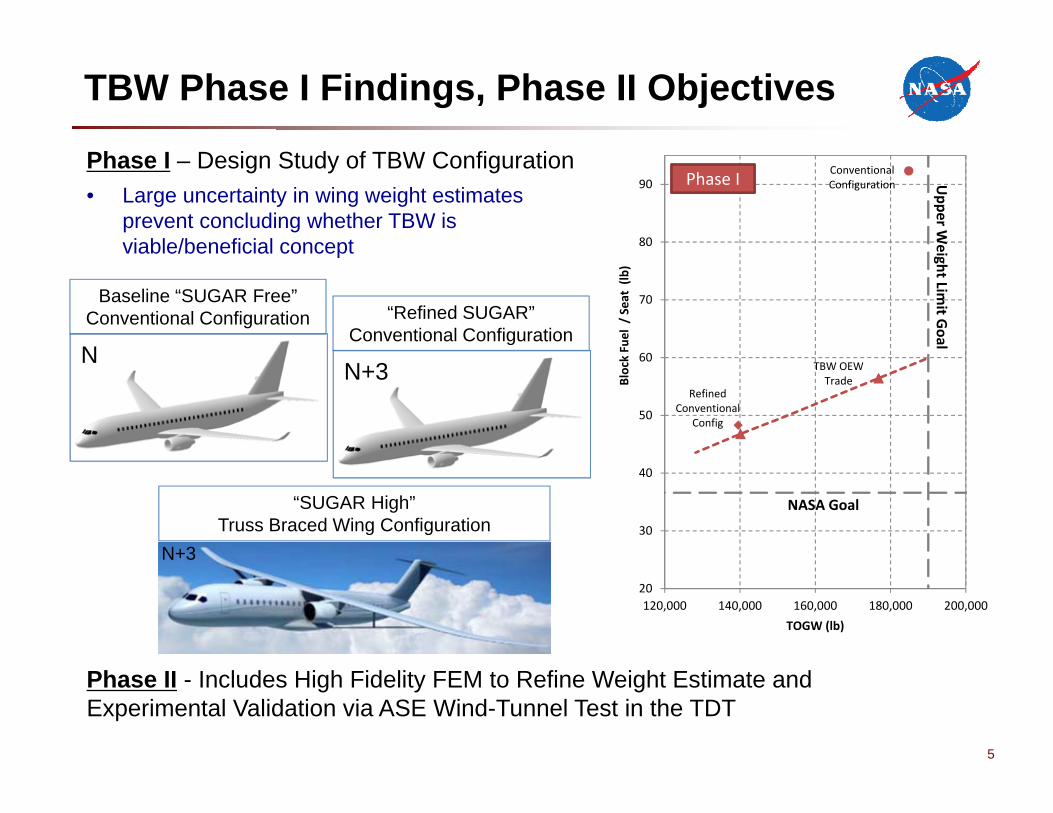
TBW Phase I Findings, Phase II Objectives
Phase I – Design Study of TBW Configuration• Large uncertainty in wing weight estimates
prevent concluding whether TBW is viable/beneficial concept
Conventional Configuration
TBW OEW Trade
Refined Conventional
Config
20
30
40
50
60
70
80
90
120,000 140,000 160,000 180,000 200,000Block Fuel / Seat (lb
)TOGW (lb)
NASA Goal
Upper W
eight Limit G
oal
Baseline “SUGAR Free”Conventional Configuration
N
“SUGAR High”Truss Braced Wing Configuration
“Refined SUGAR”Conventional Configuration
N+3
Phase I
Phase II - Includes High Fidelity FEM to Refine Weight Estimate and Experimental Validation via ASE Wind-Tunnel Test in the TDT
N+3
6
Outline
• Introduction
• Wind tunnel testing and validation data
• Analyses
– Structural Models
– Aerodynamic Modeling
– Mode Shape Transfer Between Dissimilar CSD/CFD Models
– Results
• Flutter Simulations with Linear Aerodynamics
• Sensitivity to structural model and angle of attack
• Conclusions
7
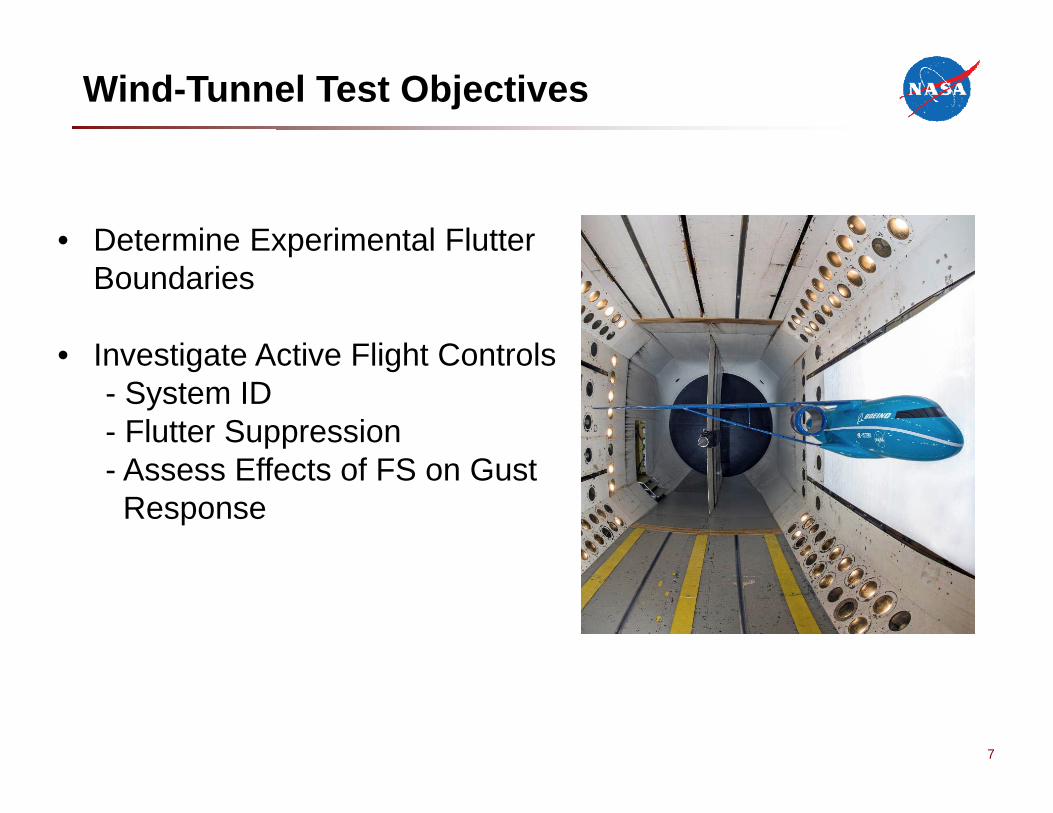
Wind-Tunnel Test Objectives
• Determine Experimental Flutter Boundaries
• Investigate Active Flight Controls- System ID- Flutter Suppression - Assess Effects of FS on Gust Response
8
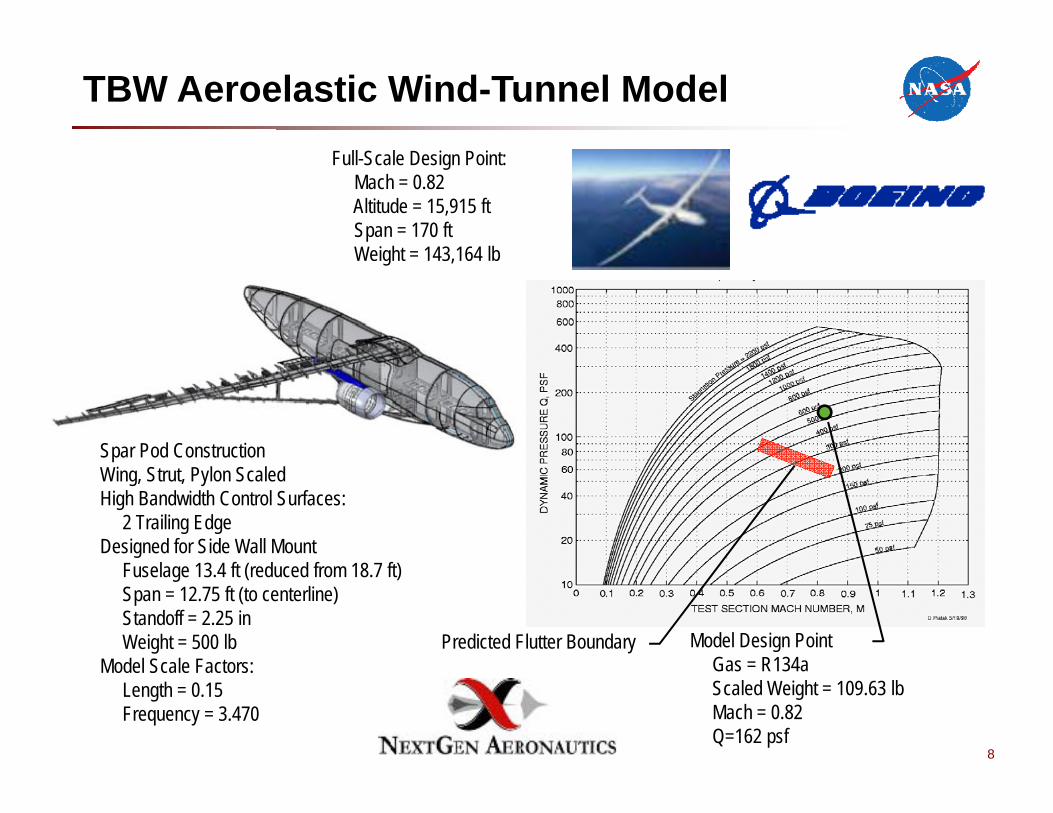
TBW Aeroelastic Wind-Tunnel ModelFull-Scale Design Point:
Mach = 0.82Altitude = 15,915 ftSpan = 170 ftWeight = 143,164 lb
Spar Pod ConstructionWing, Strut, Pylon ScaledHigh Bandwidth Control Surfaces:
2 Trailing EdgeDesigned for Side Wall Mount
Fuselage 13.4 ft (reduced from 18.7 ft)Span = 12.75 ft (to centerline)Standoff = 2.25 inWeight = 500 lb
Model Scale Factors:Length = 0.15Frequency = 3.470
Model Design PointGas = R134aScaled Weight = 109.63 lbMach = 0.82Q=162 psf
Predicted Flutter Boundary
9
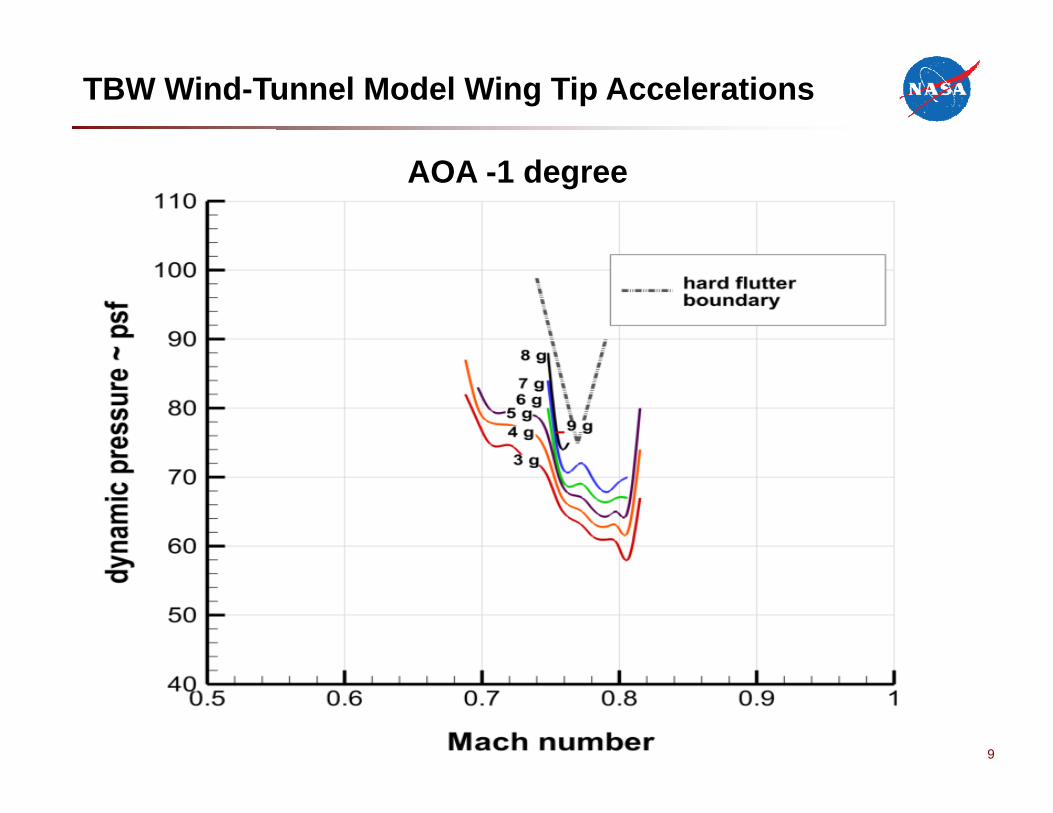
TBW Wind-Tunnel Model Wing Tip Accelerations
AOA -1 degree
10
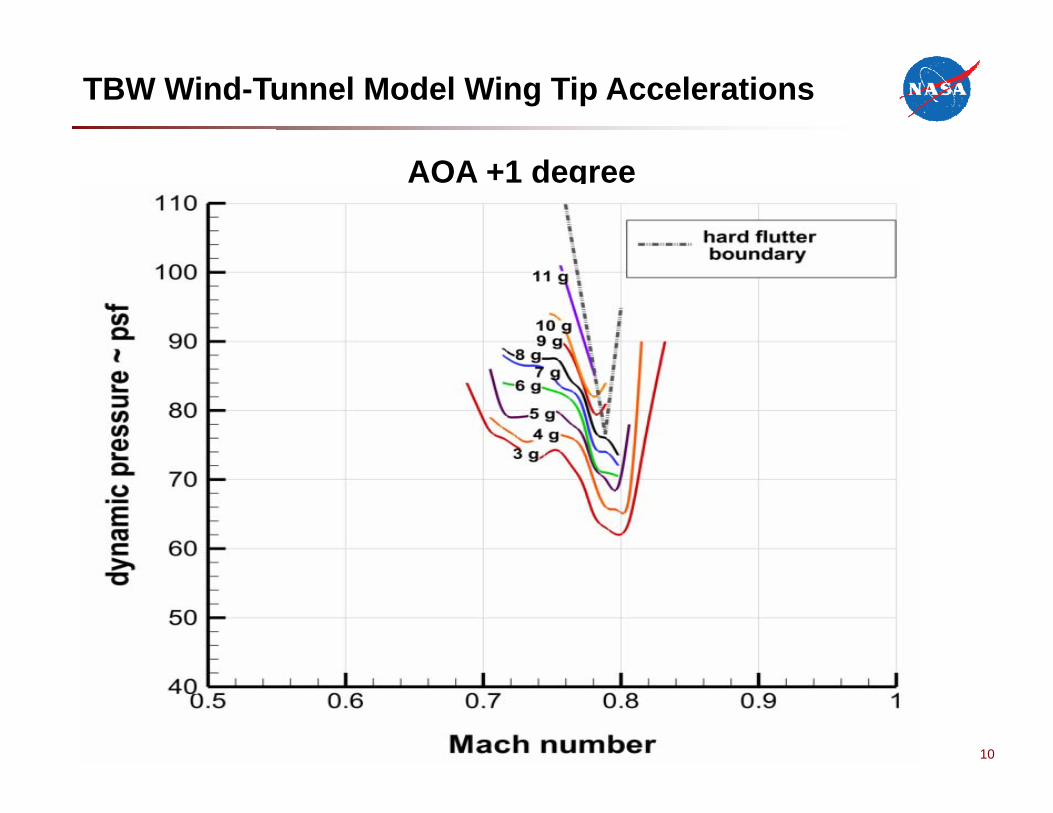
TBW Wind-Tunnel Model Wing Tip Accelerations
AOA +1 degree
11
Outline
• Introduction
• Wind tunnel testing and validation data
• Analyses
– Structural Models
– Aerodynamic Modeling
– Mode Shape Transfer Between Dissimilar CSD/CFD Models
– Results
• Flutter Simulations with Linear Aerodynamics
• Sensitivity to structural model and angle of attack
• Conclusions
12
Structural Models
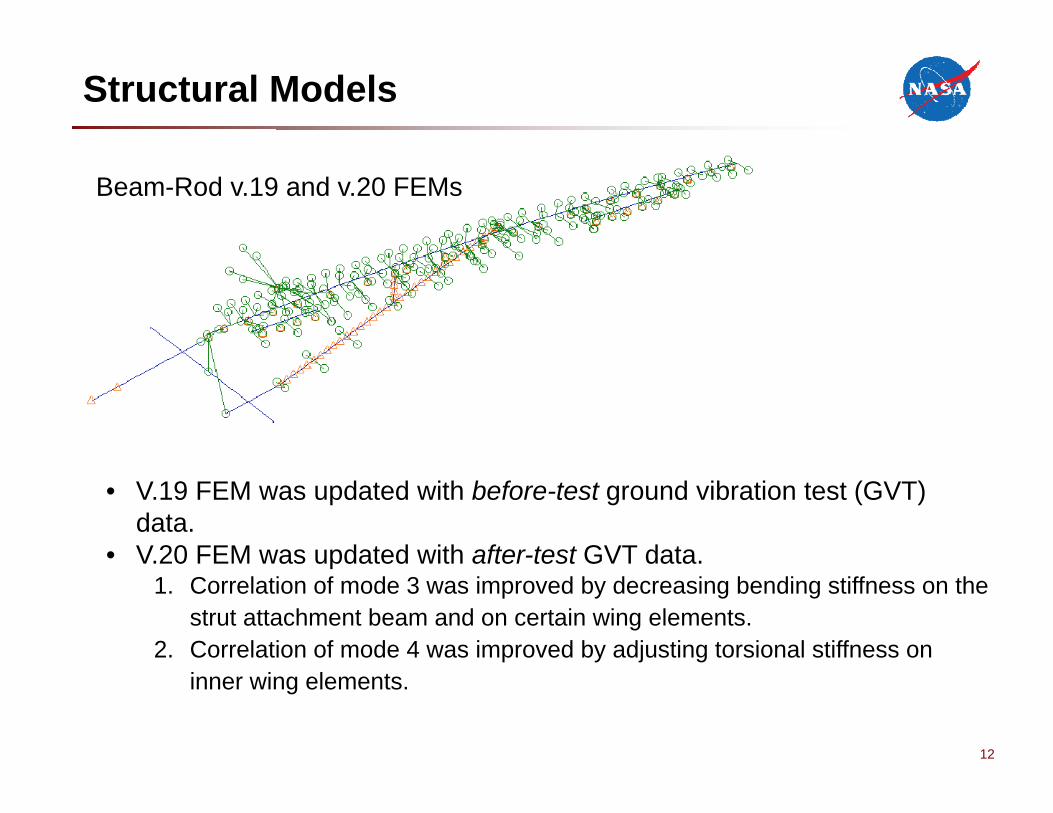
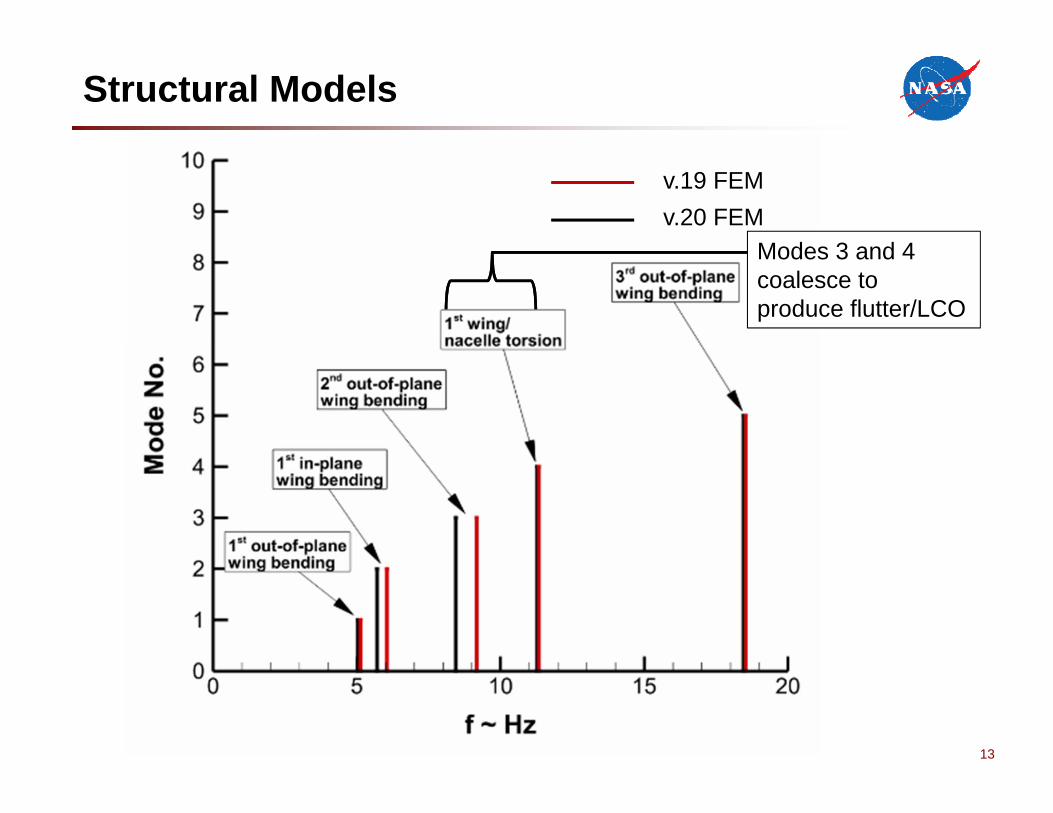
Beam-Rod v.19 and v.20 FEMs
• V.19 FEM was updated with before-test ground vibration test (GVT) data.
• V.20 FEM was updated with after-test GVT data.1. Correlation of mode 3 was improved by decreasing bending stiffness on the
strut attachment beam and on certain wing elements.2. Correlation of mode 4 was improved by adjusting torsional stiffness on
inner wing elements.
13
Structural Models
v.19 FEMv.20 FEM
Modes 3 and 4coalesce to produce flutter/LCO
14
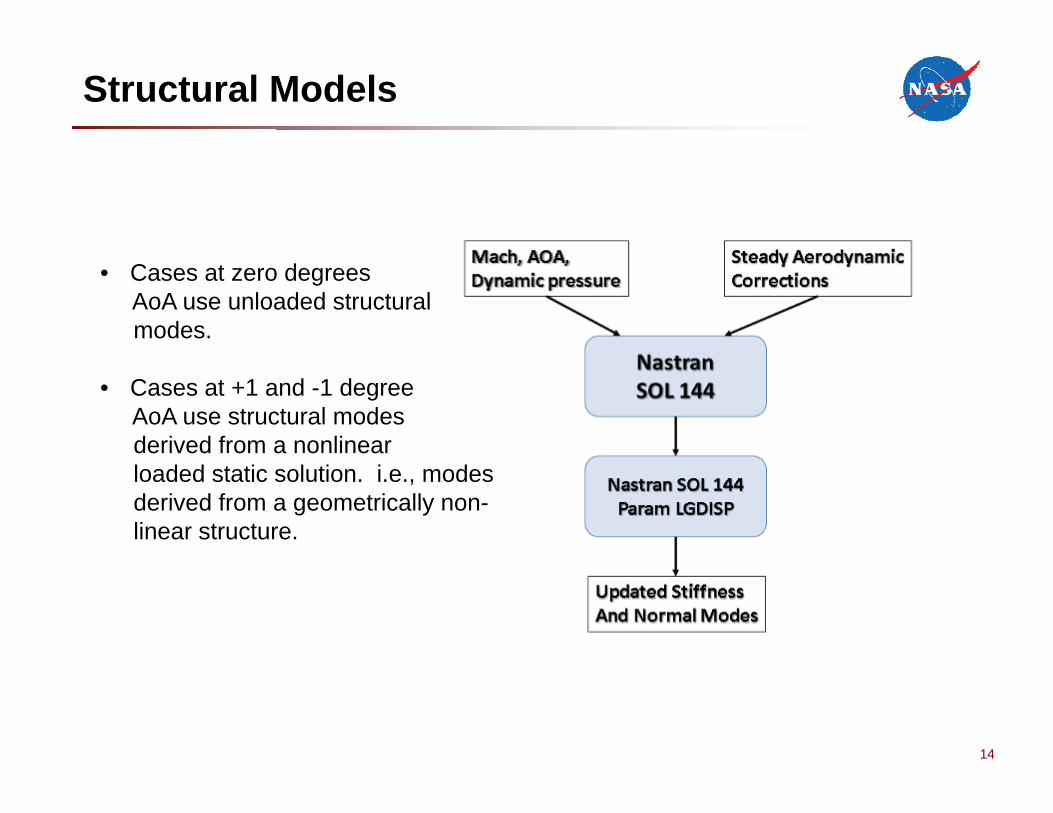
Structural Models
• Cases at zero degreesAoA use unloaded structuralmodes.
• Cases at +1 and -1 degreeAoA use structural modesderived from a nonlinearloaded static solution. i.e., modesderived from a geometrically non-linear structure.
15
Outline
• Introduction
• Wind tunnel testing and validation data
• Analyses
– Structural Models
– Aerodynamic Modeling
– Mode Shape Transfer Between Dissimilar CSD/CFD Models
– Results
• Flutter Simulations with Linear Aerodynamics
• Sensitivity to structural model and angle of attack
• Conclusions
16
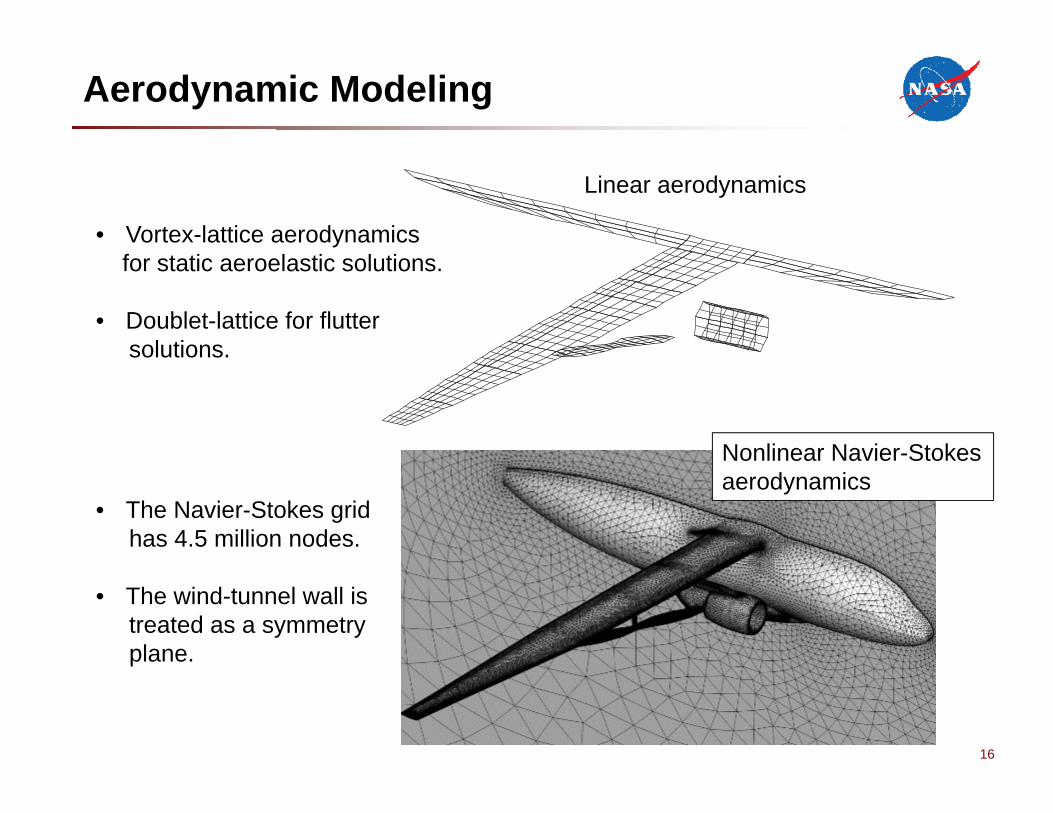
Aerodynamic Modeling
Linear aerodynamics
Nonlinear Navier-Stokesaerodynamics
• The Navier-Stokes grid has 4.5 million nodes.
• The wind-tunnel wall is treated as a symmetry plane.
• Vortex-lattice aerodynamicsfor static aeroelastic solutions.
• Doublet-lattice for fluttersolutions.
17
Outline
• Introduction
• Wind tunnel testing and validation data
• Analyses
– Structural Models
– Aerodynamic Modeling
– Mode Shape Transfer Between Dissimilar CSD/CFD Models
– Results
• Flutter Simulations with Linear Aerodynamics
• Sensitivity to structural model and angle of attack
• Conclusions
18
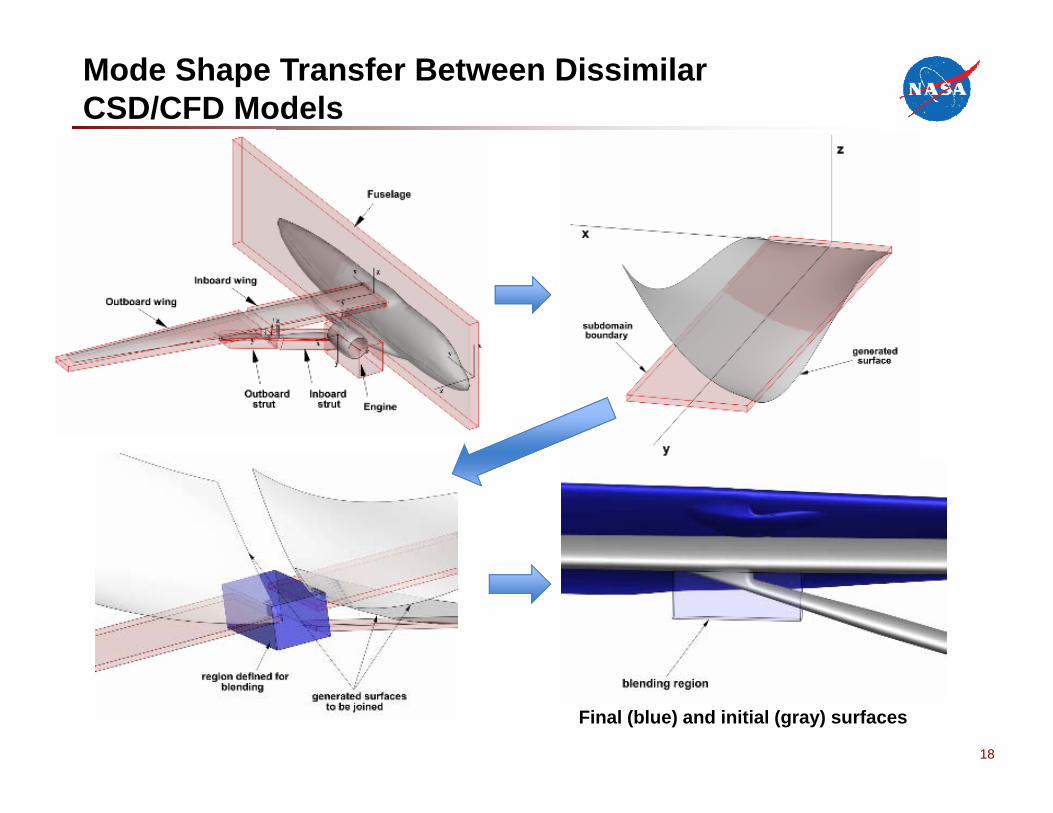
Mode Shape Transfer Between Dissimilar CSD/CFD Models
Final (blue) and initial (gray) surfaces
19
Outline
• Introduction
• Wind tunnel testing and validation data
• Analyses
– Structural Models
– Aerodynamic Modeling
– Mode Shape Transfer Between Dissimilar CSD/CFD Models
– Results
• Flutter Simulations with Linear Aerodynamics
• Sensitivity to structural model and angle of attack
• Conclusions
20
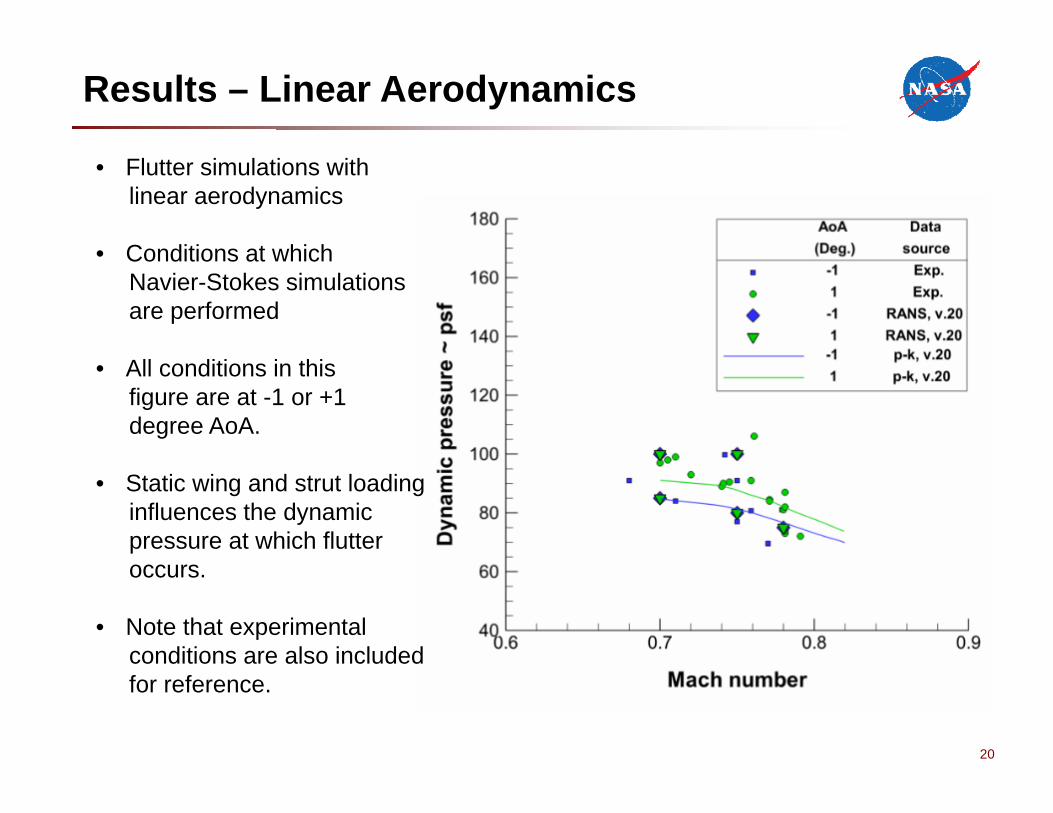
Results – Linear Aerodynamics
• Flutter simulations with linear aerodynamics
• Conditions at whichNavier-Stokes simulationsare performed
• All conditions in thisfigure are at -1 or +1degree AoA.
• Static wing and strut loadinginfluences the dynamic pressure at which flutteroccurs.
• Note that experimentalconditions are also includedfor reference.
21
Outline
• Introduction
• Wind tunnel testing and validation data
• Analyses
– Structural Models
– Aerodynamic Modeling
– Mode Shape Transfer Between Dissimilar CSD/CFD Models
– Results
• Flutter Simulations with Linear Aerodynamics
• Sensitivity to structural model and angle of attack
• Conclusions
22
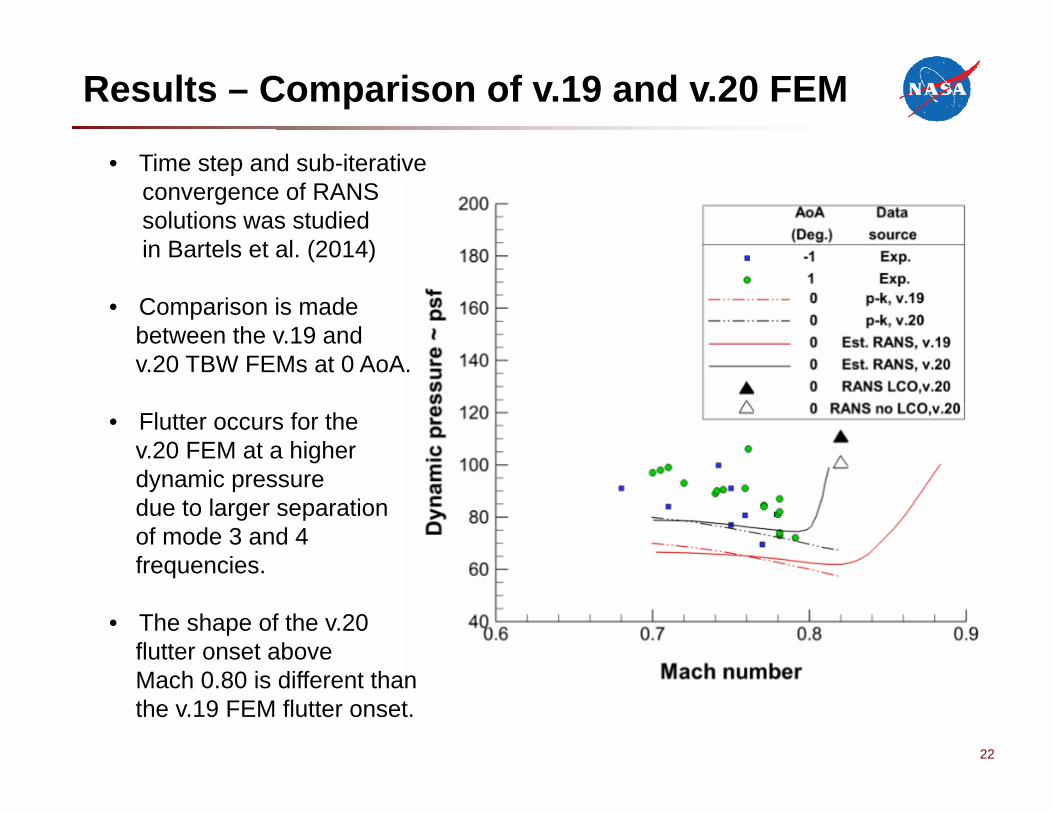
Results – Comparison of v.19 and v.20 FEM
• Time step and sub-iterativeconvergence of RANSsolutions was studiedin Bartels et al. (2014)
• Comparison is madebetween the v.19 and v.20 TBW FEMs at 0 AoA.
• Flutter occurs for thev.20 FEM at a higher dynamic pressure due to larger separationof mode 3 and 4 frequencies.
• The shape of the v.20flutter onset above Mach 0.80 is different thanthe v.19 FEM flutter onset.
23
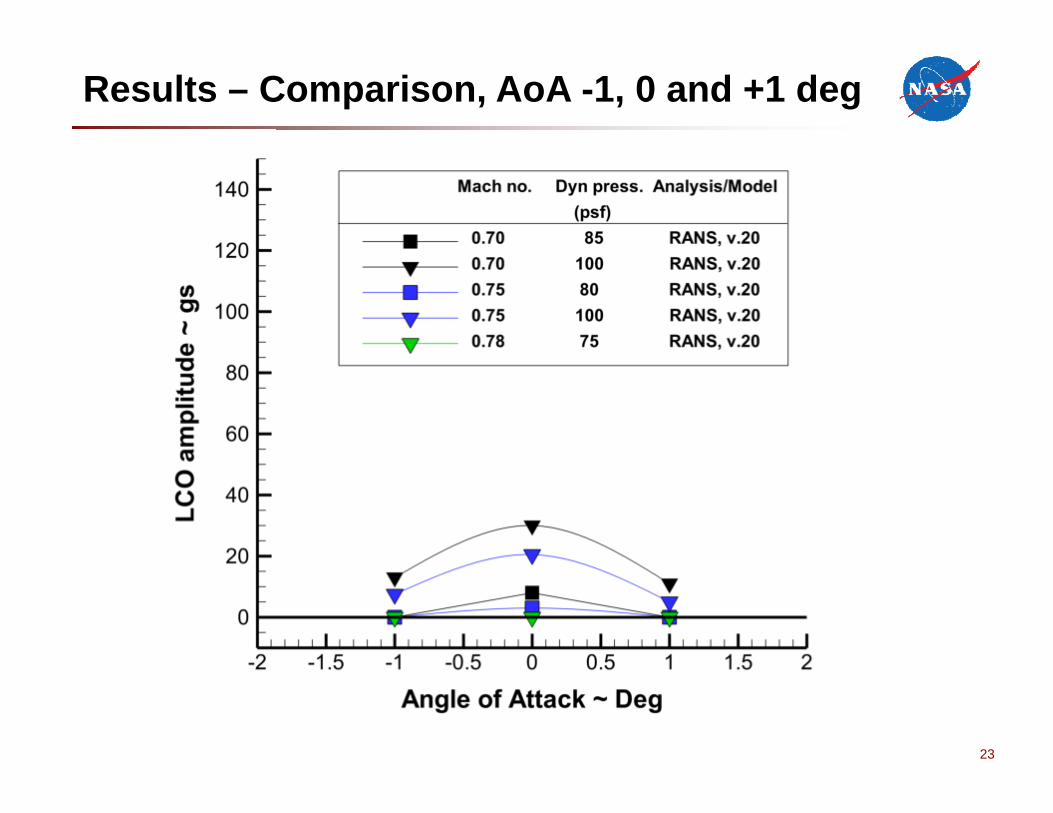
Results – Comparison, AoA -1, 0 and +1 deg
24
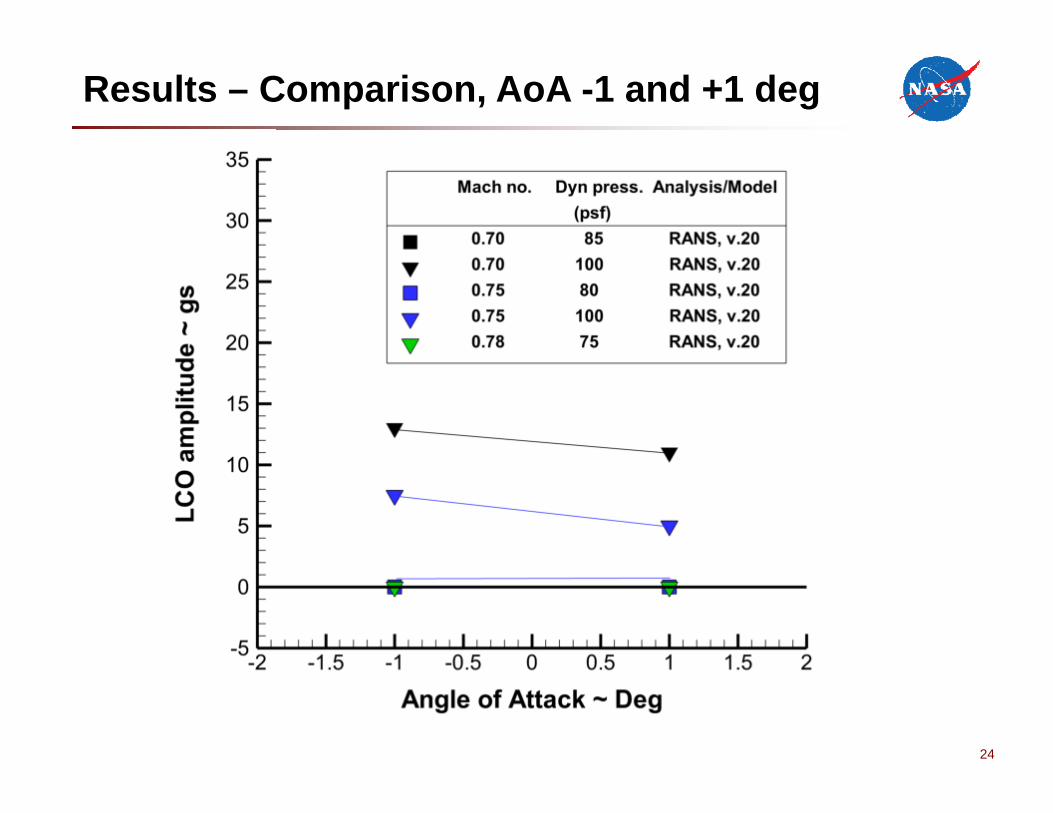
Results – Comparison, AoA -1 and +1 deg
25
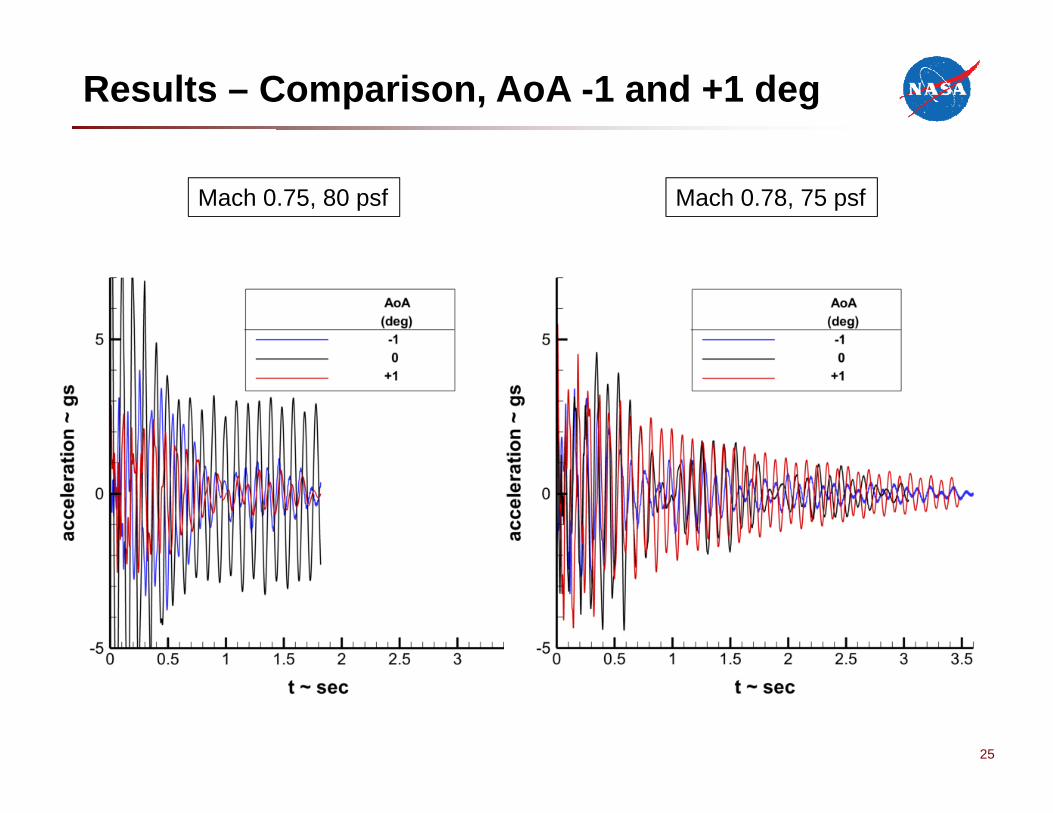
Results – Comparison, AoA -1 and +1 deg
Mach 0.75, 80 psf Mach 0.78, 75 psf
26
Conclusions
• Conclusions that can be clearly made:
1. Angle of attack and model sensitivity is predicted well withlinear aerodynamics and a static nonlinear structural model.
2. LCO is predicted with nonlinear aerodynamics (Navier-Stokes)and linear dynamic structural model
3. Flutter and LCO onset are quite sensitive to the mass and/or stiffness distribution of the wing.
4. Force/displacement transfer between fluid and structure meshes requires algorithms that can accommodate complexbeam structures models and fine CFD mesh spacing.
• Somewhat tentative conclusions:
1. A better refined CFD mesh may enable better correlation ofsimulated LCO onset with experiment.

2727Your Title Here