Embed Size (px)
Citation preview

The Better-for-you Business Case:
How Is the Supermarket Sector
Shaping Up?
www.obesity-solutions.org
Hank Cardello
Senior Fellow & Director
Obesity Solutions Initiative
June 9, 2015
U.S. Obesity Rates Are Continuing to Climb
Source: CDC 2013
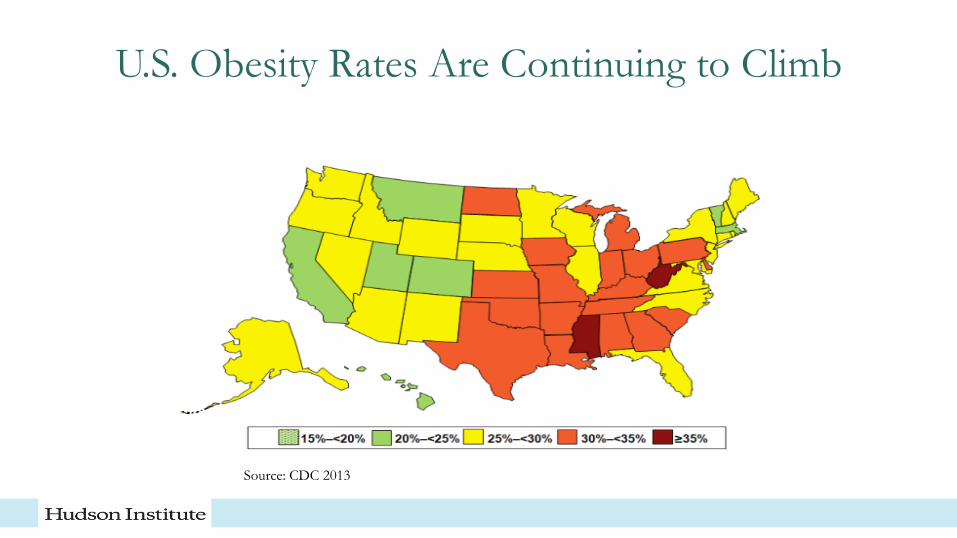
Consumers Understand Connection between Food and Health
I believe there is a definite connection
between diet and health
I wish all foods had some type of
nutritional labeling showing all the ways
they would benefit my health
Eating healthy helps me feel in control
of my life
88% 76% 75%
% general population indicating…
Health Connection Health Attributes Health Benefits
Source: Natural Marketing Institute
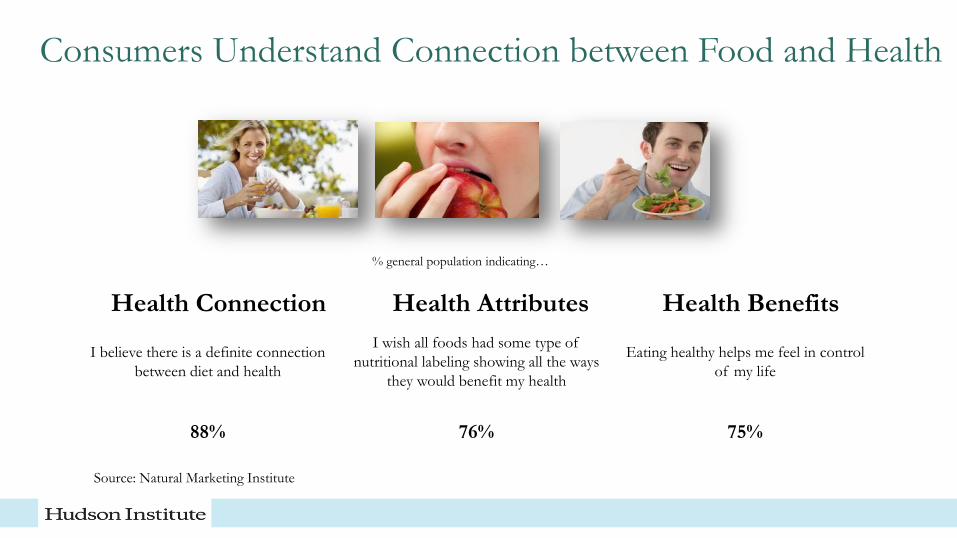
Our Approach:
Is There a Business Case for Selling More
Better-for-you/Lower-Calorie Products?
4
Studies Show That Better-for-you/Lower-Calorie
Foods Are Key Growth Drivers
5
Supermarket study funded by
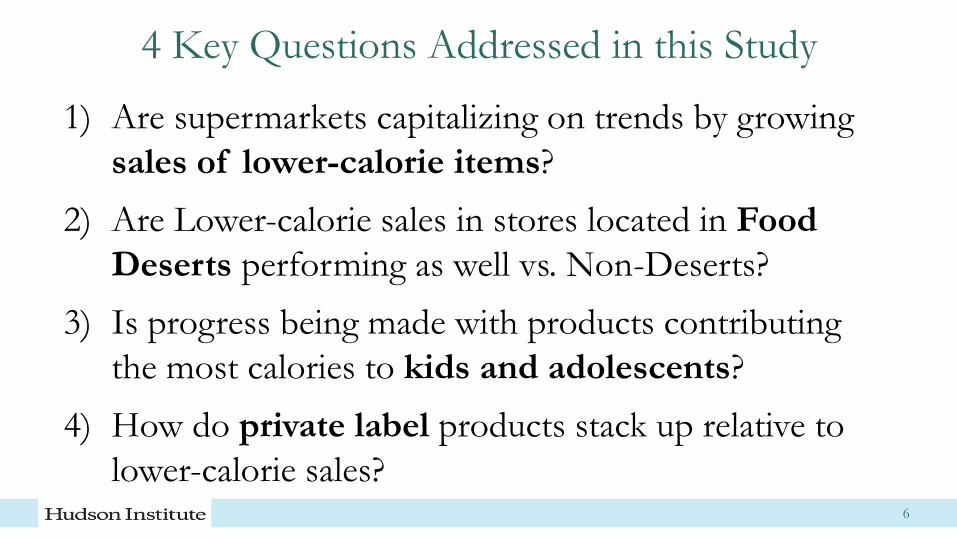
4 Key Questions Addressed in this Study
1) Are supermarkets capitalizing on trends by growing
sales of lower-calorie items?
2) Are Lower-calorie sales in stores located in Food
Deserts performing as well vs. Non-Deserts?
3) Is progress being made with products contributing
the most calories to kids and adolescents?
4) How do private label products stack up relative to
lower-calorie sales? 6
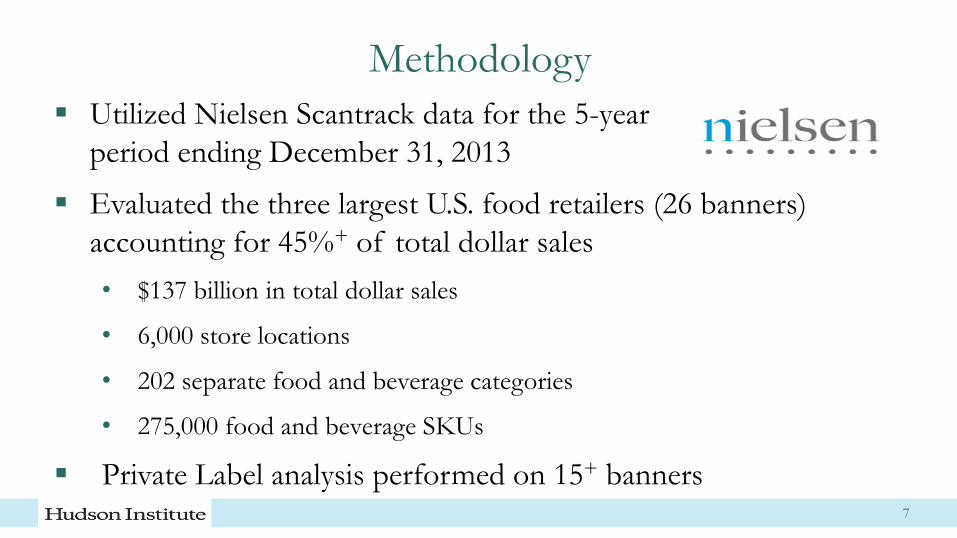
Methodology
Utilized Nielsen Scantrack data for the 5-year
period ending December 31, 2013
Evaluated the three largest U.S. food retailers (26 banners)
accounting for 45%+ of total dollar sales
• $137 billion in total dollar sales
• 6,000 store locations
• 202 separate food and beverage categories
• 275,000 food and beverage SKUs
Private Label analysis performed on 15+ banners 7
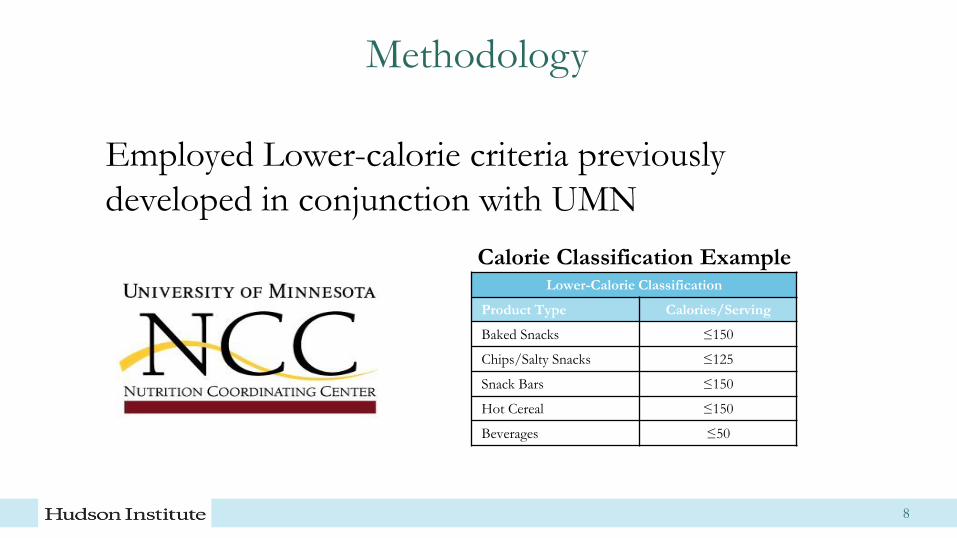
Methodology
Lower-Calorie Classification
Product Type Calories/Serving
Baked Snacks ≤150
Chips/Salty Snacks ≤125
Snack Bars ≤150
Hot Cereal ≤150
Beverages ≤50
Calorie Classification Example
8
Employed Lower-calorie criteria previously
developed in conjunction with UMN

Summary Findings
Summary Findings
Lower-calorie growing more than Higher-calorie, but more slowly than for CPG and Restaurant chains
Lower-calorie growing more than Higher-calorie in both Food Deserts and Non-Food Deserts, but…
• Lower-calorie share of sales in Food Deserts lags its share in Non-Food Deserts
Lower-calorie sales for products delivering the most calories to kids and adolescents are lagging
Private Label making significant inroads in driving Lower-calorie sales growth
10

Key Findings

Overall Store & Dollar Sales Findings
12
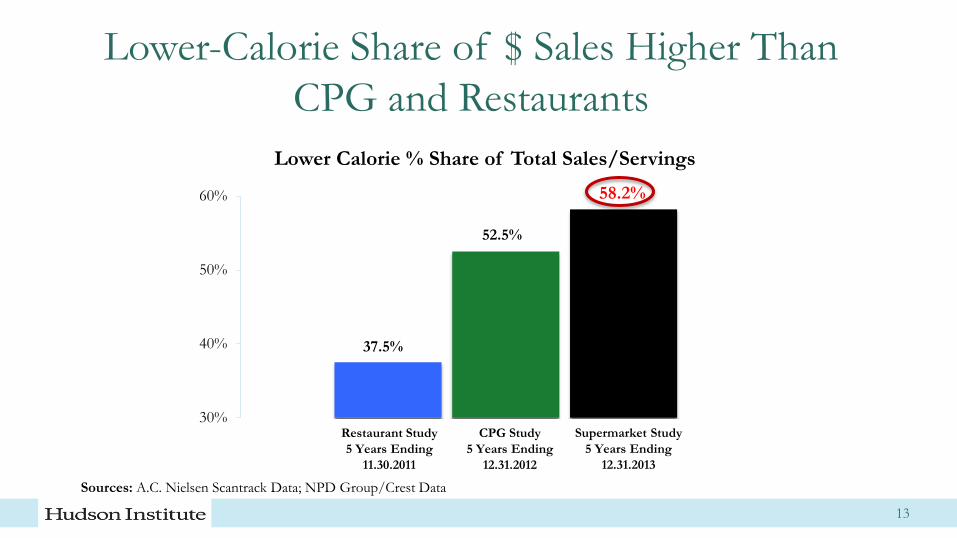
Lower-Calorie Share of $ Sales Higher Than
CPG and Restaurants
100%
13
58.2%
58.2%
37.5%
52.5%
58.2%
30%
40%
50%
60%
Lower Calorie % Share of Total Sales/Servings
Restaurant Study
5 Years Ending
11.30.2011
CPG Study
5 Years Ending
12.31.2012
Supermarket Study
5 Years Ending
12.31.2013
Sources: A.C. Nielsen Scantrack Data; NPD Group/Crest Data
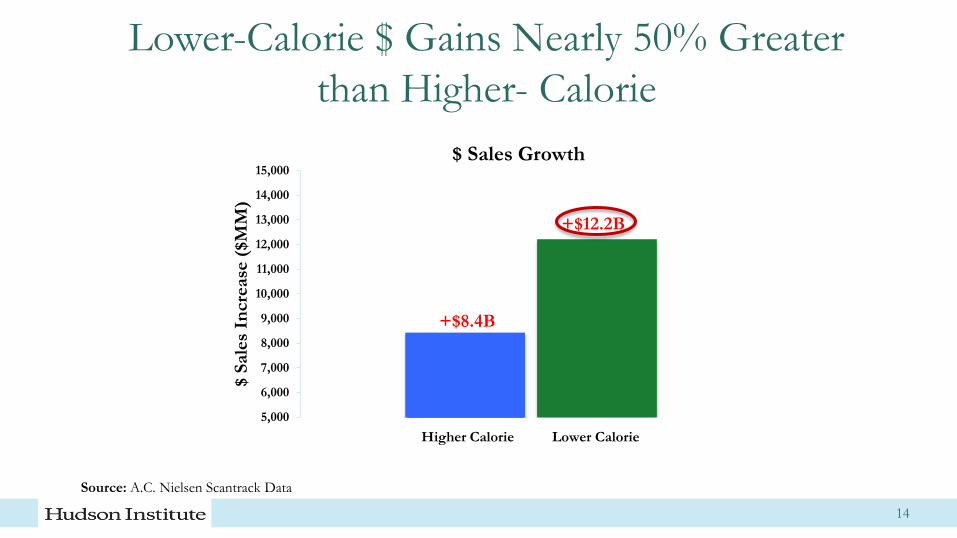
Lower-Calorie $ Gains Nearly 50% Greater
than Higher- Calorie
5,000
6,000
7,000
8,000
9,000
10,000
11,000
12,000
13,000
14,000
15,000
$ S
ale
s In
cre
ase
($M
M)
Higher Calorie
14
$ Sales Growth
Lower Calorie
+$8.4B
+$12.2B
Source: A.C. Nielsen Scantrack Data
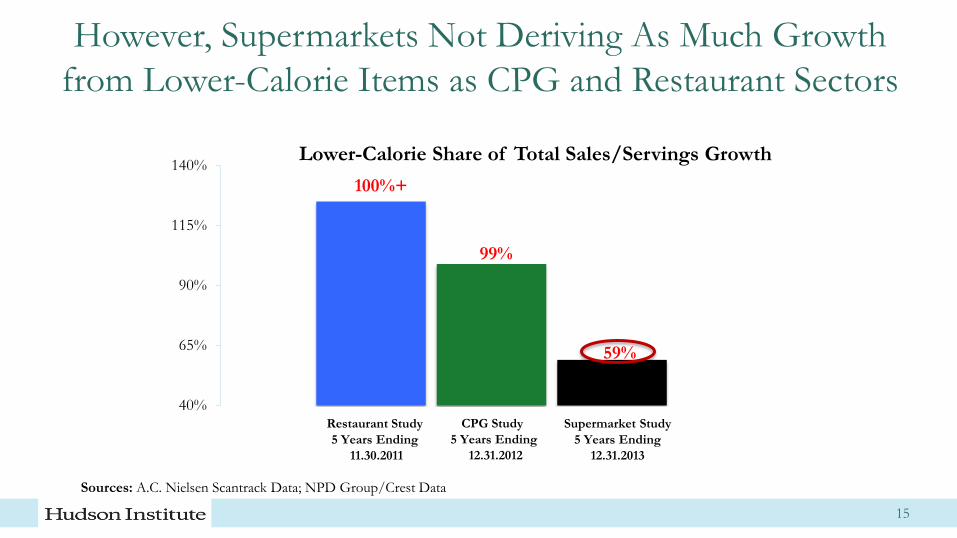
However, Supermarkets Not Deriving As Much Growth
from Lower-Calorie Items as CPG and Restaurant Sectors
100%
15
58.2%
58.2% 40%
65%
90%
115%
140%Lower-Calorie Share of Total Sales/Servings Growth
Restaurant Study
5 Years Ending
11.30.2011
CPG Study
5 Years Ending
12.31.2012
Supermarket Study
5 Years Ending
12.31.2013
Sources: A.C. Nielsen Scantrack Data; NPD Group/Crest Data
100%+
99%
59%
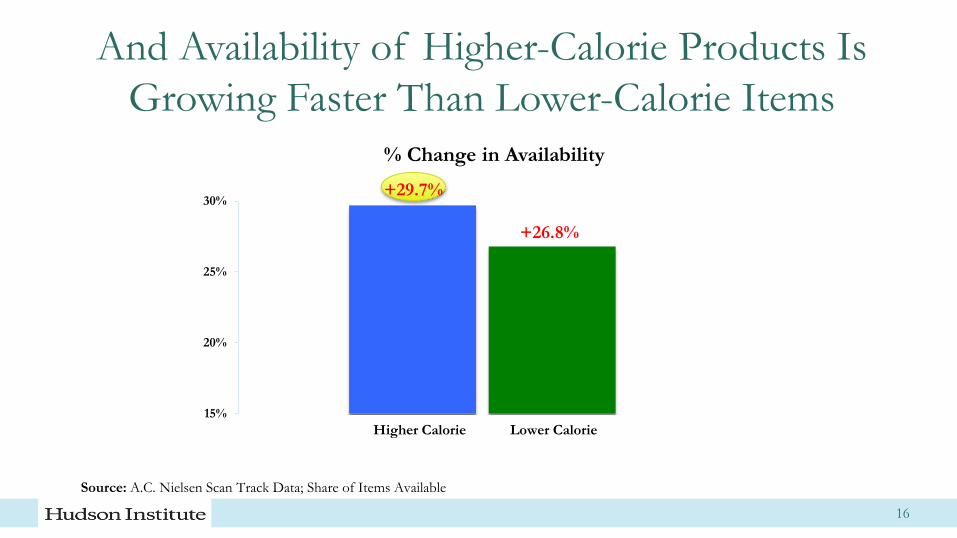
And Availability of Higher-Calorie Products Is
Growing Faster Than Lower-Calorie Items
100%
16
58.2%
58.2% 15%
20%
25%
30%
Higher Calorie Lower Calorie
+29.7%
+26.8%
% Change in Availability
Source: A.C. Nielsen Scan Track Data; Share of Items Available
Food Desert Assessment
17
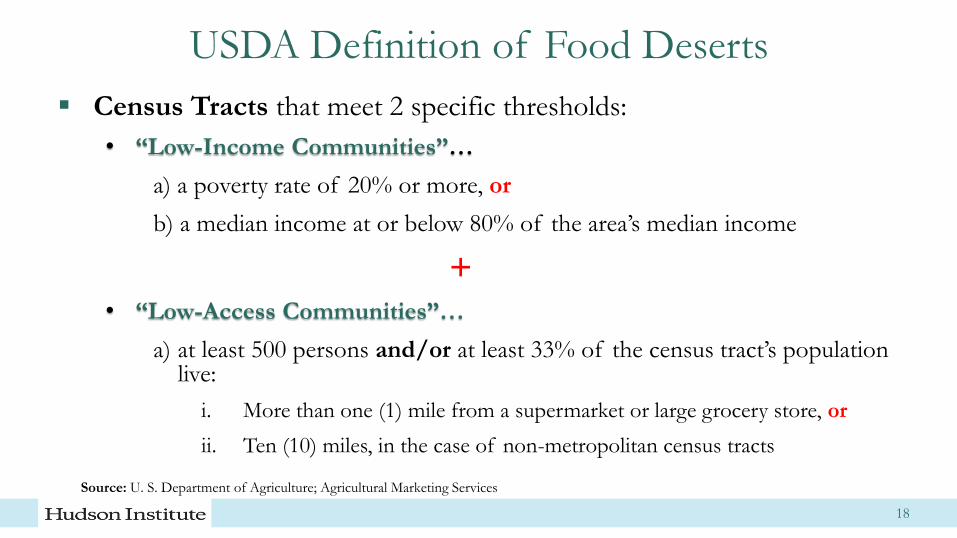
USDA Definition of Food Deserts
Census Tracts that meet 2 specific thresholds:
• “Low-Income Communities”…
a) a poverty rate of 20% or more, or
b) a median income at or below 80% of the area’s median income
+
• “Low-Access Communities”…
a) at least 500 persons and/or at least 33% of the census tract’s population live:
i. More than one (1) mile from a supermarket or large grocery store, or
ii. Ten (10) miles, in the case of non-metropolitan census tracts
18
Source: U. S. Department of Agriculture; Agricultural Marketing Services
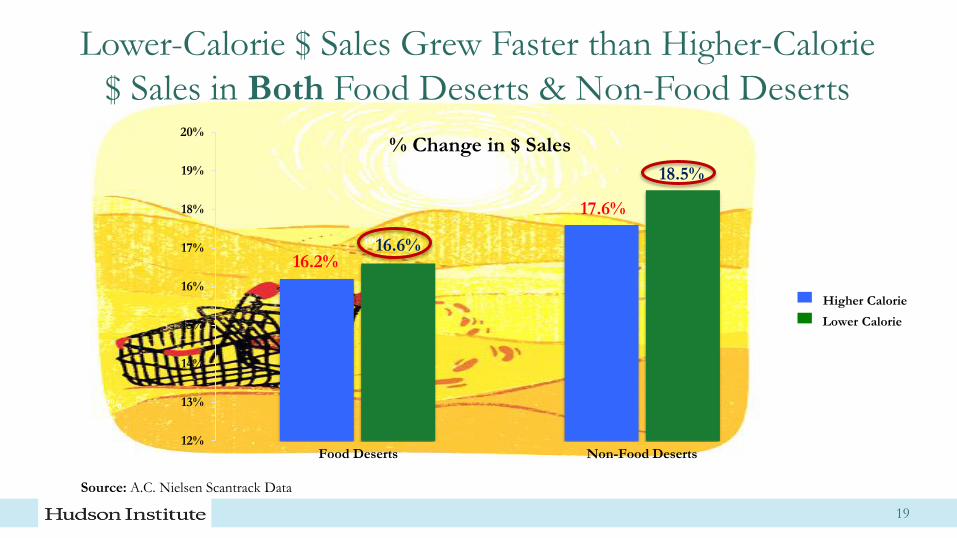
Lower-Calorie $ Sales Grew Faster than Higher-Calorie
$ Sales in Both Food Deserts & Non-Food Deserts
100%
19
58.2%
58.2%
16.2%
17.6%
16.6%
18.5%
12%
13%
14%
15%
16%
17%
18%
19%
20%
Food Deserts Non-Food Deserts
Source: A.C. Nielsen Scantrack Data
% Change in $ Sales
Higher Calorie
Lower Calorie
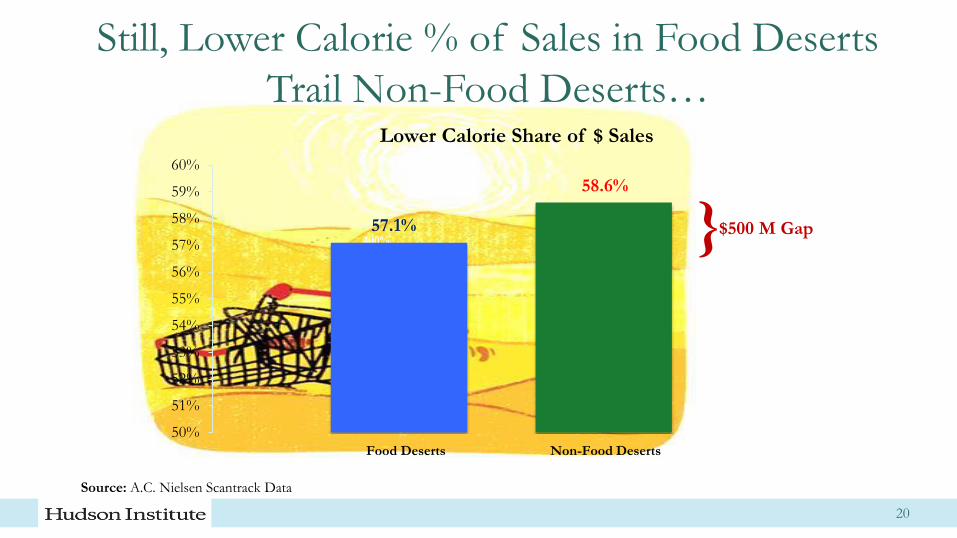
Still, Lower Calorie % of Sales in Food Deserts
Trail Non-Food Deserts…
100%
20
58.2%
58.2%
57.1%
58.6%
50%
51%
52%
53%
54%
55%
56%
57%
58%
59%
60%
Lower Calorie Share of $ Sales
}
Food Deserts Non-Food Deserts
Source: A.C. Nielsen Scantrack Data
$500 M Gap
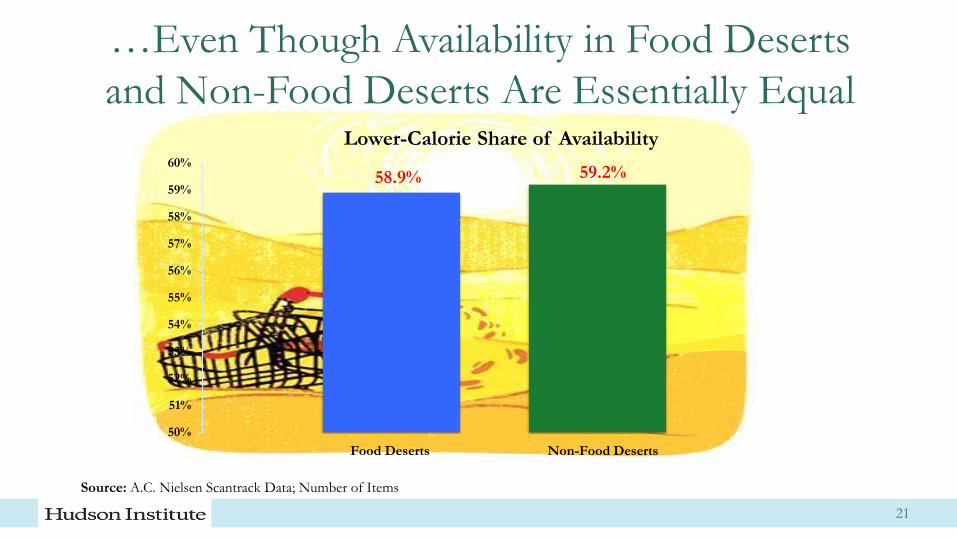
…Even Though Availability in Food Deserts
and Non-Food Deserts Are Essentially Equal
100%
21
58.2%
58.2%
58.9% 59.2%
50%
51%
52%
53%
54%
55%
56%
57%
58%
59%
60%
Lower-Calorie Share of Availability
Food Deserts Non-Food Deserts
Source: A.C. Nielsen Scantrack Data; Number of Items

Foods Contributing The Most Calories to Children
22
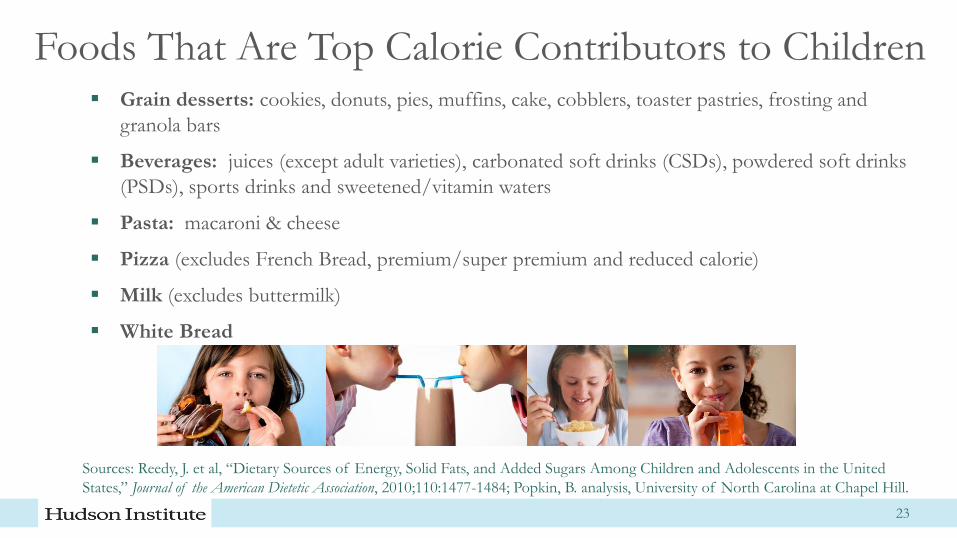
Foods That Are Top Calorie Contributors to Children Grain desserts: cookies, donuts, pies, muffins, cake, cobblers, toaster pastries, frosting and
granola bars
Beverages: juices (except adult varieties), carbonated soft drinks (CSDs), powdered soft drinks
(PSDs), sports drinks and sweetened/vitamin waters
Pasta: macaroni & cheese
Pizza (excludes French Bread, premium/super premium and reduced calorie)
Milk (excludes buttermilk)
White Bread
23
Sources: Reedy, J. et al, “Dietary Sources of Energy, Solid Fats, and Added Sugars Among Children and Adolescents in the United
States,” Journal of the American Dietetic Association, 2010;110:1477-1484; Popkin, B. analysis, University of North Carolina at Chapel Hill.
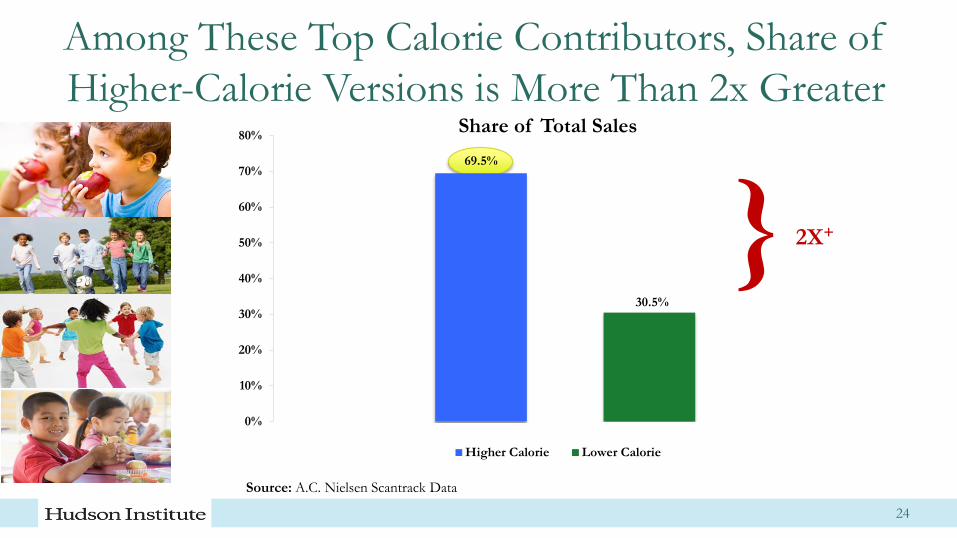
Among These Top Calorie Contributors, Share of
Higher-Calorie Versions is More Than 2x Greater
69.5%
30.5%
0%
10%
20%
30%
40%
50%
60%
70%
80%
Higher Calorie Lower Calorie
Share of Total Sales
Source: A.C. Nielsen Scantrack Data
} 2X+
24
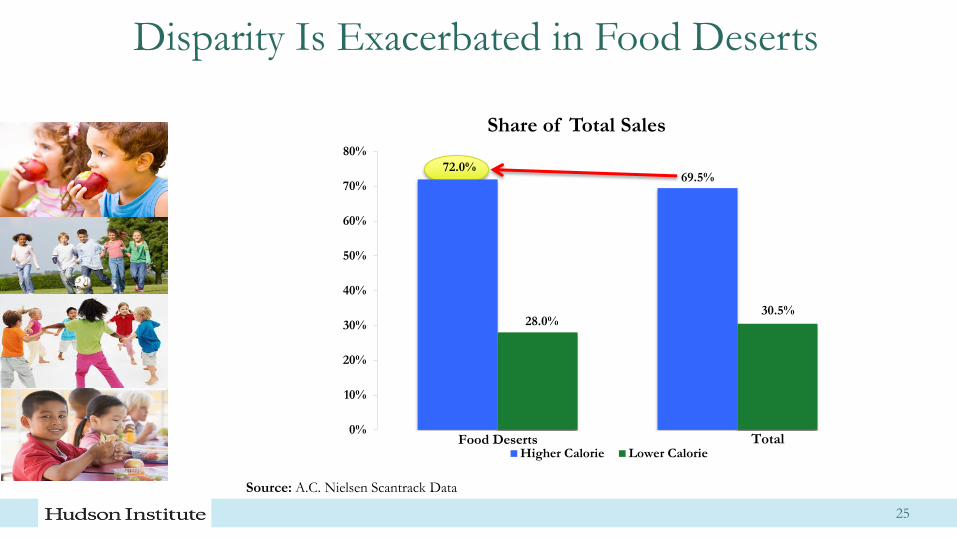
Disparity Is Exacerbated in Food Deserts
72.0% 69.5%
28.0% 30.5%
0%
10%
20%
30%
40%
50%
60%
70%
80%
Higher Calorie Lower CalorieFood Deserts Total
25
Share of Total Sales
Source: A.C. Nielsen Scantrack Data
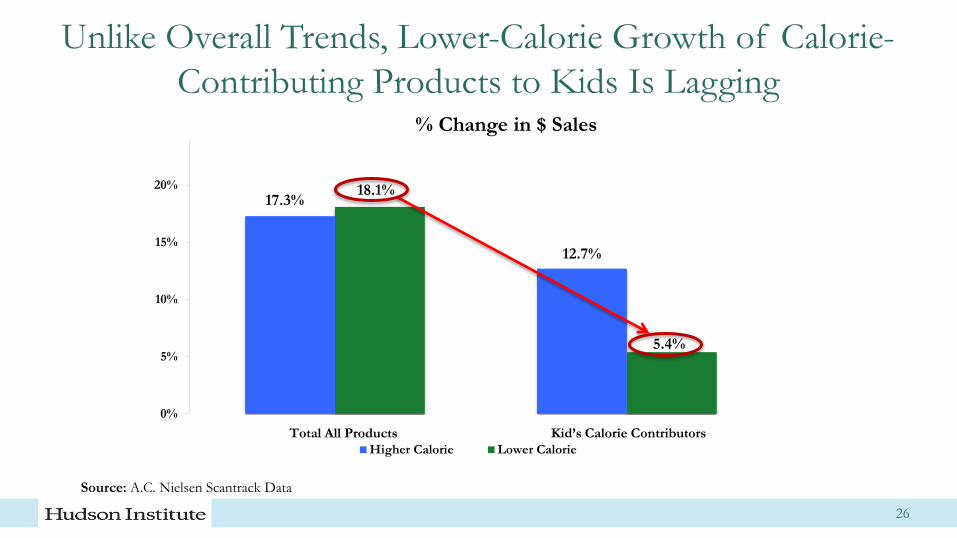
Unlike Overall Trends, Lower-Calorie Growth of Calorie-
Contributing Products to Kids Is Lagging
17.3%
12.7%
18.1%
5.4%
0%
5%
10%
15%
20%
Higher Calorie Lower Calorie
Kid’s Calorie Contributors Total All Products
26
% Change in $ Sales
Source: A.C. Nielsen Scantrack Data
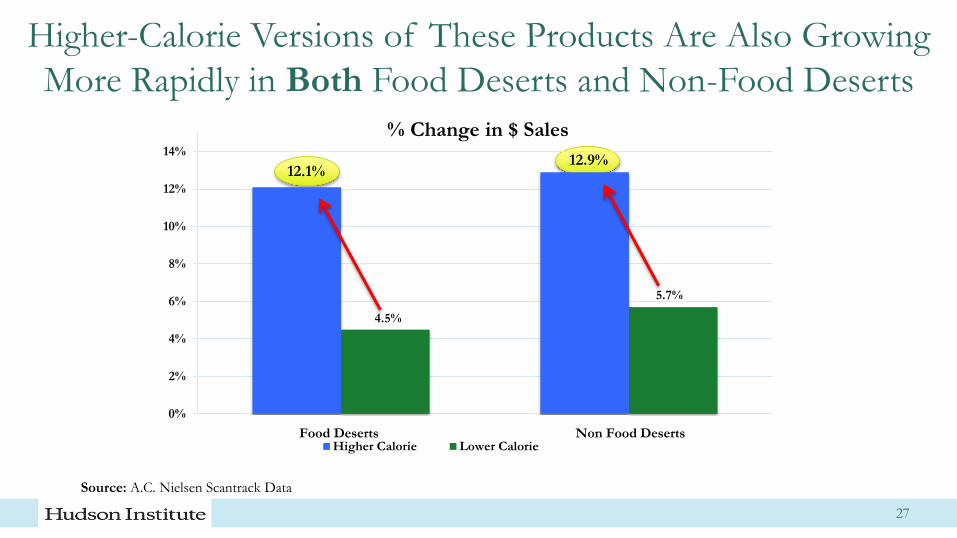
Higher-Calorie Versions of These Products Are Also Growing
More Rapidly in Both Food Deserts and Non-Food Deserts
12.1% 12.9%
4.5%
5.7%
0%
2%
4%
6%
8%
10%
12%
14%
Higher Calorie Lower CalorieNon Food Deserts Food Deserts
27
% Change in $ Sales
Source: A.C. Nielsen Scantrack Data
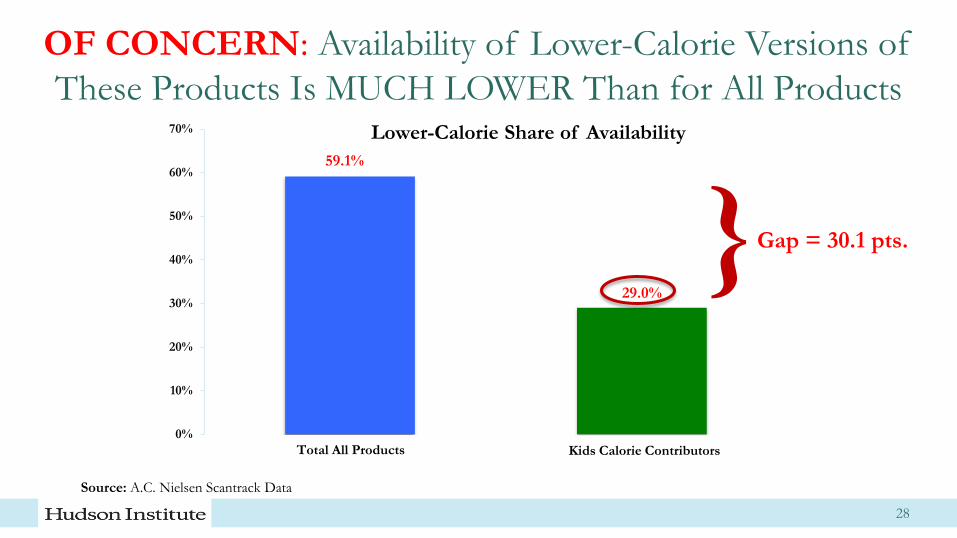
OF CONCERN: Availability of Lower-Calorie Versions of
These Products Is MUCH LOWER Than for All Products
59.1%
29.0%
0%
10%
20%
30%
40%
50%
60%
70%
Total All Products Kids Calorie Contributors
100%
28
Lower-Calorie Share of Availability
Source: A.C. Nielsen Scantrack Data
Gap = 30.1 pts. }
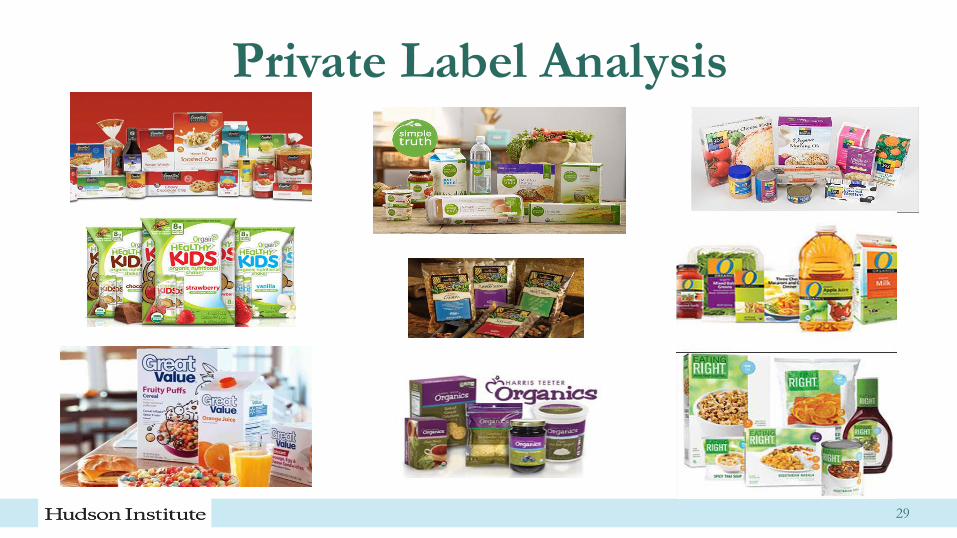
Private Label Analysis
29
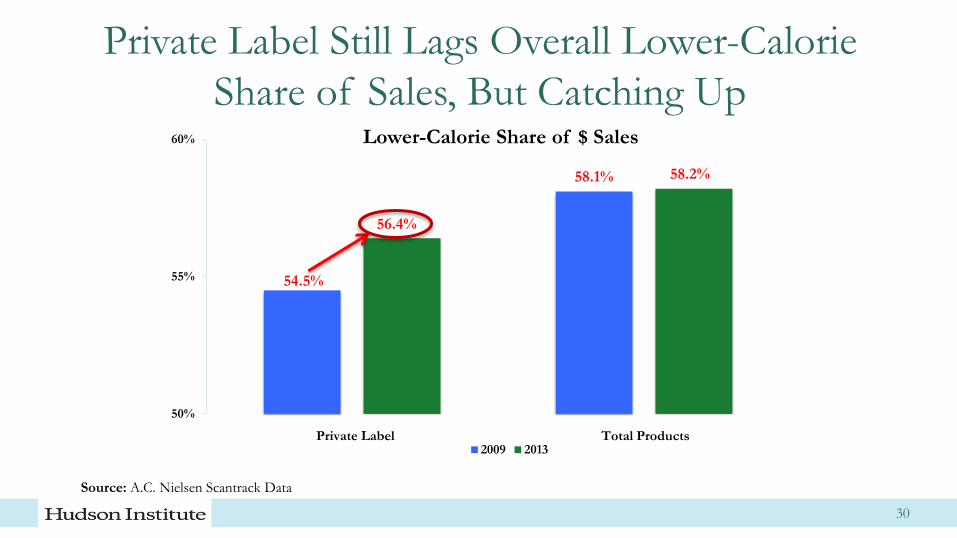
Private Label Still Lags Overall Lower-Calorie
Share of Sales, But Catching Up
54.5%
58.1%
56.4%
58.2%
50%
55%
60%
2009 2013Private Label
Lower-Calorie Share of $ Sales
30
Total Products
Source: A.C. Nielsen Scantrack Data
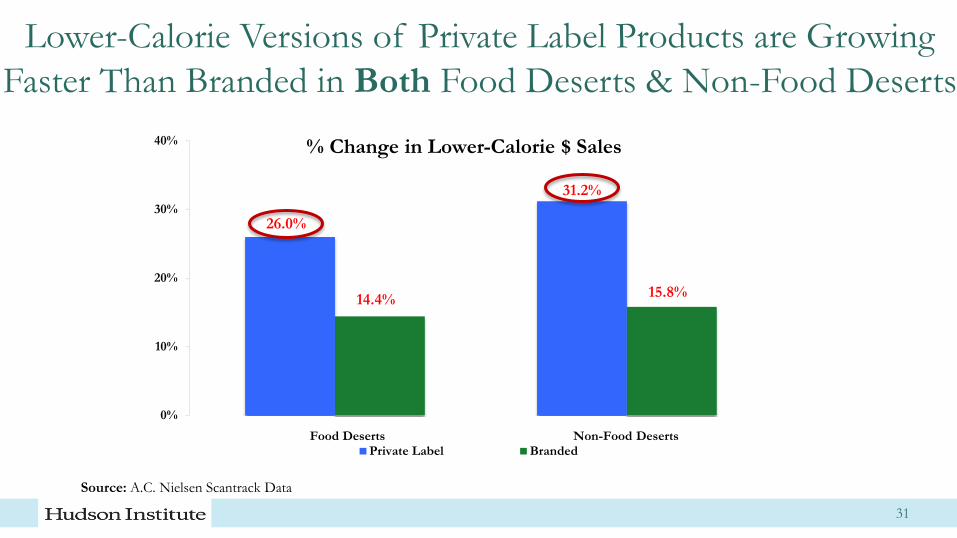
Lower-Calorie Versions of Private Label Products are Growing
Faster Than Branded in Both Food Deserts & Non-Food Deserts
26.0%
31.2%
14.4% 15.8%
0%
10%
20%
30%
40%
Private Label Branded
74.7%
Food Deserts
% Change in Lower-Calorie $ Sales
31
Source: A.C. Nielsen Scantrack Data
Non-Food Deserts
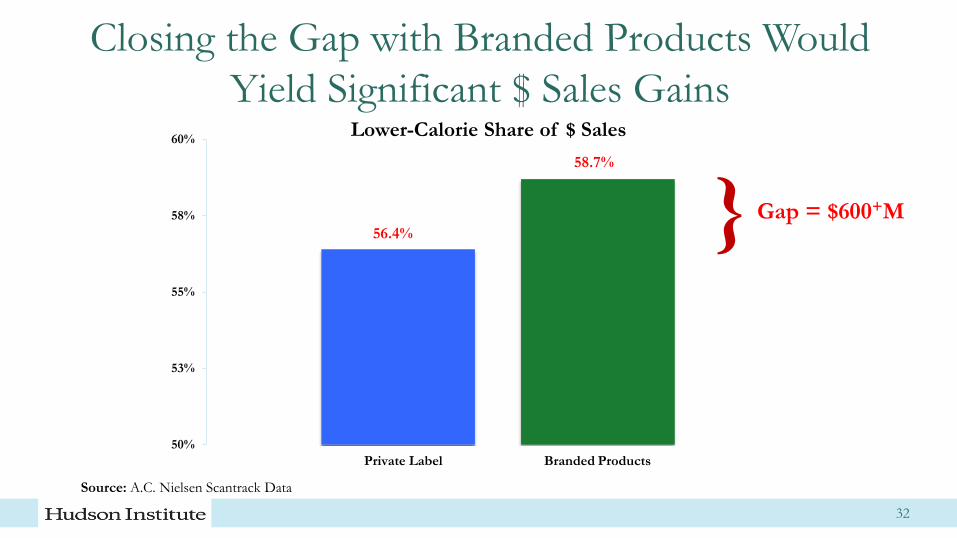
Closing the Gap with Branded Products Would
Yield Significant $ Sales Gains
56.4%
58.7%
50%
53%
55%
58%
60%
Private Label
Lower-Calorie Share of $ Sales
32
Branded Products
Source: A.C. Nielsen Scantrack Data
} Gap = $600+M

Implications
Overall
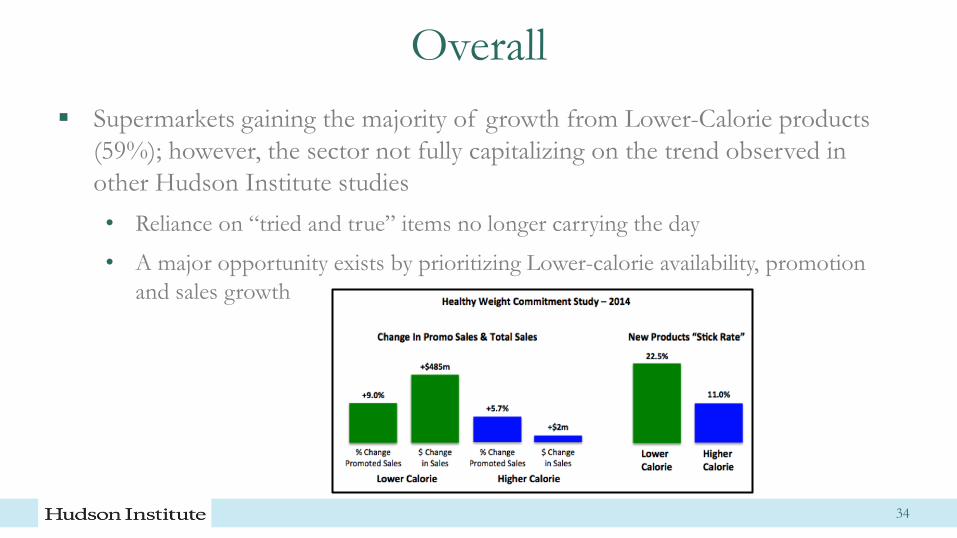
Supermarkets gaining the majority of growth from Lower-Calorie products
(59%); however, the sector not fully capitalizing on the trend observed in
other Hudson Institute studies
• Reliance on “tried and true” items no longer carrying the day
• A major opportunity exists by prioritizing Lower-calorie availability, promotion
and sales growth
34
Food Deserts
Lower-calorie growth is outpacing Higher-calorie growth in both Food
Deserts and Non-Food Deserts
• Signals that consumers, regardless of where they live or shop, are increasingly
seeking out Lower-calorie alternatives and must not be ignored
• As demand is there plus have availability…must rethink promotion and
merchandising strategies to narrow Lower-calorie sales gap with non-food deserts
35
Calorie Contributors to Kids & Adolescents
Continued over-emphasis on Higher-calorie versions will face even stronger
headwinds from:
Consumers
Public health community/regulators
• Situation aggravated in Food Deserts and by Lower-calorie availability deficiencies
Suggests there is an opportunity to re-think store makeup, merchandising/
promotion practices and distribution priorities to capture huge growth
potential in BFY products for youth.
36
Private Label
Private Label is making significant strides in Lower-Calorie
• Huge sales potential if retailers bridge Gap with branded products in
Lower-calorie versions
• Opportunity exists to drive innovation in Private Label by addressing the
“headwinds” found in those products that contribute the most calories to
kids
37
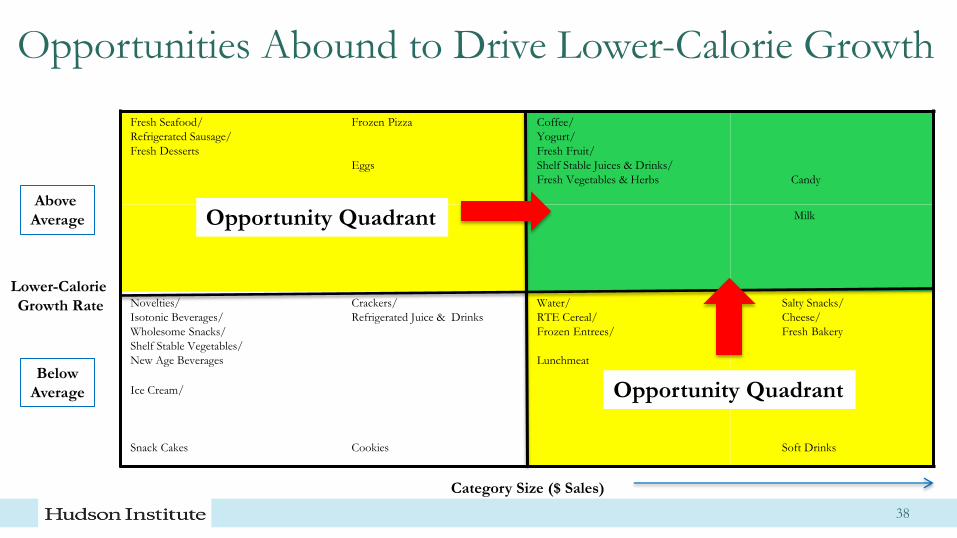
Opportunities Abound to Drive Lower-Calorie Growth
Fresh Seafood/
Refrigerated Sausage/
Fresh Desserts
Frozen Pizza
Eggs
Coffee/
Yogurt/
Fresh Fruit/
Shelf Stable Juices & Drinks/
Fresh Vegetables & Herbs
Candy
Milk
Novelties/
Isotonic Beverages/
Wholesome Snacks/
Shelf Stable Vegetables/
New Age Beverages
Crackers/
Refrigerated Juice & Drinks
Water/
RTE Cereal/
Frozen Entrees/
Lunchmeat
Salty Snacks/
Cheese/
Fresh Bakery
Ice Cream/
Snack Cakes
Cookies
Soft Drinks
Lower-Calorie
Growth Rate
Above
Average
Below
Average
Category Size ($ Sales)
Opportunity Quadrant
Opportunity Quadrant
38

39

Appendix
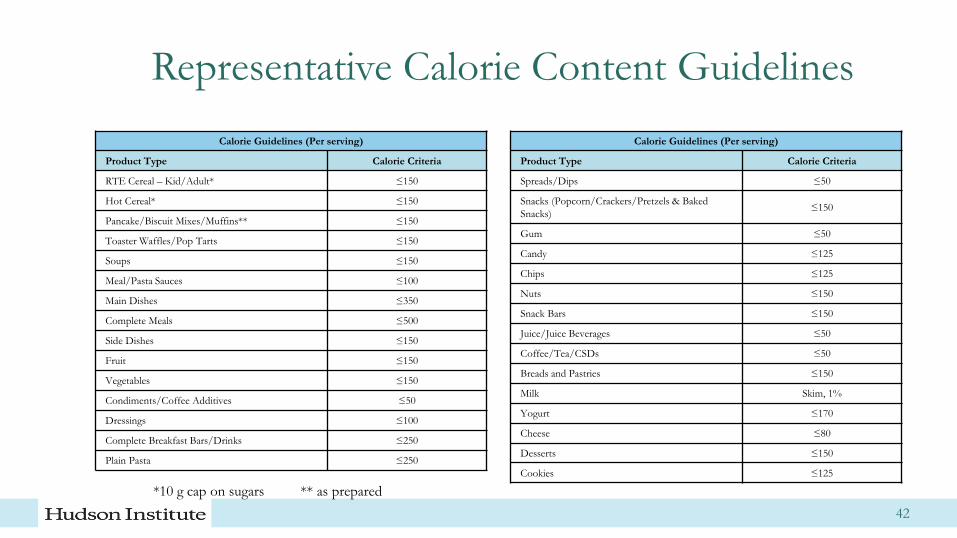
Representative Calorie Content Guidelines
Calorie Guidelines (Per serving)
Product Type Calorie Criteria
RTE Cereal – Kid/Adult* ≤150
Hot Cereal* ≤150
Pancake/Biscuit Mixes/Muffins** ≤150
Toaster Waffles/Pop Tarts ≤150
Soups ≤150
Meal/Pasta Sauces ≤100
Main Dishes ≤350
Complete Meals ≤500
Side Dishes ≤150
Fruit ≤150
Vegetables ≤150
Condiments/Coffee Additives ≤50
Dressings ≤100
Complete Breakfast Bars/Drinks ≤250
Plain Pasta ≤250
*10 g cap on sugars ** as prepared
Calorie Guidelines (Per serving)
Product Type Calorie Criteria
Spreads/Dips ≤50
Snacks (Popcorn/Crackers/Pretzels & Baked
Snacks) ≤150
Gum ≤50
Candy ≤125
Chips ≤125
Nuts ≤150
Snack Bars ≤150
Juice/Juice Beverages ≤50
Coffee/Tea/CSDs ≤50
Breads and Pastries ≤150
Milk Skim, 1%
Yogurt ≤170
Cheese ≤80
Desserts ≤150
Cookies ≤125
42
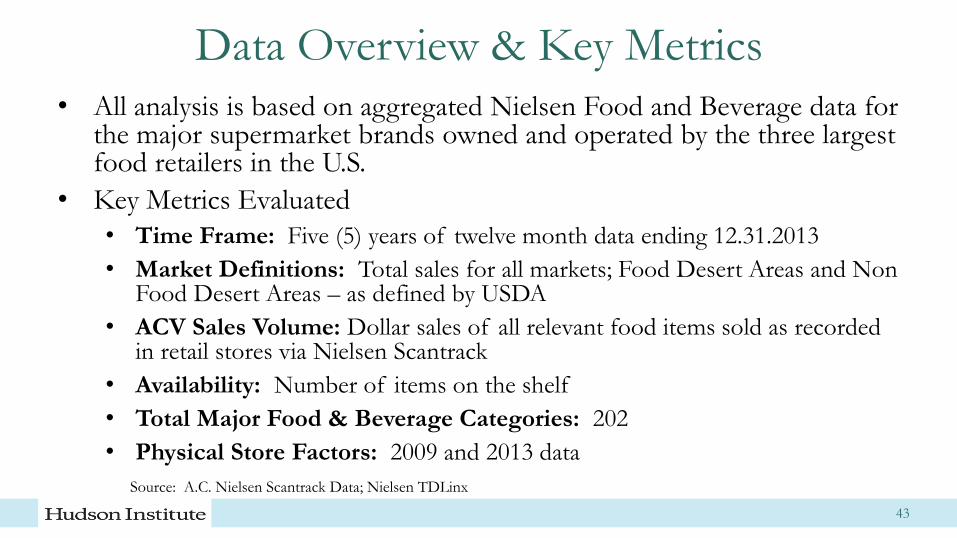
Data Overview & Key Metrics
• All analysis is based on aggregated Nielsen Food and Beverage data for the major supermarket brands owned and operated by the three largest food retailers in the U.S.
• Key Metrics Evaluated
• Time Frame: Five (5) years of twelve month data ending 12.31.2013
• Market Definitions: Total sales for all markets; Food Desert Areas and Non Food Desert Areas – as defined by USDA
• ACV Sales Volume: Dollar sales of all relevant food items sold as recorded in retail stores via Nielsen Scantrack
• Availability: Number of items on the shelf
• Total Major Food & Beverage Categories: 202
• Physical Store Factors: 2009 and 2013 data
43
Source: A.C. Nielsen Scantrack Data; Nielsen TDLinx
Data Overview
Some categories were excluded from the analysis due to the
inability to accurately determine serving sizes and corresponding
calories per serving, including:
• Fresh meat, poultry and fish sold in “Meat/Butcher” departments
• Prepared foods not portion controlled
• Frozen meat, poultry and fish sold in “bulk-style” packaging
• Pizza kits
In total, items accounting for approximately 7.5% of sales were
excluded from the study totals
44
Terminology & Definitions Products were split into two categories:
• Lower-Calorie
• Higher Calorie
Calorie data by SKU was supplied by AC Nielsen & Company – based on the nutritional labels – using calories per serving details for each SKU
• For those SKUs without available calories per serving data, calorie data was sourced from manufacturer websites, or from other publically available sources, such as caloriecount.com, fatsecret.com and calorielab.com.
• In addition, products which require additional ingredients for preparation (e.g., milk, eggs, oil) were classified based on the “as prepared/served” calorie content per serving
Items were selected as Lower-Calorie if they met the guidelines established by:
• University of Minnesota Nutrition Coordination Center standards established for Hudson Institute Lower-calorie foods: It’s Just Good Business study
45