Embed Size (px)
Citation preview
1Porter & trifts – the Best Mutual fund Managers
1
The Best Mutual Fund Managers: Testing the Impact of Experience Using a Survivorship-bias Free
DatasetGary E. Porter and Jack W. Trifts
This study uses a survivorship-bias free dataset spanning more than 80 years to identify the best mutual fund managers having tenure of ten years or more. We also examine the relationship between performance and tenure in a sample of 289 solo managers of 355 actively managed funds within the nine Morningstar styles. We find an inverse relationship between average annual returns and tenure, even after controlling for structural changes in mutual fund returns after 1996. The managers who survived more than ten years were likely to have performed at or above the market in their first three years, while their peers who did not survive as solo managers beyond three years significantly underperformed the market. Finally, while each of the very best managers generated positive compound annual market-adjusted returns following their first three years, the majority were not able to maintain their early levels of performance. This evidence is not indicative of a positive relationship between experience and performance.
Gary E. Porter is an Associate Professor of Finance at the Boler School of Business at John Carroll University in University Heights, OH. Jack W. Trifts is a Professor of Finance at Bryant University in Smithfield, RI.
The authors gratefully acknowledge the helpful comments of Ramesh Rao (Editor) and an anonymous reviewer which significantly improved this paper. We are also grateful for the substantial technical assistance by Annette Larson of Morningstar and thank Morningstar for providing low-cost access to its extensive database on mutual funds. An earlier version of this paper was presented at the Southwestern Finance Association meeting. We would also like to thank to LeRoy Brooks for his insightful comments. This research was funded, in part, by a Wasmer research grant from the Boler School of Business at John Carroll University and by a grant for the purchase of data from the College of Business at Bryant University.
nThe investing public is inundated with mutual fund advertisements stressing the long-term performance of
their fund and in many cases, the value of their managers and the importance of experience. While extensive public information is available about the performance of current actively managed mutual funds, little has been written about the historical performance of all managers, including those who are no longer actively managing funds. One might argue that once a fund manager becomes inactive, the investing community is no longer interested in their performance. However, current managers and the investing public need a historical benchmark with which to evaluate long-term performance. For example, a manager may be in the top quartile of all active managers for the last 10 years, but a complete comparison lies in measuring historical performance relative to all managers with 10-year track records. The purpose of this study is to provide a historical scorecard of the performance of solo mutual fund managers through 2008, and to examine the relationship between experience and performance among them.1
Numerous studies have examined the performance of mutual funds and addressed the question of whether mutual funds can out-perform the market on a risk-adjusted basis. While there is overwhelming evidence that actively-managed mutual funds, in general, do not outperform the market after accounting for risk and expenses, there is some evidence of short-term persistence and that a select few funds, in the
1 The motivation for this research was provided by Jon Birger (2008), a reporter at Fortune Magazine, who was working on an article on Ken Heebner (Birger, 2008), a mutual fund manager with an impressive 30-year track record. The reporter was interested in performance data for other fund managers, active and inactive, with which to compare Heebner. We define a solo manager as one who is the sole manager listed by Morningstar at a fund. Performance is measured during only the months the manager is listed as the sole manager, which may or may not be a contiguous period.

2 Journal of aPPlied finance – no. 1, 2012
tail of the distribution of all mutual fund returns, produce positive alphas over time. For example, Carhart (1997) finds that almost all mutual fund performance is explained by common factors in stock market returns and by fund expense, although he does document a short-term momentum effect. Kosowski, Timmerman, Wermers, and White (2006) use a bootstrap approach and find performance persistence for a significant minority of funds. Barras, Scaillet, and Wermers (2010) develop a model to distinguish between those funds that randomly exhibit statistically significant alphas, even though they are not superior performers, from funds that truly outperform the market on a risk-adjusted basis. They find a small subset of funds with true positive alphas. Costa and Jakob (2010) provide evidence that some funds randomly give the appearance of being able to outperform the market and document that even some unmanaged funds generate positive alphas. Nicolosi (2009) examines the trades made by mutual funds and finds that some managers demonstrate the ability to buy stocks that outperform the stocks they sell. However, this result is dependent on the assumption that trades are made at the beginning of each quarter and the result disappears with the relaxation of this assumption.
While each of these studies address the question of whether managers have superior stock picking ability, the authors examine fund returns without considering the role of the fund managers specifically. To measure the skill of a manager, one must examine the performance of funds under their sole control. To this end, we use survivorship-bias free historical data from Morningstar to examine the performance of actively-managed funds having solo managers with track records of at least 10 years. We identify the best solo mutual fund managers and attempt to determine if, as Barras et al. (2010) suggest, they have superior skills that place them in the tail of the distribution, or if their superior performance is random.
I. DataOur dataset was provided by Morningstar and includes the
population of mutual fund managers and funds for which a full set of returns were available from inception through December 2008. The survivorship-bias free dataset, which includes all share classes and all fund objectives, contains 41,248 funds and 15,225 managers. When we screen out all but the oldest, or unique, share class for each fund, remove bond funds, index funds, specialty funds, and target date funds, the sample contains 7,381 funds and 10,605
managers. We use only the oldest fund because Morningstar lists returns for each class of fund individually and most funds are offered in a variety of configurations of sales loads, fees, etc. Of the 7,381 unique funds that passed our screen, 735 lacked complete return data. Consequently, we were unable to include thirty-eight solo managers with tenure of at least ten years. Since our data is survivorship-bias free and one manager can manage several unique funds and funds
can have several managers concurrently or over time, our sample of 6,645 unique funds, which includes multiple managers and managers of all tenures, contains 31,377 manager/fund combinations.
There is a strong tendency for actively-managed mutual funds to be managed by teams of managers. We focus on the subset of solo-managed
funds because we want to capture the skills of a single manager. It is impossible to isolate the contribution of a manager who shares responsibility for a fund with one or more co-managers. Additionally, team managed funds have the additional challenge of intra-team turnover. Since the composition of teams changes over time, it is difficult to focus on the abilities of any particular individual or group of individuals within teams. As an extreme example, during one period, Morningstar listed 66 managers for Old Mutual Asset Allocation Growth A.
Our sample is further restricted to the nine styles defined by Morningstar. This enables us to effectively control for relevant risk. Our final sample of solo managers with at least 10 years tenure consists of 289 managers of 355 actively managed funds. Of these, the mean tenure is 14.5 years (median: 12.8). The manager with the longest tenure, Phil Carret, was listed as the sole manager of Pioneer A from April of 1928 until January 1980, nearly 52 years.
While the Morningstar dataset is free of survivorship bias because it includes merged and closed funds, as well as active and inactive managers, we note the possibility of what Elton, Gruber, and Blake (2001) call “omission bias” since there may be a tendency for poorer performing funds to be those without return data. While it is impossible to test whether the performance of funds without return data differs from those funds with data, we concede the potential for this source of bias.
II. Performance MeasuresOur primary measure of performance is market-adjusted
compound annual return (MACAR), which is the geometric
Peter Lynch has the best solo-managed fund with a market-adjusted compound annual return of 12.75% during his tenure of more than 13 years at Fidelity Magellan. Despite his relatively short tenure, his career market-adjusted cumulative return of 380.46% is also greater than any other manager.

3Porter & trifts – the Best Mutual fund Managers
average annual nominal return less the return on the market.2 We use the value-weighted Center for Research in Security Prices (CRSP) index, which is comprised of all stocks on the NYSE, NASDAQ and AMEX exchanges, as a proxy for the market portfolio. Market-adjusted returns reflect the manager’s ability to outperform a passive, broadly diversified portfolio.3
For comparison purposes, and to test the robustness of our results, we also calculate three additional performance metrics: Jensen (1968) alphas, Carhart alphas, and nominal compound annual return (NCAR), which is the geometric average annual nominal return, for each solo-managed fund. NCAR ignores the impact of market risk, but is the measure most often cited in industry publications and is most often (mis)-used by investors to evaluate performance. Carhart alphas are widely accepted within the academic community because they control for common factors in stock returns identified by Fama and French (1993), plus a momentum factor. To investors, the factors are the equivalent of the nine styles pioneered by Morningstar.4 The Carhart alpha reflects the impact on fund return due to systematic changes in each style. For example, because a fund that is invested largely in small capitalization value stocks can outperform the market index when the Small-Cap Value style outperforms the broad market, the manager should not be credited with superior performance if he outperforms by the same degree. The Carhart model controls for earned premiums based on market capitalization and value, so the manager earns a positive alpha only if he outperforms the small capitalization value index.5 Despite this improved performance measure, most mutual fund data bases continue to report the Jensen alpha, which produces a positive alpha if the manager outperforms a single index.
III. Performance of Solo Managers
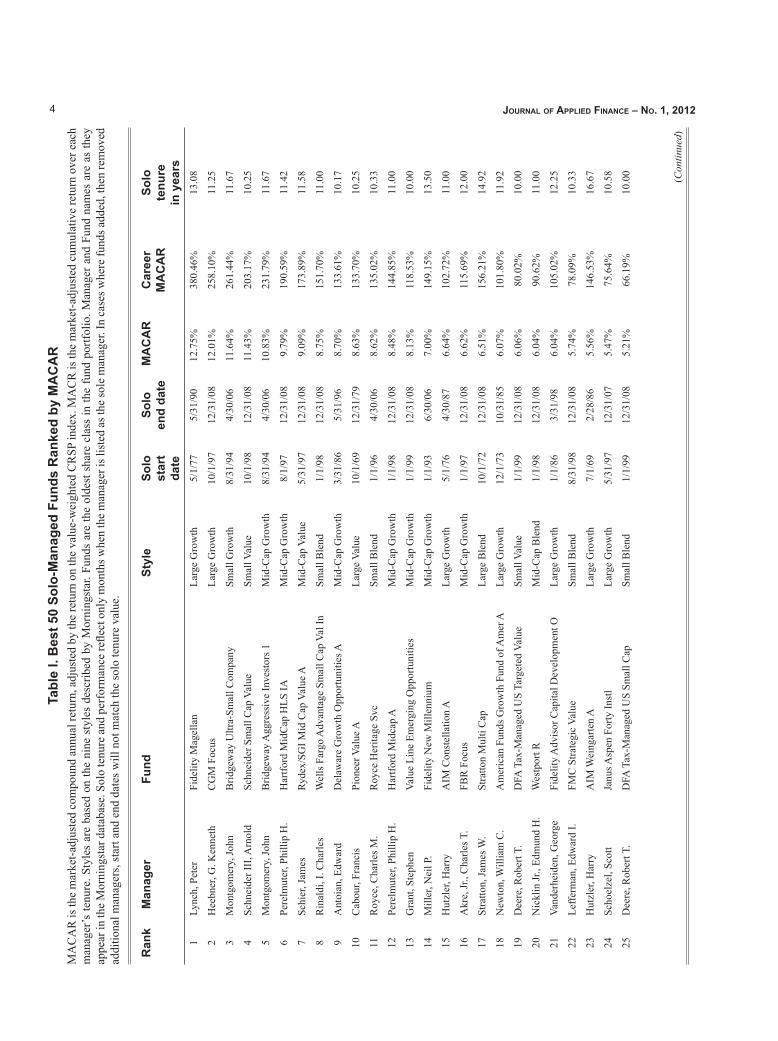
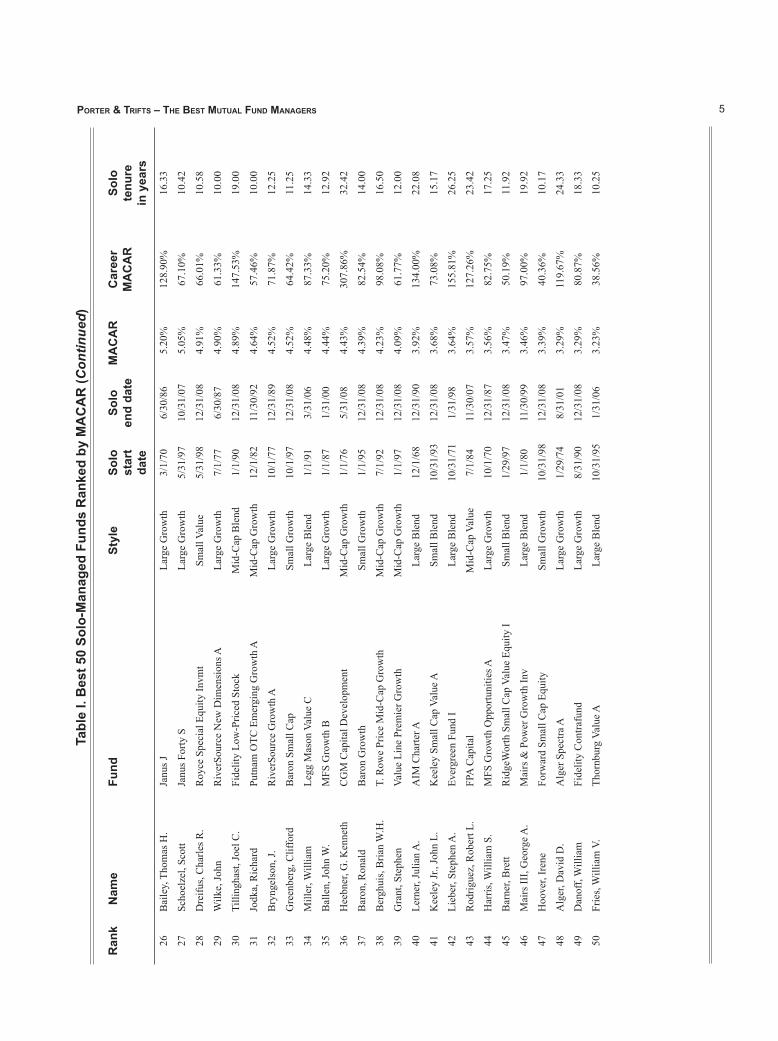
Table I shows the Best 50 solo-managed mutual funds run by 42 managers through 2008, ranked by fund MACAR.
2 Monthly market-adjusted returns are used to calculate compounded annualized returns.
3 Most mutual funds and fund publications provide market benchmarks with which to compare a fund’s performance.
4 The nine styles are: Large-Cap Value, Large-Cap Growth, Large-Cap Blend, Mid-Cap Value, Mid-Cap Growth, Mid-Cap Blend, Small-Cap Value, Small-Cap Growth, and Small-Cap Blend.
5 The Carhart (1997) model employs the variables small minus big (SMB) and high minus low (HML) from Fama and French (1993). SMB adjusts the fund’s returns by the premium between high market cap stocks and low market cap stocks. HML adjusts the fund’s returns by the premium between stocks with high book-market ratios and stocks with low book-to-market ratios.
Details include fund name and category, the career market-adjusted cumulative return (MACR), and information on the dates and length of tenure for each manager. Peter Lynch has the best solo-managed fund with a market-adjusted compound annual return of 12.75% during his tenure of more than 13 years at Fidelity Magellan. Despite his relatively short tenure, his career market-adjusted cumulative return of 380.46% is also greater than any other manager. Ken Heebner’s CGM Focus Large Growth fund has the second best MACAR of 12.01%. However, the career MACR for CGM Focus of 258.10% (tenure of 32 years) is shy of Lynch’s and less than the career MACR of 307.86% for his CGM Capital Development Fund (tenure of 11.25 years), which placed 36th by MACAR.
Since many mutual fund managers, like Heebner, are responsible for more than one fund, we do not restrict the number of funds they may have in the Best 50. As a result, seven managers appear twice on the list. Grant, Hutzler, Perelmuter, and Schoelzel each managed two funds with the same Morningstar style. The similar performance between their pairs of funds is not surprising because managers with multiple funds in the same style would hold similar portfolios, producing similar fund returns. However, three managers: Heebner, Montgomery, and Deere, each made the Best 50 with two funds having different styles.
While the excess returns of the best managers are impressive, the magnitude of the returns diminishes quickly as one moves down the list. For example, William Fries of Thornburg Value A, a large blend fund, finished in 50th place. Given the relatively small number of managers surviving more than ten years, doing so and placing in the Best 50, is worthy of note. Investors in this fund would have earned an average annual market-adjusted return of 3.23% over the 11 years of his tenure, an impressive return compared to the average mutual fund but dramatically less than Lynch’s 12.75%. In comparison, the manager of the 100th best fund (not shown in the table) earned an average annual excess return of 1.63%. Of the 355 funds managed by solo managers with at least 10 years tenure, 169 produced positive MACARs.
Table II shows the Best 50 along with their ranking by alternate performance metrics. Clearly, the determination of the best managers depends on the metric chosen. Edward Antoian ranks first by Carhart alpha but Ken Heebner and Peter Lynch each rank first by other metrics.6 Only four managers: Peter Lynch, John Montgomery (two funds), Edward Antoian, and Charles Royce rank in the top 25 by all four metrics. Lynch was the only manager to place in the top 10 in all four (first by MACAR, first by MACR, third by
6 Interestingly, Heebner’s CGM Mutual Fund placed first by Jensen alpha but 51st by MACAR, while his CGM Focus fund, which placed second by MACAR, placed 50th by Jensen alpha.
4 Journal of aPPlied finance – no. 1, 2012
Tabl
e I.
Bes
t 50
Solo
-Man
aged
Fun
ds R
anke
d by
MA
CA
RM
AC
AR
is th
e m
arke
t-adj
uste
d co
mpo
und
annu
al re
turn
, adj
uste
d by
the
retu
rn o
n th
e va
lue-
wei
ghte
d C
RSP
inde
x. M
AC
R is
the
mar
ket-a
djus
ted
cum
ulat
ive
retu
rn o
ver e
ach
man
ager
’s te
nure
. Sty
les
are
base
d on
the
nine
sty
les
desc
ribed
by
Mor
ning
star
. Fun
ds a
re th
e ol
dest
sha
re c
lass
in th
e fu
nd p
ortfo
lio. M
anag
er a
nd F
und
nam
es a
re a
s th
ey
appe
ar in
the
Mor
ning
star
dat
abas
e. S
olo
tenu
re a
nd p
erfo
rman
ce re
flect
onl
y m
onth
s whe
n th
e m
anag
er is
list
ed a
s the
sole
man
ager
. In
case
s whe
re fu
nds a
dded
, the
n re
mov
ed
addi
tiona
l man
ager
s, st
art a
nd e
nd d
ates
will
not
mat
ch th
e so
lo te
nure
val
ue.
Ran
k M
anag
er F
und
St
yle
Solo
star
t da
te
Solo
end
date
MA
CA
RC
aree
r M
AC
AR
Solo
tenu
rein
yea
rs1
Lync
h, P
eter
Fide
lity
Mag
ella
nLa
rge
Gro
wth
5/1/
775/
31/9
012
.75%
380.
46%
13.0
8
2H
eebn
er, G
. Ken
neth
CG
M F
ocus
Larg
e G
row
th10
/1/9
712
/31/
0812
.01%
258.
10%
11.2
5
3M
ontg
omer
y, Jo
hnB
ridge
way
Ultr
a-Sm
all C
ompa
nySm
all G
row
th8/
31/9
44/
30/0
611
.64%
261.
44%
11.6
7
4Sc
hnei
der I
II, A
rnol
dSc
hnei
der S
mal
l Cap
Val
ueSm
all V
alue
10/1
/98
12/3
1/08
11.4
3%20
3.17
%10
.25
5M
ontg
omer
y, Jo
hnB
ridge
way
Agg
ress
ive
Inve
stor
s 1M
id-C
ap G
row
th8/
31/9
44/
30/0
610
.83%
231.
79%
11.6
7
6Pe
relm
uter
, Phi
llip
H.
Har
tford
Mid
Cap
HLS
IAM
id-C
ap G
row
th8/
1/97
12/3
1/08
9.79
%19
0.59
%11
.42
7Sc
hier
, Jam
esRy
dex/
SGI M
id C
ap V
alue
AM
id-C
ap V
alue
5/31
/97
12/3
1/08
9.09
%17
3.89
%11
.58
8R
inal
di, I
. Cha
rles
Wel
ls F
argo
Adv
anta
ge S
mal
l Cap
Val
InSm
all B
lend
1/1/
9812
/31/
088.
75%
151.
70%
11.0
0
9A
ntoi
an, E
dwar
dD
elaw
are
Gro
wth
Opp
ortu
nitie
s AM
id-C
ap G
row
th3/
31/8
65/
31/9
68.
70%
133.
61%
10.1
7
10C
abou
r, Fr
anci
sPi
onee
r Val
ue A
Larg
e Va
lue
10/1
/69
12/3
1/79
8.63
%13
3.70
%10
.25
11R
oyce
, Cha
rles M
.R
oyce
Her
itage
Svc
Smal
l Ble
nd1/
1/96
4/30
/06
8.62
%13
5.02
%10
.33
12Pe
relm
uter
, Phi
llip
H.
Har
tford
Mid
cap
AM
id-C
ap G
row
th1/
1/98
12/3
1/08
8.48
%14
4.85
%11
.00
13G
rant
, Ste
phen
Valu
e Li
ne E
mer
ging
Opp
ortu
nitie
sM
id-C
ap G
row
th1/
1/99
12/3
1/08
8.13
%11
8.53
%10
.00
14M
iller
, Nei
l P.
Fide
lity
New
Mill
enni
umM
id-C
ap G
row
th1/
1/93
6/30
/06
7.00
%14
9.15
%13
.50
15H
utzl
er, H
arry
AIM
Con
stel
latio
n A
Larg
e G
row
th5/
1/76
4/30
/87
6.64
%10
2.72
%11
.00
16A
kre,
Jr.,
Cha
rles T
.FB
R F
ocus
Mid
-Cap
Gro
wth
1/1/
9712
/31/
086.
62%
115.
69%
12.0
0
17St
ratto
n, Ja
mes
W.
Stra
tton
Mul
ti C
apLa
rge
Ble
nd10
/1/7
212
/31/
086.
51%
156.
21%
14.9
2
18N
ewto
n, W
illia
m C
.A
mer
ican
Fun
ds G
row
th F
und
of A
mer
ALa
rge
Gro
wth
12/1
/73
10/3
1/85
6.07
%10
1.80
%11
.92
19D
eere
, Rob
ert T
.D
FA T
ax-M
anag
ed U
S Ta
rget
ed V
alue
Smal
l Val
ue1/
1/99
12/3
1/08
6.06
%80
.02%
10.0
0
20N
ickl
in Jr
., Ed
mun
d H
.W
estp
ort R
Mid
-Cap
Ble
nd1/
1/98
12/3
1/08
6.04
%90
.62%
11.0
0
21Va
nder
heid
en, G
eorg
eFi
delit
y A
dvis
or C
apita
l Dev
elop
men
t OLa
rge
Gro
wth
1/1/
863/
31/9
86.
04%
105.
02%
12.2
5
22Le
fferm
an, E
dwar
d I.
FMC
Stra
tegi
c Va
lue
Smal
l Ble
nd8/
31/9
812
/31/
085.
74%
78.0
9%10
.33
23H
utzl
er, H
arry
AIM
Wei
ngar
ten
ALa
rge
Gro
wth
7/1/
692/
28/8
65.
56%
146.
53%
16.6
7
24Sc
hoel
zel,
Scot
tJa
nus A
spen
For
ty In
stl
Larg
e G
row
th5/
31/9
712
/31/
075.
47%
75.6
4%10
.58
25D
eere
, Rob
ert T
.D
FA T
ax-M
anag
ed U
S Sm
all C
apSm
all B
lend
1/1/
9912
/31/
085.
21%
66.1
9%10
.00 (Con
tinue
d)
5Porter & trifts – the Best Mutual fund Managers
Tabl
e I.
Bes
t 50
Solo
-Man
aged
Fun
ds R
anke
d by
MA
CA
R (C
ontin
ued)
Ran
k N
ame
Fund
Styl
eSo
lost
art
date
Solo
end
date
MA
CA
RC
aree
r M
AC
AR
Solo
tenu
rein
yea
rs
26B
aile
y, T
hom
as H
.Ja
nus J
Larg
e G
row
th3/
1/70
6/30
/86
5.20
%12
8.90
%16
.33
27Sc
hoel
zel,
Scot
tJa
nus F
orty
SLa
rge
Gro
wth
5/31
/97
10/3
1/07
5.05
%67
.10%
10.4
2
28D
reifu
s, C
harle
s R.
Roy
ce S
peci
al E
quity
Invm
tSm
all V
alue
5/31
/98
12/3
1/08
4.91
%66
.01%
10.5
8
29W
ilke,
John
Riv
erSo
urce
New
Dim
ensi
ons A
Larg
e G
row
th7/
1/77
6/30
/87
4.90
%61
.33%
10.0
0
30Ti
lling
hast
, Joe
l C.
Fide
lity
Low
-Pric
ed S
tock
Mid
-Cap
Ble
nd1/
1/90
12/3
1/08
4.89
%14
7.53
%19
.00
31Jo
dka,
Ric
hard
Putn
am O
TC E
mer
ging
Gro
wth
AM
id-C
ap G
row
th12
/1/8
211
/30/
924.
64%
57.4
6%10
.00
32B
ryng
elso
n, J.
Riv
erSo
urce
Gro
wth
ALa
rge
Gro
wth
10/1
/77
12/3
1/89
4.52
%71
.87%
12.2
5
33G
reen
berg
, Clif
ford
Bar
on S
mal
l Cap
Smal
l Gro
wth
10/1
/97
12/3
1/08
4.52
%64
.42%
11.2
5
34M
iller
, Will
iam
Legg
Mas
on V
alue
CLa
rge
Ble
nd1/
1/91
3/31
/06
4.48
%87
.33%
14.3
3
35B
alle
n, Jo
hn W
.M
FS G
row
th B
Larg
e G
row
th1/
1/87
1/31
/00
4.44
%75
.20%
12.9
2
36H
eebn
er, G
. Ken
neth
CG
M C
apita
l Dev
elop
men
tM
id-C
ap G
row
th1/
1/76
5/31
/08
4.43
%30
7.86
%32
.42
37B
aron
, Ron
ald
Bar
on G
row
thSm
all G
row
th1/
1/95
12/3
1/08
4.39
%82
.54%
14.0
0
38B
ergh
uis,
Bria
n W
.H.
T. R
owe
Pric
e M
id-C
ap G
row
thM
id-C
ap G
row
th7/
1/92
12/3
1/08
4.23
%98
.08%
16.5
0
39G
rant
, Ste
phen
Valu
e Li
ne P
rem
ier G
row
thM
id-C
ap G
row
th1/
1/97
12/3
1/08
4.09
%61
.77%
12.0
0
40Le
rner
, Jul
ian
A.
AIM
Cha
rter A
Larg
e B
lend
12/1
/68
12/3
1/90
3.92
%13
4.00
%22
.08
41K
eele
y Jr
., Jo
hn L
.K
eele
y Sm
all C
ap V
alue
ASm
all B
lend
10/3
1/93
12/3
1/08
3.68
%73
.08%
15.1
7
42Li
eber
, Ste
phen
A.
Ever
gree
n Fu
nd I
Larg
e B
lend
10/3
1/71
1/31
/98
3.64
%15
5.81
%26
.25
43R
odrig
uez,
Rob
ert L
.FP
A C
apita
lM
id-C
ap V
alue
7/1/
8411
/30/
073.
57%
127.
26%
23.4
2
44H
arris
, Will
iam
S.
MFS
Gro
wth
Opp
ortu
nitie
s ALa
rge
Gro
wth
10/1
/70
12/3
1/87
3.56
%82
.75%
17.2
5
45B
arne
r, B
rett
Rid
geW
orth
Sm
all C
ap V
alue
Equ
ity I
Smal
l Ble
nd1/
29/9
712
/31/
083.
47%
50.1
9%11
.92
46M
airs
III,
Geo
rge A
.M
airs
& P
ower
Gro
wth
Inv
Larg
e B
lend
1/1/
8011
/30/
993.
46%
97.0
0%19
.92
47H
oove
r, Ir
ene
Forw
ard
Smal
l Cap
Equ
itySm
all G
row
th10
/31/
9812
/31/
083.
39%
40.3
6%10
.17
48A
lger
, Dav
id D
.A
lger
Spe
ctra
ALa
rge
Gro
wth
1/29
/74
8/31
/01
3.29
%11
9.67
%24
.33
49D
anof
f, W
illia
mFi
delit
y C
ontra
fund
Larg
e G
row
th8/
31/9
012
/31/
083.
29%
80.8
7%18
.33
50Fr
ies,
Will
iam
V.
Thor
nbur
g Va
lue A
Larg
e B
lend
10/3
1/95
1/31
/06
3.23
%38
.56%
10.2
5

6 Journal of aPPlied finance – no. 1, 2012
Table II. Alternate Performance Metrics for the Best 50 Solo-Managed Funds Ranked by MACARMACAR is the market-adjusted compound annual return, adjusted by the return on the value-weighted CRSP index. NCAR is the Nominal Compound Annual Return.
Rank Manager Fund Style Rank by Jensen Alpha
Rank by Carhart Alpha
Rank by NCAR
1 Lynch, Peter Fidelity Magellan Large Growth 4 3 1
2 Heebner, G. Kenneth CGM Focus Large Growth 50 184 75
3 Montgomery, John Bridgeway Ultra-Small Company Small Growth 3 12 2
4 Schneider III, Arnold Schneider Small Cap Value Small Value 2 24 122
5 Montgomery, John Bridgeway Aggressive Investors 1 Mid-Cap Growth 8 21 6
6 Perelmuter, Phillip H. Hartford MidCap HLS IA Mid-Cap Growth 10 9 160
7 Schier, James Rydex/SGI Mid Cap Value A Mid-Cap Value 5 11 126
8 Rinaldi, I. Charles Wells Fargo Advantage Small Cap Val In Small Blend 9 60 183
9 Antoian, Edward Delaware Growth Opportunities A Mid-Cap Growth 17 1 4
10 Cabour, Francis Pioneer Value A Large Value 11 13 58
11 Royce, Charles M. Royce Heritage Svc Small Blend 12 17 12
12 Perelmuter, Phillip H. Hartford Midcap A Mid-Cap Growth 6 6 204
13 Grant, Stephen Value Line Emerging Opportunities Mid-Cap Growth 7 54 247
14 Miller, Neil P. Fidelity New Millennium Mid-Cap Growth 45 14 29
15 Hutzler, Harry AIM Constellation A Large Growth 107 69 7
16 Akre, Jr., Charles T. FBR Focus Mid-Cap Growth 13 5 171
17 Stratton, James W. Stratton Multi Cap Large Blend 19 113 330
18 Newton, William C. American Funds Growth Fund of Amer A Large Growth 75 147 18
19 Deere, Robert T. DFA Tax-Managed US Targeted Value Small Value 15 245 286
20 Nicklin Jr., Edmund H. Westport R Mid-Cap Blend 171 131 241
21 Vanderheiden, George Fidelity Advisor Capital Development O Large Growth 108 103 3
22 Lefferman, Edward I. FMC Strategic Value Small Blend 18 133 226
23 Hutzler, Harry AIM Weingarten A Large Growth 46 67 59
24 Schoelzel, Scott Janus Aspen Forty Instl Large Growth 53 7 101
25 Deere, Robert T. DFA Tax-Managed US Small Cap Small Blend 100 230 304
26 Bailey, Thomas H. Janus J Large Growth 22 93 21
27 Schoelzel, Scott Janus Forty S Large Growth 20 8 85
28 Dreifus, Charles R. Royce Special Equity Invmt Small Value 63 23 5
29 Wilke, John RiverSource New Dimensions A Large Growth 24 47 112
30 Tillinghast, Joel C. Fidelity Low-Priced Stock Mid-Cap Blend 112 10 15
31 Jodka, Richard Putnam OTC Emerging Growth A Mid-Cap Growth 106 4 9
32 Bryngelson, J. RiverSource Growth A Large Growth 218 40 13
33 Greenberg, Clifford Baron Small Cap Small Growth 66 33 8
34 Miller, William Legg Mason Value C Large Blend 25 81 152
35 Ballen, John W. MFS Growth B Large Growth 61 19 30
36 Heebner, G. Kenneth CGM Capital Development Mid-Cap Growth 58 87 17
37 Baron, Ronald Baron Growth Small Growth 149 18 43
38 Berghuis, Brian W.H. T. Rowe Price Mid-Cap Growth Mid-Cap Growth 23 2 211
39 Grant, Stephen Value Line Premier Growth Mid-Cap Growth 52 55 16
(Continued)
7Porter & trifts – the Best Mutual fund Managers
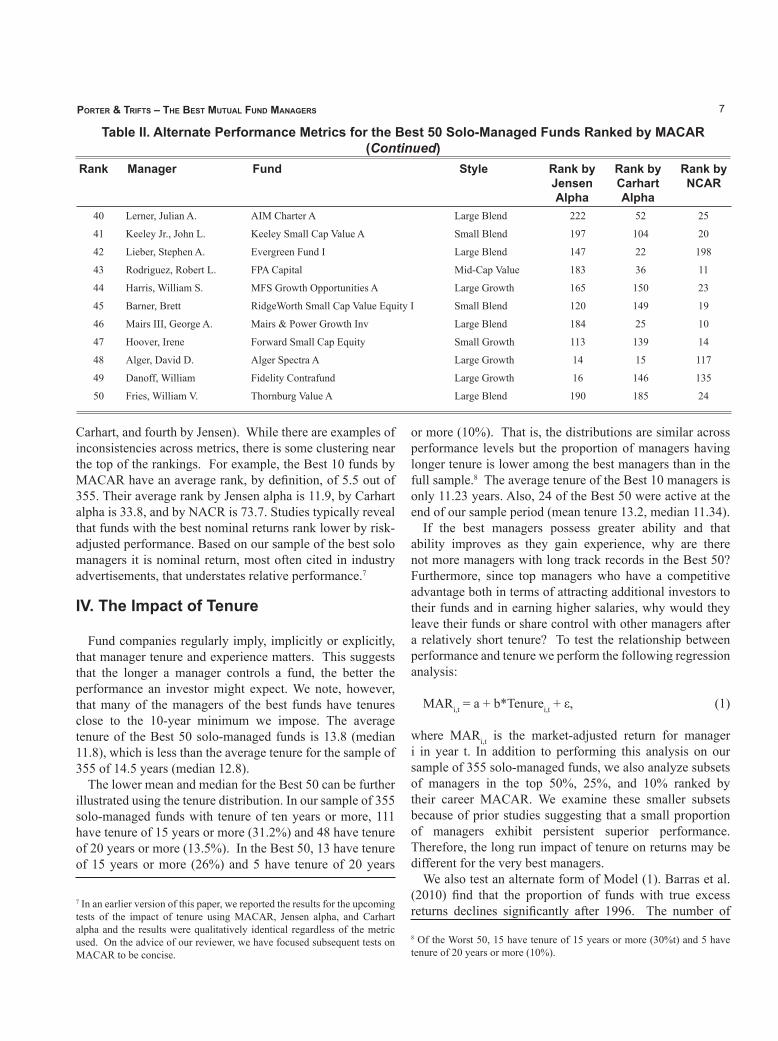
Table II. Alternate Performance Metrics for the Best 50 Solo-Managed Funds Ranked by MACAR(Continued)
40 Lerner, Julian A. AIM Charter A Large Blend 222 52 25
41 Keeley Jr., John L. Keeley Small Cap Value A Small Blend 197 104 20
42 Lieber, Stephen A. Evergreen Fund I Large Blend 147 22 198
43 Rodriguez, Robert L. FPA Capital Mid-Cap Value 183 36 11
44 Harris, William S. MFS Growth Opportunities A Large Growth 165 150 23
45 Barner, Brett RidgeWorth Small Cap Value Equity I Small Blend 120 149 19
46 Mairs III, George A. Mairs & Power Growth Inv Large Blend 184 25 10
47 Hoover, Irene Forward Small Cap Equity Small Growth 113 139 14
48 Alger, David D. Alger Spectra A Large Growth 14 15 117
49 Danoff, William Fidelity Contrafund Large Growth 16 146 135
50 Fries, William V. Thornburg Value A Large Blend 190 185 24
Rank Manager Fund Style Rank by Jensen Alpha
Rank by Carhart Alpha
Rank by NCAR
Carhart, and fourth by Jensen). While there are examples of inconsistencies across metrics, there is some clustering near the top of the rankings. For example, the Best 10 funds by MACAR have an average rank, by definition, of 5.5 out of 355. Their average rank by Jensen alpha is 11.9, by Carhart alpha is 33.8, and by NACR is 73.7. Studies typically reveal that funds with the best nominal returns rank lower by risk-adjusted performance. Based on our sample of the best solo managers it is nominal return, most often cited in industry advertisements, that understates relative performance.7
IV. The Impact of Tenure
Fund companies regularly imply, implicitly or explicitly, that manager tenure and experience matters. This suggests that the longer a manager controls a fund, the better the performance an investor might expect. We note, however, that many of the managers of the best funds have tenures close to the 10-year minimum we impose. The average tenure of the Best 50 solo-managed funds is 13.8 (median 11.8), which is less than the average tenure for the sample of 355 of 14.5 years (median 12.8).
The lower mean and median for the Best 50 can be further illustrated using the tenure distribution. In our sample of 355 solo-managed funds with tenure of ten years or more, 111 have tenure of 15 years or more (31.2%) and 48 have tenure of 20 years or more (13.5%). In the Best 50, 13 have tenure of 15 years or more (26%) and 5 have tenure of 20 years
7 In an earlier version of this paper, we reported the results for the upcoming tests of the impact of tenure using MACAR, Jensen alpha, and Carhart alpha and the results were qualitatively identical regardless of the metric used. On the advice of our reviewer, we have focused subsequent tests on MACAR to be concise.
or more (10%). That is, the distributions are similar across performance levels but the proportion of managers having longer tenure is lower among the best managers than in the full sample.8 The average tenure of the Best 10 managers is only 11.23 years. Also, 24 of the Best 50 were active at the end of our sample period (mean tenure 13.2, median 11.34).
If the best managers possess greater ability and that ability improves as they gain experience, why are there not more managers with long track records in the Best 50? Furthermore, since top managers who have a competitive advantage both in terms of attracting additional investors to their funds and in earning higher salaries, why would they leave their funds or share control with other managers after a relatively short tenure? To test the relationship between performance and tenure we perform the following regression analysis:
MARi,t = a + b*Tenurei,t + ε, (1)
where MARi,t is the market-adjusted return for manager i in year t. In addition to performing this analysis on our sample of 355 solo-managed funds, we also analyze subsets of managers in the top 50%, 25%, and 10% ranked by their career MACAR. We examine these smaller subsets because of prior studies suggesting that a small proportion of managers exhibit persistent superior performance. Therefore, the long run impact of tenure on returns may be different for the very best managers.
We also test an alternate form of Model (1). Barras et al. (2010) find that the proportion of funds with true excess returns declines significantly after 1996. The number of
8 Of the Worst 50, 15 have tenure of 15 years or more (30%t) and 5 have tenure of 20 years or more (10%).
8 Journal of aPPlied finance – no. 1, 2012
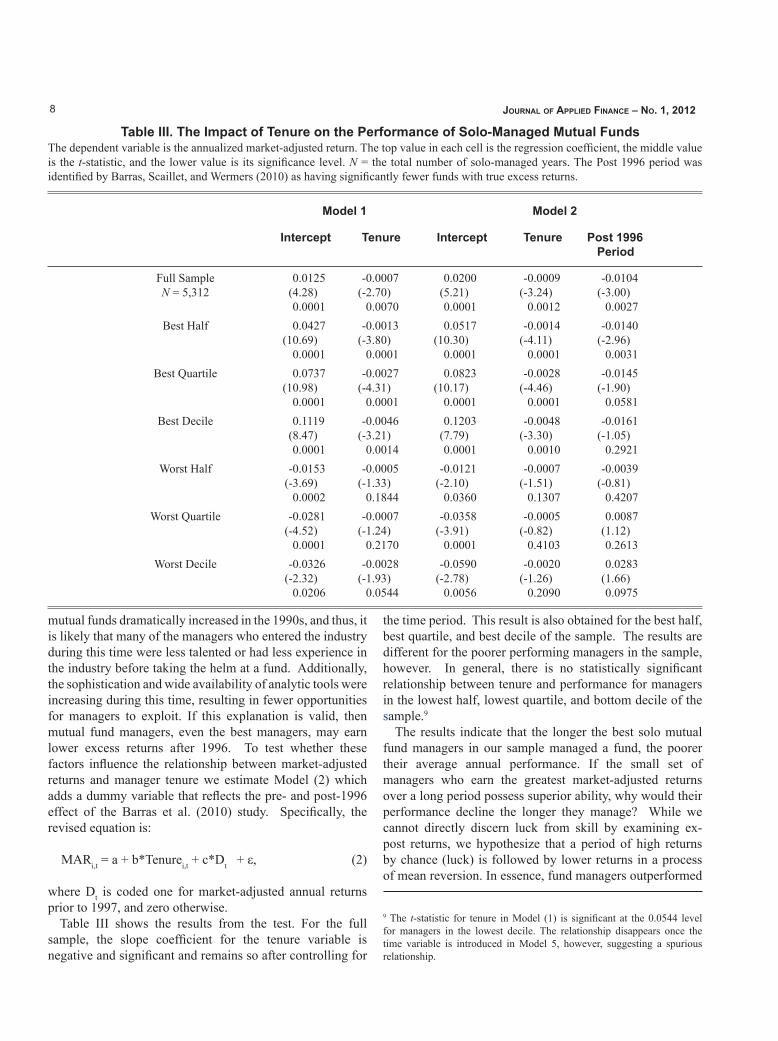
Table III. The Impact of Tenure on the Performance of Solo-Managed Mutual FundsThe dependent variable is the annualized market-adjusted return. The top value in each cell is the regression coefficient, the middle value is the t-statistic, and the lower value is its significance level. N = the total number of solo-managed years. The Post 1996 period was identified by Barras, Scaillet, and Wermers (2010) as having significantly fewer funds with true excess returns.
Model 1 Model 2
Intercept Tenure Intercept Tenure Post 1996 Period
Full Sample N = 5,312
0.0125(4.28)0.0001
-0.0007(-2.70)
0.0070
0.0200(5.21)0.0001
-0.0009(-3.24)
0.0012
-0.0104(-3.00)
0.0027Best Half 0.0427
(10.69)0.0001
-0.0013(-3.80)
0.0001
0.0517(10.30)
0.0001
-0.0014(-4.11)
0.0001
-0.0140(-2.96)
0.0031Best Quartile 0.0737
(10.98)0.0001
-0.0027(-4.31)
0.0001
0.0823(10.17)
0.0001
-0.0028(-4.46)
0.0001
-0.0145(-1.90)
0.0581Best Decile 0.1119
(8.47)0.0001
-0.0046(-3.21)
0.0014
0.1203(7.79)0.0001
-0.0048(-3.30)
0.0010
-0.0161(-1.05)
0.2921Worst Half -0.0153
(-3.69)0.0002
-0.0005(-1.33)
0.1844
-0.0121(-2.10)
0.0360
-0.0007(-1.51)
0.1307
-0.0039(-0.81)
0.4207Worst Quartile -0.0281
(-4.52)0.0001
-0.0007(-1.24)
0.2170
-0.0358(-3.91)
0.0001
-0.0005(-0.82)
0.4103
0.0087(1.12)0.2613
Worst Decile -0.0326(-2.32)
0.0206
-0.0028(-1.93)
0.0544
-0.0590(-2.78)
0.0056
-0.0020(-1.26)
0.2090
0.0283(1.66)0.0975
mutual funds dramatically increased in the 1990s, and thus, it is likely that many of the managers who entered the industry during this time were less talented or had less experience in the industry before taking the helm at a fund. Additionally, the sophistication and wide availability of analytic tools were increasing during this time, resulting in fewer opportunities for managers to exploit. If this explanation is valid, then mutual fund managers, even the best managers, may earn lower excess returns after 1996. To test whether these factors influence the relationship between market-adjusted returns and manager tenure we estimate Model (2) which adds a dummy variable that reflects the pre- and post-1996 effect of the Barras et al. (2010) study. Specifically, the revised equation is:
MARi,t = a + b*Tenurei,t + c*Dt + ε, (2)
where Dt is coded one for market-adjusted annual returns prior to 1997, and zero otherwise.
Table III shows the results from the test. For the full sample, the slope coefficient for the tenure variable is negative and significant and remains so after controlling for
the time period. This result is also obtained for the best half, best quartile, and best decile of the sample. The results are different for the poorer performing managers in the sample, however. In general, there is no statistically significant relationship between tenure and performance for managers in the lowest half, lowest quartile, and bottom decile of the sample.9
The results indicate that the longer the best solo mutual fund managers in our sample managed a fund, the poorer their average annual performance. If the small set of managers who earn the greatest market-adjusted returns over a long period possess superior ability, why would their performance decline the longer they manage? While we cannot directly discern luck from skill by examining ex-post returns, we hypothesize that a period of high returns by chance (luck) is followed by lower returns in a process of mean reversion. In essence, fund managers outperformed
9 The t-statistic for tenure in Model (1) is significant at the 0.0544 level for managers in the lowest decile. The relationship disappears once the time variable is introduced in Model 5, however, suggesting a spurious relationship.
9Porter & trifts – the Best Mutual fund Managers
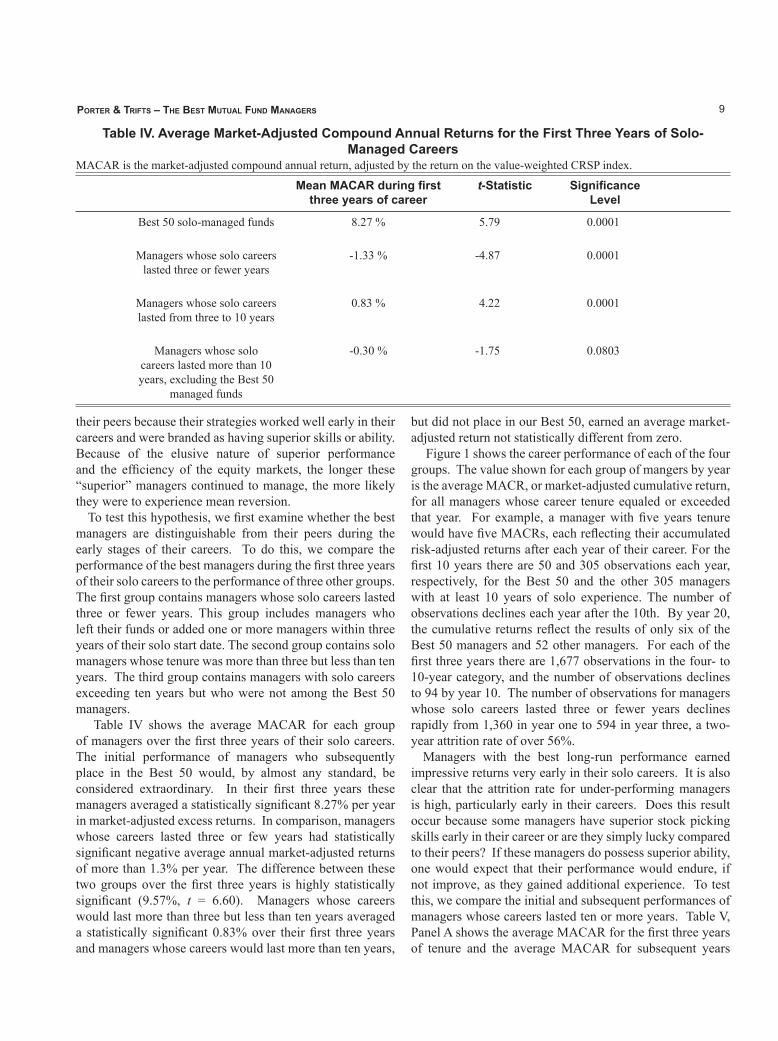
Table IV. Average Market-Adjusted Compound Annual Returns for the First Three Years of Solo-Managed Careers
MACAR is the market-adjusted compound annual return, adjusted by the return on the value-weighted CRSP index.
Mean MACAR during first three years of career
t-Statistic Significance Level
Best 50 solo-managed funds 8.27 % 5.79 0.0001
Managers whose solo careers lasted three or fewer years
-1.33 % -4.87 0.0001
Managers whose solo careers lasted from three to 10 years
0.83 % 4.22 0.0001
Managers whose solo careers lasted more than 10 years, excluding the Best 50
managed funds
-0.30 % -1.75 0.0803
their peers because their strategies worked well early in their careers and were branded as having superior skills or ability. Because of the elusive nature of superior performance and the efficiency of the equity markets, the longer these “superior” managers continued to manage, the more likely they were to experience mean reversion.
To test this hypothesis, we first examine whether the best managers are distinguishable from their peers during the early stages of their careers. To do this, we compare the performance of the best managers during the first three years of their solo careers to the performance of three other groups. The first group contains managers whose solo careers lasted three or fewer years. This group includes managers who left their funds or added one or more managers within three years of their solo start date. The second group contains solo managers whose tenure was more than three but less than ten years. The third group contains managers with solo careers exceeding ten years but who were not among the Best 50 managers.
Table IV shows the average MACAR for each group of managers over the first three years of their solo careers. The initial performance of managers who subsequently place in the Best 50 would, by almost any standard, be considered extraordinary. In their first three years these managers averaged a statistically significant 8.27% per year in market-adjusted excess returns. In comparison, managers whose careers lasted three or few years had statistically significant negative average annual market-adjusted returns of more than 1.3% per year. The difference between these two groups over the first three years is highly statistically significant (9.57%, t = 6.60). Managers whose careers would last more than three but less than ten years averaged a statistically significant 0.83% over their first three years and managers whose careers would last more than ten years,
but did not place in our Best 50, earned an average market-adjusted return not statistically different from zero.
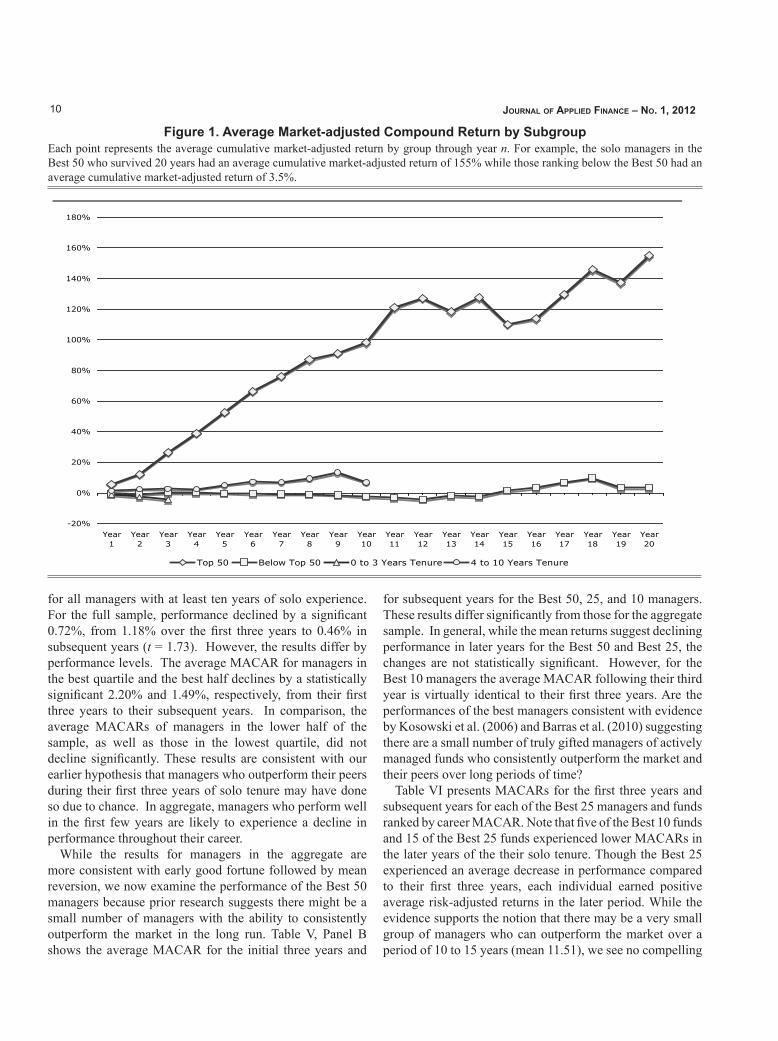
Figure 1 shows the career performance of each of the four groups. The value shown for each group of mangers by year is the average MACR, or market-adjusted cumulative return, for all managers whose career tenure equaled or exceeded that year. For example, a manager with five years tenure would have five MACRs, each reflecting their accumulated risk-adjusted returns after each year of their career. For the first 10 years there are 50 and 305 observations each year, respectively, for the Best 50 and the other 305 managers with at least 10 years of solo experience. The number of observations declines each year after the 10th. By year 20, the cumulative returns reflect the results of only six of the Best 50 managers and 52 other managers. For each of the first three years there are 1,677 observations in the four- to 10-year category, and the number of observations declines to 94 by year 10. The number of observations for managers whose solo careers lasted three or fewer years declines rapidly from 1,360 in year one to 594 in year three, a two-year attrition rate of over 56%.
Managers with the best long-run performance earned impressive returns very early in their solo careers. It is also clear that the attrition rate for under-performing managers is high, particularly early in their careers. Does this result occur because some managers have superior stock picking skills early in their career or are they simply lucky compared to their peers? If these managers do possess superior ability, one would expect that their performance would endure, if not improve, as they gained additional experience. To test this, we compare the initial and subsequent performances of managers whose careers lasted ten or more years. Table V, Panel A shows the average MACAR for the first three years of tenure and the average MACAR for subsequent years
10 Journal of aPPlied finance – no. 1, 2012
Figure 1. Average Market-Adjusted Compound Return by Subgroup
Each point represents the average cumulative market-adjusted return by group through year n. For example, the solo managers in the Best 50 who survived 20 years had an average cumulative market-adjusted return of 155% while those ranking below the Best 50 had an average cumulative market-adjusted return of 3.5%.
-20%
0%
20%
40%
60%
80%
100%
120%
140%
160%
180%
Year1
Year2
Year3
Year4
Year5
Year6
Year7
Year8
Year9
Year10
Year11
Year12
Year13
Year14
Year15
Year16
Year17
Year18
Year19
Year20
Top 50 Below Top 50 0 to 3 Years Tenure 4 to 10 Years Tenure
Figure 1. Average Market-adjusted Compound Return by SubgroupEach point represents the average cumulative market-adjusted return by group through year n. For example, the solo managers in the Best 50 who survived 20 years had an average cumulative market-adjusted return of 155% while those ranking below the Best 50 had an average cumulative market-adjusted return of 3.5%.
for all managers with at least ten years of solo experience. For the full sample, performance declined by a significant 0.72%, from 1.18% over the first three years to 0.46% in subsequent years (t = 1.73). However, the results differ by performance levels. The average MACAR for managers in the best quartile and the best half declines by a statistically significant 2.20% and 1.49%, respectively, from their first three years to their subsequent years. In comparison, the average MACARs of managers in the lower half of the sample, as well as those in the lowest quartile, did not decline significantly. These results are consistent with our earlier hypothesis that managers who outperform their peers during their first three years of solo tenure may have done so due to chance. In aggregate, managers who perform well in the first few years are likely to experience a decline in performance throughout their career.
While the results for managers in the aggregate are more consistent with early good fortune followed by mean reversion, we now examine the performance of the Best 50 managers because prior research suggests there might be a small number of managers with the ability to consistently outperform the market in the long run. Table V, Panel B shows the average MACAR for the initial three years and
for subsequent years for the Best 50, 25, and 10 managers. These results differ significantly from those for the aggregate sample. In general, while the mean returns suggest declining performance in later years for the Best 50 and Best 25, the changes are not statistically significant. However, for the Best 10 managers the average MACAR following their third year is virtually identical to their first three years. Are the performances of the best managers consistent with evidence by Kosowski et al. (2006) and Barras et al. (2010) suggesting there are a small number of truly gifted managers of actively managed funds who consistently outperform the market and their peers over long periods of time?
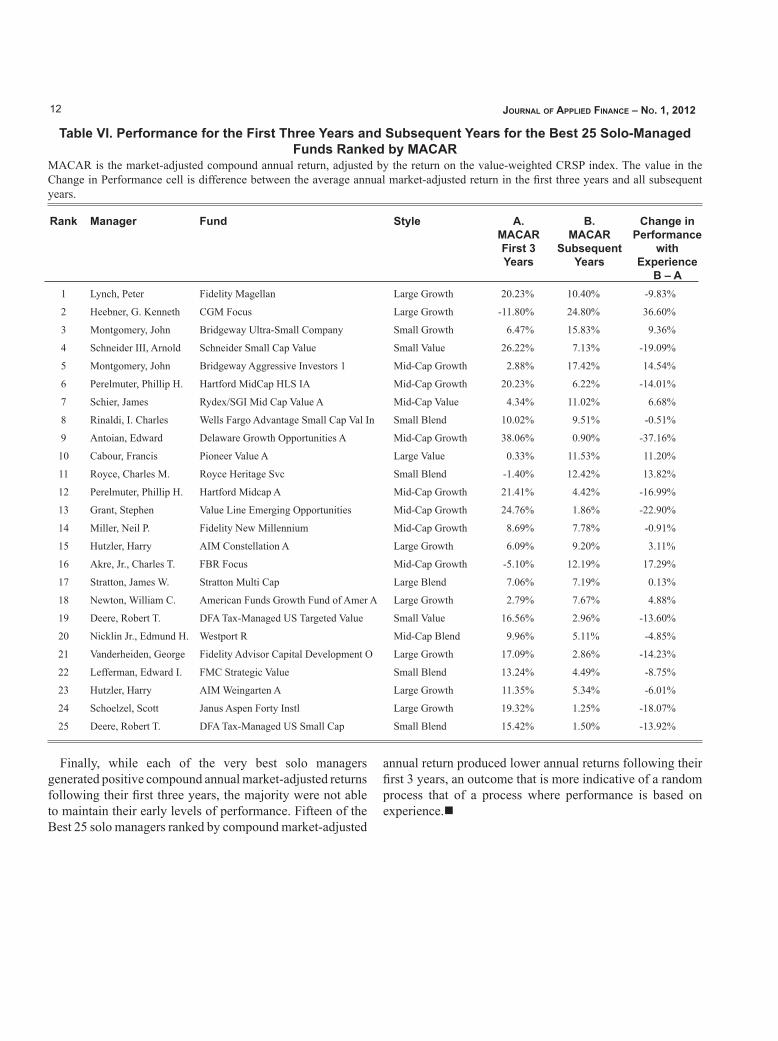
Table VI presents MACARs for the first three years and subsequent years for each of the Best 25 managers and funds ranked by career MACAR. Note that five of the Best 10 funds and 15 of the Best 25 funds experienced lower MACARs in the later years of the their solo tenure. Though the Best 25 experienced an average decrease in performance compared to their first three years, each individual earned positive average risk-adjusted returns in the later period. While the evidence supports the notion that there may be a very small group of managers who can outperform the market over a period of 10 to 15 years (mean 11.51), we see no compelling

11Porter & trifts – the Best Mutual fund Managers
Table V. Comparing Performance in the First Three Years to Subsequent Years for Managers with Ten or More Years of Solo Tenure
The Change in Performance column shows difference between the average annual market-adjusted return in the first three years and all subsequent years, the middle value is the t-statistic, and the lower value is the significance level.
Panel A. All Managers
Average annual market-adjusted returns
First three years Subsequent years Change in Performance with
Experience
All Managers 1.18% 0.46% -0.72%(-1.73)
0.0836Best quartile 6.76% 4.56% -2.20%
(-2.10)0.0361
Best half 4.24% 2.75% -1.49%(-2.34)
0.0196Worst half -1.90% -2.01% -0.11%
(-0.23)0.8187
Worst quartile -3.14% -3.56% -0.42%(-0.58)
0.5599
Panel B. Best 50 Managers
Best 50 Managers 8.27% 5.96% -2.31%(-1.49)
0.1366Best 25 Managers 11.37% 8.19% -3.18%
(-1.23)0.2213
Best 10 Managers 11.70% 11.64% -0.06%(-0.01)
0.9910
evidence of improvement with experience, as 60% of the Best 25 generated poorer returns following their initial three years. The evidence is more indicative of a random process.
V. SummaryThis study uses a survivorship-bias free sample consisting
of funds within the nine Morningstar styles, and spanning more than 80 years, to identify the best solo mutual fund managers with tenure of ten years or more. It may come as no surprise to many that Peter Lynch has the best overall performance among 289 solo managers, ranking first in both nominal and market-adjusted compound annual return, third by Carhart alpha, and fourth by Jensen alpha. He also ranked first in cumulative market-adjusted returns, though he
managed Fidelity Magellan for only 13 years, less than the average of 14.5 years for our sample of 355 funds. Less than half of the 355 funds generated positive market-adjusted compound annual returns.
We also examine the relationship between performance and tenure and find an inverse relationship between average annual returns and tenure, even after controlling for structural changes in mutual fund returns after 1996. Managers with tenure of ten or more years are likely to have significantly poorer performance the longer they manage. We also find that solo managers who survive ten or more years are likely to have performed at or above the market in their first three years, while their peers who do not survive as solo managers beyond three years significantly under-perform the market.
12 Journal of aPPlied finance – no. 1, 2012
Table VI. Performance for the First Three Years and Subsequent Years for the Best 25 Solo-Managed Funds Ranked by MACAR
MACAR is the market-adjusted compound annual return, adjusted by the return on the value-weighted CRSP index. The value in the Change in Performance cell is difference between the average annual market-adjusted return in the first three years and all subsequent years.
Rank Manager Fund Style A.MACAR First 3 Years
B.MACAR
SubsequentYears
Change in Performance
with Experience
B – A1 Lynch, Peter Fidelity Magellan Large Growth 20.23% 10.40% -9.83%
2 Heebner, G. Kenneth CGM Focus Large Growth -11.80% 24.80% 36.60%
3 Montgomery, John Bridgeway Ultra-Small Company Small Growth 6.47% 15.83% 9.36%
4 Schneider III, Arnold Schneider Small Cap Value Small Value 26.22% 7.13% -19.09%
5 Montgomery, John Bridgeway Aggressive Investors 1 Mid-Cap Growth 2.88% 17.42% 14.54%
6 Perelmuter, Phillip H. Hartford MidCap HLS IA Mid-Cap Growth 20.23% 6.22% -14.01%
7 Schier, James Rydex/SGI Mid Cap Value A Mid-Cap Value 4.34% 11.02% 6.68%
8 Rinaldi, I. Charles Wells Fargo Advantage Small Cap Val In Small Blend 10.02% 9.51% -0.51%
9 Antoian, Edward Delaware Growth Opportunities A Mid-Cap Growth 38.06% 0.90% -37.16%
10 Cabour, Francis Pioneer Value A Large Value 0.33% 11.53% 11.20%
11 Royce, Charles M. Royce Heritage Svc Small Blend -1.40% 12.42% 13.82%
12 Perelmuter, Phillip H. Hartford Midcap A Mid-Cap Growth 21.41% 4.42% -16.99%
13 Grant, Stephen Value Line Emerging Opportunities Mid-Cap Growth 24.76% 1.86% -22.90%
14 Miller, Neil P. Fidelity New Millennium Mid-Cap Growth 8.69% 7.78% -0.91%
15 Hutzler, Harry AIM Constellation A Large Growth 6.09% 9.20% 3.11%
16 Akre, Jr., Charles T. FBR Focus Mid-Cap Growth -5.10% 12.19% 17.29%
17 Stratton, James W. Stratton Multi Cap Large Blend 7.06% 7.19% 0.13%
18 Newton, William C. American Funds Growth Fund of Amer A Large Growth 2.79% 7.67% 4.88%
19 Deere, Robert T. DFA Tax-Managed US Targeted Value Small Value 16.56% 2.96% -13.60%
20 Nicklin Jr., Edmund H. Westport R Mid-Cap Blend 9.96% 5.11% -4.85%
21 Vanderheiden, George Fidelity Advisor Capital Development O Large Growth 17.09% 2.86% -14.23%
22 Lefferman, Edward I. FMC Strategic Value Small Blend 13.24% 4.49% -8.75%
23 Hutzler, Harry AIM Weingarten A Large Growth 11.35% 5.34% -6.01%
24 Schoelzel, Scott Janus Aspen Forty Instl Large Growth 19.32% 1.25% -18.07%
25 Deere, Robert T. DFA Tax-Managed US Small Cap Small Blend 15.42% 1.50% -13.92%
Finally, while each of the very best solo managers generated positive compound annual market-adjusted returns following their first three years, the majority were not able to maintain their early levels of performance. Fifteen of the Best 25 solo managers ranked by compound market-adjusted
annual return produced lower annual returns following their first 3 years, an outcome that is more indicative of a random process that of a process where performance is based on experience.n
13Porter & trifts – the Best Mutual fund Managers
References
Barras, L., O. Scaillet, and R. Wermers, 2010, “False Discoveries in Mutual Fund Performance: Measuring Luck in Estimated Alphas,” Journal of Finance 65 (No. 1), 179-216.
Birger, J., “America’s Hottest Investor,” Fortune, June 9, 2008 and on Money.CNN.com
Carhart, M., 1997, “On Persistence in Mutual Fund Performance,” Journal of Finance 52 (No. 1), 57-86.
Costa, B. and K. Jakob, “Enhanced Performance Measurement of Mutual Funds: Running the Benchmark Index through the Hurdles,” Journal of Applied Finance 20 (No. 1), 95-102.
Elton, J., M. Gruber, and C. Blake, 2001, “A First Look at the Accuracy of the CRSP Mutual Fund Database and a Comparison of the CRSP and Morningstar Mutual Fund Databases,” Journal of Finance 56 (No. 6), 2415-2430.
Fama, E. and K., French, 1993, “Common Risk Factors in the Returns on Stocks and Bonds,” Journal of Financial Economics 33 (No. 1), 3-56.
Jensen, M.C., 1968, “The Performance of Mutual Funds in the Period 1945-1964,” Journal of Finance 23 (No. 2), 389-416.
Kosowski, R., A. Timmermann, R. Wermers, and H. White, 2006, “Can Mutual Fund “Stars” Really Pick Stocks? New Evidence from a Bootstrap Analysis,” Journal of Finance 61 (No. 6), 2551-2595.
Nicolosi, G., 2009, “The Telling Trades of Mutual Funds,” Financial Management 38 (No. 4), 915-936.