Embed Size (px)
Citation preview
1
The Best AlternativeExecutive SummaryPSE and CENSE (Coalition of Eastside Neighborhoods for Sensible Energy) may not agree on the feasibility of the company’s proposed transmission project through four Eastside cities.
But at least we agree on one thing. The five alternative solutions evaluated in the Draft EIS are not practical solutions to power future growth of the Eastside.
• Alternative1B (use existing Seattle City Light corridor): Seattle City Light has said they don’t want to share these lines with PSE. We don’t know how to change that conclusion.
• Alternative1C(underground transmission lines): The state tariff enforced by the Washington Utilities and Transportation Commission makes it prohibitively expensive for communities to request undergrounding.
•Alternative1D (underwater transmission lines): This alternative may be subject to the same expensive undergrounding tariff, and also raises questions about disturbing a Superfund site, shoreline issues, and concerns about salmon.
•Alternative2 (integrated resource approach): The analysis of integrated resources is based on incorrect or obsolete information, making this option appear more expensive and less feasible than it actually is.
•Alternative3 (new 115 kV lines and transformers): With 60 miles of new transmission lines, this alternative does not seem like an attractive or realistic option to anyone.
Alternative 2 would be the most attractive option for residents and businesses if it were redesigned using more up-to-date and accurate information. Such a solution would be less expensive, less damaging to communities and the environment, and safer for homes and schools in close proximity to the power lines and high-pressure petroleum pipelines.
Sadly, Alternative 2 was not designed or reviewed by experts in new technologies that make Demand Response and Electrical Efficiency the most important factors in planning the electrical grid of the future. This is validated by a quote from the Northwest Power Plan1 that was finalized this year:
In more than 90 percent of future conditions, cost-effective efficiency met all electricity load growth through 2035. It’s not only the single largest contributor to meeting the region’s future electricity needs, it’s also the single largest source of new winter peaking capacity.
EQL’s full report is included following this introduction. The full report is quite detailed and technical. It may be more appropriate for analysis by industry experts, so this introduction attempts to distill the main points for the general public.
1 https://www.nwcouncil.org/media/7149671/7thplandraft_chap01_execsummary_20151020.pdf
2
A clear definition of need and costIn order to determine the feasibility of any alternative solution, it is important to be clear about two crucial parameters:
1. How big is the need? Or, as the DEIS poses the question in section 2.3.3, what is the “projected deficiency in transmission capacity on the Eastside?”
2. What is the relative cost of alternatives compared to the cost of PSE’s proposed project?
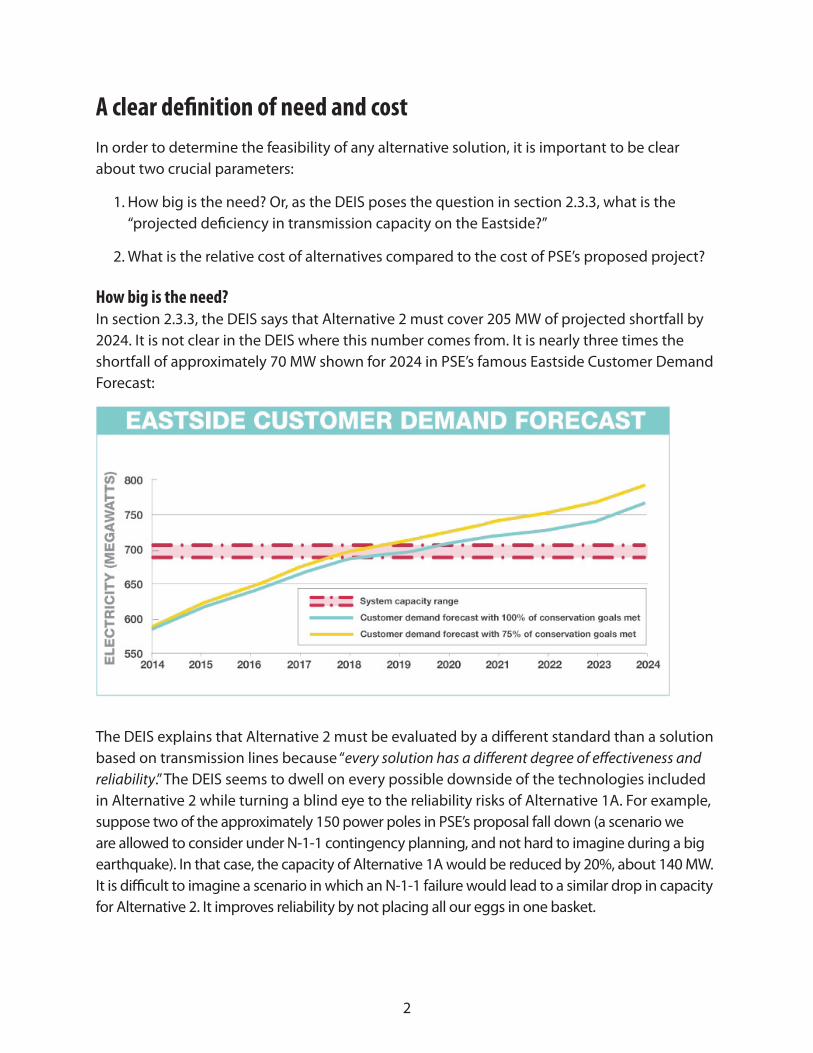
How big is the need?In section 2.3.3, the DEIS says that Alternative 2 must cover 205 MW of projected shortfall by 2024. It is not clear in the DEIS where this number comes from. It is nearly three times the shortfall of approximately 70 MW shown for 2024 in PSE’s famous Eastside Customer Demand Forecast:
The DEIS explains that Alternative 2 must be evaluated by a different standard than a solution based on transmission lines because “every solution has a different degree of effectiveness and reliability.” The DEIS seems to dwell on every possible downside of the technologies included in Alternative 2 while turning a blind eye to the reliability risks of Alternative 1A. For example, suppose two of the approximately 150 power poles in PSE’s proposal fall down (a scenario we are allowed to consider under N-1-1 contingency planning, and not hard to imagine during a big earthquake). In that case, the capacity of Alternative 1A would be reduced by 20%, about 140 MW. It is difficult to imagine a scenario in which an N-1-1 failure would lead to a similar drop in capacity for Alternative 2. It improves reliability by not placing all our eggs in one basket.
3
There is evidence that PSE has been gradually skewing requirements to reduce the competitiveness of alternatives. In April 2015, an update to Quanta’s Eastside Needs Assessment estimated the shortfall in transmission capacity at 123 MW. A few months later, the EIS consultant Stantec raised the estimate to 133 MW. In January 2016, PSE’s latest Integrated Resource Plan pegged the number at 166 MW. A few weeks later, the DEIS was published with an estimate of 205 MW.
The shortfall has grown by 54% in less than a year, calling into question the stability of the methodology used to determine this number or the motives of the information source.
The important point is that size matters. The mix of technologies and programs needed to cover a 205 MW shortfall is different from the mix that would be used to cover a shortfall of 123 MW. One wouldn’t simply “scale up” the smaller solution.
It’s important to note that CENSE is skeptical of even the lesser 123 MW figure. The Lauckhart-Schiffman Load Flow Study2 exposes errors in PSE’s assumptions and simulations that would dramatically alter the size and timeframe of the need. For the purposes of this report, we assume that the shortfall is 123-133 MW in order to critique the DEIS, but we do not agree that this is a realistic estimate.
What is the cost?The DEIS treats cost as irrelevant for the purposes of evaluating environmental impact. However, in the real world, cost is an important factor in choosing one alternative over another.
PSE has not estimated the cost of the project for at least a year. The last cost estimates that were shared with the Community Advisory Group were in the range of $150 million. EQL expects the actual cost will be closer to $300 million, for the following reasons:
1. PSE initially thought that two transmission lines could be carried on a single set of monopoles. However, due to the meanderings of the Olympic pipelines in the shared corridor, there are many places where the lines must be carried by two poles to meet safety requirements. The number of poles and construction costs will increase.
2. PSE initially thought that the current transmission poles could be removed before construction of the new line began. Recently, the company has admitted that operation of the system with no lines in place during many months of construction would present a reliability risk. Therefore, the design must be altered to accommodate both sets of transmission lines in place simultaneously.
2 http://cense.org/Lauckhart-Schiffman%20Load%20Flow%20Study.pdf
4
Taller poles will be required to maintain a safe distance between the old lines and the new lines. Also, the complexity of construction is significantly increased. Both of these factors will increase the cost of the project.
3. PSE assumed that it would be safe enough to put two transmission lines and two high-pressure petroleum pipelines in a utility corridor that is as narrow as 100 feet in densely settled residential neighborhoods. The DEIS wisely assumes that the corridor will have to be widened by up to 50 feet. This will require condemnation of homes and new easements, significantly increasing project costs.
4. Resistance to the project is much higher than PSE expected. The costs of advertising, public relations, and potential legal actions are correspondingly higher.
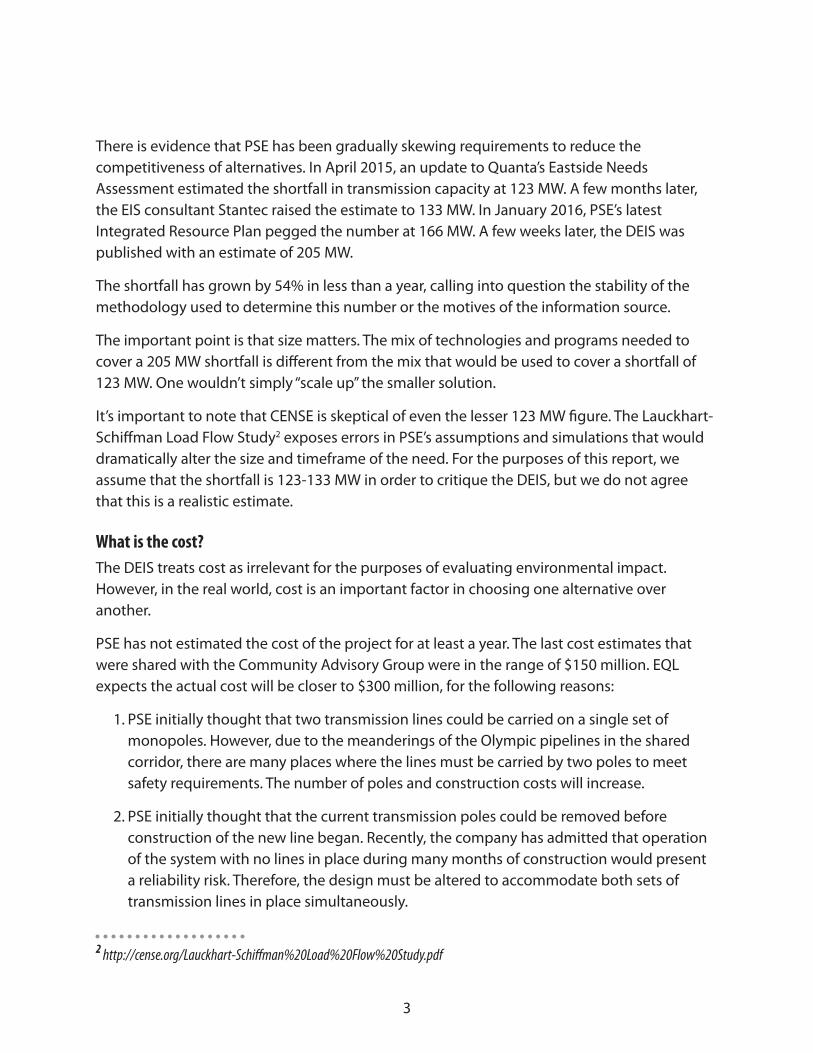
EQL’s report points out a hidden cost of Alternative 1A. If PSE invests hundreds of millions of dollars in a transmission project, the amount of investment dedicated to important programs like Demand Response and Energy Efficiency will be reduced. Consequently, overall energy use will be higher with Alternative 1A than Alternative 2. That higher consumption must be matched by new generation, and PSE anticipates that need in the 2015 Integrated Resource Plan. PSE expects to build nearly 600 MW of new gas generation plants in 2021, just a few years after Energize Eastside is complete:
Alternative 2 could reduce overall energy use enough to eliminate the need for one 200 MW generation plant, saving ratepayers $300 million. In the long run, Alternative 2 could save ratepayers the cost of both transmission and generation infrastructure, at least $600 million. Including both of these avoided costs in the analysis makes Alternative 2 the better choice for cost effectiveness.
5
Expert analysis from EQL EnergyTo better understand how Distributed Energy Resources (DER) might contribute to the future operation of our energy grid, CENSE engaged industry expert EQL Energy from Portland, Oregon. EQL has been an important contributor to alternative energy solutions in Portland and other parts of the Pacific Northwest.
EQL possesses a different skill set than that needed to plan transmission lines. These skills have not been demonstrated by PSE or the EIS consultant Stantec. Consequently, Alternative 2 is not a credible DER solution. The description included in DEIS section 2.3.3.1 would lead the reasonable reader to conclude that this option is difficult to implement and dangerous for reliability.
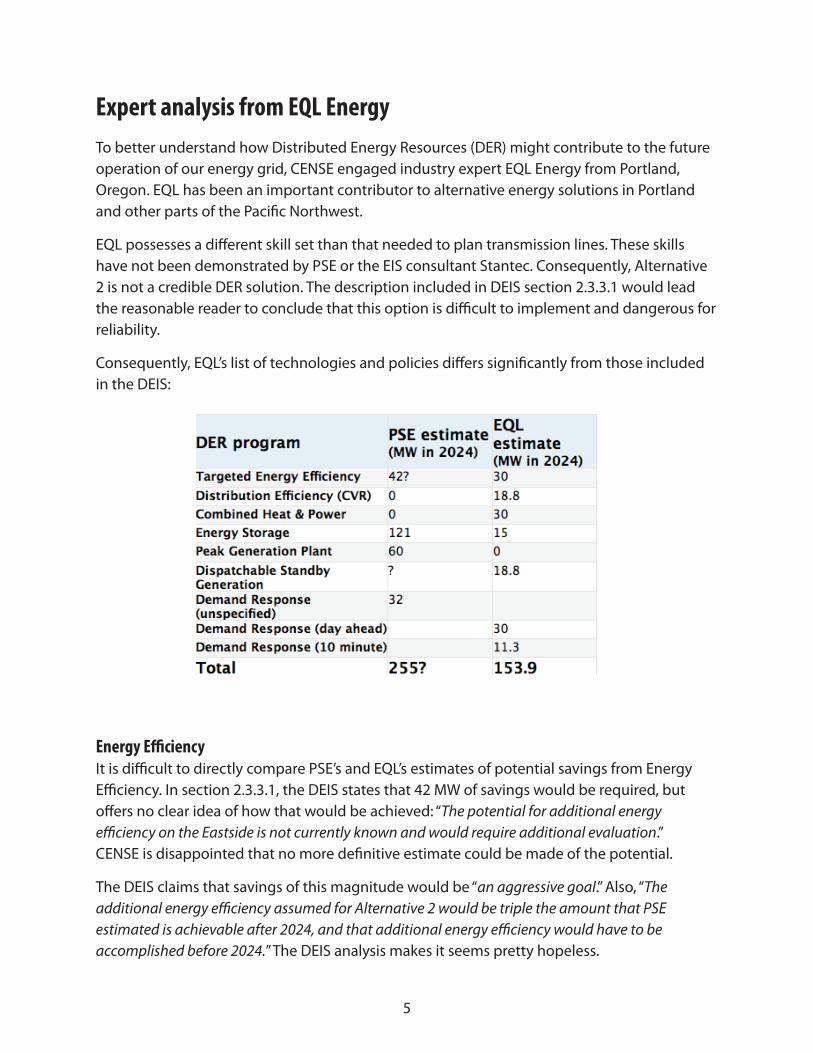
Consequently, EQL’s list of technologies and policies differs significantly from those included in the DEIS:
Energy EfficiencyIt is difficult to directly compare PSE’s and EQL’s estimates of potential savings from Energy Efficiency. In section 2.3.3.1, the DEIS states that 42 MW of savings would be required, but offers no clear idea of how that would be achieved: “The potential for additional energy efficiency on the Eastside is not currently known and would require additional evaluation.” CENSE is disappointed that no more definitive estimate could be made of the potential.
The DEIS claims that savings of this magnitude would be “an aggressive goal.” Also, “The additional energy efficiency assumed for Alternative 2 would be triple the amount that PSE estimated is achievable after 2024, and that additional energy efficiency would have to be accomplished before 2024.” The DEIS analysis makes it seems pretty hopeless.
6
In contrast, EQL has estimated 30 MW can be saved through Energy Efficiency. This is lower than PSE’s goal, and EQL believes it is more easily achieved because PSE and its consultants are using load data that is decades out of date. The obsolete data makes Energy Efficiency appear to be less effective than it actually has been in more recent years.
To get more accurate data, a “Request for Proposals” should be issued to companies that specialize in Energy Efficiency technologies and programs. A competitive bidding process would yield better estimates of the potential than the obsolete data being used by PSE and EIS consultants.
Distribution EfficiencyEnergy Efficiency achieves savings on the consumer’s side of the electric meter by using less electricity to accomplish tasks such as lighting, heating, operating appliances and electronics, and charging batteries. In contrast, Distribution Efficiency increases the efficiency of how PSE and other utilities deliver electricity to consumers. This reduces overall electricity usage by up to 4% without any impact on customers. PSE has already incorporated this technology in a few substations, but the program can be expanded to more broadly reduce peak loads.
EQL included 18.8 MW of savings in its DER estimates, based on a somewhat conservative estimate of 2.5% of peak load. No estimate is included for Distribution Efficiency in the DEIS.
Combined Heat & PowerCombined Heat & Power is a technology that generates electricity from the waste heat produced by burning natural gas to heat or cool a building. It is most effectively incorporated in new buildings, and it provides two benefits. The very efficient use of natural gas reduces total carbon emissions compared to long-distance transmission of electricity, and local generation of electricity can provide a degree of immunity from power outages. Widespread use could reduce the need for new generation facilities and transmission lines, benefitting all customers.
Bellevue has a special opportunity to incorporate this technology due to the number of new buildings planned for construction in downtown Bellevue and the Spring District. If these projects are contributing to the need for Energize Eastside, it seems fair to ask them to help solve the problem of increased energy use. It is not fair to place the burden of rising downtown energy use on residential neighborhoods with increased industrialization and lower property values.
EQL estimates 30 MW of savings due to Combined Heat & Power. No estimate is included in the DEIS.
7
Energy StorageDEIS section 2.3.3.4 describes a battery solution that would provide 121 MW to serve peak demand. However, the practicality of such a system is immediately dismissed: “An energy storage system with power and energy storage ratings large enough to reduce normal overloads has not yet been installed anywhere in the world. For comparison, the largest operational transmission scale battery facility in the U.S. can provide 32 MW of power for about 40 minutes.” The DEIS analysisi makes it sounds like you’d have to be crazy to consider this idea.
EQL proposes a battery solution with a capacity of only 15 MW, approximately 8 times smaller than PSE’s solution. For comparison, Southern California Edison is funding a project to install batteries with 250 MW of capacity. EQL’s proposal is 16 times smaller, and by PSE’s metric, 16 times more feasible.
But what about cost? EQL found a major error in the cost analysis included in the Strategen report referenced in the DEIS. Strategen ignored the cost of avoided transmission, leading to the improbable assumption that we would build transmission lines and battery storage units. When the error is corrected, the cost of batteries is approximately two times more cost effective than building new transmission lines. And battery costs will continue to fall, while the cost of transmission lines usually rises due to increasing property values.
Even PSE admits that battery storage will become a game changer as we increasingly rely on intermittent renewable energy sources like wind and solar power. We can prepare for the future by investing in small amounts of battery storage now, so we can learn from our experience and advance the state of the art. If possible, we should use products like grid batteries manufactured by the Mukilteo-based company UniEnergy. That’s a smart investment in our energy future and our economy.
EQL estimates 15 MW of battery storage. The DEIS estimates 121 MW, but notes that the consultants skipped evaluation of a summer scenario because “energy storage would not be a feasible stand-alone alternative.” This is an odd criteria to apply to energy storage, because the components of an “integrated resource approach” are designed to work together, not as stand-alone pieces.
8
Peak Generation PlantDEIS section 2.3.3.1 describes “three 20 MW generators to be implemented in combination with the other components described for Alternative 2.” As an important caveat, the DEIS notes that “PSE had eliminated this option from consideration” because “these types of generators produce a high noise level that would be incompatible with [residential] surroundings.” In discussion with Bellevue city council members, CENSE has learned that there is little political will to consider these generators.
EQL’s proposal does not rely on gas-fired peak generation plants. The DEIS assumes 60 MW of capacity.
Dispatchable Standby GenerationDispatchable Standby Generation (DSG) generates power on a customer’s site, as explained in DEIS section 2.3.3.3. The DEIS mentions many technologies that could be used for this purpose, such as gas turbines, microturbines, reciprocating engines, fuel
EQL’s proposal does not rely on gas-fired peak generation plants. The DEIS assumes 60 MW of capacity.
Dispatchable Standby GenerationDispatchable Standby Generation (DSG) generates power on a customer’s site, as explained in DEIS section 2.3.3.3. The DEIS mentions many technologies that could be used for this purpose, such as gas turbines, microturbines, reciprocating engines, fuel cells, and anaerobic digesters. However, no estimate is given regarding which ones are most practical or how much energy they might be expected to generate.
EQL describes a solution that they helped design in Portland, Oregon. Generators owned by businesses, hospitals, and government buildings are networked to the utility company. These generators are usually idle unless there is a power failure, when they are turned on to supply emergency power. The utility is provided a way to remotely control the generators when electricity demand peaks. The owner gets an attractive incentive for participating, and the generator reverts to its previous purpose (backup power) if an outage occurs.
Using the Portland program as a template, EQL used a scale factor to determine DSG potential for the Eastside. EQL estimates 18.8 MW of additional energy produced by DSG. The DEIS provides no estimate.
9
Demand ResponseThe importance of Demand Response as a primary part of future energy planning is underscored by the recently published Seventh Northwest Power Plan from the Northwest Power and Conservation Council, as well as a major victory for the Federal Energy Regulatory Commission in the U.S. Supreme Court.3 A 2015 article in Forbes explains how Demand Response will save U.S. consumers billions of dollars.4
DEIS section 2.3.3.2 mentions some rather vague ways to implement Demand Response programs, including real-time monitoring, utility control of heating and cooling systems, programmatic options to reduce peak demand (nothing specific), incentives and pricing structures to shift peak demand, continuous wireless signals to the utility (huh?)
The DEIS doesn’t provide any realistic estimate of how much energy can be saved through these programs, but it says it must be at least 32 MW. According to the DEIS, “this would triple the expected rate of adoption of demand response in PSE’s Integrated Resource Plan…”
EQL is more specific. There are actually two types of Demand Response programs: one anticipates needs one day before peak loads materialize (it’s not hard to predict very cold weather one day ahead), and one responds to emergency needs with 10 minutes’ notice.
EQL estimates 30 MW of savings for day-ahead Demand Response (4% of peak load based on a conservative estimate from industry analyst Navigant), and 11.3 MW for the 10-minute program (1.5% of peak load). The DEIS cites a goal of 32 MW, but is not specific or optimistic about achieving it.
3 https://www.washingtonpost.com/news/energy-environment/wp/2016/01/26/the-supreme-court-just-gave-a-great-explanation-of-our-baffling-electricity-system/ 4 http://www.forbes.com/sites/jamesconca/2015/02/24/solving-americas-energy-future-requires-a-demand-response/#5964a1457a9f
10
ConclusionsThe DEIS vaguely describes Alternative 2 using a resigned, pessimistic tone. The alternative seems risky and infeasible, because it was not developed or reviewed by experts with the specialized experience to accurately assess the technologies and potential energy savings.
EQL has described a more realistic way to achieve these energy goals in a manner that is cost-effective, better for the environment, better for our local economy, safer for residents, and more in sync with the Eastside’s leading edge, high-tech roots.
Alternative 2 has another advantage. PSE’s transmission line is an all-or-nothing proposal. It won’t deliver a single electron until every pole is installed and every wire strung. It will not be operational until PSE’s customers have spent at least $300 million for it.
By comparison, Alternative 2 can be built incrementally. According to PSE’s famous chart, the Eastside Customer Demand Forecast, there will be a shortfall of approximately 10 MW in 2020. It should be easy to meet that shortfall in the next four years using a subset of the technologies described by EQL. Two years after that, we need to find another 15 MW. That shouldn’t be too hard. As time progresses, technology will improve, and batteries will become cheaper and more efficient. We may find that it’s pretty easy to meet these goals.
But there’s another possibility. What if we have another recession? Or what happens if the ridiculous rate of growth (2.4% per year) that PSE is predicting doesn’t materialize? In these cases, we could scale back ongoing investments in Alternative 2, saving PSE’s customers hundreds of millions of dollars.
The DEIS describes many risks, but it doesn’t explain this one. A huge investment in Alternative 1A could create a technology dinosaur that industrializes the Eastside, does nothing to mitigate greenhouse gas emissions, and saddles our children and grandchildren with higher utility bills, leaving less money to invest in the energy technologies of the future. That doesn’t seem like a very smart investment.
CENSE.org February 24, 2016
Alternatives to Energize EastsideResponse to Draft EIS
February 15, 2016
Prepared for:CENSE
Prepared ByEQL Energy, LLC ! !Portland, ORwww.eqlenergy.com
2
Prepared by:
EQL Energy, LLC3701 SE Milwaukie Ave., Suite APortland, OR 97202
Primary Author(s)Ken Nichols, Principal /EQL Energy ! ! / 503.438.8223 / [email protected]
www.eqlenergy.com
© 2015 EQL Energy, LLC. All Rights ReservedThis document was produced by EQL Energy, LLC in accordance with an agreement with (Client). Client’s use of this report is subject to the terms of that agreement.
EQL Energy LLC | Energize Eastside Study Request
i
.................................................................................................................................Introduction 3...................................................................................Critical Points on EIS Alternative 2 4
A proper Alternative 2 analysis would prevent increases in Eastside winter ....................peaks and meet all 15 electrical criteria, and 4 non-electrical criteria. 4
Alternative 2 assessment is insufficient to determine feasibility and lacks ........................................................................................................credible analysis or estimate. 5
PSE Eastside winter peak load forecast has been a moving target throughout ................................planning process, and has steadily increased over study period. 6
PSE Eastside winter peak load forecast is wrong and has been consistently too ................................................................................................................high for the past 6 years. 7
......................................................................................Other Points on EIS Alternative 2 9..................................................................PSE local needs assessment is not a local cause 9
......................................The Problem – several days and a few hours in the winter 9.................................................................................................The DER Solution 10
.................................................................................................PSE lags rest of country in DER 11..........................................................................................................................EIS Impacts of Alt 2 11
......Alt 2 works with PSE Economic Study of Flexible AC Transmission (FACTS). 12
.................................................................................................Alternative 2 Issue Details 122014 Non-Wires Alternative Screening Study underestimates DER Potential for
.................................................................................................................................................Eastside 13...............................................................Defining distribution located resources 14
.......Energy Efficiency contribution to peak demand reductions underestimated 15.....Puget Sound DER and DSR avoided Cross-Cascades Transmission in 1990s 15
.........................................................................................................Western electricity markets 16
.........................................................................Assessment of Eastside DER Potential 16...........................................................................................................DSR and DER Contribution 16
.............................................................................Distributed Resource Planning 17.................................................................................................Distributed Solar 20
..........................................................................Distribution Efficiency (aka CVR) 20...............................................................................................Demand Response 21
...............................................................Dispatchable Standby Generation (DSG) 22.........................................................................Combined Heat and Power (CHP) 25
....................................................................................................Energy Storage 26....................................................................PSE DER Potential & Interconnection 26
EQL Energy LLC | Energize Eastside Study Request
ii
Figures
Figure 1: DER potential at PSE above the DSR 100% forecast! 4Figure 2: Range of Estimates for Eastside Peak Load increase through 2024! 6Figure 3: PSE 2015 IRP Figure 5-21: Electric Peak Demand Forecast before DSR 2015 IRP
Base Scenario versus 2013 IRP Base Scenario Hourly Annual Peak (23 Degrees, MW)! 7Figure 4: Sample DER Contribution to Winter Peak Day Load Shape! 11Figure 5: EQL Categories of Distributed Energy Resources! 15Figure 6: Distributed Resource Planning Value Analysis! 18Figure 7: DRP locational value components (CPUC DRP Guidance)! 18Figure 8: Bellevue Substation Peak Load Heat Map (2006)! 19Figure 9: Range of Distributed Solar by 2030! 20Figure 10: Eastside Area DR by 2021! 22Figure 11: Potential DSG by 2021! 23Figure 12: Base CHP Quantity 2021! 26Figure 13: Energy Storage Quantity 2021! 26
EQL Energy LLC | Energize Eastside Study Request
1 IntroductionEQL was asked to comment on Alternative 2 “Integrated Resource Approach” discussed in Chapter 2 of the Energize Eastside Draft EIS January 28, 2016. EQL has reviewed and commented Energize Eastside studies and has participated in several PSE IRP advisory group meetings, EQL has commented on the following topics through Energize Eastside and IRP Advisory process:
1. Distributed energy resources (DER), (e.g., energy efficiency, demand response, dispatchable standby generation, solar, storage, EV charging, CHP, distributed generation, etc.),
2. Demand Side Resource and transmission alternatives to Energize Eastside.3. Integration of transmission and distribution planning/costs into the utility least cost
planning process,4. Resource adequacy modeling and methods (e.g., EUE expected unserved energy,
focus on resource types), and5. Reliability in IRP, Transmission Planning, and SAIFI/SAIDI statistics, as well as
scenario and sensitivity analysis.EQL is an energy industry consultancy started in 2010 to assist utilities, utility customers, and vendors develop smart grid technologies and business cases that lower cost of utility service, improve reliability, and integrate renewable energy. Our staff has supported IRPs throughout the Western Electricity Coordinating Council and MISO since 1993. Since 2010, our work has been related to smart grid technology evaluation/planning, and integration of renewable energy and distributed energy resources (DER). EQL’s comments are those of EQL, and are meant to promote improved least cost utility planning.
2 Critical Points on EIS Alternative 2
Alternative 2 if done properly could meet criteria for Eastside expected growth in peak load. Unfortunately, the work and discussion of Alternative 2 in the EIS is confusing, insufficient to determine feasibility, uses bad data and forecasts, and demonstrates very little attention by City of Bellevue and PSE. Many utilities around the world are considering Distributed Energy Resources (DER) to defer or avoid transmission infrastructure, including ConEd (NY), SCE (CA) BC Hydro (BC), BPA (OR/WA), etc.1, DERs include targeted energy efficiency, demand response, dispatchable standby generation, solar, storage, EV charging, CHP, distributed generation, etc.
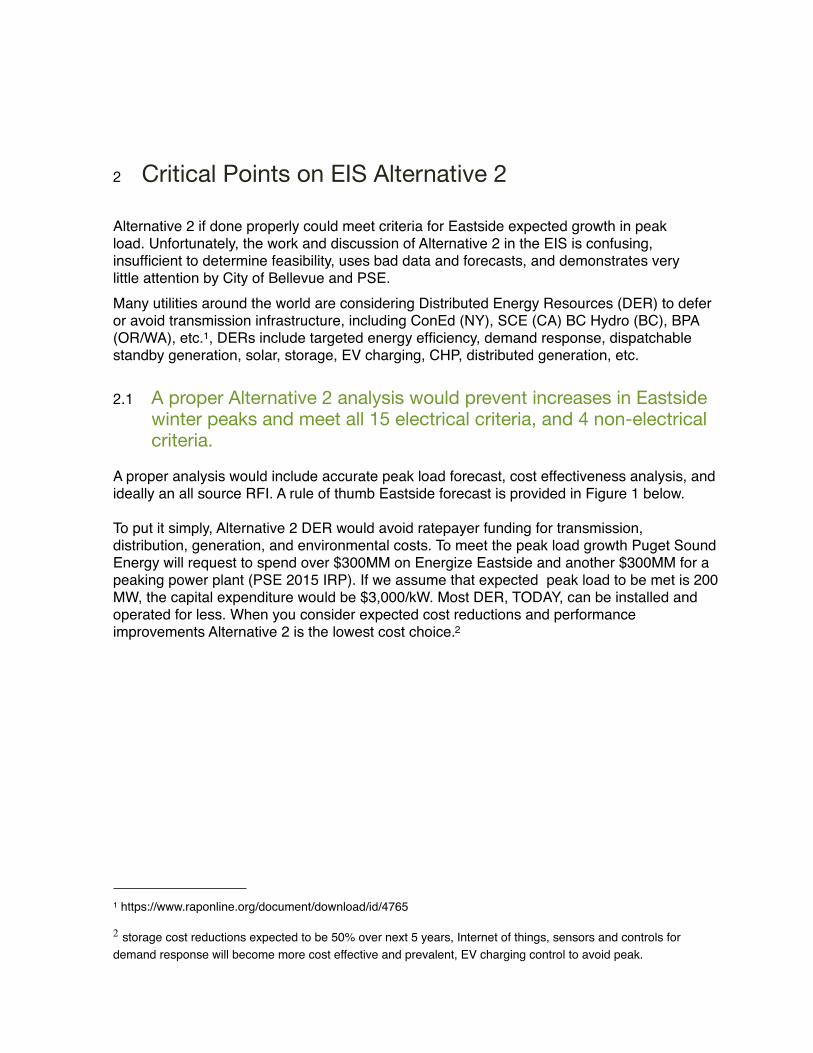
2.1 A proper Alternative 2 analysis would prevent increases in Eastside winter peaks and meet all 15 electrical criteria, and 4 non-electrical criteria.
A proper analysis would include accurate peak load forecast, cost effectiveness analysis, and ideally an all source RFI. A rule of thumb Eastside forecast is provided in Figure 1 below.
To put it simply, Alternative 2 DER would avoid ratepayer funding for transmission, distribution, generation, and environmental costs. To meet the peak load growth Puget Sound Energy will request to spend over $300MM on Energize Eastside and another $300MM for a peaking power plant (PSE 2015 IRP). If we assume that expected peak load to be met is 200 MW, the capital expenditure would be $3,000/kW. Most DER, TODAY, can be installed and operated for less. When you consider expected cost reductions and performance improvements Alternative 2 is the lowest cost choice.2
1 https://www.raponline.org/document/download/id/4765
2 storage cost reductions expected to be 50% over next 5 years, Internet of things, sensors and controls for demand response will become more cost effective and prevalent, EV charging control to avoid peak.
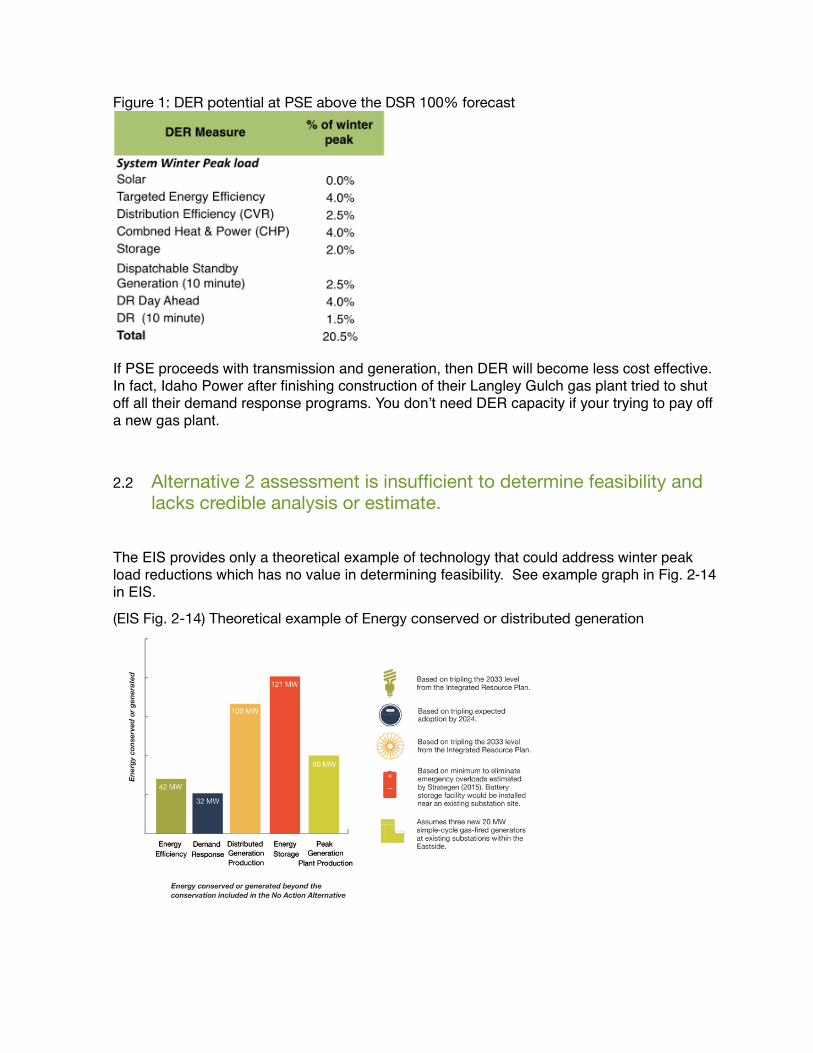
Figure 1: DER potential at PSE above the DSR 100% forecast
If PSE proceeds with transmission and generation, then DER will become less cost effective. In fact, Idaho Power after finishing construction of their Langley Gulch gas plant tried to shut off all their demand response programs. You don’t need DER capacity if your trying to pay off a new gas plant.
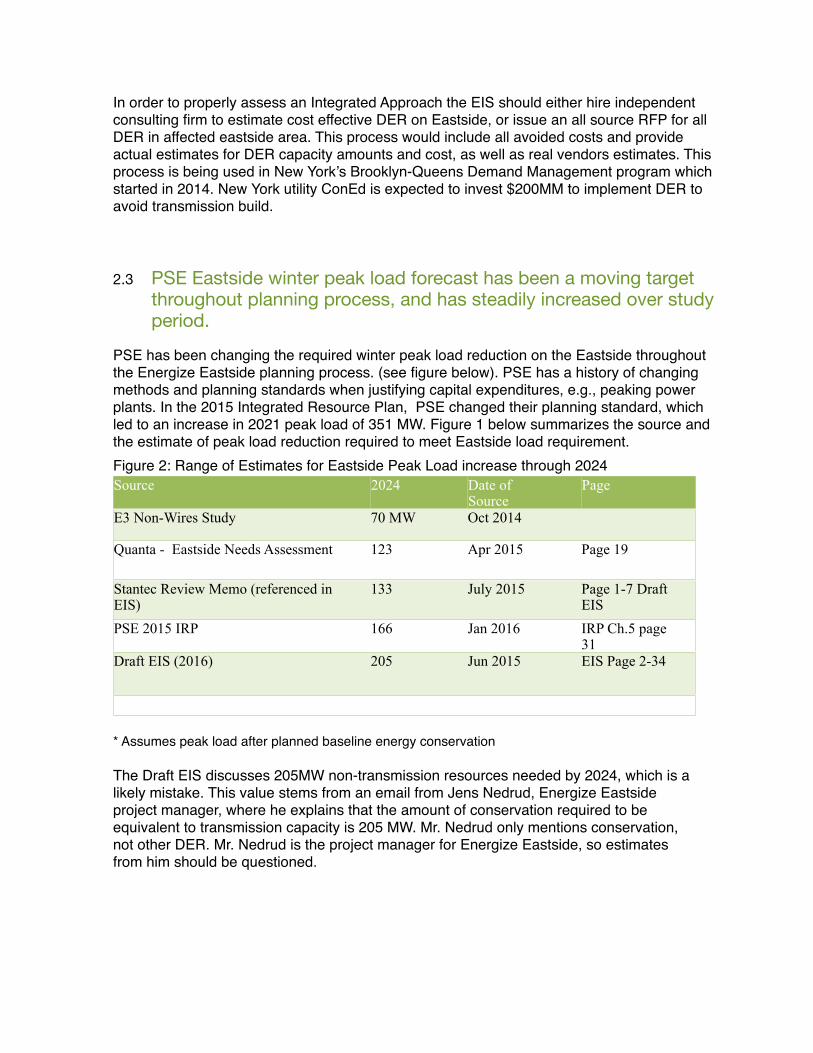
2.2 Alternative 2 assessment is insufficient to determine feasibility and lacks credible analysis or estimate.
The EIS provides only a theoretical example of technology that could address winter peak load reductions which has no value in determining feasibility. See example graph in Fig. 2-14 in EIS.
(EIS Fig. 2-14) Theoretical example of Energy conserved or distributed generation
In order to properly assess an Integrated Approach the EIS should either hire independent consulting firm to estimate cost effective DER on Eastside, or issue an all source RFP for all DER in affected eastside area. This process would include all avoided costs and provide actual estimates for DER capacity amounts and cost, as well as real vendors estimates. This process is being used in New York’s Brooklyn-Queens Demand Management program which started in 2014. New York utility ConEd is expected to invest $200MM to implement DER to avoid transmission build.
2.3 PSE Eastside winter peak load forecast has been a moving target throughout planning process, and has steadily increased over study period.
PSE has been changing the required winter peak load reduction on the Eastside throughout the Energize Eastside planning process. (see figure below). PSE has a history of changing methods and planning standards when justifying capital expenditures, e.g., peaking power plants. In the 2015 Integrated Resource Plan, PSE changed their planning standard, which led to an increase in 2021 peak load of 351 MW. Figure 1 below summarizes the source and the estimate of peak load reduction required to meet Eastside load requirement.Figure 2: Range of Estimates for Eastside Peak Load increase through 2024 Source 2024 Date of
SourcePage
E3 Non-Wires Study 70 MW Oct 2014
Quanta - Eastside Needs Assessment 123 Apr 2015 Page 19
Stantec Review Memo (referenced in EIS)
133 July 2015 Page 1-7 Draft EIS
PSE 2015 IRP 166 Jan 2016 IRP Ch.5 page 31
Draft EIS (2016) 205 Jun 2015 EIS Page 2-34
* Assumes peak load after planned baseline energy conservation
The Draft EIS discusses 205MW non-transmission resources needed by 2024, which is a likely mistake. This value stems from an email from Jens Nedrud, Energize Eastside project manager, where he explains that the amount of conservation required to be equivalent to transmission capacity is 205 MW. Mr. Nedrud only mentions conservation, not other DER. Mr. Nedrud is the project manager for Energize Eastside, so estimates from him should be questioned.
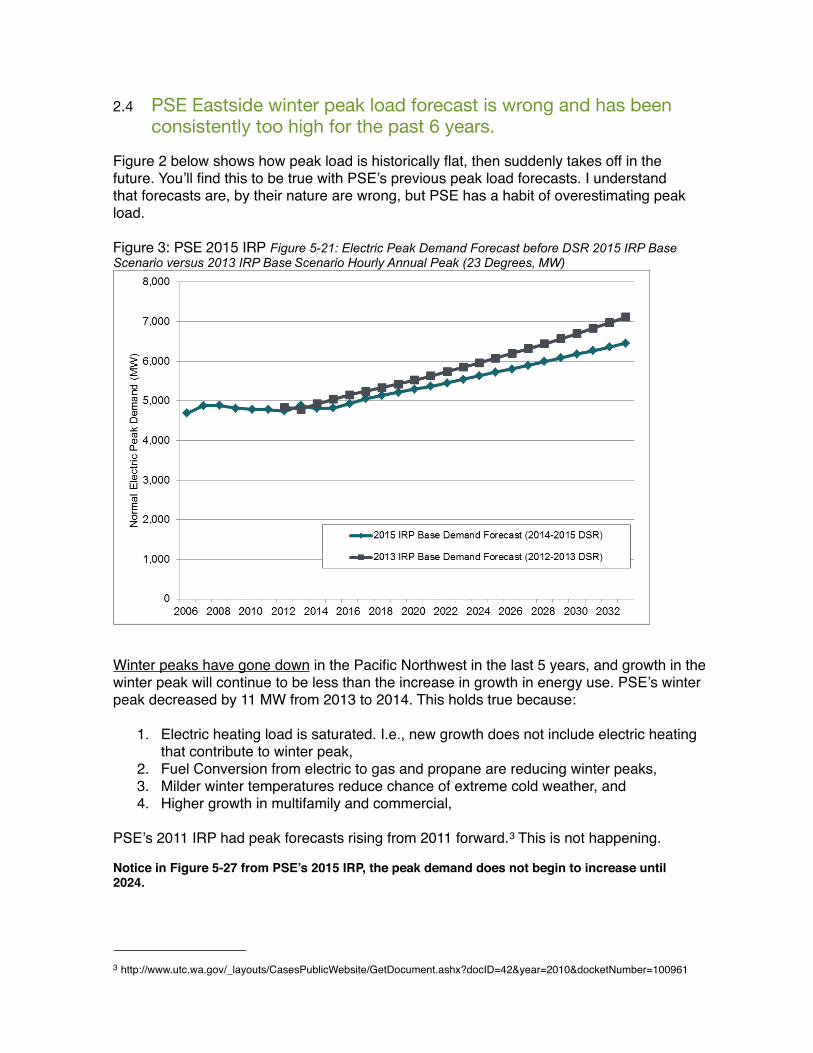
2.4 PSE Eastside winter peak load forecast is wrong and has been consistently too high for the past 6 years.
Figure 2 below shows how peak load is historically flat, then suddenly takes off in the future. You’ll find this to be true with PSE’s previous peak load forecasts. I understand that forecasts are, by their nature are wrong, but PSE has a habit of overestimating peak load.
Figure 3: PSE 2015 IRP Figure 5-21: Electric Peak Demand Forecast before DSR 2015 IRP Base Scenario versus 2013 IRP Base Scenario Hourly Annual Peak (23 Degrees, MW)
Winter peaks have gone down in the Pacific Northwest in the last 5 years, and growth in the winter peak will continue to be less than the increase in growth in energy use. PSE’s winter peak decreased by 11 MW from 2013 to 2014. This holds true because:
1. Electric heating load is saturated. I.e., new growth does not include electric heating that contribute to winter peak,
2. Fuel Conversion from electric to gas and propane are reducing winter peaks,3. Milder winter temperatures reduce chance of extreme cold weather, and4. Higher growth in multifamily and commercial,
PSE’s 2011 IRP had peak forecasts rising from 2011 forward.3 This is not happening.
Notice in Figure 5-27 from PSE’s 2015 IRP, the peak demand does not begin to increase until 2024.
3 http://www.utc.wa.gov/_layouts/CasesPublicWebsite/GetDocument.ashx?docID=42&year=2010&docketNumber=100961
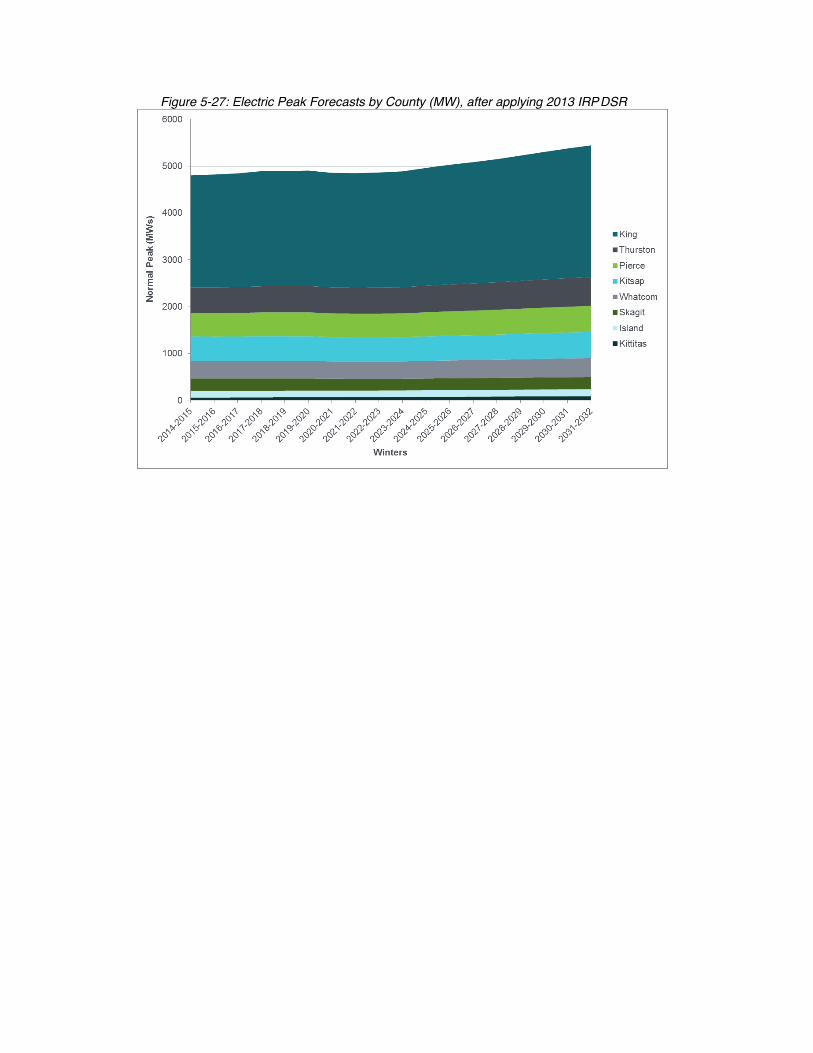
Figure 5-27: Electric Peak Forecasts by County (MW), after applying 2013 IRP DSR
3 Other Points on EIS Alternative 2
3.1 PSE local needs assessment is not a local causePSE has suggested the transmission need is based on local winter peak demand on the eastside. This is only a small part of the story. The issue arises by modeling a series of unlikely regional wholesale power scenarios (e.g., plants offline, Canadian imports, transmission line outages, and high winter peak demand) that creates: 1) high winter power flows South to North through the PSE’s eastside transmission corridor, and 2) increased loads on eastside substations. These modeled events would lead to equipment exceeding their thermal limits and the need to shed load at substations or limit power flow on the PSE 115kV system through eastside.
Based on the 2012 Memorandum of Agreement between PSE, Seattle City Light (SCL), and BPA, PSE has agreed to provide expanded transmission service through Puget Sound Area. SCL agreed to projects that would limit flow through their system by placing series inductors at two of their substations. This demonstrates that the issue and needs are indeed a regional one, not just local
This local problem, if it were ever to occur, would happen for a few hours of the year during extreme cold days and hours of peak load on eastside. The EIS extreme scenarios suggest up to 13 days this could occur, but does not forecast number of hours. Given PSE’s winter peak is in morning (8am) or evening (6pm) The load reduction would need to be for a few hours during these times. EQL’s experience suggests that the winter peaks come in 2-3 day consecutive days (cold snaps) and last maybe one to two hours per day.
According to EIS scenarios, in 2026 eastside load will need to shed 133MW to accommodate flows to Canada over PSE 115kV system.
Another troubling area is how PSE attributed winter peak demand reductions to forecasted energy efficiency measures. It is impossible to determine how PSE and its contractors did this conversion. However, EQL Energy is familiar with the issue that load shapes used in the Pacific Northwest to attribute capacity reductions from energy efficiency are inaccurate and out of date. Some end use load shapes (ELCAP) date back to the 1980s. The topic of inaccurate load shapes and hence capacity contribution of energy efficiency has been consistently discussed and agreed upon by the Northwest Power and Planning Council, as well as the Regional Technical Forum on energy efficiency.
3.1.1 The Problem – several days and a few hours in the winter
The problem PSE has identified in their Energize Eastside proposal comes about through a series of unlikely events that lead to high winter power flows South to North through the Eastside and creates overloads on certain substations. This problem, if it were ever to occur, would only happen for a few hours of the year. PSE has not estimated the number of hours because the scenarios and stress cases they use don’t
lend themselves to firm estimates. If PSE could estimate the number of hours they would need winter peak demands to be reduced, it likely would come in 2-3 day consecutive days (cold snaps) and last maybe one to two hours per day.
If Energize Eastside or one of the alternatives were not to be pursued, power outages would not be imminent during these peak demand hours unless at least three failures occur in the grid, a scenario that exceeds NERC reliability requirements. The total number of customers affected by these unlikely outages would be 3 to 5 percent of the 1.1 million customers that will pay for the project with higher electricity bills for the next 40 years.
3.1.2 The DER Solution
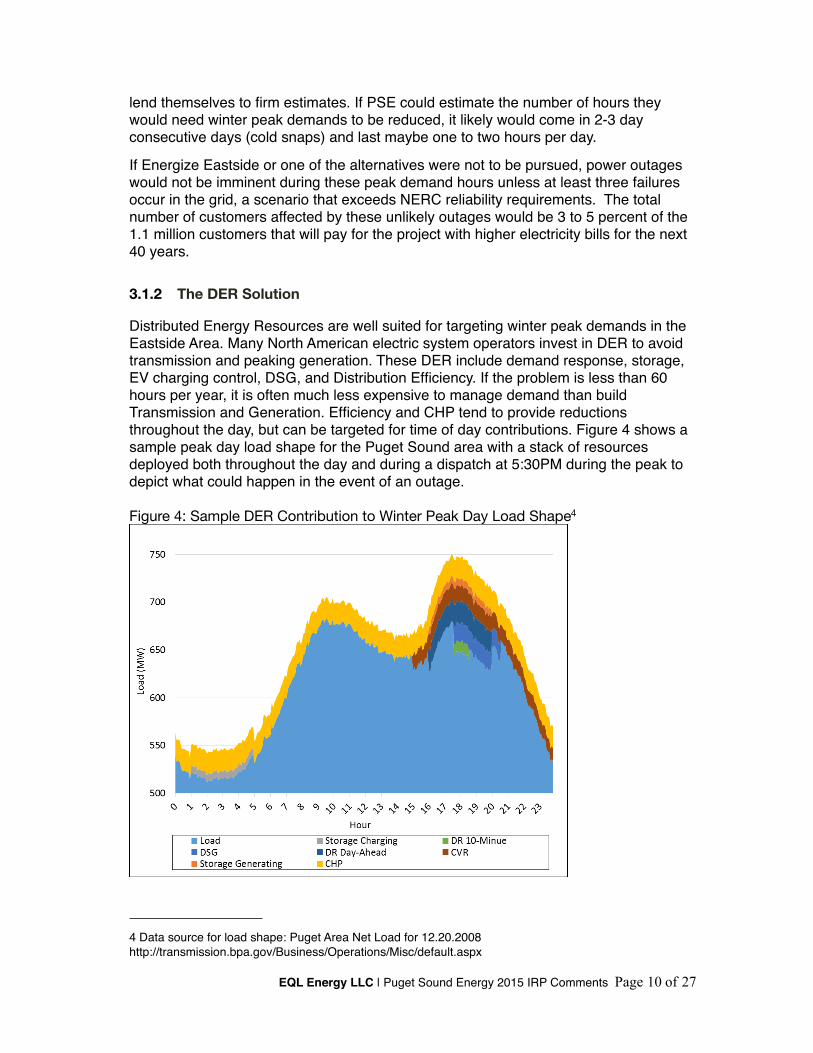
Distributed Energy Resources are well suited for targeting winter peak demands in the Eastside Area. Many North American electric system operators invest in DER to avoid transmission and peaking generation. These DER include demand response, storage, EV charging control, DSG, and Distribution Efficiency. If the problem is less than 60 hours per year, it is often much less expensive to manage demand than build Transmission and Generation. Efficiency and CHP tend to provide reductions throughout the day, but can be targeted for time of day contributions. Figure 4 shows a sample peak day load shape for the Puget Sound area with a stack of resources deployed both throughout the day and during a dispatch at 5:30PM during the peak to depict what could happen in the event of an outage.
Figure 4: Sample DER Contribution to Winter Peak Day Load Shape4
EQL Energy LLC | Puget Sound Energy 2015 IRP Comments Page 10 of 27
4 Data source for load shape: Puget Area Net Load for 12.20.2008http://transmission.bpa.gov/Business/Operations/Misc/default.aspx
* This is not an Eastside area load shape, but is representative of typical winter peak load patterns for NW utilities.
3.2 PSE lags rest of country in DER Utilities like Puget Sound Energy are way behind other areas of the country in investing in DER, especially demand response. For example, the rest of North America relies on over 60,000MW of demand response, and has eliminated billions of dollars of investments in peaking generation and transmission. The Northwest Power and Conservation Council in their recently released 7th Power Plan, identified 4,300 megawatts of regional demand response potential. PSE currently has no demand response resources it can rely upon.
One example of a DER approach to avoiding transmission project is New York’s Brooklyn-Queens demand management project.5 Growth began to occur in this area from gentrification and employment growth. The utility ConEd estimated the cost to meet this growth would require a $1Billion investment in expanded transmission and substation capacity. In 2014 the Public Service Commission approved the Brooklyn/Queens Demand Management program to invest up to $200MM to avoid the larger infrastructure costs.
The Northwest is not new to Non-Wire Alternatives. In the 1990s BPA was considering transmission across the Cascades to support Puget Sound Area growth and reliability. The transmission cost assessment led to a plan that included aggressive demand side resources in Puget Sound Area, and use of series capacitors for voltage support. These lower cost alternatives deferred the project to the point of never being built.
3.3 EIS Impacts of Alt 2The negative impacts of Alternative 2 were primarily associated with peaking generation and storage located on the Eastside, and relate to land and greenhouse gas (GHG) emissions.
EQL Energy, however, is not suggesting any new reciprocating engines, or peaking power units as part of EIS Alt. 2. We would expect primarily Combined Heat and Power (CHP) to be constructed in this alternative. CHP often uses biomass/biogas as well as natural gas, and would contribute to GHG, or could have noise impact. CHP has the benefit of also being “energy efficient” because the low value heat is used in industrial or commercial processes. Puget Sound Area has examples of CHP, e.g.,
a. Renton, WA South Treatment Plant that can produce up to 8MW of power. 6
b. Seattle, WA Enwave Seattle uses biomass and natural gas to produce 50 MW of electricity, and 35 MW of heat equivalent.
EQL Energy LLC | Puget Sound Energy 2015 IRP Comments Page 11 of 27
5 http://www.neep.org/file/2414/download?token=bNV2vVea, http://documents.dps.ny.gov/public/Common/ViewDoc.aspx?DocRefId=%7B83594C1C-51E2-4A1A-9DBB-5F15BCA613A2%7D
6 http://www.kingcounty.gov/services/environment/wastewater/resource-recovery/Energy/Renewable/cogen.aspx
c. Univ. of Washington has 5MW natural gas CHP
CHP would require capacity on natural gas infrastructure.
A Dispatchable Standby Generation (DSG) program would have to go through air permitting compliance, but it is a permittable use. PSCleanAir has suggested that a DSG program like PGE would follow EPA NESHAP RICE rules.
EQL Energy would not recommend storage implementation as described in Alt. 2 of EIS. Six acres of storage does not make much sense. Energy storage highest value is utility owned and managed, yet behind the meter at a customer site. This means customers get backup and reliability, and utility can use for system issues, e.g., winter peak demands. This also avoids the 6 acres of storage containers suggested in the EIS draft (which is ridiculous). Fire and environmental authorities are becoming comfortable with both Li-ion and flow battery technology. PSE is working on a Li-ion storage system at Glacier. State of Washington is also granting $40MM to projects in grid modernization and storage.
Alt 2 would cost less than Alt 1 and provide secondary benefits to customers through improved reliability and resiliency.
Alt 2 would have less risk during weather and natural disasters. DERs would provide backup power during intermediate or sustained outage.
3.4 Alt 2 works with PSE Economic Study of Flexible AC Transmission (FACTS).
Flexible AC Transmission systems on high voltage lines would protect PSE transmission facilities from reaching thermal limits while providing required service to loads. Combining this alternative with appropriately procured and analyzed DER provides a good alternative in Draft EIS.
See PSE Economic Study request at link below.
http://www.oasis.oati.com/PSEI/PSEIdocs/Oct_31_PSET_Economic_Study_Request_from_EQL.PDF
4 Alternative 2 Issue DetailsIn estimating Non-Wires Alternatives (NWA) like Alternative 2, PSE and its contractors have miscalculated both the technical and cost effective potential for DER in the Eastside area. They have used outdated information and methods, overestimated winter peak demand, improperly calculated “cost effectiveness”, and have not considered forecasts of technology cost and performance improvements.
EQL Energy LLC | Puget Sound Energy 2015 IRP Comments Page 12 of 27
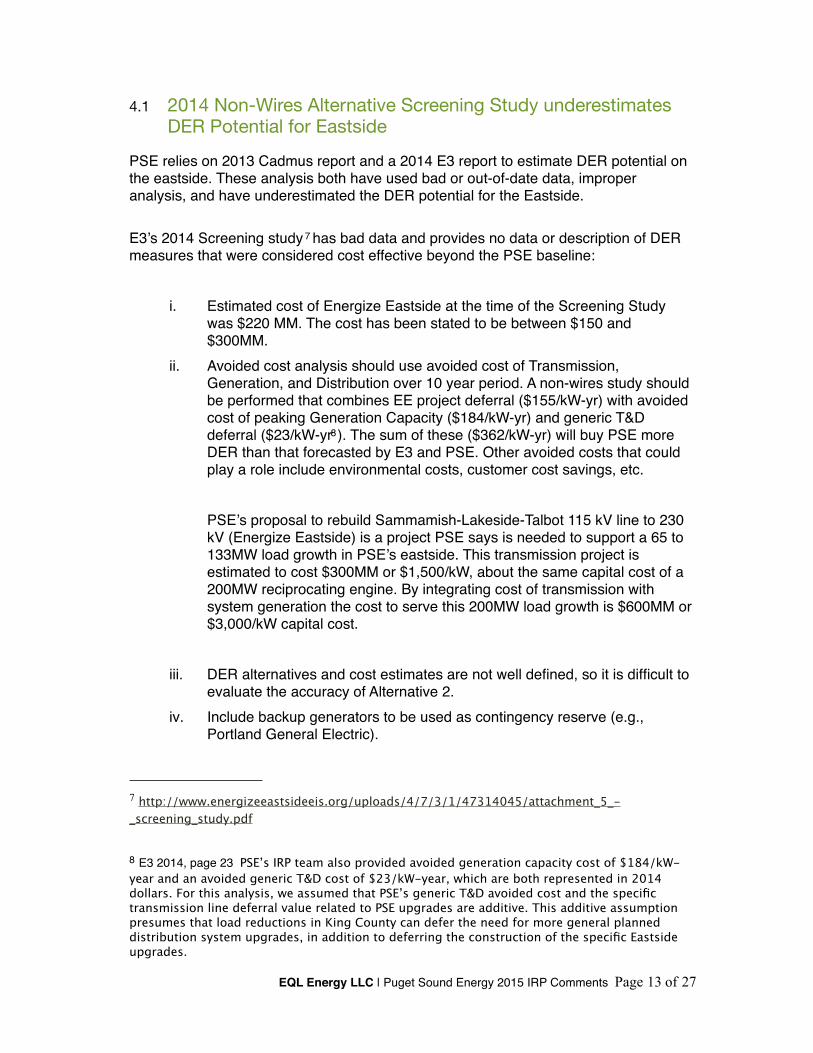
4.1 2014 Non-Wires Alternative Screening Study underestimates DER Potential for Eastside
PSE relies on 2013 Cadmus report and a 2014 E3 report to estimate DER potential on the eastside. These analysis both have used bad or out-of-date data, improper analysis, and have underestimated the DER potential for the Eastside.
E3’s 2014 Screening study 7 has bad data and provides no data or description of DER measures that were considered cost effective beyond the PSE baseline:
i. Estimated cost of Energize Eastside at the time of the Screening Study was $220 MM. The cost has been stated to be between $150 and $300MM.
ii. Avoided cost analysis should use avoided cost of Transmission, Generation, and Distribution over 10 year period. A non-wires study should be performed that combines EE project deferral ($155/kW-yr) with avoided cost of peaking Generation Capacity ($184/kW-yr) and generic T&D deferral ($23/kW-yr8). The sum of these ($362/kW-yr) will buy PSE more DER than that forecasted by E3 and PSE. Other avoided costs that could play a role include environmental costs, customer cost savings, etc.
PSE’s proposal to rebuild Sammamish-Lakeside-Talbot 115 kV line to 230 kV (Energize Eastside) is a project PSE says is needed to support a 65 to 133MW load growth in PSE’s eastside. This transmission project is estimated to cost $300MM or $1,500/kW, about the same capital cost of a 200MW reciprocating engine. By integrating cost of transmission with system generation the cost to serve this 200MW load growth is $600MM or $3,000/kW capital cost.
iii. DER alternatives and cost estimates are not well defined, so it is difficult to evaluate the accuracy of Alternative 2.
iv. Include backup generators to be used as contingency reserve (e.g., Portland General Electric).
EQL Energy LLC | Puget Sound Energy 2015 IRP Comments Page 13 of 27
7 http://www.energizeeastsideeis.org/uploads/4/7/3/1/47314045/attachment_5_-_screening_study.pdf
8 E3 2014, page 23 PSE’s IRP team also provided avoided generation capacity cost of $184/kW-year and an avoided generic T&D cost of $23/kW-year, which are both represented in 2014 dollars. For this analysis, we assumed that PSE’s generic T&D avoided cost and the specific transmission line deferral value related to PSE upgrades are additive. This additive assumption presumes that load reductions in King County can defer the need for more general planned distribution system upgrades, in addition to deferring the construction of the specific Eastside upgrades.
v. Storage is quickly becoming more cost effective and accepted as an alternative to T&D investments.
Recommendation. PSE should redo DSR, DR, and DER forecasts on Eastside using all levelized costs, including transmission (e.g., Energize Eastside), distribution, and supply-side resource alternatives. This will undoubtedly increase the amount of DSR and DER PSE has forecasted in the Draft IRP.
2016 PSE all source RFP. In 2016 PSE is expected to issue an all source RFP for distributed resources. WUTC should ensure that the avoided cost for resources in the Eastside accurately reflect all avoided costs, e.g., transmission, generation, distribution, customer benefits, environmental costs, etc. Through needs assessment of Energize Eastside, PSE’s Eastside zone needs winter capacity resources to address transmission congestion and reliability by 2018. The IRP analysis supports addition of further distributed energy resources by 2021.
4.1.1 Defining distribution located resources
PSE should move away from current categories of distribution-side resources towards resource descriptions that meet utility requirements (energy, capacity, reserves, etc). As mentioned above these requirements need better descriptions than just MW and aMW. These requirements need amount, duration, time of day/season, etc.. The distribution located resources PSE has used 3 categories of distribution located resources seen in Cadmus report 2014:9
1. DSR, Demand Side Resources, energy efficiency. (which uses bad estimates for peak demand reductions (MW)
2. DR, demand-responsea. Residential DLC- Water Heatb. Residential DLC – Space and Water heatc. Residential Critical Peak Pricing (CPP)d. C&I CPPe. C&I Load Curtailment
3. DG, distributed generation, solar
Figure 5 is suggests a better way to describe all distribution level resources. This categorization allows planners to place different values on a resource based on its quality and location. For instance, getting dispatchable capacity for winter peaks is more valuable ($/kW-year) than non-dispatchable capacity.
EQL Energy LLC | Puget Sound Energy 2015 IRP Comments Page 14 of 27
9 https://pse.com/aboutpse/EnergySupply/Documents/IRPAG_Cadmus_presentation_2014-12-08.pdf
Figure 5: EQL Categories of Distributed Energy Resources
4.2 Energy Efficiency contribution to peak demand reductions underestimated
PSE and its consultants use end use load shapes that are out of date to calculated peak demand reduction from energy efficiency programs. Many of these load shapes are based on end uses and technologies from the 1980s. This leads to lower peak reduction (MW) per unit of energy efficiency (MWh). The Northwest Power and Conservation Council has been building a business case to update these load shapes, and is expected to pursue this work in 2016.10
4.3 Puget Sound DER and DSR avoided Cross-Cascades Transmission in 1990s
In the 1990s BPA was considering transmission across the Cascades to support Puget Sound Area growth and reliability. The transmission cost assessment led to a plan that included aggressive demand side resources in and use of series capacitors for voltage support. These lower cost alternatives deferred the project to the point of never being built.DER, when cost of Transmission is considered, will increase dramatically. Estimates in Figure 2 below are estimates based on EQL estimates from WECC and NPCC forecasts.
EQL Energy LLC | Puget Sound Energy 2015 IRP Comments Page 15 of 27
10 http://rtf.nwcouncil.org/subcommittees/enduseload/
4.4 Western electricity marketsOn March 5, 2015, PSE announced it would participate in the California ISO energy imbalance market that will provide imbalance energy via locational marginal pricing. This decision by PSE management to participate in EIM, demonstrates that PSE believes in a planning and operational paradigm that explicitly recognizes locational value of generating and demand-side resources.
PSE participation in Western energy imbalance market will allow better management of existing transmission assets to existing generation and load balance. In Energize Eastside assessment, PSE has not considered the operational improvements that will exist for generation, demand management, and DER.
PSE joining the EIM does not have much effect on capacity procurement, except a possible reduction in flexibility requirement for resources.
5 Assessment of Eastside DER PotentialEQL Energy expects PSE could add over 160MW of capacity to Eastside DSR forecast by 2021. below. Using an Avoided Cost analysis that includes avoiding cost of Transmission, Distribution, and supply-side generation should include:
Capital Cost ($/kW)! ! $1,500/kW ! TransmissionCapital Cost ($/kW)! ! $1,500/kW! Thermal Resource (e.g., Peaker) Capital Cost ($/kW-yr)!$31.00!! DistributionO&M Fixed $/kW-yr! ! $10.55O&M Variable $/MWh!! $2.96
5.1 DSR and DER Contribution
The terminology around resources on the distribution side can be confusing. PSE uses DSR or demand side resources, which includes energy efficiency, demand response, and distributed generation. The EE Documents we reviewed focus on energy efficiency and do not fully address DSR and its impact on peak capacity (MW). Analysis that is reported in Annual Average Megawatts (aMW) provides limited useful information for analyzing for transmission and distribution infrastructure needs.
In our report, we distinguish between DSR and DER forecasts and work to not double count resources.
DSR – Demand Side Resources: efficiency, demand response, and distributed generation (detail and types are unknown in PSE EE analysis). Cadmus 2013 IRP DSR
EQL Energy LLC | Puget Sound Energy 2015 IRP Comments Page 16 of 27
assessment does not include kW or peak contribution, nor do they provide DR assessments.DER – Distributed Energy Resources: EQL uses this term to refer to all resources on the distribution system, including distribution efficiency (CVR and power factor correction), demand response, combined heat and power, dispatchable standby generation, and storage.11
DER and load management in critical areas is an opportunity to invest in measures that address infrastructure costs and regional load growth while engaging and benefitting customers, just like energy efficiency. Through the evaluation of Energize Eastside it is unclear the extent to which PSE has considered the use of distributed energy resources (DER) in their modeling, either as a resource or as a means to reduce load. The DER resources described below should be considered in addition to the PSE’s DSR contribution to the 100% conservation load forecast.Many of these DERs are dispatchable, including demand response, dispatchable standby generation (DSG), and energy storage and can therefore target peak load and reduce the need for infrastructure expansion in transmission and distribution.
5.1.1 Distributed Resource Planning
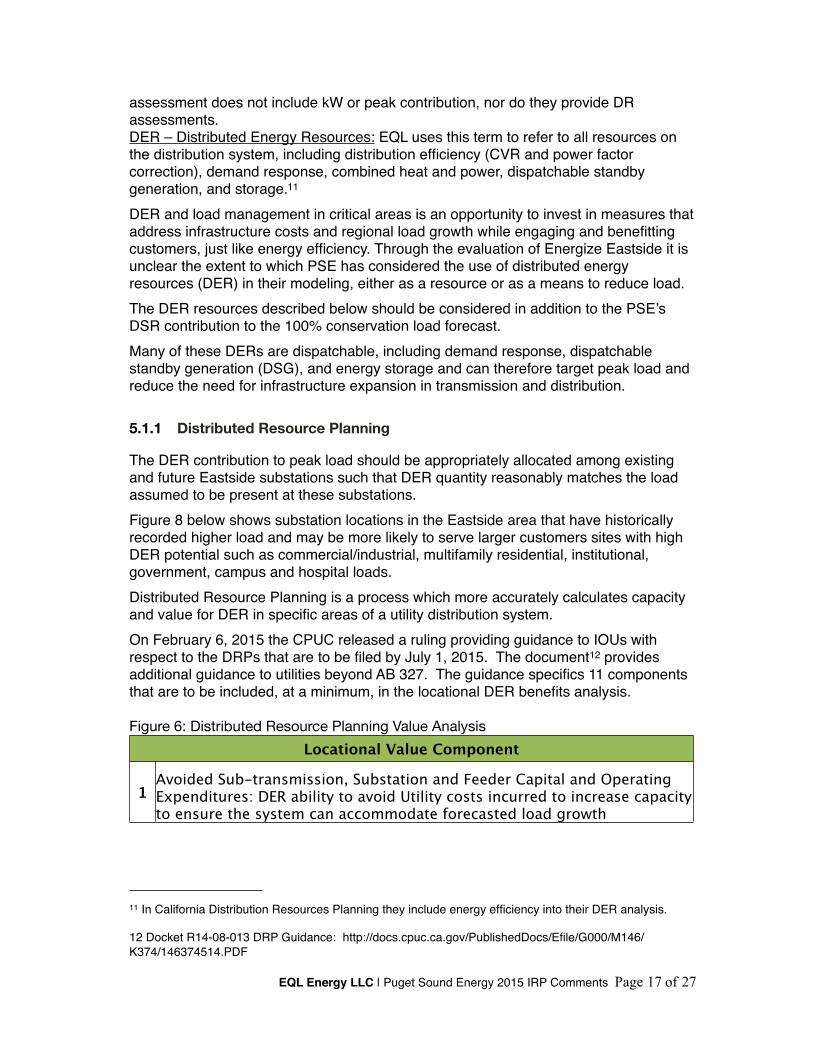
The DER contribution to peak load should be appropriately allocated among existing and future Eastside substations such that DER quantity reasonably matches the load assumed to be present at these substations.Figure 8 below shows substation locations in the Eastside area that have historically recorded higher load and may be more likely to serve larger customers sites with high DER potential such as commercial/industrial, multifamily residential, institutional, government, campus and hospital loads. Distributed Resource Planning is a process which more accurately calculates capacity and value for DER in specific areas of a utility distribution system.On February 6, 2015 the CPUC released a ruling providing guidance to IOUs with respect to the DRPs that are to be filed by July 1, 2015. The document12 provides additional guidance to utilities beyond AB 327. The guidance specifics 11 components that are to be included, at a minimum, in the locational DER benefits analysis.
Figure 6: Distributed Resource Planning Value AnalysisLocational Value ComponentLocational Value Component
1Avoided Sub-transmission, Substation and Feeder Capital and Operating Expenditures: DER ability to avoid Utility costs incurred to increase capacity to ensure the system can accommodate forecasted load growth
EQL Energy LLC | Puget Sound Energy 2015 IRP Comments Page 17 of 27
11 In California Distribution Resources Planning they include energy efficiency into their DER analysis.
12 Docket R14-08-013 DRP Guidance: http://docs.cpuc.ca.gov/PublishedDocs/Efile/G000/M146/K374/146374514.PDF
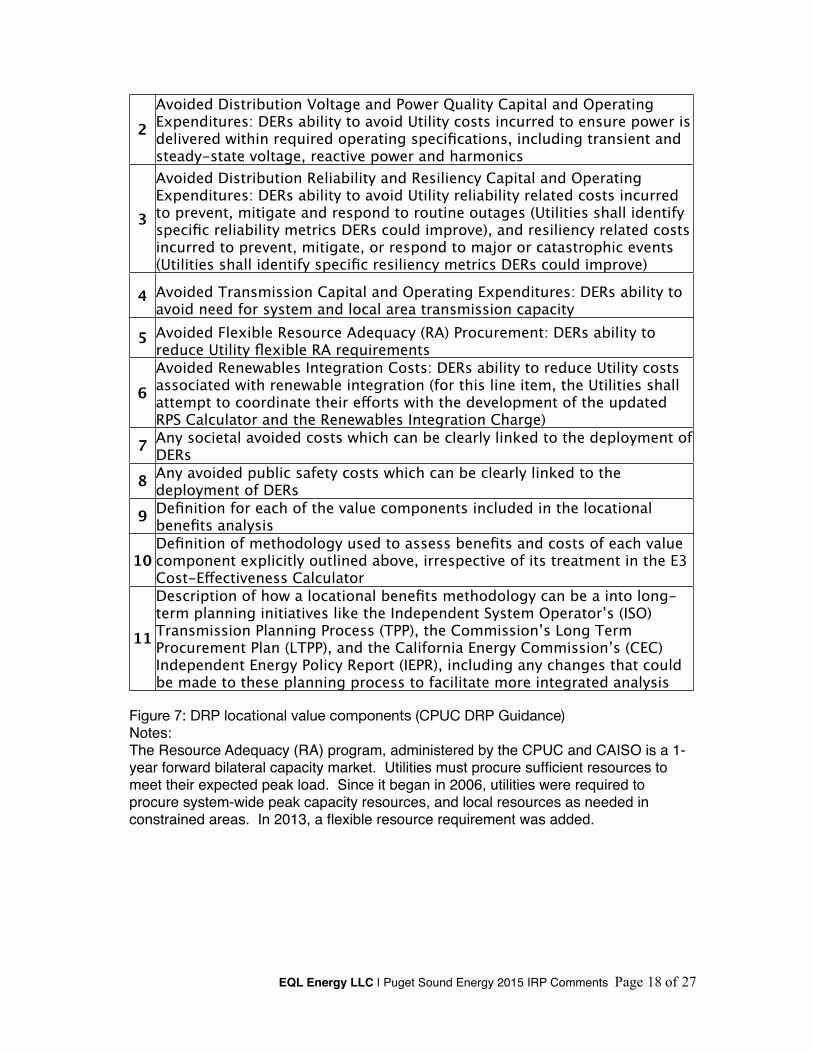
2Avoided Distribution Voltage and Power Quality Capital and Operating Expenditures: DERs ability to avoid Utility costs incurred to ensure power is delivered within required operating specifications, including transient and steady-state voltage, reactive power and harmonics
3
Avoided Distribution Reliability and Resiliency Capital and Operating Expenditures: DERs ability to avoid Utility reliability related costs incurred to prevent, mitigate and respond to routine outages (Utilities shall identify specific reliability metrics DERs could improve), and resiliency related costs incurred to prevent, mitigate, or respond to major or catastrophic events (Utilities shall identify specific resiliency metrics DERs could improve)
4 Avoided Transmission Capital and Operating Expenditures: DERs ability to avoid need for system and local area transmission capacity
5 Avoided Flexible Resource Adequacy (RA) Procurement: DERs ability to reduce Utility flexible RA requirements
6Avoided Renewables Integration Costs: DERs ability to reduce Utility costs associated with renewable integration (for this line item, the Utilities shall attempt to coordinate their efforts with the development of the updated RPS Calculator and the Renewables Integration Charge)
7 Any societal avoided costs which can be clearly linked to the deployment of DERs
8 Any avoided public safety costs which can be clearly linked to the deployment of DERs
9 Definition for each of the value components included in the locational benefits analysis
10Definition of methodology used to assess benefits and costs of each value component explicitly outlined above, irrespective of its treatment in the E3 Cost-Effectiveness Calculator
11
Description of how a locational benefits methodology can be a into long-term planning initiatives like the Independent System Operator’s (ISO) Transmission Planning Process (TPP), the Commission’s Long Term Procurement Plan (LTPP), and the California Energy Commission’s (CEC) Independent Energy Policy Report (IEPR), including any changes that could be made to these planning process to facilitate more integrated analysis
Figure 7: DRP locational value components (CPUC DRP Guidance)Notes:The Resource Adequacy (RA) program, administered by the CPUC and CAISO is a 1-year forward bilateral capacity market. Utilities must procure sufficient resources to meet their expected peak load. Since it began in 2006, utilities were required to procure system-wide peak capacity resources, and local resources as needed in constrained areas. In 2013, a flexible resource requirement was added.
EQL Energy LLC | Puget Sound Energy 2015 IRP Comments Page 18 of 27
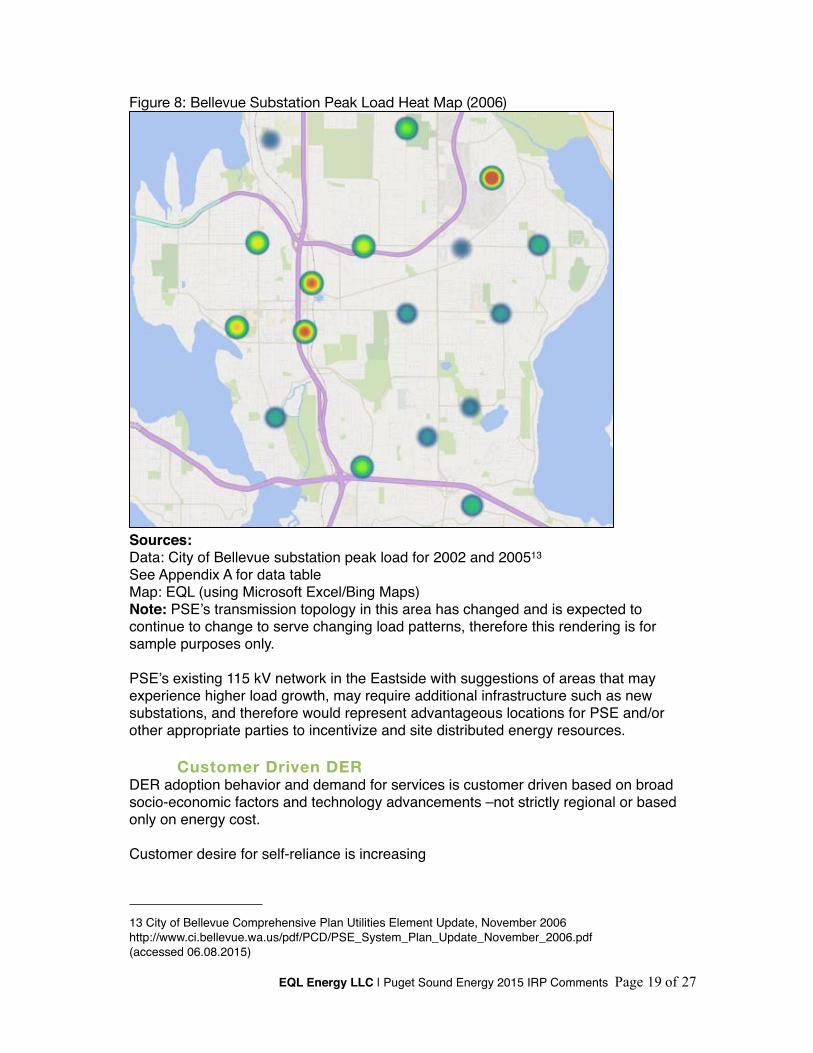
Figure 8: Bellevue Substation Peak Load Heat Map (2006)
Sources:Data: City of Bellevue substation peak load for 2002 and 200513 See Appendix A for data tableMap: EQL (using Microsoft Excel/Bing Maps)Note: PSE’s transmission topology in this area has changed and is expected to continue to change to serve changing load patterns, therefore this rendering is for sample purposes only.
PSE’s existing 115 kV network in the Eastside with suggestions of areas that may experience higher load growth, may require additional infrastructure such as new substations, and therefore would represent advantageous locations for PSE and/or other appropriate parties to incentivize and site distributed energy resources.
Customer Driven DERDER adoption behavior and demand for services is customer driven based on broad socio-economic factors and technology advancements –not strictly regional or based only on energy cost.
Customer desire for self-reliance is increasing
EQL Energy LLC | Puget Sound Energy 2015 IRP Comments Page 19 of 27
13 City of Bellevue Comprehensive Plan Utilities Element Update, November 2006http://www.ci.bellevue.wa.us/pdf/PCD/PSE_System_Plan_Update_November_2006.pdf (accessed 06.08.2015)
• Ernst & Young: 33%of the multi-national firms are expected to meet a greater share of their energy needs through self-generation over the next five years
• Navigant: nearly 75% of surveyed residential customers have “concerns about the impact electricity costs have on their monthly budgets, and 63% are interested in managing energy used in their homes”
• Best Buy: 36% of residential customers desire to “financially and physically protect the home” (Home Safeguarding persona)
5.1.2 Distributed Solar
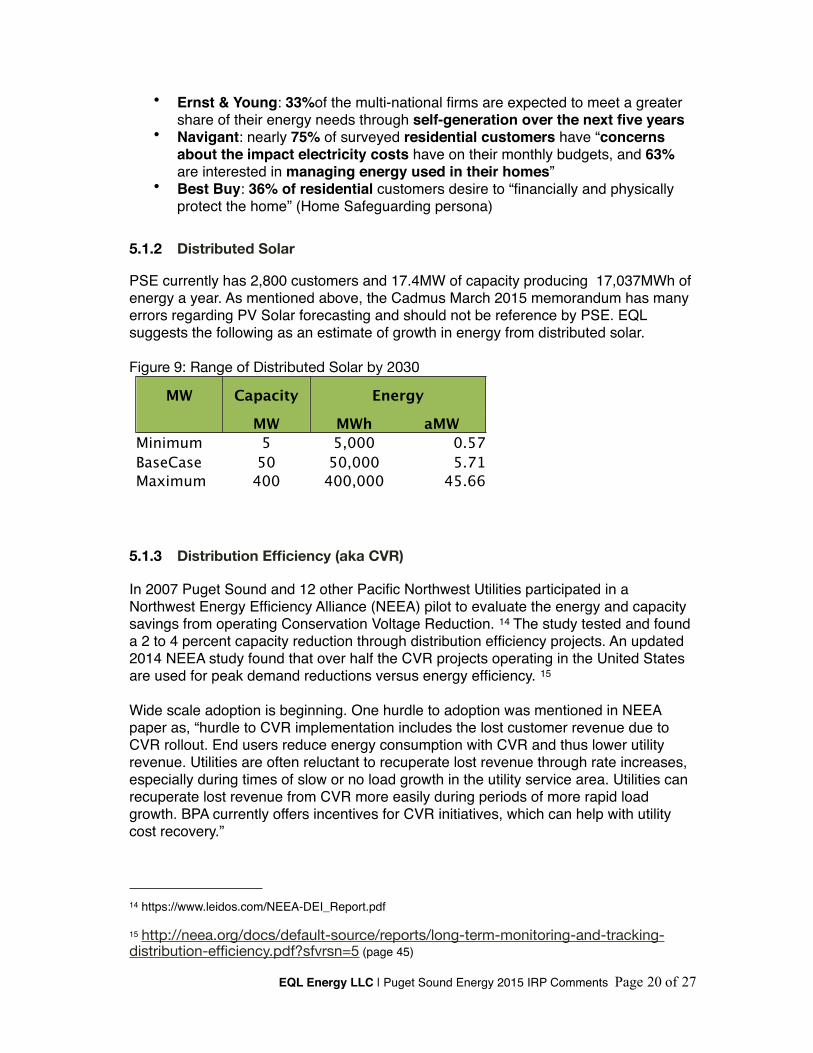
PSE currently has 2,800 customers and 17.4MW of capacity producing 17,037MWh of energy a year. As mentioned above, the Cadmus March 2015 memorandum has many errors regarding PV Solar forecasting and should not be reference by PSE. EQL suggests the following as an estimate of growth in energy from distributed solar.
Figure 9: Range of Distributed Solar by 2030
MW Capacity EnergyEnergy
MW MWh aMWMinimum 5 5,000 0.57 BaseCase 50 50,000 5.71 Maximum 400 400,000 45.66
5.1.3 Distribution Efficiency (aka CVR)
In 2007 Puget Sound and 12 other Pacific Northwest Utilities participated in a Northwest Energy Efficiency Alliance (NEEA) pilot to evaluate the energy and capacity savings from operating Conservation Voltage Reduction. 14 The study tested and found a 2 to 4 percent capacity reduction through distribution efficiency projects. An updated 2014 NEEA study found that over half the CVR projects operating in the United States are used for peak demand reductions versus energy efficiency. 15
Wide scale adoption is beginning. One hurdle to adoption was mentioned in NEEA paper as, “hurdle to CVR implementation includes the lost customer revenue due to CVR rollout. End users reduce energy consumption with CVR and thus lower utility revenue. Utilities are often reluctant to recuperate lost revenue through rate increases, especially during times of slow or no load growth in the utility service area. Utilities can recuperate lost revenue from CVR more easily during periods of more rapid load growth. BPA currently offers incentives for CVR initiatives, which can help with utility cost recovery.”
EQL Energy LLC | Puget Sound Energy 2015 IRP Comments Page 20 of 27
14 https://www.leidos.com/NEEA-DEI_Report.pdf
15 http://neea.org/docs/default-source/reports/long-term-monitoring-and-tracking-distribution-efficiency.pdf?sfvrsn=5 (page 45)
In Washington, Energy efficiency standard I-937 is currently a main driver for CVR implementation for IOUs in Washington State. I-937 mandates IOUs to undertake cost effective energy efficiency measures, such as CVR.
PSE has implemented Conservation Voltage Reduction (CVR) on three to six PSE substations before energy is sent to customers, thereby reducing customers’ electric power consumption at the point of consumption on the customers’ side of the meter.
CVR will be useful to PSE during winter peak load events due to the influence of resistive loads during those times. Reducing voltage is more effective for winter resistance heating load than for other types of load such as motors that experience greater use in summer for cooling loads.
CVR Target: 2.5% of peak load
5.1.4 Demand Response
By 2021 NPCC estimates the Pacific Northwest states will obtain between 600 and 1,080 MW (or 3%) of winter peak through demand response. At present, only a fraction of that quantity is operational. The Council is currently preparing their 7th power plan and has been working with regional utilities and industry stakeholders. 16
In a 2015 report for NPCC, Navigant estimates that by 2030 Northwest utilities will have achieved nearly 9% of winter peak load from demand response.
The estimated cumulative DR market potential for capacity programs represents nearly 9% of winter peak load by 2030. This estimate is in line with estimates of other DR potential studies conducted both in the Northwest and other parts of the country.17
Cadmus 2013 DSR report for PSE IRP (page 7) suggests that by 2033 PSE could expect 4.7% of winter peak to be reduced by Demand Response. Cadmus (2013) is approximately half of Navigant (2015) winter peak reduction forecast.
Two types of DR are likely to be beneficial for eastside areas:1. Day-Ahead notification peak load reduction DR 2. Emergency 10-minute response DRBecause PSE identifies a peak load resource requirement for the Eastside, we have identified a need to study a demand response program to operate during these times, when PSE’s most expensive resources will likely be supplying power. DR programs are often cost effective when displacing this expensive generation, such as PSE’s peaking units in Whatcom County. When combined with the additional value of
EQL Energy LLC | Puget Sound Energy 2015 IRP Comments Page 21 of 27
16 https://www.nwcouncil.org/news/meetings/2015/06/
17 http://www.nwcouncil.org/media/7148943/npcc_assessing-dr-potential-for-seventh-power-plan_updated-report_1-19-15.pdf
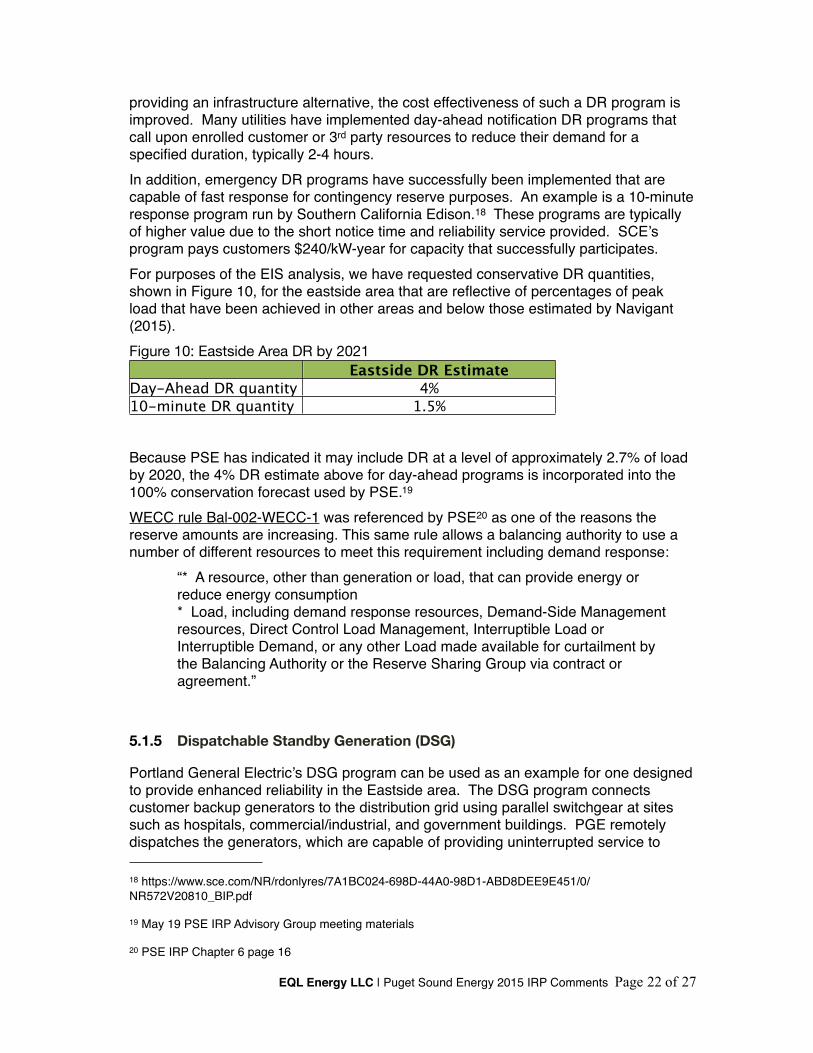
providing an infrastructure alternative, the cost effectiveness of such a DR program is improved. Many utilities have implemented day-ahead notification DR programs that call upon enrolled customer or 3rd party resources to reduce their demand for a specified duration, typically 2-4 hours.In addition, emergency DR programs have successfully been implemented that are capable of fast response for contingency reserve purposes. An example is a 10-minute response program run by Southern California Edison.18 These programs are typically of higher value due to the short notice time and reliability service provided. SCE’s program pays customers $240/kW-year for capacity that successfully participates.For purposes of the EIS analysis, we have requested conservative DR quantities, shown in Figure 10, for the eastside area that are reflective of percentages of peak load that have been achieved in other areas and below those estimated by Navigant (2015). Figure 10: Eastside Area DR by 2021
Eastside DR EstimateDay-Ahead DR quantity 4%10-minute DR quantity 1.5%
Because PSE has indicated it may include DR at a level of approximately 2.7% of load by 2020, the 4% DR estimate above for day-ahead programs is incorporated into the 100% conservation forecast used by PSE.19
WECC rule Bal-002-WECC-1 was referenced by PSE20 as one of the reasons the reserve amounts are increasing. This same rule allows a balancing authority to use a number of different resources to meet this requirement including demand response:
“* A resource, other than generation or load, that can provide energy orreduce energy consumption* Load, including demand response resources, Demand-Side Managementresources, Direct Control Load Management, Interruptible Load orInterruptible Demand, or any other Load made available for curtailment bythe Balancing Authority or the Reserve Sharing Group via contract oragreement.”
5.1.5 Dispatchable Standby Generation (DSG)
Portland General Electric’s DSG program can be used as an example for one designed to provide enhanced reliability in the Eastside area. The DSG program connects customer backup generators to the distribution grid using parallel switchgear at sites such as hospitals, commercial/industrial, and government buildings. PGE remotely dispatches the generators, which are capable of providing uninterrupted service to
EQL Energy LLC | Puget Sound Energy 2015 IRP Comments Page 22 of 27
18 https://www.sce.com/NR/rdonlyres/7A1BC024-698D-44A0-98D1-ABD8DEE9E451/0/NR572V20810_BIP.pdf
19 May 19 PSE IRP Advisory Group meeting materials
20 PSE IRP Chapter 6 page 16
customers in the event of a grid outage. As part of the program, PGE invests in and owns some of the interconnection equipment, pays for fuel, and performs ongoing testing – required for units at many sites such as hospitals.
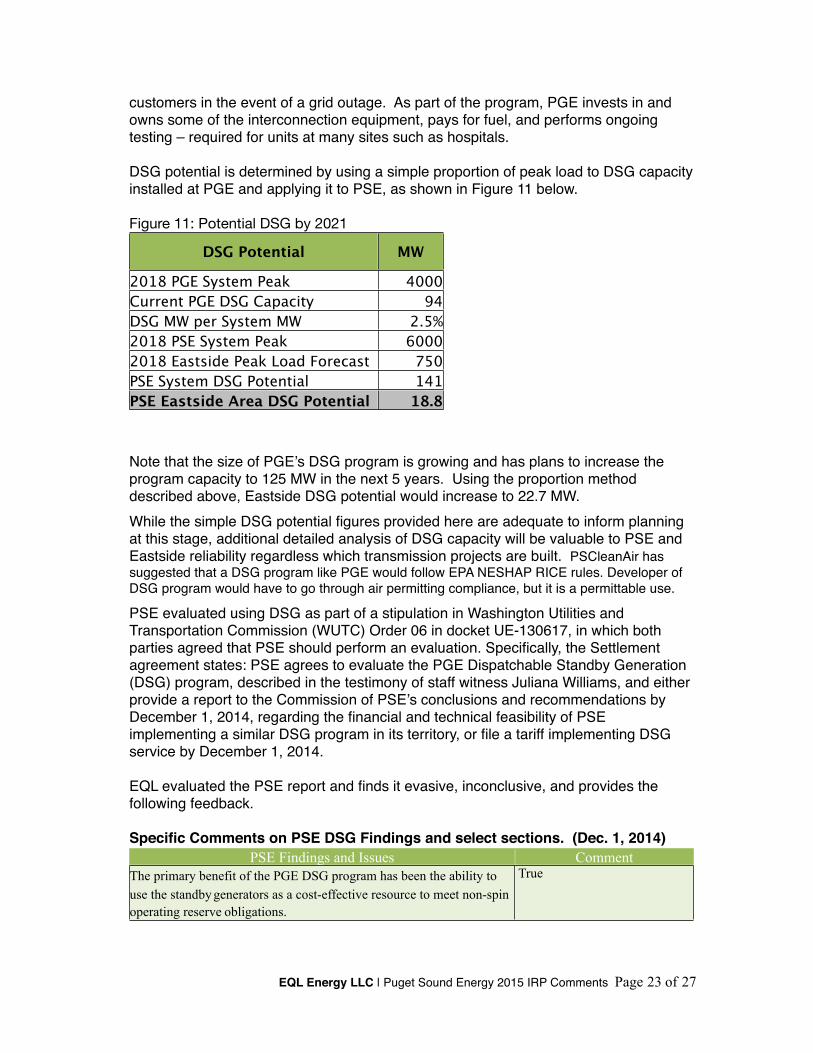
DSG potential is determined by using a simple proportion of peak load to DSG capacity installed at PGE and applying it to PSE, as shown in Figure 11 below.
Figure 11: Potential DSG by 2021
DSG Potential MW
2018 PGE System Peak 4000Current PGE DSG Capacity 94DSG MW per System MW 2.5%2018 PSE System Peak 60002018 Eastside Peak Load Forecast 750PSE System DSG Potential 141PSE Eastside Area DSG Potential 18.8
Note that the size of PGE’s DSG program is growing and has plans to increase the program capacity to 125 MW in the next 5 years. Using the proportion method described above, Eastside DSG potential would increase to 22.7 MW.While the simple DSG potential figures provided here are adequate to inform planning at this stage, additional detailed analysis of DSG capacity will be valuable to PSE and Eastside reliability regardless which transmission projects are built. PSCleanAir has suggested that a DSG program like PGE would follow EPA NESHAP RICE rules. Developer of DSG program would have to go through air permitting compliance, but it is a permittable use.
PSE evaluated using DSG as part of a stipulation in Washington Utilities and Transportation Commission (WUTC) Order 06 in docket UE-130617, in which both parties agreed that PSE should perform an evaluation. Specifically, the Settlement agreement states: PSE agrees to evaluate the PGE Dispatchable Standby Generation (DSG) program, described in the testimony of staff witness Juliana Williams, and either provide a report to the Commission of PSE’s conclusions and recommendations by December 1, 2014, regarding the financial and technical feasibility of PSE implementing a similar DSG program in its territory, or file a tariff implementing DSG service by December 1, 2014.
EQL evaluated the PSE report and finds it evasive, inconclusive, and provides the following feedback.
Specific Comments on PSE DSG Findings and select sections. (Dec. 1, 2014)PSE Findings and Issues Comment
The primary benefit of the PGE DSG program has been the ability to use the standby generators as a cost-effective resource to meet non-spin operating reserve obligations.
True
EQL Energy LLC | Puget Sound Energy 2015 IRP Comments Page 23 of 27
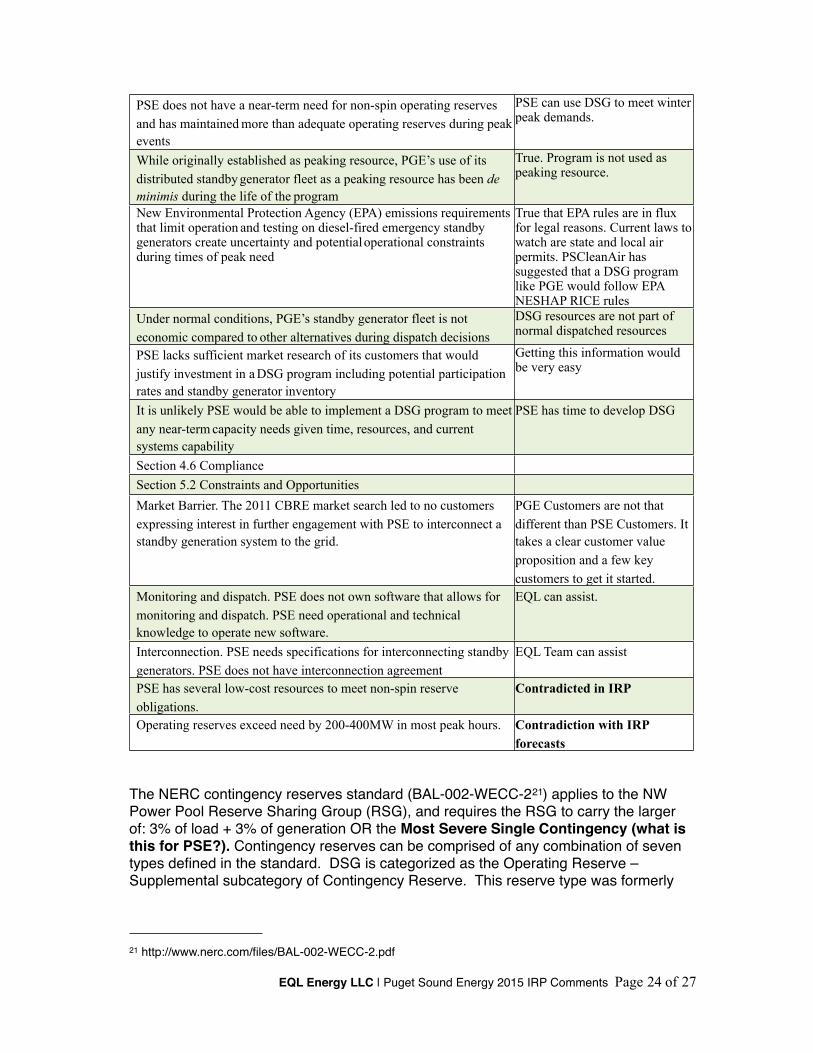
PSE does not have a near-term need for non-spin operating reserves and has maintained more than adequate operating reserves during peak events
PSE can use DSG to meet winter peak demands.
While originally established as peaking resource, PGE’s use of its distributed standby generator fleet as a peaking resource has been de minimis during the life of the program
True. Program is not used as peaking resource.
New Environmental Protection Agency (EPA) emissions requirements that limit operation and testing on diesel-fired emergency standby generators create uncertainty and potential operational constraints during times of peak need
True that EPA rules are in flux for legal reasons. Current laws to watch are state and local air permits. PSCleanAir has suggested that a DSG program like PGE would follow EPA NESHAP RICE rules
Under normal conditions, PGE’s standby generator fleet is not economic compared to other alternatives during dispatch decisions
DSG resources are not part of normal dispatched resources
PSE lacks sufficient market research of its customers that would justify investment in a DSG program including potential participation rates and standby generator inventory
Getting this information would be very easy
It is unlikely PSE would be able to implement a DSG program to meet any near-term capacity needs given time, resources, and current systems capability
PSE has time to develop DSG
Section 4.6 Compliance
Section 5.2 Constraints and Opportunities
Market Barrier. The 2011 CBRE market search led to no customers expressing interest in further engagement with PSE to interconnect a standby generation system to the grid.
PGE Customers are not that different than PSE Customers. It takes a clear customer value proposition and a few key customers to get it started.
Monitoring and dispatch. PSE does not own software that allows for monitoring and dispatch. PSE need operational and technical knowledge to operate new software.
EQL can assist.
Interconnection. PSE needs specifications for interconnecting standby generators. PSE does not have interconnection agreement
EQL Team can assist
PSE has several low-cost resources to meet non-spin reserve obligations.
Contradicted in IRP
Operating reserves exceed need by 200-400MW in most peak hours. Contradiction with IRP forecasts
The NERC contingency reserves standard (BAL-002-WECC-221) applies to the NW Power Pool Reserve Sharing Group (RSG), and requires the RSG to carry the larger of: 3% of load + 3% of generation OR the Most Severe Single Contingency (what is this for PSE?). Contingency reserves can be comprised of any combination of seven types defined in the standard. DSG is categorized as the Operating Reserve – Supplemental subcategory of Contingency Reserve. This reserve type was formerly
EQL Energy LLC | Puget Sound Energy 2015 IRP Comments Page 24 of 27
21 http://www.nerc.com/files/BAL-002-WECC-2.pdf
defined as Non-Spin reserve, but was changed to supplemental in the current standard to be inclusive of demand side management pursuant to FERC Order 740.22
E3 incorrectly ruled out DSG in their 2014 non-wires study for Energize Eastside. They wrote,
“The US Environmental Protection Agency (EPA) prohibits PSE from relying on customer-sited backup generation for peak shaving of utility loads for resource planning purposes, which PSE planners believe would prevent them from planning grid conditions that rely on backup generation to defer transmission upgrades. This regulation exists primarily to protect local air quality. Therefore, customer-sited backup generation was excluded from the DG non-wires potential estimates.”
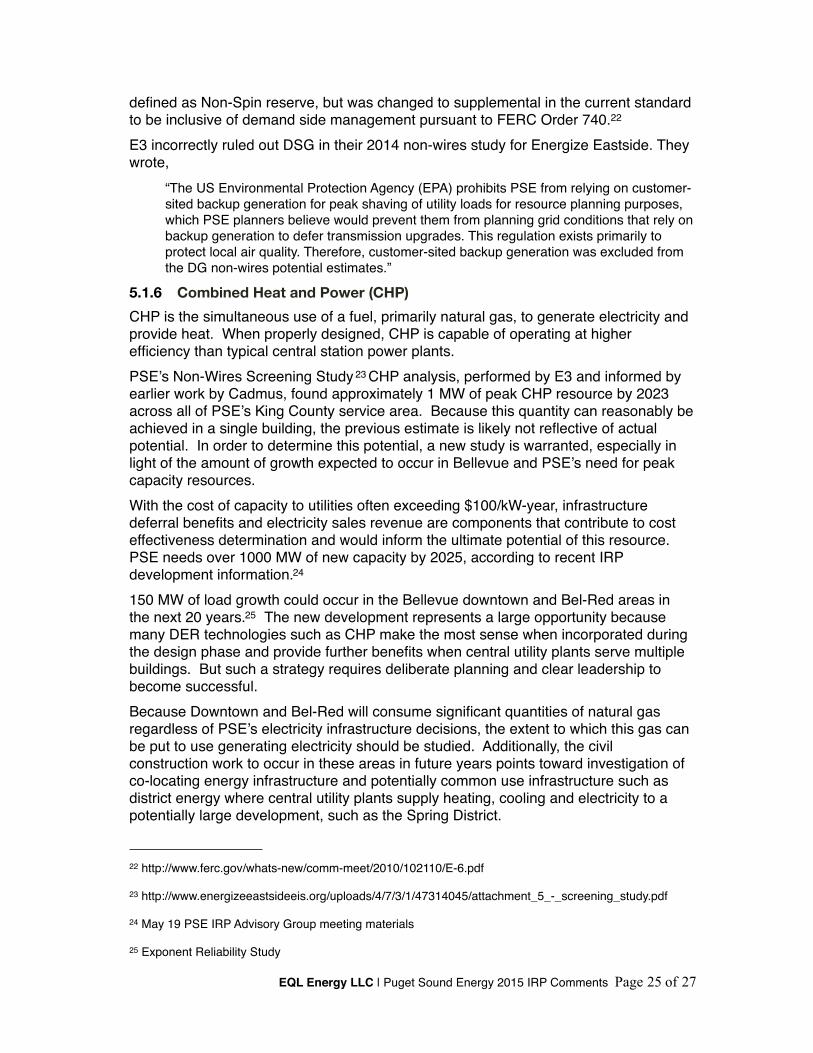
5.1.6 Combined Heat and Power (CHP)CHP is the simultaneous use of a fuel, primarily natural gas, to generate electricity and provide heat. When properly designed, CHP is capable of operating at higher efficiency than typical central station power plants.PSE’s Non-Wires Screening Study 23 CHP analysis, performed by E3 and informed by earlier work by Cadmus, found approximately 1 MW of peak CHP resource by 2023 across all of PSE’s King County service area. Because this quantity can reasonably be achieved in a single building, the previous estimate is likely not reflective of actual potential. In order to determine this potential, a new study is warranted, especially in light of the amount of growth expected to occur in Bellevue and PSE’s need for peak capacity resources. With the cost of capacity to utilities often exceeding $100/kW-year, infrastructure deferral benefits and electricity sales revenue are components that contribute to cost effectiveness determination and would inform the ultimate potential of this resource. PSE needs over 1000 MW of new capacity by 2025, according to recent IRP development information.24
150 MW of load growth could occur in the Bellevue downtown and Bel-Red areas in the next 20 years.25 The new development represents a large opportunity because many DER technologies such as CHP make the most sense when incorporated during the design phase and provide further benefits when central utility plants serve multiple buildings. But such a strategy requires deliberate planning and clear leadership to become successful. Because Downtown and Bel-Red will consume significant quantities of natural gas regardless of PSE’s electricity infrastructure decisions, the extent to which this gas can be put to use generating electricity should be studied. Additionally, the civil construction work to occur in these areas in future years points toward investigation of co-locating energy infrastructure and potentially common use infrastructure such as district energy where central utility plants supply heating, cooling and electricity to a potentially large development, such as the Spring District.
EQL Energy LLC | Puget Sound Energy 2015 IRP Comments Page 25 of 27
22 http://www.ferc.gov/whats-new/comm-meet/2010/102110/E-6.pdf
23 http://www.energizeeastsideeis.org/uploads/4/7/3/1/47314045/attachment_5_-_screening_study.pdf
24 May 19 PSE IRP Advisory Group meeting materials
25 Exponent Reliability Study
Recommendation: Explore 3rd party or PSE owned central utility plants with CHP in parts of the Eastside that will experience the most new construction.Figure 12: Base CHP Quantity 2021
Eastside CHP Estimate CHP 4% of peak load
Note:Transmission topology alternative D adds Eastside generation. Because a larger central plant CHP project should be considered for this option, selection of this alternative could result in a substantially higher CHP penetration.
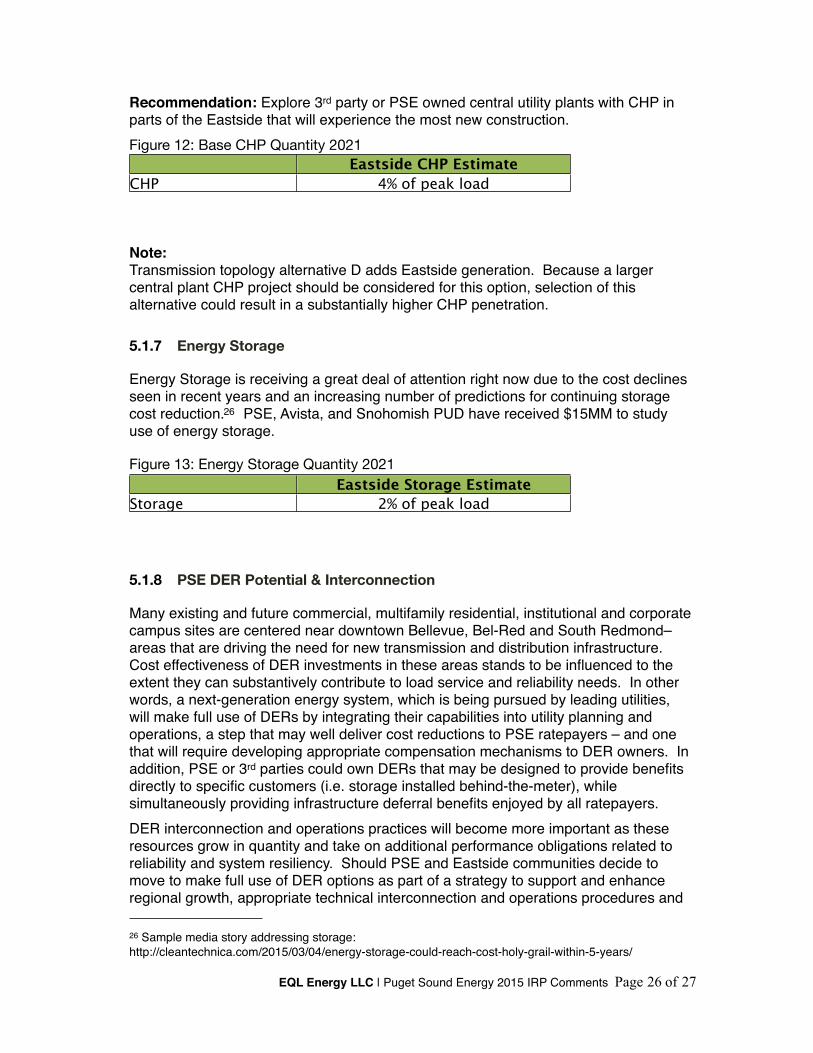
5.1.7 Energy Storage
Energy Storage is receiving a great deal of attention right now due to the cost declines seen in recent years and an increasing number of predictions for continuing storage cost reduction.26 PSE, Avista, and Snohomish PUD have received $15MM to study use of energy storage.
Figure 13: Energy Storage Quantity 2021 Eastside Storage Estimate
Storage 2% of peak load
5.1.8 PSE DER Potential & Interconnection
Many existing and future commercial, multifamily residential, institutional and corporate campus sites are centered near downtown Bellevue, Bel-Red and South Redmond–areas that are driving the need for new transmission and distribution infrastructure. Cost effectiveness of DER investments in these areas stands to be influenced to the extent they can substantively contribute to load service and reliability needs. In other words, a next-generation energy system, which is being pursued by leading utilities, will make full use of DERs by integrating their capabilities into utility planning and operations, a step that may well deliver cost reductions to PSE ratepayers – and one that will require developing appropriate compensation mechanisms to DER owners. In addition, PSE or 3rd parties could own DERs that may be designed to provide benefits directly to specific customers (i.e. storage installed behind-the-meter), while simultaneously providing infrastructure deferral benefits enjoyed by all ratepayers.DER interconnection and operations practices will become more important as these resources grow in quantity and take on additional performance obligations related to reliability and system resiliency. Should PSE and Eastside communities decide to move to make full use of DER options as part of a strategy to support and enhance regional growth, appropriate technical interconnection and operations procedures and
EQL Energy LLC | Puget Sound Energy 2015 IRP Comments Page 26 of 27
26 Sample media story addressing storage:http://cleantechnica.com/2015/03/04/energy-storage-could-reach-cost-holy-grail-within-5-years/
standards will be needed. DER best practices are emerging from California, New York, and Hawaii, states that have taken the lead. The standards by which PSE designs and operates the 12.5 kV distribution system will be important for DERs so as to ensure maximum utilization of the system, including supporting 2-way power flows.Most distribution systems move electricity in one direction – from power plants to substations to customers. But when customers interconnect generation resources, their power will flow the other direction, serving other customers and in some cases flowing power back to the substation itself and serving load further upstream, possibly at higher voltages. While there is no fundamental reason why these new flows of electricity cannot occur, investments in additional monitoring equipment and advanced control technologies will be needed. These types of investments, involving software, communications, controls, and switching equipment, are also likely to provide reliability benefits by enhancing the ability of utilities to automatically switch customers to alternate feeds in the event of an outage on a given distribution circuit.
EQL Energy LLC | Puget Sound Energy 2015 IRP Comments Page 27 of 27