Embed Size (px)
Citation preview

The Benefits of Structured Training on Manufacturing Process Ramp-Up: A Process Based Cost Model Approach
by
Colleen Beth Akehurst
B.S. in Engineering Cornell University, 1998
Submitted to the Engineering Systems Division in Partial Fulfillment of the Requirement for the Degree of
Master of Science in Technology and Policy
at the Massachusetts Institute of Technology
June 2004
© 2004 Massachusetts Institute of Technology All rights reserved
Signature of Author …………………………………………………………………….................
Technology and Policy Program, Engineering Systems Division
May 14, 2004
Certified by …………………………………………………………………………...................... Richard Roth
Director, Materials Systems Laboratory Thesis Supervisor
Certified by……………………………………………………………………………………...…
Randolph E. Kirchain, Jr. Assistant Professor of Materials Science & Engineering and Engineering Systems
Thesis Supervisor
Certified by …………………………………………………………………………...................... Frank R. Field III
Senior Research Engineer, Center for Technology, Policy, & Industrial Development Thesis Supervisor
Accepted by……………………………………………………………………………….............. Dava J. Newman
Associate Professor of Aeronautics & Astronautics and Engineering Systems Director, Technology and Policy Program

2

3
The Benefits of Structured Training on Manufacturing Process Ramp-Up: A Process Based Cost Model Approach
by
Colleen Beth Akehurst
Submitted to the Engineering Systems Division on May 14, 2004 in Partial Fulfillment of the Requirements for
the Degree of Master of Science in Technology and Policy Abstract Manufacturing facilities ramping up a new production process are faced with critical decisions, which determine the ability of that process to be cost efficient. Without quantitative analyses, these decisions are made with limited data and may cause manufacturing problems. Two critical decisions are examined in this research: what level of structured training to provide to employees and what cycle time to run when compared with the long-term optimal cycle time. By examining these decisions and their impact on two production metrics, unplanned equipment downtime and reject rate, a series of analyses are presented. A framework for conducting analyses is developed using Process Based Cost Modeling. This framework is applied to various automobile part manufacturing processes. The results indicate that production experience is critical for reducing the two performance metrics of unplanned downtime and reject rate. Additional analyses indicate that to achieve the best cycle times, a significant investment in structured training should be provided. Analytically determining the optimal cycle time is critical to improving production ramp-up because costs increase when running other cycle times. Future work would apply this framework to other manufacturing processes and gather additional data on the processes examined here. Thesis Supervisor: Richard Roth Thesis Supervisor’s Title: Director, Materials Systems Laboratory Thesis Supervisor: Randolph E. Kirchain, Jr. Thesis Supervisor’s Title: Assistant Professor of Materials Science &Engineering and Engineering Systems Thesis Supervisor: Frank R. Field III Thesis Supervisor’s Title: Senior Research Engineer, Center for Technology, Policy, & Industrial Development

4
Acknowledgements My deepest appreciation goes to everyone I have had the opportunity to learn from in the Materials Systems Laboratory, the Technology and Policy Program, and throughout MIT. First, I would like to thank Rich Roth. He has spent countless hours advising both this thesis and me. Rich went beyond the call of duty as an advisor, for his concern and support for me as an individual beyond my student persona was unimaginable. Special thank you to Randy Kirchain for his unending patient help that made my experiences here so much more valuable and educational. Randy taught me everything from how to use Excel efficiently to how to think through problems systematically. And many thanks to Frank Field, for his complete support on everything from class schedules to thesis topics to life after graduation. I am forever indebted for his generosity of spirit every day of my time at MIT. A final thank you goes to Joel Clark. He encouraged me in a research project to meet my interests and a life to meet my goals. The students of the Materials Systems Laboratory who create an interesting and fun environment to spend my days in, best of luck to Laeticia, Delphine, Chris, Erica, and Preston. Special thanks to Mike Johnson for always being a fantastic listener and wise sage whenever I needed and to Jennifer Atlee who provided perfect balance to my thoughts and a sympathetic ear so often. To my many friends in the Technology and Policy Program, you have made me think about everything in new ways. For the friendship, support, and conversations I will always be grateful. And to the woman who guides us all in countless ways, Sydney Miller. Thank you Sydney for your time, your guidance, and your encouragement, it has brought me so far. To my friends from my journey through life – thank you for your continued support. Marcus, Denise, Sarah, Ann, Dan, Jill and Deena provide friendship in ways I did not think possible. You all have seen me through the most difficult times in my life and supported me with unconditional love. I am honored that you are my friends. Thank you Sue, for advising me from the first day you met me. I pray that my advisee status will continue forever. To Marty, I have come to rely on your consistent encouragement and care. Finally, I would like to thank my parents for their continued love. From my earliest days they encouraged me to follow my dreams. Their continued support has always amazed me even during my roughest moments. I would not have made it through to today without them. And thanks to Kirsten for making sure I showed up at MIT at the right time.

5
Table of Contents Table of Contents................................................................................................................ 5 List of Figures ..................................................................................................................... 7 1. Background.................................................................................................................... 9
1.1 Manufacturing Organizations Concerns Regarding a Skilled Workforce ................ 9 1.2 Issues with Obtaining a Skilled Workforce ............................................................ 10 1.3 Benefits of Training ................................................................................................ 13 1.4 Optimal Manufacturing Ramp-Up.......................................................................... 15 1.5 Government Interest in Training............................................................................. 16
2. Problem Statement ....................................................................................................... 19 3. Methodology................................................................................................................. 23
3.1 Modeling the Cost of Production............................................................................ 23 3.2 Process Based Cost Models .................................................................................... 24 3.3 Generic Process Based Cost Model ........................................................................ 26 3.4 Conceptual Operational Decision Making Model .................................................. 27
3.4.1 Incorporations of Training Parameters into Cost Models................................ 27 3.4.2 Relationship between Cycle Time, Production Interval, Structured Training, Reject Rate, and Unplanned Downtime.................................................................... 29
3.5 Stamping Model...................................................................................................... 31 3.6 GM Training Cost Model........................................................................................ 33
4. Analyses....................................................................................................................... 37 4.1 Generic Model ........................................................................................................ 37
4.1.1 Reduction in Cost Provided by Training ......................................................... 38 4.1.2 Key Training Investment Points ...................................................................... 39 4.1.3 Operational Learning ....................................................................................... 42 4.1.4 Training and Experience .................................................................................. 44 4.1.5 Ramp-Up.......................................................................................................... 46 4.1.6. Single Cycle Times ......................................................................................... 47 4.1.7 Additional Process ........................................................................................... 49
4.2 Stamping ................................................................................................................. 52 4.2.1 Key Training Investment Points ...................................................................... 53 4.2.2 Relationship Between Operational Learning and Structured Training............ 54
5. Conclusions................................................................................................................... 57 5.1 Training Investment ................................................................................................ 57 5.2 Benefit of Production Experience........................................................................... 58 5.3. Benefits of Both Structured Training and Production Experience ........................ 59 5.4 Selection of Cycle Time.......................................................................................... 60
6. Policy Implications ....................................................................................................... 63 6.1 Corporate Changes.................................................................................................. 63
6.1.1 Quantitative Analysis of Manufacturing Process Ramp-Up............................ 63 6.1.2 Investment in Training..................................................................................... 65
6.2 Government Investment.......................................................................................... 66 6.2.1 Continued Investment in Training Programs................................................... 66 6.2.2 Call for Quantitative Data on Training Analyses ............................................ 68

6
7. Future Work .................................................................................................................. 71 7.1 Additional Data Collection and Analyses............................................................... 71 7.2 Further Quantitative Analyses of Training ............................................................. 72
Appendix A....................................................................................................................... 75 Appendix B ....................................................................................................................... 76
Generic Process Based Cost Model .............................................................................. 76 Inputs into the Generic Model .................................................................................. 76 Particular Intermediate Calculations......................................................................... 76 Summary Output Table............................................................................................. 77
Appendix C ....................................................................................................................... 78 References......................................................................................................................... 79

7
List of Figures Figure 1: Manufacturing Training Types.......................................................................... 12 Figure 2: Production Choice Impact on Cost.................................................................... 28 Figure 3: Conceptual Operational Decision Making (CODM)......................................... 29 Figure 4: Relationship Between Reject Rate and Downtime............................................ 30 Figure 5: Reduction in Cost Provided by Training........................................................... 39 Figure 6: Key Training Investment Points........................................................................ 41 Figure 7: Operational Learning Contributes to Improving Production ............................ 43 Figure 8: Relationship Between Production Interval, Training Level, and Cycle Time .. 45 Figure 9: Ramp-Up Optimal Cycle Times........................................................................ 47 Figure 10: Single Cycle Time Cost Increase .................................................................... 49 Figure 11: Key Training Investment Points for $1 Million Capital Investment............... 50 Figure 12: Key Training Investment Points $10 Million Capital Investment .................. 52 Figure 13: Key Training Investment Points for Stamping................................................ 54 Figure 14: Application of Operational Decision Relationships to Detailed Stamping
Model ........................................................................................................................ 55

8

9
1. Background
1.1 Manufacturing Organizations Concerns Regarding a Skilled Workforce
With the increased complexity of manufacturing operations, employees need a range of
skills from technical knowledge to general problem solving approaches. These skills are
required by manufacturing organizations that seek the most efficient and productive
environments.
Characteristics of a flexible or ‘high performing’ manufacturing facility is one engaged in
continuous improvement and facilitates leadership by employees (MacDuffie 1995). A
flexible workplace requires its employees to lead many aspects of production (MacDuffie
1995). Employees are to problem solve production issues, repair equipment, and
examine for quality issues in addition to running the equipment (MacDuffie 1995). With
this interest in ‘high performing’ workplaces, manufacturing firms are investing more in
training (The Century Foundation). Most often the desired goals of the training are
directly linked to performance improvements in the manufacturing plant (Burrow 2003).
In a survey of members of the National Association of Manufacturers more than half
were investing in training for their employees (NAM 2001). These respondents
indicated they were training primarily ‘to keep pace with technology’ (NAM 2001).
Additionally, basic skill shortages were listed as a reason for companies to provide
training to employees (NAM 2001).

10
Given the demands of modern manufacturing facilities, employees need a breadth of
skills. Additionally some of those same employees need depth in particular skill areas.
1.2 Issues with Obtaining a Skilled Workforce
There are two primary methods for obtaining a skilled workforce. The first is to hire the
necessary skills by having certain prerequisites for job applicants. The second is for a
company to provide the necessary training to develop the skills. Given the uniqueness of
some manufacturing processes, it can be nearly impossible to hire for the necessary skills.
Corporations utilize various approaches to obtain the skill profile needed for a
manufacturing facility. Some specifically require certain skills as part of an employment
posting.
However, not all companies take this approach. Many look for basic employee
characteristics and then choose to train the individual on specific skills. This is a
conscious decision by the employer on how to train its employees. For example, Miles
Fiberglass & Composites, Inc., provides a mandatory training program for employees
(NAM 2001). Miles hires employees with basic skills and trains them in the specifics of
their manufacturing process.
Once training is decided to be an appropriate approach, additional decisions are required
to determine the type of training. Two types of training exist in the manufacturing

11
environment. These are graphically represented in Figure 1, below. First, structured
training achieves conceptual learning (Lapre et al 2000). This type of learning can be
taught and leads to ‘know-why’ (Lapre et al 2000). Through this process employees are
taught to understand things such as the manufacturing process.
The teaching process is not limited to classroom instruction. Structured training refers to
a systematic approach to gaining skills. This approach involves identifying skills
necessary for a task. After identifying skills, a skill assessment determines the gap
between current employee skill level and the necessary skill level. Once training needs
are identified, specific instructional approaches are developed. These approaches have
specific objects and can include classroom training, structured on the job training and
other methods. After training, employees are evaluated to ensure the training was
successful. This full process is considered structured training.
The second type of training is experiential which leads to operational learning or ‘know-
how” (Lapre et al 2000). This type of learning occurs through experience and employees
learn this knowledge by actually performing their manufacturing tasks (Sinclair 2000).
This information can be learned, but requires time and production to achieve.

12
Figure 1: Manufacturing Training Types
Both types of training are required for the best benefits in manufacturing to be achieved
(Lapre et al 2000). Eliminating either learning approach greatly diminishes the benefits
that could be achieved by combining both mechanisms. More details regarding the
benefits of training are discussed below.
One of the most substantive hurdles in achieving appropriate training is securing funding.
To achieve the benefits of training, a significant investment in employees is required.
Corporate budgets are tight and financial allocations must demonstrate results indicating
a substantial return on investment. With few quantitative analyses to demonstrate the
return on investment of training, securing funding for training is difficult.
The National Association of Manufacturers recommends employers spend at least three
percent of payroll to train and educate employees (NAM 2001). This recommendation
includes a range of programs that should be offered from literacy training to tuition
Training
Experience
Conceptual Learning – know-why • Structured training • Can be taught Operational Learning – know-how • Learning by doing • “Learning curve effects”
Learning

13
reimbursement for higher education (NAM 2001). However, current spending on
training is much less than the recommended amount, with actual spending in the range of
one to two percent of payroll for survey respondents (NAM 2001). This is indicative of
tension in achieving an appropriate amount of training. Without adequate financial
commitment, gaining the most benefits from training will be unlikely.
1.3 Benefits of Training A great variety of benefits are achieved by training manufacturing employees. Two
specific benefits are examined in this research, improved quality (i.e. decreased reject
rate) and improved equipment performance (i.e. reduced unplanned downtime). Previous
research indicates both of these benefits as a result of training.
Providing training has been shown to improve quality. Training is regularly viewed as a
‘critical factor of quality management’ (Benson et al 1991). Other approaches t quality
management exist, but training is always considered essential. This view is widespread,
as indicated by one study where 94% of the forty-nine manufacturing units studied
provided training in an effort to improve quality (Ittner 1996). The investment being
made in quality training delivers results. For example, research has indicated that
‘induced learning’ (training) leads to quality improvement (Fine 1986).
Quality also improves by operational learning. Research indicates the existence of a
‘quality learning curve’ that develops over time (Levin 2000). This indicates that both

14
learning approaches, structured training and experiential knowledge, contribute
significantly to improved quality.
Linking training benefits to unplanned downtime is more difficult; limited research
addresses this problem. One study links the benefits of expert systems and training to
maintenance support (Stein et al 2003). This study indicates that improvements can be
made to maintenance of equipment by providing particular information to employees
(Stein et al 2003). This improved maintenance would then be translated into decreased
unplanned equipment downtime. As this study indicates the link between training and
unplanned downtime is not direct.
Beyond quality and maintenance, the effective usage of new technology occurs by
developing and executing training (ASTD Research 2003). Training provides specific
skills that increase the effectiveness of technology during implementation and in the long
term. Furthermore, increasing the effectiveness of new technology aids in efficient ramp-
up of manufacturing processes.
Training provides other benefits beyond improvements to manufacturing processes.
Current research indicates that employees develop a ‘psychological contract’ with
employers (Rousseau and Tijoriwala 1998). This contract exists when the employee
believes that a ‘promise’ has been made by the employers in exchange for certain
activities (Rousseau and Tijoriwala 1998). An employee will deliver their portion of the
contract as long as they perceive the employer to be doing the same. A portion of the

15
employer side of the contract includes providing training (Robinson 1996). Other
research indicates that providing training increases job satisfaction and organizational
commitment (Birdi et al 1997). Increased job satisfaction and organizational
commitment provide substantial benefits to companies, but these benefits are difficult to
quantify. Although this research only examines the financial benefits of providing
training, it is critical to remember that training provides benefits that are not easily
measured or quantified.
1.4 Optimal Manufacturing Ramp-Up
Manufacturing organizations have long sought to start-up new equipment along an
optimal acceleration curve. By using an optimal curve, costly errors can be avoided.
However, determination of this curve is difficult. Previous research has attempted to
develop methodologies for determining ramp-up in other industries. In one study a
methodology was developed to manage cycle time during the ramp-up (Haller et al
2003). This leads to more efficient use of time and resources during ramp-up. A similar
approach is taken in this thesis.
Other research developed an analytical approach to evaluate production ramp-up. The
study indicated the need for examining multiple trade-offs during the ramp-up process.
The trade-offs examined include production speed and yield (Terwiesch and Bohn 2001).
The approach presented by Terwiesch and Bohn helps manufacturing facilities achieve
more efficient ramp-up, a goal similar to this research.

16
Additional research has indicated the importance of identifying production disturbances
during ramp-up (Almgren 2000). Control of these disturbances allows for more efficient
ramp-up (Almgren 2000). However, achieving that control is difficult, since often the
disruptions are unique and uncontrollable.
Research indicates a need for production facilities to efficiently perform ramp-up. A
variety of factors have been previously considered in various industries, the learning from
that research contributes to the work presented here. However, the research in the
production ramp-up field is limited and therefore many gaps exist.
1.5 Government Interest in Training
Both federal and state governments make significant investments into training. Generally
the reasons are tied to providing appropriate skilled labor for industry which leads to
economic growth. In an effort to combine and build on previous federal legislation, the
United States Congress passed the Workforce Investment Act of 1998. Summaries of
specific sections of this Act are provided in Appendix A.
One section of the legislation most directly applies to the research in this thesis. Title I
creates a statewide Workforce Investment System. This workforce investment provides
training for adults seeking specific skills for employability. It also provides qualification

17
and potentially funding for organizations who wish to provide training. The legislation
allowed states to create approaches to implement the WIA within certain guidelines.
States have implemented this legislation differently. Some states tied this organization to
an existing executive department. For example, Connecticut added the work required
under the WIA to the Department of Labor (www.ctdol.state.ct.us/wia/wia.htm). In other
states, new organizations were created. The State of Ohio created the Office of
Investment in Training (www.odod.state.oh.us/oitp.htm). Regardless of the
implementation strategy, the purpose of these state systems was to provide a ‘one-stop’
delivery systems with career centers, job training and education to local areas (Landini
1998). Through these delivery systems, individuals can create individualized training
programs to address personal skill needs. Employers can work with the ‘one-stop’ center
to locate appropriately training employees. Employers seeking to fund training for
existing employees can potentially work with the state for funding and other assistance.
The WIA and other associated federal programs represent a significant financial
investment into the training of workers. In 1999 the federal government spent an
estimated $11.7 billion on job training or job placement assistance (Policy Almanac
2001). This money was spent by approximately forty programs that listed either job
training or job placement assistance as a primary goal (Policy Almanac 2001). It should
be noted that not all of this training expenditure was directed towards manufacturing
organizations. But, a significant portion of this spending does impact manufacturing.
18
The importance of government involvement in workforce development is reflected in a
2001 survey of members of the National Association of Manufacturers. More than half
of the survey respondents thought that government’s role in workforce development
should be tax relief for companies that offer training (NAM 2001). Although other
governmental roles are possible, it is clear from the NAM survey that manufacturing
organizations favor some type of governmental involvement.
The government reaps the benefits of a trained workforce. Whether that training is
provided by government sponsored programs or an individual company, the positive
impact to the national economy is the same.
Training is an effective method for manufacturing facilities to obtain skilled employees.
Currently the government is assisting in this training effort. Unfortunately, little work
has been done to quantitatively show the benefits of training for a particular
manufacturing process. The research presented in this thesis addresses this need.

19
2. Problem Statement
When introducing new manufacturing methods, companies are faced with a difficult
dilemma. A production manager is forced to determine the best approach to starting up
this new manufacturing process. It is unlikely that a production facility can start up at
long-term optimal speeds on the first day of production without causing significant
problems. Therefore, critical decisions must be made during the start-up process. Of
particular concern are two issues: 1) what line rate, as compared to final line rate, is
appropriate at different periods during of ramp-up and 2) what level of training is
required for employees to achieve optimal costs.
During initial ramp-up serious complications occur if the line is run too quickly. These
issues can include an increased number of rejected parts and more frequent unplanned
equipment downtime. Therefore, a ramp-up plan, indicating the rate at which the cycle
times can be reduced, shall be determined by balancing production experience and
training should be determined. However, making these decisions requires significant
analyses of the tradeoffs among multiple operation decisions. Among these are decisions
concerning the amount of training to be given to the various types of workers.
A manufacturing workforce becomes skilled through two primary mechanisms. First,
structured training assists workers in understanding the cause and effect relationships
between their work and production performance. Structured training also provides basic
knowledge of the manufacturing process and associated issues such as safety. Second,

20
experiential learning, commonly referred to as learning by doing, describes the
knowledge employees acquire over a period of time while performing the work.
Combining these two approaches to learning leads to better results for manufacturing
ramp-up.
These learning methods lead to the other interesting balance to be achieved during
manufacturing ramp-up: providing the appropriate amount of structured training while
gaining benefits by experiential learning. A new production method requires that
employees understand both how the process functions and the impact between their work
and production output.
By helping companies recognize the benefits of both structured training and experience,
better decisions can be made during start-ups. Managers can predict the production cycle
time that would be best for the process at various times during production. Based on
these decisions a cycle time acceleration curve can be defined and steady-state
performance can be achieved sooner. Knowledge of the acceleration curve leads directly
to lower costs of ramp-up due to balancing cycle time and unplanned downtime and
reject rate. Allowing longer cycle times improves the unplanned downtime and reject
rate are improved, but this alternative is costly because slower cycle times translate into
less efficient use of capital equipment and labor.
Furthermore, this study examines the optimal level of training from a cost minimization
standpoint. A breakeven point for the investment in training is quantifiable. With the
21
framework used herein, the point of greatest difference between production savings and
the cost of training can be determined. Using the methodology presented in this thesis,
the impact of various training levels can be examined for their benefits during the ramp-
up process. It can also be determined if there is a point at which training no longer
translates directly into financial benefits for the manufacturing operation.
Finally, a main objective of this work is to develop a framework for analyzing these
decisions. Given the limited data available, an important contribution to this field is a re-
applicable methodology for future analysis of various manufacturing processes. With
minor changes the mechanisms developed for the analyses presented in this research can
be applied to other manufacturing processes.
Two approaches are presented in this thesis. The first approach uses a ramp-up and
structured training framework in conjunction with a generic cost model. This facilitates a
more straightforward analysis to examine and understand the implications of training
decisions without complications arising from more detailed models. The second
approach uses a ramp-up framework with a detailed cost model to ensure consistent
results when additional process details are considered.
A number of analyses using the two approaches were done. These analyses include key
training investment points, the benefits of operational learning, the relationship between
operational learning and structured training, and the implications of choosing one cycle
time for an entire production run (only included in the generic process approach).

22

23
3. Methodology
3.1 Modeling the Cost of Production Effectively modeling the cost of production provides a variety of benefits to
manufacturing managers. Models facilitate better decision making, with more accurate
projections of the impacts of production decisions. Models allow for a variety of
scenarios to be run before critical financial resources are committed. By simulating
potential situations, more data in available to be used in up front decision making.
Historically, rules of thumb have been used to analyze the cost of production (Busch
1987). Using this approach, managers with years of experience made production
decisions based by reapplying knowledge gained in previous situations. This approach is
limited by the scope of experience of particular individuals.
Other modeling approaches focus on using large quantities of data to predict future costs,
modeling a manufacturing process abstractly, or using first principle physics. (Fixson
2002). Each of these approaches has limitations. For those relying on large quantities of
data, the obvious limitations are the availability and accuracy of that data. Abstractly
modeling manufacturing process creates mathematical calculations of the manufacturing
process. These models are limited by the complexity of the process under investigation;
a process that is overly complex is difficult to model (Fixson 2002). Using first
principles to approach modeling allows for engineering information to be translated into
24
manufacturing information. For a full discussion of the various cost modeling
techniques, refer to Fixson 2002.
3.2 Process Based Cost Models
Process based cost modeling (PBCM) analyzes the various cost components of a
production process. Through a mathematical transformation the magnitude of factors
affecting cost are estimated (Kirchain 2001). These factors are set by the process being
modeled (Kirchain 2001). PBCM was developed to provide cost estimates using
engineering, technical, and economic knowledge with accounting principles (Veloso et al
2001). The importance of the model is not in producing a usable cost for manufactured
items, but in examining how changes impact cost. Examples of changes that can be
made are production volume, equipment type or material selection. The design of a
PBCM allows for sensitivity analyses to be performed on gradual changes of a particular
variable, for examples increases in material cost or energy rates. The scope of PBCM
allow for a variety of changes to be examined across many aspects of the production
process.
As discussed previously, various mechanisms exist for understanding manufacturing
costs. However given the limitations of those methods, alternative approaches are
required for this research. For three reasons the approach used in this thesis is a PBCM.
First, PBCM can model manufacturing processes that are in various stages of
development. Other approaches require processes to be fully operational for sufficient
25
data to be gathered. Second, PBCM requires a limited number of process, operational,
and financial inputs. By minimizing the number of inputs needed, model users are able
to perform analyzes without every detail specified. Third, the calculation process of
PBCM allows for changes to be made on the variables of particular interest in this
research. PBCM provides the ability to analyze issues with real data while balancing the
level of detail required.
A PBCM is built backwards, with cost elements identified first. Examples of cost
elements are material, equipment, or energy. Next, the factors impacting these cost
elements are determined. Finally, process operations are correlated to the cost factor
(Kirchain 2001). In this particular case, PBCM uses variables that most impact the cost
of fabrication.
PBCMs are actually three models functioning seamlessly: a process model, an operations
model, and a financial model. The first step in a PBCM calculation is to determine
specifics regarding a manufacturing process. The process model transforms basic part
and process data into all the production variables needed to estimate cost. These include
calculations on type and quantity of production equipment, steps in production process,
materials required per product, and other production specific calculations. The
operations model calculates information applicable to the manufacturing facility. This
includes information such as the production time available based on employee work
schedules, number of workers needed, and other operational considerations. Finally the
financial model calculates the cost of the various determinations made by the process and

26
operations models. Those calculations include the amortized cost of the equipment,
employee wages, and items such as interest rate and overhead costs. These three
separate parts of the model are not clearly delineated in the model, but function together
to perform the full functionality of a PBCM.
3.3 Generic Process Based Cost Model
The analyses conducted in this research primarily used a generic process based cost
model. This model is a stripped down version of a more detailed PBCM. However, this
generic model took steps to reduce the number of inputs required and therefore computes
fewer intermediate calculations. For example, all equipment was grouped into one
overall charge and energy and materials were combined into one cost per part.
The generic model can be used for any process. For example, by using data appropriate
for the stamping process, the generic model can be used to estimate the costs of stamping.
First, cycle times are similar to stamping cycle times, ranging from four seconds to thirty
seconds. Second, the capital investment is set at $5 million, the approximate cost of a
mid-range stamping press line. Third, each line in the generic model has three workers
dedicated to production. The cost of a piece calculated by this generic model is roughly
equal to the cost calculated by the full scale stamping model, although some accuracy is
presumably sacrificed using the simplified approach.

27
The generic model was used to analyze most questions discussed in this research. Since
the simplified model is not process specific, input changes are all that is needed to
emulate other manufacturing processes. Actual inputs and intermediate calculations of
the generic model are reported in Appendix B.
3.4 Conceptual Operational Decision Making Model
3.4.1 Incorporations of Training Parameters into Cost Models
Choices are made early in the production development process that have an impact on
cost. For example, technology choices are made that may include decisions on types of
presses to be used. Additionally operating decisions are made regarding the specifics of
how to manufacture the part. These can include decisions such as cycle time. Use of
cycle time as performance indicator has been used elsewhere in modeling analyses
(Womer 1979). Finally, choices are made regarding the level of knowledge required by
workers to run the process. This knowledge can be achieved by training the employees.
These choices then translate into a set of production characteristics. This includes
performance metrics such as unplanned downtime and reject rate. From these production
characteristics comes actual production. This impact of production choice on cost is
graphically represented in Figure 2. As mentioned previously, production can be
analyzed to determine a final cost of manufacturing through a PBCM.

28
Figure 2: Production Choice Impact on Cost
The first step in evaluating the impact of the training and experiential learning in the
manufacturing environment was to determine which production performance metrics are
most impacted by learning. Through a series of interviews with experienced production
managers, training experts, and manufacturing personnel two production measures were
chosen for analysis: unplanned equipment downtime and reject rate. Other performance
metrics were considered, but were eliminated because they are not impacted as much by
training and learning.
In order to think about the various relationships considered in this research, connections
between the various metrics were required. The general relationship is indicated in
Figure 3. Cycle time (CT) and training are decisions that are made with direct impact on
production. They are specific for the manufacturing process being modeled. From
calculations in the generic process model, a reject rate (RR) and unplanned equipment
Technology process Operating Decision cycle time Worker Knowledge training levels
Choices
Downtime Reject
Production Characteristics
Production
Cost

29
downtime (DT) are determined for the specific manufacturing process being investigated.
More details on the specific development of the RR and DT are provided below.
The generic model was used for operations and financial calculations, with the addition
of the operating decision making framework to replace the process model. This
framework provided a feedback loop for cumulative production through the concept of
operational learning.
For this research, training was considered to be provided at various levels. A level is
defined as a certain number of hours per each skilled trade employee, each production
employee, and each salaried employee.
Figure 3: Conceptual Operational Decision Making (CODM)
3.4.2 Relationship between Cycle Time, Production Interval, Structured Training, Reject Rate, and Unplanned Downtime
The decision making framework consisted of relationships between cycle time and
unplanned downtime (DT) and reject rate (RR) at various levels of experiential learning.
To develop calculations for RR and DT, a quantitative relationship needed to be
Process Model
OperationModel
Financial Model
RRDT
CT Training
Cumulative Production
Cost
OperationalLearning

30
determined. The first step in this process was to determine a general functional form.
Based on several studies, the general form of the relationship is shown in Figure 4
(Terwiesch and Bohn 2001). The research indicates a monotonic decrease in reject rate
or downtime given increased cycle time at a single level of structured training.
Figure 4: Relationship Between Reject Rate and Downtime
A monotonic mathematical form was chosen since this clearly resembles the expected
behavior of these relationships. The form of the equation stays the same for both reject
rate and downtime. These equations are listed Error! Reference source not found..
(1) RRbRR
CTA
RR =
(2) DTbDT
CTA
DT =
Reject Rate
Cycle Time

31
The coefficient, A, and exponent, B, define the slop and magnitude of the curves holding
constant all other variables, in particular training and employee experience. Different
structured training and experience levels have different cycle time and reject rate
relationships, but are modeled as always following the same exponential form.
Accordingly, new values for A and b can be found for each level of training and
experience. A sample of the data used to calculate these values is contained in Appendix
C.
It was assumed that both the coefficient, A, and the exponent, b, also have an exponential
relationship with the levels of training and experience. While it is more difficult to
confirm the accuracy of this functional form, it is thought to generally represent
production data and is a fairly flexible form able to represent a large range of data.
Applying this functional form one can write equations for the coefficient A and the
exponent b in terms of the level of training (Tr) and the number of production intervals
(N). These equations are given below.
(3) ed TrNCA ××=
(4) hg TrNFb ××=
3.5 Stamping Model

32
The stamping cost model has been developed and refined over a period of years by the
Materials Systems Laboratory at MIT. It is a multiple step process that includes
blanking, rinsing, stamping, and finishing to produce metal automobile parts. The
accuracy of this model has been verified by data from various automobile manufacturers.
In keeping with cost modeling approaches discussed previously, the stamping model can
be thought of as three seamless models, a process model, an operations model, and a
financial model combined to produce one cost output. In this model more detailed inputs
are required and more calculations performed as compared to the generic model.
The process component of the stamping cost model uses part geometry considerations to
estimate the manufacturing requirements to produce the part. Input information includes
length, width, height, and complexity of the part. The model then estimates a size and
cost of the presses, the costs of the tools, and other process specific issues. The model
selects a stamping press from a listing of available presses. Cycle time is an input that is
generally considered to be the long term steady state cycle time. Traditionally this cycle
time has not considered the optimal cycle time at different levels of training. This
research changes that approach and includes training.
Operational inputs into the stamping model include worker wage, production days per
year, production hours per day, and worker break information. Based on these inputs, a
time is calculated that is required for production of the necessary parts. This is compared
to the time available based on production days and time in each day available for

33
production. Based on these operational considerations, additional equipment may be
required to meet production demands.
From the process requirements and operational information, the final step in the stamping
model is the determination of financial costs. Financial information inputted into the
model includes, overhead rate, interest rate, and building costs. Costs are calculated
using accounting principles, such as amortizing the cost of equipment over the equipment
life or the cost of tools over the product life.
A significant change was made to the stamping model for use with the downtime and
reject rate equations. All calculations are based on production interval as opposed to on
an annual basis. This was required because the decision making interval is a production
interval and therefore changes to cycle could be made at every production interval.
3.6 GM Training Cost Model
Based on dozens of plant start-ups and production changes over many years, General
Motors (GM) developed a training cost model. This model predicts the training
investment necessary to appropriately educate plant personnel before a large project. The
training cost model divides training between skilled trades (electrical and mechanical
maintenance personnel), production employees, and salaried employees.
34
The determination of the amount of training required is correlated to the project
complexity and size. Complexity is defined by a series of factors including:
• Extent of new process technology being implemented
• Extent of cultural change being implemented
• Changes previously implemented in other plants
• Quick change-over or major re-tooling
A more complex project will require additional training. Size is determined by the
number of employees working in the manufacturing facility.
The training cost model requires more inputs to fully analyze all factors contributing to
overall training cost. Additional inputs include:
• Average hours of training – This includes information on the three groups of
employees: skilled trades, production and salaried. Different training hours are
entered for each group of employees and for the five project complexity levels.
• Labor rates – These inputs provide information on the cost of fully-loaded
instructors, course developers, students, and other employee hourly wages.
• Percentage of course delivery – Courses can be provided over a three year period
and these inputs allow determination for what percentage of the training is offered
during each of those years.
• Workforce deployment – This section creates specifics on the workforce make-
up. The percentage translates into a number to of certain types of employees:
skilled trades, production employees, or salaried workers.

35
• Class size and attendance rates – Classes can contain a certain number of
participants and these participants have average attendance rates. Based on the
attendance rates more classes may be required to achieve one hundred percent
training, resulting in higher costs.
With all these inputs and information regarding the complexity of the project, a cost
estimation is calculated for the overall training package. This cost can then be used in the
budgeting process to allocate enough financial resources to achieve adequate training.
The total dollar investment calculated by the training model was divided to provide an
investment per employee required for the two models investigated here. For the
purposes of these analyses, all training was provided in one year. It was assumed that the
training was actually provided prior to the start of production. The complexity of the
project was not correlated to the model, but instead complexity level one was considered
to be training level of one. This level corresponds to seventy-three hours of training per
skilled trades employee and thirty-eight hours of training per production employee.
Levels two through nine were then determined by creating equally distributed training for
all types of employees.

36

37
4. Analyses The purpose of this project is to demonstrate the types of information that can be
obtained by careful analysis of training and cycle time during manufacturing process
ramp-up. The following set of analyses investigate the benefits of experience (production
interval), structured training, and optimal cycle time. Two PBCMs were used, a generic
model built for this research, and a fully detailed stamping model.
4.1 Generic Model Using a generic process based cost model a series of analyses were conducted to
understand the changes in manufacturing costs due to structured training and production
interval. The operating decisions that were changed include the cycle time for the
process given production interval and the training level to be provided to workers.
The analyses presented examined production intervals from one to one hundred in steps
of five. A production interval was defined as making 1000 good parts. A decision was
made at the beginning of each grouping of five production intervals, regarding what cycle
time to run during the next five production intervals. Although, more frequent decisions
could be made, that level of detail was deemed unnecessary for this work.
For these analyses, costs were estimated at a range of cycle times. Cycle times started at
four seconds and ranged to thirty seconds. With increments of a quarter of a second for

38
most cycle times within that range, more specific optimal cycle times could be
determined.
4.1.1 Reduction in Cost Provided by Training
A key concept to be investigated by this research is what, if any, benefits in production
costs are provided by structured training. To investigate this question, one automobile
stamping was investigated at all ten training levels, with production interval being held
constant. Reduction in optimal cycle time occurred for each of the ten levels. Between
level one and level ten a reduction of several seconds is achievable. For the earliest
production intervals it is three seconds, for the later production levels it is almost four
seconds.
As indicated by Figure 5, increased training leads to a reduction in cost per part. The
lowest point on both curves indicates the best cost obtained over a series of cycle times
for a particular production interval. A savings of 7% was achieved by increasing the
training amount by only two levels. Additional cost reductions can be achieved by
continuing to increase the amount of training provided.

39
$8.00
$8.25
$8.50
$8.75
$9.00
$9.25
$9.50
$9.75
$10.00
0 5 10 15 20 25 30 35
Cycle Time
Cos
t Level 1Level 3
Training Levels
Figure 5: Reduction in Cost Provided by Training
4.1.2 Key Training Investment Points
By incorporating the cost information from the training cost model into the generic cost
model, various investment levels for training were analyzed and compared with the
benefits of training obtained at those levels. Again, the benefits from training are
decreased unplanned downtime and decreased reject rates.
These analyses were run over the entire production volume of 100,000 parts. Because of
this, the costs presented are for the entire production, as opposed to one individual part.
As indicated in Figure 6, the benefits of training continue to increase over time. This is
indicated by the solid line continually rising. However, the training benefits curve shows

40
diminishing cost savings as the training levels increase. The incremental cost of training
indicated by the dashed line is linear because the difference in cost between any two
training levels is the same. However, these benefits overlap the incremental cost of
training at a particular level. The light grey line in the graph shows the difference
between the training benefits and costs.
Two important points exists on the ‘savings from training’ curve. The first point is at
training level four, indicated by a square marker. This point indicates an efficient
training investment amount. By providing training at this level an efficient use of
resources occurs. This is because it is the point where the most savings occurs compared
with the amount of training provided. For this particular analysis that savings is over
$5,600, which includes the cost of training.
The second point is at training level eight, indicated by a triangular marker. At this point,
there are no more financial incentives for providing training. If more money is invested
in training after level eight, there are still savings generated by the training, but the
expense of training is more than the savings delivered. Basing investment in training on
purely financial motives there would be no reason to invest in training beyond level eight.

41
Cost & Benefits of Training
-$10,000
$0
$10,000
$20,000
$30,000
$40,000
$50,000
$60,000
1 2 3 4 5 6 7 8 9 10
Training Level
Cos
t
Benefits ofTrainingIncrementalTraining CostSavings fromTraining
Figure 6: Key Training Investment Points
These two points are critical to consider for the financial investment made into training.
Knowing these points prior to starting a manufacturing project provides more information
into the optimal use of limited financial resources. However, as mentioned previously,
reasons other than financial motives for additional training may exist. Based on this
analysis a production manager may seek to train only to the most efficient point or
choose to continue to train until there are no more financial benefits whatsoever.

42
4.1.3 Operational Learning
The next analysis examines the benefits of experience, without the influence of structured
training programs. For this analysis, cost was estimated across a range of different cycle
times for several production intervals. The training amount provided was held constant.
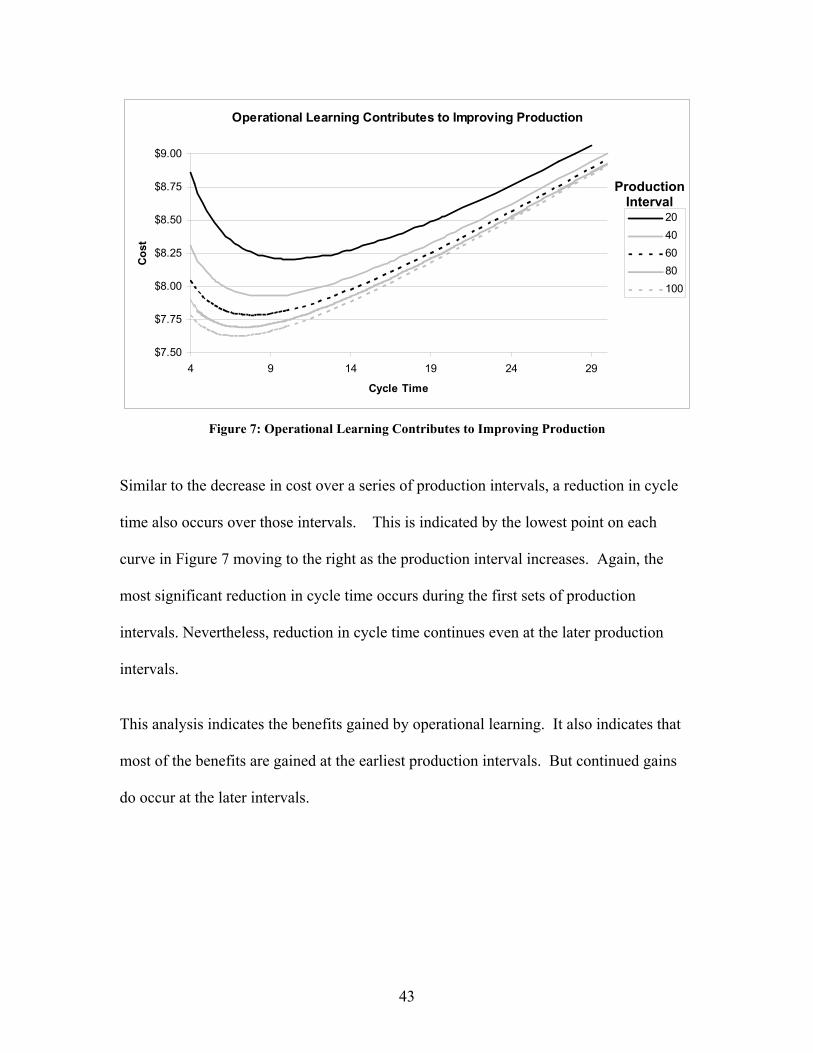
As shown in Figure 7, the cost per part decreases between each successive set of
production intervals. There are greater cost decreases between the earliest production
intervals. For example, between production interval twenty and production interval forty
there is a $.25 cost decrease per part. But, between production interval eighty and one
hundred there is only a $.06 decrease per part. The actual cost per part is not the
important point. The difference in magnitude indicates that the most significant gains to
be achieved from operational learning occur at the earliest intervals of manufacturing
ramp-up. The difference of $.06 between production intervals sixty and one hundred still
demonstrates the importance of operational learning through the production run. Even
though larger gains occur at earlier production intervals, there are still operational
learning gains at the later production intervals.
43
Figure 7: Operational Learning Contributes to Improving Production
Similar to the decrease in cost over a series of production intervals, a reduction in cycle
time also occurs over those intervals. This is indicated by the lowest point on each
curve in Figure 7 moving to the right as the production interval increases. Again, the
most significant reduction in cycle time occurs during the first sets of production
intervals. Nevertheless, reduction in cycle time continues even at the later production
intervals.
This analysis indicates the benefits gained by operational learning. It also indicates that
most of the benefits are gained at the earliest production intervals. But continued gains
do occur at the later intervals.
Operational Learning Contributes to Improving Production
$7.50
$7.75
$8.00
$8.25
$8.50
$8.75
$9.00
4 9 14 19 24 29
Cycle Time
Cos
t
20406080100
ProductionInterval

44
4.1.4 Training and Experience Based on the discussion of the previous two sections, both experiential learning and
structured training provide benefits to manufacturing economics. The next analysis
examines the interaction between these two processes. Figure 8 provides a graphical
representation of the relationship between production interval, training level, and cycle
time.
Several key points emerge from this graph. First, at the early production intervals, the
impact of training is minimal. When one views the cycle times achieved across all
training levels below production interval ten, it is clear that providing additional training
does not yield improved cycle times. This indicates the critical nature of operational
learning in the early stages of ramp-up.
However, when the higher production intervals are reached, training becomes absolutely
necessary to achieve the best cycle times. The graph in Figure 8 indicates that the
shortest cycle times can not be reached without a significant investment in training. The
upper right side with the shortest cycle times are only possible when at least a training
level of five is provided. This graph represents a need for the training investment to be
made, even if the benefits are not immediately apparent.
At the middle of the graph in Figure 8, an understanding of the balancing that occurs
between structured training and experiential learning is shown. With full training the
minimum cycle time can be achieved after forty-five production intervals or 45,000 parts.

45
However, with the minimum level of training provided, seventy production intervals or
70,000 parts are required before the minimum cycle time can be achieved. This result
demonstrates that training can shorten the ramp-up phase of production. This translates
into 25,000 parts being made at slower cycle times due to reduced training amounts. The
slopes of the curves on this graph indicate a generalized rate of substitution between
structured training and operational learning. However, as previous graphs have indicated
these two concepts are not directly interchangeable.
The connection between cycle time and cost has been made previously. When this
graph indicates improved cycle times can be reached, the real indication is that with
shorter cycle times, the cost per piece generally decreases.
1 2 3 4 5 6 7 8 9 101
15
30
45
60
75
90
Training Level
Production Interval
Relationship Between Interval, Training Level, and Cycle Time
17-1915-1713-1511-139-117-95-7
Cycle Time(seconds)
Figure 8: Relationship Between Production Interval, Training Level, and Cycle Time

46
4.1.5 Ramp-Up Another benefit of the analyses conducted using this framework is determining an
optimal cycle time for a given training level and production interval. Achieving optimal
cycle time is important to effectively utilize investment made in equipment and labor. If
cycle times are too slow, equipment and labor are more expensive then necessary,
increasing the cost of a good part. If cycle times are too fast, rejects and unplanned
downtime increase, adding to the cost of good part.
As indicated in Figure 9, least cost cycle time decreases over increased production
intervals. The largest decreases to cycle time occur during the first production intervals.
At later production intervals cycle time still decrease although less dramatically.
Additionally, cycle times plateau for a series of production intervals. This occurs once
initial experiential learning has been achieved. Attempting to run faster than optimal
cycle times creates increased rejects and unplanned equipment downtime.
The graph in Figure 9 also indicates that increasing the training amount will decrease the
least cost cycle time at any given production interval. For example, at production
interval thirty, providing only level one training yields an optimal cycle time of 12
seconds. But, with training level ten, at that same production interval of thirty, the
optimal cycle time is 7.75 seconds. This is a difference of 4.25 seconds in cycle time at
this one production interval a 35% reduction in cycle time. Additionally, the graph
shows that at the highest production interval, training achieves a significantly faster cycle

47
time by 3.75 seconds. As such, increased training also yields benefits in long-term cycle
time reduction.
579
11131517192123
1 10 20 30 40 50 60 70 80 90 100
Production Interval
Cyc
le T
ime
Training Level 1 Training Level 5Training Level 10
Figure 9: Ramp-Up Optimal Cycle Times
4.1.6. Single Cycle Times
Without quantitative analyses to determine the optimal cycle time, production managers
may choose a single cycle to run a process from the first production interval through the
last. When this occurs, there can be significant cost increase above the best achievable
results. The results of this analysis are displayed below in Figure 10.
If the single cycle time is too slow, at the earliest production adverse consequences
relating to unplanned downtime and reject rate are reduced, but this has a minimal

48
impact. At the later production intervals that same slower cycle time creates additional
cost based on inefficient capital and labor usage. When this cycle time is viewed over the
entire production run, it produces a cost higher than that achieved with optimal cycle
times throughout ramp-up.
At the opposite extreme, if a cycle time is chosen that is too fast, the earliest production
intervals experience tremendous rejects and unplanned downtime. These two adverse
consequences increase the cost per piece. At the later production intervals this same
cycle time may produce few consequences since the knowledge needed to run at these
faster times has been obtained by employees.
Another important concept represented on the graph is that the width of lines represent
the range where costs increase. Providing training increases the width of the 0-1% cost
increase range. This means that even if a poor decision is made regarding cycle time, the
cost increase is not as significant. For lower training levels, choosing the wrong cycle
time and continuing to operate at that speed for the entire production volume has more
substantial consequences.

49
1 2 3 4 5 6 7 8 9 1055.756.57.2588.759.510.51213.51516.51819.5
Training Level
Cycle Time
Single Cycle Time Cost Increase
8.0%-9.0%7.0%-8.0%6.0%-7.0%5.0%-6.0%4.0%-5.0%3.0%-4.0%2.0%-3.0%1.0%-2.0%0.0%-1.0%
Percentage Increase over
Best Cost
Figure 10: Single Cycle Time Cost Increase
4.1.7 Additional Process
By changing key inputs to the generic cost model, other detailed process based cost
models can be emulated. A variety of changes can be made from material and energy
costs per piece to number of works required. For these analyses the cost of capital was
changed, but other production variables are similar to other analyses. This allows the
generic process based cost model to be representative of other manufacturing processes
with various capital investments. The optimal cycle time is determined, but the
relationship between cycle time and downtime and unplanned equipment downtime are
unchanged from the previous analysis. By varying the cost of capital the training level

50
variation can be determined for other processes. Therefore, the next set of analyses
indicates the changes to training level for a set of manufacturing processes with various
capital investments.
$1M Capital Investment
-$30,000
-$20,000
-$10,000
$0
$10,000
$20,000
$30,000
$40,000
$50,000
$60,000
0 2 4 6 8 10 12
Training Level
Cost
Figure 11: Key Training Investment Points for $1 Million Capital Investment
First, when the cost of capital is decreased to $1 million, the efficient level of training
decreases as well. This is shown in Figure 11. For the previous analyses when the
capital investment was $5 million, the efficient amount of training was level four. In
this situation, the efficient training level decreases to level two.
Similarly, the point of limited financial incentives for additional training occurs at level
four. For the previous analyses, this training level was eight. This occurs because the
decreased cost of capital changes the benefits that can be obtained from training. With

51
less costs associated with manufacturing, the cost of training becomes a larger
percentage. Therefore more savings are required for the training to deliver before it
becomes a financially unwise decision.
On the opposite side of the spectrum, when the capital investment is increased to $10
million, the key training points shift. The graph for this analysis is contained in Figure
12. With a capital investment of $10 million the efficient training investment level is
eight. Of interest is that the savings from training never crosses the x-axis. This
indicates that for the training levels examined here, there never is a point where training
ceases to provide financial benefits. A point at a training level above 10 may occur
which financial benefits are no longer achieved. The points shift because as the cost
shifts, the opportunity for training savings also shift. With increased capital costs,
efficiently running the equipment with better cycle times is more important. Those better
cycle times are only achievable through training.
Again, given that the cost of capital is such a greater percentage of overall costs as
compared to the cost of training create more opportunity is available for savings provided
by the training. This causes the points to shift to greater levels of training due to
increased capital costs.

52
$10M Capital Investment
$0
$10,000
$20,000
$30,000
$40,000
$50,000
$60,000
$70,000
0 2 4 6 8 10 12
Training Level
Cost
Figure 12: Key Training Investment Points $10 Million Capital Investment
The optimal level of training changes depending on the capital intensity of the process.
The key investment points shift based on the relative cost of capital to the relative cost of
training.
4.2 Stamping
The next analysis was conducted using the previously described stamping model. These
analyses were run to expand the understanding provided by these relationships by
incorporating more of the details of the stamping process. This fully detailed stamping
model contains additional inputs and calculations, beyond those in the generic model.
For example, more specifics around material cost and usage are provided. Additional
information regarding equipment cost and type is also calculated.

53
Again cycle time ranged between four seconds and thirty seconds, with time steps broken
down to a quarter of a second. Ten training levels were also analyzed, with training
costing the same amount by incremental level as the cost applied to the generic model.
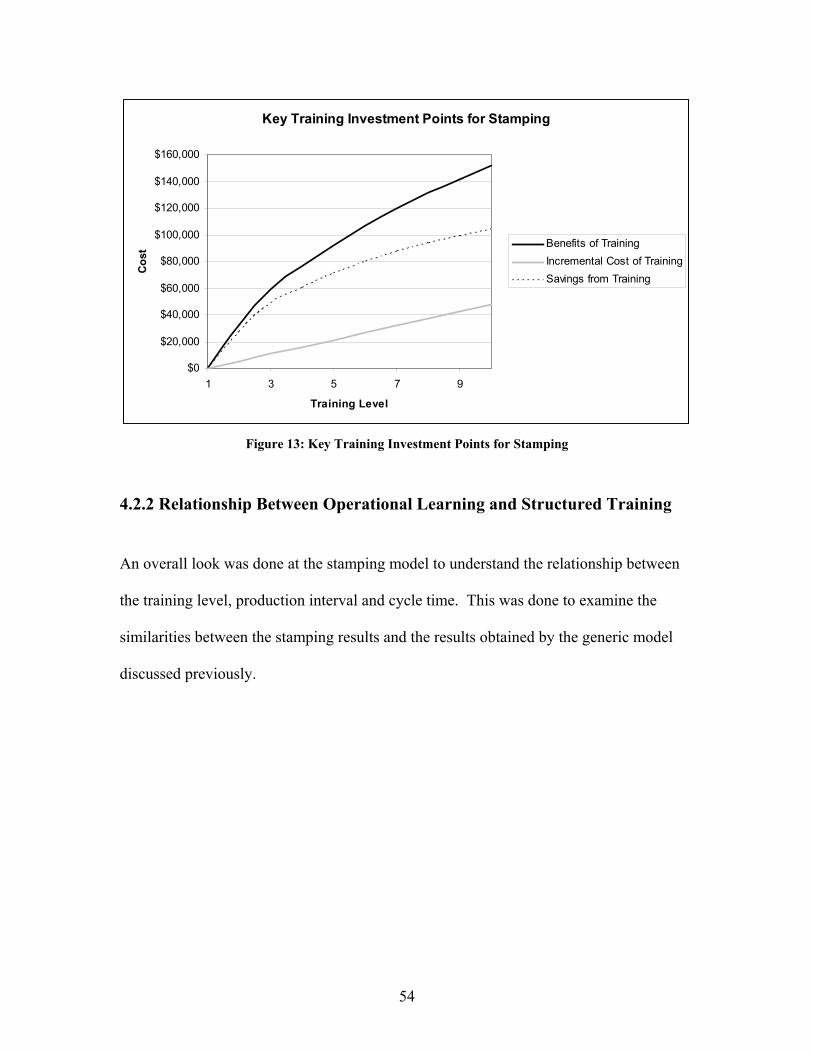
4.2.1 Key Training Investment Points
The next analysis investigated the same critical training investment points as the second
analysis performed with the generic model. An interesting result was obtained. The
incremental cost of training for this process was always considerably less than the
savings achieved by this training. At no point was there a diminishing financial return on
investment made in training. The difference between the two models is predominately
the treatment of variable costs. The detailed stamping model had greater costs for
material and energy than were calculated by the generic model. Because of these
differences in variable costs, reductions in reject rates became critical. Reductions in
reject rates occur through more training. Another possible explanation is that the cost of
training was too small given the manufacturing operation investigated.
54
Key Training Investment Points for Stamping
$0
$20,000
$40,000
$60,000
$80,000
$100,000
$120,000
$140,000
$160,000
1 3 5 7 9
Training Level
Cos
t Benefits of TrainingIncremental Cost of TrainingSavings from Training
Figure 13: Key Training Investment Points for Stamping
4.2.2 Relationship Between Operational Learning and Structured Training An overall look was done at the stamping model to understand the relationship between
the training level, production interval and cycle time. This was done to examine the
similarities between the stamping results and the results obtained by the generic model
discussed previously.

55
1 2 3 4 5 6 7 8 9 101
10
20
30
40
50
60
70
80
90
100
Cycle Time
Training Level
Interval
Stamping Analyses
17-1915-1713-1511-139-117-95-7
Figure 14: Application of Operational Decision Relationships to Detailed Stamping Model
The graph above in Figure 14, is similar to the graph in Figure 8. As such, similar
conclusions result as well. At the starting production intervals, increased training
provides no substantial benefits to achieving faster cycle times. During these first
production intervals, experiential learning is the key contributor to better cycle times.
This is because across the entire spectrum of training levels, no appreciable difference is
noted in cycle time at the earliest production intervals.
Again at the highest production intervals, training is required to reach the shortest cycle
times. Without a significant investment in training, the shortest cycle times are
unreachable. This time the requisite training level is six. To achieve these best cycle
times training of at least level six and significant production experience must occur.
CycleTime

56
The slope of the boundary lines between cycle times, balancing the benefits of training
become steeper at the higher production intervals. At the lower intervals, the slope is less
steep and therefore indicates the importance of operational learning at these times.
These analyses represent the scope of information provided by the methodology
developed for this research. Additional analyses are possible given the models developed
and the information available.

57
5. Conclusions
5.1 Training Investment
The previous analyses demonstrate the importance and impact of training for a
manufacturing workforce. An obvious, but critical point, is the conclusion that
providing structured training translates into financial benefits. By providing structured
training on the manufacturing process, problem solving skills, and other information, that
manufacturing process improves its performance on important metrics. In this particular
research, the benefits translated into reduced rejects and reduced unplanned equipment
downtime.
An efficient training investment point exists, where the highest return on investment can
be obtained. To maximize the use of limited financial resources, the methodology
presented here determined the efficient training point. As indicated through various
analyses this point can shift depending on process specifics. This shift indicates the need
for quantitative analysis of the benefits of training to be most helpful.
Additionally, there is a point at which continued investment in training does not yield
additional financial benefits. This point of no financial benefits indicates the upper most
training investment when monetary benefits will be achieved by investing to a particular
training level. Similar to the efficient training level, the point of no financial benefits

58
changes based on particular process conditions. Again this indicates the need for
quantitative analyses of training benefits to achieve the best return on investment.
As mentioned previously, the benefits of training investigated here are purely financial.
Many other benefits of training are discussed in other research, including employee
dedication and loyalty (Birdi et al 1997). Although financial benefits are a chief
consideration in deciding how much to invest in training, there are other issues that
manufacturing managers must weigh. The conclusions here should not be an indication
that management should cease to train above a certain level, but that financial incentives
change.
5.2 Benefit of Production Experience
As many of the previous analyses discussed, there is a distinct benefit gained through
production experience. The operational learning occurs more distinctly at the earliest
stages of production. However, the learning continues to occur through the entire
production runs considered in this research. Therefore two conclusions are reached based
on production experience.
First, at the earliest production intervals, experience outweighs the importance of
structured training programs. Through production experience the two variables
examined, unplanned downtime and reject rate, are both impacted to improve production
capability. The initial gains of operational learning decrease both the optimal cycle time

59
and the cost of production. Furthermore, the analyses indicate that structured training
provides limited benefits in these early production intervals. It appears as though this
early production experience provides a foundation on which the structured training can
build.
Second, benefits based on production experience still occur even at the latest production
intervals. The benefits to reduced reject rate and unplanned downtime taper off at the
later production intervals, but the analyses indicate that continued reduction still occurs in
both variables. This is critical for manufacturing organizations at the end of production
cycles to still know that appreciable benefits based on operational experience still occur.
The analyses indicate that experience is critical for a manufacturing process to achieve
optimal running times and costs. A need for ample operational experience for training to
become most beneficial also exists.
5.3. Benefits of Both Structured Training and Production Experience
Although the two previous sections discuss the benefits of structured training and
production experience they do so independently. The analyses indicate the benefit of
combining structured training that leads to conceptual learning with production
experience that leads to operational learning. The combination of the two leads to the
best cycle times and least expensive costs. Relying solely on one learning mechanism
puts a manufacturing process at a significant disadvantage.

60
As mentioned previously, a foundation of operational learning appears to provide better
results for structured training. Even at the later production intervals, when experience
does not provide as much benefit, the combination of structured training and operational
experience becomes evident.
5.4 Selection of Cycle Time
A significant contribution of the framework in this research is the determination of
optimal cycle time. This methodology allows for the calculation of an optimal cycle
time based on process decisions such as production interval and training level. The
calculation of this optimal cycle time takes the guesswork out of one decision made
during ramp-up by production managers. The model determines the cycle time at each
point during ramp-up and, therefore, generates an optimal rate at which the ramp-up
process can occur and reach steady state. The ramp-up curve is a critical approach for
manufacturing managers to use during process start-ups.
Additionally, several analyses presented indicate the significance of selecting a cycle
time at each production interval and training level. If comprehensive analyses are not
performed and a production manager selects an inappropriate cycle time, costs increase.
The cycle time selection becomes critical in achieving optimal cycle times and best costs
for a production process.

61
This determination of an optimal cycle time is achieved based on the specific approach
taken in this research. Using cycle time as a variable, allowed for analyses of this
important decision to occur.

62

63
6. Policy Implications
The policy implications of this research fall into two categories: those which apply to
corporate strategy and those which apply to government policy. The first set of
recommendations impacts corporate strategies involving manufacturing ramp-up. The
second group of recommendations applies to government policymaking. These results
suggest ways that government policy making in the area of worker development can be
made more effective.
6.1 Corporate Changes
The research conclusions point to specific areas of improvement. Within the area of
corporate policy recommendations, two strategic approaches are most important to
implement. The first is an increased emphasis on and use of quantitative analyses of
manufacturing process ramp-up. The second strategy is to optimize investment in
structured training programs, based on results provided by quantitative analyses.
6.1.1 Quantitative Analysis of Manufacturing Process Ramp-Up
These results suggest that the operators of manufacturing facilities should examine
process ramp-up more quantitatively. Frameworks, such as the one presented in this
thesis, provide mechanisms for information to be more effectively used both before and

64
during ramp-up. As the results indicate, the use of these analyses can translate into
financial savings.
As discussed in Section 4.1.5, the analyses quantify the benefit of an optimal cycle time
over the course of production ramp-up. By selecting the optimal cycle time, inefficient
use of capital equipment and labor and increased reject rate and unplanned downtime can
be avoided. Without the quantitative analyses of cycle time, costs can increase by as
much as 9%. Further discussion of the impact of cycle time is available in Section 4.1.6.
To perform these analyses, a significant change may be needed in manufacturing
facilities. Frequently, decisions are made by individuals with years of experience based
on their acquired knowledge. A shift to more mathematical analyses can be perceived as
a threat, to these individuals and their accumulated experiences. To minimize the
potential of losing their involvement, employee experiences must be built into the
relationships between cycle time, production interval, structured training and unplanned
downtime and reject rate. To effectively use these models, experience and data from
previous ramp-ups should be included. For the models to be used most effectively,
accuracy confirmation is required. Effective implementation of the models depends on
integrating the experiences of knowledgeable employees. Additionally, upper levels of
management should insist on quantitative analyses to assist in decision making.
Given the benefits of modeling and analysis, production decisions should be made early
enough to give ample time that these analyses can be done. The results presented here

65
take time to build. A model for the process must either be created, or modified, to meet
the specifics of the particular manufacturing process being investigated. Therefore,
companies need to build time into production development schedules for this work to be
done. Traditionally, production ramp-up schedules are tight and non-essential work is
eliminated as the schedule slips. The results of this research indicate there is a real price
to be paid for not systematically examining production ramp-up.
All of these recommendations can be implemented. Companies must make the decision
to promote and use quantitative analyses of manufacturing ramp-up strategies. The
added difficulty of committing to this decision with appropriate resources throughout the
production development process may prove more difficult. When schedules slip and
financial resources become constrained, implementation of these decisions will be
challenging.
6.1.2 Investment in Training
As discussed in Chapter 3, the data linking training to manufacturing performance
metrics is limited. In spite of this limited data, the results of this research should
encourage corporations to continue investment in training. Initial analyses indicate that
training benefits a manufacturing process during ramp-up. Training improves two key
manufacturing performance metrics: unplanned downtime and reject rate. Decreases in

66
both of these metrics translate into financial gains for the company, and the research
suggests that there is a level of training that optimizes these gains.
Although some analyses discussed in this thesis indicate there is an efficient point and a
point of no financial benefit for training, these only reflect the financial benefits obtained
by training. Even when accounting for only financial benefits, the key investment points
may even be a higher training investment level than those currently being provided. For
several of the analyses the key investment training points are at the higher levels of
training. These levels represent a significant investment in training. Therefore, it is
unlikely that the current investment in training reaches optimal levels.
6.2 Government Investment The conclusions of this research suggest that the government has two main
responsibilities:
1. Government must continue to invest in training programs for manufacturing
workforces.
2. Government should be actively encouraging methodologies which quantitatively
support the benefit of training.
6.2.1 Continued Investment in Training Programs The analyses indicate that an investment in training has substantial benefits. The
government, both federal and state, has correctly chosen to allocate resources to training
of workers. Continued support for the Workforce Investment Act (WIA) of 1998,

67
including reauthorization, is recommended. As discussed in Chapter One, the WIA is
the first comprehensive legislation to address worker training in the United States.
The need for manufacturing employee training to improve production performance has
been demonstrated by this research. Without some support of the government, continued
investment is unlikely. The WIA creates state organizations to manage training
approaches, within legislated guidelines. The state organizations can delegate the work
further into local agencies. Local organizations are in a better position to determine the
training needs of a particular community.
The WIA is certainly a positive step for training investment. However, this research
indicates that modifications to the approach of the WIA are required. First, a requirement
on specifics of training investment data should be required. With better data, better
analyses, similar to those done in this work, can be performed. Better analyses leads to
more efficient use of constrained resources, including resource allocation to training.
Second, the WIA should increase resources to offset training costs for employers.
Currently, up to fifty percent of training costs can be reimbursed by governmental
organizations for companies training employees (http://www.odod.state.oh.us/oitp.htm).
This amount should change based on several factors. First, target industries should be
able to obtain increased reimbursements. Each locale can identify the target industries
based on industries the community is looking to attract, grow or maintain. For some
communities, this will likely include manufacturing facilities. Second, smaller

68
companies should be able to recoup larger amounts of training costs. Due to limited
resources, smaller companies have historically invested less in training (NWAC).
A third modification to the WIA should be expansion of Title I to specifically describe
involvement of employers. Currently, the WIA describes assistance to employees, but
little is said regarding employers. Expansion of the WIA to include a requirement for
employer involvement would more actively engage the business community in the
development of governmental approaches to training needs and results. The WIA should
require local ‘one-stop’ agencies develop outreach programs to inform local industries of
the services available through the WIA. Details regarding the outreach program should
be decided by the local WIA agency.
Governmental organizations providing training resources should be requiring companies
receiving money to track the benefits of training more aggressively. Measurement is key
for both the government investing the money in training and the company investing the
time. This is discussed in more detail in Section 6.2.2.
6.2.2 Call for Quantitative Data on Training Analyses
With the quantity of resources devoted to the various training programs, ensuring return
on that investment is critical. As part of the grant for training programs, government

69
agencies should require that implementing organizations collect data. This data can be
translated into analyses that demonstrate the importance of structured training programs.
The framework presented here begins to quantify the results of training. Other
approaches are possible for training analyses. Organizations should not be limited to the
approach taken here, but should explore other mechanisms for quantitative
methodologies to analyze training benefits.
Organizations that fund training should expand their funding into quantitative analyses of
training benefits. This includes developing methodologies to analyze the return on
investment for training to expanding to improving training assessment. Analyses
detailing the benefits of training provide better justification for the allocation of
governmental resources.

70

71
7. Future Work
Although this research is a contribution to quantitative analyses of training in
manufacturing environment, there is continued work to be done. Two primary areas
require further exploration. The first is additional data collection and analyses with that
data. The second area is the creation of additional methodological tools to explore
training benefits.
7.1 Additional Data Collection and Analyses
As mentioned previously, data on actual production start-ups is not readily available.
With the controlled chaos of equipment start-ups, organizations are not able to gather the
data necessary to determine the full relationships between cycle time and training and
unplanned downtime and reject rates.
Specific data required would require tracking information from multiple manufacturing
process start-ups using the same production process. First, information about the
training approach taken at the plant would be required to understand the level of training
provided to employees. Then during the process ramp-up, actual data on the reject rate
and unplanned downtime would be collected. This data, once pooled, could more
explicitly define the relationship between production interval, cycle time, structured
training and reject rate and downtime. This more defined curve would yield even more
practical results for use in actual manufacturing ramp-ups.

72
To extend this data collection to other manufacturing processes provides growth in the
analyses performed. This growth leads to refinement of the ideas presented here and a
continued systematic methodology of analyzing training benefits. Similar data would
need to be collected. Several manufacturing operation ramp-ups would need to be
analyzed. Specific information on their structured training approach and cost would be
required. Then actual data on reject rate and unplanned downtime for various cycle times
and production intervals would be collected.
Complete analysis of other manufacturing processes allows for comparisons to the
research presented here. That comparison confirms the research conducted.
With continued research in this field, manufacturing as a whole is improved through
better ramp-ups and continued operation. Data will be required for the next step of
moving academic research into practical applications.
7.2 Further Quantitative Analyses of Training
Collectively, companies spend billions of dollars a year training their workforces. In the
last few years, the spending has been approximately $100 billion a year within the
business community (Eisen 2004). Unfortunately there is very little data linking that
investment with quantitative results. For those who work in the training and development
field, the benefits are understood qualitatively. Training specialists have seen the impact
of developing training programs and so continue to advocate for additional training

73
investment in the future. Unfortunately, in tighter fiscal environments more concrete
analyses are required. There is a gap in the research that indicates the return on
investment of training in most industries, and manufacturing in particular.
The methodology presented in this research is one approach to examining the issues of
structured training and operational learning in the manufacturing context. Other
methodologies most certainly exist. Continued work in developing and refining
methodologies ensures that the best approaches are taken when starting up a
manufacturing process.
Of particular interest is the impact of structured training and operational learning in an
ongoing manufacturing operation. The balance between these two learning mechanisms
may be rarely achieved in manufacturing facilities. Through continued research, the
relationship between the two will be expanded.
Expanding quantitative analyses to view continuing operations provides additional help
to the manufacturing industry. The research performed here investigates the ramp-up
process. But, for manufacturing operations currently in full production, an understanding
of where best to invest training resources would be helpful. Further research will need to
explore these issues.

74
There is a tremendous realm of possibilities to examine in the structured training and
manufacturing area. Any research that continues to analyze these relationships is the
most important work to be done in this field.

75
Appendix A Select Sections Summary of the Workforce Investment Act of 1998
Title I: Job Training
• Requires use of individual training accounts through which a participant chooses
from among qualified providers.
o Exceptions:
On-the-Job and Customized Training
Insufficient number of qualified providers
Programs provided by Community Based Organizations
Funding
o 85% allocated to local areas
o 15% for state-wide activities: incentive grants, management information
systems, evaluations, incumbent worker projects.
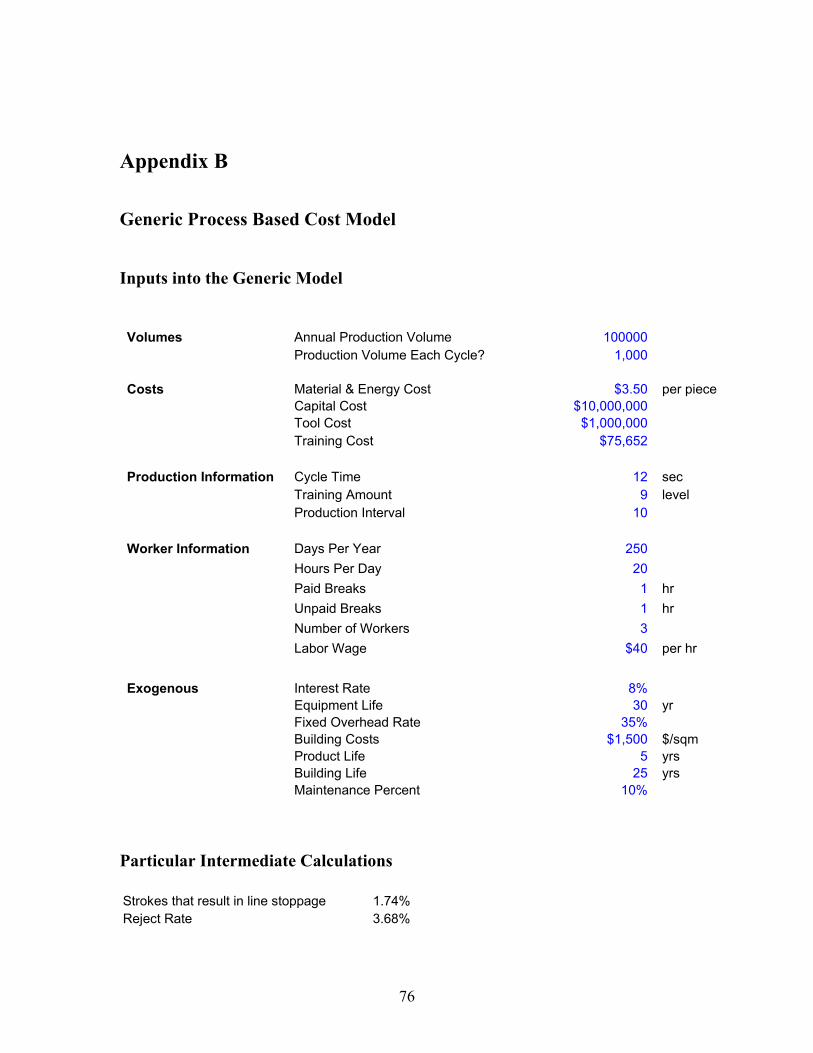
76
Appendix B
Generic Process Based Cost Model
Inputs into the Generic Model Volumes Annual Production Volume 100000 Production Volume Each Cycle? 1,000 Costs Material & Energy Cost $3.50 per piece Capital Cost $10,000,000 Tool Cost $1,000,000 Training Cost $75,652 Production Information Cycle Time 12 sec Training Amount 9 level Production Interval 10 Worker Information Days Per Year 250 Hours Per Day 20 Paid Breaks 1 hr Unpaid Breaks 1 hr Number of Workers 3 Labor Wage $40 per hr Exogenous Interest Rate 8% Equipment Life 30 yr Fixed Overhead Rate 35% Building Costs $1,500 $/sqm Product Life 5 yrs Building Life 25 yrs Maintenance Percent 10%
Particular Intermediate Calculations Strokes that result in line stoppage 1.74%Reject Rate 3.68%

77
Summary Output Table Per Interval Per Part Percent Material & Energy $3,629 $3.63 38.15%Labor $775 $0.77 8.14%Capital Cost $1,274 $1.27 13.40%Maintenance $127 $0.13 1.34%Overhead $446 $0.45 4.69%Tools $2,505 $2.50 26.33%Training Cost $757 $0.76 7.95% Total Cost $9,513 $9.51 100.00%

78
Appendix C Data Points for Reject Rate and Unplanned Downtime Equations
Point 1 Point 2 Point 3 Point 4 Point 5 Point 6 Reject Rate 19.0% 16.5% 7.5% 4.5% 15.0% 11.0%Cycle Time 6 12 6 12 6 12Production Interval 1 1 60 60 1 1Training Level 1 1 1 1 10 10
Point 1 Point 2 Point 3 Point 4 Point 5 Point 6 Downtime Event Percent 12.0% 5.0% 2.2% 1.0% 7.5% 4.5%Cycle Time 6 12 6 12 6 12Production Interval 1 1 60 60 1 1Training Level 1 1 1 1 10 10

79
References Almgren, Henrik (2000). “Pilot Production and Manufacturing Start-Up: The Case of
Vovlo S80.” International Journal of Production Research 38(17): 4577-4588. ASTD Research (2000). American Society for Training and Development
http://www.astd.org/astd/Resources/performance_improvement_community/trends.htm
Benson, P. George, Jayant V. Saraph, and Roger G. Schroeder (1991). Management
Science 37(9): 1107-1124. Birdi, Kamal, and Catriona Allan, and Peter Warr (1997). “Correlates and Perceived
Outcomes of Four Types of Employee Development Activity.” Journal of Applied Psychology 82(6): 845-857.
Burrow, J. and P. Berardinelli (2003). “Systematic Performance Improvement – Refining
the Space Between Learning and Results. The Journal of Workplace Learning 15:6-13.
Busch, John Victor (1987). “Technical Cost Modeling of Plastics Fabrication Processes.”
Doctoral Thesis. Materials Engineering, Massachusetts Institute of Technology, Cambridge, MA.
The Century Foundation, “Corporate Investments in Workers.”
www.tcf.org/TaskForces/retraining_workforce/Corp_Investment.html Eisen, Phyllis (2004). “Skills for a 21st Century Workforce: Can We Meet the
Challenge?” The Manufacturing Institute. Fine, Charles H (1986). “Quality Improvement and Learning in Productive Systems.”
Management Science 32(10): 1301-1315. Fixson, Sebastian K (2002). Linking Modularity and Cost: A Methodology to Assess
Cost Implications of Product Architecture Differences to Support Product Design Doctoral Thesis. Technology, Management, and Policy, Massachusetts Institute of Technology, Cambridge, MA: 123-132.
Haller, Martin, Andreas Peikert, and Josef Thoma (2003). “Cycle Time Management
During Production Ramp-Up.” Robotics and Computer Integrated Manufacturing 19:183-188.
“Job Training and Vocational Education.” Almanac of Policy Issues. June 1, 2001.

80
Ittner, Christopher D. (1996). “Exploratory Evidence on the Behavior of Quality Costs.”
Operations Research 44(1):114-130. Kilbridge, Maurice (1962). “A Model for Industrial Learning Costs.” Management
Science 8: 516-527. Kirchain, R.E. (2001). “Cost Modeling of Materials and Manufacturing Processes.”
Encyclopedia of Materials: Science and Technology. Landini, Michael (1998). “ Workforce Investment Act of 1998.” U.S. Department of
Labor Employment and Training Administration. Lapre, Michael A., Amit Shankar Mukhergee, and Luk N. Van Wassenhove (2000).
“Behind the Learning Curve: Linking Learning Activities to Waste Reduction.” Management Science 46(5):597-611.
Levin, Daniel Z. (2000). “Organizational Learning and the Transfer of Knowledge: An
Investigation of Quality Improvement.” Organization Science 11(6): 630-647. MacDuffie, John Paul (1995). “Human Resource Bundles and manufacturing
Performance: Organizational Logic and Flexible Production Systems in the World Auto Industry.” Industrial and Labor Relations Review 48(2): 197-221.
National Association of Manufacturers (NAM) (2001). “Skills Gap 2000.” National
Association of Manufacturers.
National Workforce Assistance Collaborative (NWAC) “Collaborative Demand for Training Loans.” http://www.ed.psu.edu/nwac/document/train/demand.html
Robinson, Sandra L. (1996). “Trust and Breach of the Psychological Contract.” Administrative Science Quarterly 41:574-599.
Roussea, Denise M. and Shenal A. Tijoriwala (1998). “Assessing Psychological
Contracts: Issues, Alternatives, and Measures.” Journal of Organizational Behavior 19(4): 679-695.
Sinclair, Gavin, Stephen Klepper, and Wesley Cohen (2000). “What’s Experience Got to
Do With It? Sources of Cost Reduction in a Large Specialty Chemicals Producer.” Management Science 46(1): 28-45.
Stein, Eric W., Mark C. Pauster, and David May (2003). “A Knowledge-based system to
improve the quality and efficiency of titanium melting.” Expert Systems with Applications 24: 239-246.

81
Terwiesch, Christian and Roger E. Bohn (2001). “Learning and process improvement during production ramp-up.” International Journal of Production Economics 70: 1-19.
Veloso, Francisco (2001). Local Content Requirements and Industrial Development:
Economic Analysis and Cost Modeling of the Automotive Supply Chain. Doctoral Thesis. Technology, Management, and Policy, Massachusetts Institute of Technology, Cambridge, MA.
Veloso, Francisco, Chris Henry, Richard Roth, and Joel P. Clark (2000). Global Straegies
for the Development of the Portuguese Autoparts Industry. Instituto de Apoio as Pequenas e Medias Empresas e ao Investimento.
Womer, Norman Keith (1979). “Learning Curves, Production Rate, and Program Costs.”
Management Science 25(4): 312-319.