Embed Size (px)
Citation preview
THE B
ENEFITS O
F U
SING
JENN
IFER
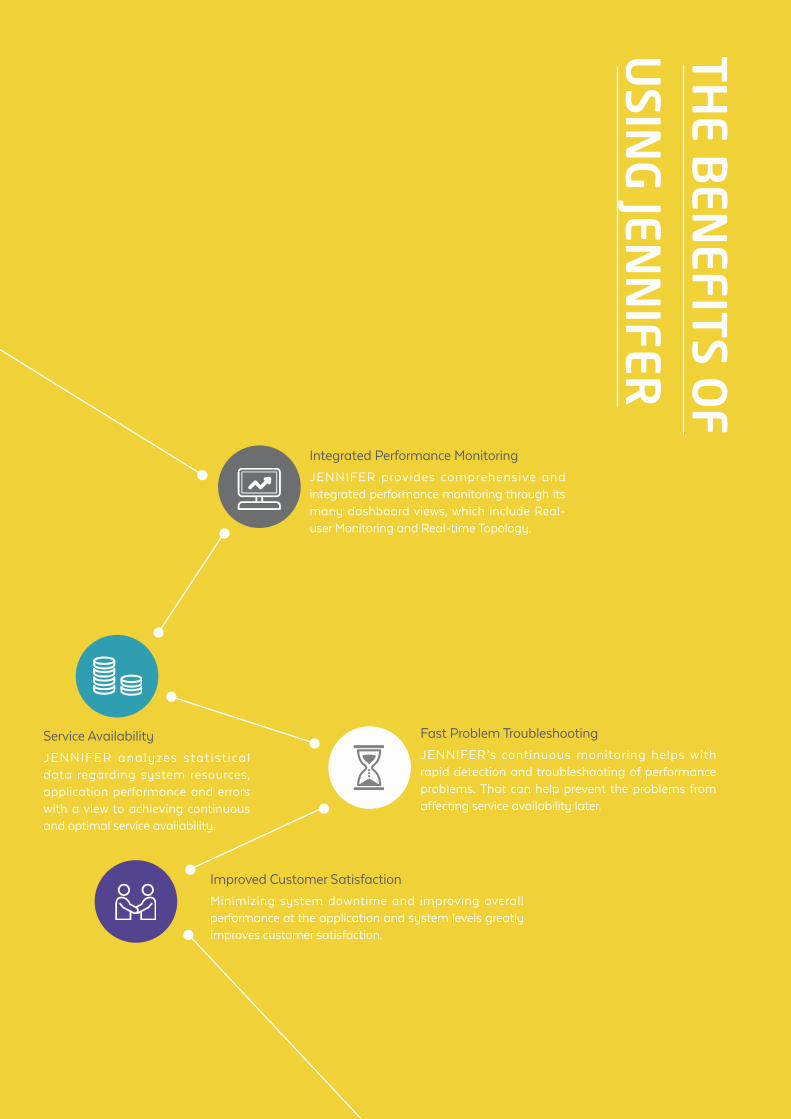
Integrated Performance Monitoring
JENNIFER provides comprehensive and integrated performance monitoring through its many dashboard views, which include Real-user Monitoring and Real-time Topology.
Service Availability
JENNIFER analyzes stat ist ical data regarding system resources, application performance and errors with a view to achieving continuous and optimal service availability.
Improved Customer Satisfaction
Minimizing system downtime and improving overall performance at the application and system levels greatly improves customer satisfaction.
Fast Problem Troubleshooting
JENNIFER’s continuous monitoring helps with rapid detection and troubleshooting of performance problems. That can help prevent the problems from affecting service availability later.
What is JENNIFER?
APPL
ICAT
ION
PER
FOR
MAN
CEM
ANAG
EMEN
T
Monitor Application Performance Intelligently with JENNIFER.
JENNIFER is a performance management solution for monitoring and
analyzing performance at each stage of the lifecycle: development, testing,
launch, operations, and stabilization of applications. It has powerful features
such as real-time monitoring of services and resources, performance and fault
analysis, reporting, etc. Real-time monitoring and X-View help clients to handle
application management tasks more quickly and efficiently.
Application Performance Management (APM)?
Application Performance Management (APM) is a system management methodology that focuses on monitoring and managing application software performance and service utilization. It includes real user monitoring, deep dive application component monitoring, transaction monitoring, and analytics. It is a critical function managed by DevOps, IT operation, application teams, developers, support teams, business managers, and other application professionals.
“
”
AP
PLI
CA
TIO
N P
ER
FO
RM
AN
CE
MA
NA
GE
ME
NT
4
Monitoring Area 01
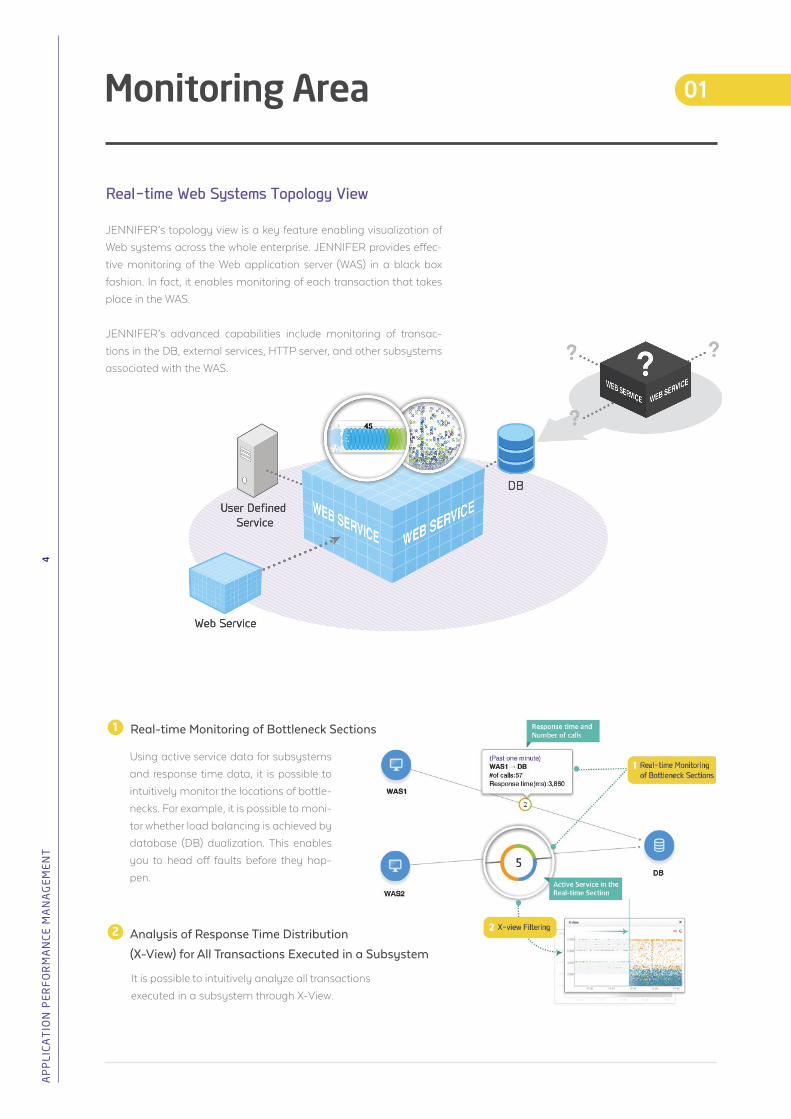
JENNIFER’s topology view is a key feature enabling visualization of
Web systems across the whole enterprise. JENNIFER provides effec-
tive monitoring of the Web application server (WAS) in a black box
fashion. In fact, it enables monitoring of each transaction that takes
place in the WAS.
JENNIFER’s advanced capabilities include monitoring of transac-
tions in the DB, external services, HTTP server, and other subsystems
associated with the WAS.
Real-time Web Systems Topology View
It is possible to intuitively analyze all transactions
executed in a subsystem through X-View.
Using active service data for subsystems
and response time data, it is possible to
intuitively monitor the locations of bottle-
necks. For example, it is possible to moni-
tor whether load balancing is achieved by
database (DB) dualization. This enables
you to head off faults before they hap-
pen.
Real-time Monitoring of Bottleneck Sections1
2 Analysis of Response Time Distribution
(X-View) for All Transactions Executed in a Subsystem
JEN
NIF
ER
5
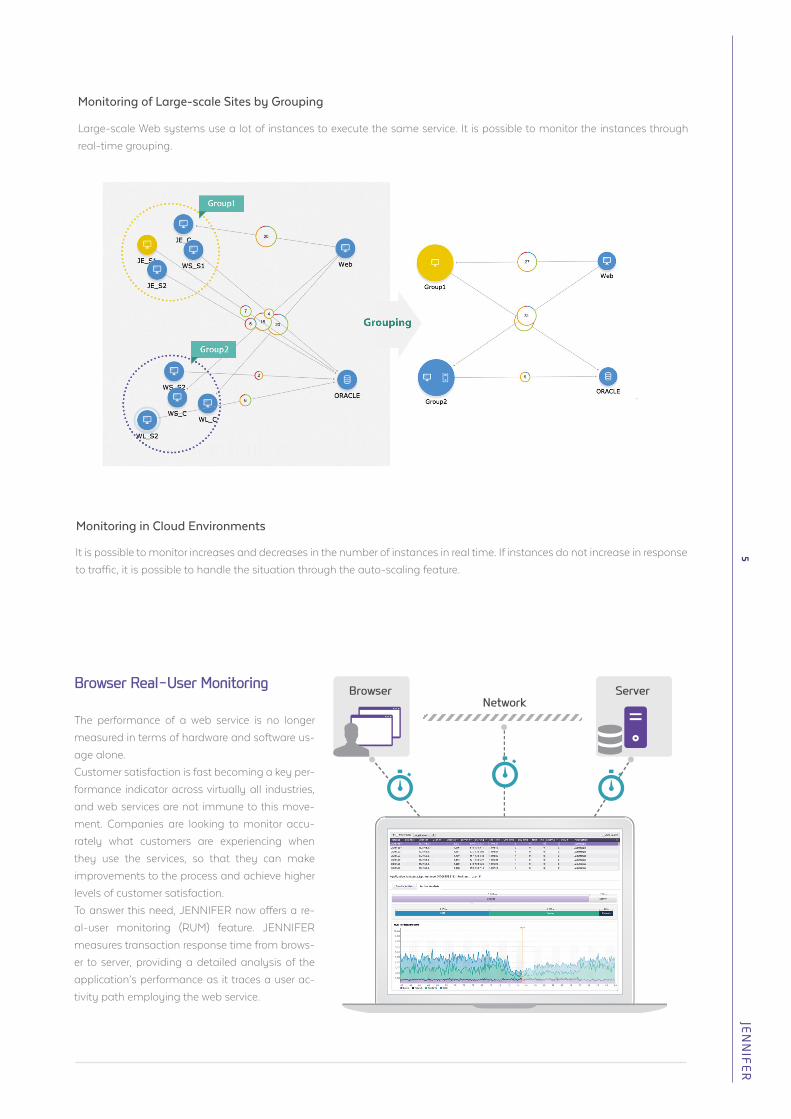
The performance of a web service is no longer
measured in terms of hardware and software us-
age alone.
Customer satisfaction is fast becoming a key per-
formance indicator across virtually all industries,
and web services are not immune to this move-
ment. Companies are looking to monitor accu-
rately what customers are experiencing when
they use the services, so that they can make
improvements to the process and achieve higher
levels of customer satisfaction.
To answer this need, JENNIFER now offers a re-
al-user monitoring (RUM) feature. JENNIFER
measures transaction response time from brows-
er to server, providing a detailed analysis of the
application’s performance as it traces a user ac-
tivity path employing the web service.
Large-scale Web systems use a lot of instances to execute the same service. It is possible to monitor the instances through
real-time grouping.
It is possible to monitor increases and decreases in the number of instances in real time. If instances do not increase in response
to traffic, it is possible to handle the situation through the auto-scaling feature.
Monitoring of Large-scale Sites by Grouping
Monitoring in Cloud Environments
Browser Real-User Monitoring
AP
PLI
CA
TIO
N P
ER
FO
RM
AN
CE
MA
NA
GE
ME
NT
6
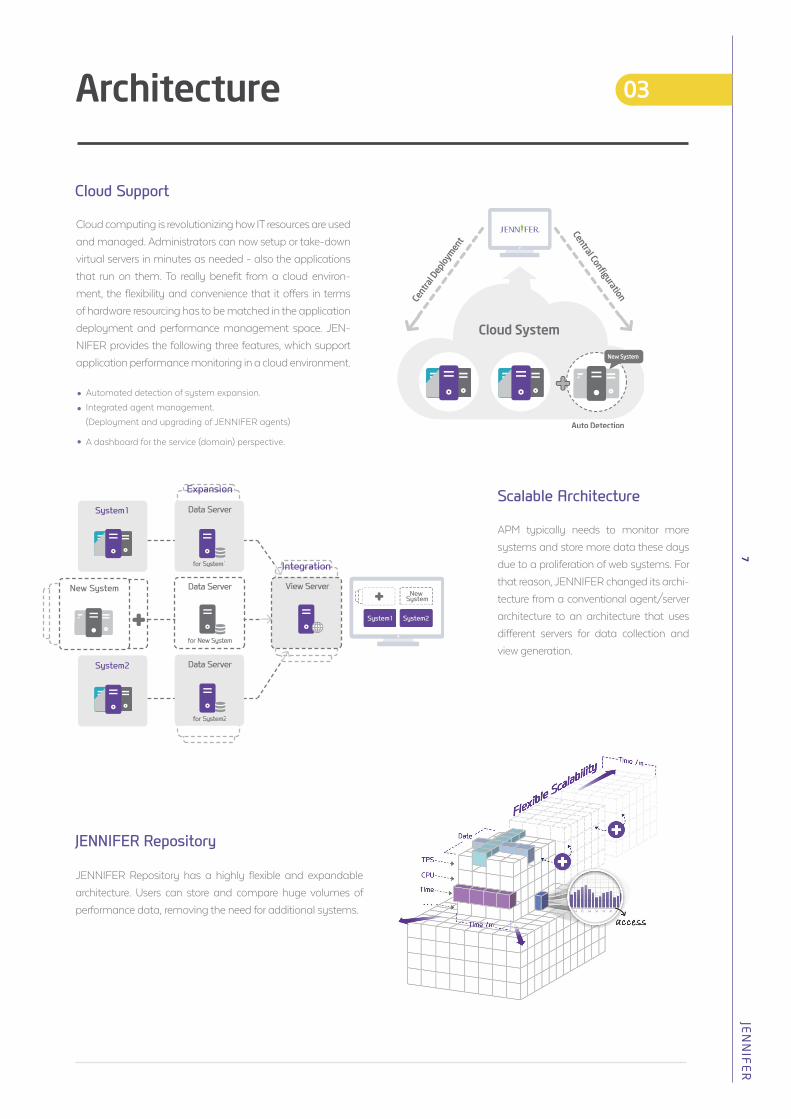
X-View is a chart, developed by JenniferSoft, which visualizes
response times for all executed transactions in graph form. Us-
ers can monitor the response times of all services at a glance
through X-View in order to discover bottleneck patterns. It also
enables analysis of transactions, users, applications, etc. from
various perspectives.
JENNIFER X-View
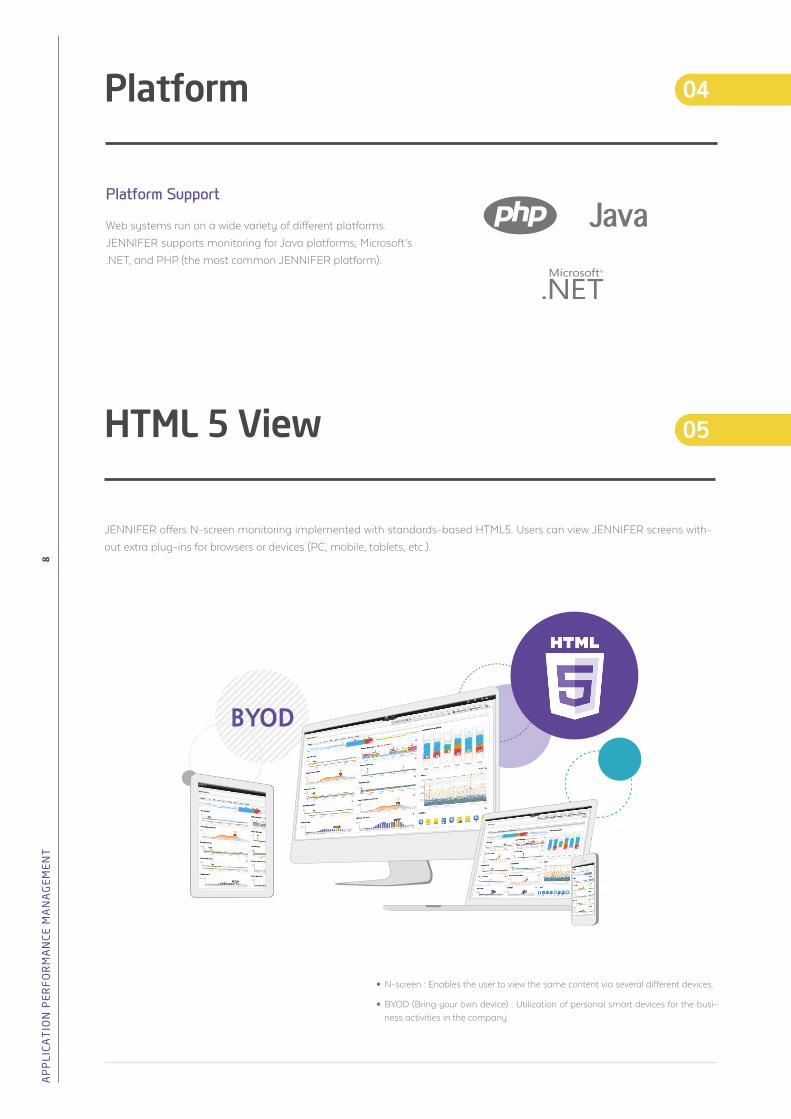
JENNIFER’s X-View analysis tool, showing the response times of individual transactions, has proven its worth to many customers.
Profiling and analysis of individual transactions are advanced functions tools used by developers or professionals specializing in per-
formance tuning. So, JENNIFER also provides a Smart Profiling function that enables easy analysis and configuration of profiling
data. This function is so simple to use that anyone can quickly and accurately identify the location of a performance deterioration or a
processing delay in a transaction by using filtering and analysis.
Smart Profiling
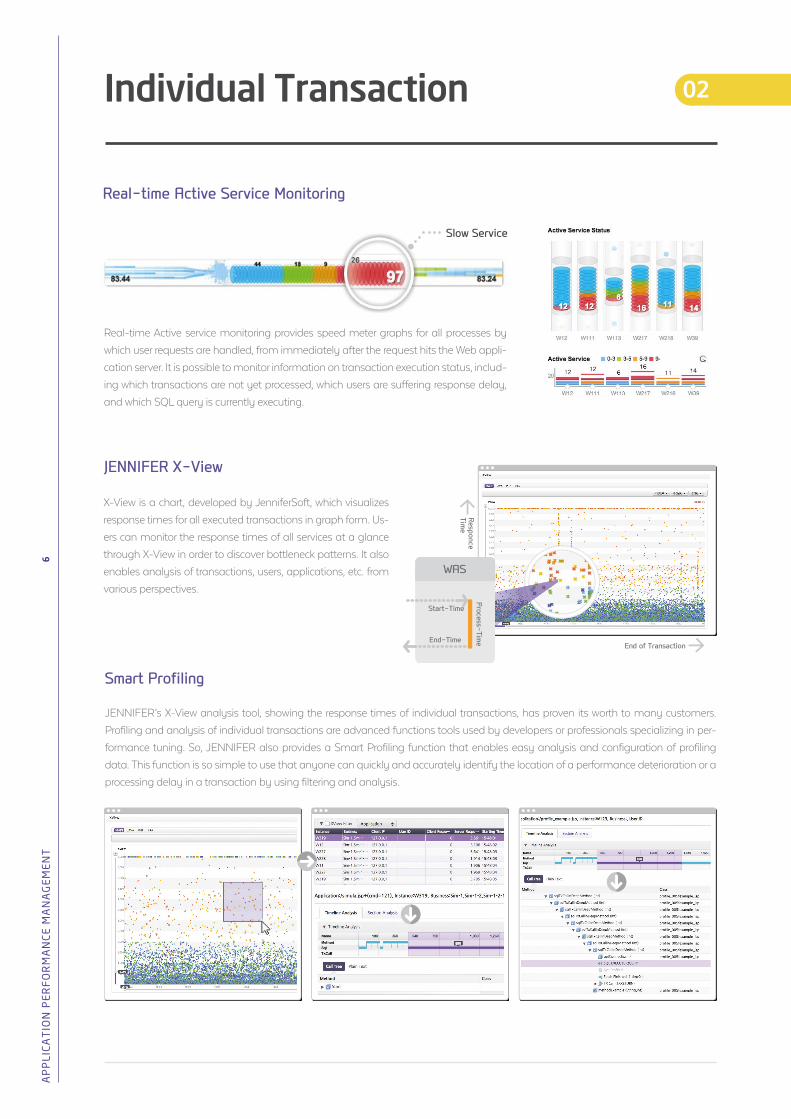
Real-time Active service monitoring provides speed meter graphs for all processes by
which user requests are handled, from immediately after the request hits the Web appli-
cation server. It is possible to monitor information on transaction execution status, includ-
ing which transactions are not yet processed, which users are suffering response delay,
and which SQL query is currently executing.
Real-time Active Service Monitoring
02
Slow Service
Individual Transaction
JEN
NIF
ER
7
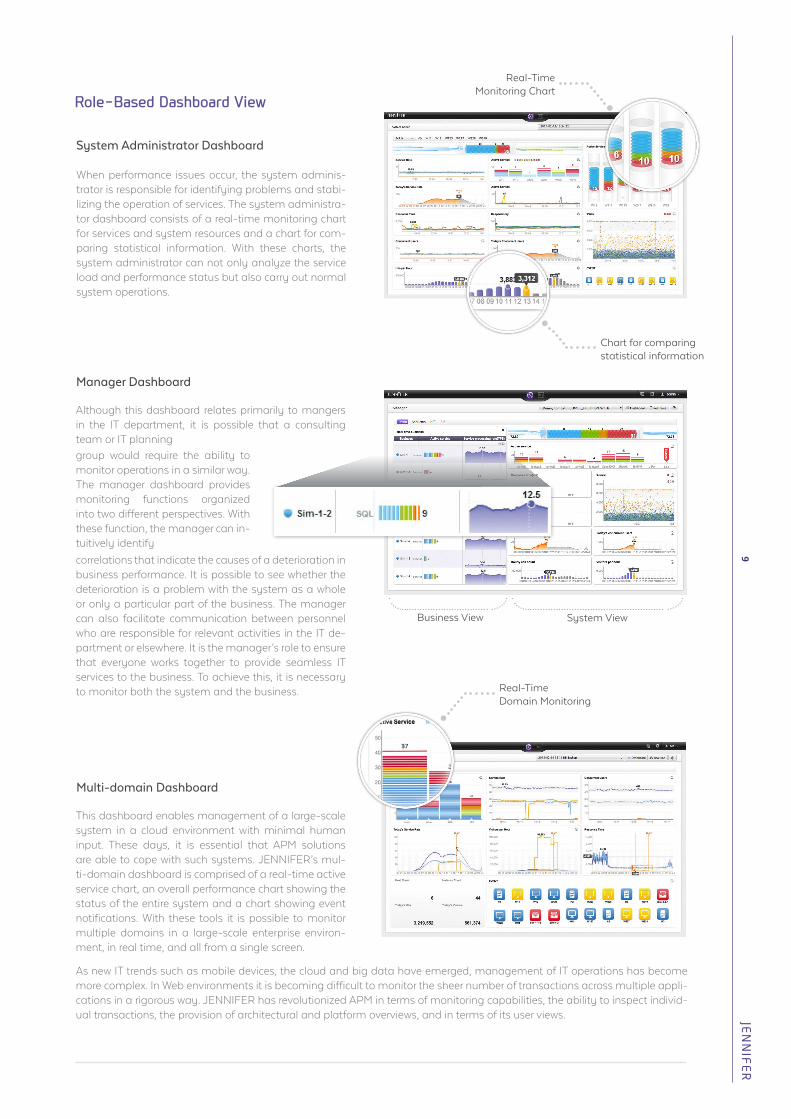
Cloud computing is revolutionizing how IT resources are used
and managed. Administrators can now setup or take-down
virtual servers in minutes as needed - also the applications
that run on them. To really benefit from a cloud environ-
ment, the flexibility and convenience that it offers in terms
of hardware resourcing has to be matched in the application
deployment and performance management space. JEN-
NIFER provides the following three features, which support
application performance monitoring in a cloud environment.
Cloud Support
APM typically needs to monitor more
systems and store more data these days
due to a proliferation of web systems. For
that reason, JENNIFER changed its archi-
tecture from a conventional agent/server
architecture to an architecture that uses
different servers for data collection and
view generation.
Scalable Architecture
JENNIFER Repository has a highly flexible and expandable
architecture. Users can store and compare huge volumes of
performance data, removing the need for additional systems.
JENNIFER Repository
03Architecture
Automated detection of system expansion.
Integrated agent management.
(Deployment and upgrading of JENNIFER agents)
A dashboard for the service (domain) perspective.
AP
PLI
CA
TIO
N P
ER
FO
RM
AN
CE
MA
NA
GE
ME
NT
8
Web systems run on a wide variety of different platforms.
JENNIFER supports monitoring for Java platforms, Microsoft’s
.NET, and PHP (the most common JENNIFER platform).
JENNIFER offers N-screen monitoring implemented with standards-based HTML5. Users can view JENNIFER screens with-
out extra plug-ins for browsers or devices (PC, mobile, tablets, etc.).
Platform Support
N-screen : Enables the user to view the same content via several different devices.
BYOD (Bring your own device) : Utilization of personal smart devices for the busi-ness activities in the company
04
05
Platform
HTML 5 View
JEN
NIF
ER
9
Role-Based Dashboard View
When performance issues occur, the system adminis-trator is responsible for identifying problems and stabi-lizing the operation of services. The system administra-tor dashboard consists of a real-time monitoring chart for services and system resources and a chart for com-paring statistical information. With these charts, the system administrator can not only analyze the service load and performance status but also carry out normal system operations.
Although this dashboard relates primarily to mangers in the IT department, it is possible that a consulting team or IT planning
correlations that indicate the causes of a deterioration in business performance. It is possible to see whether the deterioration is a problem with the system as a whole or only a particular part of the business. The manager can also facilitate communication between personnel who are responsible for relevant activities in the IT de-partment or elsewhere. It is the manager’s role to ensure that everyone works together to provide seamless IT services to the business. To achieve this, it is necessary to monitor both the system and the business.
group would require the ability to monitor operations in a similar way. The manager dashboard provides monitoring functions organized into two different perspectives. With these function, the manager can in-tuitively identify
This dashboard enables management of a large-scale system in a cloud environment with minimal human input. These days, it is essential that APM solutions are able to cope with such systems. JENNIFER’s mul-ti-domain dashboard is comprised of a real-time active service chart, an overall performance chart showing the status of the entire system and a chart showing event notifications. With these tools it is possible to monitor multiple domains in a large-scale enterprise environ-ment, in real time, and all from a single screen.
As new IT trends such as mobile devices, the cloud and big data have emerged, management of IT operations has become more complex. In Web environments it is becoming difficult to monitor the sheer number of transactions across multiple appli-cations in a rigorous way. JENNIFER has revolutionized APM in terms of monitoring capabilities, the ability to inspect individ-ual transactions, the provision of architectural and platform overviews, and in terms of its user views.
Real-Time Domain Monitoring
Chart for comparing statistical information
Business View System View
Real-Time Monitoring Chart
System Administrator Dashboard
Manager Dashboard
Multi-domain Dashboard
AP
PLI
CA
TIO
N P
ER
FO
RM
AN
CE
MA
NA
GE
ME
NT
10
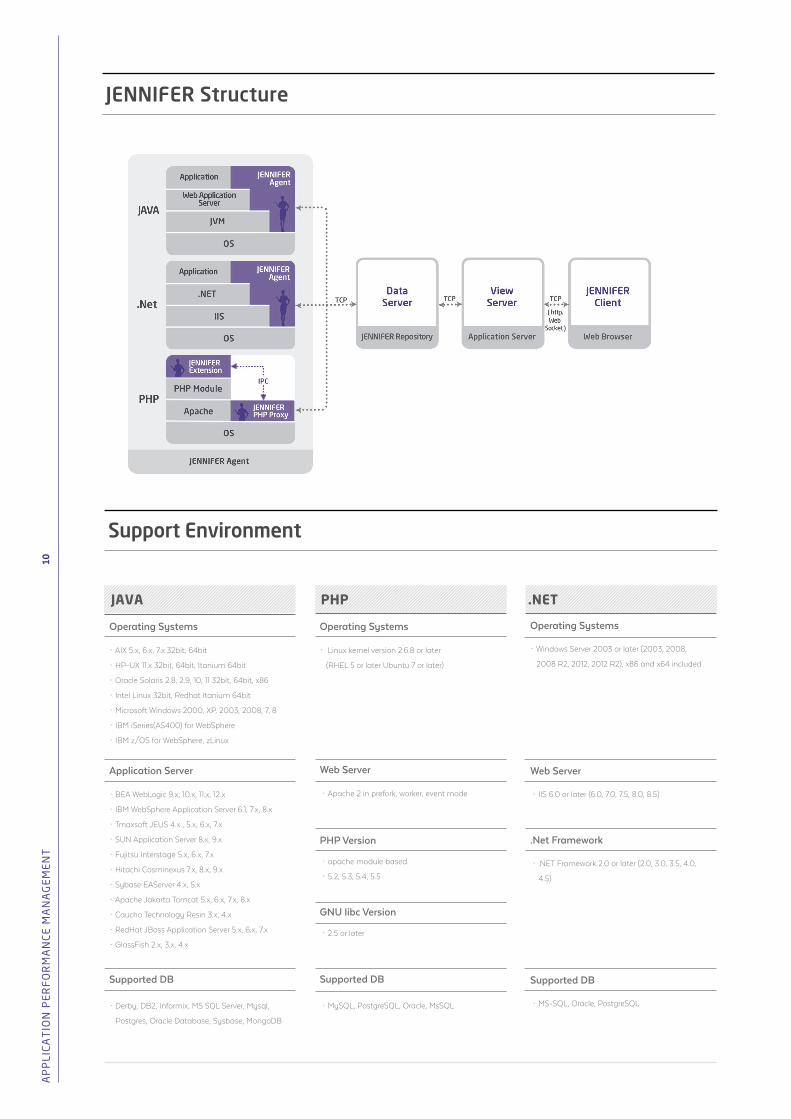
JENNIFER Structure
Support Environment
Operating Systems
‧ AIX 5.x, 6.x, 7.x 32bit, 64bit
‧ HP-UX 11.x 32bit, 64bit, Itanium 64bit
‧ Oracle Solaris 2.8, 2.9, 10, 11 32bit, 64bit, x86
‧ Intel Linux 32bit, Redhat Itanium 64bit
‧ Microsoft Windows 2000, XP, 2003, 2008, 7, 8
‧ IBM iSeries(AS400) for WebSphere
‧ IBM z/OS for WebSphere, zLinux
Application Server
‧ BEA WebLogic 9.x, 10.x, 11.x, 12.x
‧ IBM WebSphere Application Server 6.1, 7.x, 8.x
‧ Tmaxsoft JEUS 4.x , 5.x, 6.x, 7.x
‧ SUN Application Server 8.x, 9.x
‧ Fujitsu Interstage 5.x, 6.x, 7.x
‧ Hitachi Cosminexus 7.x, 8.x, 9.x
‧ Sybase EAServer 4.x, 5.x
‧ Apache Jakarta Tomcat 5.x, 6.x, 7.x, 8.x
‧ Caucho Technology Resin 3.x, 4.x
‧ RedHat JBoss Application Server 5.x, 6.x, 7.x
‧ GlassFish 2.x, 3.x , 4.x
Supported DB
‧ Derby, DB2, Informix, MS SQL Server, Mysql,
Postgres, Oracle Database, Sysbase, MongoDB
Operating Systems
‧ Linux kernel version 2.6.8 or later
(RHEL 5 or later Ubuntu 7 or later)
Web Server
‧ Apache 2 in prefork, worker, event mode
PHP Version
‧ apache module based.
‧ 5.2, 5.3, 5.4, 5.5
GNU libc Version
‧ 2.5 or later
Supported DB
‧ MySQL, PostgreSQL, Oracle, MsSQL
Operating Systems
‧ Windows Server 2003 or later (2003, 2008,
2008 R2, 2012, 2012 R2), x86 and x64 included
Web Server
‧ IIS 6.0 or later (6.0, 7.0, 7.5, 8.0, 8.5)
.Net Framework
‧ .NET Framework 2.0 or later (2.0, 3.0, 3.5, 4.0,
4.5)
Supported DB
‧ MS-SQL, Oracle, PostgreSQL
JAVA PHP .NET
JEN
NIF
ER K
EY
FEA
TUR
ES
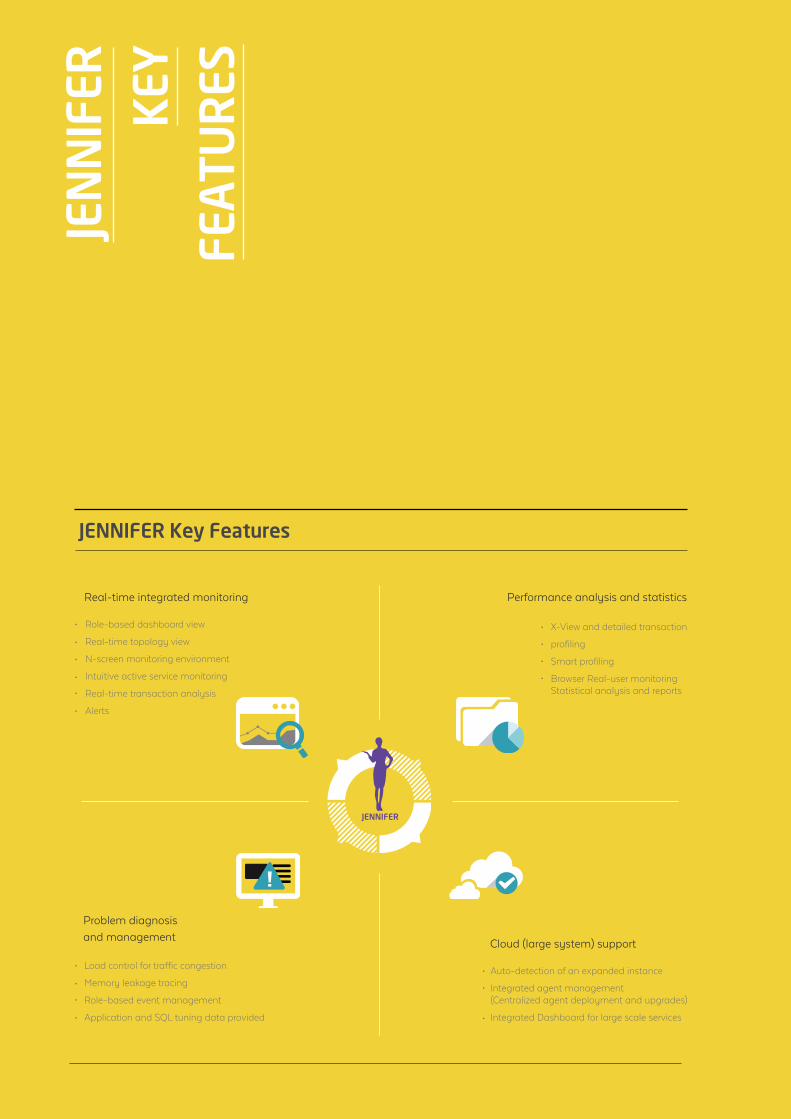
Role-based dashboard view
Real-time topology view
N-screen monitoring environment
Intuitive active service monitoring
Real-time transaction analysis
Alerts
X-View and detailed transaction
profiling
Smart profiling
Browser Real-user monitoringStatistical analysis and reports
Load control for traffic congestion
Memory leakage tracing
Role-based event management
Application and SQL tuning data provided
Real-time integrated monitoring Performance analysis and statistics
Problem diagnosis and management
JENNIFER Key Features
Auto-detection of an expanded instance
Integrated agent management (Centralized agent deployment and upgrades)
Integrated Dashboard for large scale services
Cloud (large system) support
JENNIFER