Embed Size (px)
Citation preview
1
The behaviour of point charges in dielectric media
Piet Th. van Duijnen,a Hilde D. de Gier,a Ria Broer,a Remco W.A. Havenitha,b,c,*
aTheoretical Chemistry, Zernike Institute for Advanced Materials, University of
Groningen, Nijenborgh 4, 9747 AG Groningen, The Netherlands, e-mail:
bStratingh Institute for Chemistry, University of Groningen, Nijenborgh 4, 9747 AG
Groningen, The Netherlands
cGhent Quantum Chemistry Group, Department of Inorganic and Physical Chemistry,
Ghent University, Krijgslaan 281 – (S3), B-9000 Gent, Belgium
Abstract:
Screened Coulomb interaction in dielectrics is often used as an argument for a lower
exciton binding energy and easier exciton dissociation in a high dielectric material. In
this paper, we show that at the length scales of excitons, the screened Coulomb law is
invalid and a microscopic (quantum chemical) description is necessary to describe the
exciton dissociation process. The screened Coulomb law is only valid in regions
where the electron and hole are further separated than a few Ångströms or a few tens
of Ångströms. This is illustrated here for charges in different environments.
Keywords: Organic photovoltaics, dielectric constant, screened Coulomb law, exciton
binding energy, computational chemistry
2
1. Introduction.
In the quest for more efficient organic photovoltaic devices (OPVs), the use of
materials with a high dielectric constant has been suggested.[1] One reason why
organic photovoltaic systems are less efficient than inorganic solar cells like those
based on silicon, is the high exciton binding energy. This is commonly attributed to
the low dielectric constant of OPVs (ε ≈ 4).[2, 3] This idea is based on the screened
Coulomb law in ponderable materials, which tells us that the interaction energy and
force between point charges embedded in such media are given by, respectively (in
atomic units),
(1)
with Qi and Qj the point charges, Ri and Rj their positions, Rij the distance between
them and ε the (relative) dielectric constant of the medium. By definition, ε ≥ 1.0,
furthermore, ε is independent of the type (plus or minus) of the charges, which means
that like (+/+, or -/-) and unlike (+/-) interactions are equally reduced as compared to
the vacuum situation (ε = 1.0). The proof is simple: a charge Qi in a cavity with
radius a, embedded in an infinite continuum with dielectric constant ε gives rise to an
induced charge on the cavity’s surface (Gauss’ law):
(2)
which is independent of a. Letting a going to zero, the potential at Ri vanishes and
one has effectively two coinciding, non-interacting point charges. When a second
charge (Qj) is introduced, that charge gives only rise to a similar pair of charges if the
Uij = QiQj / εRijFij = QiQj (R j − Ri ) / εR
ij
3 ; ε ≥ 1.0
Qi* = −(1 −
1ε)Qi
3
polarisation of the medium at Rj is not affected by the presence of Qi,. In that case the
distance Rij is so large that the total interaction energy can be written as[4]
(3)
which, after inserting Eq. (2), gives Eq. (1).
Hence, Eq. (1) holds only for macroscopic situations, i.e., the charges are averages
over macroscopic volumes, although small with respect to the actual size of the
system, and therefore should be at macroscopic distances (at least about 100 Å[5])
from each other. Moreover, they should also be at macroscopic distances from any
boundary for the system characterized with ε. However, an exciton generated in OPV
materials consists of a pair of unlike charges at a separation of 10 - 20 Å in a
molecular, and therefore highly anisotropic, polarisable environment. As a
consequence, Eq. (1) should not be used to describe or explain charge separation: the
charges must already be farther separated before the screened Coulomb law is
applicable. Hence, it is not straightforward that the charges involved in an exciton
behave like they were in a macroscopic dielectric, and a more indepth consideration
of their behaviour is necessary to understand charge separation in OPVs better.
As early as 1982, Van Duijnen and Thole[6] noted that a dielectric placed between
two interacting charges increases the interaction (εeff < 1.0). Later, Rullmann et al.[7]
showed that microscopic collections of (point) charges and polarisabilities show
behaviour that cannot be described by the simple expression of Eq. (1), and in 1993
De Vries and Van Duijnen[8] pointed out some of the problems connected with
mixing macroscopic and (quantum mechanical) microscopic descriptions of the
behaviour of charges. In 1995 Van Duijnen and De Vries[9] studied systematically
assembles of point charges and polarisabilities, and found that the ‘effective’
Uij =1Rij
QiQj +12(Q
i
*Qj +QiQj*)⎡
⎣⎢⎤⎦⎥
4
dielectric constants (εeff, obtained as the ratio of the forces in vacuo and in
microscopic assembles) may be different for like and unlike interactions. This
deviation was observed to the extent that some arrangements lead to εeff < 1.0 (i.e.,
unlike charges attract each other more than in vacuum) and even εeff < 0.0 (i.e., like
charges attract each other). Other examples of this unexpected behaviour of like
charges can also be found in works of Jarque[10] and Zangi.[11] The ‘unexpected’ in
the preceding sentence holds only in ‘dielectric’ terms: these results are obtained from
microscopic descriptions where the dielectric constant, as a macroscopic parameter, is
not appropriate. Thus for excitons, behaviour that deviates from Eq. (1) is also
expected, and this is the subject of the present investigation. Interestingly, Deslippe et
al.[12] reported exciton interactions in carbon nanotubes and found interactions to be
larger than ‘bare’ interactions, which they coined ‘anti-screening’.
In a theoretical study on excitons in polymers by Van der Horst et al.[13] applying the
Bethe-Salpeter equation, exciton binding energies were found of 0.4 - 0.6 eV. Here,
layers perpendicular to the polymer chain were modelled with a dielectric continuum
with ε⊥ = 3.0. In an appendix, the authors explain how they arrive at the actual used
value of ε⊥ by considering the Poisson equation. The operator for the electron
repulsion energies they used is:
(4)
i.e., they divided the interaction by the dielectric constant. This means that the
continuum is supposed to be present everywhere as a sort of ether. Their procedure
leads to exciton binding energies of 0.4 - 0.6 eV, corresponding to interaction
distances of 8 – 12 Å. Also Lethonen et al.[14] use the bulk dielectric constant for
screening Coulomb interactions in their computational studies based on an effective
mass model on quantum dots with diameters up to only 7 nm.
W (r,r') =Wε (| r - r' |) = 1 / (ε | r - r' |)
5
A much repeated picture is that of a Coulomb potential like Eq. (1) with indications of
the interaction between charges in a dielectricum. Gregg and Hanna[15] suggest that
the strong interaction in excitons is caused by the small dielectric constant in typical
OPVs (ε ≈ 4), in contrast with the free electron-hole pairs in inorganic semiconductors
(ε ≈ 15). In 2004, Gregg et al.[16] put this even stronger: “Thus, increasing ε ... leads
to a greater average distance between the charges.” But there is also a warning:
“Finally, ε is a bulk quantity and is valid only over distances of many lattice spacings;
...” In following papers, this warning is absent, and in the recent review of Clarke and
Durrant[2] the dielectric constant is still a very important parameter, and the Onsager
model, or more recently developed versions[17-22] of it, is still the main[1] operative
theory.[23] In all these works the expected effect of the dielectric constant (or the
permittivity) comes from model calculations based on the Onsager model.
However, excitons in OPVs require a microscopic description, i.e., all local
interactions should be taken into account. In this contribution, the effective force
between charges is studied in different materials, and the consequences for OPVs are
discussed. We will demonstrate that the screened Coulomb law is not applicable for
the description of an arbitrary collection of charges and polarisabilities.
2. Dielectric or not?
Recently Van Duijnen and Swart reported a Discrete Reaction Field (DRF)[24] study
on Sin-clusters[25] (n ranging from 3 to ~5000) in which they arrived at the
experimental dielectric constant from first principles for the larger clusters (n = 1750,
4950).
In the DRF-method the many-body polarisation is treated correctly:
6
(5)
In Eq. (5), µp is the dipole induced at position p by the field E0 plus the field of all
other induced dipoles. E0 consists of any applied field plus the field of any charge
distribution in the system. The dipole-dipole interaction tensors tpq in Eq. (5) contain
only geometric parameters. In DRF, the interactions are properly damped at short
distances in order to avoid too large and unphysical results.[26, 27] The electric
potentials, fields and field gradients of charges are damped in a consistent way and
the damped fields and dipole-dipole tensors are the derivatives of the potential and the
field, respectively [24]. For an arbitrary collection of charges and polarisabilities, Eq.
(5) leads to a matrix equation:
(6)
in which M is the vector of (self-consistent) induced dipoles, E0 the vector of the
initial field, A the block-diagonal matrix of the (vacuum) polarisabilities, and T the
(off-diagonal) interaction tensors. Hence, B is a normal (but many-body)
polarisability thus leading to an induction energy:
(7)
By applying unit fields in x-, y- and z-directions, the effective mean polarisabilities are
obtained from Eq. (6). We note here that the T-blocks in the condensed phases
generally lead to effective local polarisabilities that are smaller than the vacuum
values.[25]
Reversely, by fitting Eq. (6) to (experimental or calculated) molecular polarisabilities,
the vacuum, or ‘free-atom’ polarisabilities {αp} are obtained. With these (‘input’)
parameters the polarisabilities of molecules – not belonging to the learning sets – are
calculated from Eq. (6) with experimental accuracy.[28] Typically, each ‘free’ atomic
µp = α p[Ep0 + t pqµq
q≠ p∑ ]
M = BE0 = [A−1 − T]−1E0
Uind = −12E0BE0
7
polarisability is independent of its ‘chemical environment’: the latter is in all cases
absorbed in the T-blocks of B.
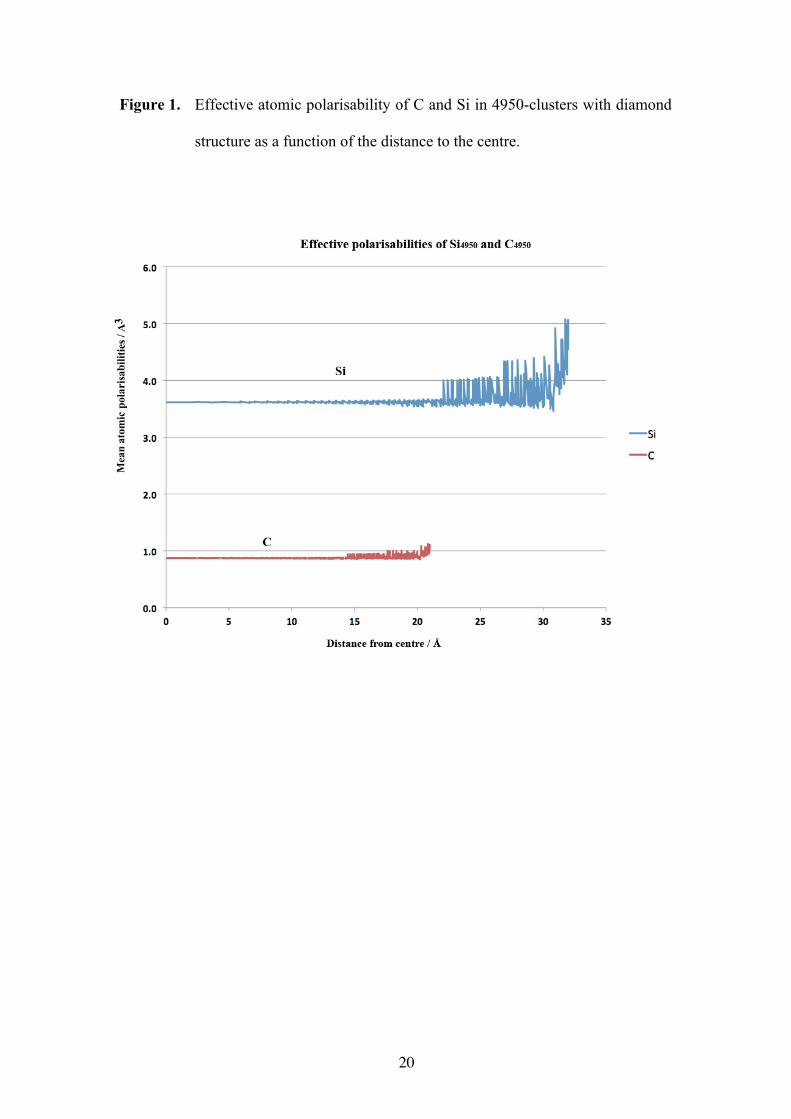
In Fig. 1, the average (per atom) mean polarisablities of atoms of n-clusters (n =
4950) of carbon and silicon in their experimental (diamond) structures are plotted as a
function of their distance to the centre of the (roughly spherical) clusters. For silicon,
the ‘free atom’ polarisability (αSi = 5.9 Å3) was obtained from the calculated
polarisability[29] of Si3, while for carbon the default value in DRF90 was used (αC =
1.3 Å3), which came from a fit to a learning set of 52 molecules.[27]
Figure 1
We note that the calculated average atomic polarisability in the interior is
substantially smaller than the input value. This is caused by the local field
contributions of the induced dipoles in the environment. Since there are no induced
counteracting dipoles outside the edge of the clusters, the mean polarisabilities there
are larger. For Si, αeff = 3.72 Å3 is in perfect agreement with the value obtained from
the Clausius-Mossotti relation:
(8)
where Ω is the average atomic volume, <r> the average atomic radius, and ε the
dielectric constant. Note, that the reverse relation
(9)
is more error prone than Eq. (8), because the denominator comes from numbers that
are in general nearly equal. The average atomic radii were obtained from the volumes
of spheres where the average atomic polarisabilities were about constant (Si: 20 Å,
α =34π
ε −1ε + 2
Ω =ε −1ε + 2
< r >3
ε = 2α + < r >3
< r >3 - α
8
1700 atoms; C: 14 Å, 1900 atoms). From the simulations, εSi = 12 and εC = 6 were
found, for which the experimental values are, respectively, 11.8 and 5.5. That the
error in εC is slightly larger than in εSi, is in agreement with the fact that αSi came from
a specific fit which in general predicts polarisabilities within about 1%, while αC was
taken from a fit to a collection of different molecular polarisabilities[27] which
predicts molecular polarisabilities with an error of about 6%.
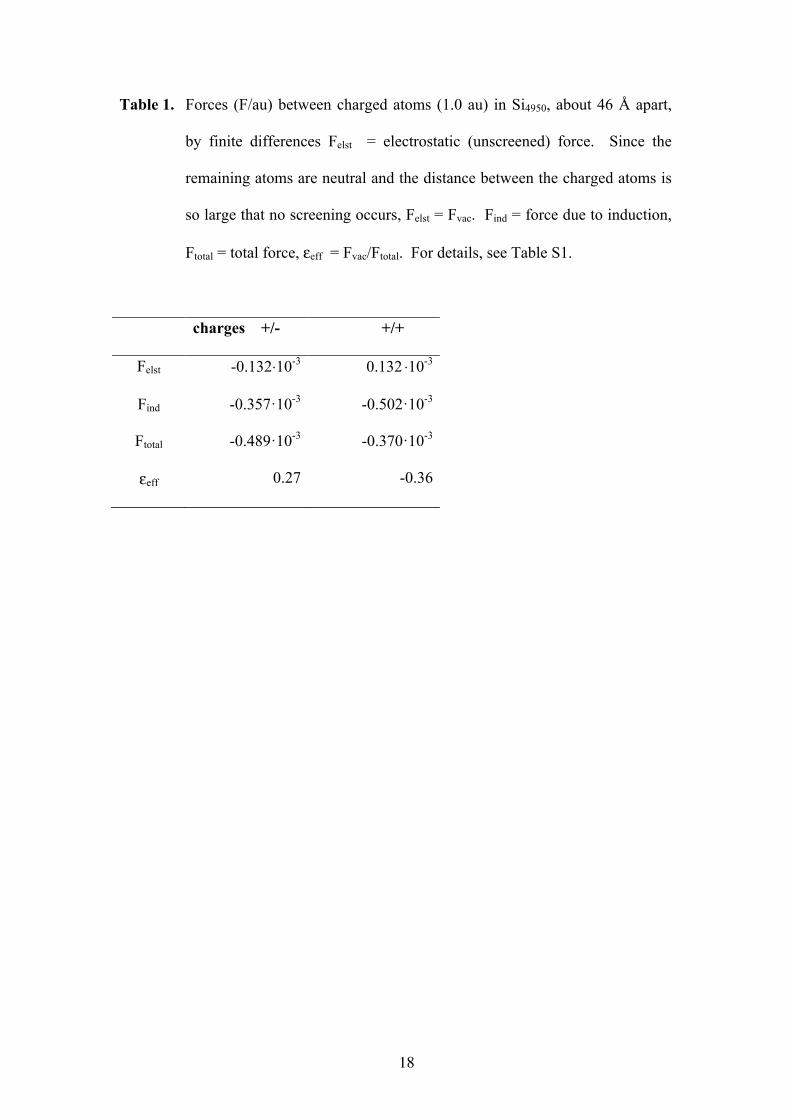
Although the calculated dielectric constants are in good agreement with experiment,
the question is whether these clusters behave as real dielectrics. In order to check
this, the force between two charged atoms (each with |Q| = 1 au), about 46 Å apart in
the Si4950 cluster was calculated from finite differences (Table 1). The results show
that the forces for like and unlike charges scale differently, and that the effective
dielectric constant is far from ε = 12: this cluster cannot be described as a dielectric
continuum.
Table 1
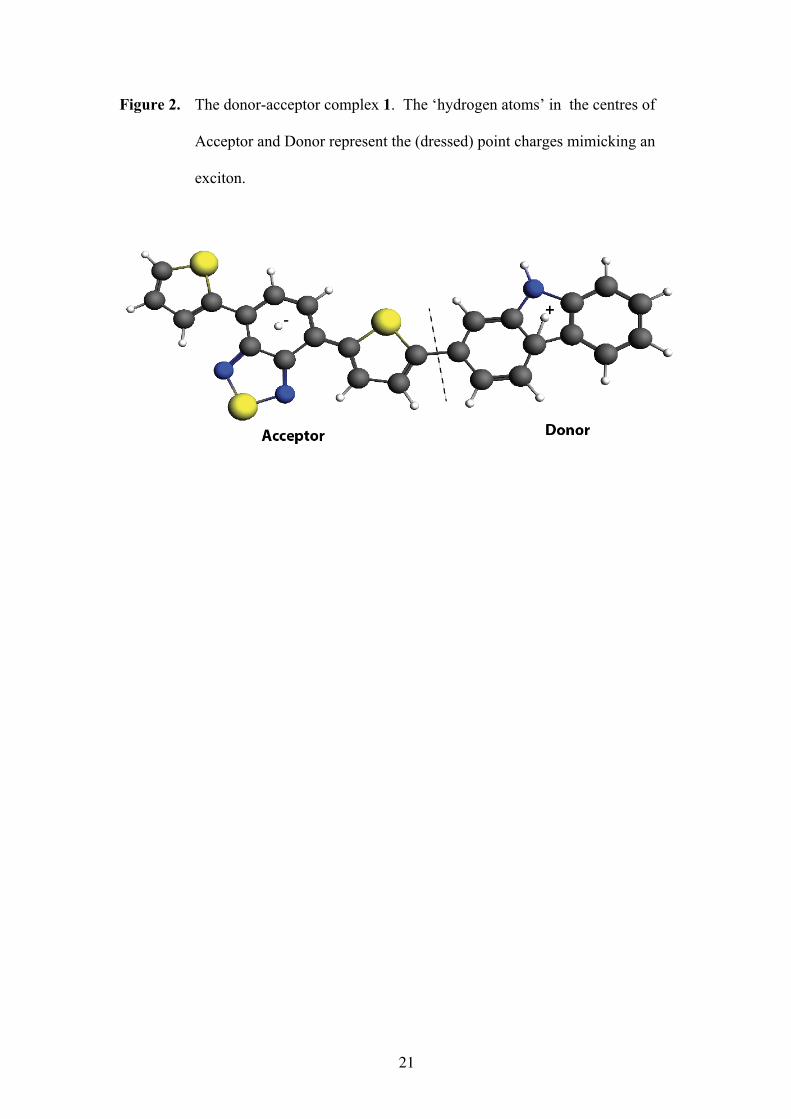
3. A model exciton in a donor-acceptor complex
In Fig. 2, we present a typical molecular donor-acceptor complex. First, we prepared
a point charge model of the donor-acceptor complex (1, Fig. 2) from INDO-SCF[30]
calculations. Next, we simulated – crudely – an exciton by putting charges in the
centres of mass of the donor and the acceptor moieties, respectively, and computed
with DRF90 the electrostatic and induction interaction energies, and the forces
between them by finite differences (Tables 2 and S2). The short-range repulsion was
neglected here, because the approximation used in DRF90 is not valid for this intra-
9
molecular region. We used the default polarisabilities of DRF90 for the atoms of the
complex while the ‘excitonic’ point charges were treated as ‘hydrogen’ atoms with a
default polarisability of about 0.5 Å3.
Figure 2 and Table 2
The (damped) coulombic force between the ‘excitonic’ point charges embedded in 1
is repulsive, due to the presence of the ground state charges and polarisabilities of 1.
The induction contribution is of about the same size and is repulsive, too.
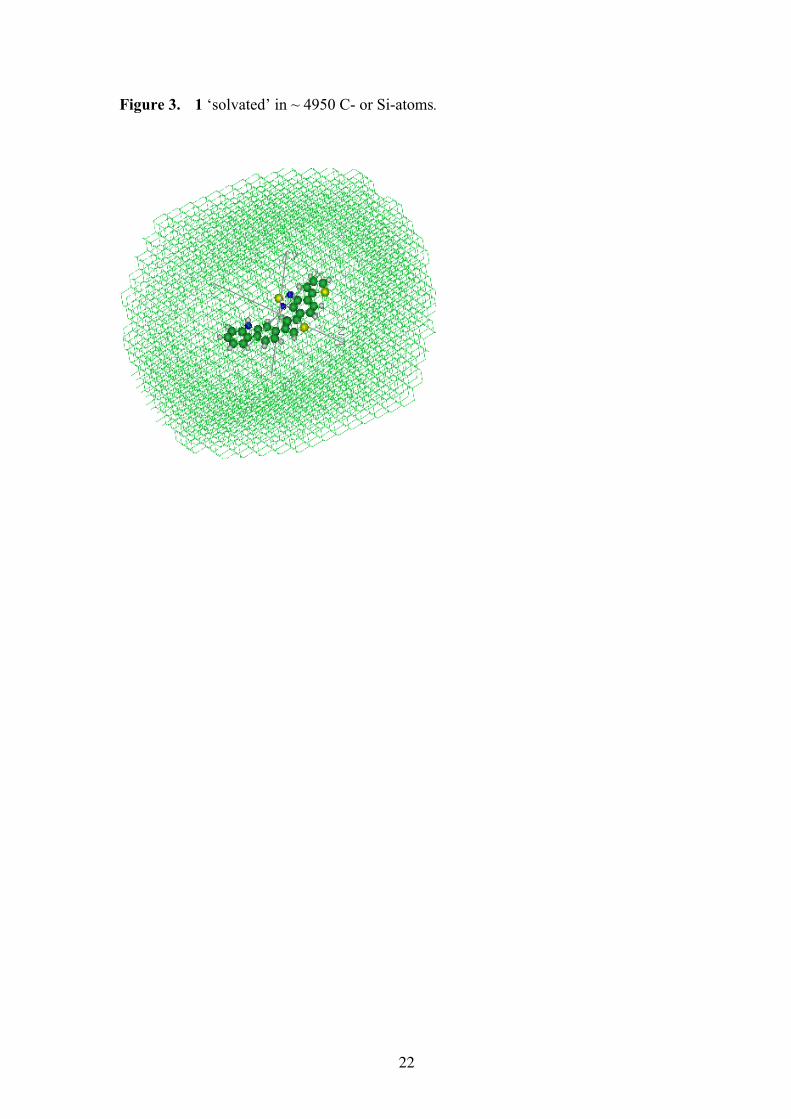
Figure 3
Next, we extended the environment by immersing 1 in C4950 and Si4950, respectively,
in which the atoms of the clusters that were too close to the atoms of complex 1 were
deleted (see Fig. 3 and Table 2). Because the C and Si atoms are not charged, and the
atoms surrounding 1 are relatively large, the electrostatic contributions to the forces
are the same as before, while the induction now comes from all charges, and the
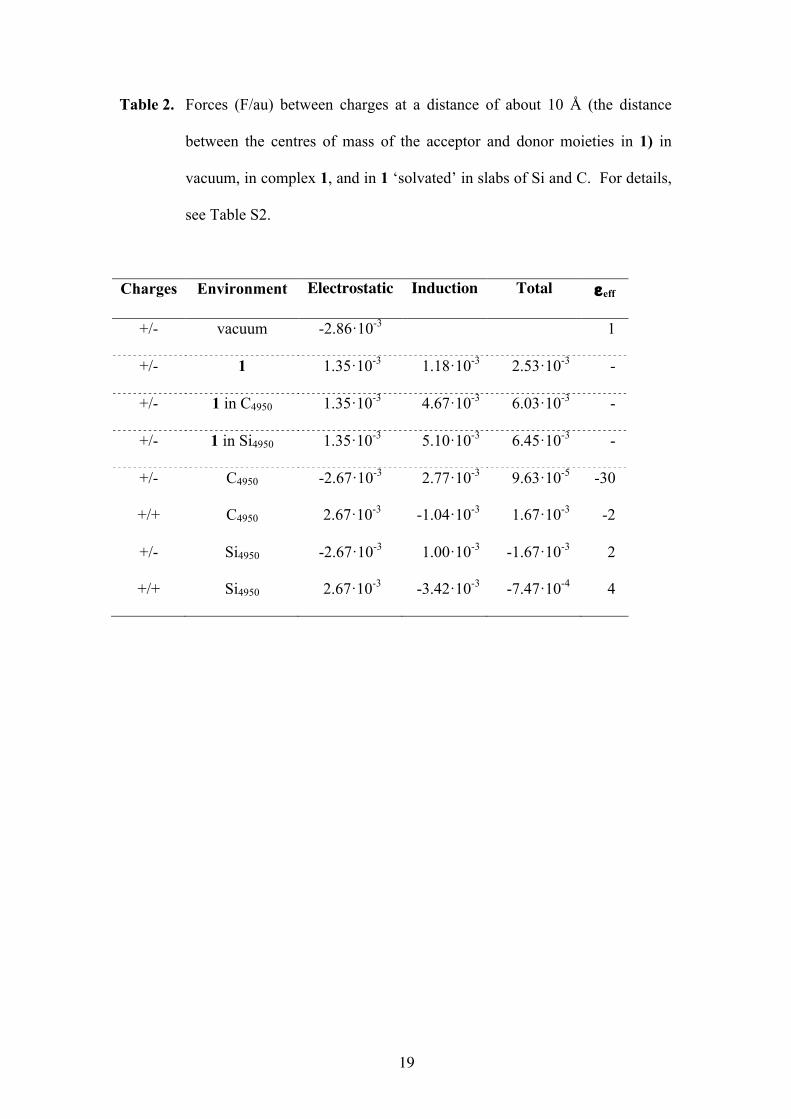
interactions between all induced dipoles in the system. First, we learn from Table 2
that extending the environment of the system has little effect: the total forces between
the ‘excitonic’ point charges in the clusters are of the same order as those in
‘vacuum’. This indicates that the immediate (molecular) environment is more
important than the embedding clusters. Moreover, the effect is counterintuitive in the
sense that one expects a reduction of the interactions, while in fact the forces increase
in the clusters. The forces in carbon and silicon are almost equal while the dielectric
constants of the clusters differ by a factor of two (see “Dielectric or not?”)! The
10
effective dielectric constants, obtained as the ratio between the total forces in vacuo
and those in the clusters, do not relate to the macroscopic dielectric constant.
Finally, only the two ‘excitonic’ point charges were ‘solvated’ in a similar way for
further investigating the dielectric behaviour of the clusters. From these last
experiments we obtained the effective dielectric constants for C and Si, which clearly
deviate considerably from the numbers in the preceding section. Moreover, repeating
this for like charges (+/+), the εeff differ from those for the unlike (+/-) charges,
showing that even these clusters of more than 4500 atoms do not behave as proper
dielectrics, or rather, the interactions cannot be described in terms of the screened
Coulomb law of Eq. (1). This is caused mainly by the too small distance between the
charges: in order to satisfy Eq. (1), the charges should be so far apart that induction
effects due to one of them vanishes around the other one.
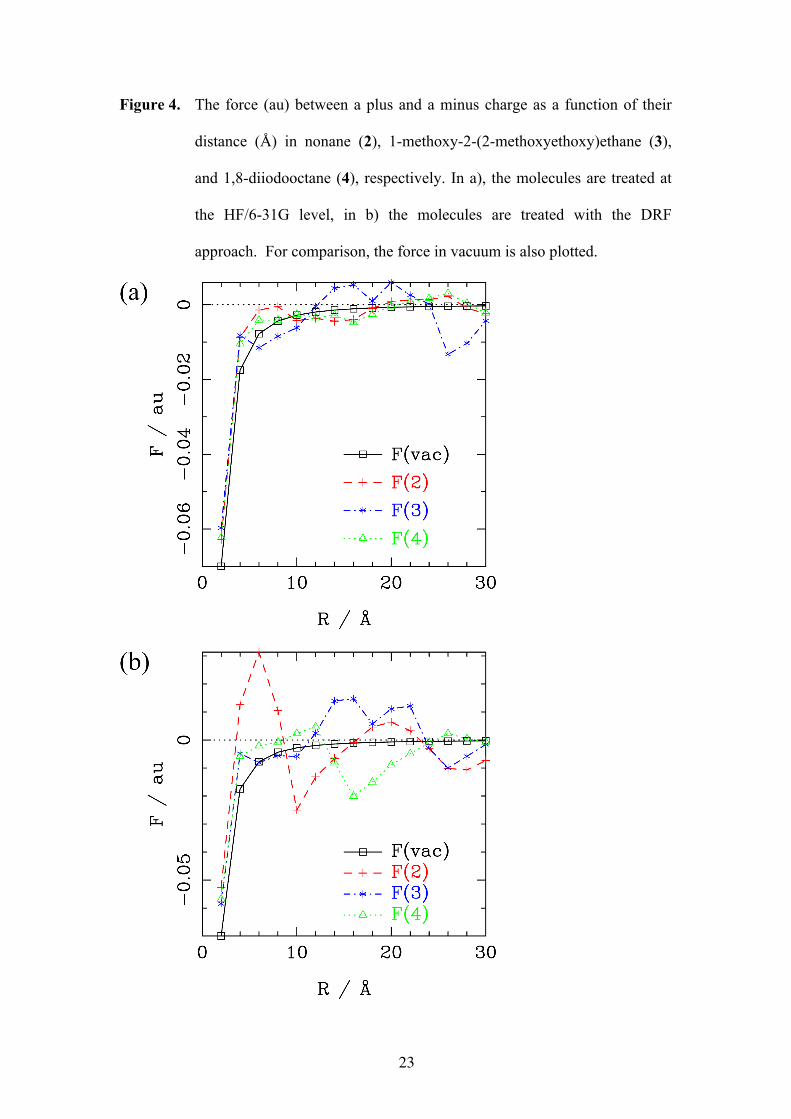
4. Modelling exciton dissociation in different materials
In the preceding sections we treated two point charges at specific geometries and
different distances. In this section, the dissociation of two oppositely charged point
particles (Q = ±1 au) is studied in a rectangular box (a = 20 Å, b= 20 Å, c = 40 Å)
filled with nonane (2, 82 molecules, ρ = 1.09 g/ml), 1-methoxy-2-(2-
methoxyethoxy)ethane (3, 78 molecules, ρ = 1.09 g/ml), and with 1,8-diiodooctane
(4, 48 molecules, ρ = 1.82 g/ml), respectively. The distance between the charges was
varied between 2 Å and 30 Å in the c-direction, and the force between the charges
was calculated by numerical differentiation (at each distance, the molecules in the box
were allowed to relax (MM3 force field [31])). After relaxation, the molecules in the
box were treated both fully quantum mechanically (HF/6-31G) and using the DRF
11
force field (GAMESS-UK [32]). The force as a function of the distance is plotted in
Fig. 4.
Figure 4
It is evident from Fig. 4, that these clusters of molecules do not behave like dielectric
media. The forces between the charges do not vary smoothly with distance and they
deviate considerably from Eq. (1). A comparison between the HF and DRF
calculated forces shows for both methods similar trends, the DRF curve is however
more extreme in the deviations from ideal behaviour, because the DRF reponse is
basically linear, while for electrons at short distances the response is nonlinear. In all
three media regions exist where the charges attract each other more than in vacuum
and regions where they even repel each other. At very short distances (< 5 Å), the
Coulombic force between the two charges is effectively reduced by the presence of
the medium, but no dielectric constant emerges. At intermediate distances (10 – 25
Å), 3 seems to favour exciton dissociation. The other compounds, 2 and 4, show the
same behaviour, but at longer distances (> 25 Å). Compound 3 shows at these
distances attraction of the charges again. However, the irregular shape of the curves
is presumably very dependent on the orientation of the molecules surrounding the
charges, thus conclusions regarding which medium would enhance exciton
dissociation cannot be drawn from this study. What is shown by this model study is
that for distances of 2 – 30 Å between charges no unique dielectric can be defined,
and exciton dissociation has to be studied using microscopic (quantum chemical)
methods.
12
5. Efficiency and permittivity in practice
Recently, a study was reported in which it was found that the OPV efficiency was
enhanced by a larger dielectric constant.[33] It is argued that the exciton binding
energy was lowered by increasing the permitivity of thin films of B,O-chelated
azadipyrromethene (BO-ADPM) blended with camphoric anhydride (CA). The
authors measured an increased internal quantum efficiency of ~30%, related to an
increase of the dielectric constant from ~4.5 to ~11. In the light of the findings
presented here, a more elaborate explanation than that based on Eq. (1) must be given
to rationalise their results, because the hole-electron distance is far too small to be
affected by the dielectric medium. Furthermore, only tiny changes in the absorption
spectrum in the various mixtures are observed, suggesting that the interaction between
BO-ADPM and CA is very weak. To confirm these experimental findings, we
performed a number of INDOs/DRF/CIS[25] calculations, with the standard INDOs
parameterization,[30] on BO-ADPM properties. The experimental spectrum consists
of bands around 325, 500 and 750 nm (3.8, 2.5 and 1.6 eV).
The ground state vacuum dipole moment of BO-ADPM was found to be 1.31 Debye
(0.51 au) and we applied the Born formula to get a first estimate of the solvation
energy for a collection of multipoles in a spherical cavity with radius r:
(10)
For a hole-electron dipole of 0.51 au in a sphere with r = 22 Bohr, i.e., a sphere just
containing the BO-ADPM molecule, placed in a continuum with ε = 11, we get Gsolv ≈
-1.1⋅10-5 Hartree (-3⋅10-4 eV).
ΔGsolv = −12
r−(2l+1)[(l +1)(ε −1)][l + ε(l +1)]
Tlm2
m=− l
l
∑l
∞
∑
13
Considering the Born formula to be a too crude approximation, we used the DRF90
suite and applied INDOs/DRF/CIS[25] for QM/MM to calculate the spectrum of BO-
ADPM in a sphere of the same size and calculated the interaction with the continuum
and the absorption spectrum, using the standard INDOs parameterization. The
calculated spectrum (red curve in Fig. 5) was very similar to the experimental one,
apart from a blue shift of about 100 nm (0.25 eV) of the experimental 750 nm band.
In the first excited state (at 1.9 eV), the dipole moment was found to be 1.8 Debye
(0.71 au) which with the Born equation leads to Gsolv ≈ -2.1⋅10-5 Hartree (-6⋅10-4 eV).
The ΔGsolv (INDO/DRF)= -2.2⋅10-4 Hartree (-6⋅10-3 eV) is larger than obtained from
Eq. (10) by going beyond the point dipole approximation for the charge distribution.
For the exciton binding, here approximated as Eb = -(EI + EA) where EI is the
ionisation energy and EA the electron affinity, we get Eb(vac) = 3.62 eV and Eb(ε = 11,
r = 22 Bohr) = 2.44 eV. This is indeed smaller than in vacuo but not related like in
Eq. (1). However, it leads to an ‘effective’ dielectric constant for the combined
system of 3.62/2.44 = 1.48.
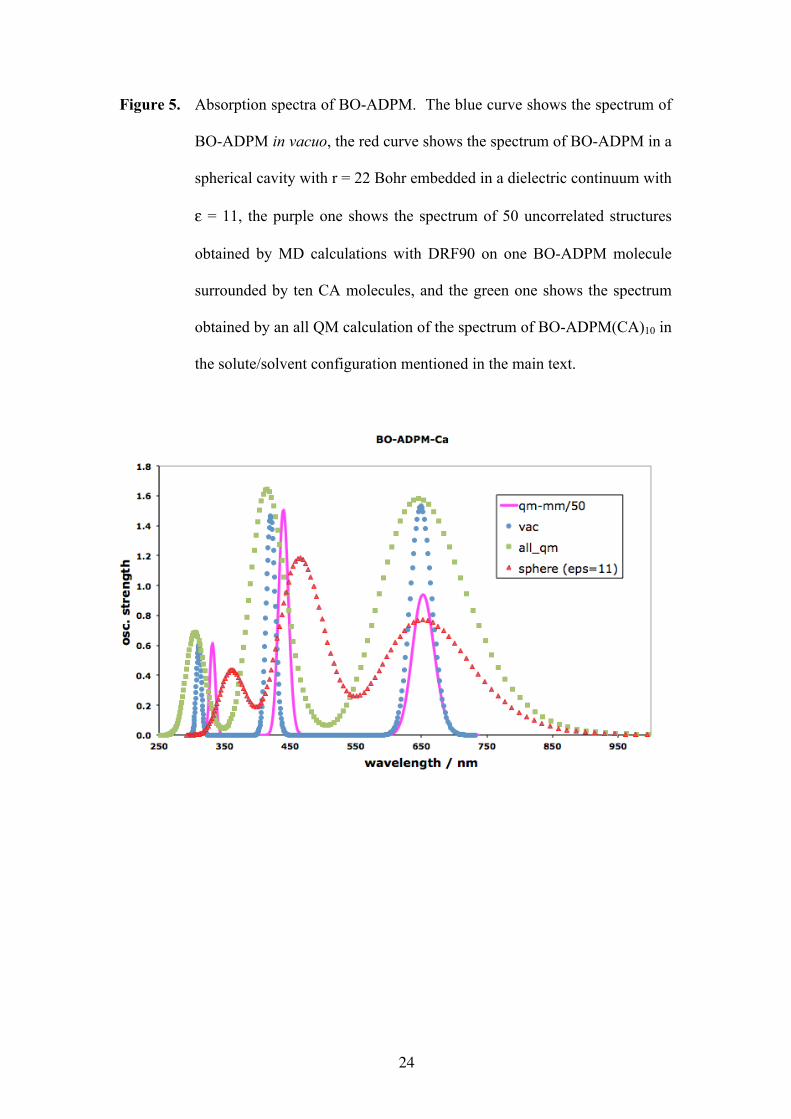
To further improve on the calculation of media effects on the absorption spectrum and
the exciton binding energy, we performed some MD calculations with DRF90 on one
BO-ADPM molecule surrounded by ten CA molecules, and collected 50 uncorrelated
structures from which 50 spectra were calculated. A total of 750 excitation energies
were sorted in 3 boxes of width 0.91 eV (the difference of the smallest and largest
excitation energy divided by the number of boxes, thus defining the resolution) and
adding the oscillator strenghts within each box. The results in de boxes were
convoluted with gaussians of width 0.27 eV. The resulting spectrum (purple curve in
Fig. 5) in the visible region did again not differ significantly from the computed
vacuum spectrum. The mean ground state interaction energy with the environment
14
was 8⋅10-4 Hartree (0.022 ± 0.016 eV). The exciton binding energy obtained from a
single ‘solute/solvent’ configuration is 0.12 Hartree (3.26 eV), i.e., slighly lower than
the vacuum exciton binding energy, but even farther from the supposed relation via
Eq. (1). Finally, we performed an all QM calculation of the spectrum of BO-
ADPM(CA)10 in the solute/solvent configuration mentioned above. Again, no
significant differences were obtained: the same spectrum (green curve in Fig. 5),
exciton binding energy (0.12 Hartree), and ground state dipole moment (10.01 D)
were found, in perfect agreement with the ensemble average of the MD calculations
(9.95 D).
Also the dielectric constant of the present system BO-ADPM(CA)10 was calculated
following the same procedure as above by applying Eq. (9) with averaged induced
dipoles on each atom and averaged radii. We arrived at εeff = 1.51, while the ratio
between the averaged binding energy in the cluster and in vacuum gives εeff = 1.06.
These results clearly indicate that the screened Coulomb law should not be applied for
microscopic situations, and a correct description of the first stages of exciton
dissociation can only be given by a microscopic (quantum mechanical) treatment.
Figure 5
6. Conclusions
This study shows that application of the screened Coulomb law modified for
dielectrics cannot be used to describe the interaction between charges at the
microscopic level. This also holds for the description of exciton dissociation, a vital
process in the generation of free charges in OPVs. Thus, it is not obvious that
15
increasing the dielectric constant of the medium alone is sufficient to yield more
efficient OPV devices. Microscopic studies using QM/MM methods are necessary to
investigate the effect of the medium on exciton dissociation. This strategy has also
been underlined recently in a review of Chiechi et al.[34]
Electronic Supplementary Information available Energies and forces between two
charges at about 46 Å in Si4950 (Table S1), forces (F/au) between charges at a distance
of about 10 Å (the distance between the centres of mass of the acceptor and donor
moieties in 1) in vacuum, in complex 1, and in 1 ‘solvated’ in slabs of Si and C (Table
S2), and coordinates of complex 1 (Å), together with the ‘excitonic’ point charges (p+
and p-) that mimick the electron distribution of its first excited state (Table S3).
Acknowledgments
R.W.A.H. acknowledges the Zernike Institute for Advanced Materials
(“Dieptestrategie” program) for financial support. This work is part of the research
programme of the Foundation of Fundamental Research on Matter (FOM), which is
part of the Netherlands Organisation for Scientific Research (NWO). This is a
publication of the FOM-focus Group ‘Next Generation Organic Photovoltaics’,
participating in the Dutch Institute for Fundamental Energy Research (DIFFER). The
work was partially done with computing time at the Dutch National Supercomputer
Cartesius (SURFsara, SH-213-13).
References
[1] L. J. A. Koster, S. E. Shaheen, J. C. Hummelen, Adv. Energy Mater., 2 (2012)
1246.
16
[2] T.M. Clarke, J.R. Durrant, Chem. Rev., 110 (2010) 6736.
[3] S. E. Gledhill, B. Scott, B. A. Gregg, J. Mater. Res., 20 (2005) 3167.
[4] R. Constanciel, Theor. Chim. Acta, 69 (1986) 505.
[5] J.D. Jackson, Classical Electrodynamics, John Wiley & Sons, New York, 1975.
[6] P.Th. van Duijnen, B.T. Thole, Biopolymers, 21 (1982) 1749.
[7] J.A.C. Rullmann, M.N. Bellido, P.Th. van Duijnen, J. Mol. Biol., 206 (1989)
101.
[8] A.H. de Vries, P.Th. van Duijnen, A.H. Juffer, Int. J. Quantum Chem.,
Quantum Chem.Symp., 27 (1993) 451.
[9] P.Th. van Duijnen, A.H. de Vries, Int. J. Quantum Chem., Quantum Chem.
Symp., 29 (1995) 523.
[10] C. Jarque, A.D. Buckingham, Chem. Phys. Lett., 164 (1989) 485.
[11] R. Zangi, J. Chem. Phys., 126 (2012) 184501.
[12] J. Deslippe, M. Dipoppa, D. Prendergast, M.V.O. Moutinho, R.B. Capaz, S.G.
Louie, Nano Lett., 9 (2009) 1330.
[13] J.-W. van der Horst, P.A. Bobbert, M.A.J. Michels, H. Bässler, J. Chem. Phys.,
114 (2001) 6950.
[14] O. Lehtonen, D. Sundholm, T. Vänskä, Phys. Chem. Chem. Phys., 10 (2008)
4535.
[15] B.A. Gregg, M.C. Hanna, J. Appl. Phys, 93 (2003) 3605.
[16] B.A. Gregg, S-G. Chen, R.A. Cormier, Chem. Mater., 16 (2004) 4586.
[17] K. M. Hong, J. Noolandi, J. Chem. Phys., 69 (1978) 5026.
[18] P. M. Borsenberger, A. I. Ateya, J. Appl. Phys., 50 (1979) 909.
[19] M. Tachiya, J. Chem. Phys., 89 (1988) 6929.
17
[20] V. D. Mihailetchi, L. J. A. Koster, J. C. Hummelen, P.W.M. Blom, Phys. Rev.
Lett., 93 (2004) 216601.
[21] V.D. Mihailetchi, L.J.A.Koster, P.W.M. Blom, C. Melzer, B. de Boer, J.K.J.
van Duren, R.A.J. Janssen, Adv. Funct. Mater., 15 (2005) 795.
[22] M. Wojcik, M. Tachiya, Rad. Phys. Chem., 74 (2005) 132.
[23] M. Lenes, F. B. Kooistra, J. C. Hummelen, I. Van Severen, L. Lutsen, D.
Vanderzande, T. J. Cleij, P. W. M. Blom, J. Appl. Phys., 104 (2008) 114517.
[24] M. Swart, P.Th. van Duijnen, Mol. Simul., 32 (2006) 471.
[25] P.Th. van Duijnen, M. Swart, J. Phys. Chem. C, 114 (2010) 20547.
[26] B.T. Thole, Chem. Phys. Lett., 59 (1981) 341.
[27] P.Th. van Duijnen, M. Swart, J. Phys. Chem. A, 102 (1998) 2399.
[28] M. Swart, P.Th. van Duijnen, J.G. Snijders, J. Mol. Struct. (Theochem), 458
(1999) 11.
[29] C. Pouchan, D. Begue, D.Y. Zhang, J. Chem. Phys., 121 (2004) 4628.
[30] M.C. Zerner, Semi Empirical Molecular Orbital Methods, in: K.B. Lipkovitz,
D.B.N. Boyd (Eds.) Reviews of Computational Chemistry, VCH, New York,
1991, pp. 313.
[31] N.L. Allinger, Y.H. Yuh, J.-H. Lii, J. Am. Chem. Soc., 111 (1989) 8551.
[32] M.F. Guest, I.J. Bush, H.J.J. van Dam, P. Sherwood, J.M.H.Thomas, J.H. van
Lenthe, R.W.A. Havenith, J. Kendrick, Mol. Phys., 103 (2005) 719.
[33] S.Y. Leblebici, T.L. Chen, P. Olada-Velasco, W. Yang, B. Ma, ACS Appl.
Mater. Interfaces, 5 (2013) 10105.
[34] R.C. Chiechi, R.W.A. Havenith, J.C. Hummelen, L.J.A. Koster, M.A. Loi,
Mater. Today, 16 (2013) 281.
18
Table 1. Forces (F/au) between charged atoms (1.0 au) in Si4950, about 46 Å apart,
by finite differences Felst = electrostatic (unscreened) force. Since the
remaining atoms are neutral and the distance between the charged atoms is
so large that no screening occurs, Felst = Fvac. Find = force due to induction,
Ftotal = total force, εeff = Fvac/Ftotal. For details, see Table S1.
charges +/- +/+
Felst -0.132⋅10-3 0.132 ⋅10-3
Find -0.357·10-3 -0.502·10-3
Ftotal -0.489·10-3 -0.370·10-3
εeff 0.27 -0.36
19
Table 2. Forces (F/au) between charges at a distance of about 10 Å (the distance
between the centres of mass of the acceptor and donor moieties in 1) in
vacuum, in complex 1, and in 1 ‘solvated’ in slabs of Si and C. For details,
see Table S2.
Charges Environment Electrostatic Induction Total εeff
+/- vacuum -2.86·10-3 1
+/- 1 1.35·10-3 1.18·10-3 2.53·10-3 -
+/- 1 in C4950 1.35·10-3 4.67·10-3 6.03·10-3 -
+/- 1 in Si4950 1.35·10-3 5.10·10-3 6.45·10-3 -
+/- C4950 -2.67·10-3 2.77·10-3 9.63·10-5 -30
+/+ C4950 2.67·10-3 -1.04·10-3 1.67·10-3 -2
+/- Si4950 -2.67·10-3 1.00·10-3 -1.67·10-3 2
+/+ Si4950 2.67·10-3 -3.42·10-3 -7.47·10-4 4
20
Figure 1. Effective atomic polarisability of C and Si in 4950-clusters with diamond
structure as a function of the distance to the centre.
21
Figure 2. The donor-acceptor complex 1. The ‘hydrogen atoms’ in the centres of
Acceptor and Donor represent the (dressed) point charges mimicking an
exciton.
22
Figure 3. 1 ‘solvated’ in ~ 4950 C- or Si-atoms.
23
Figure 4. The force (au) between a plus and a minus charge as a function of their
distance (Å) in nonane (2), 1-methoxy-2-(2-methoxyethoxy)ethane (3),
and 1,8-diiodooctane (4), respectively. In a), the molecules are treated at
the HF/6-31G level, in b) the molecules are treated with the DRF
approach. For comparison, the force in vacuum is also plotted.
24
Figure 5. Absorption spectra of BO-ADPM. The blue curve shows the spectrum of
BO-ADPM in vacuo, the red curve shows the spectrum of BO-ADPM in a
spherical cavity with r = 22 Bohr embedded in a dielectric continuum with
ε = 11, the purple one shows the spectrum of 50 uncorrelated structures
obtained by MD calculations with DRF90 on one BO-ADPM molecule
surrounded by ten CA molecules, and the green one shows the spectrum
obtained by an all QM calculation of the spectrum of BO-ADPM(CA)10 in
the solute/solvent configuration mentioned in the main text.

![ANTENNA BEHAVIOUR UNDER DIFFERENT SOIL CONDITIONS...[21] Varun Shukla, Arti Saxena and Swati Jain, A New Rectangular Dielectric Resonator Antenna Compatible for Mobile Communication](https://img.pdfslide.us/doc/110x75/5f935e7cb3469a48e978d7c8/antenna-behaviour-under-different-soil-21-varun-shukla-arti-saxena-and-swati.jpg)


![Batch - 2008 [Engg]newtontutorials.co.in/downloads/public/7/Periodic Test_2008_Engg... · r at which these charges will exert the same force in a medium of dielectric constant k is](https://img.pdfslide.us/doc/110x75/5eadf967943a5c7fb0024201/batch-2008-engg-test2008engg-r-at-which-these-charges-will-exert-the.jpg)