Embed Size (px)
Citation preview

THE BEHAVIORAL RESPONSE OF HARBOR SEALS TO
SEASONAL PREY PULSES OF SPAWNING PACIFIC HERRING
By
Austen C Thomas
Accepted in Partial Completion
of the Requirements for the Degree
Master of Science
____________________________________
Moheb A. Ghali, Dean of the Graduate School
ADVISORY COMMITTEE
____________________________
Chair, Dr. Alejandro Acevedo-Gutiérrez
____________________________
Dr. Deborah Donovan
___________________________
Dr. Benjamin Miner

MASTER‟S THESIS
In presenting this thesis in partial fulfillment of the requirements for a master‟s degree at
Western Washington University, I grant to Western Washington University the non-exclusive
royalty-free right to archive, reproduce, distribute, and display the thesis in any and all forms,
including electronic format, via any digital library mechanisms maintained by WWU.
I represent and warrant this is my original work, and does not infringe or violate any rights of
others. I warrant that I have obtained written permissions from the owner of any third party
copyrighted material included in these files.
I acknowledge that I retain ownership rights to the copyright of this work, including but not
limited to the right to use all or part of this work in future works, such as articles or books.
Library users are granted permission for individual, research and non-commercial reproduction
of this work for educational purposes only. Any further digital posting of this document requires
specific permission from the author.
Any copying or publication of this thesis for commercial purposes, or for financial gain, is not
allowed without my written permission.
Signature ______________________________
Date __________________________________

THE BEHAVIORAL RESPONSE OF HARBOR SEALS TO
SEASONAL PREY PULSES OF SPAWNING PACIFIC HERRING
A Thesis
Presented to
The Faculty of
Western Washington University
In Partial Fulfillment
Of the Requirements for the Degree
Master of Science
by
Austen C Thomas
June 2010

iv
ABSTRACT
The Pacific harbor seal (Phoca vitulina) is a noteworthy omission from the list of predators that
aggregate at herring spawning sites, despite strong suggestive evidence that they are likely to
respond to herring pulses. Working with the hypothesis that spawning herring aggregations are
seasonally important prey for harbor seals, we tested several predictions using an analysis of
harbor seal prey remains, GPS telemetry, and satellite-linked time/depth recorder data. Contrary
to predictions, herring in harbor seal diet was comprised of 77% juveniles and 23% adults in the
spawn season, versus 33% juveniles and 67% adults in the post-spawn season. Seal diving focus
peaked at night during the post-spawn season, and seals exhibited less diving effort during the
spawn season. Harbor seals did not however appear to alter their foraging behaviors to take
advantage of spawning herring aggregations. The lack of response by harbor seals to spawning
herring pulses is likely explained by seasonal differences in adult herring profitability, the
availability of alternative prey, or a decline in local herring biomass.

v
ACKNOWLEDGEMENTS
The work presented in this thesis is a result of an extensive collaborative effort between
the Marine Behavior and Ecology lab at WWU, several excellent scientists at the Washington
Department of Fish and Wildlife (WDFW) and the National Martine Fisheries Service (NMFS).
Before I begin listing the contributions of the many individuals who assisted with this project, I
want to recognize that without the assistance of our collaborators none of the following research
would have been possible. Additionally, I would like to mention that I have befitted a great deal
scientifically, professionally, and personally from this collaboration; and I encourage other
university researchers to pursue such opportunities for their graduate students, as it inevitably
yields an invaluable experience for young scientists.
First of all I offer my sincere thanks to my thesis advisor, Dr. Alejandro Acevedo-
Gutiérrez, for his guidance, constant availability, and unwavering support of my work. Next I
would like to recognize the large scientific contributions of Monique Lance and Steven Jeffries
at WDFW, for their work in the process of study design, seal capture, tag
programming/deployment, scat collection, and diet analysis. Monique Lance provided all of the
harbor seal prey id data presented herein, in addition to coordinating the use of the Argos
satellite network for our research needs. I also owe a great deal of gratitude to the other
members of my thesis committee, Dr. Deborah Donovan and Dr. Benjamin Miner, for their help
with the study design, and implementation. Dr. Benjamin Miner also contributed substantially to
this project by way of statistics and assistance with code writing in R.
In the process of designing this project and analyzing the data, I contacted several outside
researchers who made generous contributions of their time and/or data. Jake Schweigert and
vi
Doug Hay at the department of Fisheries and Oceans Canada provided the herring data that we
used to estimate consumed herring sizes, and assisted in the interpretation of our harbor seal diet
data. Kurt Stick at the Washington Department of Fish and Wildlife assisted with interpretation
of herring data layers and offered assistance during the design phase. Dr. John Fieberg gave me
much needed advice on the use of utilization distribution overlap indices, and Dr. Louie Yang
provided insight into the ecosystem response to resource pulses. I would also like to thank Dr.
Andrew Trites for his assistance with the seal movement data interpretation, and encouragement
of research efforts.
This project built upon the work of several previous graduate students in the Marine
Behavior and Ecology lab at WWU, including Kathryn Luxa, Sarah Hardee-Peterson, Kenady
Reuland, Sarah Schuster-Howard, and Sasha McFarland. Their support and advice throughout
my graduate work at WWU has been invaluable. Many undergraduates of the WWU biology
department also contributed to this work by assisting with harbor seal tracking, scat collections
and diet analysis. Special thanks to Indu Soini for her many hours of assistance in the field
during tracking efforts, and Laurel Mundy for her assistance with the diet analyses.
And I of course owe a tremendous debt of gratitude to my family and friends for their
contributions to my thesis work. My grandmother, Betty Thomas, provided her home as an
impromptu research laboratory during my summer of field work, and my parents provided a
quite working environment during the writing process. Lastly, many thanks to Katie Haman and
Dane Vennewitz for their continuous encouragement and support throughout the course of my
graduate degree.
Financial support for this project was primarily provided by Dr. Acevedo-Gutiérrez‟s
National Science Foundation award #0550443. Additional financial support came from the

vii
WWU Ross Graduate Tuition Scholarship, Biology Alumni Scholarship, and the Research and
Sponsored Programs Fund for the Enhancement of Graduate Research.

viii
TABLE OF CONTENTS
ABSTRACT .................................................................................................................................. iv
ACKNOWLEDGEMENTS ......................................................................................................... v
LIST OF FIGURES ..................................................................................................................... ix
LIST OF TABLES ........................................................................................................................ x
INTRODUCTION......................................................................................................................... 1
Resource pulses ......................................................................................................................... 1
Spawning pacific herring as a resource pulse ........................................................................ 4
Harbor seal foraging ecology ................................................................................................... 7
Harbor seals and Pacific herring in the Salish Sea .............................................................. 10
METHODS .................................................................................................................................. 17
Study location .......................................................................................................................... 17
Harbor seal diet ....................................................................................................................... 17
Tag deployment and programming ....................................................................................... 20
Seal foraging areas .................................................................................................................. 21
Seal diving behavior ................................................................................................................ 23
RESULTS .................................................................................................................................... 26
Harbor seal diet ....................................................................................................................... 26
Seal foraging areas .................................................................................................................. 30
Seal diving behavior ................................................................................................................ 34
DISCUSSION .............................................................................................................................. 37
Harbor seal diet ....................................................................................................................... 37
Seal foraging areas .................................................................................................................. 39
Seal diving behavior ................................................................................................................ 40
Conclusions .............................................................................................................................. 42
LITERATURE CITED .............................................................................................................. 45

ix
LIST OF FIGURES
Figure 1. The Salish Sea and its three major bodies of water: the Strait of Georgia, the Strait of
Juan de Fuca, and Puget Sound…………………………………………………………..11
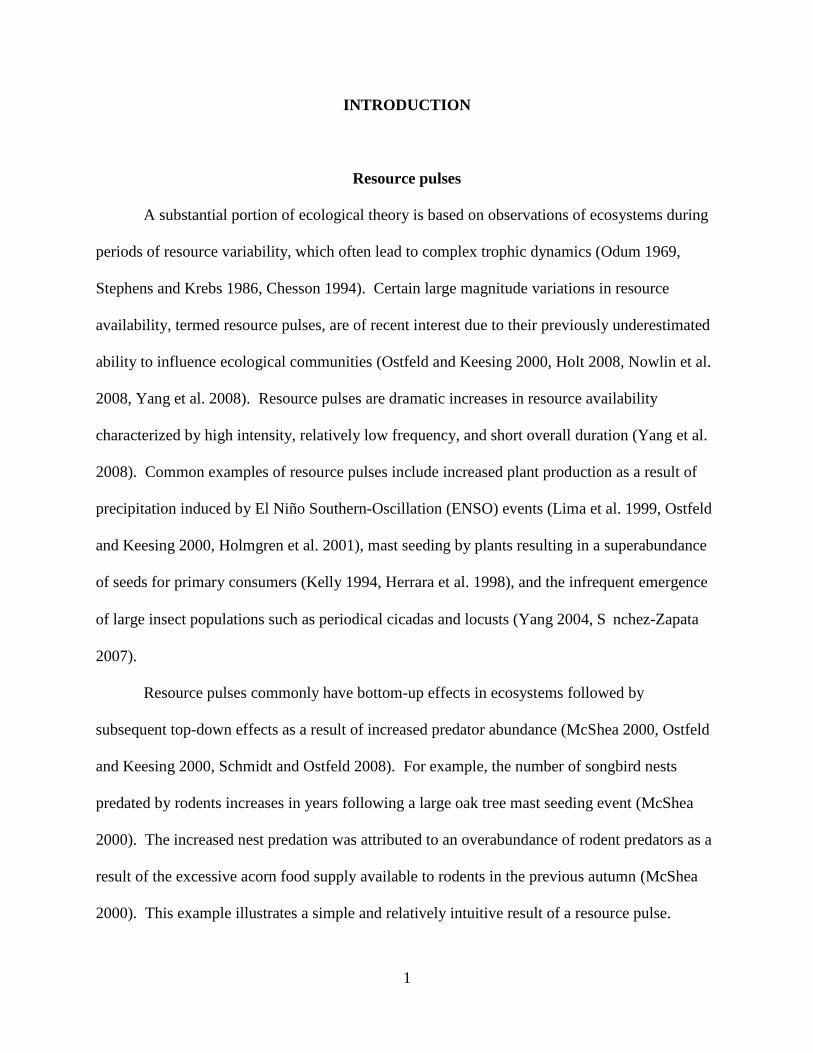
Figure 2. Range (gray shading) and peak (black shading) of documented spawn timing for
WDFW Puget Sound Pacific herring stocks. Figure used with the permission of
Gustafson et al. (2006)…………………..……………………………………….………12
Figure 3. Pacific herring spawning biomass (metric tons) from 1973 to 2004 in the Strait of
Juan de Fuca. Figure used with the permission of Gustafson et al. (2006)……………..14
Figure 4. Generalized logistic growth curves of harbor seals in the Washington, inland waters
stock. Data presented for the Strait of Juan de Fuca stock (above), and the nearby San
Juan Island stock (below). Figures used with the permission of Jeffries et al. (2003)….15
Figure 5. Protection Island, the site where harbor seals were tagged and scat collected. Nearby
bays used by spawning Pacific herring are also indicated……………………………….18
Figure 6. Estimated age classes of herring consumed by harbor seals during the spawn (a) and
post-spawn (b) seasons. Black bars indicate herring estimated to be juveniles and grey
bars indicate adults……………………………………………………………………….29
Figure 7. Foraging areas of GPS-tagged harbor seals during the spawn (left) and post-spawn
(right) seasons. Symbols indicate GPS locations ( ), overall foraging areas (95% a-
LoCoH) ( ), core foraging areas (50% a-LoCoH) ( ), herring holding areas ( ),
and herring spawning areas ( ). Seal sex and ID are indicated in the upper left (F =
female, M = male). Herring data provided by Washington Department of Fish and
Wildlife………………………...……...…………………………………………………31
Figure 7 (continued). Foraging areas of GPS-tagged harbor seals during the spawn (left) and
post-spawn (right) seasons. Symbols indicate GPS locations ( ), overall foraging areas
(95% a-LoCoH) ( ), core foraging areas (50% a-LoCoH) ( ), herring holding areas
( ), and herring spawning areas ( ). Seal sex and ID are indicated in the upper left
(F = female, M = male). Herring data provided by Washington Department of Fish and
Wildlife…………………………...……………………………………………………...32
Figure 8. Diurnal variation in harbor seal dive depth focus (a), modal dive depth (b), and diving
frequency (c) between seasons (spawn and post-spawn). Morning (0400-0959), day
(1000-1559), evening (1600-2159), and night (2200-0359). See text for details on dive
variables………………………………………………………………………………….36

x
LIST OF TABLES
Table 1. The percent frequency of occurrence (FO) of prey species in harbor seal scats collected
on Protection Island during the spawn (16 March) and post-spawn (22 July) seasons….27
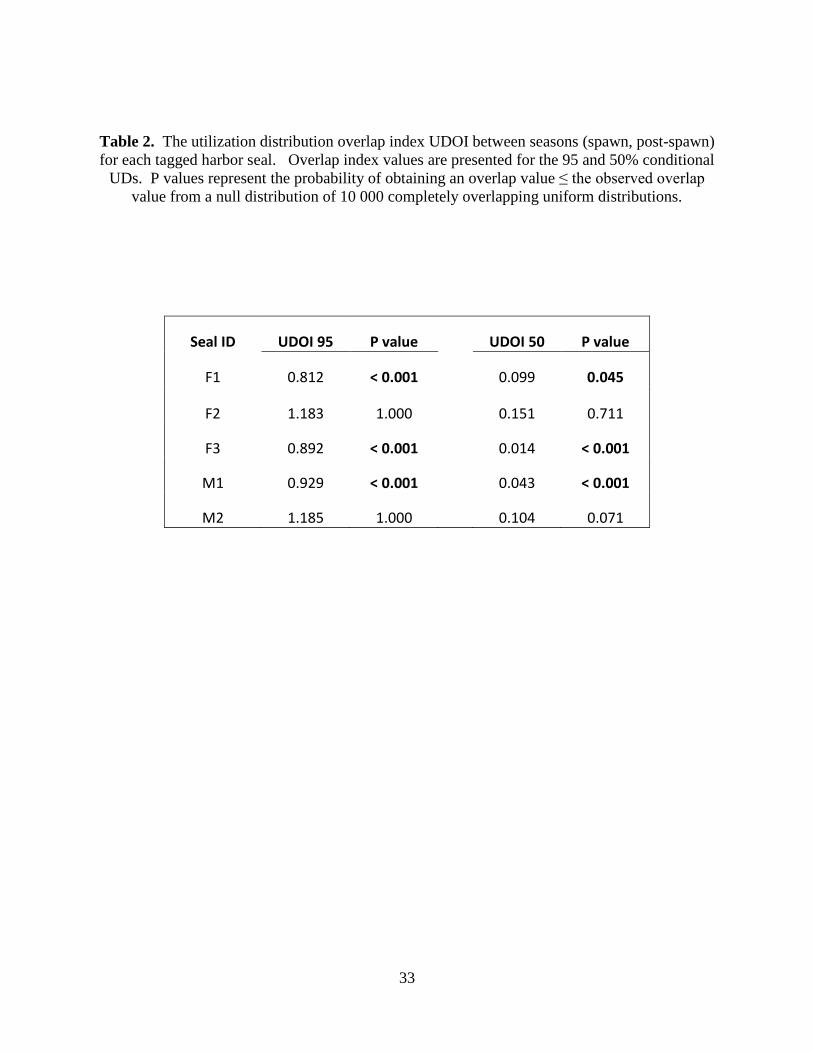
Table 2. The utilization distribution overlap index UDOI between seasons (spawn, post-spawn)
for each tagged harbor seal. Overlap index values are presented for the 95 and 50%
conditional UDs. P values represent the probability of obtaining an overlap value ≤ the
observed overlap value from a null distribution of 10 000 completely overlapping
uniform distributions……………………………………………………………………..33
1
INTRODUCTION
Resource pulses
A substantial portion of ecological theory is based on observations of ecosystems during
periods of resource variability, which often lead to complex trophic dynamics (Odum 1969,
Stephens and Krebs 1986, Chesson 1994). Certain large magnitude variations in resource
availability, termed resource pulses, are of recent interest due to their previously underestimated
ability to influence ecological communities (Ostfeld and Keesing 2000, Holt 2008, Nowlin et al.
2008, Yang et al. 2008). Resource pulses are dramatic increases in resource availability
characterized by high intensity, relatively low frequency, and short overall duration (Yang et al.
2008). Common examples of resource pulses include increased plant production as a result of
precipitation induced by El Niño Southern-Oscillation (ENSO) events (Lima et al. 1999, Ostfeld
and Keesing 2000, Holmgren et al. 2001), mast seeding by plants resulting in a superabundance
of seeds for primary consumers (Kelly 1994, Herrara et al. 1998), and the infrequent emergence
of large insect populations such as periodical cicadas and locusts (Yang 2004, S nchez-Zapata
2007).
Resource pulses commonly have bottom-up effects in ecosystems followed by
subsequent top-down effects as a result of increased predator abundance (McShea 2000, Ostfeld
and Keesing 2000, Schmidt and Ostfeld 2008). For example, the number of songbird nests
predated by rodents increases in years following a large oak tree mast seeding event (McShea
2000). The increased nest predation was attributed to an overabundance of rodent predators as a
result of the excessive acorn food supply available to rodents in the previous autumn (McShea
2000). This example illustrates a simple and relatively intuitive result of a resource pulse.

2
However, the trophic interactions in pulsed resource communities can be much more complex.
For instance, Schmidt and Ostfeld (2003) pointed out that the relationship between songbird
populations and rodent abundance in forest communities is not always strictly monotonic. They
observed that in low mast seed years, songbird populations were under increased raptor predation
pressure because rodent populations were low, whereas in high mast years songbirds were under
increased nest predation pressure from rodents (as in the previous example). This complex
trophic dynamic resulted in the highest songbird abundance during conditions of intermediate
mast production. The second example illustrates that resource pulses can have complex
cascading effects in ecosystems, often dependent upon the qualities of the resource pulse such as
pulse magnitude.
Not all consumers are well adapted to take advantage of the periodical superabundance of
resources. Generalist consumers are the most likely to respond to resource pulses because they
are able to take advantage of temporary increases in resource abundance and feed on alternative
food sources when the pulse is absent (Ostfeld and Keesing 2000). Additionally, consumers
must also exhibit a rapid functional or numeric response to the presence of a resource pulse in
order to fully utilize it. As a result, consumer species able to temporarily increase resource
consumption and to move effortlessly over long distances are best adapted to take advantage of
resource pulses (Rose and Polis 1998). In some instances, consumers anticipate these infrequent
events by increasing reproductive output in advance of the resource pulse to levels that would
otherwise be unsustainable (Boutin et al. 2006, Yang et al. 2008). Therefore the ability to predict
the occurrence of a resource pulse yields distinct fitness advantages for consumers.
While most conceptual work on resource pulses has focused on terrestrial ecosystems,
several recent studies have evaluated resource pulses occurring in aquatic ecosystems (Willson

3
and Womble 2006, Nowlin et al. 2008, Yang et al. 2010). These studies have highlighted that
resource pulses are common in aquatic ecosystems, including events such as periodic upwelling
of nutrient-rich water into the euphotic zone (Adams et al. 2000, Longhurst 2001), guano
deposition by migrating waterbirds and subsequent nutrient release (Kitchell et al. 1999),
episodic blue mussel settlement eliciting an aggregative response by sea stars (Bologna et al.
2005), and large aggregations of spawning fish providing an important seasonal energy input to
consumers, ranging from microbes to top predators (Willson and Halupka 1995, Helfield and
Naiman 2001, Naiman et al. 2002). Aquatic and terrestrial ecosystems appear to respond to
resource pulses in many of the same ways; however there is some evidence that consumers in
aquatic ecosystems are able to respond more quickly to pulse events than those in terrestrial
ecosystems (Nowlin et al. 2008, Yang et al. 2010).
The importance of salmonid spawning events as a resource pulse in estuarine and riparian
communities is widely recognized and well studied (Helfield and Naiman 2001, Naiman et al.
2002, Nowlin et al. 2008, Yang et al. 2010). However, the ecosystem impacts of other fish
spawning events operating on a similar temporal scale have not received as much attention
(Willson and Womble 2006). In addition to salmonids, spawning eulachon (Thaleichthys
pacificus), capelin (Mallotus villosus), and Pacific herring (Clupea pallasii) are all important to
the foraging ecology of numerous vertebrate consumers (Willson and Womble 2006). Fish
spawning events differ from many examples of resource pulses in the conceptual literature in the
frequency with which events occur relative to the life span of the consumer (Ostfeld and Keesing
2000, Yang et al. 2008). For example, many fish spawning events occur seasonally and are
utilized by long-lived consumers, whereas the classic example of nutrient input from periodical
cicadas occurs only every 17 years and is utilized by microbes and small forest plants (Yang

4
2004). Nonetheless, many fish spawning aggregations are excellent examples of resource pulses
in marine ecosystems, because they are relatively brief, infrequent events of high resource
availability for consumers. Pacific herring spawning aggregations are a particularly good
example of a resource pulse, providing a superabundance of energy-rich prey for seabirds,
cetaceans, and pinnipeds.
Spawning pacific herring as a resource pulse
Pacific herring are an abundant, energy-rich forage fish in the North Pacific Ocean that
have received much attention due to their ecological and economic importance (Hourston and
Haegele 1980, Gustafson et al. 2006, Therriault et al. 2009). They are considered forage fish
because they are among a class of small, schooling fishes that are important prey for larger fish
and wildlife. The documented geographic range of Pacific herring extends from the Baja
California Peninsula to the Alaskan Arctic in the eastern Pacific, and from Korea to the Russian
Arctic in the western Pacific (Hourston and Haegele 1980). Herring in the north Pacific are
generally divided into separate stocks based loosely on regional differences in spawn timing,
spawn location and genetic data. In some regions there is an active fishery for adult Pacific
herring and roe, although concerns about the impact of fisheries on herring populations have led
to heavy regulation and closure of herring fisheries in many areas (Stout et al. 2001).
Pacific herring have an interesting life history that involves seasonal spawning
migrations. During the spring months, herring eggs are primarily deposited on marine vegetation
in the shallow intertidal areas of protected bays and inlets (Haegel and Schweigert 1985). In the
first six months of development, Pacific herring remain near the shallow waters of the spawning
grounds where they feed on locally available zooplankton. Larval herring metamorphose into

5
juveniles after approximately 13 wks and then form progressively larger schools that eventually
migrate to the offshore feeding grounds after their second summer (Hourston and Haegele 1980,
Therriault et al. 2009). Immature herring remain in the offshore feeding grounds until they reach
sexual maturity between ages 2-5 yrs (Lassuy 1989), after which they begin making yearly
migrations to the inshore spawning areas. However, some herring do not make the initial
offshore migration at the juvenile stage, but rather remain in the inland waters throughout their
entire life (Stevenson 1955, Lassuy 1989). In the late fall, adult herring migrate en masse to the
spawning grounds, where they form densely aggregated schools in pre-spawner holding areas
approximately 3-4 wks prior to spawning (Stick 2005, Stick and Lindquist 2009). Spawning
occurs in waves over the course of several days in early spring, after which the spent herring
immediately migrate back toward the offshore feeding areas (Haegele and Schweigert 1985).
During the weeks when they are spawning, Pacific herring experience high predation
rates on both adult fish and their eggs (Hourston and Haegele 1980, Lassuy 1989, Willson and
Womble 2006). Referring to the predation pressure experienced by herring on Canada‟s Pacific
coast, Hourston and Haegele (1980) wrote: “They are most susceptible when massed on the
spawning grounds and preoccupied with spawning activities. Large herds of seals and sea lions,
pods of killer whales, flocks of gulls, cormorants and puffins, and schools of dogfish gather from
miles around to eat their fill from the bounteous supply of herring which is so readily
accessible.” In fact it has been hypothesized that the mass spawning strategy of Pacific herring
evolved to saturate predators with more biomass than can be consumed, thereby assuring
reproductive success in spite of high predation rates (Pianka 1978). Natural mortality for Pacific
herring has been estimated to be approximately 30% per year for adults (Hourston and Haegele

6
1980) and egg mortality from seabirds alone is estimated up to 40% annually (Outram 1958,
Haegele and Schweigert 1985).
Pacific herring spawning aggregations and their eggs together form an important annual
resource pulse that delivers high energy food to many consumers. Excluding fish, at least 25
vertebrate species forage in large numbers on adult herring and eggs at Pacific herring spawning
sites (Willson and Womble 2006). The vast majority of those species are birds, which primarily
forage on deposited eggs during low tide. Spawning herring can deliver exceedingly large
quantities of stored energy from the ocean to coastal consumers in the form of roe. The eggs
deposited by one spawning stock of Atlantic herring (Clupea harengus) constitute the world‟s
largest flux of biological energy caused by a single population (Varpe et al. 2005). In some
regions of the north Pacific, herring are the most important fish prey species for seabirds
(Therriault et al. 2009), and strong links exist between herring reproduction and seabird foraging
ecology. For example, surf scoters (Melanitta perspicillata) alter their foraging behavior and
habitat use in response to the availability of herring roe, forming aggregations up to 75 000
individuals at a single herring spawning site (Lok et al. 2008). And access to large quantities of
herring spawn may be crucial for certain migratory seabirds to replenish depleted energy
reserves (Anderson et al. 2009).
Far fewer marine mammals than seabirds have been documented foraging in large
numbers at Pacific herring spawning sites; however, herring aggregations are particularly
important for certain marine mammal populations. At least four marine mammal species prey on
herring aggregations: grey whales (Eschrichtius robustus), humpback whales (Megaptera
novaengliae), killer whales (Orcinus orcas), and Steller sea lions (Eumetopias jubatus) (Willson
and Womble 2006). Of these species, the relationship between Steller sea lions and herring

7
aggregations has been the most studied (Womble et al. 2005, Gende and Sigler 2006, Womble
and Sigler 2006, Sigler et al. 2009, Womble et al. 2009). Foraging on herring spawning and
overwintering aggregations is an important part of a seasonal foraging strategy used by Steller
sea lions to attain good body condition prior to the breeding season (Womble et al. 2005,
Womble et al. 2009) and is likely linked to their reproductive success (Costa et al. 1989).
Furthermore, it has been hypothesized that a dramatic decline in the western stock of Alaska
Steller sea lions is due to a dietary shift from highly nutritive forage fish, such as herring and
capelin, to low-energy gadids (Trites and Donnelly 2003, Rosen and Trites 2005).
The Pacific harbor seal (Phoca vitulina) is a noteworthy omission from the list of
predators that aggregate at herring spawning sites (Norcross et al. 2001, Willson and Womble
2006). Steller sea lions and harbor seals have largely overlapping diets and geographic
distributions (Bigg 1981, Schusterman 1981a), and both have been observed foraging in large
numbers at the spawning sites of other marine forage fish (Marston et al. 2002). Additionally,
herring are frequently observed in the diets of harbor seals throughout much of their range
(Thompson et al. 1991, Olesiuk 1993, Andersen et al. 2007, Lance and Jeffries 2007) and herring
are a preferred prey of harbor seals when they are available (Lunneryd 2001). Given the obvious
predator-prey relationship between seals and herring, it seems likely that harbor seals would also
respond to herring spawning aggregations.
Harbor seal foraging ecology
Harbor seals are a regionally abundant, high-level predator in marine and estuarine
environments, ranging throughout the temperate and subarctic waters of the North Pacific and
North Atlantic oceans (Bigg 1981). These small phocid seals primarily occupy the littoral zone,

8
often spending lengthy periods hauled out in near-shore areas on rocky or sandy substrates.
While they occasionally perform long-distance movements (Lowry et al. 2001, Lessage et al.
2004, Hardee 2008), harbor seals are considered non-migratory central place foragers, making
repeated short foraging trips from a preferred haul-out location. They are generalist predators
that feed on a variety of locally available fish and invertebrate species; however, their diet is
dominated by a few select species (Tollit et al. 1997).
Harbor seal diet and foraging behavior are influenced by a variety of factors including
sex (Thompson et al. 1998), age (Hastings et al. 2004), season (Lowry et al. 2001), time of day
(Frost et al. 2001), haul-out type (Hardee 2008, Reuland 2008), and dominant prey species
(Tollit et al. 1997). Among these factors, the dominant prey species has a particularly strong
influence on the foraging strategy adopted by harbor seals. For example, harbor seals that fed on
cryptic prey such as flounder use a “cruising” foraging strategy, i.e. they swim slowly along the
sea floor attempting to disturb well camouflaged prey, whereas harbor seals foraging on
conspicuous prey such as schooling sand lance pursue the schools at high speed attempting to
separate and consume small groups of fish (Bowen et al. 2002). In addition, seasonal or annual
changes in the distribution and abundance of preferred prey can change the overall foraging
strategy adopted by harbor seals. Harbor seals in Moray Firth, Scotland, feed in pelagic waters
in years when overwintering Atlantic herring are abundant, and in demersal waters when herring
are not abundant (Tollit et al. 1997).
Seasonal changes in the foraging behavior of harbor seals related to the abundance of
preferred prey are detectable in the diving behavior and horizontal movements of seals. Multiple
investigations of harbor seal diving behavior have observed strong diurnal dive depth patters in
certain seasons, suggesting that harbor seals follow vertically-migrating prey in the water column

9
when such prey are regionally abundant (Thompson et al. 1991, Hastings et al. 2004, Reuland
2008). A strong correlation between the fall distributions of harbor seals and the locations where
English sole (Parophrys vetulus) are seasonally aggregated has also been observed (Grigg et al.
2009). While these studies indirectly determined seal foraging on seasonally available prey, the
methods used are particularly powerful when combined with an analysis of prey remains (Sigler
et al. 2009).
It is surprising that the relationship between harbor seal foraging behavior and spawning
aggregations of Pacific herring remains poorly understood. Herring are amongst the highest
energy-density forage fish available to harbor seals (Anthony et al. 2000) and comprise a large
portion of the Pacific harbor seal diet (> 90% by frequency of occurrence) in some regions
(Lance and Jeffries 2007). In Scotland, harbor seals modify their haul-out use and foraging
patterns to take advantage of overwintering schools of Atlantic herring, leading to increased seal
body condition in the following spring (Thompson et al. 1996). Herring in the diet of harbor
seals in Limfjord, Denmark, peaked when herring entered the fjord to spawn, comprising 90% of
the weight consumed by seals during that time (Andersen et al. 2007). In San Francisco Bay,
harbor seal locations were correlated with herring spawning sites during the months when
herring spawn, and several hauled-out seals were observed covered in herring eggs (Grigg et al
2009). These findings strongly suggest that harbor seals take advantage of seasonal pulses of
spawning herring.
Harbor seals are likely to respond to seasonal pulses of spawning herring for several
reasons, beyond a simple preference for herring prey. Because harbor seals are generalist
predators, they are among those species most able to switch quickly between prey species
depending on which one is most abundant and readily available. Harbor seals are also highly

10
mobile predators, traveling up to 500 km between haul-out sites (Lowry et al. 2001). High
mobility enables consumers to respond quickly to resource pulses with an aggregative response,
and may explain why some harbor seals exhibit long-range movements. For instance, harbor
seals in southeastern Alaska aggregate during spring spawning runs of energy-rich eulachon
(Thaleichthys pacificus) (Marston et al. 2002), and harbor seals display both functional and
aggregative responses to the presence of migrating salmonids (Middlemas et al. 2006). Lastly,
harbor seals are relatively long lived predators with a high learning capacity (Schusterman
1981b), and the ability to memorize locations using a variety of cues including landscape
information (Mauck and Dehnhardt 2007). Harbor seals are therefore likely able to predict the
timing and locations of annual fish prey pulses such as spawning herring aggregations.
Harbor seals and Pacific herring in the Salish Sea
The Salish Sea is a trans-boundary inland body of water that includes the Strait of
Georgia, Puget Sound, and the Strait of Juan de Fuca (Fig. 1). Pacific herring are the most
studied of the forage fishes in the Salish Sea, with active survey efforts and management
practices on both sides of the Canada and U.S.A. border. Historically, there was a large
reduction fishery for Pacific herring in this region, which was used to produce fish meal and oil
(Hourston and Haegele 1980). However, due to concerns about declining herring populations,
the herring fishery in Washington State is almost completely closed. On the Canadian side of the
border, there continue to be well regulated fisheries for bait herring and roe. Population
estimates of herring in the Salish Sea are typically performed during the months when herring
are spawning, and are based on a combination of acoustic surveys and spawn deposition analysis.
In Washington State, most spawning occurs between mid January to early April (Fig. 2), and

11
Figure 1. The Salish Sea and its three major bodies of water: the Strait of Georgia, the Strait of
Juan de Fuca, and Puget Sound.
12
Figure 2. Range (gray shading) and peak (black shading) of documented spawn timing for WDFW Puget Sound Pacific herring
stocks. Figure used with the permission of Gustafson et al. (2006)

13
spawning locations are relatively consistent and well documented (Stick 2005). Recent concerns
about the rapid decline of the once-large Cherry Point herring stock in Washington have
instigated two extensive reviews by the U.S. National Marine Fisheries service on the status of
Pacific herring in the Salish Sea (Stout et al. 2001, Gustafson et al. 2006). Based on a wide
variety of evidence, the authors concluded that the Salish Sea contains a single distinct
population segment (DPS) of Pacific herring, despite some regional differences in spawn timing
and evidence of „homing‟ to specific spawning locations. The authors also concluded that the
Salish Sea Pacific herring DPS is overall healthy, although they admitted that certain potential
subpopulations within the DPS are in decline. Conversely, harbor seal populations are healthy
throughout the Salish Sea, having rebounded substantially since their protection by law in 1970
in Canada and in 1972 in the United States (Olesiuk et al. 1990, Jeffries et al. 1999). Harbor seal
populations in the Strait of Georgia experienced logistic growth during the 1970‟s and 80‟s,
showing an average growth rate of 11.5% per annum during that time period (Olesiuk 1999).
The same general trend was observed in Washington waters, where harbor seals populations in
Washington State appear to be near carrying capacity (Jeffries et al. 2003).
In some regions within the Salish Sea, the inverse correlation between the size of herring
and harbor seal subpopulations is quite striking. In the Strait of Juan de Fuca for example, there
has been a consistent decline in herring spawner biomass since the mid 1980‟s (Fig. 3), whereas
the harbor seal populations in that area have experienced a rapid increase during the same time
period (Fig.4). The decline in herring stock biomass in the Strait of Juan de Fuca is primarily
driven by the collapse of the historically abundant Discovery Bay herring stock (Gustafson et al.
2006). Local resource managers speculated that the Discovery Bay herring stock decline may

14
Figure 3. Pacific herring spawning biomass (metric tons) from 1973 to 2004 in the Strait of Juan de Fuca. Figure used with the
permission of Gustafson et al. (2006).

15
Figure 4. Generalized logistic growth curves of harbor seals in the Washington, inland waters
stock. Data presented for the Strait of Juan de Fuca stock (above), and the nearby San Juan
Island stock (below). Figures used with the permission of Jeffries et al. (2003).

16
have been a result of pinniped predation, particularly from animals using the nearby Protection
Island haul-out (Stick 2005). Similarly, increased pinniped predation was identified as one of the
major risk factors to the survival of Pacific herring in the Salish Sea (Stout et al. 2001).
Because harbor seals are so abundant and herring so well monitored in the Salish Sea, the
region is ideal to study the response of harbor seals to seasonal aggregations of spawning
herring. Working with the hypothesis that spawning herring aggregations are seasonally
important prey for harbor seals, our objective was to measure the seasonal changes in harbor seal
diet, foraging distribution, and diving behavior relative to spawning herring aggregations. We
monitored the behavioral response of harbor seals on Protection Island, WA, to seasonal changes
in herring distribution using a combination of satellite tags, time depth recorders, and seal scat
analysis. Specifically, we predicted that: 1) harbor seal consumption of adult herring peaks
during the season when herring are spawning, 2) harbor seals seasonally change their foraging
areas to take advantage of spawning herring aggregations, and 3) seal diving behavior reflects
the vertical distribution of herring in the water column when herring are spawning.
17
METHODS
Study location
Protection Island (48°07‟40”N, 122°55‟50”W) is a small National Wildlife Refuge
located in the eastern Strait of Juan de Fuca, USA, (Fig. 5) that is known for its extensive seabird
colonies and high quality marine habitat. We chose Protection Island for our study due to its
proximity to important herring spawning areas (Stick and Lindquist 2009) and its relative
importance as a harbor seal haul-out site (Jeffries et al. 2000). Two sandy spits extending
eastward and westward from the island are used by up to 1,000 harbor seals during all tidal
phases (Jeffries et al. 2000). Discovery Bay, situated approximately 3.5 km south of Protection
Island, is the spawning site of the Discovery Bay herring stock. It was once the second largest
herring stock in Washington State but has experienced a dramatic decline in recent decades,
possibly due to harbor seal predation (Stick 2005). To the west of Protection Island two other
small herring spawning grounds make up the Dungeness/Sequim Bay herring stock. While these
two stocks are the closest to Protection Island, all of Washington‟s inland herring spawning
locations are within foraging distance of Protection Island harbor seals (Hardee 2008).
Harbor seal diet
Harbor seal fecal samples (scats) were collected on a single day during each of two
herring-related seasons: spawn (16 March) and post-spawn (22 July). The seasons were defined
based on the local spawn timing (Stick 2005, Penttila 2007). Scats were collected on both island
spits, during daytime low tides, with a target sample size of 60 scats for each collection period

18
Figure 5. Protection Island, the site where harbor seals were tagged and scat collected. Nearby
bays used by spawning Pacific herring are also indicated.

19
(Trites and Joy 2005). Samples were collected in plastic „Whirlpak‟ bags and frozen until
processing.
Samples were washed using nest sieves (Lance et al. 2001). Prey were identified to the
lowest possible taxon using a dissecting microscope, reference fish bones from Washington and
Oregon, and published fish bone, otolith, and cephalopod beak keys (Kashiwada et al. 1979,
Morrow 1979, Wolff 1982, Clarke 1986, Cannon 1987, Harvey et al. 2000, Lance et al. 2001).
Otoliths were measured using an ocular micrometer and graded according to Tollit et al. (2004).
Only otoliths graded good (no or minimal erosion) and fair (small amount of erosion) were
measured. Data were entered into an Access database.
Diet data are presented as percent frequency of occurrence for each season (spawn and
post-spawn). To account for differences in sample sizes among seasons, we present an
unweighted average that was calculated by taking the mean percent Frequency of Occurrence
(FO) within each season for each prey species. When a sample contained hard parts identifiable
to the species level and other parts only identifiable to the family level (but within same family),
we included both the species category (e.g. Pacific herring) and the family category (e.g.
Unidentified clupeids) only when prey parts were different size (age) classes. Top prey species
were identified as those with frequency of occurrence ≥ 25% during one of the two seasons
(Luxa 2008).
To estimate the age and size classes of Pacific herring consumed by harbor seals we used
a three-step calculation. First, we applied grade-specific length correction factors (g-LCFs) to
herring otoliths from seal scats to correct for digestion erosion. Because appropriate correction
factors for Pacific herring were not available, we used the mixed diet correction factors for the
closely related species Pacific sardine (Sardinops sagax) to generate corrected otolith lengths

20
(Phillips and Harvey 2009). Second, we estimated herring lengths from corrected otolith lengths
using a published species-specific regression equation (Harvey et al. 2000). Lastly, consumed
herring age classes were calculated by comparing our estimated herring lengths to size at age
data for Pacific herring in the region (Schweigert et al. 2009). Juvenile herring were
differentiated from adults as those with an estimated age class < 3 (Hay 1985, Gustafson 2006).
Values are reported as mean ± SD.
Tag deployment and programming
On January 12th
and 13th
of 2008, harbor seals were captured on Protection Island using
the beach-seine method (Jeffries et al. 1993) (MMPA Permit No. 782-1702-05). All animals
were weighed, measured and flipper tagged with a unique identification number. Five adult seals
(2 males, 3 females) received a combined satellite-linked Time Depth Recorder (TDR) and
Fastloc GPS receiver (model MK10AF, Wildlife Computers, Redmond, USA) that was attached
to the pelage using 5-min epoxy. We placed the instruments on the dorsal midline on the
animals such that the tag would be exposed to the air when the back of the seal reached the water
surface. During Jan 12-July 3, 2008, we received regular transmissions from all five tags via the
Argos satellite network that contained compressed TDR and Fastloc GPS data. Messages were
processed using Wildlife Computers‟ software (DAP Processor 2008) and the progress of the
animals was monitored using the Satellite Tracking and Analysis Tool (Coyne and Godley
2005).
To conserve battery life, we limited the number of fastGPS measurement attempts to a
maximum of 4 per h or 100 per d. The TDR sensor was set to sample every 10s and record only
dives >2m in depth or >30s in duration. The tags automatically summarized the diving behavior

21
of the animals each day into four 6-h time periods: morning (0400-0959), day (1000-1559),
evening (1600-2159), and night (2200-0359) local time. Throughout the study, local sunrise
always occurred in the morning period and sunset always occurred during the evening period.
Transmitted maximum dive depth histograms tallied dives into twelve depth bins: 2-10, 10-20,
20-50, 50-100, 100-150, 150-200, 200-250, 250-300, 300-350, 350-400, 400-500, >500m. Only
those depth bins that contained data for at least one animal were used in subsequent analyses.
Similar to scat collection, all transmitted GPS locations and TDR histograms were
separated into two herring-related seasons of equal duration (84 d each): spawn (Jan 14-Apr 7)
and post-spawn (Apr 8 – Jun 30) based on the spawn timing of local Pacific herring (Stick 2005,
Penttila 2007).
Seal foraging areas
After the fastloc GPS locations were solved using the DAP processor, we imported for
initial inspection the location data into GIS (ArcView 9.3 – ESRI, Redlands, USA). We
removed extreme erroneous locations using a combination of two methods used in other GPS
studies of diving marine animals (Schofield et al. 2009, Costa et al. 2010). First, the data were
filtered using the grpSpeedFilter function in the R package “diveMove” (Luque and Liaw 2009),
which applies the first stage of the filtering algorithm described in Austin et al. (2003). For this
function we used the species-specific speed threshold of 2 m s-1
applied in previous harbor seal
studies (Williams and Kooyman 1985, Lessage et al. 1999, Hardee 2008). Second, we
subjectively removed any additional locations that passed the speed filter but were obviously
erroneous because they fell on land (Schofield et al. 2009). Because our interest was in the
foraging distribution of harbor seals, we eliminated locations associated with haul-out behavior.
22
Thompson et al. (1998) defined harbor seal foraging locations as any identified location > 2km
from a haul-out site. However, based upon our observations of seals around Protection Island
and the abundance of high quality fish habitat <2km of the island, we concluded that a 2km
buffer would be far too conservative and therefore chose to eliminate locations <0.5km of the
documented haul-out sites (Jeffries et al. 2000).
To address the questions of seal space use in this study, we calculated two foraging
Utilization Distributions (UDs) for each seal and for each herring-related season. To quantify
changes in space use between seasons, the first UD calculated was a fixed kernel density
estimate, which was later used in the calculation of overlap indices (Fieberg and Kochanny
2005). For the fixed kernel estimates we used the ad hoc method of bandwidth selection
(Worton 1995, Calenge 2006) because the Least Square Cross Validation method failed to
minimize for our data. While fixed kernel UDs are useful for quantifying UD similarity, they are
less effective for describing actual areas used by animals in close proximity to hard boundaries
such as coastlines (Getz et al. 2007). To better estimate the sizes and locations of seal foraging
areas, the second UD calculated was an adaptive local convex hull (a-LoCoH) (Getz et al. 2007,
Huck et al. 2008). The resulting 95% contour was used to describe the overall foraging area
used by each seal, and the 50% contour defined core foraging areas (Ostfeld 1986, Hyrenbach
2002, Hardee 2008).
Using the fixed kernel density estimates, we calculated an index of UD overlap to assess
whether seals used different foraging areas between the spawn and post-spawn seasons. An
extensive review of UD overlap indices concluded that the Utilization Distribution Overlap
Index (UDOI) is the most appropriate for analyses of space-use sharing (Fieberg and Kochanny
2005). In general, UDOI values <1 indicate less overlap than would be expected from
23
overlapping uniform distributions, whereas values >1 indicate greater UD overlap than would be
expected from overlapping uniform distributions. To statistically compare UDs between seasons
we created a set of reference values for UDOI by generating a null distribution of overlap indices
from 10 000 simulated, completely overlapping, random, uniform distributions. Using the
simulated overlaps, we calculated a p-value for each seal‟s overlap statistic i.e. the probability of
obtaining a value ≤ the observed overlap value from the null distribution.
Lastly, we quantified harbor seal use of herring habitat by calculating the amount of
overlap between each seal‟s a-LoCoH UDs and two publically available herring datasets: (1) the
documented locations where herring aggregate prior to spawning (holding areas), and (2)
documented locations where herring regularly deposit eggs (spawning areas) (Stick 2005, Stick
and Lindquist 2009). While the timing of herring spawn is quite consistent between years, there
is moderate between-year variability in the locations of herring holding areas (K.C. Stick,
Washington Department of Fish and Wildlife, La Conner, Washington, personal communication,
2008). Thus, caution should be exercised in the interpretation of the UD/herring area overlap
calculations. All values are reported as mean ± SD.
Seal diving behavior
We calculated three diving variables from the maximum dive-depth histograms to
describe seal diving behavior during the four 6-h periods. Any histograms that contained <10
dives/histogram were excluded from the analysis to prevent small sample size bias (Hastings et
al. 2004).

24
Dive depth focus. The degree to which harbor seals focused their diving to a single depth
bin was assessed by calculating the dive depth focus (F) within each histogram (Frost et al. 2001,
Hastings et al. 2004):
F = ∑ {[n i (n i -1)]/[N (N – 1)]}
With n being the number of dives per meter in bin i and N being the total number of dives in the
histogram (Hastings et al. 2004). Values of dive depth focus ranged from 1.0 (high focus) to
0.167 (low focus) with values > 0.5 indicating that most dives within the histogram were to a
single depth bin.
Modal dive depth. Previous studies of harbor seal diving behavior that used satellite data
recorders found that modes are strongly representative of seal diving behavior (Frost et al. 2001,
Hastings et al. 2004). Thus, harbor seal use of the water column was summarized by calculating
the modal dive depth, i.e. the depth bin with the highest number of dives per meter within a
histogram. In the rare case when a mode could not be identified because two depth bins had
equal dives per meter, that histogram was removed from subsequent analyses. To perform
statistical analyses on the modal dive depth we rescaled the depth bins to integers (1-12) from the
shallowest to the deepest bin.
Dive frequency. As a metric of overall foraging effort, we used dive frequency, i.e. the
number of dives per hour during each 6-h histogram. Differences in harbor seal dive frequency
between seasons may also be attributed to seasonal changes in seal behaviors other than
foraging; however harbor seals in the study region do not appear to undergo major life history
changes during the study period (Huber et al. 2001). Hence, we believe that changes in diving
frequency between the herring-related seasons can be attributed to changes in foraging behavior.

25
We used linear mixed effects models to test the effects of season (spawn, post-spawn)
and period (morning, day, evening, night) on the three dive parameters with the R package lme4
(Bates and Maechler 2009). Of the two fixed effects, period was nested within season, and both
were nested within the random effect of seal. For each dive parameter we compared the fit of
models that contained an interaction between the fixed effects and models containing each
separate main effect. Model fit was compared using Akaike Information Criterion, and the
model with the lowest AIC value is reported for each parameter.

26
RESULTS
Harbor seal diet
We collected 126 harbor seals scats from Protection Island between the two seasons
(spawn: n = 61, post-spawn: n = 65, Table 1). The average number of species per scat was 2.5 ±
1.4 during the spawn season, and 2.2 ± 1.3 during the post-spawn season; the maximum number
of prey species identified in a single scat was eight. Overall harbor seal diet included at least 21
species from 16 families. In both seasons the top prey species were Pacific herring, Walleye
pollock (Theragra chalcogramma), and Pacific sand lance (Ammodytes hexapteras); however the
importance of each top prey species varied between seasons. In the spawn season the dominant
prey species was Walleye pollock (FO = 62%) followed by Pacific herring (FO = 43%) and
Pacific sand lance (FO = 28%). Whereas the opposite trend was observed in the post-spawn
season, with the most important prey species being Pacific sand lance (FO = 42%) followed by
Pacific herring (FO = 40%) and Walleye pollock (FO = 25%). We observed only a minor
difference (3% FO) in the amount of herring consumed by harbor seals between the spawn and
post-spawn seasons.

27
Table 1. The percent frequency of occurrence (FO) of prey species in harbor seal scats collected
on Protection Island during the spawn (16 March) and post-spawn (22 July) seasons.
spawn post-spawn Phylum Family Group or Species Common Name n=61 %FO n=65 %FO
Chordata
Gadidae
50 82 24 37
Unidentified gadids Codfishes 9 15 6 9
Theragra chalcogramma Walleye pollock 38 62 16 25
Merluccius productus Pacific hake 0 0 1 2
Gadus macrocephalus Pacific cod 3 5 1 2
Clupeidae
36 59 42 65
Unidentified clupeids Herrings 9 15 16 25
Clupea pallasi Pacific herring 26 43 26 40
Alosa sapidissima American Shad 1 1.6 0 0
Salmonidae
12 20 21 32
Unidentified salmonids Salmon 11 18 21 32
Oncorhynchus tshawytscha Chinook salmon 1 16 0 0
Cottidae
5 8 2 3
Unidentified cottids Sculpins 2 3 1 2
Leptocottus armatus Staghorn sculpin 3 5 1 2
Ammodytidae Ammodytes hexapteras Pacific sand lance 17 28 27 42
Embiotocidae Cymatogaster aggregata Shiner perch 11 18 2 3
Engraulidae Engraulis mordax Northern anchovy 2 3 1 2
Pleuronectidae Unidentified pleuronectids Righteye flounders 2 3 5 8
Liparidae Unidentified liparidids Snailfishes 1 2 0 0
Rajidae Unidentified rajids Skates 1 2 5 8
Osmeridae Unidentified osmerids Smelts 1 2 0 0
Scorpaenidae Unidentified scorpaenids Rockfishes 0 0 1 2
Zoarcidae Unidentified zoarcids Eelpouts 2 3 2 3
Pholidae Unidentified pholids Gunnels 1 2 0 0
Unidentified fish spp.
1 2 5 8
Not identifiable fish spp. 3 5 0 0
Mollusca
Octopodidae Octopus rubescens Pacific red octopus 3 5 4 6
Loliginidae Loligo opalescens Market squid 2 3 1 2
Arthropoda
Unidentifiable crustaceans 2 3 1 2

28
A total of 230 herring otoliths were recovered from harbor seal scats between seasons
(spawn: n = 109, post-spawn: n = 121). Corrected otolith lengths (mean = 3.3 ± 0.93 mm) were
on average 28.9% larger than the uncorrected otolith lengths (mean = 2.5 ± 0.53 mm), equating
to an estimated average fish length of 15.4 ± 4.9 cm for herring consumed by harbor seals during
the study period. There was a remarkable difference in the estimated age classes of herring
consumed between the two seasons (Fig.7a-b). During the spawn season, herring in harbor seal
diet was comprised of 77% juveniles (estimated age class < 3) and 23% adults, versus the post-
spawn season in which 33% were juveniles and 67% were adults. Most (83%) of the juvenile
herring consumed during the spawn season were < 2 yrs in age. Of the adult herring consumed
during the spawn season, the large majority were age >7 yrs; whereas seals consumed a variety
of adult herring age classes during the post-spawn season.

29
a.
Spawn
< 2 2 3 4 5 6 7 > 7
Pe
rce
nt
of
he
rrin
g c
on
su
me
d
0
20
40
60
80
Adults
Juveniles
b.
Post-spawn
Estimated herring age class
< 2 2 3 4 5 6 7 > 7
Perc
ent
of
herr
ing c
onsum
ed
0
20
40
60
80
Figure 6. Estimated age classes of herring consumed by harbor seals during the spawn (a) and
post-spawn (b) seasons. Black bars indicate herring estimated to be juveniles and grey bars
indicate adults.

30
Seal foraging areas
All tags performed well during the study period with an average of 998 ± 229 GPS
locations per seal (range = 840-1397) or approximately 6 locations per day. Filtering steps
removed 1.5% of locations, and an additional 32% of locations were identified as haul-out
behavior and removed before calculation of the foraging utilization distributions. There were no
significant differences in the sizes of harbor seal foraging UDs between the spawn and post-
spawn seasons for the overall foraging areas: 95% a-LoCoH (spawn: 57.59 ± 42.28 km2, post-
spawn: 39.48 ± 11.29 km2; paired t = 1.22, df = 4, p = 0.29); and the core foraging areas: 50% a-
LoCoH (spawn: 6.95 ± 3.93 km2, post spawn: 7.19 ± 3.87 km
2; paired t = -0.16, df = 4, p = 0.88).
There was however a high degree of individual variability in the sizes of foraging UDs (Fig. 7a-
e).
The UDOI index of UD overlap indicated three of the five seals showed significantly less
UD overlap between seasons than would be expected from completely overlapping uniform
distributions at the 95 and 50% contour levels (Table 2). However, two of those three seals that
were identified as having changed their foraging areas between the spawn and post-spawn
seasons exhibited only minor foraging area differences between seasons (Fig. 7c1-c2, d1-d2).
Only one of the five seals foraged in a largely different region of the Strait of Juan de Fuca
between the spawn and post-spawn seasons (Fig. 7a1-a2).

31
Spawn
a1
b1
c1
Post-spawn
a2
b2
c2
Figure 7. Foraging areas of GPS-tagged harbor seals during the spawn (left) and post-spawn
(right) seasons. Symbols indicate GPS locations ( ), overall foraging areas (95% a-LoCoH) (
), core foraging areas (50% a-LoCoH) ( ), herring holding areas ( ), and herring
spawning areas ( ). Seal sex and ID are indicated in the upper left (F = female, M = male).
Herring data provided by Washington Department of Fish and Wildlife.

32
Spawn
d1
e1
Post-spawn
d2
e2
Figure 7 (continued). Foraging areas of GPS-tagged harbor seals during the spawn (left) and
post-spawn (right) seasons. Symbols indicate GPS locations ( ), overall foraging areas (95%
a-LoCoH) ( ), core foraging areas (50% a-LoCoH) ( ), herring holding areas ( ), and
herring spawning areas ( ). Seal sex and ID are indicated in the upper left (F = female, M =
male). Herring data provided by Washington Department of Fish and Wildlife.
33
Table 2. The utilization distribution overlap index UDOI between seasons (spawn, post-spawn)
for each tagged harbor seal. Overlap index values are presented for the 95 and 50% conditional
UDs. P values represent the probability of obtaining an overlap value ≤ the observed overlap
value from a null distribution of 10 000 completely overlapping uniform distributions.
Seal ID UDOI 95 P value UDOI 50 P value
F1 0.812 < 0.001 0.099 0.045
F2 1.183 1.000 0.151 0.711
F3 0.892 < 0.001 0.014 < 0.001
M1 0.929 < 0.001 0.043 < 0.001
M2 1.185 1.000 0.104 0.071

34
The amount of overlap between the a-LoCoH UDs and the herring holding/spawning
areas was not significantly different between the spawn and post-spawn seasons for either
contour level (Fig. 7a-e) i.e. between holding areas and the 95% contours (spawn: 7.24 ± 7.30
km2, post spawn: 10.17 ± 6.74 km
2; paired t = -2.11, df = 4, p = 0.10), between holding areas and
the 50% contours (spawn: 0.60 ± 1.26 km2, post spawn: 1.65 ± 2.79 km
2; paired t = -1.52, df = 4,
p = 0.22), between spawning areas and the 95% contours (spawn: 0.02 ± 0.05 km2, post spawn:
0.02 ± 0.05 km2; paired t = 1.00, df = 4, p = 0.37), and between spawning areas and the 50%
contours (spawn: 0.01 ± 0.02 km2, post spawn: 0.00 ± 0.00 km
2; paired t = 1.00, df = 4, p =
0.37). Two of the five seals had core foraging areas that overlapped with herring holding areas
during both seasons (Fig. 7a1-a2, c1-c2); whereas only one seal‟s core foraging area overlapped
slightly with documented herring spawning areas (Fig. 7c1), and it occurred during the spawn
season.
Seal diving behavior
After removing dive depth histograms with fewer than 10 dives, the average number of
histograms per seal was 220 ± 33 for the study period. Overall average values for the calculated
diving variables were: 0.60 ± 0.08 for dive depth focus (range from 0.167 indicating an even
dive distribution across all depth bins, to 1.0 indicating all dives were to a single depth bin), 2.1
± 0.61 for modal dive depth (i.e. the rescaled depth bin value), and 5.1 ± 0.31 dives/hr for diving
frequency.
Based on AIC values, the best model fit for the dive depth focus variable included an
interaction between season and time of day (Fig. 8a). In the spawn season, diving focus was
greatest during the day but only slightly higher than the other three time periods. The most

35
dramatic difference in dive depth focus occurred during the post spawn season, in which diving
focus was much greater during the night than any other time period. The best model for the
modal dive depth variable (Fig. 8b) contained only the random factor of individual seal. Lastly,
variation in diving frequency was best described by the effect of season, indicated by a
proportionally large difference in diving frequency between the spawn and post prawn seasons
(Fig. 8c). Harbor seals on average dove 1.1 dives h-1
less (20% change) during the spawn season
than they did during the post-spawn season (spawn = 4.43 ± 0.35 dives h-1
, post-spawn = 5.53 ±
0.53 dives h-1
).

36
Div
e d
epth
focus
0.4
0.5
0.6
0.7
0.8
Mod
al div
e d
epth
1.0
1.5
2.0
2.5
3.0
Morning Day Evening Night
Div
ing f
requen
cy (
div
es/h
r)
3
4
5
6
7
Spawn
Post spawn
a
b
C
Figure 8. Diurnal variation in harbor seal dive depth focus (a), modal dive depth (b), and diving
frequency (c) between seasons (spawn and post-spawn). Morning (0400-0959), day (1000-
1559), evening (1600-2159), and night (2200-0359). See text for details on dive variables.

37
DISCUSSION
Harbor seal diet
We detected two major differences in harbor seal diet between the spawn and post-spawn
seasons. The first was a shift from a diet dominated by Walleye pollock during the spawn season
to a diet that included a higher percentage of Pacific sand lance and a lower percentage of
pollock during the post-spawn season. The second major change was a shift from eating almost
entirely juvenile herring in the spawn season to eating mostly adult herring in the post-spawn
season (Fig. 6); although there was very little difference in the overall herring percent frequency
of occurrence between seasons. These observations are counter to our predictions that herring in
harbor seal diet would peak during the spawn season, and that the herring consumed by harbor
seals during the spawn season would primarily be spawning adults.
Several explanations could account for why Protection Island harbor seals did not
consume many adult herring during the spawn season. The first and most likely explanation is
that foraging on spawning herring is less profitable for harbor seals during the spawn season than
foraging on juvenile herring or pollock. When herring migrate into the inshore waters to spawn,
they cease foraging and largely rely on stored energy for gamete production and bodily
maintenance. This leads to a large decrease in herring energy density during the spawn season,
equating to a reduction of approximately 40% of their total somatic energy content (Paul et al.
1998). Juvenile herring however are only slightly less energy dense than adults during the spawn
season, but likely require substantially less handling time and are regionally abundant in the
spawn season (Paul et al. 1998). Given that handling times increase rapidly with prey size, some
authors have suggested that small prey are retained in the diets of large predators because they
are actually more profitable for predators when the energetic costs of prey acquisition are

38
considered (Scharf et al. 2001). Thus the decision by harbor seals to forage on juvenile herring
during the spawn season can be explained by the relative capturability of juveniles, combined
with the large proportional decrease in adult herring energy density during that season. This
finding implies that seasonal changes in the pulsed prey energy density and the availability of
profitable alternate prey, may both affect the likelihood that a predator will respond to the prey
pulse.
A less likely yet intuitive explanation for why harbor seals primarily consumed juvenile
herring during the spawn season is that spawning herring in the Strait of Juan de Fuca may no
longer be abundant enough to elicit a response from harbor seals. In the early 1980‟s a large
spawning population of Pacific herring occupied the area, but since then there has been a
consistent decline in spawning herring biomass in the Strait of Juan de Fuca (Stick 2005,
Gustafson et al. 2006, Stick and Lindquist 2009). Because a fundamental component of the
resource pulse definition includes a large magnitude increase in resource availability, it is
possible that spawning herring in the Strait of Juan de Fuca are no longer an effective resource
pulse (Ostfeld and Keesing 2000, Nowlin et al. 2008, Yang et al. 2008, Yang et al. 2010). If that
is the case, then we would not expect harbor seals in the Strait of Juan de Fuca to change their
foraging behavior during the spawn season and/or consume a higher proportion of adult herring.
However we would still expect local herring abundance to peak during the spawning season in
the Strait of Juan de Fuca. Thus this second explanation does not account for the observed
increase in harbor seal foraging on adult herring during the post-spawn season.
Additionally, if harbor seals only respond to large-magnitude spawning herring
aggregations, then we would expect that Protection Island harbor seals consumed a large
proportion of herring during the spawn season when Strait of Juan de Fuca herring were

39
historically abundant. Interestingly, historical harbor seal diet data from Protection Island in
1981 shows that harbor seals consumed more herring during the summer (55% frequency of
occurrence) than they did during the winter (29% frequency of occurrence) when herring were
spawning (Everitt et al. 1981). At that time spawning herring biomass in the Strait of Juan de
Fuca was approximately ten times larger than it is currently (Gustafson et al. 2006). Since
harbor seals chose to consume more herring during the post-spawn even when spawning herring
in the Strait of Juan de Fuca were extremely abundant, it lends further support to our first
explanation that foraging on adult herring may be more profitable for Protection Island seals
during the post-spawn season.
Seal foraging areas
Based on the UDOI index, a large proportion of harbor seals from Protection Island
(40%) showed high foraging site fidelity between seasons (Table 2). Of the seals that did use
different foraging areas between seasons, only one appeared to forage in a noticeably different
region within the Strait of Juan de Fuca (Fig. 7a1-a2). These results are somewhat counter to our
prediction that harbor seals use different foraging areas when herring are spawning versus when
they are not spawning. However, these results are consistent with the findings of other
researchers who have detected high foraging area fidelity in harbor seals (Suryan and Harvey
1998, Tollit et al. 1998).
Also contrary to our predictions, there was no seasonal difference in harbor seal use of
documented herring holding areas or spawning areas. Foraging areas of seals overlapped with
herring areas in both seasons, suggesting that portions of herring spawning habitat are important
foraging areas for harbor seals regardless of the presence of herring. The only two herring areas

40
that overlapped with harbor seal foraging areas were those closest to the haul-out site. While all
of the inshore herring spawning areas are within the foraging range of harbor seals on Protection
Island, none of the distant spawning areas were used by tagged seals. If Strait of Juan de Fuca
herring populations were indeed insufficient to elicit a response from Protection Island harbor
seals, it is noteworthy that those seals did not change their foraging areas to be in other locations
of high spawning herring abundance within their range. This implies that harbor seals on
Protection Island were either unaware of the availability of the other spawning aggregations, or
foraging on those aggregations is not profitable enough to elicit an aggregative response from
distant harbor seals. Due to the variability of herring holding areas and our small sample size we
hesitate to draw firm conclusions from these results. However our data suggest that despite their
high mobility and therefore high likelihood of exhibiting a numeric response to prey pulses
(Rose and Polis 1998, Ostfeld and Keesing 2000), harbor seals did not appear to alter their
foraging areas to utilize seasonal pulses of spawning herring.
Seal diving behavior
Despite the small sample size, we detected strong seasonal and diurnal variations in
harbor seal diving focus and frequency during the study period (Fig. 8a, 9c). In the herring
spawn season harbor seal dive depth focus peaked during the day, and diving was overall less
frequent during this period. These results are consistent with our prediction that harbor seal
diving behavior during the spawn season would reflect the distribution of diurnally migrating
prey. However, during the spawn season harbor seals primarily consumed Walleye pollock and
juvenile herring, rather than consuming adult herring as we had expected (Fig. 6). Pollock of the
size class eaten by harbor seals and juvenile herring both occupy nearshore waters and perform

41
daily vertical migrations; during the day they form dense shoals near the sea floor, and then
disperse into the upper water column at night to feed (Lowry et al. 1988, Gustafson et al. 2000).
The peak in daytime dive depth focus during the spawn season suggests that seals adopted a
benthic or demersal foraging strategy, likely targeting dense schools of young herring and
pollock. However, we did not observe a corresponding pattern in harbor seal dive depths that
would support that conclusion. This may be due to the highly variable bathymetry in the study
region and the large individual variability in harbor seal foraging areas (Suryan and Harvey
1998, Hardee 2008). In fact, the inclusion of diving focus as a factor in pinniped studies that
incorporate binned dive data was partially driven by the goal of detecting benthic foraging in
habitats with highly variable bathymetry (Frost et al. 2001). Given the bathymetric complexity
of the habitat surrounding Protection Island, it is not surprising that we did not detect a consistent
pattern of depths used across all seals.
The most striking difference in diving behavior between seasons was the large peak in
nighttime diving focus during the post-spawn season (Fig. 8a), accompanied by an increase in
overall diving effort (Fig. 8c). During the post-spawn season we also observed a decrease in the
importance of pollock in seal diet and an increase in sand lance consumption. The peak in
nighttime diving focus is likely related to the observed increase in foraging on sand lance during
the post-spawn season. Sand lance bury themselves in sea floor and remain dormant throughout
most of the winter until food availability increases the following spring. Once active, sand lance
forage in large schools during the day and migrate nightly into the substrate to avoid predation
(Robards et al. 1999). Harbor seals regularly forage on buried sand lance by disturbing them out
of the sediment, and it has been demonstrated that this benthic foraging strategy is more
profitable for seals than pursuing daytime schools of sand lance (Bowen et al. 2002). The peak

42
in harbor seal diving focus during the post-spawn season is therefore likely due to an increase in
nighttime benthic foraging on sand lance during that season.
Given the harbor seal diet differences between seasons, the overall decrease in harbor
seal diving effort during the spawn season is more difficult to interpret. We expected that seal
diving frequency would be lower during the spawn season because less effort would be required
to meet energetic needs when foraging on densely aggregated adult herring. However, while we
did observe lower diving effort during the spawn season, we also found that seals did not
consume many adult herring at that time (Fig. 6). One possible explanation for the reduction in
diving effort during the spawn season is that juvenile herring and pollock require less handling
time than adults, and several prey could be acquired within a single dive. Therefore fewer dives
may actually be required for harbor seals to meet their energetic needs when foraging on juvenile
fish. Whereas, the increased diving frequency in the post-spawn season could reflect the greater
effort required to catch adult herring and other energy-rich prey e.g. salmonids, available during
that season. However the increase in foraging effort during the post-spawn season is likely offset
by the high energy density of their prey at that time. This clearly demonstrates the usefulness of
concurrent diet analysis when interpreting pinniped telemetry data, and emphasizes the
importance of a multi-level approach to understanding predator responses to changes in prey
availability.
Conclusions
Protection island harbor seals exhibited several behavioral differences between the spawn
and post-spawn seasons while some behaviors did not change. First and foremost, harbor seals
consumed primarily juvenile herring and pollock in the spawn season, and then switched to adult

43
herring and sand lance in the post-spawn season. Harbor seal diving focus was greatest in the
day during the spawn season, and peaked at night during the post-spawn season combined with
an increase in overall diving effort (i.e. frequency). Three of the five tagged seals changed their
foraging utilization distributions between seasons; however only one seal used a largely different
foraging area during the spawn season. Lastly, harbor seal foraging areas only overlapped with
herring holding and spawning areas that were closest to the haul-out site, and did so in both
seasons.
Pacific herring spawning aggregations are an important seasonal resource pulse for a
wide variety of consumers including pinnipeds (Hourston and Haegele 1980, Lassuy 1989,
Willson and Womble 2006, Therriault et al. 2009). However, despite suggestive evidence that
harbor seals are likely to utilize these seasonal aggregations, our data did not indicate that
spawning herring are important prey for Protection Island harbor seals. Instead we found that
juvenile herring and Walleye pollock were the key prey species for harbor seals during the
season when herring are spawning. These findings are consistent with another herring resource
pulse study that did not identify harbor seals as responding to spawning herring aggregations
(Willson and Womble 2006). However they are inconsistent with a study that reported harbor
seal consumption of herring peaked during the herring spawn season in the north Atlantic
(Andersen et al. 2007). While our results may be partially explained by a large reduction in
herring spawner biomass in the Strait of Juan de Fuca, there is also strong evidence that adult
herring are less profitable for harbor seals during the spawn season than they are at other times of
year.
Our study indicates that future resource pulse investigations that focus on the response of
predators should take into account several aspects of a resource pulse, such as seasonal changes

44
in prey energy density, prey handling time, and availability of alternative prey, which are all
likely to affect the response of predators to seasonal prey pulses. A similar study design to this
one that incorporates a concurrent survey of prey availability between seasons could yield
substantial additional insight into the relationship between harbor seals and their herring prey.

45
LITERATURE CITED
Adams, N.G., Lesoing, M., and Trainer, V.L. 2000. Environmental conditions associated with
domic acid in razor clams on the Washington coast. J. Shellfish Res. 19: 1007-1015.
Andersen, S.M., Teilmann, J., Harders, P.B., Hansen, E.H., and Hjøllund, D. 2007. Diet of
harbour seals and great cormorants in Limfjord, Denmark: interspecific competition and
interaction with fishery. ICES J. Mar. Sci. 64: 1235-1245.
Anderson, E.M., Lovvorn, J.R., Esler, D., Boyd, W.S., and Stick, K.C. 2009. Using predator
distributions, diet, and condition to evaluate seasonal foraging sites: sea ducks and
herring spawn. Mar. Ecol. Prog. Ser. 386: 287-302.
Anthony, J.A., Roby, D.D., and Turco, K.R. 2000. Lipid content and energy density of forage
fishes from the northern Gulf of Alaska. J. Exp. Mar. Biol. Ecol. 248: 53-78.
Bates, D., and Maechler, M. 2009. lme4: Linear mixed-effects models using S4 classes. R
package version 0.999375–31.
Bigg, M.A. 1981. Harbour Seal, Phoca vitulina and Phoca largha. In Handook of marine
mammals. Edited by S.H. Ridgway and R.J. and Harrison. Academic Press, New York.
pp. 1-28.
Bologna, P.A.X., Fetzer, M.L., McDonnell, S., and Moody, E.M. 2005. Assessing the potential
benthic-pelagic coupling in episodic blue mussel (Mytilus edulis) settlement events
within eelgrass (Zostera marina) communities. J. Exp. Mar. Biol. Ecol. 316: 117-131.
Boutin, S., Wauters, L.A., McAdam, A.G., Humphries, M.M., Tosi, G., and Dhondt, A.A. 2006.
Anticipatory reproduction and population growth in seed predators. Science 314: 1928-
1930.
Bowen, W.D., Tully, D., Boness, D.J., Bulheier, B.M., and Marshall, G.J. 2002. Prey-dependent
foraging tactics and prey profitability in a marine mammal. Mar. Ecol. Prog. Ser. 244:
235-245.
Calenge, C. (2006) The package adehabitat for the R software: a tool for the analysis of space
and habitat use by animals. Ecol. Model. 197: 516-519.
Cannon, D.Y. 1987. Marine Fish Osteology: A manual for archaeologists. Archaeology Press,
Simon Fraser University, Burnaby, British Columbia. Publication no. 18 pp.
Chesson, P. 1994. Multispecies competition in variable environments. Theor. Popul. Biol. 45:
227-276.
Clarke, M.R. (ed.). 1986. A handbook for the identification of cephalopod beaks. Clarendon
Press, Oxford. 273 pp.

46
Costa, D.P., Croxall, J.P., and Duck, C.D. 1989. Foraging energetics of Antarctic fur seals in
relation to changes in prey availability. Ecology 70: 596-606.
Costa, D.P., Robinson, P.W., Arnould, J.P.Y., Harrison, A., Simmons, S.E., Hassrick, J.L.,
Hoskins, A.J., Kirkman, S.P., Oosthuizen, H., Villegas-Amtmann, S., and Crocker, D.E.
2010. Accuracy of ARGOS locations of pinnipeds at-sea estimated using fastloc GPS.
PLoS ONE 5: e8677.
Coyne, M.S., and Godley, B.J. 2005. Satellite Tracking and Analysis Tool (STAT): an integrated
system for archiving, analyzing, and mapping animal tracking data. Mar. Ecol. Prog. Ser.
301: 1-7.
Everitt, R.D., Gearin, P.J., Skidmore, J.S., and DeLong, R.L. 1981. Prey items of harbor seals
and California sea lions in Puget Sound, Washington. The Murrelet 62: 83-86.
Fieberg, J., and Kochanny, C.O. 2005. Quantifying home-range overalp: The importance of the
utilization distribution. J. Wildl. Manag. 69: 1346-1359.
Frost, K.J., Simpkins, M.A., and Lowry, L.F. 2001. Diving behavior of subadult and adult harbor
seals in Prince William Sound, Alaska. Mar. Mamm. Sci. 17: 813-834.
Gende, S.M., and Sigler, M.F. 2006. Persistence of forage fish 'hot spots' and its association with
foraging Steller sea lions (Eumetopias jubatus) in southeast Alaska. Deep-Sea Research
II 53: 432-441.
Getz, W.M., Fortmann-Roe, S., Cross, P.C., Lyons, A.J., Ryan, S.J., and Wilmers, C.C. 2007.
LoCoH: Nonparametric kernal methods for constructing home ranges and utilization
distributions. PLoS ONE 2: e207.
Grigg, E.K., Klimley, A.P., Allen, S.G., Green, D.E., Elliott-Fisk, D.L., and Markowitz, H. 2009.
Spatial and seasonal relationships between Pacific harbor seals (Phoca vitulina richardii)
and their prey, at multiple scales. Fish. Bull. 107: 359-372.
Gustafson R.G., W.H. Lenarz, B.B. McCain, C.C. Schmitt, W.S. Grant, T.L. Builder, and R.D.
Methot. 2000. Status review of Pacific Hake, Pacific Cod, and Walleye Pollock from
Puget Sound, Washington. U.S. Dept. Commer., NOAA Tech. Memo. NMFS-NWFSC-
44, 275 p.
Gustafson R.G., J. Drake, M.J. Ford, J.M. Myers, E.E. Holmes, and R.S. Waples. 2006. Status
review of Cherry Point Pacific herring (Clupea pallasii) and updated status review of the
Georgia Basin Pacific herring distinct population segment under the Endangered Species
Act. U.S. Dept. Commer., NOAA Tech. Memo. NMFS-NWFSC-76, 182 p.
Haegele, C.W., and and Schweigert, J.F. 1985. Distribution and characteristics of herring
spawning grounds and description of spawning behavior. Can. J. Fish. Aquat. Sci. 42: 39-
55.

47
Hardee, S. 2008. Movements and home ranges of harbor seals (Phoca vitulina) in the inland
waters of the Pacific Northwest. Master's thesis, Department of Biology, Western
Washington University, Belligham, WA.
Harvey, J.T., Loughlin, T.R., Perez, M.A., and Oxman, D.S. 2000. Relationship between fish
size and otolith length for 63 species of fishes from the eastern North Pacific Ocean.
Technical Report NMFS150. Fish. Bull., NOAA, U. S. Department of Commerce,
Seattle, Washington.
Hastings, K.K., Frost, K.J., Simpkins, M.A., Pendleton, G.W., Swain, U.G., and Small, R.J.
2004. Regional differences in diving behavior of harbor seals in the Gulf of Alaska. Can.
J. Zool. 82: 1755-1773.
Hay, D.E. 1985. Reproductive biology of Pacific herring (Clupea harengus pallasi). Can. J. Fish.
Aquat. Sci. 42 Suppl 1: 111-126.
Helfield, J.M., and and Naiman, R.J. 2001. Effects of salmon-derived nitrogen on riparian forest
growth and implications for stream productivity. Ecology 82: 2403-2409.
Herrera, C.M., Jordano, P., Guitián, J., and and Traveset, A. 1998. Annual variability in seed
production by woody plants and the masting concept: Reassessment of principles and
relationship to pollination and seed dispersal. Am. Nat. 152: 576-594.
Holmgren, M., Scheffer, M., Ezcurra, E., Gutiérrez, J.R., and and Mohren, G.M.J. 2001. El Niño
effects on the dynamics of terrestrial ecosystems. Trends Ecol. Evol. 16: 89-94.
Holt, R.D. 2008. Theoretical perspectives on resource pulses. Ecology 89: 671-681.
Hourston, A.S., and Haegele, C.W. 1980. Herring on Canada's Pacific coast. Can. Spec. Publ.
Fish. Aquat. Sci. 48.
Huber, H.R., Jeffries, S.J., Brown, R.F., DeLong, R.L., and Van Blaricom, G. 2001. Correcting
aerial survey counts of harbor seals (Phoca vitulina richardsi) in Washington and
Oregon. Mar. Mamm. Sci. 17: 276-293.
Huck, M., Davidson, J., and and Roper, T.J. 2008. Comparison of two sampling protocols and
four home-range estimators using radio-tracking data from urban badgers Meles meles.
Wildl. Biol. 14: 467-477.
Hyrenbach, K.D. 2002. Oceanographic habitats of two sympatric North Pacific albatrosses
during the breeding season. Mar. Ecol. Prog. Ser. 233: 283-301.
Jeffries, S.J., Gearin, P.J., Huber, H.R., Saul, D.L., and Pruett, D.A. 2000. Atlas of seal and sea
lion haulout sites in Washington. Washington Department of Fish and Wildlife, Wildlife
Science Division, 600 Capitol Way North, Olympia, WA.
Jeffries, S.J., Huber, H.R., Calambokidis, J., and Laake, J. 2003. Trends and status of harbor
seals in Washington State: 1978-1999. J. Wildl. Manag. 67: 208-219.

48
Kashiwada, J., C.W. Recksiek, K.A. Karpov. 1979. Beaks of the market squid, Loligo
opalescens, as tools for predator studies. CalCOFI 20:65-69.
Kelly, D. 1994. The evolutionary ecology of mast seeding. Trends in Ecology and Evolution 9:
465-470.
Kitchell, J.F., Schindler, D.E., Herwig, B.R., Post, D.M., and and Olson, M.H. 1999. Nutrient
cycling at the landscape scale: The role of diel foraging migrations by geese at the
Bosque del Apache National Wildlife Refuge, New Mexico. Limnol. Oceanogr. 44: 828-
836.
Lance, M.M., Orr, A.J., Riemer, S.D., Weise, M.J., and Laake, J.L. 2001. Pinniped food habits
and prey identification techniques protocol AFSC Processed Report 2001-04, Alaska
Fisheries Science Center, National Marince Fisheries Service, Seattle, WA.
Lance, M.M., and Jeffries, S.J. 2007. Temporal and spatial variability of harbor seal diet in the
San Juan Island archipelago. Final Report to U.C. Davis Wildlife Health Center, SeaDoc
Society, Washington Department of Fish and Wildlife, Lakewood, WA.
Lassuy, D.R. 1989. Species profiles: Life histories and environmental requirements of coastal
fishes and invertebrates (Pacific Northwest) - Pacific Herring. U.S. Fish. Wildl. Serv.
Biol. Rep. 82 (11.126): 1-18.
Lesage, V., Hammill, M.O., and Kovacs, K.M. 1999. Functional classification of harbor seal
(Phoca vitulina) dives using depth profiles, swimming velocity, and an index of foraging
success. Can. J. Zool. 77: 74-87.
Lesage, V., Hammill, M.O., and Kovacs, K.M. 2004. Long-distance movements of harbour seals
(Phoca vitulina) from seasonally ice-covered area, the St. Lawrence River estuary,
Canada. Can. J. Zool. 82: 1070-1081.
Lima, M., Marquet, P.A., and and Jaksic, F.M. 1999. El Niño events, precipitation patterns, and
rodent outbreaks are statistically associated in semiarid Chile. Ecography 22: 213-218.
Lok, E.K., Kirk, M., Esler, D., and and Boyd, W.S. 2008. Movements of pre-migratory surf and
white-winged scoters in response to pacific herring spawn. Waterbirds 31: 385-393.
Longhurst, A. 2001. A major seasonal phytoplankton bloom in the Madagascar Basin. Deep Sea
Research Part I: Oceanographic Research Papers 48: 2413-2422.
Lowry, L.F., Frost, K.J., Ver Hoef, J.M., and DeLong, R.L. 2001. Movements of satellite-tagged
subadult and adult harbor seals in Prince William Sound, Alaska. Mar. Mamm. Sci. 17:
835-861.
Lunneryd, S.G. 2001. Fish preference by the harbour seal (Phoca vitulina), with implications for
the control of damage to fishing gear. ICES J. Mar. Sci. 58: 824-829.
Luque, S.P. 2007. Diving Behaviour Analysis in R. R News 7: 8-14.

49
Luxa, K. 2008. Food habits of harbor seals (Phoca vitulina) in two estuaries in northern Puget
Sound, Washington. Master's thesis, Biology, Western Washington University,
Bellingham, WA.
Marston, B.H., Willson, M.F., and Gende, S.M. 2002. Predator aggregations during eulachon
Thaleichthys pacificus spawning runs. Mar. Ecol. Prog. Ser. 231: 229-236.
Mauck, B., and Dehnhardt, G. 2007. Spatial multiple-choice matching in a harbour seal (Phoca
vitulina): differential encoding of landscape versus local feature information? Anim.
Cogn. 10: 397-405.
McShea, W.J. 2000. The influence of acorn crops on annual variation in rodent and bird
populations. Ecology 81: 228-238.
Middlemas, S.J., Barton, T.R., Armstrong, J.D., and Thompson, P.M. 2006. Functional and
aggregative responses of harbour seals to changes in salmonid abundance. Proc. R. Soc.
B 273: 193-198.
Morrow J.E. 1979. Preliminary keys to otoliths of some adult fishes of the Gulf of Alaska,
Bering Sea, and Beaufort Sea. NOAA Tech. Rpt., NMFS, Circular 420.
Naiman, R.J., Bilby, R.E., Schindler, D.E., and and Helfield, J.M. 2002. Pacific salmon,
nutrients, and the dynamics of freshwater and riparian ecosystems. Ecosystems 5: 399-
417.
Norcross, B.L., Brown, E.D., Foy, R.J., Frandsen, M., Gay, S.M., Kline, T.C.J., Mason, D.M.,
Patrick, E.V., Paul, A.J., and and Stokesbury, K.D.E. 2001. A synthesis of the life history
and ecology of juvenile Pacific herring in Prince Willian Sound, Alaska. Fish. Oceanogr.
10 (Suppl. 1): 42-57.
Nowlin, W.H., Vanni, M.J., and Yang, L.H. 2008. Comparing resource pulses in aquatic and
terrestrial ecosystems. Ecology 89: 647-659.
Odum, E.P. 1969. The strategy of ecosystem development. Science 164: 262-270.
Olesiuk, P.F., Bigg, M.A., and Ellis, G.M. 1990. Recent trends in the abundance of harbour
seals, Phoca vitulina, in British Columbia. Can. J. Fish. Aquat. Sci. 47: 992-1003.
Olesiuk, P.F. 1993. Annual prey consumption by harbour seals (Phoca vitulina) in the Strait of
Georgia, British Columbia. Fish. Bull. 91: 491-515.
Olesiuk, P.F. 1999. An assessment of the status of harbour seals (Phoca vitulina) in British
Columbia. Research Document 99/33, Department of Fisheries and Oceans, Nanaimo,
BC.
Ostfeld, R.S. 1986. Territoriality and Mating System of California Voles. J. Anim. Ecol. 55: 691-
706.

50
Ostfeld, R.S., and and Keesing, F. 2000. Pulsed resources and community dynamics of
consumers in terrestrial ecosystems. Trends Ecol. Evol. 15: 232-237.
Outram, D.N. 1958. The magnitude of herring spawn losses due to bird predation on the west
coast of Vancouver Island. Fish. Res. Board Can. Pac. Prog. Rep. 111: 9-13.
Paul, A.J., Paul, J.M., and Brown, E.D. 1998. Fall and spring somatic energy content for Alaskan
Pacific herring (Clupea pallasi Valenciennes 1847) relative to age, size and sex. J. Exp.
Mar. Biol. Ecol. 223: 133-142.
Penttila, D. 2007. Marine forage fishes in Puget Sound. Puget Sound Nearshore Partnership
Report No. 2007-03, Seattle District, U.S. Army Corps of Engineers, Seattle, WA.
Phillips, E.M., and Harvey, J.T. 2009. A captive feeding study with the Pacific harbor seal
(Phoca vitulina richardii): Implications for scat analysis. Mar. Mamm. Sci. 25: 373-391.
Pianka, E. R. 1974. Evolutionary Ecology. First Edition. Harper and Row, New York. 356 pp.
Reuland, K. 2008. Seasonal variation in the foraging behavior of harbor seals in the Georgia
Basin: implications for marine reserves. Master's thesis, Department of Biology, Western
Washington University, Bellingham, WA.
Robards, M.D., M.F. Wilson, R.H. Armstrong, and J.F. Piatt, eds. 1999. Sand lance: A review of
biology and predator relations and annotated bibliography. Exxon Valdez oil spill
restoration project 99346 final report. Research Paper PNW-RP-521. Portland, Oregon:
U.S. Department of Agriculture Forest Service.
Rose, M.D., and and Polis, G.A. 1998. The distribution and abundance of coyotes: The effects
of allochthonous food subsidies from the sea. Ecology 79: 998-1007.
Rosen, D.A.S., and Trites, A.W. 2005. Examining the potential for nutritional stress in young
Steller sea lions: physiological effects of prey composition. J. Comp. Physiol. B 175:
265-273.
Sánchez-zapata, J.A., Donázar, J.A., Delgado, A., Forero, M.G., Ceballos, O., and and Hiraldo,
F. 2007. Desert locust outbreaks in the Sahel: resource competition, predation and
ecological effects of pest control. J. Appl. Ecol. 44: 323-329.
Scharf, F.S., Juanes, F., and Rountree, R.A. 2000. Predator size - prey size relationships of
marine fish predators: interspecific variation and effects of ontogeny and body size on
trophic-niche breadth. Mar. Ecol. Prog. Ser. 208: 229-248.
Schmidt, K.A., and and Ostfeld, R.S. 2003. Songbird populations in fluctuating environments:
Predator responses to pulses resources. Ecology 84: 406-415.
Schmidt, K.A., and and Ostfeld, R.S. 2008. Numerical and behavioral effects within a pulse-
driven system: Consequences for shared prey. Ecology 89: 635-646.
51
Schofield, G., Lilley, M.K.S., Bishop, C.M., Brown, P., Katselidis, K.A., Dimopoulos, P., Pantis,
J.D., and Hays, G.C. 2009. Conservation hotspots: implications of intense spatial area use
by breeding male and female loggerheads at the Mediterranean‟s largest rookery.
Endang. Species. Res. 10: 191-202.
Schusterman, R.J. 1981a. Steller Sea Lion, Eumetopias jubatus. In Handook of marine
mammals. Edited by S.H. Ridgway and R.J. and Harrison. Academic Press, New York.
pp. 119-141.
Schusterman, R.J. 1981b. Behavioral capabilities of seals and sea lions: A review of their
hearing, visual, learning, and diving skills. Psychol. Rec. 31: 125-143.
Schweigert, J., Christensen, L.B., and Haist, V. 2009. Stock assessments for British Columbia
herring in 2008 and forecasts of the potential catch in 2009. Canadian Science Advisory
Secretariat, 2009/019: 66p.
Sigler, M.F., Tollit, D.J., Vollenweider, J.J., Thedinga, J.F., Csepp, D.J., Womble, J.N., Wong,
M.A., Rehberg, M.J., and Trites, A.W. 2009. Steller sea lion foraging response to
seasonal changes in prey availability. Mar. Ecol. Prog. Ser. 388: 243-261.
Stephens, D.W., and Krebs, J.R. 1986. Foraging Theory. Princeton University Press, Princeton,
NJ. 237pp.
Stevenson, J.C. 1955. The movement of herring in Brittish Columbia waters as determined by
tagging. Rapp. P.-V. Reun. Perm. Int. Explor. Mer. 140: 33-24.
Stick, K.C. 2005. 2004 Washington State herring stock status report. SS 05-01, Fish Program,
Washington Department of Fish and Wildlife, Olympia, WA.
Stick, K.C., and Lindquist, A. 2009. 2008 Washington State herring stock status report. FPA 09-
05, Fish Program, Washington Department of Fish and Wildlife, Olympia, WA.
Stout, H.A., R.G. Gustafson, W.H. Lenarz, B.B. McCain, D.M. VanDoornik, T.L. Builder, and
R.D. Methot. 2001. Status review of Pacific Herring in Puget Sound, Washington. U.S.
Dept. Commer., NOAA Tech. Memo. NMFS-NWFSC- 45, 175 p.
Suryan, R.M., and Harvey, J.T. 1998. Tracking harbor seals (Phoca vitulina richardsi) to
determine dive behavior, foraging activity, and haul-out site use. Mar. Mamm. Sci. 14:
361-372.
Therriault, T.W., Hay, D.E., and Schweigert, J.F. 2009. Biological overview and trends in
pelagic forage fish abundance in the Salish Sea (Strait of Georgia, British Columbia).
Mar. Ornithol. 37: 3-8.
Thompson, P.M., Pierce, G.J., Hislop, J.R.G., Miller, D., and Diack, J.S.W. 1991. Winter
foraging by common seals (Phoca vitulina) in relation to food availability in the inner
Moray Firth, N.E. Scotland. J. Anim. Ecol. 60: 283-294.

52
Thompson, P.M., Tollit, D.J., Greenstreet, S.P.R., Mackay, A., and Corpe, H.M. 1996. Between-
year variations in the diet and behaviour of harbour seals Phoca vitulina in the Moray
Firth; causes and consequences. In Aquatic Predators and their Prey. Edited by S.P.R.
Greenstreet and M.L. Tasker. Fishing News Books, Osney Mead, Oxford. pp. 44-52.
Thompson, P.M., Mackay, A., Tollit, D.J., Enderby, S., and Hammond, P.S. 1998. The influence
of body size and sex on the characteristics of harbour seal foraging trips. Can. J. Zool. 76:
1044-1053.
Tollit, D., Greenstreet, S.P.R., and Thompson, P.M. 1997. Prey selection by harbour seals, Phoca
vitulina, in relation to variations in prey abundance. Can. J. Zool. 75(9): 1508-1518.
Tollit, D.J., Black, A.D., Thompson, P.M., Mackay, A., Corpe, H.M., Wilson, B., Parijs, S.M.,
Grellier, K., and Parlane, S. 1998. Variations in harbour seal Phoca vitulina diet and
dive-depths in relation to foraging habitat. J. Zool. 244: 209-222.
Tollit, D., Heaslip, S.G., Joy, R., Call, K.A., and Trites, A.W. 2004. A method to improve size
estimates of Walleye pollock (Theragra chalcogramma) and Atka mackerel
(Pleurogrammus monopterygius) consumed by pinnipeds: digestion correction factors
applied to bones and otoliths recovered in scats. Fish. Bull. 102: 498-508.
Trites, A.W., and Donnelly, C.P. 2003. The decline of Steller sea lions Eumetopias jubatus in
Alaska: a review of the nutritional stress hypothesis. Mammal. Rev. 33: 3-28.
Trites, A.W., and Joy, R. 2005. Dietary analysis from fecal samples: how many scats are
enough? J. Mammal. 86: 704-712.
Varpe, Ø., Fiksen, Ø., and Slotte, A. 2005. Meta-ecosystem and biological energy transport from
ocean to coast: the ecological importance of herring migration. Oecologia 146: 443-451.
Williams, T.M., and Kooyman, G.L. 1985. Swimming performance and hydrodynamic
characteristics of harbor seals Phoca vitulina. Physiol. Zool. 58: 576-589.
Willson, M.F., and and Halupka, K.C. 1995. Anadromous fish as a keystone species in vertebrate
communities. Conserv. Biol. 9: 489-497.
Willson, M.F., and Womble, J.N. 2006. Vertebrate exploitation of pulsed marine prey: a review
and the example of spawning herring. Rev. Fish Biol. Fish. 16: 183-200.
Wolff, G. 1982. A beak key for eight eastern tropical Pacific cephalopod species with
relationships between beak dimensions and size. Fish. Bull. U.S. 80:357-370.
Womble, J.N., Willson, M.F., Sigler, M.F., Kelly, B.P., and VanBlaricom, G.R. 2005.
Distribution of Steller sea lions Eumetopias jubatus in relation to spring-spawning fish in
SE Alaska. Mar. Ecol. Prog. Ser. 294: 271-282.

53
Womble, J.N., and Sigler, M.F. 2006. Seasonal availability of abundant, energy-rich prey
influences the abundance and diet of a marine predator, the Steller sea lion Eumetopias
jubatus. Mar. Ecol. Prog. Ser. 325: 281-293.
Womble, J.N., Sigler, M.F., and and Willson, M.F. 2009. Linking seasonal distribution patterns
with prey availability in a central-place forager, the Steller sea lion. J. Biogeogr. 36: 439-
451.
Worton, B.J. 1995. Using monte carlo simulation to evaluate kernel-based home range
estimators. J. Wildl. Manag. 59: 794-800.
Yang, L.H. 2004. Periodical cicadas as resource pulses in North American forests. Science 306:
1565-1567.
Yang, L.H., Bastow, J.L., Spence, K.O., and and Wright, A.N. 2008. What can we learn from
resource pulses? Ecology 89: 621-634.
Yang, L.H., Edwards, K.F., Byrnes, E.J., Bastow, J.L., Wright, A.N., and and Spence, K.O.
2010. A meta-analysis of resource pulse-consumer interactions. Ecol. Monogr. 80: 125-
151.