Embed Size (px)
Citation preview

The behavior of aerogel blankets as insulation material in external walls at high temperatures
Master of Science Thesis in the Master’s Programme Structural Engineering and
Building Performance Design
OLAYA CIRUELA PÉREZ Department of Civil and Environmental Engineering Division of Building Technology
Building Physics CHALMERS UNIVERSITY OF TECHNOLOGY Göteborg, Sweden 2012 Master’s Thesis 2012:147


MASTER’S THESIS 2012:147
The behavior of aerogel blankets as insulation material in external walls at high temperatures
Master of Science Thesis in the Master’s Programme Structural Engineering and
Building Performance Design
OLAYA CIRUELA PÉREZ
Department of Civil and Environmental Engineering Division of Building Technology
Building Physics
CHALMERS UNIVERSITY OF TECHNOLOGY
Göteborg, Sweden 2012

The behavior of aerogel blankets as insulation material in external walls at high temperatures
Master of Science Thesis in the Master’s Programme Structural Engineering and
Building Performance Design
OLAYA CIRUELA PÉREZ
© OLAYA CIRUELA PÉREZ, 2012
Examensarbete / Institutionen för bygg- och miljöteknik, Chalmers tekniska högskola 2012:147 Department of Civil and Environmental Engineering Division of Building Technology Building PhysicsBuilding Physics Chalmers University of Technology SE-412 96 Göteborg Sweden Telephone: + 46 (0)31-772 1000 Chalmers Reproservice / Department of Civil and Environmental Engineering Göteborg, Sweden 2012

I
The behavior of aerogel blankets as insulation material in external walls at high temperatures
Master of Science Thesis in the Master’s Programme Structural Engineering and
Building Performance Design
OLAYA CIRUELA PÉREZ Department of Civil and Environmental Engineering Division of Building Technology Building Physics Chalmers University of Technology
ABSTRACT
The aerogel blanket is a new material that has very low thermal conductivity that makes the material a good candidate for insulating of walls. In fact, nowadays aerogel blankets are used to improve the energy performance of the existing walls.
Using aerogel blankets as insulation material in a wall means replacement of existing insulation material. When a material in a building component is replaced in order to improve a specific performance, it is important to verify the influence of the other functional requirement of the wall such as fire performance. The purpose of this study is to evaluate fire performance of a non-load bearing external wall insulated by aerogel blankets.
In order to achieve this aim, experiments and numerical simulations were carried out. First, two wall models using aerogel blankets as insulation materials were designed. The fire behavior of the designed walls was investigated and the models were modified according to the fire requirements. Finally, the moisture properties of the aerogel blanket were measured and compared to other common insulation materials.
The results indicated that although aerogel blankets thermal properties were excellent, its fire reaction was not so advantageous. However, if aerogel blankets are placed in a safe position of the wall, the thickness of the wall can be reduced. Because of this thickness reduction, using aerogel blankets as insulation material could be an interesting alternative wherever space is an important topic.
It is important to mention that in this project constant energy consumption was considered. Further studies are needed for evaluation of other functional requirements of the wall, e.g. heat and moisture transfer, fire resistance and acoustics.
Key words: Aerogel blankets, Non-bearing external wall, Insulation materials, Energy performance, Fire performance.

II
CHALMERS Civil and Environmental Engineering, Master’s Thesis 2012:147 III
Contents
ABSTRACT I
CONTENTS III
PREFACE V
NOTATIONS VI
1 INTRODUCTION 1
1.1 Aim 1
1.2 Method 1
1.3 Limitations 2
1.4 Short about aerogel based materials 2
1.4.1 Aerogel Blankets 3
2 WALL DESIGN BASED ON ENERGY PERFORMANCE 7
2.1 Determination of aerogel blankets thermal conductivity 7
2.2 Walls design 9
2.2.1 Wood based walls design 9
2.2.2 Concrete based walls design 11
2.3 Summary of first alternative results 12
3 FIRE PERFORMANCE 13
3.1 Literature study 13
3.1.1 Fire behavior in a room 14
3.1.2 Fire compartment division 14
3.1.3 European fire classification of materials, construction products and building elements. 15
3.2 Determination of aerogel blankets heat capacity 16
3.3 Determination of aerogel blankets fire reaction 17
3.3.1 Sample preparation 18
3.3.2 Tests 19
3.3.3 Results and comments 20
3.4 Simplifications 23
3.5 Numerical simulations 23
3.5.1 Preprocessing 23
3.5.1.1 Geometry 23
3.5.1.2 Material properties 25
3.5.1.3 Boundary conditions 34
3.5.2 Numerical simulations 34

CHALMERS, Civil and Environmental Engineering, Master’s Thesis 2012:147 IV
3.5.2.1 Steady-state and transient study of wood based wall 34
3.5.2.2 Gypsum board study 39
3.5.2.3 Wood based wall study 41
3.5.2.4 Concrete based wall study 44
3.6 Second alternative results 45
3.6.1 Wood based wall model 45
3.6.2 Concrete based wall model 46
3.6.3 Summary of second alternative results 48
4 MOISTURE PROPERTIES 49
4.1 Vapor permeability 49
4.2 Determination of aerogel blankets vapor permeability 50
4.2.1 Sample preparation 51
4.2.2 Tests 52
4.2.3 Results 53
5 DISCUSSION 54
6 CONCLUSIONS 59
7 REFERENCES 60
LIST OF FIGURES 64
LIST OF TABLES 66
APPENDIX A: HRR RESULTS 67
APPENDIX B: MASS LOSS RESULTS 69
APPENDIX C: BACK TEMPERATURE RESULTS 71

CHALMERS Civil and Environmental Engineering, Master’s Thesis 2012:147 V
Preface
In this work, experiments and numerical simulation were performed in order to evaluate the possibility of using aerogel blankets as insulation material in external walls at high temperatures. The study was made during February 2012 to September 2012 at the Department of Civil and Environmental Engineering, Building Physics, Chalmers University of Technology, Sweden. The experiments were done at Chalmers University of Technology and at Lund Technical University.
This project was carried out with Bijan Adl-Zarrabi as supervisor who advised me and guided me through my project. I am also thankful for the help from Patrick Van Hees and Marek Machowski during the experiments. Finally, I also would like to thank Aida Ciruela Pérez for her help in the writing of this report.
Göteborg October 2012
Olaya Ciruela Pérez

CHALMERS, Civil and Environmental Engineering, Master’s Thesis 2012:147 VI
Notations
Roman upper case letters
� Area [m2]
� Diffusivity of water vapor in air [m2/s]
� Heat flow rate [W]
� Thermal resistance [m2.K/W]
�� Relative Humidity [%]
� Temperature [K]
� Thermal transmittance [m2.K/W]
� Vapor resistance [m/s]
Roman lower case letters
Specific heat capacity [J/kg.K]
� Thickness [m]
� Steady-state moisture flux [kg/m2.s]
Mass [kg]
� Density of het flow rate [W/m2]
� Time [s]
� Air humidity by volume [kg/m3]
Greek lower case letters
�� Vapor permeability coefficient [m2/s]
� Thermal conductivity [W/m.K]
� µ-factor [-]
� Density [kg/m3]

CHALMERS, Civil and Environmental Engineering, Master’s Thesis 2012:147 1
1 Introduction
Among the environmental issues in today’s world, none is as present as the Greenhouse gases (GHGs) emissions. Greenhouse gases (GHGs) emissions present a big current issue in developed countries and in many nations. Leaders state their concern for reducing these emissions while discussing ambitious targets. For example, the EU has decided that 2020 emissions levels should be 20% lower than those emitted in 1990. The awareness of this issue continues to grow and, on this basis, an intense debate is underway studying technical and economic ways to achieve these objectives. One of the most cost-effective actions for greenhouse gas abatement is to improve the residential and commercial buildings insulation (McKinsey & Company, 2009). It is obvious that in order to have a better insulation in buildings, traditional insulation can be used in thicker or multiple layers. Nevertheless, new materials with better thermal properties, such as aerogels and vacuum insulated panels, are being investigated for buildings applications (Ruben Baetens, Bjørn Petter Jelle & Arild Gustavsen 2010).
In this project, the increasing importance of aerogel based materials as new building insulation materials was studied. Aerogel is not still a common material although it was discovered in early 1960s. However, since five years ago, the aerogel technologies have become more important in the global insulation market (M. Cagliardi 2009). Moreover by using aerogel based materials, thinner walls can be built with the same insulation capacity than by using the conventional insulation materials. This characteristic can be very useful in big cities where there are lots of buildings and the area allocated for each new construction building is limited, considering that it might allow rooms with bigger areas. Not only this increase of the living area makes the building more comfortable for the tenant, but it also represents an economic benefit for the owner.
Nonetheless, the change of wall materials can affect the behavior of the wall such as the fire performance.
1.1 Aim
The purpose of this study is to evaluate fire performance of a non-load bearing external wall insulated by aerogel blankets.
1.2 Method
First, a literature study was carried out in order to get information about the insulation capacity requirements of external walls considering the energy consumption. Taking into account this information, two external reference walls were designed by using steady-state heat transfer calculations. These reference designs were a reference wood based wall and a reference concrete based wall. For the calculations, the thermal conductivities of the wall insulation materials were required. This information was found by using Eurocode, manufacturers’ datasheets and scientific articles. However the thermal conductivity of aerogel blankets was measured.

CHALMERS2
The common insulation materialblankets, keeping the same
The second part of this projectwalls. A literature study ofthe reference designs weretransient heat transfer study and wall. For the simulations, twas necessary as well as capacity of the aerogel blanket were measured. Using the results of the numericalsimulations made it possibleof the wall and a second insulation capacity than the reference wall designs.
The study of the aerogel blanket material was completed with a comparison between the experimental vapor permeability of aerogel blankets and the vapor permeability of some common insulation materials.
Finally, a discussion took placewalls with the same insulation capacity by using aerogel blankets.
1.3 Limitations
This project focused in an external nondepartment in a multi-family house.was a wood based wall and the other a concrete based wall.
1.4 Short about aerogel based materials
Aerogels are dried gels with small pores and high porosity well known for their low densities and its material properties. They were invented sometime between 1929 and 1930 by Dr. Samuel Stephens Kistuntil 1950´s (Aerogel.org).
Silica aerogels are the most common type of aerogels and also the ones utilizbuilding applications.
A picture of a silica aerogels piece
Figure 1.1 Silica aerogels (Aspen Aerogels 2012)
CHALMERS, Civil and Environmental Engineering, Master’s Thesis
insulation materials of the reference designs were replaced with aerogel keeping the same thermal performance.
part of this project was the study of the fire behavior of the designed of some relevant concepts related with fire was done. Then,
reference designs were simulated using a finite element program sfer study and considering a fire in the inside part
s, the temperature dependency of the wall material properties as well as their fire reaction. The reaction to fire and specific heat aerogel blanket were measured. Using the results of the numerical
made it possible to find out the temperature distribution over cross section second alternative model for having thinner wallsthan the reference wall designs.
The study of the aerogel blanket material was completed with a comparison between the experimental vapor permeability of aerogel blankets and the vapor permeability of some common insulation materials.
took place in order to find a final solution for having thinner walls with the same insulation capacity by using aerogel blankets.
ject focused in an external non-load bearing wall which was a part of a fire amily house. But only two types of walls were studied, one
was a wood based wall and the other a concrete based wall.
Short about aerogel based materials
with small pores and high porosity well known for their low s material properties. They were invented sometime between 1929 and
1930 by Dr. Samuel Stephens Kistler but its first commercialization until 1950´s (Aerogel.org).
the most common type of aerogels and also the ones utiliz
picture of a silica aerogels piece is shown in Figure 1.1.
Silica aerogels (Aspen Aerogels 2012).
, Master’s Thesis 2012:147
replaced with aerogel
fire behavior of the designed was done. Then,
program based on a of the external
he temperature dependency of the wall material properties The reaction to fire and specific heat
aerogel blanket were measured. Using the results of the numerical distribution over cross section
s with the same
The study of the aerogel blanket material was completed with a comparison between the experimental vapor permeability of aerogel blankets and the vapor permeability of
in order to find a final solution for having thinner
load bearing wall which was a part of a fire But only two types of walls were studied, one
with small pores and high porosity well known for their low s material properties. They were invented sometime between 1929 and
did not happen
the most common type of aerogels and also the ones utilized in

CHALMERS, Civil and Environmental Engineering, Master’s Thesis 2012:147 3
Synthesis
The synthesis of aerogels, and particularly the synthesis of silica areogels, consists in three general steps. Firstly, the gel is prepared by using a sol-gel process in which the solid components of the gel are spread in a dissolvent liquid and after some chemical reactions the mixture reaches the gel point. The second step is the ageing process where the gel becomes stiffer and stronger. Finally, the drying process takes place and it is the most critical step. In contrast to xerogels, on which the wet gels are normally dried by evaporation, aerogels are normally dried by supercritical drying. Through the use of this drying method, where the liquid inside the pores is removed above both the critical temperature and pressure to avoid capillary tension which can produce the facture of the pores, the dried samples have the same porous texture as the wet state. (Ruben Baetens, Bjørn Petter Jelle & Arild Gustavsen 2010).
Solid properties
Silica aerogels have a cross-linked internal structure of SiO2 chains with a large number of small air-filled pores whose size is around 5-70mm (Ruben Baetens, Bjørn Petter Jelle & Arild Gustavsen 2010). Since this structure, where the 95-97% is air, this material has remarkable physical, thermal, optical and acoustic properties very attractive for building applications.
The high porosity of silica aerogels makes this material the lightest solid material known at the moment. Furthermore, silica aerogels are transparent; it makes them very attractive for window insulation. Finally, it has been found that granular aerogels are exceptional reflectors of audible sound (Ruben Baetens, Bjørn Petter Jelle & Arild Gustavsen 2010).
The most important property for this project is its low thermal conductivity. The combination of small pores and a small fraction of solid silica cause this low value of thermal conductivity. Moreover, by adding some kind of opacifying agent, the radioactive conduction in the aerogels can be reduced decreasing even more its thermal conductivity (Axel Berge & Pär Johansson 2012). This makes aerogels to be considered one of the possible new materials for thermal insulation in building.
As a negative aspect, aerogels are also a very fragile material because of its structure. Fortunately, this problem can be solved by incorporating it in a fibrous matrix. They are known as aerogels blankets (Ruben Baetens, Bjørn Petter Jelle & Arild Gustavsen 2010).
1.4.1 Aerogel Blankets
The aerogel blankets are textile-like blankets as the Figure 1.2 shows. This product should be prepared adding fibers or a fibrous matrix to the pre-gel mixture which contains gel precursors, then the gel can be dried (Ruben Baetens, Bjørn Petter Jelle & Arild Gustavsen 2010).
An aerogel blankets picture is shown in Figure 1.2.

CHALMERS4
Figure 1.2 Aerogel blanket (Aspen A
Health and safety
On account of aerogels blankets are97% of particles larger than 45production. Some healthy institutes; such as the InternationCancer (IARC), the Organization for Economic Co(OECD) and the Occupational Safety and Health Administration (OSHA); having studied the amorphous silica particles, claim that these particlesfor the human health. Whereas, the typical breathable dust rate for most of the commercial aerogel insulation products is 5mg/msilica established by OSHA is 80 mg/m
The personal protective eqconsists of a P100 respiratorrecommendations are only inhalation or dermal risk. Bproduce a sensation of dryness to skin and irritation to(Aspen Aerogels 2012).
Environmental impact
Aerogel blankets are fully recyclable and they have been rated as Silver in Cradle CradleSM certification from McDonough Braungart Design Chemistry. certification process examines a product’s manufacturing and impact in order to know if the product’s wastes are entirely eliminated with a healthy and sustainable society
Furthermore, Aerogels blankets have ZERO Ozone Depleting Potential (ODP) which means the relative amount of degradation that a chemical compound can cause to the ozone layer. And making referenmentioning that this product has a Global Warming Potential (GWP) less than 5 (Aspen Aerogels 2012).
Continuing with the environmental restrictions, this insulation material is fully compliant with the regulachemicals (REACH). And the substances restricted by the Substances Directive (RoHSconcentration is higher than the limits stated.
CHALMERS, Civil and Environmental Engineering, Master’s Thesis
Aerogel blanket (Aspen Aerogels 2012).
erogels blankets are made by amorphous (non-crystalline) silica with 97% of particles larger than 45µm, aerogel insulation sheets suffer from dust
Some healthy institutes; such as the International Agency for Research on Organization for Economic Co-operation and Development
and the Occupational Safety and Health Administration (OSHA); having studied the amorphous silica particles, claim that these particlesfor the human health. Whereas, the typical breathable dust rate for most of the commercial aerogel insulation products is 5mg/m3, while the limit for amorphous silica established by OSHA is 80 mg/m3. (Aspen Aerogels 2012).
The personal protective equipment (PPE) suggested by Aspen Aerogels Company consists of a P100 respirator, work gloves and safety glasses. However, these
only from comfort and convenience, not because there isinhalation or dermal risk. But it is true that the contact with these particles can produce a sensation of dryness to skin and irritation to eyes, skin and respiratory tracts
Aerogel blankets are fully recyclable and they have been rated as Silver in Cradle certification from McDonough Braungart Design Chemistry.
certification process examines a product’s manufacturing and as well asimpact in order to know if the product’s wastes are entirely eliminated
a healthy and sustainable society (Cabot Corporation 2011).
Furthermore, Aerogels blankets have ZERO Ozone Depleting Potential (ODP) which the relative amount of degradation that a chemical compound can cause to the
nd making reference to the greenhouse gas emissions, this product has a Global Warming Potential (GWP) less than 5
Continuing with the environmental restrictions, this insulation material is fully compliant with the regulation, evaluation, authorization and the restriction of chemicals (REACH). And the substances restricted by the Restriction of Hazardous
RoHS) are not contained in the finish product when concentration is higher than the limits stated.
, Master’s Thesis 2012:147
crystalline) silica with m, aerogel insulation sheets suffer from dust
al Agency for Research on operation and Development
and the Occupational Safety and Health Administration (OSHA); after having studied the amorphous silica particles, claim that these particles are not toxic for the human health. Whereas, the typical breathable dust rate for most of the
, while the limit for amorphous
uipment (PPE) suggested by Aspen Aerogels Company However, these
not because there is eye, the contact with these particles can
, skin and respiratory tracts
Aerogel blankets are fully recyclable and they have been rated as Silver in Cradle to certification from McDonough Braungart Design Chemistry. This strict
as well as its ecological impact in order to know if the product’s wastes are entirely eliminated in agreement
Furthermore, Aerogels blankets have ZERO Ozone Depleting Potential (ODP) which the relative amount of degradation that a chemical compound can cause to the
ce to the greenhouse gas emissions, it is worth this product has a Global Warming Potential (GWP) less than 5
Continuing with the environmental restrictions, this insulation material is fully tion, evaluation, authorization and the restriction of
Restriction of Hazardous ) are not contained in the finish product when

CHALMERS, Civil and Environmental Engineering, Master’s Thesis 2012:147 5
Applications
Aerogel blankets have different applications in many fields. Some examples are presented below (Aspen Aerogels 2012):
- Aerospace & Military - Building & Construction - Clothing & footwear - Industrials Plants - LNG & Cryogenics, which is the production of materials at very low temperature
- Subsea Pipelines
Aerogel blankets are an innovated alternative to traditional insulation materials in Building and Construction applications. Even though, its cost is still high in the building industry.
Some examples of aerogel blankets Building & Construction applications are presented below (Aspen Aerogels 2012):
- Roof insulation - Floor & Balcony insulation - External insulation - Internal insulation - Heat Bridge Treatments, e.g. located on the ledges of the windows - Services, e.g. pipe insulation
One manufacturer that develops this product is Aspen Aerogels (INC.), in which the aerogel blanket product used for wall insulation is named Spaceloft®. They use Spaceloft® to improve the insulation capacity of existing walls. Although the blankets of 10 mm of thickness are currently available, it is also possible to have them in higher thickness or apply it in several layers. Aspen Aerogels (INC.) was consulted in order to discover when the material should be applied to the walls.
In external insulation, the Spaceloft® layer or layers are directly applied to the existing wall using mechanical and/or adhesive to attach the blanket to the wall (Aspen Aerogels 2012).
Some examples of external insulation are shown in Figure 1.3. A mechanical fixing example is shown in Figure 1.4.

CHALMERS6
Figure 1.3 External insulation (Aspen Aerogels 2012)
Figure 1.4 Mechanical fix of aerogel blankets i
2012).
When external insulation is not possible the external façade belonSpaceloft® is applied to the existing wall usicontact and avoiding any air layer between which could affect the thermal performance of the
By using Spaceloft®, which is the thinnest material avais possible to preserve living space in small areas improving the UThis product is easy to transport, to fix and it does not need a specific maintenance. Moreover, the indoor air quality is maintained
CHALMERS, Civil and Environmental Engineering, Master’s Thesis
xternal insulation (Aspen Aerogels 2012).
echanical fix of aerogel blankets in external insulation (Aspen Aerogels
hen external insulation is not possible because of a complicated facade system or the external façade belongs to a heritage, the wall can be insulated internally.
to the existing wall using standard plaster to guaranty the full any air layer between aerogel blankets and the existing wallthermal performance of the wall (Aspen Aerogels 2012).
, which is the thinnest material available for internal insulation,is possible to preserve living space in small areas improving the U-value of the wall. This product is easy to transport, to fix and it does not need a specific maintenance. Moreover, the indoor air quality is maintained (Aspen Aerogels 2012).
, Master’s Thesis 2012:147
n external insulation (Aspen Aerogels
a complicated facade system or gs to a heritage, the wall can be insulated internally.
ng standard plaster to guaranty the full aerogel blankets and the existing wall
(Aspen Aerogels 2012).
ilable for internal insulation, it value of the wall.
This product is easy to transport, to fix and it does not need a specific maintenance. (Aspen Aerogels 2012).

CHALMERS, Civil and Environmental Engineering, Master’s Thesis 2012:147 7
2 Wall design based on energy performance
During the design of the project walls, it was aimed to ensure a good thermal insulation. Thus, it was established a constant value of the thermal transmittance (U-value) of the designed walls. In the concrete based walls, the U-value was remained constant at 0.2W/m2.K. This number is based on a Post-Kyoto target of 85% CO2-emissions-saving for the building stock (Eurima 2007). In the wood based walls, the U-value was remained constant at 0.17W/m2.K because it was prioritized the common studs used in wood houses which are 45x45mm plus 45x145mm.
The two reference walls, wood based reference wall and concrete based reference wall, were designed by steady-state heat transfer calculations. Furthermore, the insulation material of the reference walls were replaced with aerogel blankets keeping the same thermal performance resulting in the first alternative walls, i.e. first alternative wood based wall and first alternative concrete based wall.
In the wall design, the thermal conductivities of the wall insulation materials were required.
2.1 Determination of aerogel blankets thermal
conductivity
Thermal conductivity (λ) of aerogel blankets was determinate by the Heat flow meter method. The test equipment follows the procedure described in EN 12667 which is the Standard Test Method for Steady-State Thermal Transmission Properties by Means of the Heat Flow Meter Apparatus (LambdaLab LLC).
A picture of the instrument used in this experiment is presented in Figure 2.1.
Figure 2.1: Holometrix Rapid-k apparatus, Chalmers University of Technology.
The heat flow meter method is based on establishing a steady state one-dimensional heat flux through a test specimen. A sample is placed between two parallel plates whose temperatures are constant, hot and cold plate. For example, if the hot plate temperature is 300C and the cold plate temperature is 100C, the mean temperature in the test specimen will be the average of the other two and it is said that the measured
CHALMERS, Civil and Environmental Engineering, Master’s Thesis 2012:147 8
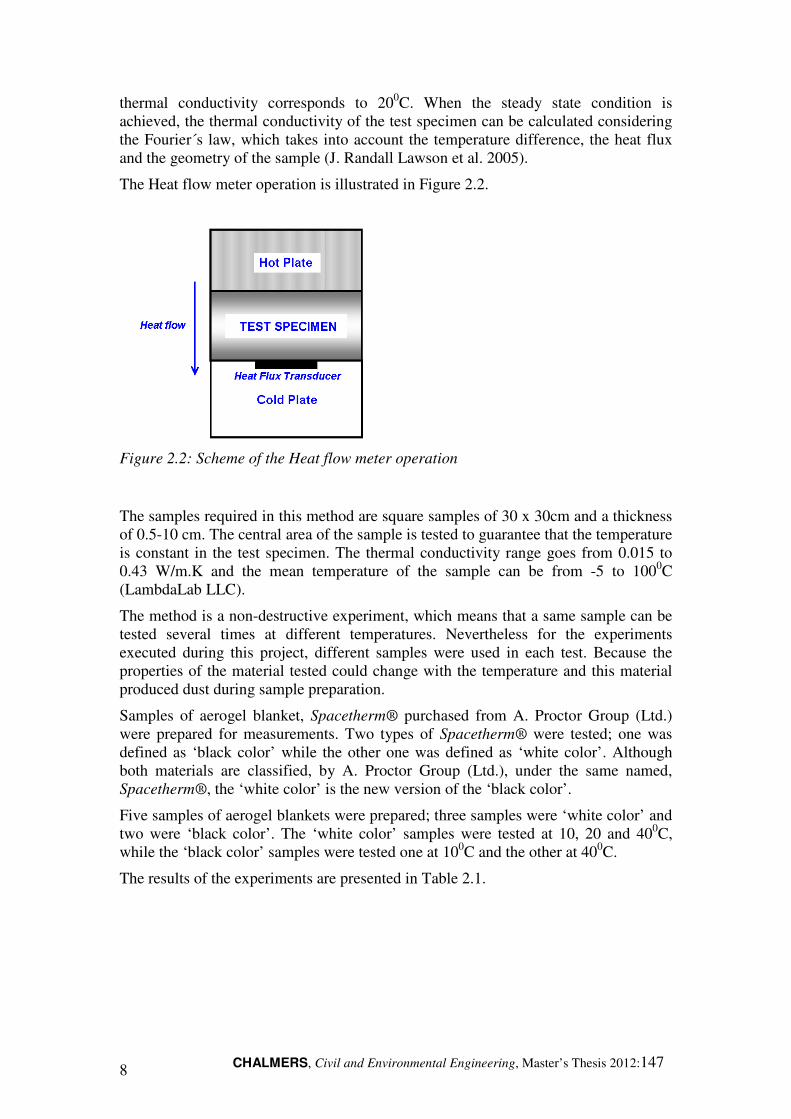
thermal conductivity corresponds to 200C. When the steady state condition is achieved, the thermal conductivity of the test specimen can be calculated considering the Fourier´s law, which takes into account the temperature difference, the heat flux and the geometry of the sample (J. Randall Lawson et al. 2005).
The Heat flow meter operation is illustrated in Figure 2.2.
Figure 2.2: Scheme of the Heat flow meter operation
The samples required in this method are square samples of 30 x 30cm and a thickness of 0.5-10 cm. The central area of the sample is tested to guarantee that the temperature is constant in the test specimen. The thermal conductivity range goes from 0.015 to 0.43 W/m.K and the mean temperature of the sample can be from -5 to 1000C (LambdaLab LLC).
The method is a non-destructive experiment, which means that a same sample can be tested several times at different temperatures. Nevertheless for the experiments executed during this project, different samples were used in each test. Because the properties of the material tested could change with the temperature and this material produced dust during sample preparation.
Samples of aerogel blanket, Spacetherm® purchased from A. Proctor Group (Ltd.) were prepared for measurements. Two types of Spacetherm® were tested; one was defined as ‘black color’ while the other one was defined as ‘white color’. Although both materials are classified, by A. Proctor Group (Ltd.), under the same named, Spacetherm®, the ‘white color’ is the new version of the ‘black color’.
Five samples of aerogel blankets were prepared; three samples were ‘white color’ and two were ‘black color’. The ‘white color’ samples were tested at 10, 20 and 400C, while the ‘black color’ samples were tested one at 100C and the other at 400C.
The results of the experiments are presented in Table 2.1.
CHALMERS, Civil and Environmental Engineering, Master’s Thesis 2012:147 9
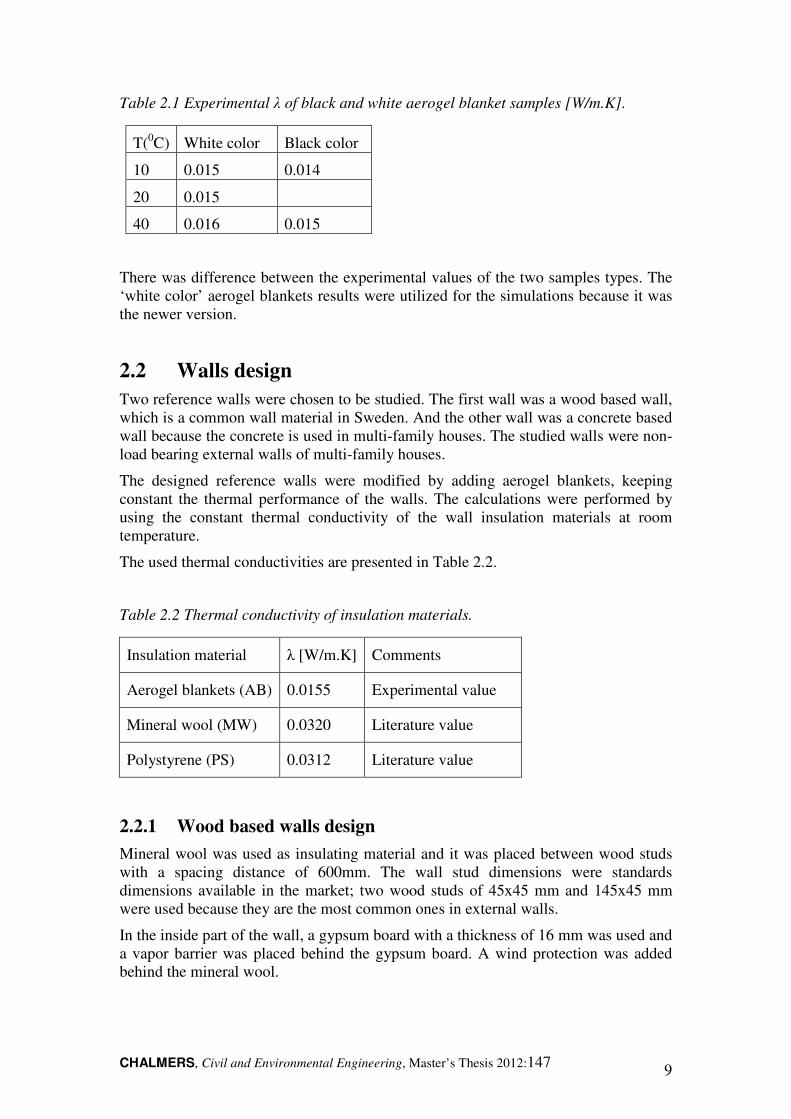
Table 2.1 Experimental λ of black and white aerogel blanket samples [W/m.K].
T(0C) White color Black color
10 0.015 0.014
20 0.015
40 0.016 0.015
There was difference between the experimental values of the two samples types. The ‘white color’ aerogel blankets results were utilized for the simulations because it was the newer version.
2.2 Walls design
Two reference walls were chosen to be studied. The first wall was a wood based wall, which is a common wall material in Sweden. And the other wall was a concrete based wall because the concrete is used in multi-family houses. The studied walls were non-load bearing external walls of multi-family houses.
The designed reference walls were modified by adding aerogel blankets, keeping constant the thermal performance of the walls. The calculations were performed by using the constant thermal conductivity of the wall insulation materials at room temperature.
The used thermal conductivities are presented in Table 2.2.
Table 2.2 Thermal conductivity of insulation materials.
Insulation material λ [W/m.K] Comments
Aerogel blankets (AB) 0.0155 Experimental value
Mineral wool (MW) 0.0320 Literature value
Polystyrene (PS) 0.0312 Literature value
2.2.1 Wood based walls design
Mineral wool was used as insulating material and it was placed between wood studs with a spacing distance of 600mm. The wall stud dimensions were standards dimensions available in the market; two wood studs of 45x45 mm and 145x45 mm were used because they are the most common ones in external walls.
In the inside part of the wall, a gypsum board with a thickness of 16 mm was used and a vapor barrier was placed behind the gypsum board. A wind protection was added behind the mineral wool.

CHALMERS, Civil and Environmental Engineering, Master’s Thesis 2012:147 10
In the outside part of the wall, wood external cladding, which is very common in wood houses, was used. There exist two different types of wood cladding: vertical panels and horizontal panels (Carl Michael Johannesson 1992). In the façade system, the wood horizontal cladding panels (22mm thickness) were fixed onto nail studs (34x45mm) which were fixed over the timber frame leaving a well-ventilated cavity between them (Svenskt Trä).
The structure of the reference wood based wall is shown in Figure 2.3.
600
45
145
34
45
nail studs
wood horizontal panels
air gap
mineral wool
gypsum board
wood studs
OUTSIDE
INSIDE
wind protection
vapor barrier
22
16
Figure 2.3 Reference wood based wall, units in mm.
Reference wood based wall (WBW_R)
The wood studs used were 45x45 and 45x145mm which means that the thickness of mineral wool should be 190mm. The thermal resistance (R-value) and the thermal transmittance (U-value) of the wall were calculated as:
����_� � ������
� �. !��.�"# � 5.94 (
) *� (2.1)
����_� � ��+�_+
� 0.17 �() * (2.2)
Where
RWRW_R Thermal resistance of the reference wood based wall (m2.K/W) UWRW_R Thermal transmittance of the reference wood based wall (W/m2.K) dMW Thickness of mineral wool (m) λMW Thermal conductivity of mineral wool (W/m.K)
First alternative wood based wall (WBW_1)
In this model, all the mineral wool was replaced with aerogel blankets and the thermal performance of the wall was kept constant. The aerogel blankets thickness of this model was calculated by Equations 2.3 and 2.4.

CHALMERS, Civil and Environmental Engineering, Master’s Thesis 2012:147 11
��/�_ � ��/�_� � 5.94 () *� (2.3)
��/�_ � �01�01
� �01�.� 22 � 5.94 (
) *� � �3/ � 0.092 (2.4)
Where
RWRW_1 Thermal resistance of the first alternative wood based wall (m2.K/W) dAB Thickness of aerogel blankets (m) λAB Thermal conductivity of aerogel blankets (W/m.K)
2.2.2 Concrete based walls design
The thickness of concrete in a non-load bearing wall can vary from 100 to 200 mm, depending on the sound insulation (Cement Concrete & Aggregates Australia 2009). The thickness of the concrete in the designed wall was 150mm.
Polystyrene was used as insulation material and its thickness had be 156mm to achieve the U-value of 0.20 W/m2.K. The insulation material was mechanically fastened to the wall using a galvanized expanded metal lath and concrete screws with washer (National Concrete Masonry Association 2010). As this wall was external insulated using polystyrene, a vapor barrier was not required
In the outside part of the wall, plaster was applied in a layer of 3 mm and because there was not air gap a wind protection was not needed.
The structure of the reference concrete based wall is shown in Figure 2.4.
156
150
OUTSIDE
INSIDE
plaster
polystyrene
concrete
3
Figure 2.4 Reference concrete based wall, units in mm.
Reference concrete based wall (WBW_R)
The U-value was fixed at 0.20 W/m2.K which means that the R-value and the thickness of the polystyrene were calculated using Equations 2-5 and 2.6.
�5/�_� � 671�_+
� 5.0 �() * (2.5)
�5/�_� � �89�89
� �89�.�" # � 5.0 (
) *� � �:; � 0.156 (2.6)

CHALMERS, Civil and Environmental Engineering, Master’s Thesis 2012:147 12
Where
RCRW_R Thermal resistance of the reference concrete based wall (m2.K/W) UCRW_R Thermal transmittance of the reference concrete based wall (W/m2.K) dPS Thickness of polystyrene (m) λPS Thermal conductivity of polystyrene (W/m.K)
First alternative concrete based wall (CBW_1)
In this wall, all the polystyrene was replaced with aerogel blankets and the thermal performance of the wall was kept constant. The aerogel blankets thickness of this wall was calculated by using Equations 2.7 and 2.8.
�5/�_ � �5/�_� � 5.0() *� (2.7)
�5/�_ � �01�01
� �01�.� 22 � 5.0 (
) *� � �3/ � 0.078 (2.8)
Where
RCRW_1 Thermal resistance of the first alternative concrete based wall (m2.K/W) dAB Thickness of aerogel blankets (m) λAB Thermal conductivity of aerogel blankets (W/m.K)
2.3 Summary of first alternative results
The thicknesses (d) of the reference walls and the first alternative walls by replacing all the common insulation material with aerogel blankets are summarized in Table 2.3.
Table 2.3 Reference walls and first walls thicknesses
wall d [mm] insulation d [mm] U-value [W/m2.K] ∆d [mm] ∆d [%]
WBW_R 262 190 (MW) 0.17
WBW_1 164 92 (AB) 0.17 98 37%
CBW_R 309 156 (PS) 0.20
CBW_1 231 78 (AB) 0.20 78 25%
Considering the energy performance, the wood based wall thickness was reduced 37% while the concrete based wall thickness was reduced 25%.

CHALMERS, Civil and Environmental Engineering, Master’s Thesis 2012:147 13
3 Fire performance
Fire safety in buildings requires numerical simulations and fire tests which are expensive. For example, in this study, the wall should be built and tested. The fire safety study in this project was based on numerical simulations.
Before starting the fire performance analysis of the reference wall models, a literature study about concepts related to fire was carried out. The fire behavior was studied and as well as the fire compartment idea due to the fact that the external wall studied was part of a fire department in a multi-family house. The European fire classification of materials, construction products and building elements was also investigated.
To control the fire performance of the reference walls, some simplifications were performed in the wall structure in order to create a simulation models. The simplified models were analyzed using a finite element (FEM) program named COMSOL Multiphysics®. A time dependent heat transfer procedures were used by using boundary conditions described in to Eurocode (EN 1991-1-2:2002). For these simulations, the temperature dependency of the wall material properties was required as well as the fire reaction of the wall materials. The materials properties needed for the FEM simulations were the density (ρ), the thermal conductivity (λ), the heat capacity (cp) and the fire reaction. Moreover, in the aerogel blanket case, experiments were performed to determinate its properties. The thermal conductivity of the aerogel blanket was found using the Heat flow meter method, this experiment is explained in chapter Wall design based on energy performance in the subchapter Determination of
thermal conductivity, and its heat capacity was determined by using the Transient Plan Source (TPS) method. To know the aerogel blankets fire reaction samples of aerogel blankets were tested using the Cone Calorimeter method because there is not much information about this new material
The simulations performed were: first, a steady state-transient study was done in order to know if the simulation models were correct. Furthermore, a gypsum board study was carried out to investigate when the gypsum board collapses from the reference wood based wall model. Finally, the reference wood and concrete based wall models were simulated in order to determine the temperature distribution over cross section of the wall after one hour of fire exposure.
Using the results of the simulations, a second alternative wall models for having thinner walls with the same insulation capacity than the reference wall models was designed. The second alternative wall models were named second alternative wood based wall model and second alternative concrete based wall model.
3.1 Literature study
Some relevant concepts for the study and related with fire were investigated before the simulations.

CHALMERS, Civil and Environmental Engineering, Master’s Thesis 2012:147 14
3.1.1 Fire behavior in a room
Fire is an uncontrolled chemical reaction that produces both light and the energy enough to damage the human skin (James G. Quintiere 1998). This uncontrolled chemical reaction has a particular thermal behavior which is explained bellow. First of all, it is necessary that the fire starts. This first process is known as ‘fire ignition’. After this, the fire grows until the flashover point, which is an event that can occur at temperatures of 500 to 600 0C. The next step is the full development which is a state of a compartment fire where the flames fill the room and the fire consumes all the combustible. Finally the fire decay takes place (University of South Carolina).
The fire thermal behavior is illustrated in Figure 3.1.
Figure 3.1 Fire grow curve.
3.1.2 Fire compartment division
A fire compartment is a space within building which is enclosed by separation elements that prevent the fire from spreading beyond the compartment during the relevant fire exposure (EN 1991-1-2:2002).
Buildings should be divided into fire compartment so as to both restrict the consequences of fire and ensure sufficient time for evacuation. For small buildings where the consequences of fire are small, such as single-family houses, fire compartments are not needed (BFS 2011:26-5:5).
Buildings classes
Buildings fire protection has difference levels (BFS 2011:26-5:2):
Br0 Very high protection Br1 High protection Br2 Moderate protection Br3 Low protection

CHALMERS, Civil and Environmental Engineering, Master’s Thesis 2012:147 15
Buildings with three of more stories should be designed in building class Br1; this is the case of multifamily houses. However, single-family houses with up to three stories can be designed at class Br2.
The studied wall was a part of a multi-family house, which is classified as class Br1.
3.1.3 European fire classification of materials, construction
products and building elements.
Building materials and components should to be tested and classified by the European system in terms of their fire resistant and reaction to fire.
Fire resistance is the ability of a structure, a part of a structure or a member to resist fire for a specified period of time (EN 1991-1-2:2002).
The fire resistance of building components and construction are classified in different fire requirements. These requirements are the following:
R Load bearing capacity E Integrity I Insulation W Radiation M Mechanical resistance C Self closure S Smoke leakage K Fire protection (coverings)
The fire resistance classification is followed by the time limit registered in minutes 15, 30, 45, 60, 90, 120, 180, 240 or 360. This number shows the time which the component should withstand when it is exposed to fire (SP Technical Research Institute of Sweden).
The walls studied were a separating non-load bearing elements of a fire compartment in a building class Br1. This implicates that the walls should be EI60 which means that the surface temperature of unexposed side of the wall should not exceed 1600C during first 60 minutes (I-Insulation). Furthermore, no smoke and no fire gases should go through the wall (E-Integrity).
The reaction to fire of construction products classification is performed in accordance to the Euroclass system which divides the surface coverings fire reaction into seven main classes (SP Technical Research Institute of Sweden) (Björn Sundström 2007):
A1 Non-combustible material A2 Limited combustible material B Combustible material; no flashover C Combustible material; no flashover for 100kW- flashover for 300kW ignition source
D Combustible material; flashover after more than 2min for 100kW ignition source E Combustible material; flashover before 2min for 100kW ignition source F Without identifying
CHALMERS, Civil and Environmental Engineering, Master’s Thesis 2012:147 16
The fire reaction classes have the sub index FL when they refer to floors classification.
This fire reaction classification is complemented with the smoke class and the burning droplets class:
s1, s2, s3 From less to more smoke emissions d0, d1, d2 From less to more burning droplets
The fire properties of the building materials can be measured by several methods. One example is Cone Calorimeter method.
3.2 Determination of aerogel blankets heat capacity
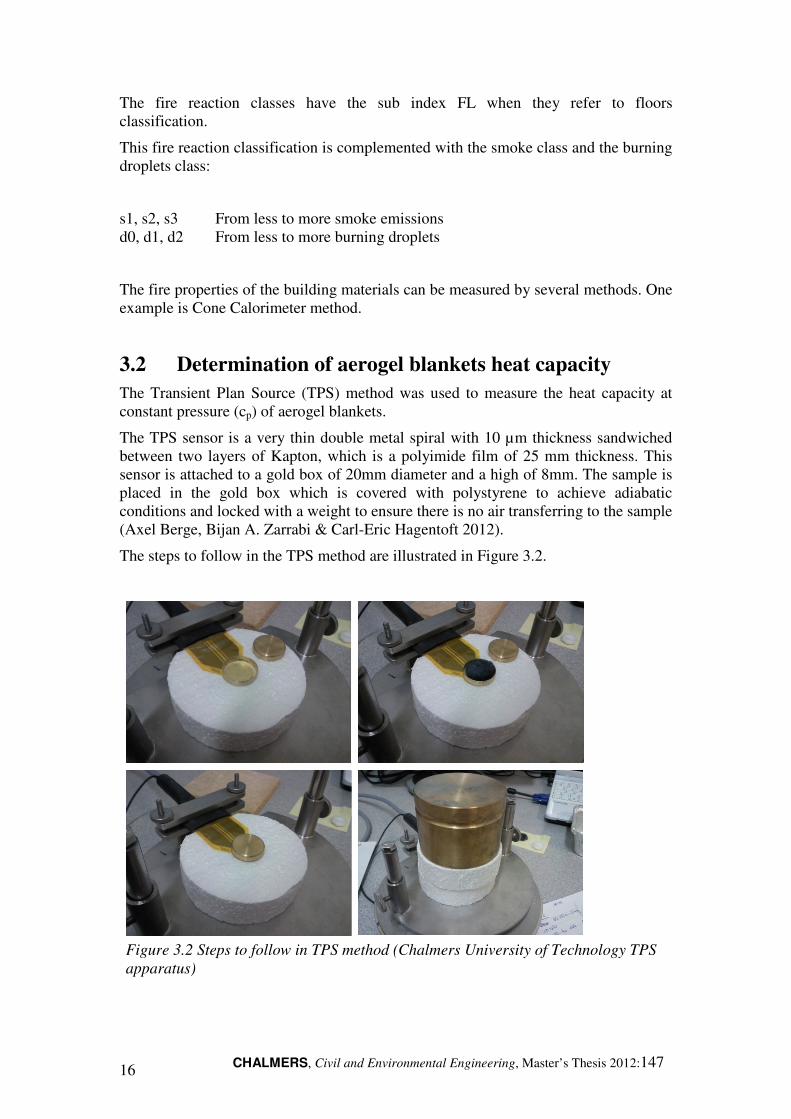
The Transient Plan Source (TPS) method was used to measure the heat capacity at constant pressure (cp) of aerogel blankets.
The TPS sensor is a very thin double metal spiral with 10 µm thickness sandwiched between two layers of Kapton, which is a polyimide film of 25 mm thickness. This sensor is attached to a gold box of 20mm diameter and a high of 8mm. The sample is placed in the gold box which is covered with polystyrene to achieve adiabatic conditions and locked with a weight to ensure there is no air transferring to the sample (Axel Berge, Bijan A. Zarrabi & Carl-Eric Hagentoft 2012).
The steps to follow in the TPS method are illustrated in Figure 3.2.
Figure 3.2 Steps to follow in TPS method (Chalmers University of Technology TPS
apparatus)

CHALMERS, Civil and Environmental Engineering, Master’s Thesis 2012:147 17
A constant power is applied and the temperature increase of the sensor is recorded during a specific time. With this information and the sample weight, it is possible to calculate the specific heat capacity of the solid samples at atmospheric pressure and at the room temperature where the experiment takes place by the Hot Disk Thermal Constant Analyzer Software. In order to make these calculations, a reference measurement with the gold box empty should be performed (Hot Disk Inc. 2007).
The material tested was the aerogel blanket type Spacetherm® ‘white’ from A. Proctor Group (LTD.). And the mean value was used as input data in simulations at 230C.
The results of the measurements are presented in Table 3.1.
Table 3.1 Experimental Cp of aerogel blanket samples at 230C
Sample cp [J/kg.K]
white_1 934
white_2 928
mean value 931
The mean value was close to the ones presented by Aspen Aerogel (INC.) at 230C which was 949 J/kg.K. Linear interpolation was used between 864 J/kg.K at 00C and 1000 J/kg.K at 40 0C.
3.3 Determination of aerogel blankets fire reaction
To study the aerogel blanket fire reaction, experiments were performed using Cone Calorimeter method at Lund University facilities.
The Cone Calorimeter method needs a test specimen with an area of 100mm x 100mm. The sample is exposed to a constant radiant heat flux adjusted from 10 to 100kW/m2. The effluents from the test are collected and transported through a duct where there is a thermocouple, a pressure sensor and a smoke measurement system. Furthermore, the test specimen is positioned on a load cell and the mass loss of the sample can be recorded during the test. The test results are heat release rate (calculated using oxygen consumption technique), time to ignition, smoke production and weight loss. (Patrick van Hees et al. 2010)
The test equipment is shown in Figure 3.3.

CHALMERS18
Figure 3.3 Cone Calorimeter apparatus, Lund University.
The Cone Calorimeter results behavior. Furthermore, a thermocouple was added in the samples to know the temperature variation in that part.
3.3.1 Sample preparation
The material utilized for this experiment wasfrom A. Proctor Group (LTD.)‘black’ and the other ‘white’. Although both materials were classifiedmanufacturer under the same, ‘black’.
In total, ten samples of 10 mm of thickness were prepared and tested. Six were ‘whiteand four were ‘black’.
In order to contain all possible burning products the samples should be aluminum paper, see Figure holder with four centimeters of ceramic similar to mineral wool with better thermal propertiesduring the test and to avoid problems with boundary cond
Figure 3.4 Aerogel blanket samples with
CHALMERS, Civil and Environmental Engineering, Master’s Thesis
Cone Calorimeter apparatus, Lund University.
Cone Calorimeter results were used for studying the aerogel blankets fire Furthermore, a thermocouple was added in the backside of some of the
samples to know the temperature variation in that part.
Sample preparation
terial utilized for this experiment was the aerogel blanket type Group (LTD.). Two types of samples were tested; one was
‘black’ and the other ‘white’. Although both materials were classifiedmanufacturer under the same, Spacetherm®, the ‘white’ was a new version of the
In total, ten samples of 10 mm of thickness were prepared and tested. Six were ‘white
contain all possible burning products the samples should be igure 3.4. Furthermore, the samples were placed in a sample
holder with four centimeters of ceramic wool; see Figure 3.5, which is a material similar to mineral wool with better thermal properties, to have adiabatic conditions
avoid problems with boundary conditions.
Aerogel blanket samples with aluminum paper.
, Master’s Thesis 2012:147
aerogel blankets fire backside of some of the
the aerogel blanket type Spacetherm® tested; one was named
‘black’ and the other ‘white’. Although both materials were classified by the ’ was a new version of the
In total, ten samples of 10 mm of thickness were prepared and tested. Six were ‘white’
contain all possible burning products the samples should be covered with , the samples were placed in a sample
ich is a material have adiabatic conditions

CHALMERS, Civil and Environmenta
Figure 3.5 Sample holder with ceramic wool
3.3.2 Tests
The radiant heat flux can be adjusted from 10 to 100kW/mconvection was negligible in comparison with the radiatthe constant radiation corresponded to heat flow by just radiation. was equivalent to a specific distance from the fire origin and also to a specific intensity of the fire. For example, 25kW/mfrom a hot gas layer in a room close to flashover. high value e.g. sun radiation is around
The relation between the cone radiation and the temperature is presente3.6. This relation is based on the Boltzmann law which between cone and sample, emissivity and surface temperature. temperature and a distance energy.
Figure 3.6 Radiation versus cone temperature.
Furthermore, in order to have an idea of theinsulation, in some tests a thermocouple in the backside of the sample thermocouples were located between the sample backside and the aluminum paper.
Civil and Environmental Engineering, Master’s Thesis 2012:147
Sample holder with ceramic wool.
The radiant heat flux can be adjusted from 10 to 100kW/m2. In these experiments the convection was negligible in comparison with the radiation, it was about 10%the constant radiation corresponded to heat flow by just radiation. Each radiation
a specific distance from the fire origin and also to a specific intensity of the fire. For example, 25kW/m2 can be considered as the flux radiation from a hot gas layer in a room close to flashover. This radiation can be considered a high value e.g. sun radiation is around 1.4kW/m2 (Robert Rosner 1996).
The relation between the cone radiation and the temperature is presente. This relation is based on the Boltzmann law which considers the view factor
between cone and sample, emissivity and surface temperature. The idea is that a distance between cone and sample represent radioactive
Radiation versus cone temperature.
Furthermore, in order to have an idea of the aerogel blanket empirical thermal insulation, in some tests a thermocouple in the backside of the sample was added. The thermocouples were located between the sample backside and the aluminum paper.
19
. In these experiments the ion, it was about 10%. Thus,
Each radiation level a specific distance from the fire origin and also to a specific
dered as the flux radiation can be considered a
Robert Rosner 1996).
The relation between the cone radiation and the temperature is presented in Figure the view factor
The idea is that a cone radioactive heat
aerogel blanket empirical thermal was added. The
thermocouples were located between the sample backside and the aluminum paper.

CHALMERS, Civil and Environmental Engineering, Master’s Thesis 2012:147 20
The setup of the experiments is presented in Table 3.2. The first test was run at 35kW/m2 with the ‘white’ aerogel blanket. The ignition was after few seconds so the next experiments were run at lower radiations.
Table 3.2 Cone calorimeter tests
Name test Sample type
Cone temp. [0C]
Cone rad. [kW/m2]
Thermocouple Test num.
w35 white 700 35 no 1
w25_1 white 600 25 no 1
w25_2 white 600 25 no 2
b25_1 black 600 25 no 1
b25_2 black 600 25 No 2
w20 white 550 20 Yes 1
b20 black 550 20 Yes 1
w17 white 525 17 Yes 1
w15 white 500 15 Yes 1
b15 black 500 15 Yes 1
3.3.3 Results and comments
The results found with the experiments were divided in two groups, the results related to ordinary Cone Calorimeter measurements named: time to ignition and stop flaming time, heat release rate (HRR) and weight loss. And the temperatures measured using a thermocouple in the back side of the samples. Moreover, observations during measuring were discussed.
Reaction to fire results
The ignition time and the stop flaming time of the samples ‘white’ and ‘black’ at different radiations are presented in Table 3.3.* indicates that ‘white’ sample were inert at 15kW/m2.

CHALMERS, Civil and Environmental Engineering, Master’s Thesis 2012:147 21
Table 3.3 Ignition and stop flaming times.
Name test ignition time stop flaming time
[s] [s] [min]
w35 1.2 12 0.2
w25_1 10.2 40.2 0.67
w25_2 13.2 34.8 0.58
b25_1 12 240 4
b25_2 14.4 240 4
w20 16.2 31.8 0.53
b20 28.8 271.8 4.53
w17 51 468 7.8
w15 * * *
b15 21 90 1.5
The results showed that ‘black’ aerogel blankets needed lower level of radiation to ignite. The minimum radiation for igniting of ‘white’ aerogel blankets was between 17kW/m2 and 15kW/m2 while the ‘black’ aerogel blanket ignited at lower radiations than 15kW/m2. One reason could be the ‘black’ aerogel blanket had higher amount of combustible material. Another reason could be the influence of the color since the black color absorbs more radiation than the white color.
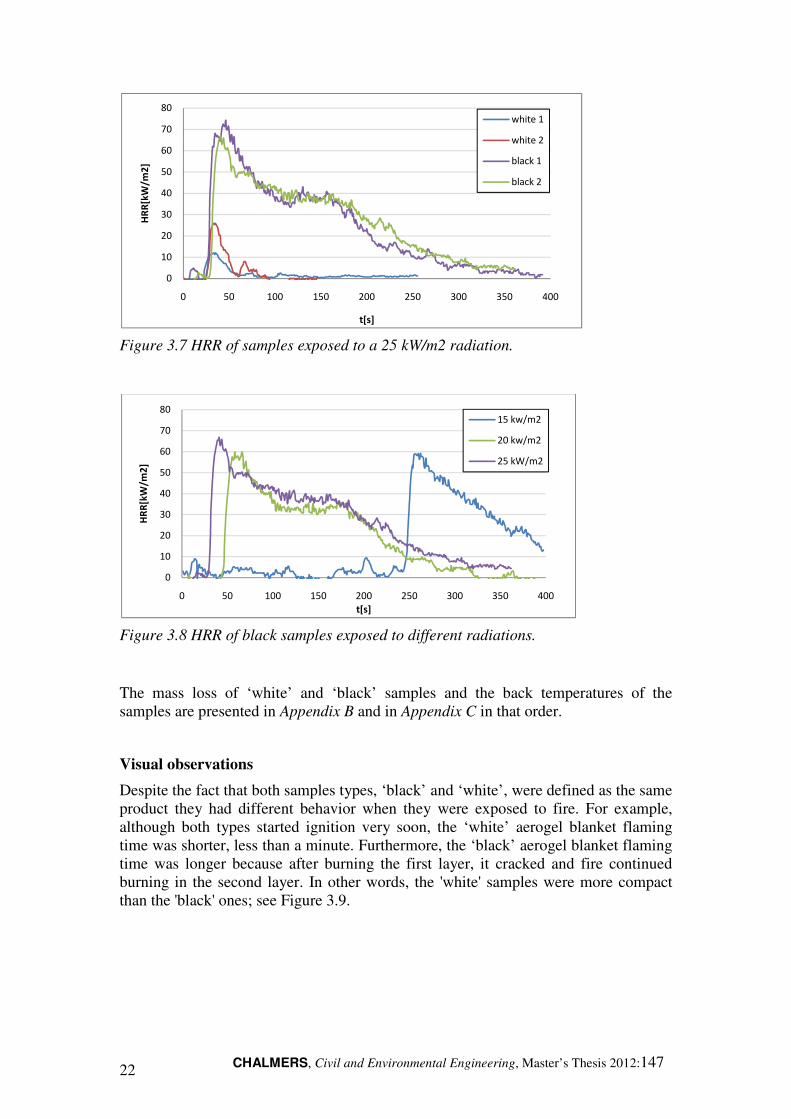
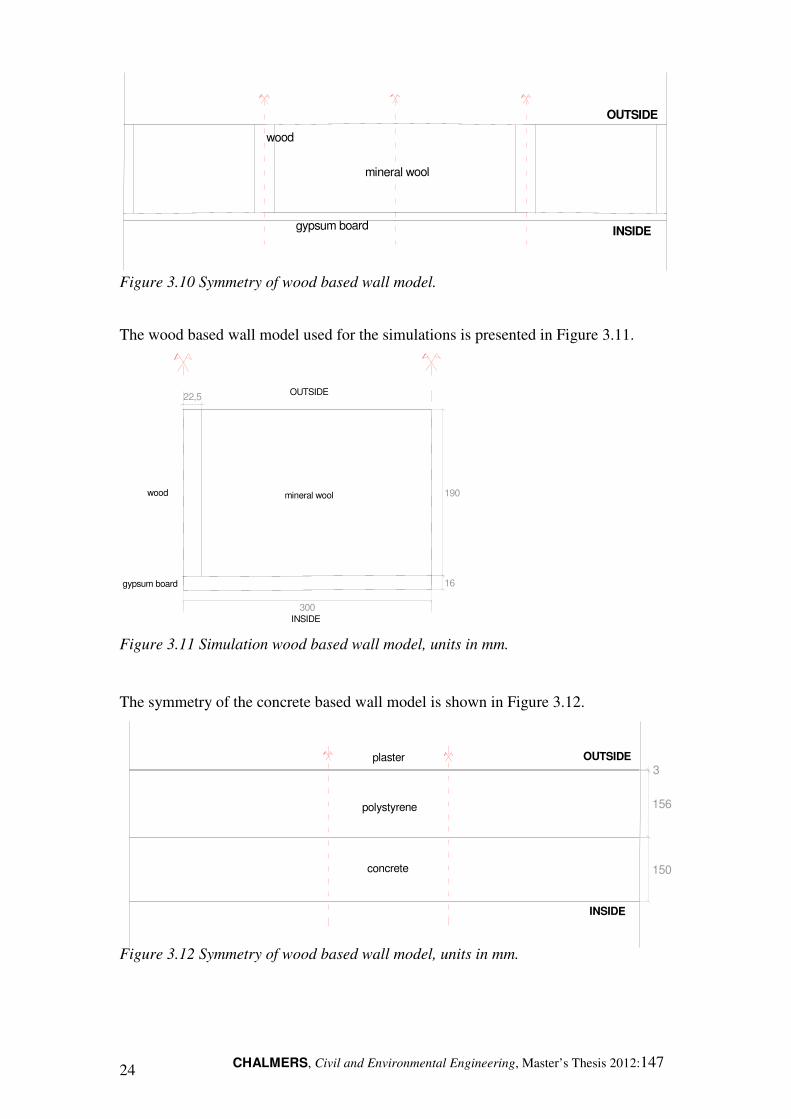
Regarding to heat release rate (HRR) which is the quantity of energy that the fire releases in a second, some of the results are shown in Figures 3.7 and 3.8. For more results see Appendix A.
The results indicated that the HRR of the ‘black’ aerogel blanket was higher than the ‘white’ one. It could depend on the higher absorption of energy by black color sample, which leaded to higher temperatures and faster burning.
Continuing with HRR, it seems that in the case for the black material the HRR maximum value is almost constant for the flux level and the only difference is that when the radiation is higher the HRR is faster, in other words, the maxim value of HRR is before in time. This behavior is not followed by all materials e.g. plastics and wood. By the way, for the white material the HRR is too small to take conclusions but it is clear that some heat is realized and ignition occurs.
CHALMERS, Civil and Environmental Engineering, Master’s Thesis 2012:147 22
Figure 3.7 HRR of samples exposed to a 25 kW/m2 radiation.
Figure 3.8 HRR of black samples exposed to different radiations.
The mass loss of ‘white’ and ‘black’ samples and the back temperatures of the samples are presented in Appendix B and in Appendix C in that order.
Visual observations
Despite the fact that both samples types, ‘black’ and ‘white’, were defined as the same product they had different behavior when they were exposed to fire. For example, although both types started ignition very soon, the ‘white’ aerogel blanket flaming time was shorter, less than a minute. Furthermore, the ‘black’ aerogel blanket flaming time was longer because after burning the first layer, it cracked and fire continued burning in the second layer. In other words, the 'white' samples were more compact than the 'black' ones; see Figure 3.9.
0
10
20
30
40
50
60
70
80
0 50 100 150 200 250 300 350 400
HR
R[k
W/m
2]
t[s]
white 1
white 2
black 1
black 2
0
10
20
30
40
50
60
70
80
0 50 100 150 200 250 300 350 400
HR
R[k
W/m
2]
t[s]
15 kw/m2
20 kw/m2
25 kW/m2

CHALMERS, Civil and Environmenta
Figure 3.9 ‘Black’ and ‘white’ samples after the test
3.4 Simplifications
In order to convert the real structuremake some simplificationsfire simulations.
In the reference to the wood based wall modelprotection were removed. neglected. Furthermore, the façade systemThis last simplification didof the wall due to the existence of an air gap.
In the concrete wall model
3.5 Numerical simulations
Generally, each numerical simulation contains three stages: calculations and port processing.
3.5.1 Preprocessing
The preprocessing includesand boundary conditions.
3.5.1.1 Geometry
The simulation models were two dimensions
The symmetry of the wood based wall model is shown
Civil and Environmental Engineering, Master’s Thesis 2012:147
‘Black’ and ‘white’ samples after the test.
Simplifications
eal structure to the numerical simulations, it is make some simplifications. Thus, the reference wall models were simplified for the
wood based wall model, both the vapor barrier and the wind removed. As well as the connections of the wall materials
. Furthermore, the façade system (cladding) was not included in the modeldid not affect to the boundary condition of the unexposed side
ue to the existence of an air gap.
In the concrete wall model the fixing methods were not taken into account.
Numerical simulations
Generally, each numerical simulation contains three stages: preprocessingcalculations and port processing.
eprocessing
The preprocessing includes geometry of the simulation models; material
The simulation models were two dimensions and symmetric geometry was used.
The symmetry of the wood based wall model is shown in Figure 3.10.
23
, it is necessary to . Thus, the reference wall models were simplified for the
both the vapor barrier and the wind of the wall materials were
included in the model. of the unexposed side
taken into account.
preprocessing, numerical
; material properties
and symmetric geometry was used.
CHALMERS, Civil and Environmental Engineering, Master’s Thesis 2012:147 24
mineral wool
OUTSIDE
gypsum board
wood
INSIDE
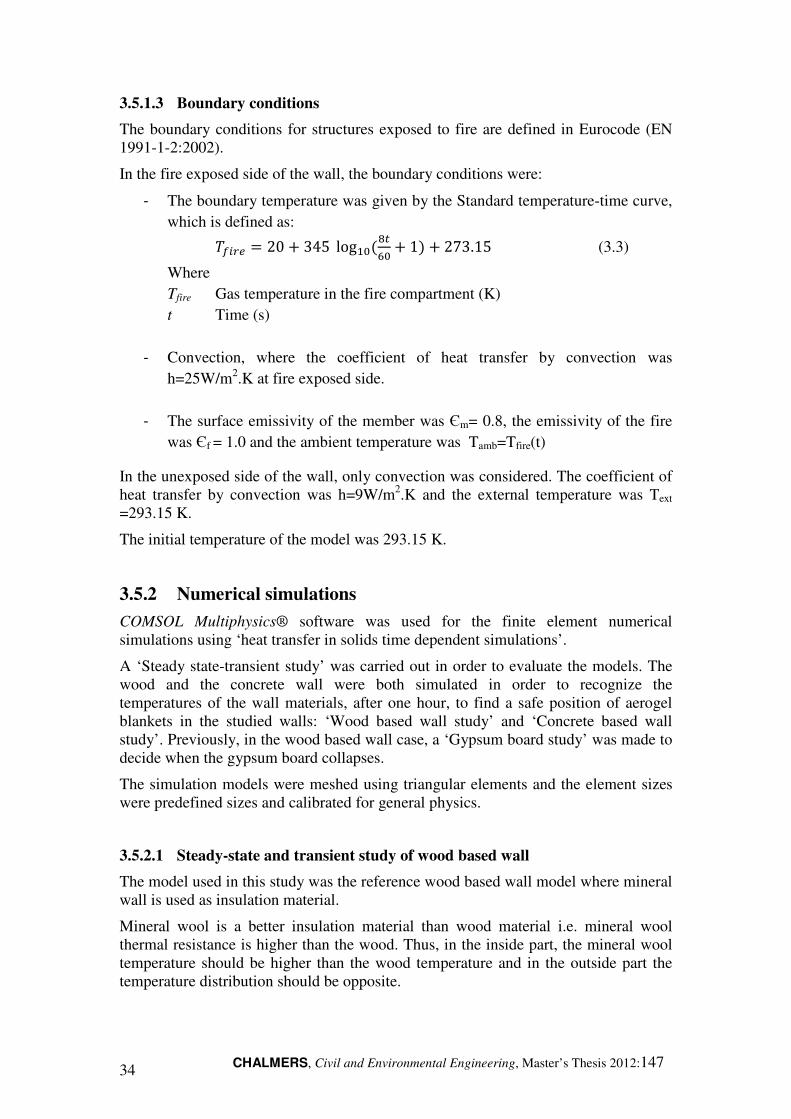
Figure 3.10 Symmetry of wood based wall model.
The wood based wall model used for the simulations is presented in Figure 3.11.
gypsum board
wood mineral wool
22,5
300
190
16
OUTSIDE
INSIDE
Figure 3.11 Simulation wood based wall model, units in mm.
The symmetry of the concrete based wall model is shown in Figure 3.12.
concrete
OUTSIDE
polystyrene
plaster
INSIDE
150
156
3
Figure 3.12 Symmetry of wood based wall model, units in mm.

CHALMERS, Civil and Environmental Engineering, Master’s Thesis 2012:147 25
3.5.1.2 Material properties
Fire simulations need material properties at high temperatures but they are not always available. The materials used in the wall models were the followings: aerogel blankets, mineral wool, polystyrene, wood, concrete, gypsum board and plaster. The most relevant material properties for the study were density, thermal conductivity and heat capacity.
In order to use accurate input data, production companies of the materials were consulted. Eurocode and scientist articles were also used. Furthermore, in aerogel blankets case, some experiments were run to measure its properties. For introducing the properties to the simulation program, analytic functions were used when the curve of the material property by temperature was available. Linear interpolation functions were utilized in cases where that curve was not available.
Aerogel blanket
The aerogel blankets material used in this project was the Spaceloft® type offered by Aspen Aerogel (INC.) which is the type normally used in interior and exterior insulation of walls, floors and roofs.
Referring to the fire reaction, the material was tested using Cone Calorimeter method, which is explained in this chapter in the subchapter Determination of aerogel blanket
fire reaction. The maximum service temperature of aerogel blankets is 2000C (Aspen Aerogels, INC.).
The aerogel blankets density was considered constant during all the simulations and its value was 150 kg/m3 (Aspen Aerogels, INC.).
The temperature dependence of the aerogel blankets thermal conductivity is presented in Table 3.4(Aspen Aerogels, INC.).
Table 3.4 Aerogel blankets thermal conductivity
T[0C] λ[W/m.K]
-160 0.0107
-100 0.0119
-50 0.0130
0 0.0141
10 0.0151*
20 0.0155*
40 0.0160*
100 0.0183
150 0.0231

CHALMERS, Civil and Environmental Engineering, Master’s Thesis 2012:147 26
The temperature dependence of the aerogel blankets heat capacity is presented in Table 3.5 (Aspen Aerogels, INC.).
Table 3.5 Aerogel blankets heat capacity.
T[0C] cp[J/kg.K]
-60 576
-40 683
-20 779
0 864
23 931*
40 1000
60 1054
80 1100
100 1150
120 1189
140 1218
150 1234
* is the measured data in this study.
So as to assign thermal properties at higher temperatures than 1500C i.e. 2000C, which is the maximum service temperature of aerogel blankets, linear extrapolation was used.
Mineral wool
Mineral wool is well known wall insulation material. There exist different types of mineral wool depending on the fiber employed as raw material. In this study, stone wool was chosen due to its fire properties, which are better than the glass fibers based products. Moreover, its high melting temperatures (> 1000°C) make it ideal for fire protection and retardation (Netzsch).
It is widely known that at least 96% of mineral wool is made from inorganic fibers derived from basalt, a volcanic rock. And these fibers are glued using a thermosetting resin binder (Industrial Insulation Group, LLC 2012) (Rockwool peninsular).
The mineral wool density was considered constant during all the simulations and its value was 150kg/m3 (K. Ghazi Wakili, L. Wullschleger & E. Hugi 2008).
Thermal conductivity of mineral wool at different temperatures is presented in Table 3.6. (K. Ghazi Wakili, L. Wullschleger & E. Hugi 2008).

CHALMERS, Civil and Environmental Engineering, Master’s Thesis 2012:147 27
Table 3.6 Mineral wool thermal conductivity.
T[0C] λ[W/m.K]
0 0.03
170 0.05
430 0.10
590 0.15
700 0.20
790 0.25
850 0.30
900 0.35
1000 0.44
Several companies inform that the mineral wool heat capacity at room temperature is 840J/kg.K. However, the heat capacity of mineral wool at different temperatures was not possible to find and some assumptions were done in order to approximate the specific het capacity.
More than 96% of mineral wool is basalt, which is a volcanic rock, and the other components are minor amounts of binder and oil (Roxul Inc.). Furthermore, when it is exposed to high temperatures the adhesive used to glue the rock fibers burns. Thus, the heat capacity of basalt was used as an approximation of mineral wood specific heat capacity (Peter I. Nabelek, Anne M. Hofmeister & Alan G. Whittington 2012).
The used equation is presented in Equation 3.1.
� 2337 ? 2.773 @ 10A � B 2.202 @ 10C�A# ? 2.976 @ 10D�A�.2 (3.1)
Where cp Heat capacity (J/kg.K) T Temperature (K)
However, at room temperature (200C) the cp, calculated by the Equation 3.1, was 774 J/kg.K which was 66J/kg.K less than the one declared by the mineral wool companies. This difference could depend on the existence of adhesives used but also due to the fibers format of basalt. Another option could have been adding 66J/kg.K to the Equation 3.1 but it would have resulted a higher cp value, in other words it would have taken less time to achieve steady state. Furthermore, at the same time the temperature in the material would be lower. Thus, the cp of basalt was used and it is in the safe side concerning fire behavior.

CHALMERS, Civil and Environmental Engineering, Master’s Thesis 2012:147 28
Polystyrene
Polystyrene (PS) is one of the most common rigid plastic foam insulation material for residential and industrial insulation. It can be either found as extruded polystyrene (XPS) or as expanded polystyrene (EPS). Both types of materials are rigid, closed cell and thermoplastic foam materials. However, while EPS is produced from solid beads of polystyrene with small amounts of pentane gas dissolved into the polystyrene base materials to achieve expansion, XPS production starts with solid polystyrene crystals that are extruded along with special additives and a blowing agent. In addition, EPS has a slightly lower value of thermal insulation which remains constant during the life time of the product. It is also easier to work with EPS during its installation and although both products can be recycled, EPS has a better overall environmental impact. However, XPS has a better established reputation as rigid insulation material (Dyplast products 2011). Thus, the extruded polystyrene was selected in the study in of concrete based wall model.
The extruded polystyrene is combustible and can be a fire hazard when it has been improperly installed. This product should not be located in interiors parts where it can be direct exposed to fire, unless an approved thermal barrier, such as a fire resistant gypsum board, is mechanically attached over the foam. In addition, the extruded polystyrene is not recommended for uses where the temperature will exceed 740C - 820C (DiversiFoam Products). To avoid this problem, external insulation was used instead of internal insulation.
The extruded polystyrene thermal material properties used for the simulations were found in a scientific article (Saleh A. Al-Ajlan 2006).
The XPS density was considered constant during all the simulations and its value was 34kg/m3.
Thermal conductivity of XPS at different temperatures is presented in Table 3.7. For higher temperatures linear extrapolation was used.
Table 3.7 Polystyrene thermal conductivity.
T[0C] λ[W/m.K]
22 0.0312
35 0.0324
50 0.0340
65 0.0352
The XPS heat capacity was considered constant during all the simulations and its value was 1280J/kg.K.

CHALMERS, Civil and Environmental Engineering, Master’s Thesis 2012:147 29
Wood
Wood studs were used as structural part of the wood based wall. The wood stud dimensions are:
45x45 mm 45x120 mm 45x70 mm 45x145 mm 45x95 mm 45x170 mm
Spruce is the type of wood chosen for this study. It is very common for structural uses as studs and beams as well as furniture, facades, floorings and doors. Furthermore, Spruce is the most important building and construction timber in Europe (Swedish Wood).
When wood is exposed to fire and subjected to high temperature, a chemical process of incomplete combustion takes places. This process which is known as charring should be taken into account for all surfaces of wood directly exposed to fire. A charring depth should be added to the original member dimensions because the charred part of the member cannot be included in the calculations related to load bearing capacity (EN 1995-1-2:2004). However, as this study focus on non-load bearing walls, the charring of the wood was not taken into consideration.
The dry density of spruce is 440 kg/m3 (Swedish Wood 2012). However, for this study it was necessary to find out its density in several temperatures. Thus, the dry density was multiplied by the density ratio (EN 1995-1-2:2004). It was considered that the moisture content of the wood at 20 0C was 12 % (Swedish Wood 2012).
The variation of the wood density with the temperature is presented in Table 3.8.
Table 3.8 Wood density.
T[0C] Density[kg/m3]
20 493
100 440
120 440
200 440
250 409
300 334
350 229
400 167
600 123
800 114

CHALMERS, Civil and Environmental Engineering, Master’s Thesis 2012:147 30
The spruce wood is classified as softwood. The thermal conductivity and the specific heat capacity of these types of woods were chosen according to Eurocode (EN 1995-1-
2:2004).
The thermal conductivity of spruce at different temperatures is presented in the table 3.9.
Table 3.9 Wood thermal conductivity.
T[0C] λ[W/m.K]
20 0.12
200 0.15
350 0.07
500 0.09
800 0.35
1200 1.50
The heat capacity of spruce at different temperatures is presented in Table 3.10.
Table 3.10 Wood heat capacity.
T[0C] cp[J/kg.K]
20 1530
99 1770
120 2120
200 2000
250 1620
300 710
350 850
400 1000
600 1400
800 1650
1200 1650

CHALMERS, Civil and Environmental Engineering, Master’s Thesis 2012:147 31
Concrete
Concrete is basically a mixture of aggregate and paste. The paste, made with cement and water, binds the aggregates at the same time that the mixture hardens due to a chemical reaction of the cement and the water. The aggregate which is generally divided into two groups, fine and coarse, can be sand and gravel or crushed stone (Portland Cement Association 2012)
The concrete fire reaction is excellent. In fact, concrete does not burn. This makes the concrete acting as an effective fire shield not only between adjacent spaces, but also to protect itself from fire damage (MPA-The Concrete Centre).
The concrete properties present in Eurocode were used in this study (EN 1995-1-
2:2004). The concrete density is shown in Table 3.11.
Table 3.11 Concrete density.
T[0C] Density[kg/m
3]
20 2300
115 2300
200 2254
400 2185
1200 2024
About concrete thermal conductivity, Eurocode gives both the upper and the lower limits. The lower limit was elected as it gives more realistic temperatures for concrete structures. The concrete thermal conductivity was calculated by the Equation 3.2.
� � 1,36 ? 0,136 FGA#C", 2 �� H B 0,0057 FGA#C", 2 �� H# (3.2)
Where λ Thermal conductivity (W/m.K) T Temperature ( 293.15K ≤ T ≤ 1473.15K)
For the concrete heat capacity it was assumed moisture content of 1.5% of concrete weight. The concrete heat capacity is illustrated in Table 3.12.

CHALMERS, Civil and Environmental Engineering, Master’s Thesis 2012:147 32
Table 3.12 Concrete heat capacity.
T[0C] cp[J/kg.K]
20 900
100 900
100.1 1470
115 1470
200 1000
400 1100
1200 1100
Gypsum board
Gypsum board is a product used inside parts of walls and ceiling. There are different types and different thickness which influence its fire reaction. There exist two types of gypsum board, regular and Type X. The main difference between them is that Type X contains noncombustible fibers. The fibers help to maintain the integrity of the core as shrinkage occurs, providing greater resistance to heat transfer during fire exposure (National Gypsum). Regular gypsum board was used for the simulations in this study.
When a wall with gypsum board is exposed to fire, the gypsum board collapses after 15-30 minutes. It depends on the type, the thickness and the way it is attached to the board.
The properties of gypsum board: density, thermal conductivity and heat capacity; were considered constant. The properties used in simulations are presented in Table 3.13 (National Gypsum).
Table 3.13 Gypsum board properties.
ρ[kg/m3] λ[W/m.K] cp[J/kg.K]
755 0.19 1090
Plaster
The plaster used as exterior of the concrete based wall is named Stucco which is the common name for Portland cement plaster. Stucco is a combination of cement ingredients, aggregate, water and other materials that they are sometimes added so as to achieve different colors and textures. This material is a popular exterior finish for buildings due to the fact that it provides an economical hard surface that is not only rot, rust and fire resistant but it also needs a minimum maintenance routine (Portland Cement Association 2012).

CHALMERS, Civil and Environmental Engineering, Master’s Thesis 2012:147 33
Stucco is basically made of cement materials which provide it a good fire reaction. The plaster was placed in the external part of the wall and it was not affected by the inside fire, at least after an hour. The properties of plaster were considered constant.
The properties utilized in simulations: density, thermal conductivity (Newkem Products Corporation) and heat capacity (Martin A. Wilkinson) are presented in Table 3.14.
Table 3.14 Plaster properties.
ρ[kg/m3] λ[W/m.K] cp[J/kg.K]
2000 0.65 1000
Summary materials properties
A summary of the origin of the used material properties and the temperature dependence is presented in Table 3.15.
Table 3.15 Material properties characteristics.
Materials Density (ρ) Thermal conductivity (λ)
Heat capacity (cp)
Comments
Aerogel blankets
Constant Temperature dependent
Temperature dependent
Manufacturer values & experimental values
Mineral wool
Constant Temperature dependent
Temperature dependent
Literature values
Polystyrene Constant Temperature dependent
Constant Literature values
Wood Temperature dependent
Temperature dependent
Temperature dependent
Eurocode values
Concrete Temperature dependent
Temperature dependent
Temperature dependent
Eurocode values
Gypsum board
Constant Constant Constant Manufacturer values
Plaster Constant Constant Constant Manufacturer values & Literature values
CHALMERS, Civil and Environmental Engineering, Master’s Thesis 2012:147 34
3.5.1.3 Boundary conditions
The boundary conditions for structures exposed to fire are defined in Eurocode (EN 1991-1-2:2002).
In the fire exposed side of the wall, the boundary conditions were:
- The boundary temperature was given by the Standard temperature-time curve, which is defined as:
�IJKL � 20 B 345 log �PQRS�B 1T B 273.15 (3.3)
Where Tfire Gas temperature in the fire compartment (K) t Time (s)
- Convection, where the coefficient of heat transfer by convection was h=25W/m2.K at fire exposed side.
- The surface emissivity of the member was Єm= 0.8, the emissivity of the fire was Єf = 1.0 and the ambient temperature was Tamb=Tfire(t)
In the unexposed side of the wall, only convection was considered. The coefficient of heat transfer by convection was h=9W/m2.K and the external temperature was Text
=293.15 K.
The initial temperature of the model was 293.15 K.
3.5.2 Numerical simulations
COMSOL Multiphysics® software was used for the finite element numerical simulations using ‘heat transfer in solids time dependent simulations’.
A ‘Steady state-transient study’ was carried out in order to evaluate the models. The wood and the concrete wall were both simulated in order to recognize the temperatures of the wall materials, after one hour, to find a safe position of aerogel blankets in the studied walls: ‘Wood based wall study’ and ‘Concrete based wall study’. Previously, in the wood based wall case, a ‘Gypsum board study’ was made to decide when the gypsum board collapses.
The simulation models were meshed using triangular elements and the element sizes were predefined sizes and calibrated for general physics.
3.5.2.1 Steady-state and transient study of wood based wall
The model used in this study was the reference wood based wall model where mineral wall is used as insulation material.
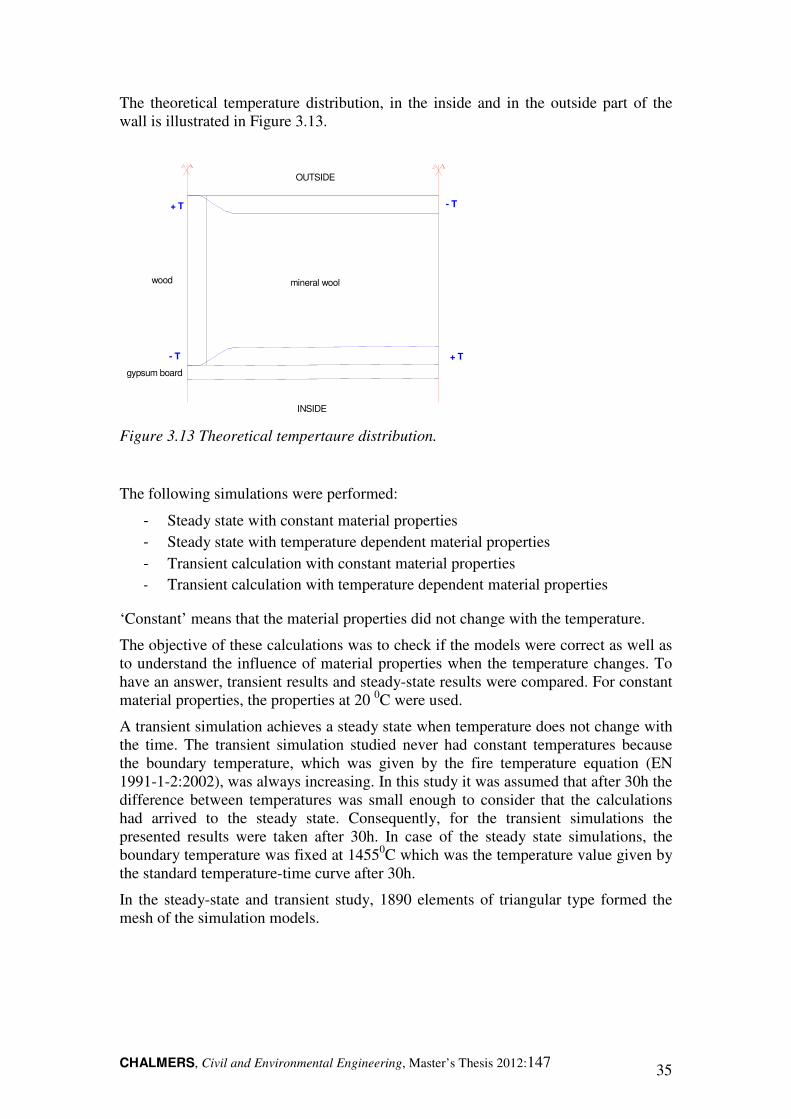
Mineral wool is a better insulation material than wood material i.e. mineral wool thermal resistance is higher than the wood. Thus, in the inside part, the mineral wool temperature should be higher than the wood temperature and in the outside part the temperature distribution should be opposite.
CHALMERS, Civil and Environmental Engineering, Master’s Thesis 2012:147 35
The theoretical temperature distribution, in the inside and in the outside part of the wall is illustrated in Figure 3.13.
gypsum board
wood mineral wool
OUTSIDE
INSIDE
+ T
+ T
- T
- T
Figure 3.13 Theoretical tempertaure distribution.
The following simulations were performed:
- Steady state with constant material properties - Steady state with temperature dependent material properties - Transient calculation with constant material properties - Transient calculation with temperature dependent material properties
‘Constant’ means that the material properties did not change with the temperature.
The objective of these calculations was to check if the models were correct as well as to understand the influence of material properties when the temperature changes. To have an answer, transient results and steady-state results were compared. For constant material properties, the properties at 20 0C were used.
A transient simulation achieves a steady state when temperature does not change with the time. The transient simulation studied never had constant temperatures because the boundary temperature, which was given by the fire temperature equation (EN 1991-1-2:2002), was always increasing. In this study it was assumed that after 30h the difference between temperatures was small enough to consider that the calculations had arrived to the steady state. Consequently, for the transient simulations the presented results were taken after 30h. In case of the steady state simulations, the boundary temperature was fixed at 14550C which was the temperature value given by the standard temperature-time curve after 30h.
In the steady-state and transient study, 1890 elements of triangular type formed the mesh of the simulation models.

CHALMERS, Civil and Environmental Engineering, Master’s Thesis 2012:147 36
Results
In order to present the results of this study the followed nomenclature was used: x-
axis corresponds to the longitudinal axis of the simulation model and y-axis is the transversal axis.
The geometrical nomenclature of the simulation model is presented in Figure 3.14.
Figure 3.14 Simulation model geometrical nomenclature.
The results of the steady-state and transient study are presented in Figures 3.15, 3.16, 3.17 and 3.18. The results were the temperature in different longitudinal sections (y-position of the simulation models) and the total heat flux of wall external transversal section (y = 205mm).
Results of steady state with constant material properties
Figure 3.15 Steady-state with constant material properties results.
0,2
0,25
0,3
0,35
0,4
0,45
0,5
0,55
0,6
0,65
0,7
0,75
0 25 50 75 100 125 150 175 200 225 250 275 300
qy
[k
W/m
2]
x [mm]
total heat flux y-direction (steady state const. material
prop.)
y=205mm
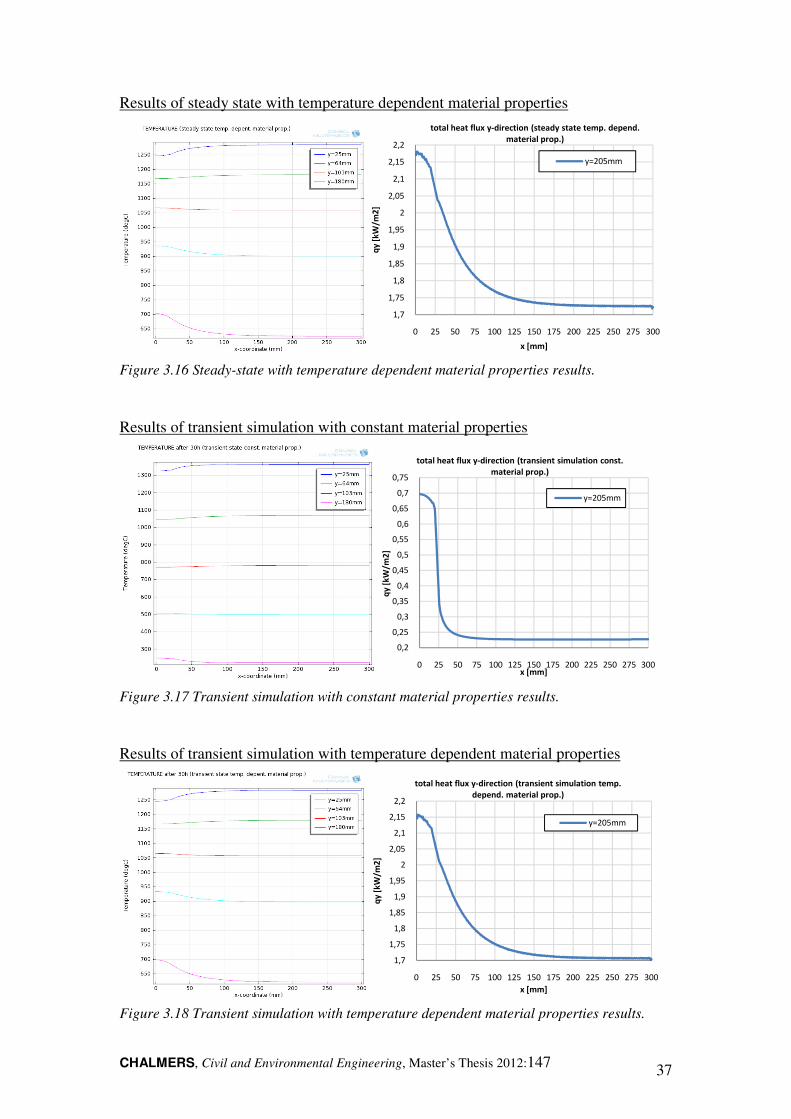
CHALMERS, Civil and Environmental Engineering, Master’s Thesis 2012:147 37
Results of steady state with temperature dependent material properties
Figure 3.16 Steady-state with temperature dependent material properties results.
Results of transient simulation with constant material properties
Figure 3.17 Transient simulation with constant material properties results.
Results of transient simulation with temperature dependent material properties
Figure 3.18 Transient simulation with temperature dependent material properties results.
1,7
1,75
1,8
1,85
1,9
1,95
2
2,05
2,1
2,15
2,2
0 25 50 75 100 125 150 175 200 225 250 275 300
qy
[k
W/m
2]
x [mm]
total heat flux y-direction (steady state temp. depend.
material prop.)
y=205mm
0,2
0,25
0,3
0,35
0,4
0,45
0,5
0,55
0,6
0,65
0,7
0,75
0 25 50 75 100 125 150 175 200 225 250 275 300
qy
[k
W/m
2]
x [mm]
total heat flux y-direction (transient simulation const.
material prop.)
y=205mm
1,7
1,75
1,8
1,85
1,9
1,95
2
2,05
2,1
2,15
2,2
0 25 50 75 100 125 150 175 200 225 250 275 300
qy
[k
W/m
2]
x [mm]
total heat flux y-direction (transient simulation temp.
depend. material prop.)
y=205mm

CHALMERS, Civil and Environmental Engineering, Master’s Thesis 2012:147 38
The last simulation, transient simulation with temperature dependent material properties, was the one explained in this project. The temperature evolution in the inside part (y=25mm) and in an intermediate transversal section (y=103mm) at different times are shown in Figure 3.19. It was chosen an intermediate section because after one hour of simulation, the highest temperatures arrived around this section.
Figure 3.19 Transient simulations with temperature dependent material properties
temperatures at different times.
The results of the calculations indicated that transient results achieved the steady state results. Furthermore, all the options follow the theoretical behavior explained in the first paragraph, higher temperature in mineral wool in the inside part and higher temperature in wood in the outside part. The small difference between steady state and transient simulations depends on the boundary temperature which was constant at 14550C in steady state simulation, but in transient simulation it was only in the last second the boundary temperature reached 14550C.
Figure 3.19, shows that in transient temperature dependent material properties simulation, in the inside part the mineral wool temperatures were always higher that the wood temperatures, as it should be; but in deeper layers there was a change of the temperature distribution. For example, in the middle of the wall, first the mineral wool had the highest temperatures but after 4.5h mineral wool had the lowest temperatures. As this study was analyzed during the first hour period, mineral wool had higher temperatures because the calculations did not achieve the steady state yet.
The heat flux in the y-direction was higher in wood as the theoretical prediction. Furthermore, in order to verify if the total heat flux value obtained with the simulation was correct some calculations were performed. The analyzed model was the steady state model with the material properties constant with the temperature and the values were from the external boundary in the mineral wool section (y=205.9 mm).
� � U3 � � ∆� (3.4)
� � 6 �
�W�WB �)
�) (3.5)

CHALMERS, Civil and Environmental Engineering, Master’s Thesis 2012:147 39
Where
q Density of heat flow rate (W/m2) Q Heat flow rate (W) A Area (m2) U Thermal transmittance (W/m2.K) ∆T Temperature variation (K) R Thermal resistivity (m2.K/W) d Thickness (m) λ Thermal conductivity (W/m.K)
In Equation 3.5, the sub-index 1 corresponded to gypsum board where � �0.0159 and � � 0.1871 �
( * and the sub-index 2 made referent to mineral wool
�# � 0.190 and �# � 0.032 �( * . About the temperature variation, ∆T= 1407.
The heat flux from the simulations and from the calculations in mineral wool section is presented in Table 3.16. These values were very similar.
Table 3.16 Heat flux in mineral wool section (W/m2).
qsimulation qcalculations deviation
MW section 233.95 233.62 0.14%
The wall models with temperature dependent material properties had a higher value of the heat flux in the y-direction because with the temperature, the thermal conductivity of the materials increases which leads to less resistance to the heat transfer. Thus, temperatures in the inside part were lower while temperatures in the outside part were higher than in the models with constant material properties.
3.5.2.2 Gypsum board study
In a wall structure with gypsum board, after 15-30 minutes the gypsum board collapses and the substrate is exposed to fire. The objective of this study was to investigate how the time that the gypsum board was in its place influenced the temperature distribution in the wall. The reference wood base wall model was used for studding the influence of the gypsum board.
The results of the steady state and transient study showed that the higher temperatures took place in mineral wool. Thus, the section studied here was the transversal section x=300mm. Four cases, which are presented below, were simulated using time-dependent study:
- The gypsum board does not collapse from the wall (GB always)) - The gypsum board collapses after 15min (no GB after 15min) - The gypsum board collapses after 20min (no GB after 20min) - The gypsum board collapses after 30min (no GB after 30min)

CHALMERS40
The temperatures distribution was studied after 1h, 1.5h and 4h.
761 elements of triangular type board was still in its place. And 667 the wall model where the gypsum board was not included.
Results
The temperature distributions after 1h, 1.5h and 4h of the difference cases in the mineral wool section are presented in Figure
Figure 3.20 Temperatures in mineral wool section after 1h.
Figure 3.21 Temperatures in minera
0
100
200
300
400
500
600
700
800
900
1000
0 25 50
T[0
C]
200 0C
0
100
200
300
400
500
600
700
800
900
1000
0 25 50
T[0
C]
CHALMERS, Civil and Environmental Engineering, Master’s Thesis
The temperatures distribution was studied after 1h, 1.5h and 4h.
elements of triangular type formed the mesh of the wall model where the gypsum board was still in its place. And 667 elements of triangular type formed the
where the gypsum board was not included.
The temperature distributions after 1h, 1.5h and 4h of the difference cases in the neral wool section are presented in Figures 3.20, 3.21, 3.22.
Temperatures in mineral wool section after 1h.
Temperatures in mineral wool section after 1.5h.
75 100 125 150 175 200
y[mm]
GB always
no GB after 15min
no GB after 20min
no GB after 30min
75 100 125 150 175 200y[mm]
GB alwaysno GB after 15minno GB after 20minno GB after 30min
, Master’s Thesis 2012:147
where the gypsum formed the mesh of
The temperature distributions after 1h, 1.5h and 4h of the difference cases in the

CHALMERS, Civil and Environmental Engineering, Master’s Thesis 2012:147 41
Figure 3.22 Temperatures in mineral wool section after 4h.
The results of the simulations indicated that there was a large difference between the simulation results with and without gypsum board. For example after 1 hour the temperatures in the wall were around 200 degree lower in the case where the gypsum board was still in its place. Consequently as later the gypsum board collapsed, the temperature values were lower. However, at longer time, the temperature difference; between 15, 20 and 30min gypsum boards resistance; decreased due to 1500C.
In Figure 3.20, which gives the most significant results because the studied wall should resist 1h exposed to fire, it could be observed that the temperatures difference between 15 and 20min resistance was not a lot. For that reason, the gypsum board that collapse after 15min of fire exposure was used for the following simulations.
3.5.2.3 Wood based wall study
According to manufacturer the aerogel blanket selected for this study, named Spaceloft®, cannot be used at temperatures higher than 2000C (Aspen Aerogels, INC.). Moreover, the results of Cone Calorimeter method showed that the ignition time of aerogel blankets was very short. Simulations were performed to find the 2000C level over cross section of the wall after one hour.
The reference wood based wall model was utilized and two simulations were performed. In the first simulation, the temperature distribution over the wall section was calculated for the first 15 minutes, assuming that gypsum board collapsed after 15 minutes. The results of these calculations were saved. In the second simulation the gypsum board was removed i.e. the substrate was exposed to fire temperature. Furthermore, the temperature distribution obtained by the first simulation was used as initial temperatures for the second simulation. The second simulation time was from 15 minutes until 1 hour and the results were the position of the 2000C which indicated the minimum thickness of mineral wool needed to protect aerogel blankets.
The specific heat capacity of mineral wool was assumed to be in the same level as basalt. A sensitive analysis was performed to determine how the assumption affects the position of 2000C.
0
100
200
300
400
500
600
700
800
900
1000
1100
1200
0 25 50 75 100 125 150 175 200
T[0
C]
y[mm]
GB always
no GB after 15min
no GB after 20min
no GB after 30min150 0C

CHALMERS, Civil and Environmental Engineering, Master’s Thesis 2012:147 42
The mesh of the models had the same element type and the same number of elements as the gypsum board study.
Minimum mineral wool thickness results
The temperature distribution of the reference wood based wall after 1 hour is presented in Figure 3.23.
Figure 3.23 Temperature distribution of the reference wood based wall after 1 hour.
The results showed that mineral wool was exposed to 9390C. This value was lower than the maximum service temperature of mineral wool which is higher than 10000C (Netzsch). The critical temperature for aerogel blankets, 2000C, was found between 80 and 120mm from the fire exposed surface, see Figure 3.23. The temperatures in this section in more detail are presented in Figure 3.24.
Figure 3.24 Detail of temperature distribution of the reference wood based wall after 1 hour.
50
100
150
200
250
300
350
400
450
80 85 90 95 100 105 110 115 120
T[0
C]
y[mm]
mineral wool section (x=300mm)

CHALMERS, Civil and Environmenta
Linear interpolation between which was 103.29mm from the fire exposedin to account, this position corresponds to 87.39mm of mineral wool minimum thickness needed to protect aerogel blankets.approximated to 95mm because
Mineral wool sensitive analysis results
In the mineral wool sensitive analysis there cases was simulated:
- Mineral wool heat capacity as basalt heat capacity - Mineral wool heat capacity 10% higher than basalt heat capacity (MW Cp +
- Mineral wool heat capacity 10% lower basalt heat capacity
The y-positions in the mineral wool section (x=300mm) of the temperatures close to 2000C after 1 hour of the pre
Figure 3.25 Mineral wool Cp sensitive analysis.
The comparison between the 200(∆y) and the mineral wool heat capacity variation (
Table 3.17 Mineral wool Cp sensitive analysis results.
Name ∆Cp[%]
Cp+10% 10.00%
Cp 0.00%
Cp-10% -10.00%
The results agreed with the higherFurthermore, it can be noticed that when the heat capacity of mineral wool varies 10% the critical distance varies approximately becomes approximately
96979899
100101102103104105106107108109110
190
y[m
m]
Civil and Environmental Engineering, Master’s Thesis 2012:147
inear interpolation between the results of each node gave the location of 200103.29mm from the fire exposed surface. If the gypsum board is
his position corresponds to 87.39mm of mineral wool minimum thickness needed to protect aerogel blankets. However the mineral wool thickness
because of the available wood stud dimensions.
Mineral wool sensitive analysis results
In the mineral wool sensitive analysis there cases was simulated:
Mineral wool heat capacity as basalt heat capacity (MW Cp) Mineral wool heat capacity 10% higher than basalt heat capacity (MW Cp +
Mineral wool heat capacity 10% lower basalt heat capacity (MW Cp
positions in the mineral wool section (x=300mm) of the temperatures close to C after 1 hour of the previous cases are illustrated in Figure 3.25.
Mineral wool Cp sensitive analysis.
The comparison between the 2000C distance from the surface exposed to fire variation y) and the mineral wool heat capacity variation (∆Cp) is presented in Table 3.17.
Mineral wool Cp sensitive analysis results.
y[mm] ∆y[mm] ∆y[%]
99.29 -4.00 -3.87%
103.29 0.00 0,00%
107.96 4.67 4.52%
The results agreed with the higher value of Cp, the higher surface temperature. Furthermore, it can be noticed that when the heat capacity of mineral wool varies 10% the critical distance varies approximately 5%. The difference in thickness
5mm which was acceptable.
200 210
T[0C]
MW Cp
MW Cp + 10%
MW Cp - 10%
43
the results of each node gave the location of 2000C the gypsum board is not taken
his position corresponds to 87.39mm of mineral wool minimum the mineral wool thickness was tud dimensions.
Mineral wool heat capacity 10% higher than basalt heat capacity (MW Cp + 10%)
(MW Cp - 10%)
positions in the mineral wool section (x=300mm) of the temperatures close to
C distance from the surface exposed to fire variation Cp) is presented in Table 3.17.
value of Cp, the higher surface temperature. Furthermore, it can be noticed that when the heat capacity of mineral wool varies
5%. The difference in thickness
210
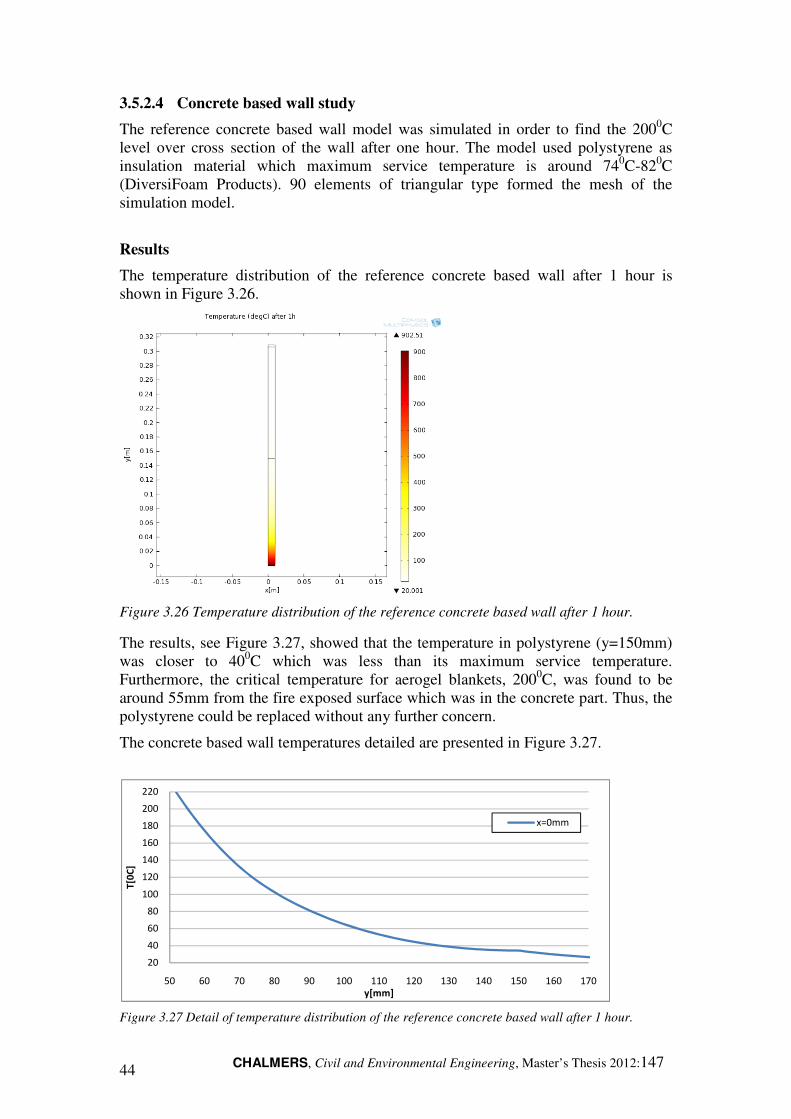
CHALMERS, Civil and Environmental Engineering, Master’s Thesis 2012:147 44
3.5.2.4 Concrete based wall study
The reference concrete based wall model was simulated in order to find the 2000C level over cross section of the wall after one hour. The model used polystyrene as insulation material which maximum service temperature is around 740C-820C (DiversiFoam Products). 90 elements of triangular type formed the mesh of the simulation model.
Results
The temperature distribution of the reference concrete based wall after 1 hour is shown in Figure 3.26.
Figure 3.26 Temperature distribution of the reference concrete based wall after 1 hour.
The results, see Figure 3.27, showed that the temperature in polystyrene (y=150mm) was closer to 400C which was less than its maximum service temperature. Furthermore, the critical temperature for aerogel blankets, 2000C, was found to be around 55mm from the fire exposed surface which was in the concrete part. Thus, the polystyrene could be replaced without any further concern.
The concrete based wall temperatures detailed are presented in Figure 3.27.
Figure 3.27 Detail of temperature distribution of the reference concrete based wall after 1 hour.
20
40
60
80
100
120
140
160
180
200
220
50 60 70 80 90 100 110 120 130 140 150 160 170
T[0
C]
y[mm]
x=0mm

CHALMERS, Civil and Environmental Engineering, Master’s Thesis 2012:147 45
3.6 Second alternative results
In order to design thinner walls with aerogel blankets considering the fire performance new simulations were performed resulting in second alternative wall models: second alternative wood based wall model and second alternative concrete based wall model. It was assumed that the energy performance of the new walls was in the same level as the reference walls designs.
In the new design of the wood based wall, some part of mineral wool was replaced with aerogel blankets. While in new concrete design, all the polystyrene was replaced with aerogel blankets. As the thermal conductivity of the aerogel blankets is lower than the mineral wool and the polystyrene, the new walls thickness was less.
3.6.1 Wood based wall model
According to the ‘Wood based wall study’, 95mm mineral wool thickness was needed. Thus, the thickness of aerogel blankets became 46mm, see equations 3.6 and 3.7.
��/�_# � ��/�_� � 5.94 () *� (3.5)
��/�_# � ������
B �01�01
� �.�!2�.�"#B
�01�.� 22 � 5.94 (
) *� ��3/ � 0.046 (3.6)
Where
RWRW_2 Thermal resistance of the second alternative wood based wall (m2.K/W) RWRW_R Thermal resistance of the reference wood based wall (m2.K/W) dMW Thickness of mineral wool (m) λMW Thermal conductivity of mineral wool (W/m.K) dAB Thickness of aerogel blankets (m) λAB Thermal conductivity of aerogel blankets (W/m.K)
The new model was also simulated during 1 hour of fire exposure using the same conditions as before and 484 elements of triangular type formed the mesh of the simulation model.
The temperatures distribution in the wood based wall is presented in Figure 3.28.
Figure 3.28 Second alternative wood based wall temperature distribution after 1h.
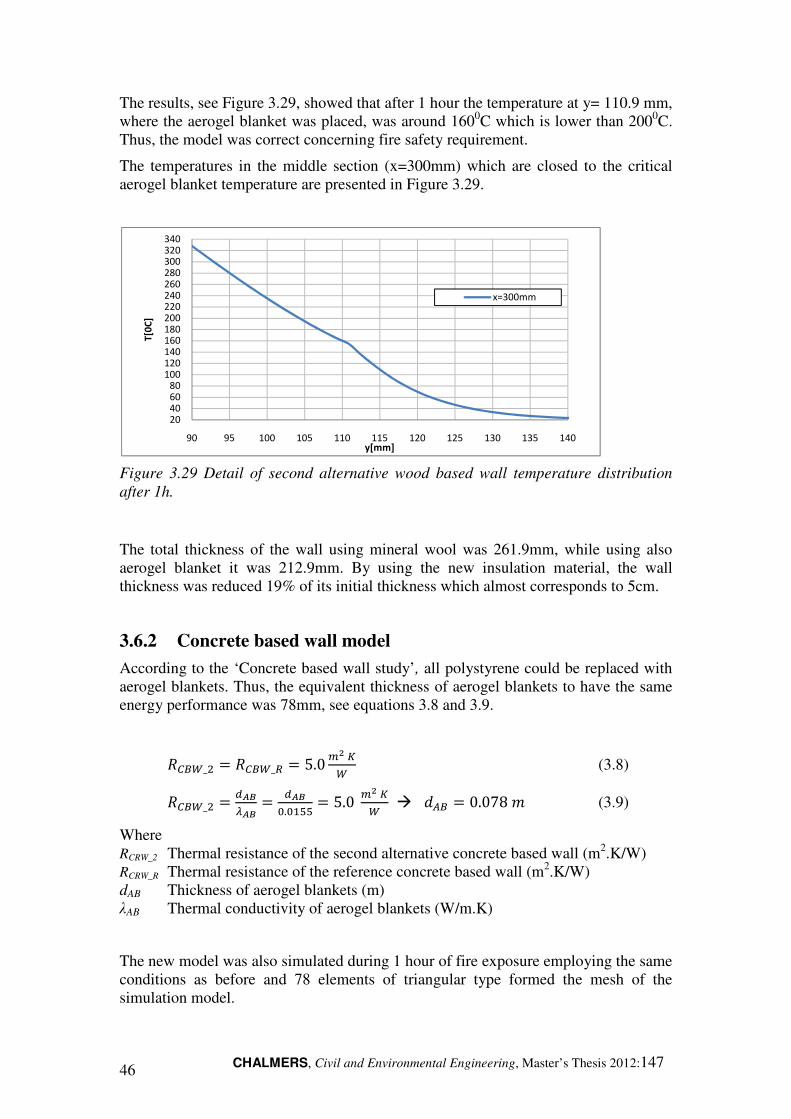
CHALMERS, Civil and Environmental Engineering, Master’s Thesis 2012:147 46
The results, see Figure 3.29, showed that after 1 hour the temperature at y= 110.9 mm, where the aerogel blanket was placed, was around 1600C which is lower than 2000C. Thus, the model was correct concerning fire safety requirement.
The temperatures in the middle section (x=300mm) which are closed to the critical aerogel blanket temperature are presented in Figure 3.29.
Figure 3.29 Detail of second alternative wood based wall temperature distribution
after 1h.
The total thickness of the wall using mineral wool was 261.9mm, while using also aerogel blanket it was 212.9mm. By using the new insulation material, the wall thickness was reduced 19% of its initial thickness which almost corresponds to 5cm.
3.6.2 Concrete based wall model
According to the ‘Concrete based wall study’, all polystyrene could be replaced with aerogel blankets. Thus, the equivalent thickness of aerogel blankets to have the same energy performance was 78mm, see equations 3.8 and 3.9.
�5/�_# � �5/�_� � 5.0() *� (3.8)
�5/�_# � �01�01
� �01�.� 22 � 5.0 (
) *� � �3/ � 0.078 (3.9)
Where
RCRW_2 Thermal resistance of the second alternative concrete based wall (m2.K/W) RCRW_R Thermal resistance of the reference concrete based wall (m2.K/W) dAB Thickness of aerogel blankets (m) λAB Thermal conductivity of aerogel blankets (W/m.K)
The new model was also simulated during 1 hour of fire exposure employing the same conditions as before and 78 elements of triangular type formed the mesh of the simulation model.
20406080
100120140160180200220240260280300320340
90 95 100 105 110 115 120 125 130 135 140
T[0
C]
y[mm]
x=300mm

CHALMERS, Civil and Environmental Engineering, Master’s Thesis 2012:147 47
The temperatures distribution in the concrete based wall is presented in Figure 3.30.
Figure 3.30 Second alternative concrete based wall temperature distribution after 1h.
The results, see Figure 3.31, showed that after 1 hour the temperature at y= 150 mm, where the aerogel blanket was placed, was around 350C which is lower than 2000C. Thus, the model was correct concerning fire safety requirement.
The temperatures in a transversal wall section (x=0mm) close to the critical aerogel blanket temperature are presented in Figure 3.31.
Figure 3.31 Detail of second alternative concrete based wall temperature distribution
after 1h.
The total thickness of the wall using polystyrene was 309mm, while using aerogel blanket it was 231mm. By using the new insulation material, the wall thickness was reduced 25% of its initial thickness which almost corresponds to 8cm.
20
40
60
80
100
120
140
160
180
200
220
50 60 70 80 90 100 110 120 130 140 150 160 170
T[0
C]
y[mm]
x=0mm

CHALMERS, Civil and Environmental Engineering, Master’s Thesis 2012:147 48
3.6.3 Summary of second alternative results
The thicknesses (d) of the reference wall models and the second alternative wall models by replacing some of the mineral wool with aerogel blankets in the wood based wall case, and by replacing all the polystyrene with aerogel blankets in the concrete based wall case are summarized in Table 3.18.
Table 3.18 Reference walls and second alternative walls thicknesses.
wall d [mm]
insulation d [mm]
U-value [W/m2.K]
∆d [mm] ∆d [%]
WBW_R 262 190 0.17
WBW_2 213 141 0.17 49 19%
CBW_R 309 156 0.20
CBW_2 231 78 0.20 79 25%
Where WBW_R Reference wood based wall WBW_2 Second alternative wood based wall CBW_R Reference concrete based wall CBW_2 Second alternative concrete based wall
By considering the fire performance, the wood based wall thickness was reduced 19% while the concrete based wall thickness was reduced 25%.

CHALMERS, Civil and Environmental Engineering, Master’s Thesis 2012:147 49
4 Moisture properties
When a wall material in a building component is replaced with another material in order to improve a specific performance, it is important to verify the influence of the replacement on other technical demand, for example risk for condensation of moisture.
In this study the vapor permeability (δv) of aerogel blankets was determinate by the Cup method and it was compared with the vapor permeability of other insulation materials.
4.1 Vapor permeability
Although water is essential for all forms of life, it can also deteriorate and disintegrate natural and hand-made material and buildings consist of a large numbers of such materials. Moreover, the interaction of moisture with building materials may significantly influence the thermal performance of buildings (Carl-Eric Hagentoft. 2001).
A first differentiation can be done between moisture in air and moisture in porous materials. The moisture transfer in air or by air can be per diffusion or by convection, while the moisture transfer in porous material is owing to diffusion or capillary suction or a combination of both.
In this study, only the moisture transfer in porous materials by diffusivity was studied. The steady-state diffusivity flux g through a porous material layer with thickness d and air humidity by volume v kept at v1 in one side of the layer and v2 on the other side, see Figure 4.1, can be calculated by using Equation 4.1. � � �� �WA�)
� (4.1)
Where g Steady-state diffusivity flux (kg/m2.s) δv Vapor permeability coefficient (m2/s) v Air humidity by volume (kg/m3) d Thickness (m)
The diffusion of water vapor through a material layer is illustrated in Figure 4.1.
Figure 4.1 Diffusion of water vapor through a material layer.

CHALMERS, Civil and Environmental Engineering, Master’s Thesis 2012:147 50
The vapor permeability coefficient of the material can be compared with the diffusion of moisture in dry air by introducing the µ-factor:
� � XYZ
(4.2)
Where µ µ-factor (-) D Diffusivity of water vapor in air (25·10-6 m2/s at 200C)
A high value of µ-factor means that the material has high resistance to water vapor transmission.
The µ-factor given by manufacturers of mineral wool, polystyrene (Natural Building Technologies 2009) and aerogel blankets (Aspen Aerogels 2012) are shown in Table 4.1.
Table 4.1 Insulation materials µ-factor.
µ-factor
Mineral wool 1
Polystyrene 30
Aerogel blankets 5
4.2 Determination of aerogel blankets vapor permeability
The moisture permeability of aerogel blankets was determined by using the Cup method.
A cup is filled with distilled water to achieve a relative humidity inside the cup around 100%, and later a specimen of the material studied is used to seal the cup. Subsequently, the cup is placed in an atmosphere of constant temperature and relative humidity lower than 100%. This atmosphere can be achieved either in a climate box or directly exposed to the air of a climate room. (Bijan Adl Zarrabi 1998). This method is illustrated in the Figure 4.2.
As the relative humidity is higher inside the cup, there is a moisture flow through the specimen therefore, the weight of the cup decreases. During the test, the cup is weighted regularly until the steady-state condition is reached. After getting these results, the moisture resistance can be calculated using the Equation 4.5. Furthermore, the moisture permeability of the studied material, δv[m
2/s], can be calculated by Equation 4.6. The following relations are used in this method: ´

CHALMERS, Civil and Environmental Engineering, Master’s Thesis 2012:147 51
� � ∆�[\]\
(4.3)
�R^R � �_L`J(La B �bJK cb B �d (4.4)
�_L`J(La � 3 ∆R ∆�∆( ? �#
�.�#2 �ef ? gd (4.5)
�� � � [hijklmjn
� � 0 ∆\ ∆Z∆m A o)
p.p)q WpefArs (4.6)
In Equation 4.3 ∆v is the difference of the humidity by volume over cross section of the specimen. Considering that the relativity humidity of the climate room is 50 % and the relative humidity inside the cup is almost 100%, ∆v had a value of 8.65E-3 kg.
In Equation 4.4, the first term represents the moisture resistance of the studied material, Zspecimen[m/s], the second term, Zair gap[m/s], is the vapor resistance of the air gap between the water surface and the specimen and the third term, Zu, is the resistance between the surface of the specimen and the external air. Zu value was estimated to 100s/m using the Lewis formula.
In Equation 4.5, A[m2] is the area of the specimen, ∆m[kg] is the weight reduction over a time period of ∆t[s] and d2[m], is air gap thickness.
In Equation 4.6 d1[m] is the thickness of the specimen.
Cup method is illustrated in Figure 4.2.
Figure 4.2 Cup method.
4.2.1 Sample preparation
Samples of aerogel blanket, Spacetherm® from Proctor Company were prepared for measurements. Two types of Spacetherm® were tested; one was defined as ‘black’ and the other one as ‘white’. Although both materials are classified, by the manufacturer, under the same named, Spacetherm®, the ‘white’ was the new version of the ‘black’. Four samples were tested; two of each type. Their dimensions were 13cm diameter and 1cm thickness.
As the aerogel blanket is a material made of small particles, it was not possible to fix the specimen to the cup using ordinary ways. The solution found is explained below.

CHALMERS52
The aerogel blanket sample, which the cup and an aluminum material to get one dimension moisture flowspecimen to the cup.
The final setup of the speci
Figure 4.3 Cup method dimensions.
4.2.2 Tests
The cups with the specimens, climate room where the temperature and the relative humidity were maintained constant at 200C and 50% respectively. The cups were weigdays.
The samples are illustrated in FTable 4.2.
Figure 4.4 Cup method samples.
Table 4.2 Cup method samples initial weights
Name test Sample type
b_1 black
b_2 black
w_1 white
w_2 white
CHALMERS, Civil and Environmental Engineering, Master’s Thesis
The aerogel blanket sample, which had a larger diameter than the cup, was placed on aluminum foil of 5cm width was used to cover the extra specimen
material to get one dimension moisture flow. Adhesive paper was used t
the specimen and the cup is presented in Figures 4.3.
od dimensions.
The cups with the specimens, see Figure 4.4, were directly exposed to the air of a climate room where the temperature and the relative humidity were maintained
C and 50% respectively. The cups were weighted regularly during 38
samples are illustrated in Figure 4.4 and their initial weights are presented in
Cup method samples.
Cup method samples initial weights.
Sample type initial weight [g]
280,10
280,12
286,38
286,33
, Master’s Thesis 2012:147
, was placed on ver the extra specimen was used to attach the
.
, were directly exposed to the air of a climate room where the temperature and the relative humidity were maintained
regularly during 38
itial weights are presented in

CHALMERS, Civil and Environmental Engineering, Master’s Thesis 2012:147 53
4.2.3 Results
The mass variation and the vapor permeability coefficient of the four samples tested are shown in Figures 4.5 and 4.6.
Figure 4.5 Mass variation of Cup method samples.
Figure 4.6 Vapor permeability coefficient of Cup method samples.
In order to had an idea about this aerogel blankets moisture property, the vapor permeability was calculated in time interval 35-40 days.
The vapor permeability and the µ-factor values found for the four samples are presented in the Table 4.3.
Table 4.3 Cup method results.
δv [m2/s] µ-factor
black_1 8.30E-06 3.01
black_2 8.55E-06 2.92
white_1 9.50E-06 2.63
white_2 8.50E-06 2.94
mean value 8.70E-06 3.00
200,00
220,00
240,00
260,00
280,00
300,00
0,00E+00 5,00E+05 1,00E+06 1,50E+06 2,00E+06 2,50E+06 3,00E+06 3,50E+06
ma
ss [
g]
t [s]
black_1
black_2
white_1
white_2
6,50E-06
7,00E-06
7,50E-06
8,00E-06
8,50E-06
9,00E-06
9,50E-06
1,00E-05
0,00E+00 5,00E+05 1,00E+06 1,50E+06 2,00E+06 2,50E+06 3,00E+06 3,50E+06
δv
[m
2/s
]
t [s]
black_1
black_2
white_1
white_2

CHALMERS, Civil and Environmental Engineering, Master’s Thesis 2012:147 54
5 Discussion
The models studied in the study are presented in Table 5.1. The reference wall models were designed considering energy performance of the walls. On one hand, the first alternative wall models were the solution based on the energy performance. On the other hand, the second alternative wall models were the solution related to fire performance.
Table 5.1 Wall models thickness (d).
d_wall [mm]
d_insulation [mm] U-value
[W/m2.K]
∆d [mm]
∆d
[%] Total MW PS AB
WBW_R 262 190 190 - - 0.17 - -
WBW_1 164 92 - - 92 0.17 98 37%
WBW_2 213 141 95 - 46 0.17 49 19%
CBW_R 309 156 - 156
0.2 - -
CBW_1 231 78 - - 78 0.2 78 25%
CBW_2 231 78 - - 78 0.2 78 25%
Where WBW_R Reference wood based wall model WBW_1 First alternative wood based wall model WBW_2 Second alternative wood based wall model CBW_R Reference concrete based wall model CBW_1 First alternative concrete based wall model CBW_2 Second alternative concrete based wall model MW Mineral wool PS Polystyrene AB Aerogel blankets
The structure of the concrete wall before and after adding aerogel blankets did not change. Thus, the final concrete based wall model corresponded to any of the two alternatives concrete based wall models. Concerning to the moisture analysis, as the aerogel blankets vapor permeability has a high value; a vapor barrier should be added in the concrete based wall model when the polystyrene is replaced with aerogel blankets.
In the mineral wool based wall, a minimum mineral wool thickness was needed to protect aerogel blankets from the fire. Therefore, the final wood based wall model corresponded to the second alternative wood based wall model.
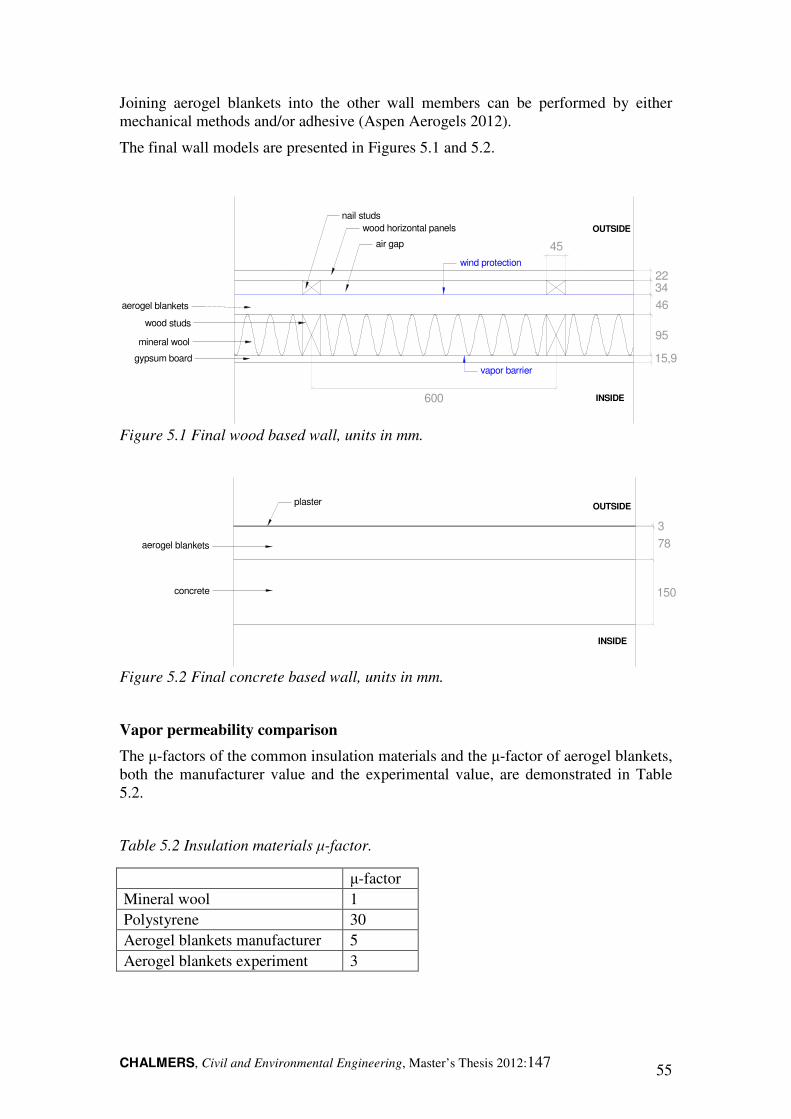
CHALMERS, Civil and Environmental Engineering, Master’s Thesis 2012:147 55
Joining aerogel blankets into the other wall members can be performed by either mechanical methods and/or adhesive (Aspen Aerogels 2012).
The final wall models are presented in Figures 5.1 and 5.2.
600
34
45
nail studs
wood horizontal panels
air gap
gypsum board
OUTSIDE
INSIDE
wind protection
vapor barrier
aerogel blankets
wood studs
mineral wool
46
95
15,9
22
Figure 5.1 Final wood based wall, units in mm.
150
OUTSIDE
INSIDE
plaster
concrete
78
3
aerogel blankets
Figure 5.2 Final concrete based wall, units in mm.
Vapor permeability comparison
The µ-factors of the common insulation materials and the µ-factor of aerogel blankets, both the manufacturer value and the experimental value, are demonstrated in Table 5.2.
Table 5.2 Insulation materials µ-factor.
µ-factor
Mineral wool 1 Polystyrene 30 Aerogel blankets manufacturer 5 Aerogel blankets experiment 3

CHALMERS, Civil and Environmental Engineering, Master’s Thesis 2012:147 56
The µ-factor found after testing aerogel blankets samples was lower than the value given by manufacturer. The difference can be because the experimental value was calculated using results that had not achieved the steady-state yet. The experiment had to be stopped after 38 days because after that time, the mass variations of the specimens became too high. This behavior could have been caused by the large thickness of the air gap which leads to moisture transfer by convection. In the cup method, moisture transport by diffusion should be taken into account.
The used setup should be modified. In the setup, the sample area covered with aluminum paper (69.11 cm2) was in the same order than the sample area free (63.62 cm2), which produced a two-dimension moisture transfer, see Figure 5.3. Thus, there were some water losses in the surface that were not considered in the experimental method. These unknown mass of water losses to the edges was a reason that the experimental vapor permeability (8·10-6 m2/s) was higher than the literature value (5·10-6 m2/s).
The two-dimension moisture transfer of the specimens is illustrated in Figure 5.3.
Figure 5.3 Cup method two-dimension moisture transfer.
Finally, the difference could be also due to dependency of vapor diffusivity and relative humidity. The cup method was performed in a climate room at 50% relative humidity (HR) and inside the cup was considered 100%HR which means that the sample vapor permeability value found correspond to 75%HR. However, the level of relative humidity of the used literature value was not determined.
Cost estimation
A cost estimation was performed. The study was focused on the rental price and the price of the insulation materials. An apartment of four rooms in a multi-family house in Sweden was selected for the study.
As the U-value of the reference wall models and the new wall models was keeping constant, there was no change in the energy consumption. For that reason, the difference between the reference wall models and the new wall models was the wall thickness. In this example the position of the external side of the wall was remained. Accordingly, when the wall thickness was reduced the internal area became larger.

CHALMERS, Civil and Environmental Engineering, Master’s Thesis 2012:147 57
The reference and the new internal areas are illustrated in Figure 5.4. The continuous line ( ) is the external side of the reference and the new models walls, the dotted line (· · ·) is the internal side of the reference walls while the broken line (- - -) is the internal side of the new walls.
reference internal areanew internal area
Figure 5.4 Reference and new internal areas.
The price of renting an apartment of 4 rooms in Sweden is 862SEK/(m2.year) (Ulla Janson 2008). The price of mineral wool is 6.8SEK/(m2.mm_thickness) (Pink Batts 2008), the price of polystyrene is 3.9SEK/(m2.mm_thickness) (Foam Sales 2008) and the price of aerogel blankets is 20SEK/(m2.mm_thickness). In order to simplify the calculations, it was assumed a square apartment with an area of 100m2 and a height of 2.5m. The variation of the rent area was performed in accordance with the reduction of the wall thickness. And the price of the wall insulation material was performed in accordance with the insulation materials used and their thickness.
The results of the wall insulation thickness, the insulation price, the rent area and the rent price per year of the apartments studied are presented in Table 5.3.
Table 5.3 Reference and new apartment information.
Insulation thickness [mm]
Insulation price [SEK]
Rent area [m2]
Rent price [SEK/year]
WA_R 190 (MW) 129200 100 86200 WA_N 95 (MW) + 46 (AB) 158135 101.97 87898 CA_R 156 (PS) 60840 100 86200 CA_N 78 (AB) 158434 103.14 88910
Where WA_R Reference apartment with wood based walls WA_N New apartment with wood based walls CA_R Reference apartment with concrete based walls CA_N New apartment with concrete based walls
CHALMERS, Civil and Environmental Engineering, Master’s Thesis 2012:147 58
The payoff time for using aerogel blankets were calculated and the results are presented in Table 5.4.
Table 5.4 New apartment variations.
∆ insulation thickness [mm]
∆ rent area [m2]
∆ insulation price[SEK]
∆ rent price [SEK/year]
years
WA_N 49 1.97 28935 1698 17 CA_N 78 3.14 97594 2710 36
Aerogel blankets are still expensive in comparison to traditional insulation materials. However, in future the price of aerogel blankets will be reduced and they may be used as the traditional insulation materials. Furthermore, aerogel blankets can be used for specific applications where a limited volume of material is needed.
External fire considerations
A wall exposed to an internal fire was studied in this project. However, in an external wall design, an external fire should be also taken into account. A possible solution could be based on using a facade material satisfying the fire requirements.

CHALMERS, Civil and Environmental Engineering, Master’s Thesis 2012:147 59
6 Conclusions
Aerogel blankets have excellent thermal properties. However, their fire reaction is not so good. The ‘white color’ aerogel blanket had better fire reaction than the ‘black color’ aerogel blanket because of its shorter flaming time. Nevertheless, as the aerogel blanket ignition time is very short, this material could help to further development of the fire. Thus, if aerogel blankets are used in building applications, they should be protected from direct exposure to fire by covering it with other materials with better fire resistance. For instance, in the external non load bearing walls studied, it was required 95 mm of mineral wool in the wood based wall and 55 mm of concrete in the concrete based wall.
Moreover this project suggests that if aerogel blankets are placed in a safe position of the wall the thickness of the wall can be reduced, which can be a very interesting alternative wherever space is an important topic. In the external non load bearing wood based wall studied, a wall thickness reduction of 19 % was possible, while in the concrete based wall the thickness of the wall was reduced by 25 %.
In the ‘gypsum board study’, it was seen that the temperatures of the wall where the gypsum board did not collapse after 1 hour fire exposure were around 2000C lower. However, to guarantee that the gypsum board does not collapse is very difficult since even the gypsum board cannot support its own weight, due to the water evaporation of the gypsum board structure at high temperatures. The study was carried out using constant gypsum board properties. For more accurate results, the temperature dependence of the gypsum board properties should be considered.
The moisture analysis was not performed because the time limitations of the project. Moreover, in the determination of aerogel blankets vapor permeability, the two-dimension moisture transfer of the test specimens made the results were not reliable.
Last but not least, it is important to mention that this project was carried out considering constant energy consumption of the walls and internal fire requirements. To get a more completed and concise picture concerning if aerogel blankets can be used in new construction walls, other performances of the wall should be studied, for instance: heat, moisture, fire and acoustics performances.

CHALMERS, Civil and Environmental Engineering, Master’s Thesis 2012:147 60
7 References
Aerogel.org, Part 1: Samuel Kistler, Inventor of Aerogel. Available from: <http://www.aerogel.org/?p=464>. [27 August 2012].
Aerogel.org, Silica Aerogels. Available from: <http://www.aerogel.org/?p=16>. [27 August 2012].
Aerogel.org, What is Aerogels?. Available from: <http://www.aerogel.org/?p=3>. [27 August 2012].
Aspen Aerogels (2012), Environmental, Health & Safety. Available from: <http://www.aerogel.com/ehs.html#6>. [27 August 2012].
Aspen Aerogels (2012), Spaceloft Aerogel Blanket Insulation, presentation notes distributed at Chalmers University of Technology on 23 May 2012.
Aspen Aerogels, INC., Insulation products. Available from: <http://www.aerogel.com/products/overview-product.html>. [4 February 2012].
Axel Berge & Pär Johansson (2012), Literature Review on Novel Thermal Insulation
Materials and Componets, Report in Building Physics, Chalmers University of technology, Sweden.
Axel Berge, Bijan A. Zarrabi & Carl-Eric Hagentoft (2012), Determination of specific
heat capacity by Transient Plane Source, Proceedings of the 5th International Building Physics Conference, Chalmers University of Technology, Sweden.
BFS 2011:26-5:2, Safety in case of fire: Fire resistance classes and other conditions, BBR-building regulations.
BFS 2011:26-5:5, Safety in case of fire: Protection against the development and
spread of fire and smoke in buildings, BBR-building regulations.
Bijan Adl Zarrabi (1998), Hygro-Elastic Deformation of High Pressure Laminates, Chalmers University of Technology, Sweden.
Björn Sundström (2007), The Development of a European Fire Classification System
for Building Products Test Methods and Mathematical Modelling, Doctoral Thesis, Department of Fire Safety Engineering, Lund University, Sweden.
Cabot Corporation (2011), LumiraTM Aerogel Blanket LB800, Product Data Sheet. [27 August 2012].
Carl Michael Johannesson (1992), Väggar Träbyggnadshandbok 3.
Carl-Eric Hagentoft (2001), Introduction to Building Physics, Studentlitteratur, Lund.
Cement Concrete & Aggregates Australia (2009), SOUND Insulation Properties of
Concrete Walls and Floors. Available from: Cement Concrete & Aggregates Australia Data Sheet. [5 August 2012].
DiversiFoam Products, What Is Extruded Polystyrene Insulation (XEPS)?. Available from: <http://www.diversifoam.com/xeps.htm>. [20 August 2012].
Dyplast products (2011), Expanded versus Extruded Polystyrene. Available from: <http://www.dyplastproducts.com/newsletter/more_xpseps.htm>. [20 August 2012].

CHALMERS, Civil and Environmental Engineering, Master’s Thesis 2012:147 61
EN 1991-1-2:2002, General actions-Actions on structures exposed to fire, European standard.
EN 1995-1-2:2004, Design of timber structures-General-Structural fire design, European standard.
Eurima (2007), U -values for better energy performance of buildings, Eurina publications. Available from: < http://www.eurima.org/uploads/ModuleXtender/Publications/13/EURIMA-ECOFYS_VII_report_p1-651.pdf >. [6 April 2012].
Foam Sales (2008), Extruded Polystyrene Sheets (XPS) Blue board. Available from: < http://www.foamsales.com.au/products/polystyrene/polystyrenesheets/xps/>. [21 September 2012].
Hot Disk Inc. (2007), Specific Heat Application Hot Disk Thermal Constant Analyzer
Software Version 5.9, Instruction Manual.
Industrial Insulation Group, LLC (2012), MinWool-1200® Industrial Board. Available from: IIG Data sheets [5 February 2012].
J. Randall Lawson, William D. Walton, Nelson P. Bryner & Francine K (2005), Estimates of Thermal Properties for Fire Fighters' Protective Clothing Materials, National Institute of Standars and Technology, NIST.
James G. Quintiere (1998), Principles of Fire Behavior, Delmar Publishers.
K. Ghazi Wakili, L. Wullschleger & E. Hugi (2008), ‘Thermal behavior of a steel door frame subjected to the standard fire of ISO 834: Measurements, numerical simulation and parameter study’, Fire Safety Journal, vol. 43, no. 5, pp. 325-333.
LambdaLab LLC, LambdaLab Equipment: Heat Flow Meter. Available from: <http://lambdalab.net/equipment.html>. [25 August 2012].
M. Cagliardi (2009), Aerogels, Report AVM052B, BCC Research.
Martin A. Wilkinson, Thermal Properties of Building Materials, Retired lecture webpage, University of Bath, United Kingdom. Available from: <http://people.bath.ac.uk/absmaw/BEnv1/properties.pdf>. [20 August 2012].
McKinsey&Company (2009), Pathways to a Low-Carbon Economy - Version 2 of the
Global Greenhouse Gas - Abatement Cost Curve.
MPA-The Concrete Centre, Fire resistance. Available from: <http://www.concretecentre.com/technical_information/performance_and_benefits/fire_resistance.aspx>. [7 August 2012].
National Concrete Masonry Association (2010), Thermal Catalog of Concrete
Masonry Assemblies. Available from: NCMA Thermal Catalog. [5 August 2012].
National Gypsum, Gypsum Board Frequently Asked Questions. Available from: <http://www.nationalgypsum.com/resources/faqs/gypboard.htm>. [20 February 2012].
Natural Building Technologies (2009), Breathability Matters: Why the Kingspan
White paper is seriously misleading. Available from: <http://www.natural-building.co.uk/PDF/Breathability-Matters-response-to-Kingspan.pdf>. [9 September 2012].

CHALMERS, Civil and Environmental Engineering, Master’s Thesis 2012:147 62
Netzsch, Thermal Insulation Materials: Material Characterization, Phase Changes,
Thermal Conductivity. Available from: NETZSCH Analyzing & Testing Business Unit. [4 February 2012].
Newkem Products Corporation, Thermal insulation. Available from: <http://www.indiamart.com/newkem/thermal-insulation.html>. [15 August 2012].
Patrick van Hees, Petra Andersson, Maria Hjohlman, Nils Wenne & Mohamed Aly Hassan (2010), ‘Use of the Cone Calorimeter and ConeTools software for development of innovate intumescing graphite systems’, Fire and materials, vol. 34, pp. 367-384.
Peter I. Nabelek, Anne M. Hofmeister & Alan G. Whittington (2012), ‘The influence of temperature-dependent thermal diffusivity on the conductive cooling rates of plutons and temperature-time paths in contact aureoles’, Earth and Planetary
Science Letters, vol. 317-318, pp. 157-164.
Pink Batts (2008), Price List. Available from: <http://www.homeimprovementpages.com.au/creative/brochures/206729/brochure_print.pdf>. [21 September 2012].
Portland Cement Association (2012), Concrete in the Classroom-Lesson 2: What are
the Parts of Concrete?. Available from: <http://www.cement.org/basics/concretebasics_lessontwo.asp>. [7 August 2012].
Portland Cement Association (2012), Stucco. Available from: <http://www.cement.org/stucco/index.asp>. [7 August 2012].
Robert Rosner (1996), MacMillan Encyclopedia of Physics, vol. 4, New York: Simon & Schuster.
Rockwool peninsular, Lana de Roca: Ficha de datos de seguridad. Available from: Rockwool F.D.S. [5 February 2012].
Roxul Inc., Stone wool: Production Process. Available from: <http://www.roxul.com/stone+wool/production+process>. [5 February 2012].
Ruben Baetens, Bjørn Petter Jelle & Arild Gustavsen (2010), ‘Areogel insulation for building applications: A state-of-the-art review’, Energy and Buildings, vol. 43, pp. 761-769.
Saleh A. Al-Ajlan (2006), ‘Measurements of thermal properties of insulation materials by using transient plane source technique’, Applied Thermal
Engineering, vol. 26, pp. 2184-2191.
SP Technical Research Institute of Sweden, European fire classification of materials,
construction products and building elements. Available from: <http://www.sp.se/en/index/information/fireclassification/Sidor/default.aspx>. [10 August 2012].
SP Technical Research Institute of Sweden, Fire resistance classes. Available from: <http://www.sp.se/en/index/services/fire_classes/Sidor/default.aspx>. [10 August 2012].
SP Technical Research Institute of Sweden, Transient Plane Source (TPS). Available from: <http://www.sp.se/en/index/resources/firetechnology/equipment/tps_brk/sidor/default.aspx>. [2 May 2012].
CHALMERS, Civil and Environmental Engineering, Master’s Thesis 2012:147 63
Swedish Wood (2012), Technical Data. Available from: <http://www.swedishwood.com/facts_about_wood/norms_and_standards/technical_data >. [20 April 2012].
Swedish Wood, Swedish Sawn Timber. Available from: <http://www.swedishwood.com/facts_about_wood/wood_industry/swedish_sawn_timber>. [20 April 2012].
Svenskt Trä, Yttervägg med stående panel, TräGuiden. Available from: <http://www.traguiden.se/TGtemplates/popup2spalt.aspx?id=4551&contextPage=5947>. [20 April 2012].
Ulla Janson (2008), Passive houses in Sweden, Lund University, Sweden.
University of South Carolina, Fire Extinguisher Training: The Fire triangle. Available from: <http://ehs.sc.edu/training/Fire/01_triangle.htm>. [20 February 2012].

CHALMERS, Civil and Environmental Engineering, Master’s Thesis 2012:147 64
List of figures
Figure 1.1 Silica aerogels (Aspen Aerogels 2012). ....................................................... 2
Figure 1.2 Aerogel blanket (Aspen Aerogels 2012). ..................................................... 4
Figure 1.3 External insulation (Aspen Aerogels 2012). ................................................ 6
Figure 1.4 Mechanical fix of aerogel blankets in external insulation (Aspen Aerogels 2012). ............................................................................................................................. 6
Figure 2.1: Holometrix Rapid-k apparatus, Chalmers University of Technology. ........ 7
Figure 2.2: Scheme of the Heat flow meter operation ................................................... 8
Figure 2.3 Reference wood based wall, units in mm. .................................................. 10
Figure 2.4 Reference concrete based wall, units in mm. ............................................. 11
Figure 3.1 Fire grow curve. .......................................................................................... 14
Figure 3.2 Steps to follow in TPS method (Chalmers University of Technology TPS apparatus) ..................................................................................................................... 16
Figure 3.3 Cone Calorimeter apparatus, Lund University. .......................................... 18
Figure 3.4 Aerogel blanket samples with aluminum paper. ........................................ 18
Figure 3.5 Sample holder with ceramic wool. ............................................................. 19
Figure 3.6 Radiation versus cone temperature. ............................................................ 19
Figure 3.7 HRR of samples exposed to a 25 kW/m2 radiation. .................................. 22
Figure 3.8 HRR of black samples exposed to different radiations. ............................. 22
Figure 3.9 ‘Black’ and ‘white’ samples after the test. ................................................. 23
Figure 3.10 Symmetry of wood based wall model. ..................................................... 24
Figure 3.11 Simulation wood based wall model, units in mm. .................................... 24
Figure 3.12 Symmetry of wood based wall model, units in mm. ................................ 24
Figure 3.13 Theoretical tempertaure distribution. ....................................................... 35
Figure 3.14 Simulation model geometrical nomenclature. .......................................... 36
Figure 3.15 Steady-state with constant material properties results. ............................. 36
Figure 3.16 Steady-state with temperature dependent material properties results. ..... 37
Figure 3.17 Transient simulation with constant material properties results. ............... 37
Figure 3.18 Transient simulation with temperature dependent material properties results. .......................................................................................................................... 37
Figure 3.19 Transient simulations with temperature dependent material properties temperatures at different times. .................................................................................... 38
Figure 3.20 Temperatures in mineral wool section after 1h. ....................................... 40
Figure 3.21 Temperatures in mineral wool section after 1.5h. .................................... 40
Figure 3.22 Temperatures in mineral wool section after 4h. ....................................... 41

CHALMERS, Civil and Environmental Engineering, Master’s Thesis 2012:147 65
Figure 3.23 Temperature distribution of the reference wood based wall after 1 hour. 42
Figure 3.24 Detail of temperature distribution of the reference wood based wall after 1 hour. ............................................................................................................................. 42
Figure 3.25 Mineral wool Cp sensitive analysis. ......................................................... 43
Figure 3.26 Temperature distribution of the reference concrete based wall after 1 hour. ............................................................................................................................. 44
Figure 3.27 Detail of temperature distribution of the reference concrete based wall after 1 hour. .................................................................................................................. 44
Figure 3.28 Second alternative wood based wall temperature distribution after 1h. ... 45
Figure 3.29 Detail of second alternative wood based wall temperature distribution after 1h. ........................................................................................................................ 46
Figure 3.30 Second alternative concrete based wall temperature distribution after 1h. ...................................................................................................................................... 47
Figure 3.31 Detail of second alternative concrete based wall temperature distribution after 1h. ........................................................................................................................ 47
Figure 4.1 Diffusion of water vapor through a material layer. .................................... 49
Figure 4.2 Cup method. ............................................................................................... 51
Figure 4.3 Cup method dimensions. ............................................................................ 52
Figure 4.4 Cup method samples. .................................................................................. 52
Figure 4.5 Mass variation of Cup method samples. ..................................................... 53
Figure 4.6 Vapor permeability coefficient of Cup method samples. ........................... 53
Figure 5.1 Final wood based wall, units in mm. .......................................................... 55
Figure 5.2 Final concrete based wall, units in mm. ..................................................... 55
Figure 5.3 Cup method two-dimension moisture transfer. .......................................... 56
Figure 5.4 Reference and new internal areas. .............................................................. 57

CHALMERS, Civil and Environmental Engineering, Master’s Thesis 2012:147 66
List of tables
Table 2.1 Experimental λ of black and white aerogel blanket samples [W/m.K]. ........ 9
Table 2.2 Thermal conductivity of insulation materials. ............................................... 9
Table 2.3 Reference walls and first walls thicknesses ................................................. 12
Table 3.1 Experimental Cp of aerogel blanket samples at 230C .................................. 17
Table 3.2 Cone calorimeter tests .................................................................................. 20
Table 3.3 Ignition and stop flaming times. .................................................................. 21
Table 3.4 Aerogel blankets thermal conductivity ........................................................ 25
Table 3.5 Aerogel blankets heat capacity. ................................................................... 26
Table 3.6 Mineral wool thermal conductivity. ............................................................. 27
Table 3.7 Polystyrene thermal conductivity. ............................................................... 28
Table 3.8 Wood density. .............................................................................................. 29
Table 3.9 Wood thermal conductivity. ........................................................................ 30
Table 3.10 Wood heat capacity. ................................................................................... 30
Table 3.11 Concrete density. ....................................................................................... 31
Table 3.12 Concrete heat capacity. .............................................................................. 32
Table 3.13 Gypsum board properties. .......................................................................... 32
Table 3.14 Plaster properties. ....................................................................................... 33
Table 3.15 Material properties characteristics. ............................................................ 33
Table 3.16 Heat flux in mineral wool section (W/m2). ................................................ 39
Table 3.17 Mineral wool Cp sensitive analysis results. ............................................... 43
Table 3.18 Reference walls and second alternative walls thicknesses. ....................... 48
Table 4.1 Insulation materials µ-factor. ....................................................................... 50
Table 4.2 Cup method samples initial weights. ........................................................... 52
Table 4.3 Cup method results. ..................................................................................... 53
Table 5.1 Wall models thickness (d). ........................................................................... 54
Table 5.2 Insulation materials µ-factor. ....................................................................... 55
Table 5.3 Reference and new apartment information. ................................................. 57
Table 5.4 New apartment variations. ........................................................................... 58

CHALMERS, Civil and Environmental Engineering, Master’s Thesis 2012:147 67
Appendix A: HRR results
0
10
20
30
40
50
60
70
0 50 100 150 200 250 300 350 400
HR
R[k
W/m
2]
t[s]
HRR of samples exposed to 15 kW/m2 cone radiation
white
black
0
10
20
30
40
50
60
70
0 50 100 150 200 250 300 350
HR
R[k
W/m
2]
t[s]
HRR of samples exposed to 20 kW/m2 cone radiation
white
black
0
10
20
30
40
50
60
70
80
0 50 100 150 200 250 300 350 400
HR
R[k
W/m
2]
t[s]
HRR of samples exposed to 25 kW/m2 cone radiation
white 1
white 2
black 1
black 2

CHALMERS, Civil and Environmental Engineering, Master’s Thesis 2012:147 68
0
5
10
15
20
25
30
35
40
0 50 100 150 200 250 300 350
HR
R[k
W/m
2]
t[s]
HRR of 'white' samples exposed to different cone radiation
15 kw/m2
17 kw/m2
20 kw/m2
25 kW/m2 (1)
25 kW/m2 (2)
35 kW/m2
0
10
20
30
40
50
60
70
80
0 50 100 150 200 250 300 350 400
HR
R[k
W/m
2]
t[s]
HRR of 'black' samples exposed to different cone radiation
15 kw/m2
20 kw/m2
25 kW/m2
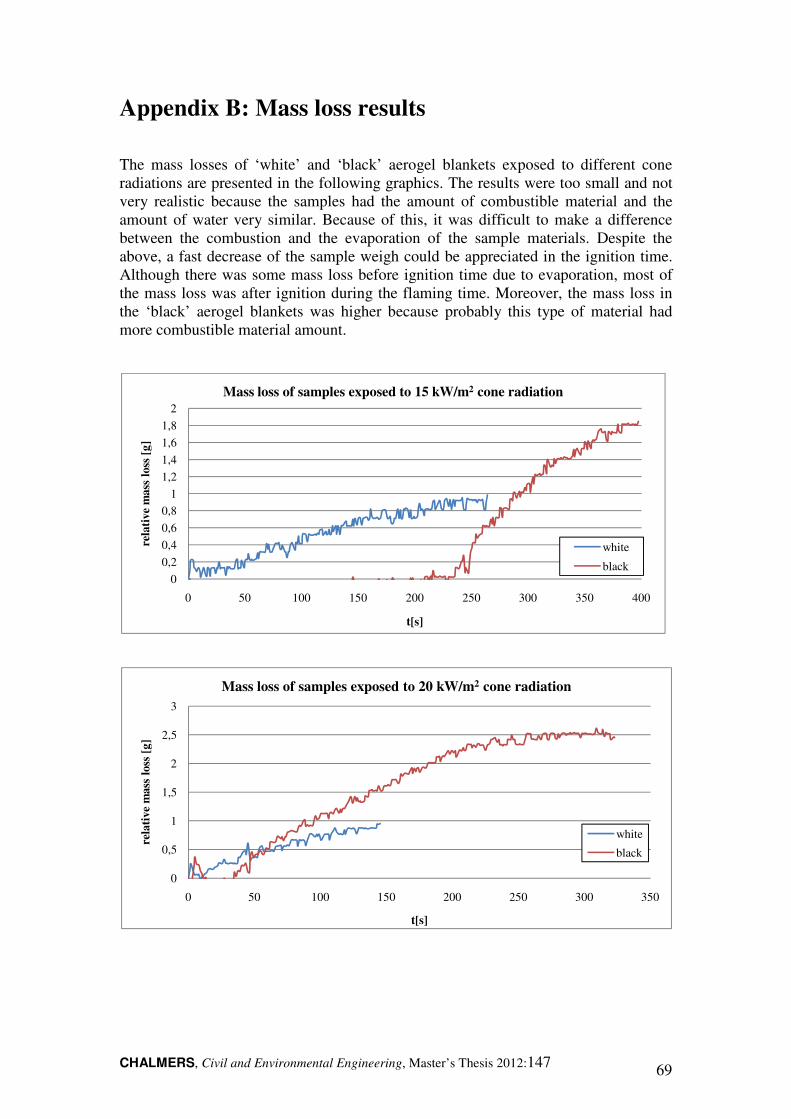
CHALMERS, Civil and Environmental Engineering, Master’s Thesis 2012:147 69
Appendix B: Mass loss results
The mass losses of ‘white’ and ‘black’ aerogel blankets exposed to different cone radiations are presented in the following graphics. The results were too small and not very realistic because the samples had the amount of combustible material and the amount of water very similar. Because of this, it was difficult to make a difference between the combustion and the evaporation of the sample materials. Despite the above, a fast decrease of the sample weigh could be appreciated in the ignition time. Although there was some mass loss before ignition time due to evaporation, most of the mass loss was after ignition during the flaming time. Moreover, the mass loss in the ‘black’ aerogel blankets was higher because probably this type of material had more combustible material amount.
0
0,2
0,4
0,6
0,8
1
1,2
1,4
1,6
1,8
2
0 50 100 150 200 250 300 350 400
rela
tive
mass
loss
[g
]
t[s]
Mass loss of samples exposed to 15 kW/m2 cone radiation
white
black
0
0,5
1
1,5
2
2,5
3
0 50 100 150 200 250 300 350
rela
tive
mass
loss
[g
]
t[s]
Mass loss of samples exposed to 20 kW/m2 cone radiation
white
black

CHALMERS, Civil and Environmental Engineering, Master’s Thesis 2012:147 70
0
0,5
1
1,5
2
2,5
3
3,5
4
0 50 100 150 200 250 300 350 400 450
rela
tive
mass
loss
[g
]
t[s]
Mass loss of samples exposed to 25 kW/m2 cone radiation
white 1
white 2
black 1
black 2

CHALMERS, Civil and Environmental Engineering, Master’s Thesis 2012:147 71
Appendix C: Back temperature results
The temperatures of the back side of the samples tested in the Cone Calorimeter method are presented in the following graphics. The temperature results are from the exposure beginning to the stop flaming time of the samples.
0
50
100
150
200
250
300
0,00 0,50 1,00 1,50 2,00 2,50 3,00 3,50 4,00 4,50
T[0
C]
time [min]
Back temperature of white sample exposed to 15 kW/m2 cone
radiation
white
25
27
29
31
33
35
37
39
0,00 0,05 0,10 0,15 0,20 0,25 0,30 0,35 0,40 0,45 0,50
T [
0C
]
time [min]
Back temperature of white sample exposed to 17 kW/m2 cone
radiation
white
ignition time

CHALMERS, Civil and Environmental Engineering, Master’s Thesis 2012:147 72
25
27
29
31
33
35
37
39
41
43
0,00 0,10 0,20 0,30 0,40 0,50 0,60
T[0
C]
time [min]
Back temperature of white sample exposed to 20 kW/m2 cone
radiation
white
ignition time
25
75
125
175
225
275
325
375
425
0,00 1,00 2,00 3,00 4,00 5,00 6,00 7,00 8,00
T[0
C]
time [min]
Back temperature of black sample exposed to 15 kW/m2 cone
radiation
black
ignition time
25,00
75,00
125,00
175,00
225,00
275,00
325,00
375,00
425,00
475,00
0,00 1,00 2,00 3,00 4,00 5,00
T[0
C]
time [min]
Back temperature of black sample exposed to 20 kW/m2 cone
radiation
black
ignition time