Embed Size (px)
Citation preview
ASTRONOMY & ASTROPHYSICS DECEMBER I 1998, PAGE 271
SUPPLEMENT SERIES
Astron. Astrophys. Suppl. Ser. 133, 271–284 (1998)
The beam pattern of the IRAM 30–m telescope
(a reflector with several surface error distributions)
A. Greve1, C. Kramer2,3, and W. Wild2
1 IRAM, 300 rue de la Piscine, Domaine Universitaire, F–38406 St. Martin d‘Heres, France2 IRAM, Nucleo Central, Avda. Divina Pastora 7, E–18012 Granada, Spain3 I. Physikalisches Institut, Universitat zu Koln, Zulpicher Straße 77, D–50937 Koln, Germany
Received July 28, 1997; accepted June 11, 1998
Abstract. Total power scans across the Moon around NewMoon (mostly day time) and Full Moon (night time) at3.4 mm (88 GHz), 2.0 mm (150 GHz), 1.3 mm (230 GHz),and 0.86 mm (350 GHz) wavelength are used to derive thebeam pattern of the IRAM 30–m telescope to a level ofapproximately −30 dB (0.1%) and, dependent on wave-length, to a full width of 1000 − 1400′′. From the reflec-tor surface construction and application of the antennatolerance theory we find that the measurable beam con-sists of the diffracted beam, two underlying error beamswhich can be explained from the panel dimensions, anda beam deformation mostly due to large–scale transientresidual thermal deformations of the telescope structure.In view of the multiple beam structure of the 30–m tele-scope, and of other telescopes with a similar reflectorconstruction of (mini–)panels and panel frames, we sum-marize the antenna tolerance theory for the influence ofseveral independent surface/wavefront deformations. Thistheory makes use of different correlation lengths, which inessence determine the independent error distributions, andof the wavelength–scaling of the diffracted beam and of theerror beams.
From the Moon scans we derive the parameters forcalculation of the 30–m telescope beam in the wavelengthrange 3 mm to 0.8 mm as required for the reduction of as-tronomical observations, in particular of extended sources.The parameters of the beam are primarily for the time af-ter July 1997 when the reflector was re–adjusted and im-proved to the illumination weighted surface precision ofσT = 0.065− 0.075 mm.
In the Appendix we explain the choice for this analysisof scans taken around New Moon and Full Moon.
Key words: telescopes
Send offprint requests to: A. Greve
1. Introduction
Observations with a single dish radio telescope are madewith a finite size beam of which the theoretical pattern isoften degraded by imperfections of the telescope, primarilydeformations of the main reflector surface. A knowledgeof the actual beam profile is required for the reductionof astronomical observations and estimates of a possibleimprovement of the telescope. The theoretical beam pat-tern can be calculated from the Theory of Physical Optics(Born & Wolf 1980; Love 1978; Christiansen & Hogbom1985; Kraus 1986); the beam degradation can be calcu-lated from the Theory of Aberrations (Born & Wolf 1980)and the Antenna Tolerance Theory (Scheffler 1962; Ruze1952, 1966; Shifrin 1971; Baars 1973), both specified bya few basic parameters which must be determined frommeasurements of the wavefront error topography or thebeam pattern itself. The wavefront (reflector surface) er-ror topography can be derived, for instance, from hologra-phy measurements (Morris et al. 1988; Whyborn & Morris1995); the actual beam pattern can also be derived, for in-stance, from scans across a strong point–like radio sourceor a satellite beacon, or from scans across the limb of theMoon and the Sun (Horne et al. 1981; Lindsey & Roellig1991). The measured beam pattern reveals, in general,the influence of spatially large–scale and small–scale wave-front deformations. Large–scale deformations distort thecentral part of the beam; small–scale deformations pro-duce one, or several, underlying, extended error beams.We analyze total power scans across the Moon at 3.4 mm(88 GHz), 2.0 mm (150 GHz), 1.3 mm (230 GHz), and0.86 mm (350 GHz) wavelength, and provide in addition tothe earlier investigation of Garcia–Burillo et al. (1993) theparameters of an analytic expression of the IRAM 30–mtelescope beam as required for the reduction of astronom-ical observations, in particular of extended sources. (Fora description of the 30–m telescope and its behaviour see
272 A. Greve et al.: The beam pattern of the IRAM 30–m telescope
Baars et al. (1987, 1994) and Greve et al. (1993, 1996a,1998)).
This publication consists of two parts. The first partexplains the theory of beam degradation from several sur-face error distributions, and we confirm this theory withmulti–wavelength beam patterns of the 30–m telescopederived from Moon limb scans observed before July 1997(Sects. 2,3). The second part explains the result of thelatest surface adjustment (July 1997), and we provide thecurrent parameters for calculation of the 30–m telescopebeam (Sects. 4–6). In detail, Sect. 2 summarizes the an-tenna tolerance theory for a combination of several large–scale and small–scale wavefront (reflector surface) defor-mations, as appropriate for the understanding of the 30–mtelescope and other telescopes of similar reflector design.In this theory we use the deformation correlation length(s)to anticipate the structure of the degraded beam from de-tails of the reflector surface construction. We explain inSects. 3.1–3.3 how we derive in an empirical way the para-meters of the degraded beam from the comparison of ob-served and calculated scans across the limb of the Moon,taken around New Moon (mostly day time) and Full Moon(night time). In particular we confirm the wavelength scal-ing of the error beam(s). In Sect. 3.4 we show the reflec-tor surface error correlation function, derived from holog-raphy measurements, which confirms in an independentway the correlation lengths used in the analysis of theMoon scans. We explain in Sect. 3.5 in which way thestandard Ruze relation is modified for the case of severalerror distributions. In Sect. 4 we explain the surface preci-sion obtained from the July 1997 panel frame adjustment(Morris et al. 1996, 1997). Sect. 5 shows the current beampatterns of the 30–m telescope at 3.4 mm, 2.0 mm, and1.3 mm, and Sect. 6 gives the current telescope efficiencies.In the Appendix we explain our choice of scans aroundNew Moon and Full Moon. We follow the notation usedby Downes (1989) and used at the 30–m telescope (seeMauersberger et al. 1989).
2. Terminology and theory
2.1. The structure of the beam pattern
The directional response, i.e. the beam F = Fc + Fe of asingle dish radio telescope consists of the diffracted beamFc, formed by coherently focused radiation, and the errorbeam(s) Fe, formed by radiation “scattered” towards thefocal plane. The diffracted beam Fc = Fmb + F sl consistsof the main beam Fmb and sidelobes F sl. The diffractedbeam of a perfect, circular reflector of diameter D (withvertex hole, shadowing from the subreflector and its sup-port, illumination taper of the receiver etc.) is a taperedAiry–type pattern AT with components AT = AT,mb +AT,sl. For a shallow, perfect, full aperture, non–taperedreflector the diffracted beam is A(u) = [J1(u)/u]2 with J1
the Bessel function of first order and u the spatial coordi-nate of the focal plane (Born & Wolf 1980). The steepnessof a radio reflector and the illumination taper preserves toa large extent the sidelobe structure of the Airy pattern(Minnett & Thomas 1968; Goldsmith 1987; see Sect. 5),however, the sidelobe levels are made by purpose signi-ficantly lower than those of the non–tapered beam. Thewidth (FWHP) of the main beam AT,mb is
θb = kλ/D [rad] (1)
with k (1 ≤ k <∼ 1.4) a factor dependent on the illumina-tion taper and blockage of the aperture (Christiansen &Hogbom 1985; Kraus 1986). Measurements with the 30–mtelescope and current SIS receivers of ∼ −13 dB Gaussianedge taper give k = 1.16 for 0.8 mm <∼ λ <∼ 3 mm (Kramer1997).
We assume in the following that the beam is degradedby phase perturbations of the wavefront δϕ ≈ 2 (2π/λ)δwhich are primarily due to deformations δ of the mainreflector surface. For a good quality telescope we may as-sume also that the phase perturbations are small com-pared to the wavelength so that the resulting beam degra-dation is the sum of the individual degradations (seeShifrin 1971; Sect. 2.4). In addition we assume that themain reflector surface is constructed from a large numberof panels. Large–scale surface deformations, which do notchange significantly over several panel areas or a consider-able fraction of the reflector surface, degrade the diffrac-tion pattern but preserve, in general, the main beam andsidelobe structure. Small–scale wavefront deformations,which change significantly over single panel areas or panelsub–sections, produce the underlying error beams. Surfacedeformations which change over distances of wavelengthsbehave like rough surfaces, and are discussed in opticaljournals.
Different mathematical formalisms are used to calcu-late the beam degradation from spatially large–scale andsmall–scale wavefront deformations.
2.2. Large–scale deformations
Large–scale deformations, which often appear as system-atic deformations, are described by combinations of loworder Zernike polynomials Zij (i <∼ 10, j <∼ 10)
δ =∑
i,jaijZij =
∑i,jaijRi(ρ)cos(jψ) (2)
(with Ri functions of the normalized aperture radius ρ,ψ the azimuth angle of the aperture, and aij the ampli-tude of component (ij)) (Born & Wolf 1980; Greve et al.1996b), or other orthogonal functions for decompositionof wavefront deformations (Smith & Bastian 1997). Thecorresponding, degraded, tapered beam pattern Zc,T hasa main beam and sidelobes, and can be calculated ex-actly from diffraction theory. Well known examples are

A. Greve et al.: The beam pattern of the IRAM 30–m telescope 273
defocus (Z10, Z20), coma (Z31), and astigmatism (Z22).These deformations are sometimes due to misalignedcomponents, for instance a misaligned subreflector or amisaligned receiver.
2.3. Small–scale deformations
Small–scale random1 deformations of the reflector surfaceare characterized by the (root mean square) rms–valueσ and the spatial correlation function Cδ(d) (0 ≤ d ≤D)2. For a reflector surface sampled at a large number ofpositions (n = 1, 2, ..., K; with K a few hundred), therms–value is
σ2 =∑
n=1,K(δn)2/K,
∑δn = 0 (3)
for deformations δn measured in the normal direction ofthe best–fit reflector surface. The quantity σ is the geomet-rical rms–value of the surface errors (Greve & Hooghoudt1981). The rms–value σϕ of the associated wavefront de-formation (including a factor 2 because of reflection) is
σϕ = R (4π/λ)σ = 2Rk σ = 2 k σT, k = 2π/λ (4)
with the reduction factor R = 0.8− 0.9 for a steep radioreflector of focal ratio N = F/D ≈ 0.3 and a − 10 dB to−15 dB edge taper of the illumination. σT = Rσ is thetapered, or illumination weighted, rms–value of the surfaceerrors (Greve & Hooghoudt 1981) as derived, for instance,from aperture efficiency and holography measurements.The normalized correlation function Cδ(d) with Cδ(0) = 1is
Cδ(d) =
[∑(1,2)
δ(r1)δ(r2)/N1,2
]/σ2 = C+
δ /σ2 (5)
with the summation (1,2) extending over the number N1,2
of pairs (r1, r2) [r = (x, y)] of positions in the aperture(A) with separation
|r1 − r2| = d ≤ D. (6)
The correlation function of the corresponding wavefrontdeformations [δϕ] is
Cϕ(d) =
[∑(1,2)
δϕ(r1)δϕ(r2)/N1,2
]/σ2
ϕ = C+ϕ /σ
2ϕ (7)
with Cϕ ≈ Cδ. The degraded beam pattern at the positionu = (u, v) of the focal plane is (Scheffler 1962)
F(θ) ≡ F(u) ∝
1 We exclude small–scale periodic deformations which act likegratings (for instance warped panels, regular surface ripplesfrom machining, etc.), although such deformations occasionallydo occur. The grating theory of a paneled reflector surface isnot available; however, some special investigations have beenpublished (Cortes–Medellin & Goldsmith 1994; Hills & Richer1992; Harris et al. 1997).
2 The values σ and Cδ can also be calculated for large–scaledeformations, however, they do not always contain a physicalmeaning as for small–scale random deformations (Greve 1980).
exp[−(σϕ)2]
∫ ∫A
dS1dS2exp[C+ϕ (d)]exp[iku(r1−r2)/f ](8)
with dSi = (dxdy)i a surface element of the aperture (A).The angular distance θ from the focal axis of the positionu = (u, v) is θ =
√u2 + v2/f [rad], with f the effective
focal length of the telescope. In order to obtain an ana-lytic expression of Eq. (8), it has been assumed (Scheffler1962; Ruze 1966; Shifrin 1971; see the criticism/supportby Schwesinger 1972; Greve et al. 1994a) that3
Cδ(d) ≈ Cϕ(d) ∝ exp[−(d/L)2] (9)
with L the correlation length4 of the deformations [δ].Under the assumption of a Gaussian correlation lengthdistribution (Eq. (9)), the degraded beam pattern F(θ) iscircular symmetric and
F(θ) = Fc(θ) + Fe(θ)
= exp[−(σϕ)2]AT(θ) + ae exp[−(πθL/2λ)2] (10)
with
ae = (L/D)2[1− exp[−(σϕ)2]]/ε0 (11)
for σϕ <∼ 1 (Scheffler 1962; Ruze 1966; Vu 1969; Baars1973) as existing on a good quality telescope. ε0 is theaperture efficiency at long wavelengths. The normalizationis F(θ = 0) = 1 for σ = 0 (which implies L = 0). The width(FWHP) of the error beam is
θe = 0.53λ/(L/2) [rad]. (12)
This tolerance theory of a single small–scale error distribu-tion [δ] with correlation length L, as discussed in the basicpublication of Scheffler (1962), Ruze (1966), and Robieux(1966), is verified by a large number of investigations ofoptical telescopes and radio telescopes (see in particularRuze 1966; Vu 1970a)5.
2.4. The combination of small–scale and large–scalesurface deformations
It is reasonable to assume that a paneled reflector surfacemay have several independent error distributions [δi] with
3 Shifrin (1971) analyzes also the exponential correlationlength distribution; however, arguments are given that theGaussian correlation length distribution represents the morerealistic case.
4 L = 2c, with c the correlation radius (Ruze 1966; Baars1973).
5 The term Fc(θ) of Eq. (10) was first derived by Vaisala(1922) to quantify the precision of optical surfaces. The termwas re–discovered by Marechal (1947), Scheffler (1962), Ruze(1966), Robieux (1966), and others, however, with the under-standing of being valid only in the case of an uncorrelated errordistribution (L = 0). Nevertheless, this term is frequently usedin efficiency calculations although, apriori, being correct onlyin case of uncorrelated errors (see Sect. 3.5).The derivation of the beam pattern Eq. (8) is valid for a shallowreflector as used in optical telescopes. However, Eq. (10) canalso be used for a steep radio reflector in case the appropriatediffraction pattern AT is used (see Sect. 5).

274 A. Greve et al.: The beam pattern of the IRAM 30–m telescope
different rms–values [σi] and different correlation lengths[Li]. The surface of the IRAM 30–m reflector6 containsindependent large–scale and small–scale errors of whichthe characteristic correlation lengths are anticipated fromthe mechanical construction.
The surface of the 30–m reflector consists of 7 rings ofpanel frames (in total 210) with each frame holding twopanels. A panel (average size ∼ 1 × 2 meter) is attachedto its frame by 15 screws, arranged in 5 parallel rows withapproximately 1/4 × 2 m ≈ 0.5 m spacing. These sup-port screws were used to adjust the panel contours to anaverage precision σp ≈ 0.03 mm, as measured in the fac-tory (Baars et al. 1987). From the geometry of the panelsupport and contour maps of the panel surfaces (Fig. 1)as measured in the factory, we anticipate that the resid-ual deformations of the adjustments have a correlationlength Lp of approximately 1/4 length of a panel, so thatLp = 0.3 − 0.5 m and Lp/D ≈ 1/75. The width of theanticipated error beam is θe,p ≈ 75 θb (Eqs. (1, 12)).
A panel frame (average size ∼ 2 × 2 meter) is at-tached to the backstructure by adjustment screws locatedat the four frame corners. A panel frame which is mis-aligned in piston and/or tilt represents a surface area ofcorrelated deformations. The weighted distance betweenthe centers of adjacent panel frames gives the correlationlength La = 1.5− 2.0 m so that La/D ≈ 1/17. The widthof the anticipated error beam is θe,a ≈ 17 θb (Eqs. (1, 12)).
For two independent small–scale surface error distribu-tions [δ1] and [δ2], with Gaussian correlation length dis-tributions L1 and L2, the effective surface rms–value σ is(see Eq. (3))
σ2 =∑
(δ1,n + δ2,n)2/K
=∑
(δ1,n)2/K +∑
(δ2,n)2/K = σ21 + σ2
2 (13)
since∑δ1,nδ2,n = 0. The correlation function of the com-
bined error distribution [δ] = [δ1] + [δ2] is
Cδ(d) = [C+δ,1(d) + C+
δ,2(d)]/[σ21 + σ2
2 ]
∝∑
i=1,2exp[−(d/Li)
2]/∑
σ2i . (14)
When using the correlation function of the correspondingwavefront deformation (see Eq. (7)) in Eq. (8) under theassumption that the phase rms–values σϕ,i are small sothat the integral can be split into the sums of the individ-ual contributions, i.e.
F(θ)=exp[−∑i
(σϕ,i)2]
∫∫dS1dS2exp[
∑i
C+ϕ,i(d)]exp[...]
6 The subreflector of the 30–m Cassegrain telescope and theNasmyth mirrors may have additional surface errors. However,in general, these mirrors are more precise than the main reflec-tor, and thus may be neglected (see Rush & Wohlleben 1982).For other reflectors with several error distributions see, for in-stance, the Itapetinga 14–m telescope (Kaufmann et al. 1987)and the JCMT 15–m telescope (Hills & Richer 1992; Prestage1993).
Fig. 1. Surface contours as measured in the factory of five ran-domly selected panels. The dots show the positions of the ad-justment screws; the circles illustrate the size of a correlationcell of Lp = 0.3 − 0.5 m diameter as the influence area of anadjustment screw. Contour levels at 0.015 mm
Fig. 2. Total power scans across the Moon. The 3.4 mm obser-vation (thick line) was made 0.5 days after New Moon (6 Sep.1994); the 0.86 mm observation (thin line) was made 4 daysbefore New Moon (5 Mar. 1997). Note the decrease in sharp-ness of the limb with decreasing wavelength. (The structure ofthe 3.4 mm scan shows features of the Moon’s surface)
≈∑
iexp[−(σϕ,i)
2]
∫ ∫dS1dS2exp[C+
ϕ,i(d)]exp[...] (15)
then the beam pattern degraded by several independentsmall–scale deformations [δi] with Gaussian correlationlength distributions [Li] (Eq. (14)) is
F(θ) = exp[−(σϕ)2]AT(θ)+∑
iae,iexp[−(πθLi/2λ)2](16)
where the amplitude ae,i = (Li/D)2[1− exp[−(σϕ,i)2]]/ε0
(Eq. (11)) of the error beam [i] is related only to therms–value σi and the correlation length Li of the er-ror distribution [δi]. Equivalent to Eq. (13), in Eq. (16)σϕ
2 =∑
(σϕ,i)2. For a rigorous discussion of several
small–scale error distributions, the proofs of Eq. (14) and
A. Greve et al.: The beam pattern of the IRAM 30–m telescope 275
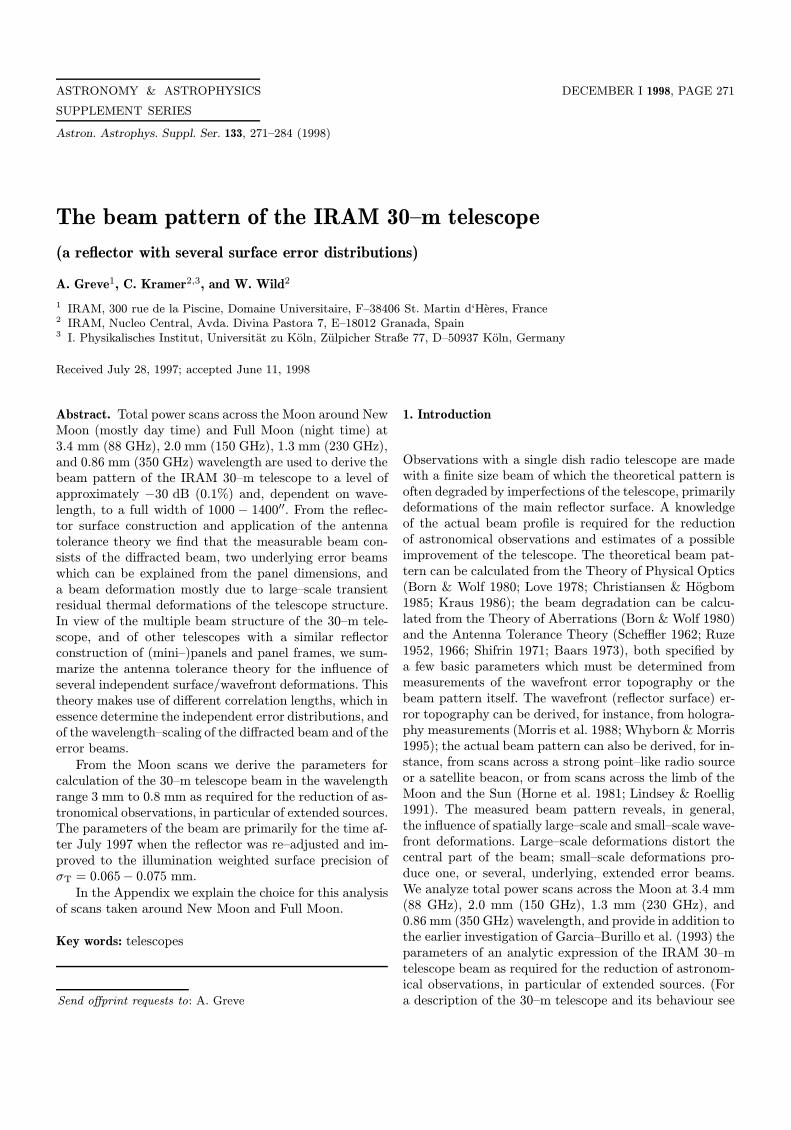
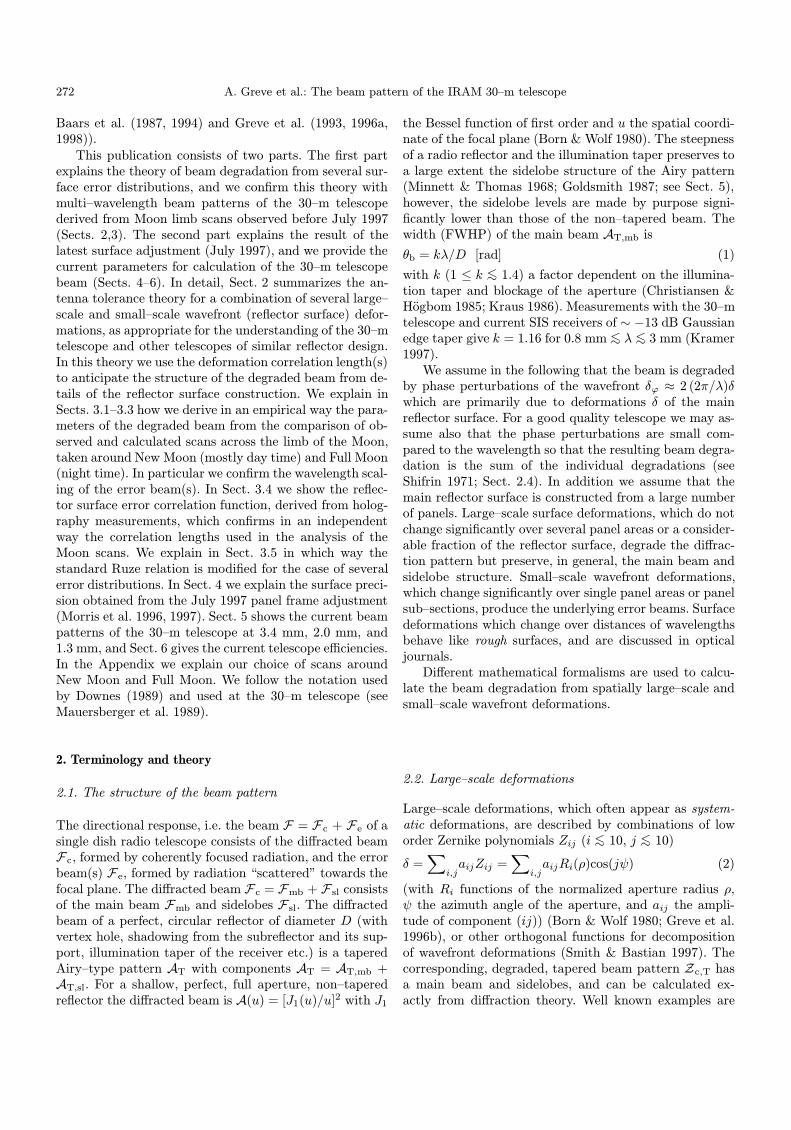
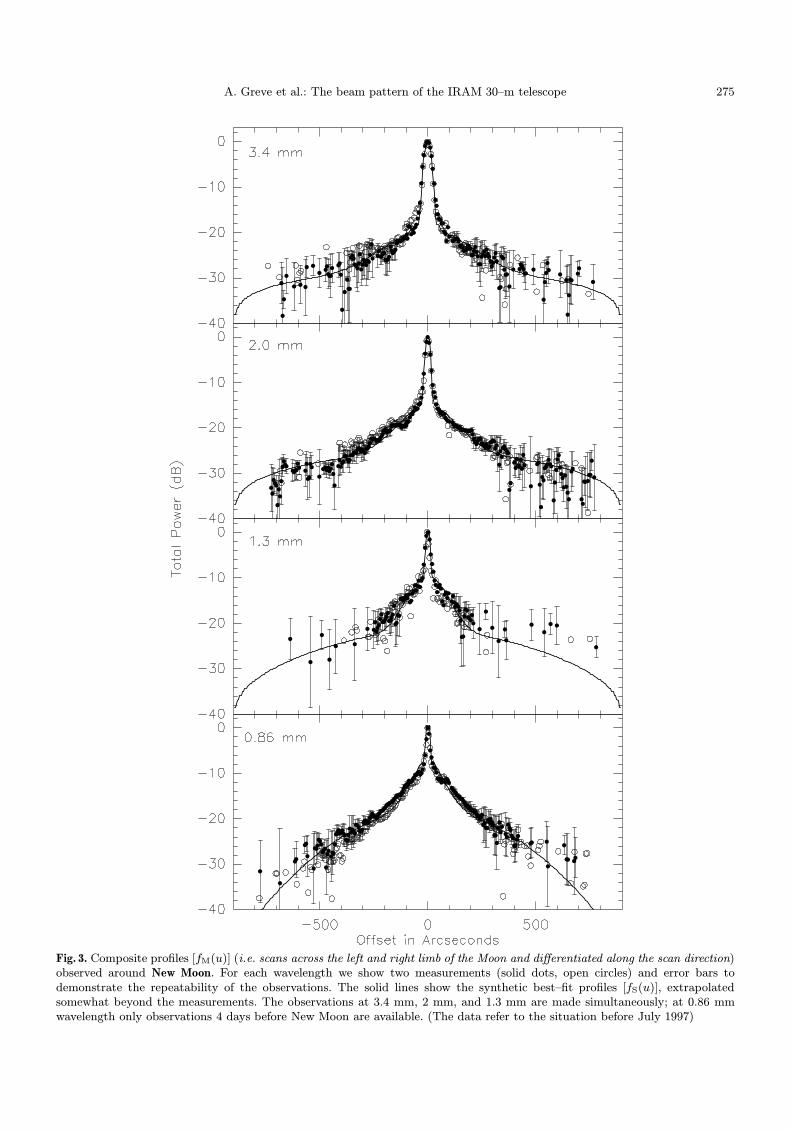
Fig. 3. Composite profiles [fM(u)] (i.e. scans across the left and right limb of the Moon and differentiated along the scan direction)observed around New Moon. For each wavelength we show two measurements (solid dots, open circles) and error bars todemonstrate the repeatability of the observations. The solid lines show the synthetic best–fit profiles [fS(u)], extrapolatedsomewhat beyond the measurements. The observations at 3.4 mm, 2 mm, and 1.3 mm are made simultaneously; at 0.86 mmwavelength only observations 4 days before New Moon are available. (The data refer to the situation before July 1997)
276 A. Greve et al.: The beam pattern of the IRAM 30–m telescope
Eq. (16), and the validity of relation (15) see Shifrin (1971,chapter 5).
Following the explanation of Sect. 2.2, additionallarge–scale deformations cover areas of several panelframes so that their correlation length is, say, Ll ≈ 5 La.The width of the anticipated error beam is θe,l ≈ 5 θb
(Eqs. (1, 12)). For large–scale deformations the diffractionpattern AT of Eq. (16) is replaced by the correspondinglow order Zernike polynomial diffraction pattern Zc,T, forinstance a comatic or astigmatic beam.
3. The IRAM 30–m telescope beam structure
We analyze multi–wavelength beam profiles of the 30–mtelescope obtained from Moon limb scans, and demon-strate that the antenna tolerance theory of several errordistributions explained above gives consistent results forthe beam structure and the efficiencies.
3.1. Measurements
We applied the method of total power Moon limb scans toderive the beam at 3.4 mm, 2 mm, 1.3 mm, and 0.86 mmwavelength, using SIS receivers of 500 MHz bandwith andsimilar Gaussian illumination of ∼ −13 dB edge taper.The scans of 3600′′ length, across the Moon of ∼ 1800′′
diameter, allow an investigation of the beam to a distanceof ∼ ± 900′′ from the beam axis. After focusing the tele-scope, the data of a scan were taken on–the–fly in 120 s ata spatial resolution of 6′′ (200 ms sampling rate). Linearbaselines, determined at the outermost ±30′′, were sub-tracted from the scans. The observations were made undervery stable atmospheric conditions so that the measure-ments are reliable to a level of approximately −30 dB, i.e.∼0.1% of the peak intensity7. The measurements weremade at intermediate elevations where the homology de-formations of the reflector are small (Greve et al. 1998).For the analysis we have taken scans around New Moon(mostly day time) and Full Moon (night time) which pro-vide for the analysis the advantage of a simple brightnessdistribution of the Moon (Sect. 3.2, Appendix), and alsothe possibility to investigate the day and night time per-formance of the telescope.
Figure 2 shows a 3.4 mm and a 0.86 mm total powerscan across the Moon, taken around New Moon. The dis-tortion of the intrinsically sharp limb is due to the finitebeam of the telescope.
3.2. Moon scans and profiles
Within the limitations of the antenna tolerance theory, thebeam pattern (Eq. (16)) is circular symmetric so that any
7 Except the measurements at 1.3 mm wavelength (Fig. 3)made with a noisier receiver.
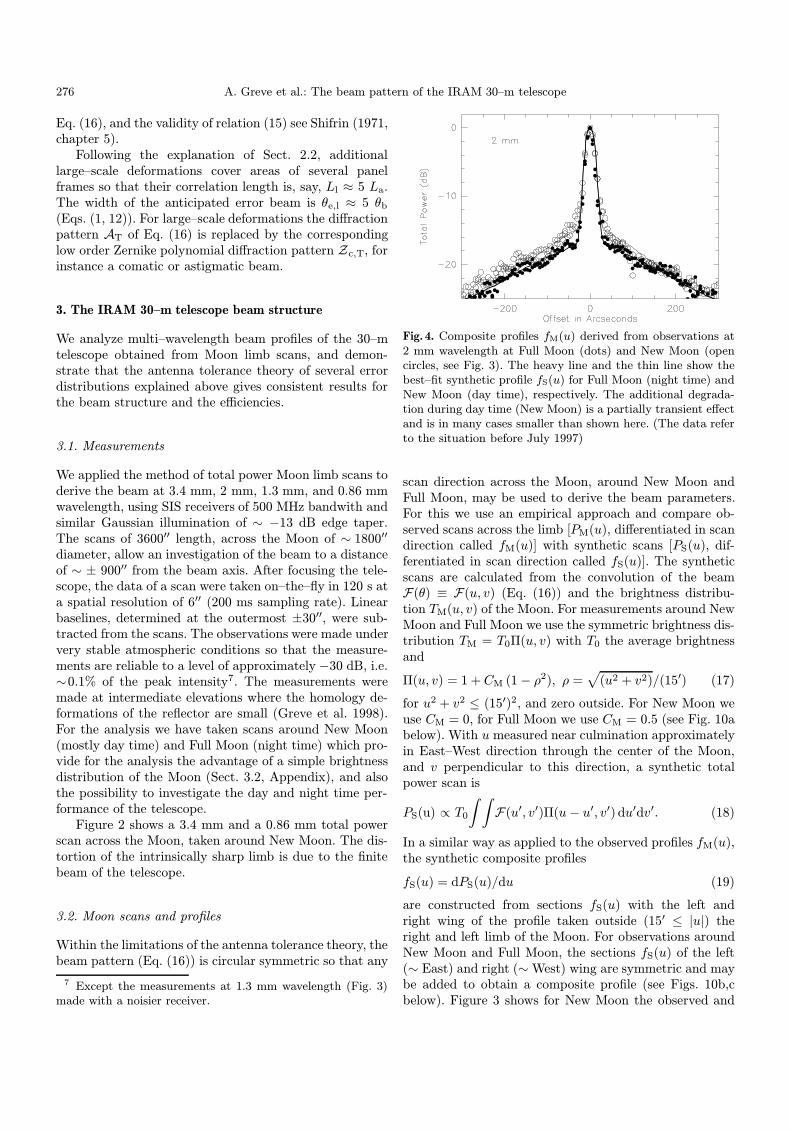
Fig. 4. Composite profiles fM(u) derived from observations at2 mm wavelength at Full Moon (dots) and New Moon (opencircles, see Fig. 3). The heavy line and the thin line show thebest–fit synthetic profile fS(u) for Full Moon (night time) andNew Moon (day time), respectively. The additional degrada-tion during day time (New Moon) is a partially transient effectand is in many cases smaller than shown here. (The data referto the situation before July 1997)
scan direction across the Moon, around New Moon andFull Moon, may be used to derive the beam parameters.For this we use an empirical approach and compare ob-served scans across the limb [PM(u), differentiated in scandirection called fM(u)] with synthetic scans [PS(u), dif-ferentiated in scan direction called fS(u)]. The syntheticscans are calculated from the convolution of the beamF(θ) ≡ F(u, v) (Eq. (16)) and the brightness distribu-tion TM(u, v) of the Moon. For measurements around NewMoon and Full Moon we use the symmetric brightness dis-tribution TM = T0Π(u, v) with T0 the average brightnessand
Π(u, v) = 1 + CM (1− ρ2), ρ =√
(u2 + v2)/(15′) (17)
for u2 + v2 ≤ (15′)2, and zero outside. For New Moon weuse CM = 0, for Full Moon we use CM = 0.5 (see Fig. 10abelow). With u measured near culmination approximatelyin East–West direction through the center of the Moon,and v perpendicular to this direction, a synthetic totalpower scan is
PS(u) ∝ T0
∫ ∫F(u′, v′)Π(u− u′, v′) du′dv′. (18)
In a similar way as applied to the observed profiles fM(u),the synthetic composite profiles
fS(u) = dPS(u)/du (19)
are constructed from sections fS(u) with the left andright wing of the profile taken outside (15′ ≤ |u|) theright and left limb of the Moon. For observations aroundNew Moon and Full Moon, the sections fS(u) of the left(∼ East) and right (∼West) wing are symmetric and maybe added to obtain a composite profile (see Figs. 10b,cbelow). Figure 3 shows for New Moon the observed and
A. Greve et al.: The beam pattern of the IRAM 30–m telescope 277
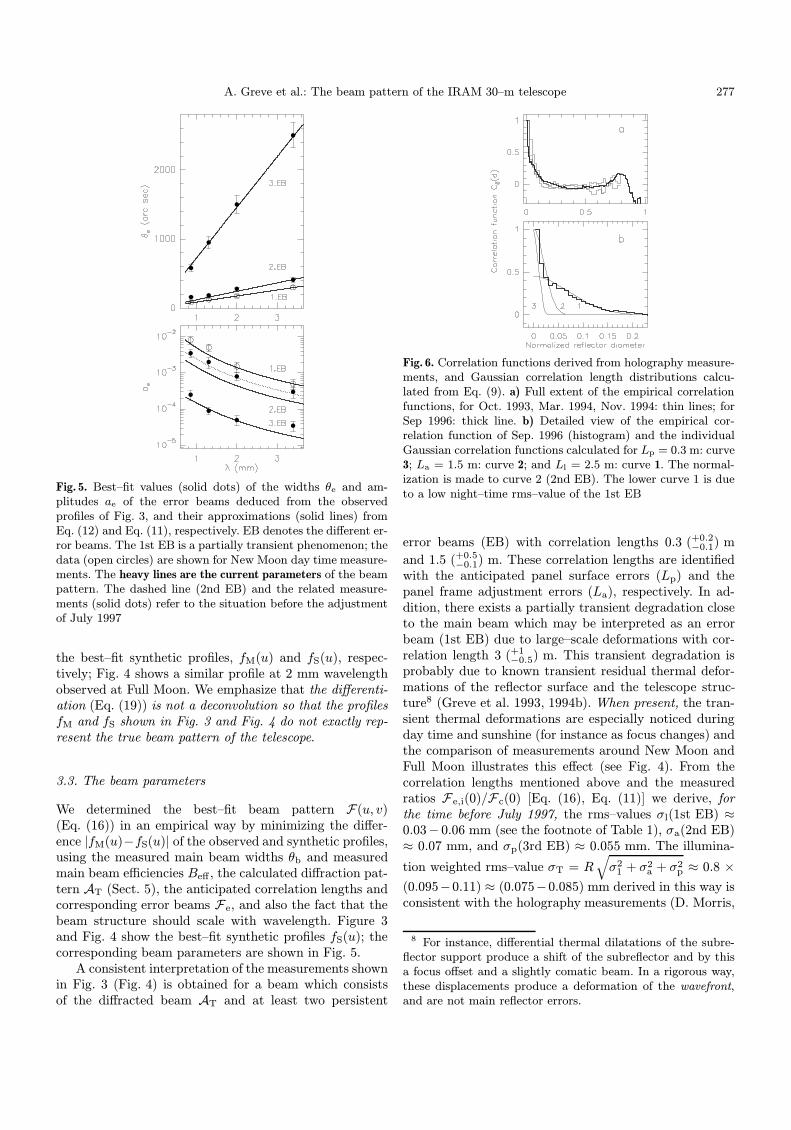
Fig. 5. Best–fit values (solid dots) of the widths θe and am-plitudes ae of the error beams deduced from the observedprofiles of Fig. 3, and their approximations (solid lines) fromEq. (12) and Eq. (11), respectively. EB denotes the different er-ror beams. The 1st EB is a partially transient phenomenon; thedata (open circles) are shown for New Moon day time measure-ments. The heavy lines are the current parameters of the beampattern. The dashed line (2nd EB) and the related measure-ments (solid dots) refer to the situation before the adjustmentof July 1997
the best–fit synthetic profiles, fM(u) and fS(u), respec-tively; Fig. 4 shows a similar profile at 2 mm wavelengthobserved at Full Moon. We emphasize that the differenti-ation (Eq. (19)) is not a deconvolution so that the profilesfM and fS shown in Fig. 3 and Fig. 4 do not exactly rep-resent the true beam pattern of the telescope.
3.3. The beam parameters
We determined the best–fit beam pattern F(u, v)(Eq. (16)) in an empirical way by minimizing the differ-ence |fM(u)−fS(u)| of the observed and synthetic profiles,using the measured main beam widths θb and measuredmain beam efficiencies Beff , the calculated diffraction pat-tern AT (Sect. 5), the anticipated correlation lengths andcorresponding error beams Fe, and also the fact that thebeam structure should scale with wavelength. Figure 3and Fig. 4 show the best–fit synthetic profiles fS(u); thecorresponding beam parameters are shown in Fig. 5.
A consistent interpretation of the measurements shownin Fig. 3 (Fig. 4) is obtained for a beam which consistsof the diffracted beam AT and at least two persistent
Fig. 6. Correlation functions derived from holography measure-ments, and Gaussian correlation length distributions calcu-lated from Eq. (9). a) Full extent of the empirical correlationfunctions, for Oct. 1993, Mar. 1994, Nov. 1994: thin lines; forSep 1996: thick line. b) Detailed view of the empirical cor-relation function of Sep. 1996 (histogram) and the individualGaussian correlation functions calculated for Lp = 0.3 m: curve3; La = 1.5 m: curve 2; and Ll = 2.5 m: curve 1. The normal-ization is made to curve 2 (2nd EB). The lower curve 1 is dueto a low night–time rms–value of the 1st EB
error beams (EB) with correlation lengths 0.3 (+0.2−0.1) m
and 1.5 (+0.5−0.1) m. These correlation lengths are identified
with the anticipated panel surface errors (Lp) and thepanel frame adjustment errors (La), respectively. In ad-dition, there exists a partially transient degradation closeto the main beam which may be interpreted as an errorbeam (1st EB) due to large–scale deformations with cor-relation length 3 (+1
−0.5) m. This transient degradation isprobably due to known transient residual thermal defor-mations of the reflector surface and the telescope struc-ture8 (Greve et al. 1993, 1994b). When present, the tran-sient thermal deformations are especially noticed duringday time and sunshine (for instance as focus changes) andthe comparison of measurements around New Moon andFull Moon illustrates this effect (see Fig. 4). From thecorrelation lengths mentioned above and the measuredratios Fe,i(0)/Fc(0) [Eq. (16), Eq. (11)] we derive, forthe time before July 1997, the rms–values σl(1st EB) ≈0.03− 0.06 mm (see the footnote of Table 1), σa(2nd EB)≈ 0.07 mm, and σp(3rd EB) ≈ 0.055 mm. The illumina-
tion weighted rms–value σT = R√σ2
1 + σ2a + σ2
p ≈ 0.8 ×
(0.095−0.11) ≈ (0.075−0.085) mm derived in this way isconsistent with the holography measurements (D. Morris,
8 For instance, differential thermal dilatations of the subre-flector support produce a shift of the subreflector and by thisa focus offset and a slightly comatic beam. In a rigorous way,these displacements produce a deformation of the wavefront,and are not main reflector errors.
278 A. Greve et al.: The beam pattern of the IRAM 30–m telescope
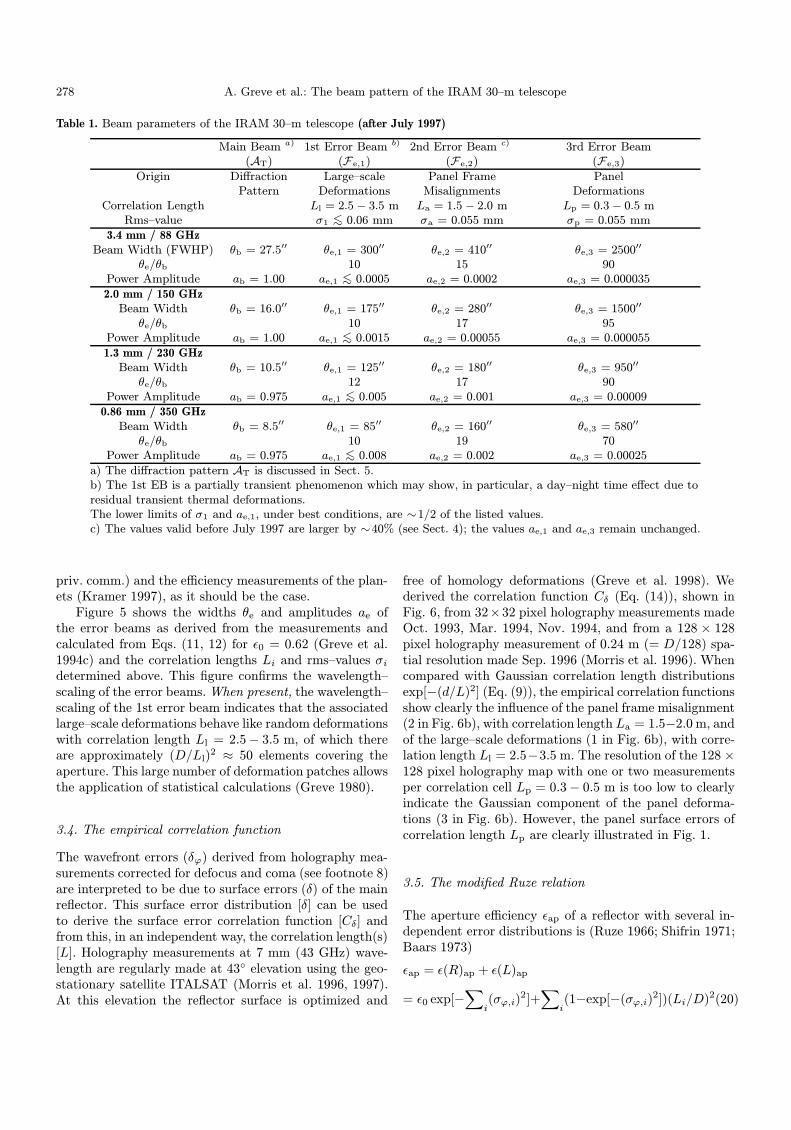
Table 1. Beam parameters of the IRAM 30–m telescope (after July 1997)
Main Beam a) 1st Error Beam b) 2nd Error Beam c) 3rd Error Beam(AT) (Fe,1) (Fe,2) (Fe,3)
Origin Diffraction Large–scale Panel Frame PanelPattern Deformations Misalignments Deformations
Correlation Length Ll = 2.5− 3.5 m La = 1.5 − 2.0 m Lp = 0.3− 0.5 mRms–value σ1 <∼ 0.06 mm σa = 0.055 mm σp = 0.055 mm
3.4 mm / 88 GHzBeam Width (FWHP) θb = 27.5′′ θe,1 = 300′′ θe,2 = 410′′ θe,3 = 2500′′
θe/θb 10 15 90Power Amplitude ab = 1.00 ae,1 <∼ 0.0005 ae,2 = 0.0002 ae,3 = 0.000035
2.0 mm / 150 GHzBeam Width θb = 16.0′′ θe,1 = 175′′ θe,2 = 280′′ θe,3 = 1500′′
θe/θb 10 17 95Power Amplitude ab = 1.00 ae,1 <∼ 0.0015 ae,2 = 0.00055 ae,3 = 0.000055
1.3 mm / 230 GHzBeam Width θb = 10.5′′ θe,1 = 125′′ θe,2 = 180′′ θe,3 = 950′′
θe/θb 12 17 90Power Amplitude ab = 0.975 ae,1 <∼ 0.005 ae,2 = 0.001 ae,3 = 0.00009
0.86 mm / 350 GHzBeam Width θb = 8.5′′ θe,1 = 85′′ θe,2 = 160′′ θe,3 = 580′′
θe/θb 10 19 70Power Amplitude ab = 0.975 ae,1 <∼ 0.008 ae,2 = 0.002 ae,3 = 0.00025
a) The diffraction pattern AT is discussed in Sect. 5.b) The 1st EB is a partially transient phenomenon which may show, in particular, a day–night time effect due toresidual transient thermal deformations.The lower limits of σ1 and ae,1, under best conditions, are ∼1/2 of the listed values.c) The values valid before July 1997 are larger by ∼40% (see Sect. 4); the values ae,1 and ae,3 remain unchanged.
priv. comm.) and the efficiency measurements of the plan-ets (Kramer 1997), as it should be the case.
Figure 5 shows the widths θe and amplitudes ae ofthe error beams as derived from the measurements andcalculated from Eqs. (11, 12) for ε0 = 0.62 (Greve et al.1994c) and the correlation lengths Li and rms–values σidetermined above. This figure confirms the wavelength–scaling of the error beams. When present, the wavelength–scaling of the 1st error beam indicates that the associatedlarge–scale deformations behave like random deformationswith correlation length Ll = 2.5− 3.5 m, of which thereare approximately (D/Ll)
2 ≈ 50 elements covering theaperture. This large number of deformation patches allowsthe application of statistical calculations (Greve 1980).
3.4. The empirical correlation function
The wavefront errors (δϕ) derived from holography mea-surements corrected for defocus and coma (see footnote 8)are interpreted to be due to surface errors (δ) of the mainreflector. This surface error distribution [δ] can be usedto derive the surface error correlation function [Cδ] andfrom this, in an independent way, the correlation length(s)[L]. Holography measurements at 7 mm (43 GHz) wave-length are regularly made at 43 elevation using the geo-stationary satellite ITALSAT (Morris et al. 1996, 1997).At this elevation the reflector surface is optimized and
free of homology deformations (Greve et al. 1998). Wederived the correlation function Cδ (Eq. (14)), shown inFig. 6, from 32×32 pixel holography measurements madeOct. 1993, Mar. 1994, Nov. 1994, and from a 128 × 128pixel holography measurement of 0.24 m (= D/128) spa-tial resolution made Sep. 1996 (Morris et al. 1996). Whencompared with Gaussian correlation length distributionsexp[−(d/L)2] (Eq. (9)), the empirical correlation functionsshow clearly the influence of the panel frame misalignment(2 in Fig. 6b), with correlation length La = 1.5−2.0 m, andof the large–scale deformations (1 in Fig. 6b), with corre-lation length Ll = 2.5−3.5 m. The resolution of the 128 ×128 pixel holography map with one or two measurementsper correlation cell Lp = 0.3− 0.5 m is too low to clearlyindicate the Gaussian component of the panel deforma-tions (3 in Fig. 6b). However, the panel surface errors ofcorrelation length Lp are clearly illustrated in Fig. 1.
3.5. The modified Ruze relation
The aperture efficiency εap of a reflector with several in-dependent error distributions is (Ruze 1966; Shifrin 1971;Baars 1973)
εap = ε(R)ap + ε(L)ap
= ε0 exp[−∑
i(σϕ,i)
2]+∑
i(1−exp[−(σϕ,i)
2])(Li/D)2(20)
A. Greve et al.: The beam pattern of the IRAM 30–m telescope 279
where
ε(R)ap = ε0 exp[−∑
i(σϕ,i)
2] = ε0 exp[−(σϕ)2] (21)
is the standard Ruze relation and ε(L)ap a correctiontaking into account the scale of the surface errors. Itis evident from Eq. (20) that in particular large–scaledeformations (large L) contribute to ε(L)ap, increasingthe efficiency ε(R)ap. When using in Eqs. (20, 21) themeasured values (σi, Li) given in Table 1, and ε0 =0.62, we find that in the wavelength region from 0.8 mmto 3 mm the quantity ε(L)ap does not exceed 1 − 2%,which is below the accuracy of the measurements. Thedifference between the Ruze relation (L = 0) and thecomplete expression Eq. (20) is so small so that the Ruzerelation can be used for evaluation of the 30–m reflector.
4. The current surface accuracy
We have presented in detail the data taken beforeJuly 1997 since this complete set of multi–wavelengthMoon scans (Fig. 3) and corresponding beam parameters(Fig. 5) illustrate that a consistent theory exists todescribe the beam degradation from several surface errordistributions. In this theory it is possible to anticipatethe structure of the beam pattern and the number ofbeam components from details of the reflector surfaceconstruction. Although it may be possible to approximatethe measurements by some other analytic function thanEqs. (10, 16), the decomposition used here is consistentwith proven concepts of the antenna tolerance theoryand with the surface structure of the 30–m reflector. Webelieve that the use of a priori knowledge of the beamstructure allows the derivation of meaningful parametersof the error beams, in particular of very extended lowlevel error beams which are difficult to measure with highprecision. We believe also that the predictability of thebeam structure from details of the reflector constructionallows a meaningful estimate of the influence of surfaceimprovements, as done in the following.
It is evident from the 30–m reflector construction thatthe correlation lengths Lp (panels, 3rd EB) and La (panelframes, 2nd EB) are fixed quantities, hence also the widthsθe,p and θe,a of the corresponding error beams. Sinceonly panel frames can be adjusted, only the associatedrms–value σa may change, leading to the improved valueσ∗a. The associated change of the power amplitude ae,a
(Eq. (11), Fig. 5) of the corresponding 2nd error beam is
a∗e,a/ae,a = [1− exp(−σ∗ 2ϕ,a)] / [1− exp(−σ2
ϕ,a)]. (22)
Approximately 80% of the power removed by the surfaceadjustment from the error beam appears as an increase inpower of the diffracted main beam, the remaining ∼20%appear in the sidelobe pattern (see Born & Wolf 1980).
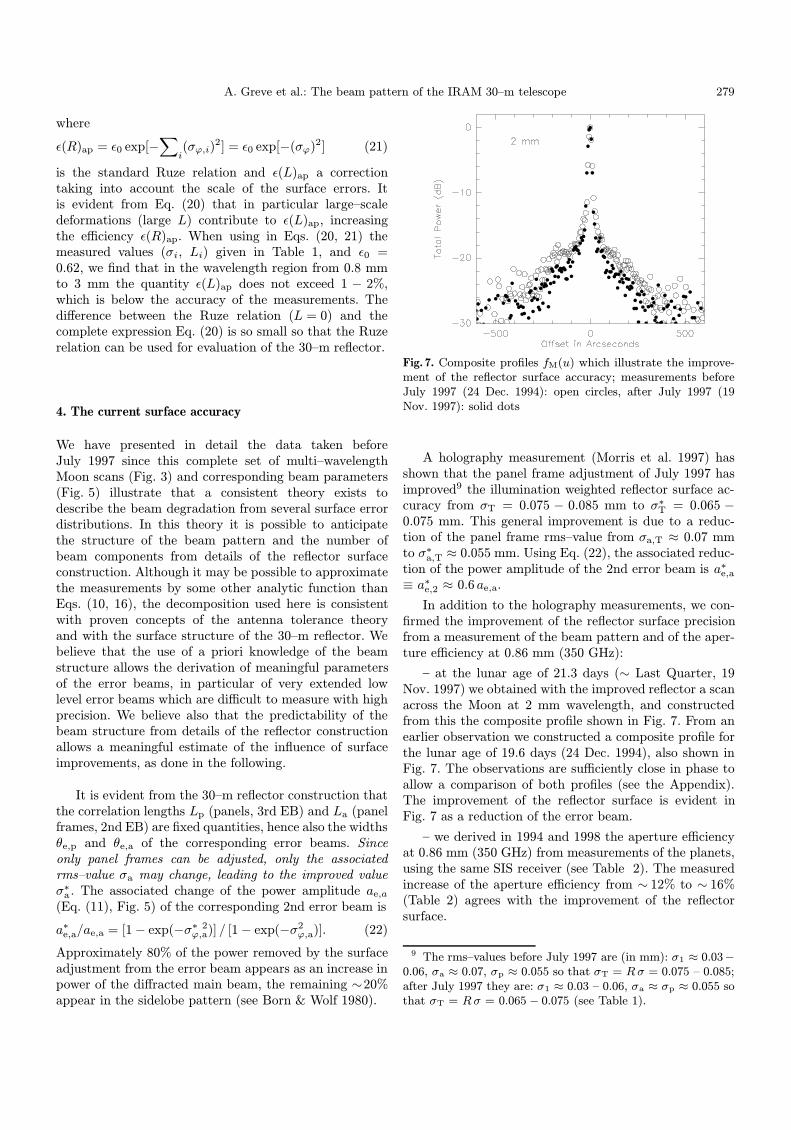
Fig. 7. Composite profiles fM(u) which illustrate the improve-ment of the reflector surface accuracy; measurements beforeJuly 1997 (24 Dec. 1994): open circles, after July 1997 (19Nov. 1997): solid dots
A holography measurement (Morris et al. 1997) hasshown that the panel frame adjustment of July 1997 hasimproved9 the illumination weighted reflector surface ac-curacy from σT = 0.075 − 0.085 mm to σ∗T = 0.065 −0.075 mm. This general improvement is due to a reduc-tion of the panel frame rms–value from σa,T ≈ 0.07 mmto σ∗a,T ≈ 0.055 mm. Using Eq. (22), the associated reduc-tion of the power amplitude of the 2nd error beam is a∗e,a≡ a∗e,2 ≈ 0.6 ae,a.
In addition to the holography measurements, we con-firmed the improvement of the reflector surface precisionfrom a measurement of the beam pattern and of the aper-ture efficiency at 0.86 mm (350 GHz):
– at the lunar age of 21.3 days (∼ Last Quarter, 19Nov. 1997) we obtained with the improved reflector a scanacross the Moon at 2 mm wavelength, and constructedfrom this the composite profile shown in Fig. 7. From anearlier observation we constructed a composite profile forthe lunar age of 19.6 days (24 Dec. 1994), also shown inFig. 7. The observations are sufficiently close in phase toallow a comparison of both profiles (see the Appendix).The improvement of the reflector surface is evident inFig. 7 as a reduction of the error beam.
– we derived in 1994 and 1998 the aperture efficiencyat 0.86 mm (350 GHz) from measurements of the planets,using the same SIS receiver (see Table 2). The measuredincrease of the aperture efficiency from ∼ 12% to ∼ 16%(Table 2) agrees with the improvement of the reflectorsurface.
9 The rms–values before July 1997 are (in mm): σ1 ≈ 0.03−0.06, σa ≈ 0.07, σp ≈ 0.055 so that σT = Rσ = 0.075 – 0.085;after July 1997 they are: σ1 ≈ 0.03 – 0.06, σa ≈ σp ≈ 0.055 sothat σT = Rσ = 0.065 − 0.075 (see Table 1).

280 A. Greve et al.: The beam pattern of the IRAM 30–m telescope
Fig. 8. IRAM 30–m telescope current beam pattern calculated from Eq. (16) and the parameters of Table 1. The heavy linesshow the case of a Gaussian approximation of the main beam (Eq. (23)). The accuracy of the profiles is ∼± 1 dB beyond themain beam area. The beam patterns are shown on logarithmic scale (dB). For each wavelength the profile is normalized to 1/2width of the full beam θfb (see Table 2)
Using these data, we proceeded in the following way toarrive at representative parameters of the telescope perfor-mance for the time after the July 1997 surface adjustment:
(1) we use the values θe and ae derived from the multi–wavelength set of Moon scans (Fig. 5), but update thevalues ae,2 = ae,a (panel frames, 2nd EB) by applicationof Eq. (22) as explained above. In Eq. (22) we use thevalues σa,T = 0.070 mm and σ∗a,T = 0.055 mm based onthe earlier and recent holography measurements (seefootnote 9).
(2) we use the holography measurement of the reflec-tor surface precision (σ∗T) and of the 350 GHz apertureefficiency to update the earlier efficiency data compiledby Kramer (1997) from a large set of observations, as notyet available for the improved reflector.
The current beam parameters are shown in Fig. 5 andare given in Table 1; the current efficiencies are given inTable 2.
5. The current beam pattern
Figure 8 shows the current beam pattern at 3.4 mm,2.0 mm, and 1.3 mm wavelength calculated from Eq. (16)and the values of Table 1. The values of Table 1, the curvesof Fig. 5, and Eqs. (11, 12) can be used to derive the pa-rameters of the beam pattern for other wavelengths thanthe reported measurements.
The calculation of the beam pattern requires a know-ledge of the diffraction pattern AT. Without enter-ing into lengthy calculations (see Minnett & Thomas
1968; Goldsmith 1987), the diffraction pattern of the30–m telescope is obtained with sufficient accuracy,when compared to measurements, from the approximationAT(u) = α(u)A(u), with A(u) = [J1(u)/u]2 calculatedfrom the expressions given by Abramowitz & Stegun(1972) and the reduction factor α(u) = 0.12, 0.22, 0.27 forthe 1st, 2nd, and 3rd sidelobe. In this calculation the beamwidth (FWHP) of the Airy pattern A(u) is θb (Table 1)at u = 1.62. As evident from Fig. 8, at the level of the 3rdsidelobe the diffraction pattern and the error pattern havesimilar intensities. The sidelobe structure and the errorbeam seen in Fig. 8 are not observed in regular pointingscans made with the 30–m telescope because the sensi-tivity of the procedure is only −10 dB to −15 dB. Thesidelobe structure is also not seen in the composite Moonscans (Figs. 3, 4) since this detail is lost in the convolution(Eq. (18)).
In many applications the diffracted beam AT is ap-proximated by a Gaussian main beam without sidelobes
AT ≈ GT = exp[−(θ /Θ)2] (23)
with Θ = θb/(2√ln 2) = 0.60 θb. Figure 8 shows also the
approximated Gaussian main beams.
6. The current efficiencies
The current efficiencies given in Table 2 are primarilybased on the measured illumination weighted rms–valueσ∗T. The aperture efficiency εap and the beam efficiencyBeff are related by Beff = 0.8899 [θb/(λ/D)]2 εap ≈ 1.20 εap
A. Greve et al.: The beam pattern of the IRAM 30–m telescope 281
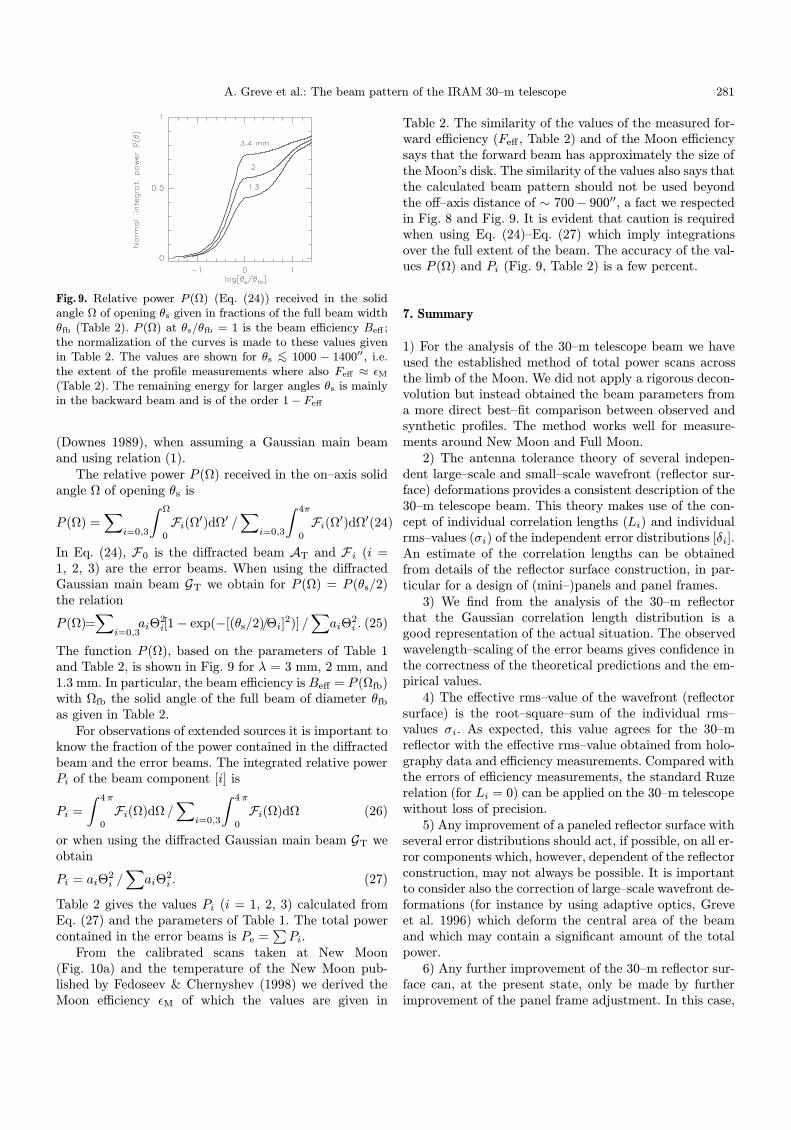
Fig. 9. Relative power P (Ω) (Eq. (24)) received in the solidangle Ω of opening θs given in fractions of the full beam widthθfb (Table 2). P (Ω) at θs/θfb = 1 is the beam efficiency Beff ;the normalization of the curves is made to these values givenin Table 2. The values are shown for θs <∼ 1000 − 1400′′, i.e.the extent of the profile measurements where also Feff ≈ εM(Table 2). The remaining energy for larger angles θs is mainlyin the backward beam and is of the order 1− Feff
(Downes 1989), when assuming a Gaussian main beamand using relation (1).
The relative power P (Ω) received in the on–axis solidangle Ω of opening θs is
P (Ω) =∑
i=0,3
∫ Ω
0
Fi(Ω′)dΩ′ /
∑i=0,3
∫ 4π
0
Fi(Ω′)dΩ′(24)
In Eq. (24), F0 is the diffracted beam AT and F i (i =1, 2, 3) are the error beams. When using the diffractedGaussian main beam GT we obtain for P (Ω) = P (θs/2)the relation
P (Ω)=∑
i=0,3aiΘ
2i[1− exp(−[(θs/2)/Θi]
2)] /∑
aiΘ2i . (25)
The function P (Ω), based on the parameters of Table 1and Table 2, is shown in Fig. 9 for λ = 3 mm, 2 mm, and1.3 mm. In particular, the beam efficiency is Beff = P (Ωfb)with Ωfb the solid angle of the full beam of diameter θfb
as given in Table 2.For observations of extended sources it is important to
know the fraction of the power contained in the diffractedbeam and the error beams. The integrated relative powerPi of the beam component [i] is
Pi =
∫ 4π
0
Fi(Ω)dΩ /∑
i=0,3
∫ 4π
0
Fi(Ω)dΩ (26)
or when using the diffracted Gaussian main beam GT weobtain
Pi = aiΘ2i /∑
aiΘ2i . (27)
Table 2 gives the values Pi (i = 1, 2, 3) calculated fromEq. (27) and the parameters of Table 1. The total powercontained in the error beams is Pe =
∑Pi.
From the calibrated scans taken at New Moon(Fig. 10a) and the temperature of the New Moon pub-lished by Fedoseev & Chernyshev (1998) we derived theMoon efficiency εM of which the values are given in
Table 2. The similarity of the values of the measured for-ward efficiency (Feff , Table 2) and of the Moon efficiencysays that the forward beam has approximately the size ofthe Moon’s disk. The similarity of the values also says thatthe calculated beam pattern should not be used beyondthe off–axis distance of ∼ 700− 900′′, a fact we respectedin Fig. 8 and Fig. 9. It is evident that caution is requiredwhen using Eq. (24)–Eq. (27) which imply integrationsover the full extent of the beam. The accuracy of the val-ues P (Ω) and Pi (Fig. 9, Table 2) is a few percent.
7. Summary
1) For the analysis of the 30–m telescope beam we haveused the established method of total power scans acrossthe limb of the Moon. We did not apply a rigorous decon-volution but instead obtained the beam parameters froma more direct best–fit comparison between observed andsynthetic profiles. The method works well for measure-ments around New Moon and Full Moon.
2) The antenna tolerance theory of several indepen-dent large–scale and small–scale wavefront (reflector sur-face) deformations provides a consistent description of the30–m telescope beam. This theory makes use of the con-cept of individual correlation lengths (Li) and individualrms–values (σi) of the independent error distributions [δi].An estimate of the correlation lengths can be obtainedfrom details of the reflector surface construction, in par-ticular for a design of (mini–)panels and panel frames.
3) We find from the analysis of the 30–m reflectorthat the Gaussian correlation length distribution is agood representation of the actual situation. The observedwavelength–scaling of the error beams gives confidence inthe correctness of the theoretical predictions and the em-pirical values.
4) The effective rms–value of the wavefront (reflectorsurface) is the root–square–sum of the individual rms–values σi. As expected, this value agrees for the 30–mreflector with the effective rms–value obtained from holo-graphy data and efficiency measurements. Compared withthe errors of efficiency measurements, the standard Ruzerelation (for Li = 0) can be applied on the 30–m telescopewithout loss of precision.
5) Any improvement of a paneled reflector surface withseveral error distributions should act, if possible, on all er-ror components which, however, dependent of the reflectorconstruction, may not always be possible. It is importantto consider also the correction of large–scale wavefront de-formations (for instance by using adaptive optics, Greveet al. 1996) which deform the central area of the beamand which may contain a significant amount of the totalpower.
6) Any further improvement of the 30–m reflector sur-face can, at the present state, only be made by furtherimprovement of the panel frame adjustment. In this case,
282 A. Greve et al.: The beam pattern of the IRAM 30–m telescope
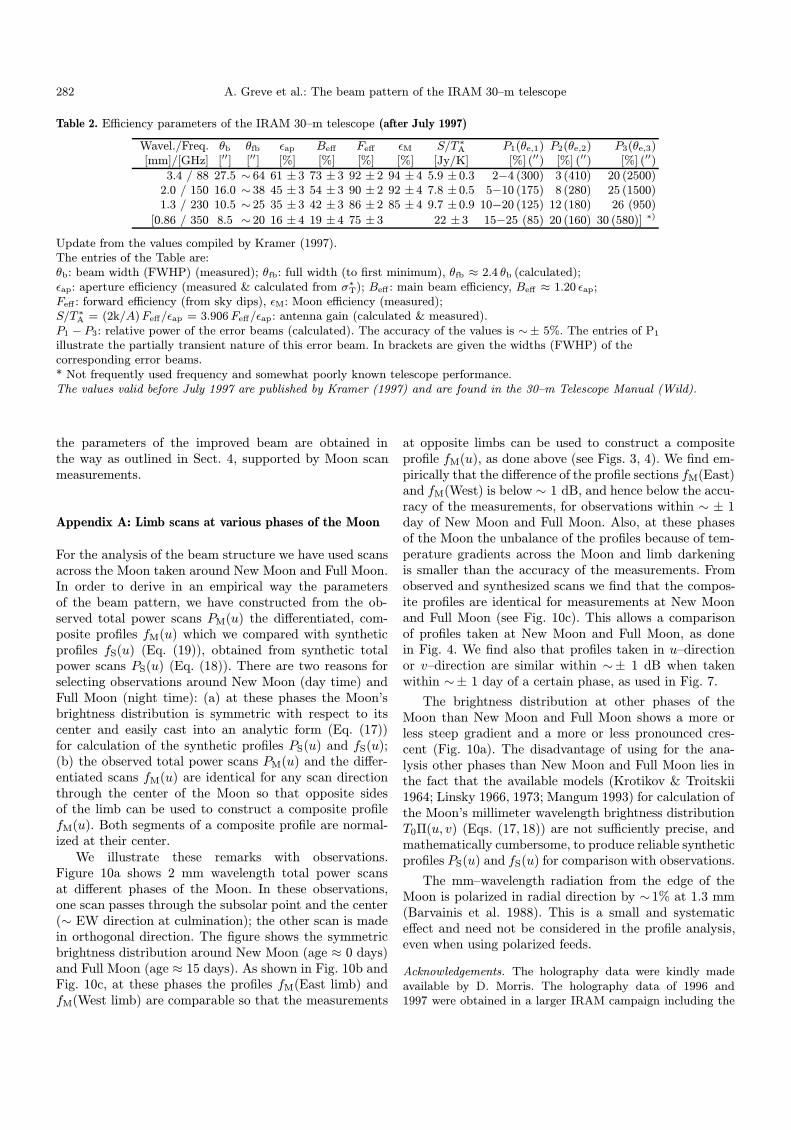
Table 2. Efficiency parameters of the IRAM 30–m telescope (after July 1997)
Wavel./Freq. θb θfb εap Beff Feff εM S/T ∗A P1(θe,1) P2(θe,2) P3(θe,3)[mm]/[GHz] [′′] [′′] [%] [%] [%] [%] [Jy/K] [%] (′′) [%] (′′) [%] (′′)
3.4 / 88 27.5 ∼ 64 61 ± 3 73 ± 3 92 ± 2 94 ± 4 5.9 ± 0.3 2−4 (300) 3 (410) 20 (2500)2.0 / 150 16.0 ∼ 38 45 ± 3 54 ± 3 90 ± 2 92 ± 4 7.8 ± 0.5 5−10 (175) 8 (280) 25 (1500)1.3 / 230 10.5 ∼ 25 35 ± 3 42 ± 3 86 ± 2 85 ± 4 9.7 ± 0.9 10−20 (125) 12 (180) 26 (950)
[0.86 / 350 8.5 ∼ 20 16 ± 4 19 ± 4 75 ± 3 22 ± 3 15−25 (85) 20 (160) 30 (580)] ∗)
Update from the values compiled by Kramer (1997).The entries of the Table are:θb: beam width (FWHP) (measured); θfb: full width (to first minimum), θfb ≈ 2.4 θb (calculated);εap: aperture efficiency (measured & calculated from σ∗T); Beff : main beam efficiency, Beff ≈ 1.20 εap;Feff : forward efficiency (from sky dips), εM: Moon efficiency (measured);S/T ∗A = (2k/A)Feff/εap = 3.906Feff/εap: antenna gain (calculated & measured).P1 − P3: relative power of the error beams (calculated). The accuracy of the values is ∼± 5%. The entries of P1
illustrate the partially transient nature of this error beam. In brackets are given the widths (FWHP) of thecorresponding error beams.* Not frequently used frequency and somewhat poorly known telescope performance.The values valid before July 1997 are published by Kramer (1997) and are found in the 30–m Telescope Manual (Wild).
the parameters of the improved beam are obtained inthe way as outlined in Sect. 4, supported by Moon scanmeasurements.
Appendix A: Limb scans at various phases of the Moon
For the analysis of the beam structure we have used scansacross the Moon taken around New Moon and Full Moon.In order to derive in an empirical way the parametersof the beam pattern, we have constructed from the ob-served total power scans PM(u) the differentiated, com-posite profiles fM(u) which we compared with syntheticprofiles fS(u) (Eq. (19)), obtained from synthetic totalpower scans PS(u) (Eq. (18)). There are two reasons forselecting observations around New Moon (day time) andFull Moon (night time): (a) at these phases the Moon’sbrightness distribution is symmetric with respect to itscenter and easily cast into an analytic form (Eq. (17))for calculation of the synthetic profiles PS(u) and fS(u);(b) the observed total power scans PM(u) and the differ-entiated scans fM(u) are identical for any scan directionthrough the center of the Moon so that opposite sidesof the limb can be used to construct a composite profilefM(u). Both segments of a composite profile are normal-ized at their center.
We illustrate these remarks with observations.Figure 10a shows 2 mm wavelength total power scansat different phases of the Moon. In these observations,one scan passes through the subsolar point and the center(∼ EW direction at culmination); the other scan is madein orthogonal direction. The figure shows the symmetricbrightness distribution around New Moon (age ≈ 0 days)and Full Moon (age ≈ 15 days). As shown in Fig. 10b andFig. 10c, at these phases the profiles fM(East limb) andfM(West limb) are comparable so that the measurements
at opposite limbs can be used to construct a compositeprofile fM(u), as done above (see Figs. 3, 4). We find em-pirically that the difference of the profile sections fM(East)and fM(West) is below ∼ 1 dB, and hence below the accu-racy of the measurements, for observations within ∼ ± 1day of New Moon and Full Moon. Also, at these phasesof the Moon the unbalance of the profiles because of tem-perature gradients across the Moon and limb darkeningis smaller than the accuracy of the measurements. Fromobserved and synthesized scans we find that the compos-ite profiles are identical for measurements at New Moonand Full Moon (see Fig. 10c). This allows a comparisonof profiles taken at New Moon and Full Moon, as donein Fig. 4. We find also that profiles taken in u–directionor v–direction are similar within ∼± 1 dB when takenwithin ∼± 1 day of a certain phase, as used in Fig. 7.
The brightness distribution at other phases of theMoon than New Moon and Full Moon shows a more orless steep gradient and a more or less pronounced cres-cent (Fig. 10a). The disadvantage of using for the ana-lysis other phases than New Moon and Full Moon lies inthe fact that the available models (Krotikov & Troitskii1964; Linsky 1966, 1973; Mangum 1993) for calculation ofthe Moon’s millimeter wavelength brightness distributionT0Π(u, v) (Eqs. (17, 18)) are not sufficiently precise, andmathematically cumbersome, to produce reliable syntheticprofiles PS(u) and fS(u) for comparison with observations.
The mm–wavelength radiation from the edge of theMoon is polarized in radial direction by ∼1% at 1.3 mm(Barvainis et al. 1988). This is a small and systematiceffect and need not be considered in the profile analysis,even when using polarized feeds.
Acknowledgements. The holography data were kindly madeavailable by D. Morris. The holography data of 1996 and1997 were obtained in a larger IRAM campaign including the

A. Greve et al.: The beam pattern of the IRAM 30–m telescope 283
Fig. 10. a) Observed (before July 1997) total power scans at 2 mm wavelength; West is to the right, East to the left. The ageof the Moon is indicated as days after New Moon (scans of the last half of the lunar cycle are similar, with the EW directioninverted). The profiles show scans PM(u) through the subsolar point (i.e. ∼ EW direction at culmination) and the center ofthe Moon (thick line), and scans in orthogonal direction (thin line). Only scans at New Moon and Full Moon are symmetric.b) Moon scans differentiated along ∼ EW direction, i.e. fM(u) = dPM(u)/du. c) Sections of the composite profile fM withfM(West): solid dots, fM(East): open circles (folded around the beam axis)
collaboration of D. Morris, J. Lamb, B. Lazareff, M. Carter,F. Mattiocco, and the staff of IRAM–Granada. D. Teyssier ofIRAM–Granada made the new measurements used in Fig. 7; A.Karpov (IRAM) provided and operated the 350 GHz receiver.The data of Fig. 1 are taken from the ARGE–Krupp–MANdocumentation of the telescope. We appreciated the discussionswith D. Morris and B. Lazareff, and the pointed comments ofD. Downes (IRAM) and the referee, R.E. Hills.
References
Abramowitz M., Stegun I.A., 1972, Handbook ofMathematical Functions. Dover Publ. Inc., New York
Baars J.W.M., 1973, IEEE Trans. Ant. Propag. AP–21, 461
Baars J.W.M., Hooghoudt B.G., Mezger P.G., de Jonge M.,1987, A&A 175, 319
Baars J.W.M., Greve A., Hein H., et al., 1994, Proc. IEEE 82,687
Barvainis R., Clemens D.P., Leach R., 1988, PASP 95, 510Born M., Wolf E., 1980, Principles of Optics. Pergamon Press,
Oxford, UKChristiansen W.N., Hogbom J.A., 1985, Radiotelescopes.
Cambridge University Press, Cambridge, UKCortes–Medellin G., Goldsmith P.F., 1994, IEEE Trans. Ant.
Propag. AP–42, 176Downes D., 1989, Radio Astronomy Techniques, in Evolution
of Galaxies, Astronomical Observations, Appenzeller I.,Habing H.J., Lena P. (eds.). Springer Verlag, Heidelberg
Fedoseev L.I., Chernyshev V.I., 1998, Astronomy Reports 42,105
Garcia–Burillo S., Guelin M., Cernicharo J., 1993, A&A 274,144
Goldsmith P.F., 1987, Int. J. Infrared & Millimeter Waves 8,771
Greve A., 1980, Appl. Opt. 19, 2948Greve A., Hooghoudt B.G., 1981, A&A 93, 76Greve A., Dan M., Penalver J., 1993, IEEE Trans. Ant. Propag.
AP–40, 1375Greve A., Morris D., Johansson L.E.B., et al., 1994a, IEE Proc.
Microw. Ant. Propag. 141, 23Greve A., LeFloch B., Morris D., et al., 1994b, IEEE Trans.
Ant. Propag. AP–42, 1345Greve A., Steppe H., Graham D.A., et al., 1994c, A&A 286,
654Greve A., Panis J.-F., Thum C., 1996a, A&AS 115, 379Greve A., Baars J.W.M., Penalver J., et al., 1996b, Radio Sci.
31, 1053Greve A., Neri R., Sievers A., 1998, A&AS (in print)Harris J.W., Catalan G., Atad–Ettedgui E., et al., 1997, Appl.
Opt. 36, 4571Hills R.E., Richer J., 1992, The JCMT Newsletter, Aug. 24Horne K., Hurford G.J., Zirin H., 1981, ApJ 244, 340Kaufmann P., Abraham Z., Scalise E., et al., 1987, IEEE Trans.
Ant. Propag. AP–35, 996Kramer C., 1997, Calibration of spectral line data at the IRAM
30 m Telescope, IRAM Internal ReportKraus J.D., 1986, Radioastronomy. Cygnus–Quasar Books,
Powell, Ohio, U.S.A.
284 A. Greve et al.: The beam pattern of the IRAM 30–m telescope
Krotikov V.D., Troitskii V.S., 1964, Sov. Phys.–Ups. 6, 841Lindsey C.A., Roellig T.L., 1991, ApJ 375, 414Linsky J.L., 1966, Icarus 5, 606Linsky J.L., 1973, ApJS 25, 163Love A.W., 1978, Reflector Antennas. IEEE Press, New YorkMangum J.G., 1993, PASP 105, 117Marechal A., 1947, Rev. Opt. 26, 257Mauersberger R., Guelin M., Martin–Pintado J., et al., 1989,
A&AS 79, 217Minnet H.C., Thomas B.M., 1968, Proc. IEE 115, 1419Morris D., Baars J.W.M., Hein H., et al., 1988, A&A 203, 399Morris D., Lamb J., Lazareff B., et al., 1996, Phase–Coherent
Holography of the 30 m Telescope in September 1996,IRAM Int. Report
Morris D., Lazareff B., Mattiocco F., et al., 1997, Holographyof the 30 m Telescope in September 1997, IRAM Int.Report
Prestage R., 1993, The JCMT Newslett. July 27Robieux J., 1966, Ann. Radioelectr. 11, 633Rush W.V.T., Wohlleben R., 1982, IEEE Trans. Ant. Propag.
AP–30, 784Ruze J., 1952, Suppl. al Nuovo Cimento 9, 364Ruze J., 1966, Proc. IEEE 54, 633Scheffler H., 1962, Z. f. Astrophys. 55, 1Schwesinger G., 1972, Optik 34, 553Shifrin Y.S., 1971, Statistical Antenna Theory. The Golem
Press, Boulder, Colorado, U.S.A.Smith W.T., Bastian R.J., 1997, IEEE Trans. Ant. Propag.
AP–45, 5Vaisala Y., 1922, Ann. Univ. Finnicae Aboensis, Turku, Ser A
1, No. 2Vu T.B., 1969, Proc. IEE 116, 195Vu T.B., 1970a, Int. J. Electron. 29, 165Whyborn N.D., Morris D., 1995, Experim. Astron. 6, 43