Embed Size (px)
Citation preview
The B.E. Journal of EconomicAnalysis & Policy
TopicsVolume 7, Issue 1 2007 Article 63
Cross-Border Shoppingandthe Sales Tax: AnExamination of Food Purchases in West
Virginia
MehmetS. Tosun∗ Mark L. Skidmore†
∗University of Nevada,Reno, [email protected]†MichiganState University, [email protected]
RecommendedCitationMehmetS. Tosun andMark L. Skidmore (2007) “Cross-BorderShoppingandthe Sales Tax: AnExamination of Food Purchases in West Virginia,”The B.E. Journal of Economic Analysis &Policy: Vol. 7: Iss. 1 (Topics), Article 63.
Brought to you by | Washington & Lee UniversityAuthenticated | 137.113.46.52
Download Date | 10/23/12 7:22 PM
Cross-Border Shopping and the Sales Tax: AnExamination of Food Purchases in West
Virginia∗
Mehmet S. Tosun and Mark L. Skidmore
Abstract
In this article we present new evidence of cross-border shopping in response to sales taxation.While several instructive studies provide estimates of the cross-border shopping effect, we utilizea unique opportunity to evaluate the effect of a large discrete change in sales tax policy. Usingcounty level data on food sales and sales tax rates for West Virginia over the 1988-1991 period weestimate that for every one-percentage point increase in the county relative price ratio due to thesales tax change, per capita food sales decreased by about 1.38 percent. Our estimates indicate thatfood sales fell in West Virginia border counties by about eight percent as a result of the impositionof the six percent sales tax on food at the beginning of 1990.
KEYWORDS: sales taxation, cross-border shopping
∗We would like to thank to two anonymous referees and the editor for helpful comments andsuggestions.
Brought to you by | Washington & Lee UniversityAuthenticated | 137.113.46.52
Download Date | 10/23/12 7:22 PM
1. Introduction
In this article we take advantage of a unique opportunity to reevaluate the role of sales taxation on cross-border shopping using county level food store data for West Virginia over the 1988-1991 period. Between 1980 and 1982 West Virginia legislators eliminated the sales tax on food by cutting the rate on food from three percent to zero by one-percentage point per year. Then beginning in 1990 legislators reintroduced the taxation of food, but at a rate of six percent. As illustrated in Figure 1, West Virginia’s neighboring states (Kentucky, Maryland, Ohio, Pennsylvania, and Virginia) either exempt food from sales taxation, or in the case of Virginia tax food at a reduced rate. In total, there are currently 20 states that impose state and/or local sales tax on food products. Residents in West Virginia border counties experienced a significant shift in the after-tax price differential with neighboring states for food products. The reintroduction of the six percent sales tax on food in 1990 provides an opportunity to evaluate the impact of a large discrete change in sales tax policy on the food store industry in border counties relative to interior counties. This is particularly relevant because West Virginia policymakers recently decided to cut the sales tax rate as applied to food sales by one percent. There is indeed a strong interest among state policymakers to completely eliminate the sales tax on food for home consumption. A recent survey on the West Virginia retailers’ views on the food tax showed that most of the respondents (82 percent of non-grocery and more than 70 percent of grocery retailers) indicated their sales would likely remain the same with the one percent reduction in the sales tax on food for home consumption (Brown, 2005). Interestingly, 73 percent of the grocery retailers stated that the legislature should not completely eliminate the sales tax on food for home consumption. In recent years there has been a renewed interest in the potential effect of sales taxation on consumption activity, and in particular the effect of sales taxation on shopping location decisions. At the state and local level, the proliferation of Internet shopping is eroding the sales tax base. State and local governments cannot require firms without a physical presence (or nexus) in the taxing jurisdiction to collect sales and use taxes. Thus, just as there is the potential for consumers to avoid sales taxation by making purchases in a nearby lower tax jurisdiction, there is also potential for consumers to avoid sales taxation by making purchases online. The limited empirical evidence shows that Internet purchases are sensitive to sales taxation (Goolsbee, 2000; Alm and Melnick, 2005; Ballard and Lee, 2007). At the federal level, there is some discussion of the possibility of replacing the income tax with a broad-based consumption tax. Also, in Europe policies that have increased both consumer and factor mobility have generated a new interest in tax harmonization in order to avoid distortions that
1
Tosun and Skidmore: Cross-Border Shopping
Brought to you by | Washington & Lee UniversityAuthenticated | 137.113.46.52
Download Date | 10/23/12 7:22 PM
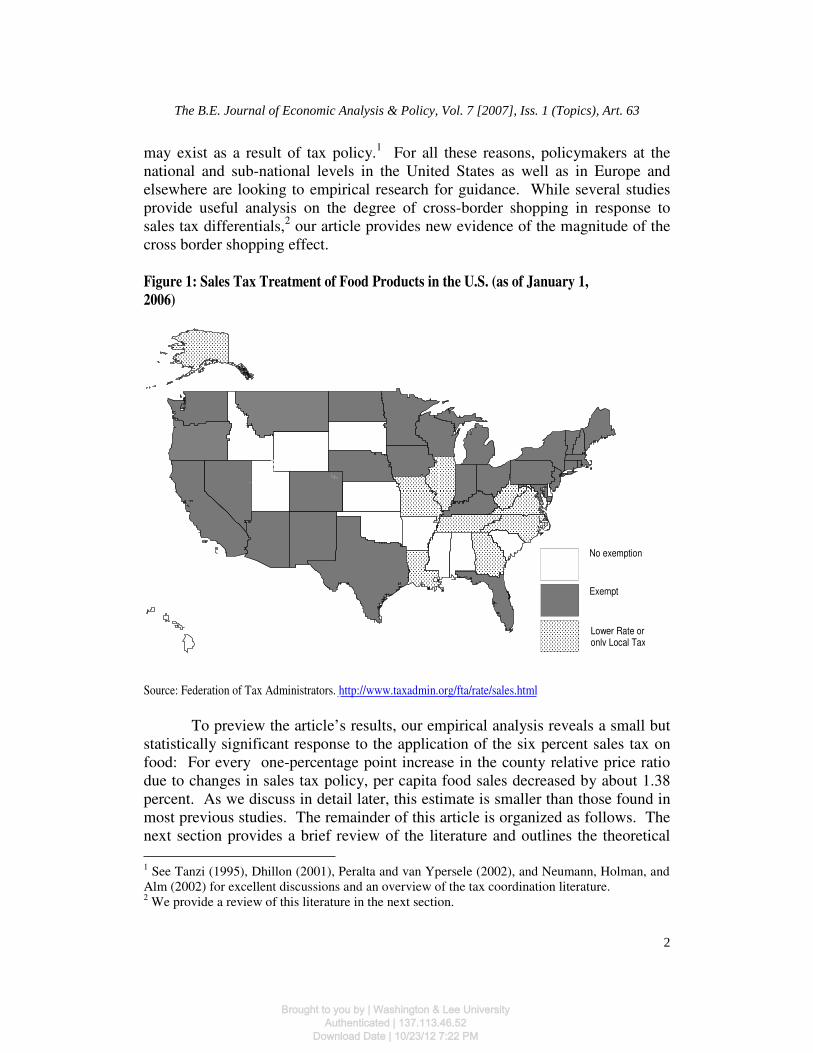
may exist as a result of tax policy.1 For all these reasons, policymakers at the national and sub-national levels in the United States as well as in Europe and elsewhere are looking to empirical research for guidance. While several studies provide useful analysis on the degree of cross-border shopping in response to sales tax differentials,2 our article provides new evidence of the magnitude of the cross border shopping effect.
Figure 1: Sales Tax Treatment of Food Products in the U.S. (as of January 1,
2006)
Source: Federation of Tax Administrators. http://www.taxadmin.org/fta/rate/sales.html
To preview the article’s results, our empirical analysis reveals a small but statistically significant response to the application of the six percent sales tax on food: For every one-percentage point increase in the county relative price ratio due to changes in sales tax policy, per capita food sales decreased by about 1.38 percent. As we discuss in detail later, this estimate is smaller than those found in most previous studies. The remainder of this article is organized as follows. The next section provides a brief review of the literature and outlines the theoretical
1 See Tanzi (1995), Dhillon (2001), Peralta and van Ypersele (2002), and Neumann, Holman, and Alm (2002) for excellent discussions and an overview of the tax coordination literature. 2 We provide a review of this literature in the next section.
No exemption
Exempt
Lower Rate or only Local Tax
2
The B.E. Journal of Economic Analysis & Policy, Vol. 7 [2007], Iss. 1 (Topics), Art. 63
Brought to you by | Washington & Lee UniversityAuthenticated | 137.113.46.52
Download Date | 10/23/12 7:22 PM
framework used to guide our empirical analysis. Next, we present the data, our empirical methodology, and results. The last section concludes.
2. Literature Review and Theoretical Discussion
There are a number of studies from the U.S. that examine the relationship between state and local taxes and cross-border sales. However, given the integration efforts in the European Union, it is also important to cite research on cross-border shopping in Europe. With regard to the European experience, FitzGerald (1992) found evidence of tax-induced cross-border shopping between Ireland and the United Kingdom. Also, a study by Gordon and Nelson (1997) provided evidence of cross-border shopping in Denmark. Further, Ohsawa (2003) contributed to the EU tax harmonization literature by showing in a theoretical model that narrowing the tax band across countries lowers the number of cross-border shoppers. In North America sales and excise taxation, lotteries, and cross-border sales have received considerable attention in recent years. For example, Ferris (2001) showed that heavy taxation of “sin” products in Canada led to significant changes in cross-border shopping between 1989 and 1994. Beard, Gant and Saba (1997) also provide evidence of cross-border sales of beer and liquor in a number of U.S. states. They argued that these cross-border sales might change the demand elasticities to the extent that the revenue generating capabilities of state governments are affected. The work of Nelson (2002) shows that in the U.S. the size of potential cross-border markets is an important determinant of state excise tax policy. Snodgrass and Otto (1990) examined local sales taxation in rural areas, concluding that raising local sales tax rates does not jeopardize retail sales as long as the tax differential between communities is not large.3 In a related strand of literature, Tosun and Skidmore (2004) and Garrett and Marsh (2002) analyzed the border effects of state lotteries. Using a cross-section of counties in Kansas, Garrett and Marsh (2002) provide evidence that cross-border lottery shopping had a significant net negative impact on state lottery revenues in Kansas. Similarly, Tosun and Skidmore (2004) demonstrated in a dynamic analysis that lottery and lottery game introductions in neighboring states have had a significant impact on lottery revenues in West Virginia border counties. In the context of sales taxation and Internet shopping, Goolsbee (2000) evaluated the relationship between sales tax rates and Internet purchases, using data from Forrester Research (a marketing research company). He found that
3 Note, however, that Gerking and Morgan (1998) explain a possible positive association between economic activity and taxes by pointing out that economic growth increases demand for public services and thereby creates upward pressure on tax rates.
3
Tosun and Skidmore: Cross-Border Shopping
Brought to you by | Washington & Lee UniversityAuthenticated | 137.113.46.52
Download Date | 10/23/12 7:22 PM
local sales taxation is an important determinant of Internet purchases. However, a limitation of his work is that he is unable to determine precisely the city or county of residence for the consumer, and thus the tax rate variable used by Goolsbee may contain measurement error. Along similar lines, Alm and Melnick (2005) demonstrated that consumers in high tax jurisdictions are more likely to shop on the Internet in order to avoid taxation. Finally, Ballard and Lee (2007) also find evidence of Internet shopping in order to avoid sales taxation. Further, they show that consumers whose own county is adjacent to a lower tax county are less likely to use Internet shopping. They interpret this finding as evidence of cross-border shopping.
Most closely related to the present article is the work of Walsh and Jones (1988) who examined the effect of the elimination of the three percent sales tax on food in West Virginia during the 1980-82 period.4 In particular, they measured how West Virginia consumers in border counties who had been shopping outside of West Virginia to avoid the sales tax on food stopped shopping elsewhere as the tax was phased out. Walsh and Jones found that for every one-percentage point reduction in the sales tax rate, food sales fell by a substantial 5.9 percent. In the context of a six percent increase in the sales tax rate as applied to food, this estimate suggests that food sales would fall by about 35 percent. As we discuss later, our analysis suggests that this estimate may be too high. It should be noted, however, that other earlier studies (Fisher, 1980; Fox, 1986) also estimate relatively large responses, albeit in different regions. In our analysis we measure the degree to which West Virginia consumers in border counties began shopping in neighboring states as the sales tax on food was reintroduced in West Virginia but at twice the original three percent rate. We also utilize econometric techniques to address serial correlation of error, and we examine the potential for bias, inefficiency, and/or inconsistency that might be introduced because of correlation of errors across space (spatial error and spatial lag models).
While the previous research is useful in understanding the border tax issue, the present article makes several contributions. First, much of the previous work has relied on the cross-sectional variation in taxes and retail sales, whereas we evaluate the issue over time by utilizing a panel of West Virginia counties over a four-year period. Second, the previous research that utilized panel data (as opposed to cross-sectional data) evaluated marginal changes in sales tax rates of, say, one, two, or three percent. In contrast, we examine the response to a large discrete six percent increase in the sales tax rate. As Snodgrass and Otto (1990) found, a large tax differential may have a relatively more significant effect on retail activity. Hence a large change in the sales tax rate may generate a more
4 Walsh and Jones (1988) and Snodgrass and Otto (1990) provide an extensive review of the U.S. studies on sales taxation, border tax differentials and cross border shopping.
4
The B.E. Journal of Economic Analysis & Policy, Vol. 7 [2007], Iss. 1 (Topics), Art. 63
Brought to you by | Washington & Lee UniversityAuthenticated | 137.113.46.52
Download Date | 10/23/12 7:22 PM
accurate and precise estimate of the cross-border shopping effect. Third, most studies have utilized data on general retail activity. We focus on one industry—food purchased for home consumption. Our empirical approach utilizes a classic differences-in-differences strategy around a major policy change. We estimate the tax impact using interior counties and counties before the tax change as our control group to estimate the sales tax response. A key advantage of this approach is that it isolates the cross-border shopping effect from the typical demand response effect. The theoretical framework we use follows the simple model presented in Walsh and Jones (1988) and is similar to that which was used in earlier work of Fisher (1980) and Fox (1986). Per capita demand for grocery products in county i at time period t depends on per capita income (Yit), the after-tax price of food items in the county relative to that available in other nearby locations (Pit), and the cost of travel associated with obtaining goods in other locations (Cit). This relationship is illustrated in the following multiplicative demand model:
a b c
it i it it iS AY P C= (1)
Sit is per capita sales of taxable food items demanded in county i at time t, Yit is
per capita income, and Pit is defined as,( )
( )
1
1
it it
at at
p T
p T
+
+ where Tit is the home state tax
rate as applied to grocery food, Tat is the sales tax rate applied to grocery food sales in the nearest county in the adjacent state, and pit, pat are home and adjacent state pre-tax prices, which are assumed to be equal. Ci and Ai represent costs of travel from county i to the nearest commercial center in the adjacent state and a multiplicative factor that is unique to each county. In the context of our panel approach, Ci and Ai are for the most part constant over time so that they will be controlled for with county fixed effects. We expect an inverse relationship between food sales and the after-tax price differential because consumers may find it worthwhile to travel to the lower tax jurisdiction to make purchases. In order for us to attribute any changes in grocery sales with changes in sales taxation we assume that input costs are similar on each side of the border, and that long-run supply curves are flat (i.e., constant cost structures); assumptions that are typical in this line of research.5 We also
5 In the empirical evaluation of sales and excise tax incidence it is often assumed that in the long run supply curves become perfectly elastic. In the limited empirical work on tax incidence (Besley and Rosen, 1999; Poterba, 1996; and Alm, Sennoga and Skidmore, 2007) studies generally find full forward shifting of sales and excise taxes, a result that is consistent with a horizontal supply curve. With regard to food items, Besley and Rosen (1999) estimate price responses to food items such as bananas, bread, Crisco, milk, and soda, generally finding full shifting although the estimates vary from product to product. Also, Doyle and Samphantharak (2007) use firm level gasoline price data to examine the price response to changes in tax rates
5
Tosun and Skidmore: Cross-Border Shopping
Brought to you by | Washington & Lee UniversityAuthenticated | 137.113.46.52
Download Date | 10/23/12 7:22 PM
control for several other economic and demographic factors that may determine food sales but are not explicitly modeled here—these variables are discussed in the next section.
The literature review and theoretical discussion presented above suggests that border county grocery sales are likely to decrease with the introduction of the sales tax on food. To set the stage for our more in-depth analysis, we present some initial evidence of the “border tax” effect. First, consider Figure 2, which contains a map of West Virginia and the surrounding states. The map demonstrates a clear potential for cross-border shopping. West Virginia is surrounded by states with large populations, particularly Pennsylvania, Ohio and Virginia. It has particularly long borders with Virginia and Ohio. We also see the per capita food sales are particularly high in certain border regions.
Using data on per capita food sales we also conduct a difference-in-difference analysis. As shown in Table 1, average per capita food sales in West Virginia interior counties was about $34.48 lower in 1991 than in 1990. But for West Virginia border counties the year 1991 logged a larger reduction in per capita food sales of $50.86 relative to 1990. The difference between the change in per capita food sales for border counties versus interior counties is therefore ($16.38). Without controlling for other factors that influence changes in food sales, this comparison suggests that the imposition of the sales tax on food products in 1990 may have had a significant impact on the retail grocery industry in border counties. In the next section, we conduct a more thorough empirical analysis to determine that magnitude of the “border tax” effect.
along state borders. They find 80-100 percent forward shifting to consumers, although they also provide evidence of somewhat smaller differentials near state lines.
6
The B.E. Journal of Economic Analysis & Policy, Vol. 7 [2007], Iss. 1 (Topics), Art. 63
Brought to you by | Washington & Lee UniversityAuthenticated | 137.113.46.52
Download Date | 10/23/12 7:22 PM

Figure 2. West Virginia County Food Sales and Neighboring State
Populations (1990)
.-,70
.-,7 7
.-,7 9
.-,7 9
.-, 64 .-, 6 4
.-, 70
.-,7 0
.-,81
.-, 81
.-,6 4
.-, 64
.-, 64
.-, 71
.-,77
Ohio
Virginia
Pennsylvania
Kentucky
West Virginia
.-, 23
.-, 80
Maryland
.-,64
.-,402
77.-,7 7
100 0 100 200 Miles
State Populations ofWest Virginia's Neighbors (1990)
453,588 - 1,793,477
1,793,478 - 3,375,099
3,375,100 - 5,995,297
5,995,298 - 17,990,455
17,990,456 - 29,760,021
Per Capita Food SalesBy WV County ($1990)
374 - 693693 - 10611061 - 14351435 - 21272127 - 2995
Table 1. Difference-in-Difference Analysisa
Real Per Capita Food Sales
1990 1991 Difference
Border Counties
1,185.23 (96.26)
1,134.37 (103.01)
-50.86 (140.99) West
Virginia
County Interior Counties
1,295.89 (114.78)
1,261.41 (105.82)
-34.48 (156.46)
-16.38 (210.64)
aStandard errors are shown in parentheses.
7
Tosun and Skidmore: Cross-Border Shopping
Brought to you by | Washington & Lee UniversityAuthenticated | 137.113.46.52
Download Date | 10/23/12 7:22 PM

3. Empirical Analysis
As outlined in the previous section, the retail food sales variable is modeled to be a function of per capita income (Yit), the after-tax price of food items in the county relative to that available in other nearby locations (Pit), and the cost of travel associated with obtaining goods in other locations (Cit). In this section we describe in detail the data we use, the empirical methodology and the estimation results. We begin with a detailed explanation of the food sales variable, our dependent variable.
3.1. Data
We were able to obtain data for the years 1988 through 1991 on food sales for most counties in West Virginia from the West Virginia State Tax Department.6 The food sales data we use are taxable food sales since these are derived from sales tax returns filed by food stores in the state. Note that our data come solely from West Virginia counties and not border state counties. We do, however utilize after tax information in neighboring state counties to calculate the changes in after-tax price relative to those counties in the bordering states. Summary statistics, definitions and sources for this and all variables used in the analysis are presented in Tables 1 and 2. We now turn our attention to several important econometric issues.
3.2. Methodology
The data are a panel of 212 observations7 that include nearly all counties for years 1988 through 1991.8 Given that our data have time series and cross-section components, our analysis relies on changes in the status of the sales on tax on food in West Virginia. The analysis is simplified by the fact that West Virginia’s contiguous states did not experience changes in sales tax status during the period of analysis. Given the panel nature of the data, our analysis employs panel estimation techniques. Two conventional approaches for estimating panel data are the fixed-effects and random-effects procedures.
6 Ideally, we would like to have had data for an extended timeframe, but uncovering data for these years was very challenging. We thank West Virginia State Tax Department employees for the extra effort they extended to make these data available to us. 7 The panel is unbalanced due to 8 missing observations on food sales. Missing food sales data are for Cabell (1991), Marion (1991), Mineral (1988), Pleasants (1990) and Wirt (1988-1991) counties. 8 An exception to this is Wirt County for which we have no food sales data.
8
The B.E. Journal of Economic Analysis & Policy, Vol. 7 [2007], Iss. 1 (Topics), Art. 63
Brought to you by | Washington & Lee UniversityAuthenticated | 137.113.46.52
Download Date | 10/23/12 7:22 PM
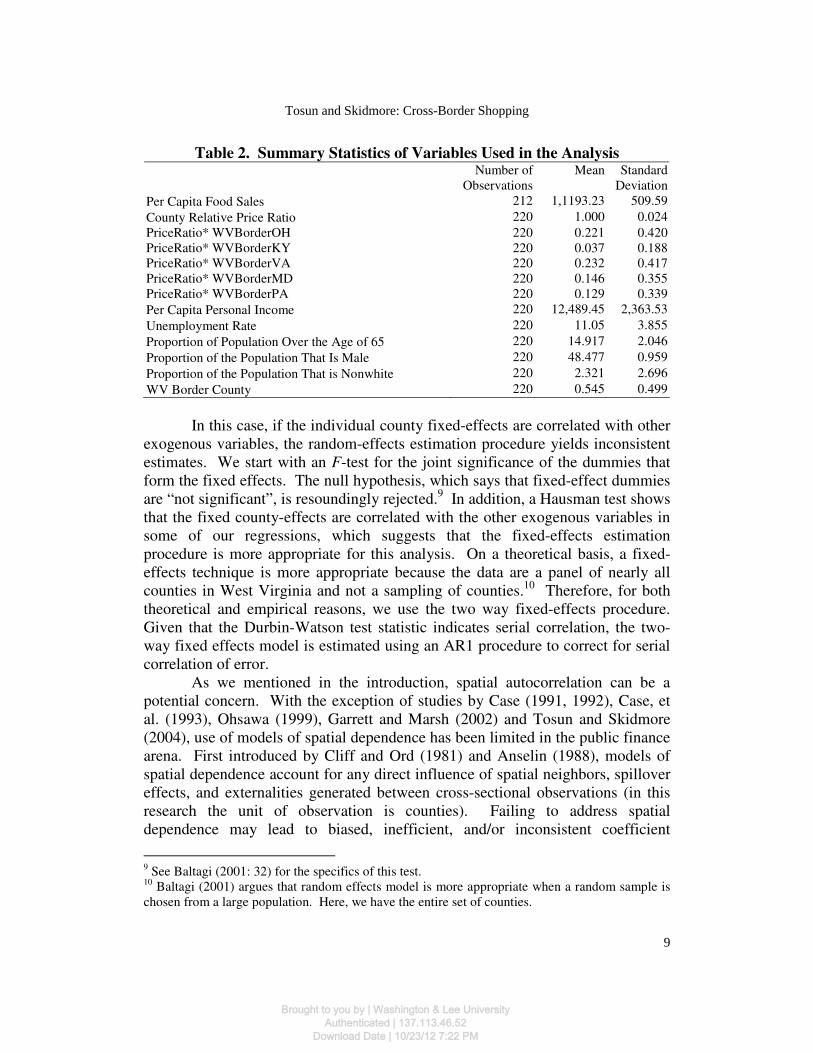
Table 2. Summary Statistics of Variables Used in the Analysis Number of
Observations Mean Standard
Deviation
Per Capita Food Sales 212 1,1193.23 509.59
County Relative Price Ratio 220 1.000 0.024
PriceRatio* WVBorderOH 220 0.221 0.420 PriceRatio* WVBorderKY 220 0.037 0.188 PriceRatio* WVBorderVA 220 0.232 0.417 PriceRatio* WVBorderMD 220 0.146 0.355 PriceRatio* WVBorderPA 220 0.129 0.339
Per Capita Personal Income 220 12,489.45 2,363.53
Unemployment Rate 220 11.05 3.855
Proportion of Population Over the Age of 65 220 14.917 2.046
Proportion of the Population That Is Male 220 48.477 0.959
Proportion of the Population That is Nonwhite 220 2.321 2.696
WV Border County 220 0.545 0.499
In this case, if the individual county fixed-effects are correlated with other
exogenous variables, the random-effects estimation procedure yields inconsistent estimates. We start with an F-test for the joint significance of the dummies that form the fixed effects. The null hypothesis, which says that fixed-effect dummies are “not significant”, is resoundingly rejected.9 In addition, a Hausman test shows that the fixed county-effects are correlated with the other exogenous variables in some of our regressions, which suggests that the fixed-effects estimation procedure is more appropriate for this analysis. On a theoretical basis, a fixed-effects technique is more appropriate because the data are a panel of nearly all counties in West Virginia and not a sampling of counties.10 Therefore, for both theoretical and empirical reasons, we use the two way fixed-effects procedure. Given that the Durbin-Watson test statistic indicates serial correlation, the two-way fixed effects model is estimated using an AR1 procedure to correct for serial correlation of error. As we mentioned in the introduction, spatial autocorrelation can be a potential concern. With the exception of studies by Case (1991, 1992), Case, et al. (1993), Ohsawa (1999), Garrett and Marsh (2002) and Tosun and Skidmore (2004), use of models of spatial dependence has been limited in the public finance arena. First introduced by Cliff and Ord (1981) and Anselin (1988), models of spatial dependence account for any direct influence of spatial neighbors, spillover effects, and externalities generated between cross-sectional observations (in this research the unit of observation is counties). Failing to address spatial dependence may lead to biased, inefficient, and/or inconsistent coefficient
9 See Baltagi (2001: 32) for the specifics of this test. 10 Baltagi (2001) argues that random effects model is more appropriate when a random sample is chosen from a large population. Here, we have the entire set of counties.
9
Tosun and Skidmore: Cross-Border Shopping
Brought to you by | Washington & Lee UniversityAuthenticated | 137.113.46.52
Download Date | 10/23/12 7:22 PM
estimates. However, in tests we do not find evidence of spatial dependence and therefore do not report the estimates here.11 In our analysis,
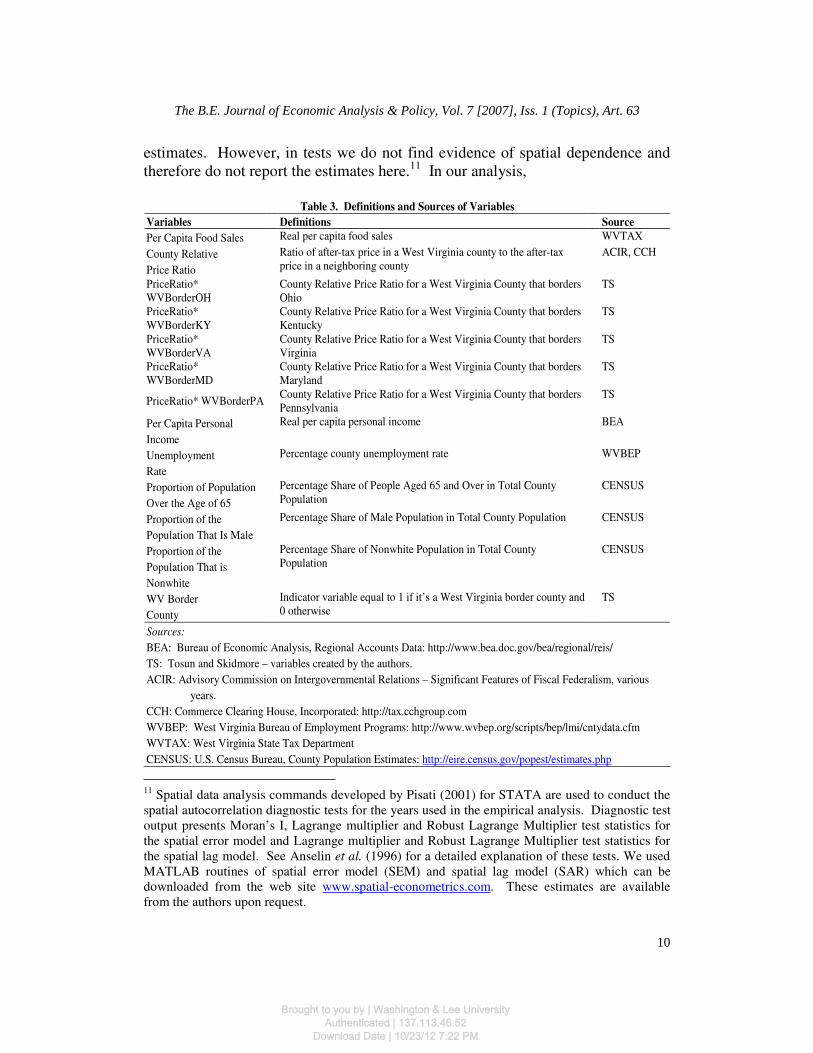
Table 3. Definitions and Sources of Variables
Variables Definitions Source
Per Capita Food Sales Real per capita food sales WVTAX
County Relative
Price Ratio
Ratio of after-tax price in a West Virginia county to the after-tax price in a neighboring county
ACIR, CCH
PriceRatio* WVBorderOH
County Relative Price Ratio for a West Virginia County that borders Ohio
TS
PriceRatio* WVBorderKY
County Relative Price Ratio for a West Virginia County that borders Kentucky
TS
PriceRatio* WVBorderVA
County Relative Price Ratio for a West Virginia County that borders Virginia
TS
PriceRatio* WVBorderMD
County Relative Price Ratio for a West Virginia County that borders Maryland
TS
PriceRatio* WVBorderPA County Relative Price Ratio for a West Virginia County that borders
Pennsylvania TS
Per Capita Personal
Income
Real per capita personal income BEA
Unemployment
Rate
Percentage county unemployment rate WVBEP
Proportion of Population
Over the Age of 65
Percentage Share of People Aged 65 and Over in Total County Population
CENSUS
Proportion of the
Population That Is Male
Percentage Share of Male Population in Total County Population CENSUS
Proportion of the
Population That is
Nonwhite
Percentage Share of Nonwhite Population in Total County Population
CENSUS
WV Border
County
Indicator variable equal to 1 if it’s a West Virginia border county and 0 otherwise
TS
Sources:
BEA: Bureau of Economic Analysis, Regional Accounts Data: http://www.bea.doc.gov/bea/regional/reis/
TS: Tosun and Skidmore – variables created by the authors.
ACIR: Advisory Commission on Intergovernmental Relations – Significant Features of Fiscal Federalism, various
years.
CCH: Commerce Clearing House, Incorporated: http://tax.cchgroup.com
WVBEP: West Virginia Bureau of Employment Programs: http://www.wvbep.org/scripts/bep/lmi/cntydata.cfm
WVTAX: West Virginia State Tax Department
CENSUS: U.S. Census Bureau, County Population Estimates: http://eire.census.gov/popest/estimates.php
11 Spatial data analysis commands developed by Pisati (2001) for STATA are used to conduct the spatial autocorrelation diagnostic tests for the years used in the empirical analysis. Diagnostic test output presents Moran’s I, Lagrange multiplier and Robust Lagrange Multiplier test statistics for the spatial error model and Lagrange multiplier and Robust Lagrange Multiplier test statistics for the spatial lag model. See Anselin et al. (1996) for a detailed explanation of these tests. We used MATLAB routines of spatial error model (SEM) and spatial lag model (SAR) which can be downloaded from the web site www.spatial-econometrics.com. These estimates are available from the authors upon request.
10
The B.E. Journal of Economic Analysis & Policy, Vol. 7 [2007], Iss. 1 (Topics), Art. 63
Brought to you by | Washington & Lee UniversityAuthenticated | 137.113.46.52
Download Date | 10/23/12 7:22 PM

we use panel data so that the parameter estimates are generated primarily from the within county variation in food sales. Further, given that sales tax policy is governed solely by state government it is perhaps not surprising that we find little evidence of spatial dependence. Denote Foodit as the natural logarithm of deflated county per capita food sales in county i in period t. We assume that
ittiititit TCXPFood εββ ++++= 21 (2)
where Pit is the after-tax price of food items in the county relative to that available in other nearby locations for county i in period t12, Xit is an nxm vector control
variables (m is the number of controls) and where β2 represents an mx1 vector of coefficients. Included in Xit are the natural logarithm of real per capita income (Per Capita Income), the unemployment rate (Unemployment Rate), the proportion of the population that is over the age of 65 (Elderly), male (Male), and nonwhite (Minority). Ci represents the county specific effects which control for,
among other things, travel costs, Tt is the set of time indicator variables, and εit is the residual which we treat as serially correlated (AR1 procedure). We estimate another specification in which we measure the effect of the after-tax-price ratio (P) on food sales in each of the five bi-state regions (Kentucky, Maryland, Ohio, Pennsylvania, and Virginia) by interacting a series of indicator variables that equal one if the county borders a particular state and zero otherwise, with P.13 As illustrated in Tosun and Skidmore (2004), due the significant population bases in each of the five bi-state regions there is potential for cross-border sales in each region.14 Empirical analysis in a spatial context often focuses on factors such as distance, size of retail center, transportation routes, and the like. However, in our work here these variables change little over time so that fixed effects largely control for these factors. This allows us to focus on other variables that change
12 To compute the relative after tax price variable each county was paired with its contiguous county in the neighboring state. In West Virginia the sales taxes are controlled exclusively by the state, but this is not so in neighboring states. Thus, we were careful to identify the state and local sales tax rates in the corresponding contiguous counties. 13 One could also use a less specific measure of the effect of the introduction of the sales tax on food. In alternative specification P could be replaced with an interaction term between an indicator variable that is equal to one if the county is a border county and zero otherwise, and indicator variable that is equal to one for 1991 (the year during which the 6 percent tax was imposed on food) and zero otherwise. We have estimated regressions with such a specification, which yielded results similar those presented here. These estimates are available from the authors upon request. 14 Tosun and Skidmore (2004) find evidence of cross-border lottery shopping in West Virginia counties bordering Kentucky, Virginia and Maryland. Ohio and Pennsylvania did not introduce any new lottery games during the period of analysis and thus no cross-border shopping effect could be estimated for those regions.
11
Tosun and Skidmore: Cross-Border Shopping
Brought to you by | Washington & Lee UniversityAuthenticated | 137.113.46.52
Download Date | 10/23/12 7:22 PM
over time such as income, demographic characteristics and our primary interest, the changing tax environment.
3.3. Results
In Table 4, we present five sets of regressions.15 We begin by presenting in column 1 a regression that, to some degree, reflects the estimation approach used by Walsh and Jones (1988). Walsh and Jones do not explicitly control for fixed county or time effects, and their sample for which they find a border effect includes border counties and not interior counties. Walsh and Jones find that for every one-percentage point decrease in the after-tax-price grocery sales increase by 5.9 percent. In the context of the six percentage point increase in the sales tax rate that occurred in 1990, their estimate suggests that grocery sales would have fallen by about 35 percent. Our difference-in-difference analysis presented in Table 1 reveals only a small decline in per capita food sales in border counties relative to interior counties. In our judgment, the Walsh and Jones estimate may be too high. In fact, it seems that the estimates found in much of the previous literature are of similar magnitude to those found in Walsh and Jones. For example, Fisher (1980) found that food sales in the District of Columbia fell by about seven percent for every one-percentage point change in the D.C sales tax rate as compared to neighboring jurisdictions.16 Estimates found in Fox (1986) suggest that a one-percentage point difference in sales tax rates reduced sales in the high tax jurisdiction by one to four percent. Generally, studies on the border tax issue have estimated that a one-percentage point differential in sales tax rates resulted in decreased sales ranging between one and 11 percent in the high tax jurisdiction. As we discuss below, our coefficient estimates fall in the lower range of these previous studies.
15 Note that the number of observations for the AR(1) fixed effects regressions in columns (2)-(5) are lower than the full sample size of 212. This is because the Cochran-Orcutt method drops the first observation of each panel (county) in those regressions. 16 Note that while the estimated aggregate effect is substantial as illustrated, the elasticity estimates in Fisher’s (1980) study as well as in other studies such as Snodgrass and Otto (1990) suggest an inelastic response.
12
The B.E. Journal of Economic Analysis & Policy, Vol. 7 [2007], Iss. 1 (Topics), Art. 63
Brought to you by | Washington & Lee UniversityAuthenticated | 137.113.46.52
Download Date | 10/23/12 7:22 PM
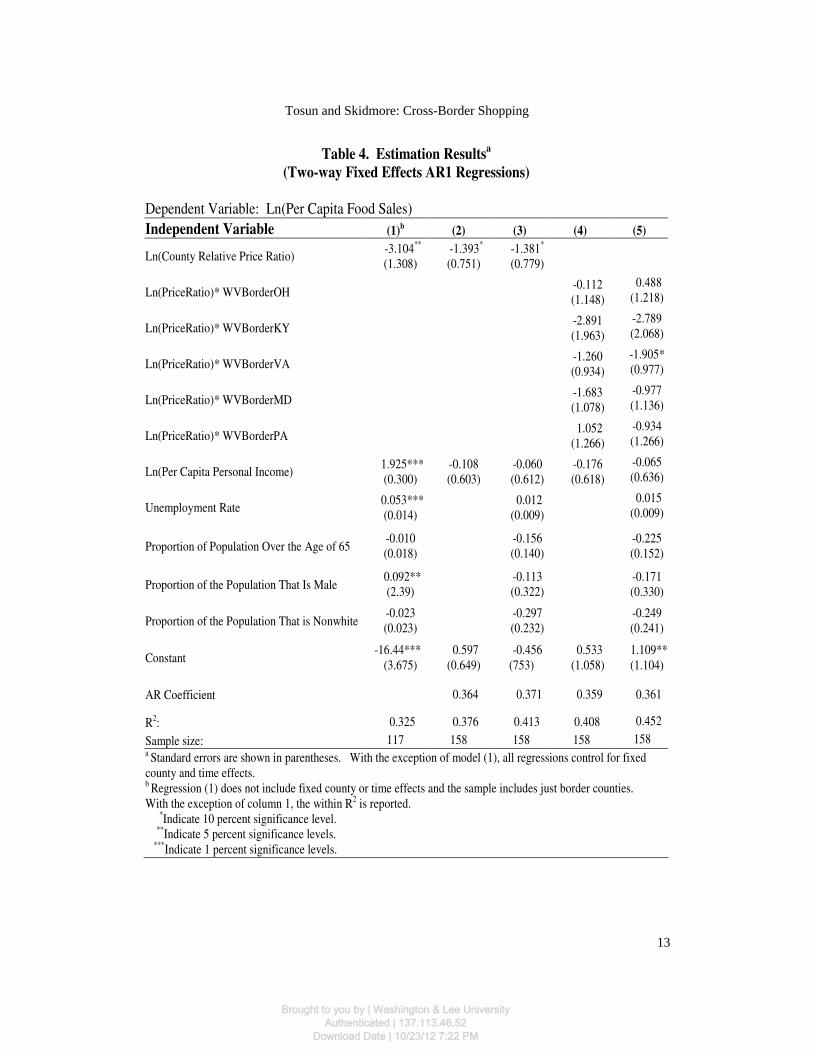
Table 4. Estimation Resultsa
(Two-way Fixed Effects AR1 Regressions)
Dependent Variable: Ln(Per Capita Food Sales)
Independent Variable (1)b
(2) (3) (4) (5)
Ln(County Relative Price Ratio) -3.104** (1.308)
-1.393* (0.751)
-1.381* (0.779)
Ln(PriceRatio)* WVBorderOH -0.112 (1.148)
0.488
(1.218)
Ln(PriceRatio)* WVBorderKY -2.891 (1.963)
-2.789 (2.068)
Ln(PriceRatio)* WVBorderVA -1.260 (0.934)
-1.905* (0.977)
Ln(PriceRatio)* WVBorderMD -1.683 (1.078)
-0.977 (1.136)
Ln(PriceRatio)* WVBorderPA 1.052
(1.266)
-0.934
(1.266)
Ln(Per Capita Personal Income) 1.925*** (0.300)
-0.108 (0.603)
-0.060 (0.612)
-0.176 (0.618)
-0.065 (0.636)
Unemployment Rate 0.053*** (0.014)
0.012
(0.009)
0.015 (0.009)
Proportion of Population Over the Age of 65 -0.010 (0.018)
-0.156 (0.140)
-0.225
(0.152)
Proportion of the Population That Is Male 0.092** (2.39)
-0.113 (0.322)
-0.171 (0.330)
Proportion of the Population That is Nonwhite -0.023 (0.023)
-0.297 (0.232)
-0.249 (0.241)
Constant -16.44***
(3.675) 0.597
(0.649) -0.456
(753) 0.533
(1.058) 1.109** (1.104)
AR Coefficient 0.364 0.371 0.359 0.361
R2: 0.325 0.376 0.413 0.408 0.452
Sample size: 117 158 158 158 158 a Standard errors are shown in parentheses. With the exception of model (1), all regressions control for fixed county and time effects. b Regression (1) does not include fixed county or time effects and the sample includes just border counties. With the exception of column 1, the within R2 is reported. *Indicate 10 percent significance level. **Indicate 5 percent significance levels. ***Indicate 1 percent significance levels.
13
Tosun and Skidmore: Cross-Border Shopping
Brought to you by | Washington & Lee UniversityAuthenticated | 137.113.46.52
Download Date | 10/23/12 7:22 PM
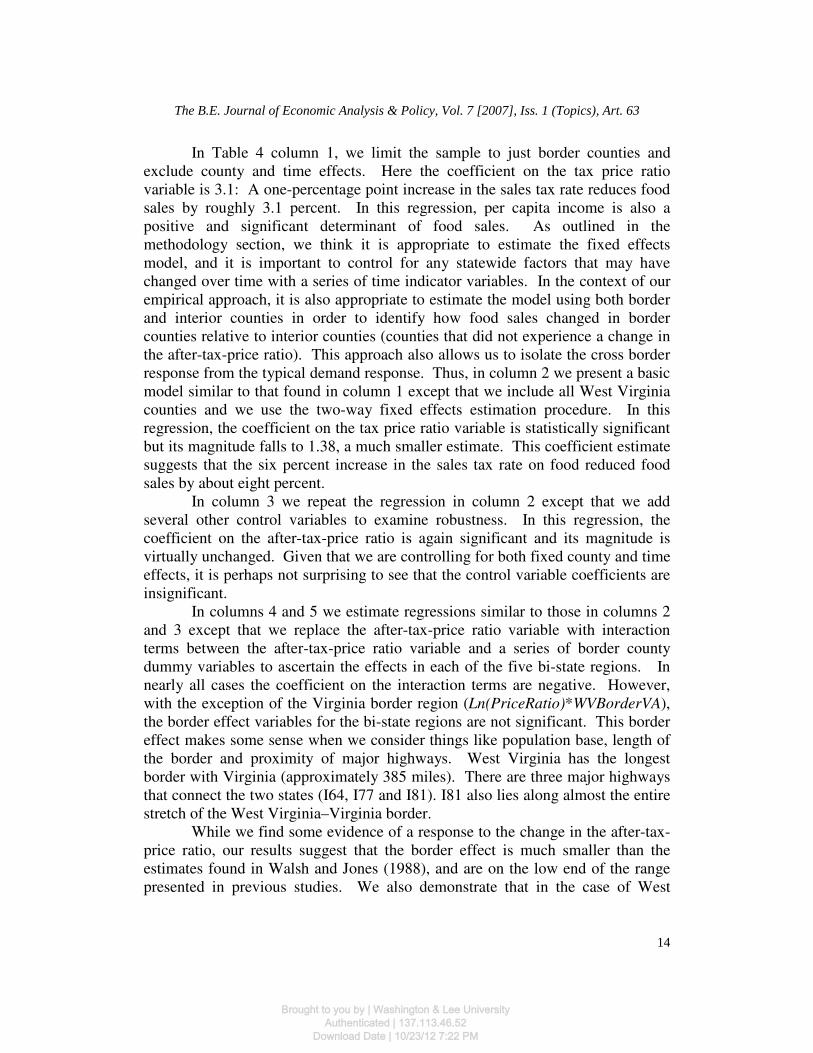
In Table 4 column 1, we limit the sample to just border counties and exclude county and time effects. Here the coefficient on the tax price ratio variable is 3.1: A one-percentage point increase in the sales tax rate reduces food sales by roughly 3.1 percent. In this regression, per capita income is also a positive and significant determinant of food sales. As outlined in the methodology section, we think it is appropriate to estimate the fixed effects model, and it is important to control for any statewide factors that may have changed over time with a series of time indicator variables. In the context of our empirical approach, it is also appropriate to estimate the model using both border and interior counties in order to identify how food sales changed in border counties relative to interior counties (counties that did not experience a change in the after-tax-price ratio). This approach also allows us to isolate the cross border response from the typical demand response. Thus, in column 2 we present a basic model similar to that found in column 1 except that we include all West Virginia counties and we use the two-way fixed effects estimation procedure. In this regression, the coefficient on the tax price ratio variable is statistically significant but its magnitude falls to 1.38, a much smaller estimate. This coefficient estimate suggests that the six percent increase in the sales tax rate on food reduced food sales by about eight percent.
In column 3 we repeat the regression in column 2 except that we add several other control variables to examine robustness. In this regression, the coefficient on the after-tax-price ratio is again significant and its magnitude is virtually unchanged. Given that we are controlling for both fixed county and time effects, it is perhaps not surprising to see that the control variable coefficients are insignificant.
In columns 4 and 5 we estimate regressions similar to those in columns 2 and 3 except that we replace the after-tax-price ratio variable with interaction terms between the after-tax-price ratio variable and a series of border county dummy variables to ascertain the effects in each of the five bi-state regions. In nearly all cases the coefficient on the interaction terms are negative. However, with the exception of the Virginia border region (Ln(PriceRatio)*WVBorderVA), the border effect variables for the bi-state regions are not significant. This border effect makes some sense when we consider things like population base, length of the border and proximity of major highways. West Virginia has the longest border with Virginia (approximately 385 miles). There are three major highways that connect the two states (I64, I77 and I81). I81 also lies along almost the entire stretch of the West Virginia–Virginia border.
While we find some evidence of a response to the change in the after-tax-price ratio, our results suggest that the border effect is much smaller than the estimates found in Walsh and Jones (1988), and are on the low end of the range presented in previous studies. We also demonstrate that in the case of West
14
The B.E. Journal of Economic Analysis & Policy, Vol. 7 [2007], Iss. 1 (Topics), Art. 63
Brought to you by | Washington & Lee UniversityAuthenticated | 137.113.46.52
Download Date | 10/23/12 7:22 PM
Virginia the only statistically significant effect is in the West Virginia-Virginia bi-state region. Thus, our estimates suggest a smaller overall effect and differing effects among the five bi-state regions.
4. Policy Implications and Conclusions
In this article we present new evidence of cross-border shopping in response to sales taxation. While several instructive studies provide estimates of the cross-border shopping effect, we add to this literature by utilizing a unique opportunity to evaluate the effect of a large discrete change in sales tax policy. Using county level data on food sales and sales tax data for West Virginia over the 1988-1991 period we estimate that for every one-percentage point increase in the county relative price ratio due to sales tax change, the per capita food sales decreases by about 1.38 percent. Our estimates indicate that food sales fell in West Virginia border counties by about eight percent as a result of the imposition of the six percent sales tax on food in 1990. Hence, while our results are consistent with those found in Walsh and Jones (1988) and other studies, we find a much smaller effect. Our estimates may be smaller for two reasons. First, we estimated the after-tax price response in border counties relative to interior counties, which isolates the cross border effect from the normal demand response to a price change. However, we believe this approach is more likely to yield a truer estimate of the cross-border substitution effect. A second possible source of difference is that we estimated the response to a six percent increase in the sales tax as opposed to a one, two or three percent change: Such a large discrete change may yield a more reliable estimate. Further, it is possible that the impact of the tax change is nonlinear, so that it may not be prudent to assume the estimated elasticity from a one percentage point change in the tax rate would be equivalent to the elasticity estimates generated from a six percentage point change in the tax rate. Using the border effect estimate from column (3) of Table 4, our results indicate that, on average, the imposition of the six percent sales tax on food sales in West Virginia border counties reduces sales by about $69 million in 1991. According to estimates in column (5) of Table 4, the annual economic impact in 1991 for the only bi-state region that exhibited statistically significant border effect was -$40 million for West Virginia counties bordering Virginia. Generally, these results confirm the findings of previous work on taxation and border shopping. However, our findings suggest that the magnitude of the effect estimated in other studies may be too high. Nevertheless, policymakers do well to consider carefully the tax structure in neighboring jurisdictions. In the case of West Virginia, the imposition of the sales tax on food resulted in a significant outflow of expenditures in border counties –about $69 million in 1991.
15
Tosun and Skidmore: Cross-Border Shopping
Brought to you by | Washington & Lee UniversityAuthenticated | 137.113.46.52
Download Date | 10/23/12 7:22 PM
In the end it may be that the benefits of imposing the sales tax on food outweighed the costs, but information presented here helps decision makers to make that assessment.
References
Alm, James. and Mikhail Melnick, “Sales Taxes and the Decision to Purchase Online,” Public Finance Review, 2005, 33,184-212.
Alm, James, Edward Sennoga and Mark Skidmore, “Perfect Competition, Urbanization, and Tax Incidence in the Retail Gasoline Market,” 2007, Economic Inquiry, Forthcoming.
Anselin, Luc, Spatial Econometrics: Methods and Models, 1988, Kluwer Academic Publishers, Dordrecht.
Anselin, Luc, Anil Bera, Raymond Florax and Mann Yoon. “Simple Diagnostic Tests for Spatial Dependence,” Regional Science and Urban Economics
1996, 26, 77-104.
Ballard, Charles, and Jaimin Lee, “Internet Purchases, Cross-border Shopping, and Sales Taxes,” 2007, National Tax Journal, Forthcoming.
Baltagi, Badi, Econometric Analysis of Panel Data, Second Edition, 2001, John Wiley & Sons, New York.
Beard, Randolph, Paul Gant and Richard Saba. “Border-Crossing Sales, Tax Avoidance, and State Tax Policies: An Application to Alcohol,” Southern
Economic Journal, 1997, 64, 293-306.
Besley, Timothy and Harvey Rosen, “Sales Taxes and Prices: An Empirical Analysis,” National Tax Journal, 1999, 52, 157-178.
Brown, James, “West Virginia Retailers’ Expectations for the 2005 Holiday Season,” West Virginia Business and Economic Review, 2005,11, 1-4.
Case, Anne, “Spatial Patterns in Household Demand,” Econometrica, 1991, 59, 953-965.
16
The B.E. Journal of Economic Analysis & Policy, Vol. 7 [2007], Iss. 1 (Topics), Art. 63
Brought to you by | Washington & Lee UniversityAuthenticated | 137.113.46.52
Download Date | 10/23/12 7:22 PM
Case, Anne, “Neighborhood Influence and Technological Change,” Regional
Science and Urban Economics, 1992, 22, 491-508. Case, Anne, Harvey Rosen, James Hines, Jr., “Budget Spillovers and Fiscal
Policy Independence: Evidence from the States,” Journal of Public
Economics, 1993, 52, 285-307. Cliff, Andrew, J. Keith Ord, Spatial Processes, Models, and Applications, 1981.
Pion, London. Dhillion, Amrita, Carlo Perroni, C., Kimberly Scharf, “Implementing Tax
Coordination.” Journal of Public Economics, 2001, 72, 243-268. Doyle, Joseph, and Krislert Samphantharak, “$2.00 Gas! Studying the Effects of
a Gas Tax Moratorium.” 2007, Journal of Public Economics, Forthcoming. Ferris, J. Stephen, “The Determinants of Cross Border Shopping: Implications for
Tax Revenues and Institutional Change,” National Tax Journal, 2001, 53, 801-824.
Fisher, Ronald, “Local Sales Taxes: Tax Rate Differentials, Sales Loss, and
Revenue Estimation,” Public Finance Quarterly, 1980, 8, 171-188. FitzGerald, John, “The Distortionary Effects of Taxes on Trade in Border Areas:
The Republic of Ireland-UK Border,” In Georg Winckler (ed.), Tax
Harmonization and Financial Liberalization in Europe, 1992, St. Martin’s Press, New York.
Fox, William, “Tax Structure and the Location of Economic Activity along State
Borders.” National Tax Journal, 1986, 39, 387-401. Garrett, Thomas A. and Thomas L. Marsh, “The Revenue Impacts of Cross-
border Lottery Shopping in the Presence of Spatial Autocorrelation,” Regional Science and Urban Economics, 2002, 32, 501-519.
Gerking, Shelby and William Morgan, “State Fiscal Structure and Economic
Development Policy.” Growth and Change, 1998, 29, 131-145. Goolsbee, Austan, “In a World without Borders: The Impact of Taxes on Internet
Commerce,” Quarterly Journal of Economics, 2000, 115, 561-76.
17
Tosun and Skidmore: Cross-Border Shopping
Brought to you by | Washington & Lee UniversityAuthenticated | 137.113.46.52
Download Date | 10/23/12 7:22 PM
Gordon, Roger, and Bo Nielson, “Tax Evasion in an Open Economy: Value-Added vs. Income Taxation,” Journal of Public Economic, 1997, 66, 173-97.
Nelson, Michael, “Using Excise Taxes to Finance State Government: Do Neighboring State Taxation Policy and Cross-Border Markets Matter?” Journal of Regional Science, 2002, 42, 731-752.
Neumann, Rebecca, Jill Holman, and James Alm, “Globalization and Tax Policy,” 2002, University of Wisconsin-Milwaukee Working Paper.
Ohsawa, Yoshiaki, “A Spatial Tax Harmonization Model,” European Economic
Review, 2003, 47, 443-459.
Ohsawa, Yoshiaki, “Cross-border Shopping and Commodity Tax Competition Among Governments,” Regional Science and Urban Economics, 1999, 29, 33-51.
Peralta, Susana and Tanguy van Ypersele, “Coordination of Capital Taxation among Asymmetric Countries,” 2002, CORE-UCL Working Paper.
Pisati, Maurizio, sg162: “Tools for Spatial Data Analysis.” Stata Technical
Bulletin, 2001, 60, 21-37.
Poterba, James, “Retail Price Reactions to Changes in State and Local Sales Taxes,” National Tax Journal, 1996, 49, 165-176.
Snodgrass, Dodd W. and Daniel M. Otto, “Analysis of State and Local Sales Taxation in Rural Areas: An Oklahoma Case Study,” Growth and Change, 1990, 21, 34-45.
Tanzi, Vito, Taxation in an Integrating World, 1995. The Brookings Institution, Washington D.C.
Tosun, Mehmet and Mark Skidmore, “Interstate Competition and Lottery Revenues,” National Tax Journal, 2004, 57, 163-178.
Walsh, Michael and Jonathan Jones, “More Evidence on the Border Tax Effect: The Case of West Virginia, 1979-84.” National Tax Journal, 1988, 41, 261-265.
18
The B.E. Journal of Economic Analysis & Policy, Vol. 7 [2007], Iss. 1 (Topics), Art. 63
Brought to you by | Washington & Lee UniversityAuthenticated | 137.113.46.52
Download Date | 10/23/12 7:22 PM


![The B.E. Journal of Economic Analysis & Policy Files/9_Dafny_Data Impediments to... · The B.E. Journal of Economic Analysis & Policy, Vol. 11 [2011], Iss. 2 (Contributions), Art](https://img.pdfslide.us/doc/110x75/5b7836837f8b9a8f698e843b/the-be-journal-of-economic-analysis-files9dafnydata-impediments-to.jpg)