Embed Size (px)
Citation preview

THE BANK LENDING CHANNEL OF UNCONVENTIONAL MONETARY POLICY: THE IMPACT OF THE VLTROS ON CREDIT SUPPLY IN SPAIN
Miguel García-Posada and Marcos Marchetti
Documentos de Trabajo N.º 1512
2015

THE BANK LENDING CHANNEL OF UNCONVENTIONAL MONETARY
POLICY: THE IMPACT OF THE VLTROS ON CREDIT SUPPLY IN SPAIN

THE BANK LENDING CHANNEL OF UNCONVENTIONAL MONETARY POLICY: THE IMPACT OF THE VLTROS ON CREDIT SUPPLY IN SPAIN (*)
Miguel García-Posada (**)
BANCO DE ESPAÑA AND UNIVERSIDAD CARLOS III DE MADRID
Marcos Marchetti (***)
BANCO DE ESPAÑA
(*) We are especially grateful to Jorge Martínez for his valuable guidance and suggestions. We also thank Roberto Blanco, Christian Castro, Ángel Estrada, Gabriel Jiménez, Aitor Lacuesta, Carmen Martínez-Carrascal, Carlos Thomas and seminar participants at Banco de España, Banca d’Italia and Banque de France for their comments. The views expressed herein are those of the authors and should not be attributed to the Banco de España or the Eurosystem. (**) Corresponding author. Email: [email protected]. Tel. (+34) 913385479. Banco de España. Alcalá 48, 28014 Madrid. (***) Email: [email protected]. Tel. (+34) 913388752. Banco de España.
Documentos de Trabajo. N.º 1512 2015

The Working Paper Series seeks to disseminate original research in economics and fi nance. All papers have been anonymously refereed. By publishing these papers, the Banco de España aims to contribute to economic analysis and, in particular, to knowledge of the Spanish economy and its international environment.
The opinions and analyses in the Working Paper Series are the responsibility of the authors and, therefore, do not necessarily coincide with those of the Banco de España or the Eurosystem.
The Banco de España disseminates its main reports and most of its publications via the Internet at the following website: http://www.bde.es.
Reproduction for educational and non-commercial purposes is permitted provided that the source is acknowledged.
© BANCO DE ESPAÑA, Madrid, 2015
ISSN: 1579-8666 (on line)
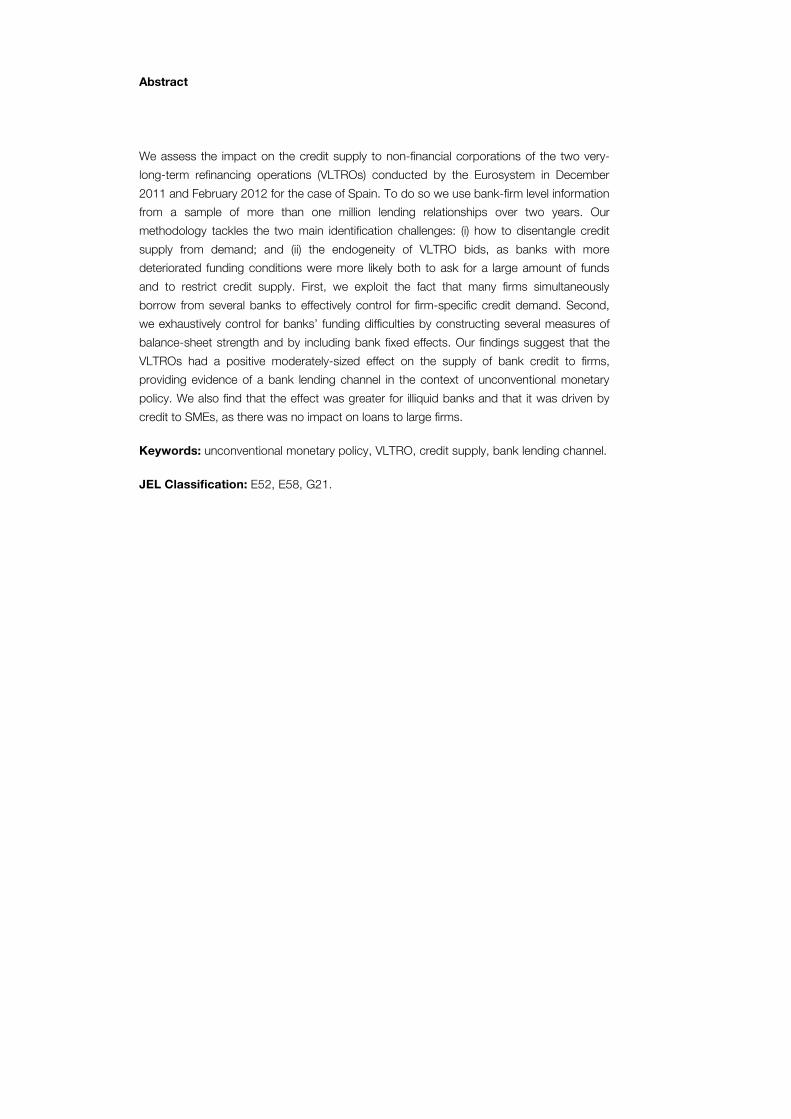
Abstract
We assess the impact on the credit supply to non-financial corporations of the two very-
long-term refinancing operations (VLTROs) conducted by the Eurosystem in December
2011 and February 2012 for the case of Spain. To do so we use bank-firm level information
from a sample of more than one million lending relationships over two years. Our
methodology tackles the two main identification challenges: (i) how to disentangle credit
supply from demand; and (ii) the endogeneity of VLTRO bids, as banks with more
deteriorated funding conditions were more likely both to ask for a large amount of funds
and to restrict credit supply. First, we exploit the fact that many firms simultaneously
borrow from several banks to effectively control for firm-specific credit demand. Second,
we exhaustively control for banks’ funding difficulties by constructing several measures of
balance-sheet strength and by including bank fixed effects. Our findings suggest that the
VLTROs had a positive moderately-sized effect on the supply of bank credit to firms,
providing evidence of a bank lending channel in the context of unconventional monetary
policy. We also find that the effect was greater for illiquid banks and that it was driven by
credit to SMEs, as there was no impact on loans to large firms.
Keywords: unconventional monetary policy, VLTRO, credit supply, bank lending channel.
JEL Classification: E52, E58, G21.
Resumen
El presente trabajo evalúa el impacto en el crédito a sociedades no financieras de las dos
operaciones de financiación a tres años (VLTRO, en sus siglas en inglés) efectuadas por el
Eurosistema en diciembre de 2011 y febrero de 2012 en el caso de España. Para ello se usa
información a escala de banco-empresa de una muestra de más de un millón de relaciones
de crédito durante dos años. La metodología implementada hace frente a los dos principales
problemas de identificación: i) cómo separar la oferta de crédito de su demanda, y ii) la
endogenidad de las peticiones de fondos en las VLTRO, puesto que es probable que los
bancos con condiciones de financiación más deterioradas pidieran más fondos y contrajeran
más el crédito. Primero, se usa el hecho de que muchas empresas tienen préstamos con
varios bancos al mismo tiempo para controlar por la demanda de crédito específica a cada
empresa. Segundo, se controla exhaustivamente por las dificultades de financiación de los
bancos mediante la construcción de diversas medidas de fortaleza financiera y mediante la
inclusión de efectos fijos de banco. Los resultados sugieren que las VLTRO tuvieron un
efecto positivo, de tamaño moderado, en la oferta de crédito bancario a las empresas, lo que
evidencia la existencia de un canal de crédito bancario en el marco de políticas monetarias no
convencionales. También se encuentra que el efecto fue mayor en los bancos con menor
liquidez y que dicho efecto fue principalmente impulsado por el crédito a pymes, dado que no
hubo impacto alguno en la oferta de préstamos a grandes empresas.
Palabras clave: políticas monetarias no convencionales, oferta de crédito, canal de crédito
bancario.
Códigos JEL: E52, E58, G21.
BANCO DE ESPAÑA 7 DOCUMENTO DE TRABAJO N.º 1512
1 Introduction
The intensification of the European sovereign debt crisis in the second half of 2011 hampered
euro area banks’ access to market based-funding, both in the bond and monetary markets,
especially in Greece, Portugal, Ireland, Italy and Spain. In those countries, bank CDS soared
in parallel with the spreads of their sovereign bonds against the corresponding German
figures, while their stock prices plummeted. Euro area banks mainly relied on the funds
provided by the Eurosystem to sustain their liquidity position and their funding and
deleveraging pressures raised the risk of disruptions in the credit supply to the non-financial
private sector.
Against this backdrop, the ECB Governing Council decided to implement
additional non-standard policy measures on 8 December 2011, which aimed to forestall
a further contraction of credit through the mitigation of liquidity and funding risks. The
agreed package of measures included two very long term refinancing operations
(VLTROs) with a maturity of three years and the option of early repayment after one year,
carried out as fixed rate tender procedures with full allotment. The interest rates of those
operations were set much lower than those borne by banks in wholesale markets at the
time.1 The first VLTRO, conducted on 21 December 2011, provided €489 billion to 523
banks.2 The second one took place on 29 February 2012 and allotted €530 billion to 800
credit institutions. Adding up the two, the total net refinancing amounted to more than
€500 billion3
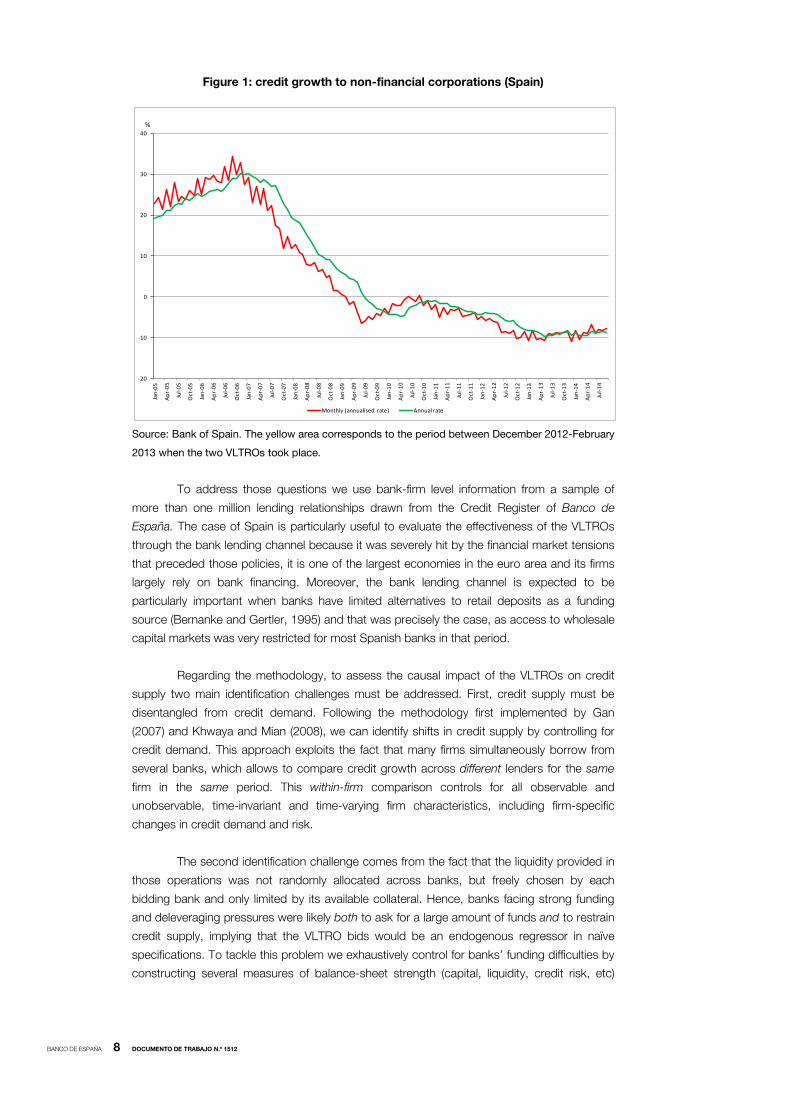
All the above figures imply that the VLTROs can be best regarded as a large positive
liquidity shock to euro-area banks. But, since lending to the non-financial private sector kept
declining –as shown for the case of Spanish firms in Figure 1- serious doubts about its
effectiveness were raised. Nevertheless, the absence of a natural counterfactual, i.e., what
would have happened had the Eurosystem not implemented the VLTROs, lead us to consider
the following research question: would have lending declined much more if the VLTROs
hadn’t taken place? To put it differently, given the extremely weak macroeconomic conditions
prevailing in that period –which reduced credit demand and increased credit risk- and the
liquidity and funding risks experienced by banks –which constrained credit supply- did the
VLTROs prevent a credit crunch?
. The total liquidity injection was massive: it increased the size of the
Eurosystem’s balance sheet by more than a fifth and accounted for 80% of the monetary
base in the euro area, 20% of the total bank credit to euro area firms and almost 11% of
the area’s GDP (Andrade et al., 2015).
1.The rate was fixed at the average rate of the main refinancing operations over the life of the respective operation. Interest had to be paid when the respective operation matured. 2. This amount included €45.7 billion transferred from the 12-month LTRO allotted in October. 3. For further details see the ECB Monthly Bulletin of January and March 2012.
BANCO DE ESPAÑA 8 DOCUMENTO DE TRABAJO N.º 1512
Figure 1: credit growth to non-financial corporations (Spain)
Source: Bank of Spain. The yellow area corresponds to the period between December 2012-February
2013 when the two VLTROs took place.
To address those questions we use bank-firm level information from a sample of
more than one million lending relationships drawn from the Credit Register of Banco de
España. The case of Spain is particularly useful to evaluate the effectiveness of the VLTROs
through the bank lending channel because it was severely hit by the financial market tensions
that preceded those policies, it is one of the largest economies in the euro area and its firms
largely rely on bank financing. Moreover, the bank lending channel is expected to be
particularly important when banks have limited alternatives to retail deposits as a funding
source (Bernanke and Gertler, 1995) and that was precisely the case, as access to wholesale
capital markets was very restricted for most Spanish banks in that period.
Regarding the methodology, to assess the causal impact of the VLTROs on credit
supply two main identification challenges must be addressed. First, credit supply must be
disentangled from credit demand. Following the methodology first implemented by Gan
(2007) and Khwaya and Mian (2008), we can identify shifts in credit supply by controlling for
credit demand. This approach exploits the fact that many firms simultaneously borrow from
several banks, which allows to compare credit growth across different lenders for the same
firm in the same period. This within-firm comparison controls for all observable and
unobservable, time-invariant and time-varying firm characteristics, including firm-specific
changes in credit demand and risk.
The second identification challenge comes from the fact that the liquidity provided in
those operations was not randomly allocated across banks, but freely chosen by each
bidding bank and only limited by its available collateral. Hence, banks facing strong funding
and deleveraging pressures were likely both to ask for a large amount of funds and to restrain
credit supply, implying that the VLTRO bids would be an endogenous regressor in naïve
specifications. To tackle this problem we exhaustively control for banks’ funding difficulties by
constructing several measures of balance-sheet strength (capital, liquidity, credit risk, etc)
-20
-10
0
10
20
30
40
Jan-
05
Apr-
05
Jul-0
5
Oct
-05
Jan-
06
Apr-
06
Jul-0
6
Oct
-06
Jan-
07
Apr-
07
Jul-0
7
Oct
-07
Jan-
08
Apr-
08
Jul-0
8
Oct
-08
Jan-
09
Apr-
09
Jul-0
9
Oct
-09
Jan-
10
Apr-
10
Jul-1
0
Oct
-10
Jan-
11
Apr-
11
Jul-1
1
Oct
-11
Jan-
12
Apr-
12
Jul-1
2
Oct
-12
Jan-
13
Apr-
13
Jul-1
3
Oct
-13
Jan-
14
Apr-
14
Jul-1
4
Aggregate credit growth to NFCs
Monthly (annualised rate) Annual rate
%

BANCO DE ESPAÑA 9 DOCUMENTO DE TRABAJO N.º 1512
using the confidential supervisory reports owned by Banco de España and we include bank
fixed effects to account for time-invariant unobserved heterogeneity.
Our findings suggest that the VLTROs had a positive moderate-sized effect on the
supply of bank credit to firms in the twelve4 months after the first VLTRO (December 2011-
November 2012), providing evidence of a bank lending channel in the context of
unconventional monetary policy. Specifically, the aggregate impact of the two VLTROs on
annual credit growth ranged between 0.8% and 1%. Of course, this does not mean that the
VLTROs actually increased the available credit, but that they reduced the rate of contraction
of lending: if they had not been implemented, credit to non-financial corporations would have
decreased at a rate 0.8% higher than it did5
We also study whether the VLTROs had a heterogenous impact on banks depending
of their balance-sheet strength. We find that, as in Jiménez et al. (2012),
.
6 the impact was
greater on illiquid banks but, unlike their work, we find no differential effect regarding capital.
We have two complementary explanations to this finding. First, as argued by Albertazzi et al.
(2014), during systemic crises the nature of the bank lending channel may change. Second,
regulatory capital, rather than leverage, may be the appropriate variable to look at during
those crises7
Finally, we find that the VLTROs had a sizeable impact on the credit to SMEs, while
they had no effect on the loans to large firms. This is an important aspect to take into account
when assessing the effectiveness of the VLTROs because SMEs are much more vulnerable to
a credit crunch than larger companies, as they often do not have access to alternative
sources of external finance (debt and equity markets).
.
Nevertheless, a limitation of our study is that it only evaluates the direct impact of the
VLTROs on bank credit, but there may be important indirect channels we ignore. For instance, by
bolstering investors’ confidence, the VLTROs may have improved banks’ access to wholesale
markets, which may have been translated into more lending to the private sector. Consistent with
this idea, Dubecq et al. (2014) find that the VLTROs helped to ease the euro interbank market. In
addition, according to Acharya and Steffen (2014), the VLTROs, by increasing the demand for
sovereign debt by banks, helped to reduce sovereign spreads. Due to the positive correlation
between sovereign spreads and private sector interest rates (Pancrazi et al., 2014), the VLTROs
would have indirectly reduced the borrowing costs borne by households and non-financial
corporations. Finally, it cannot be ruled out that the VLTROs helped to repair banks’ balance
sheets, which could have had an indirect further impact on lending.
The rest of the paper is organised as follows. Section 2 reviews the most relevant
literature on the subject. Section 3 discusses the identification strategy in detail. Section 4
explains the data sources and the sample selection and Section 5 describes the variables
used in the empirical analyses. Section 6 comments on the main results, while Section 7
displays some robustness analyses. Section 8 concludes.
4. Notice that, as the VLTROs had a maturity of 36 months with the option of early repayment after one year, any potential effect on the supply of credit is likely to be temporary. We restrict our study to the twelve months after the first VLTRO to identify the full liquidity shock implied by the VLTROs, i.e., before any possible repayment. 5. The average annual growth rate of the credit to non-financial corporations in the twelve months after the first VLTRO (between December 2011 and November 2012) was -5.1%, 6. Jiménez et al. (2012) also use the Spanish Credit Register to analyse the bank lending channel. However, they focus on monetary shocks measured by changes in money market rates, rather than on unconventional monetary policies. 7. In fact, Albertazzi et al. (2014), who use the supervisory Tier 1 capital ratio, find that the VLTROs were more effective in improving lending supply to SMEs (compared to larger firms) for illiquid but well-capitalised banks.
BANCO DE ESPAÑA 10 DOCUMENTO DE TRABAJO N.º 1512
2 Literature review
While there is a large body of literature on unconventional monetary policy (see, inter alia,
reviews in Cecioni et al. 2012 and Joyce et al. 2012) few works have specifically studied the
impact of the VLTROs. Darracq-Paries and De Santis (2013) use (aggregate) information on
credit supply conditions from the ECB’s Bank Lending Survey (BLS) to identify the credit
supply shock implied by the VLTROs in a panel-VAR for euro area countries. Their
counterfactual experiments point to a relevant increase in bank loans to non-financial
corporations and a moderate narrowing of lending rate spreads, together with a significant
increase in the euro area real GDP and a somewhat higher inflation over the next two-to-three
years. With more disaggregated information, Casiraghi et al. (2012) use bank-level data and
the individual answers of the Italian banks to the BLS to assess the impact of the ECB’s
Securities Markets Programme (SMP), the VLTROs and the Outright Monetary Operations
(OMT) on government yields, money market interest rates and credit availability. Then they
use their estimations, together with the Bank of Italy model of the Italian economy, to gauge
their macroeconomic impact. In the specific case of the VLTROs, using both regression and
event-study methodologies, they find that the VLTROs significantly eased credit supply
conditions –as proxied by the BLS index of credit supply- and substantially reduced the
interest rates paid by Italian banks in the interbank market8
Besides our paper, there are only two other works that –to the best of our
knowledge- study the impact of VLTROs on credit growth using bank-firm level data.
Albertazzi et al. (2014) make use of the loan-level information of the Italian Credit Register and
the fact that many firms borrow from several lenders to identify shifts in credit demand from
shifts in credit supply, following the methodology first implemented by Gan (2007) and
Khwaya and Mian (2008). They also control for the endogeneity of the VLTROs take-up
(weaker banks are likely to borrow more funds and to restrict more credit supply) using an IV
approach and bank fixed effects. While they do not find significant effects on lending growth
for the average bank-firm lending relationship, they do find that the VLTROs were more
effective in improving lending supply for SMES (compared to larger firms) for banks
characterised by both a relatively large funding gap
. They also find that the overall
impact of the three policies on GDP growth, mainly via the credit channel, was a cumulative
increase of 2.7 pp over the period 2012-2013.
9
8. A similar result is found by Dubecq et al. (2014) in their analysis of the impact of the SMP, the VLTROs and the OMT on both liquidity and credit risks in the interbank market. Specifically, the VLTROs reduced liquidity premia by around 50 bp, while their effect on credit risk was much smaller.
and a relatively favourable capitalization.
Andrade et al. (2015) use the loan-level information of the French Credit Register and
individual bank balance-sheet information, as well as data on credit-risk rating and balance
sheets for a subsample of firms, to tackle the same identification issues. Their main finding is
that the VLTROs had a positive and sizeable impact on the supply of banking credit. They
also find that the first VLTRO (December 2011) was more effective than the second one
(February 2012) and that there was substantial heterogeneity in their impact across borrowers
and lenders. Specifically, the VLTROs had a greater impact for larger companies, with the
smallest firms not benefiting at all. Moreover, the effect was higher for firms whose loans
were eligible to the Additional Credit Claim (ACC) program and for firms with more banking
relationships, and lower for companies with long relationships with their banks. Finally, more
capitalised banks lent marginally more.
9. Defined as the difference between retail loans and retail funding over retail loans.

BANCO DE ESPAÑA 11 DOCUMENTO DE TRABAJO N.º 1512
3 Identification strategy
We can express our identification strategy with the following equations:
∆𝐶𝑟𝑒𝑑𝑖𝑡𝑖𝑗𝑡 = 𝛽𝑉𝐿𝑇𝑅𝑂𝑖𝑡 + 𝑎𝑗𝑡 + 𝑏𝑖 + ∑ 𝑏𝑘𝐵𝐴𝑁𝐾_𝑉𝐴𝑅𝑖𝑡−1𝑘𝐾𝑘=1 + 𝑒𝑖𝑗𝑡 (1)
𝑉𝐿𝑇𝑅𝑂𝑖𝑡 = 𝑉𝐿𝑇𝑅𝑂𝑖 ∙ 𝐼(𝑡 ≥ 2011𝑀12) (2)
where i refers to bank, j to firm and t to year:month; 𝑉𝐿𝑇𝑅𝑂𝑖𝑡 is our key regressor, the
product of the gross amount of funds borrowed at the two VLTROs scaled by the bank’s total
assets (𝑉𝐿𝑇𝑅𝑂𝑖) and an indicator variable 𝐼(𝑡 ≥ 2011𝑀12) that equals 1 since December 2012 (when the first VLTRO took place); 𝑎𝑗𝑡 are time-varying firm fixed effects, 𝑏𝑖 are bank
fixed effects, BANK_VAR are time-varying bank characteristics and 𝑒𝑖𝑗𝑡 is a regression
disturbance. Following Jiménez et al (2012) BANK_VAR are lagged one period to alleviate
endogeneity concerns.
Our goal is to identify the causal impact of the provision of liquidity via the two
VLTROs on the supply of credit by Spanish banks to Spanish firms. The first identification
challenge is to disentangle changes in credit supply from changes in credit demand, as what
we observe is the equilibrium outcome, credit growth, and those changes are often correlated
(Bentolila et al., 2013). For instance, a credit contraction in the midst of a financial crisis can
be due to a reduction in credit supply (banks reduce credit supply to increase their capital and
liquidity buffers) and to a downward shift of credit demand (firms reduce their demand for
credit as they find less profitable investment opportunities).
The second identification challenge arises from the possible correlation between
banks’ recourse to non-standard measures such as VLTROs and supply problems. As banks
with more deteriorated funding conditions are more likely both to borrow more funds in the
VLTROs and to cut loan supply, our variable of interest, the liquidity provided by the VLTROs,
may be endogenous.
We address the first problem by exploiting the fact that firms often borrow from
several lenders, a strategy first implemented by Gan (2007) and Khwaja and Mian (2008). This allows us to include in the regression time-varying firm fixed effects 𝑎𝑗𝑡 (i.e., a dummy for
every firm-year:month combination) that control for all (observed and unobserved) firm
heterogeneity, including credit demand. Not controlling for demand would imply an omitted variable bias if 𝑐𝑜𝑟𝑟(𝑉𝐿𝑇𝑅𝑂𝑖𝑡,𝑎𝑗𝑡) ≠ 0, which is likely to be case, as the same factors that
influence banks’ recourse to VLTROs (economic downturn, financial distress) are expected to affect firm’s borrowing behaviour, as captured by 𝑎𝑗𝑡. The sign of the bias cannot be
ascertained a priori, as it depends on the borrowing behaviour of firms during recessions.
Two scenarios can arise. First, if firms demand less credit during recessions (because of less
positive NPV projects), then we should expect a downward bias in our estimates because there would be a negative correlation between 𝑉𝐿𝑇𝑅𝑂𝑖𝑡 and the omitted variable 𝑎𝑗𝑡 (the
deeper the recession, the higher the bids by banks in the VLTROs and the lower the demand
by firms). Second, if firms demand more credit during recessions (to avoid financial distress or
having to sell core assets to offset their operating losses), then we should expect an upward
bias in our estimates because there would be a positive correlation between 𝑉𝐿𝑇𝑅𝑂𝑖𝑡 and the

BANCO DE ESPAÑA 12 DOCUMENTO DE TRABAJO N.º 1512
omitted variable 𝑎𝑗𝑡 (the deeper the recession, the higher the bids by banks in the VLTROs
and the higher the demand by firms)10
To address the second problem we need to control for banks’ funding conditions in our regressions to ensure 𝑐𝑜𝑟𝑟�𝑉𝐿𝑇𝑅𝑂𝑖𝑡, 𝑒𝑖𝑗𝑡� = 0. To do so we include a very
comprehensive set of time-varying bank characteristics that capture factors such as liquidity,
capital, loan quality, diversification of the credit portfolio, profitability and size (see their
description in section 5) as well as bank fixed effects. Even if this approach did not fully
remove this bias, we would know its sign: we would expect a downward bias in the
coefficient on the VLTRO uptake, as banks with more (less) deteriorated funding conditions
are expected to borrow more (less) funds in the VLTROs and to exhibit a lower (higher) credit
growth. Hence our identification strategy would estimate the lower bound of the true causal
impact.
.
10. Another source of bias would occur if firms are not randomly assigned to banks and banks’ bids at the VLTROs depend on their financial strength. If weaker firms tend to match with weaker banks (Gertler and Gilchrist, 1994) and weaker banks borrow more funds in the VLTROs, the sign of the bias will depend on the borrowing behaviour of weak firms.
BANCO DE ESPAÑA 13 DOCUMENTO DE TRABAJO N.º 1512
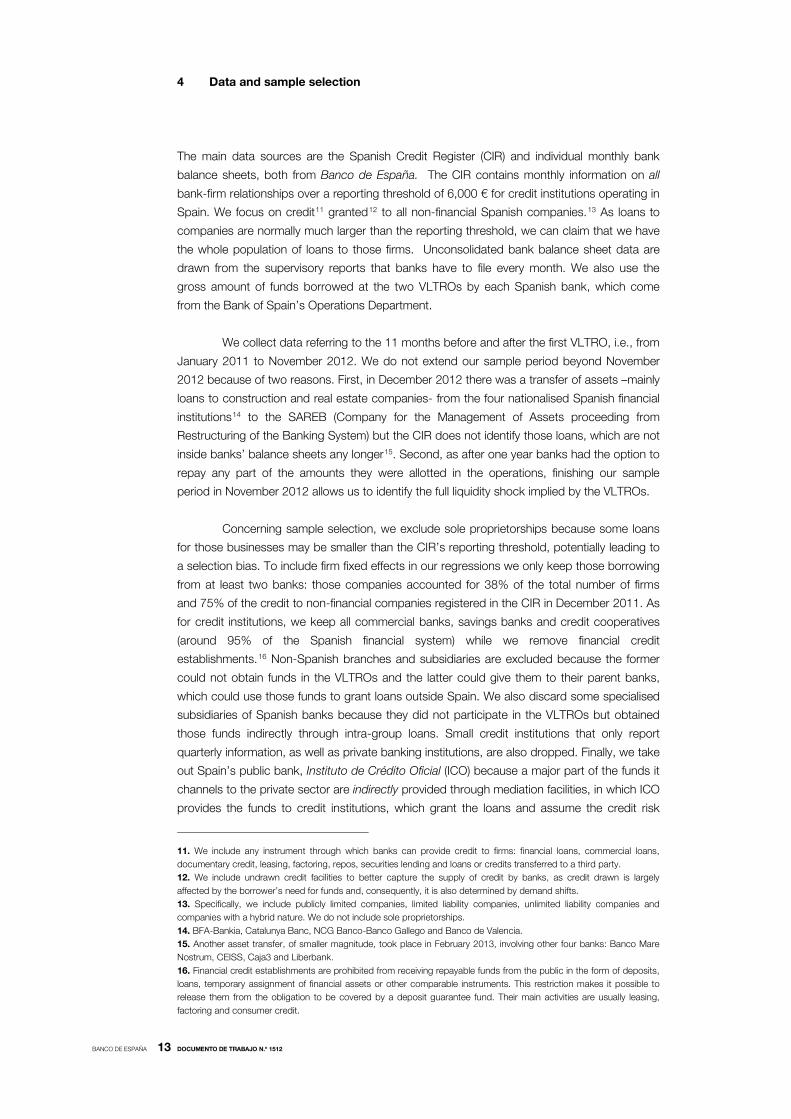
4 Data and sample selection
The main data sources are the Spanish Credit Register (CIR) and individual monthly bank
balance sheets, both from Banco de España. The CIR contains monthly information on all
bank-firm relationships over a reporting threshold of 6,000 € for credit institutions operating in
Spain. We focus on credit11 granted12 to all non-financial Spanish companies.13
We collect data referring to the 11 months before and after the first VLTRO, i.e., from
January 2011 to November 2012. We do not extend our sample period beyond November
2012 because of two reasons. First, in December 2012 there was a transfer of assets –mainly
loans to construction and real estate companies- from the four nationalised Spanish financial
institutions
As loans to
companies are normally much larger than the reporting threshold, we can claim that we have
the whole population of loans to those firms. Unconsolidated bank balance sheet data are
drawn from the supervisory reports that banks have to file every month. We also use the
gross amount of funds borrowed at the two VLTROs by each Spanish bank, which come
from the Bank of Spain’s Operations Department.
14 to the SAREB (Company for the Management of Assets proceeding from
Restructuring of the Banking System) but the CIR does not identify those loans, which are not
inside banks’ balance sheets any longer15
Concerning sample selection, we exclude sole proprietorships because some loans
for those businesses may be smaller than the CIR’s reporting threshold, potentially leading to
a selection bias. To include firm fixed effects in our regressions we only keep those borrowing
from at least two banks: those companies accounted for 38% of the total number of firms
and 75% of the credit to non-financial companies registered in the CIR in December 2011. As
for credit institutions, we keep all commercial banks, savings banks and credit cooperatives
(around 95% of the Spanish financial system) while we remove financial credit
establishments.
. Second, as after one year banks had the option to
repay any part of the amounts they were allotted in the operations, finishing our sample
period in November 2012 allows us to identify the full liquidity shock implied by the VLTROs.
16
11. We include any instrument through which banks can provide credit to firms: financial loans, commercial loans, documentary credit, leasing, factoring, repos, securities lending and loans or credits transferred to a third party.
Non-Spanish branches and subsidiaries are excluded because the former
could not obtain funds in the VLTROs and the latter could give them to their parent banks,
which could use those funds to grant loans outside Spain. We also discard some specialised
subsidiaries of Spanish banks because they did not participate in the VLTROs but obtained
those funds indirectly through intra-group loans. Small credit institutions that only report
quarterly information, as well as private banking institutions, are also dropped. Finally, we take
out Spain’s public bank, Instituto de Crédito Oficial (ICO) because a major part of the funds it
channels to the private sector are indirectly provided through mediation facilities, in which ICO
provides the funds to credit institutions, which grant the loans and assume the credit risk
12. We include undrawn credit facilities to better capture the supply of credit by banks, as credit drawn is largely affected by the borrower’s need for funds and, consequently, it is also determined by demand shifts. 13. Specifically, we include publicly limited companies, limited liability companies, unlimited liability companies and companies with a hybrid nature. We do not include sole proprietorships. 14. BFA-Bankia, Catalunya Banc, NCG Banco-Banco Gallego and Banco de Valencia. 15. Another asset transfer, of smaller magnitude, took place in February 2013, involving other four banks: Banco Mare Nostrum, CEISS, Caja3 and Liberbank. 16. Financial credit establishments are prohibited from receiving repayable funds from the public in the form of deposits, loans, temporary assignment of financial assets or other comparable instruments. This restriction makes it possible to release them from the obligation to be covered by a deposit guarantee fund. Their main activities are usually leasing, factoring and consumer credit.
BANCO DE ESPAÑA 14 DOCUMENTO DE TRABAJO N.º 1512
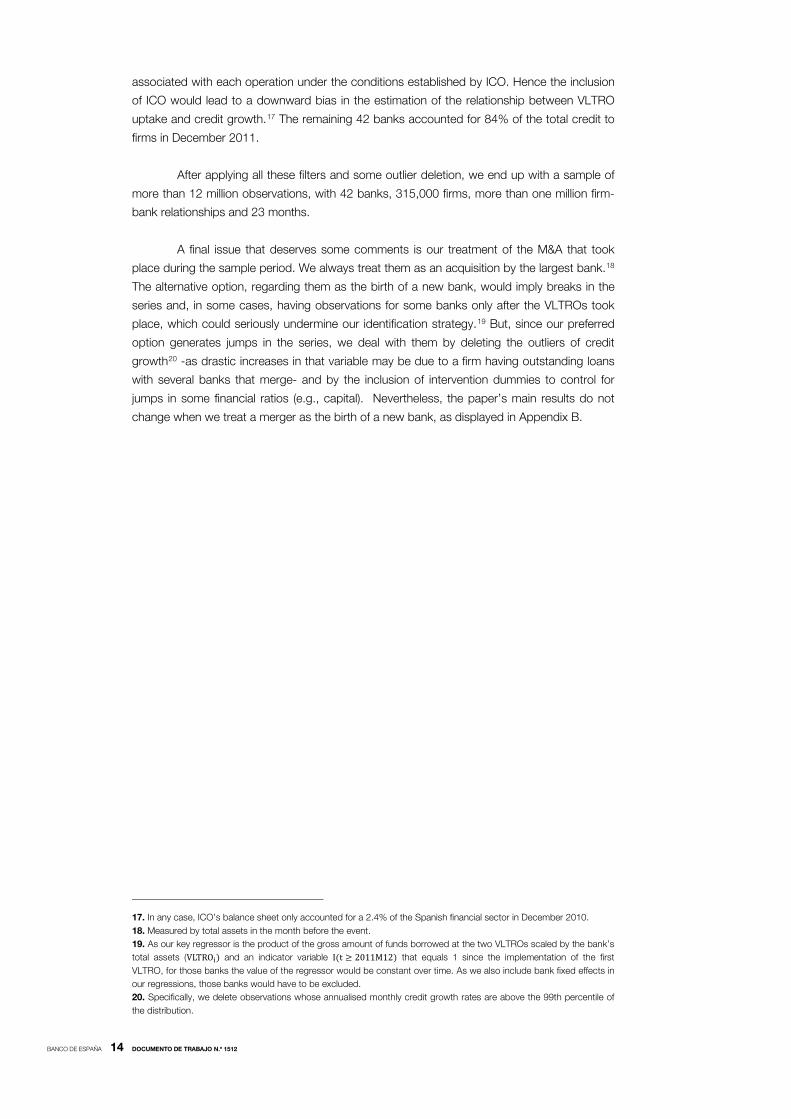
associated with each operation under the conditions established by ICO. Hence the inclusion
of ICO would lead to a downward bias in the estimation of the relationship between VLTRO
uptake and credit growth.17
After applying all these filters and some outlier deletion, we end up with a sample of
more than 12 million observations, with 42 banks, 315,000 firms, more than one million firm-
bank relationships and 23 months.
The remaining 42 banks accounted for 84% of the total credit to
firms in December 2011.
A final issue that deserves some comments is our treatment of the M&A that took
place during the sample period. We always treat them as an acquisition by the largest bank.18
The alternative option, regarding them as the birth of a new bank, would imply breaks in the
series and, in some cases, having observations for some banks only after the VLTROs took
place, which could seriously undermine our identification strategy.19 But, since our preferred
option generates jumps in the series, we deal with them by deleting the outliers of credit
growth20
17. In any case, ICO’s balance sheet only accounted for a 2.4% of the Spanish financial sector in December 2010.
-as drastic increases in that variable may be due to a firm having outstanding loans
with several banks that merge- and by the inclusion of intervention dummies to control for
jumps in some financial ratios (e.g., capital). Nevertheless, the paper’s main results do not
change when we treat a merger as the birth of a new bank, as displayed in Appendix B.
18. Measured by total assets in the month before the event. 19. As our key regressor is the product of the gross amount of funds borrowed at the two VLTROs scaled by the bank’s total assets (VLTROi) and an indicator variable I(t ≥ 2011M12) that equals 1 since the implementation of the first VLTRO, for those banks the value of the regressor would be constant over time. As we also include bank fixed effects in our regressions, those banks would have to be excluded. 20. Specifically, we delete observations whose annualised monthly credit growth rates are above the 99th percentile of the distribution.
BANCO DE ESPAÑA 15 DOCUMENTO DE TRABAJO N.º 1512
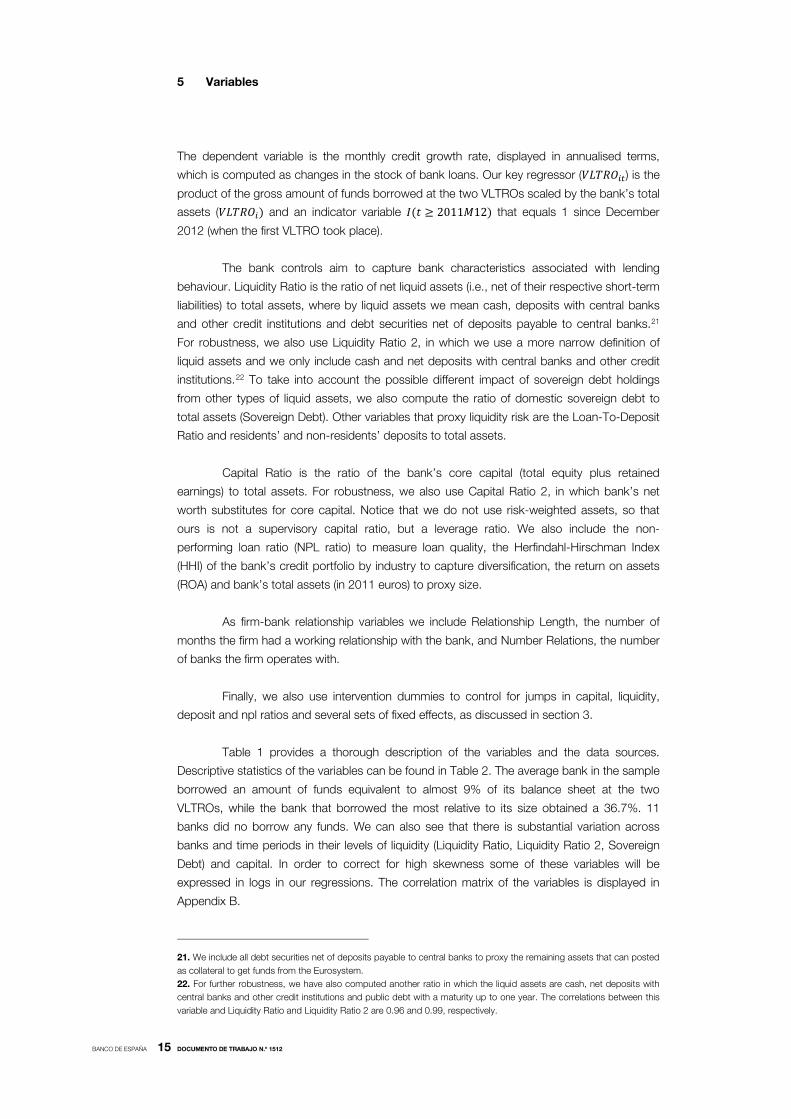
5 Variables
The dependent variable is the monthly credit growth rate, displayed in annualised terms,
which is computed as changes in the stock of bank loans. Our key regressor (𝑉𝐿𝑇𝑅𝑂𝑖𝑡) is the
product of the gross amount of funds borrowed at the two VLTROs scaled by the bank’s total
assets (𝑉𝐿𝑇𝑅𝑂𝑖) and an indicator variable 𝐼(𝑡 ≥ 2011𝑀12) that equals 1 since December
2012 (when the first VLTRO took place).
The bank controls aim to capture bank characteristics associated with lending
behaviour. Liquidity Ratio is the ratio of net liquid assets (i.e., net of their respective short-term
liabilities) to total assets, where by liquid assets we mean cash, deposits with central banks
and other credit institutions and debt securities net of deposits payable to central banks.21
For robustness, we also use Liquidity Ratio 2, in which we use a more narrow definition of
liquid assets and we only include cash and net deposits with central banks and other credit
institutions.22
Capital Ratio is the ratio of the bank’s core capital (total equity plus retained
earnings) to total assets. For robustness, we also use Capital Ratio 2, in which bank’s net
worth substitutes for core capital. Notice that we do not use risk-weighted assets, so that
ours is not a supervisory capital ratio, but a leverage ratio. We also include the non-
performing loan ratio (NPL ratio) to measure loan quality, the Herfindahl-Hirschman Index
(HHI) of the bank’s credit portfolio by industry to capture diversification, the return on assets
(ROA) and bank’s total assets (in 2011 euros) to proxy size.
To take into account the possible different impact of sovereign debt holdings
from other types of liquid assets, we also compute the ratio of domestic sovereign debt to
total assets (Sovereign Debt). Other variables that proxy liquidity risk are the Loan-To-Deposit
Ratio and residents’ and non-residents’ deposits to total assets.
As firm-bank relationship variables we include Relationship Length, the number of
months the firm had a working relationship with the bank, and Number Relations, the number
of banks the firm operates with.
Finally, we also use intervention dummies to control for jumps in capital, liquidity,
deposit and npl ratios and several sets of fixed effects, as discussed in section 3.
Table 1 provides a thorough description of the variables and the data sources.
Descriptive statistics of the variables can be found in Table 2. The average bank in the sample
borrowed an amount of funds equivalent to almost 9% of its balance sheet at the two
VLTROs, while the bank that borrowed the most relative to its size obtained a 36.7%. 11
banks did no borrow any funds. We can also see that there is substantial variation across
banks and time periods in their levels of liquidity (Liquidity Ratio, Liquidity Ratio 2, Sovereign
Debt) and capital. In order to correct for high skewness some of these variables will be
expressed in logs in our regressions. The correlation matrix of the variables is displayed in
Appendix B.
21. We include all debt securities net of deposits payable to central banks to proxy the remaining assets that can posted as collateral to get funds from the Eurosystem. 22. For further robustness, we have also computed another ratio in which the liquid assets are cash, net deposits with central banks and other credit institutions and public debt with a maturity up to one year. The correlations between this variable and Liquidity Ratio and Liquidity Ratio 2 are 0.96 and 0.99, respectively.

BANCO DE ESPAÑA 16 DOCUMENTO DE TRABAJO N.º 1512
Table 1: description of variables
Table 2: descriptive statistics
Variable Definition Variation Source
Credit Growth Monthly annualised growth rate of outstanding loans. By bank-firmCredit Register
Banco de España
VLTRO Funds borrowed at the two VLTROs to total assets. By bankOperations Department
Banco de España
Liquidity RatioCash, net deposits with central banks and other credit institutions
and debt securities net of deposits payable to central banks to total By bank
Supervisory reportsBanco de España
Liquidity Ratio 2Cash and net deposits with central banks and other credit institutions
to total assets.By bank
Supervisory reportsBanco de España
Sovereing Debt Domestic sovereign debt to total assets. By bankSupervisory reports
Banco de España
Loan to Deposits Ratio between the loans to the private sector and deposits. By bankSupervisory reports
Banco de España
Capital Ratio Core capital (total equity plus retained earnings) to total assets. By bankSupervisory reports
Banco de España
Capital Ratio 2 Net worth to total assets. By bankSupervisory reports
Banco de España
NPL Ratio Non-performing loans to total loans to the private sector. By bankSupervisory reports
Banco de España
Resident Deposits Deposits by non-financial private residents to total assets. By bankSupervisory reports
Banco de España
Non-resident Deposits Deposits by non-financial private non-residents to total assets. By bankSupervisory reports
Banco de España
ROA Net income to total assets. By bankSupervisory reports
Banco de España
Real Total Assets Total Assets in 2011 euros. By bankSupervisory reports
Banco de España
Relationship Length Number of months the firm had a working relationship with the bank. By bank-firmCredit Register
Banco de España
Number Relations Number of banks the firm operates with. By firm-timeCredit Register
Banco de España
HHIHerfindahl-Hirschman Index of the bank’s credit portfolio by industry
(2 digits)By bank-time
Credit RegisterBanco de España
Variable Scale Obs Mean Std.Dev. Min MaxCredit Growth (i,j,t) % (annualised) 12,181,556 -13.37 28.57 -100 91.33
VLTRO (i) % 42 9.69 8.15 0 36.61Liquidity Ratio (i, t-1) % 12,181,556 1.97 6.44 -65.36 36.07
Liquidity Ratio 2 (i, t-1) % 12,181,556 -4.81 4.25 -65.36 45.35Sovereign Debt (i, t-1) % 12,181,556 6.14 2.38 0.00 25.05Loan to Deposits (i, t-1) % 12,181,556 188.70 35.43 80.08 471.29
Capital Ratio (i, t-1) % 12,181,556 5.89 1.90 1.14 14.09Capital Ratio 2 (t-1) % 12,181,556 6.12 2.37 -11.35 14.15
NPL Ratio (i, t-1) % 12,181,556 7.75 4.29 0.09 28.03Resident Deposits (i, t-1) % 12,181,556 31.17 10.42 0.63 74.37
Non-resident Deposits (i, t-1) % 12,181,556 8.39 6.39 0.00 24.12ROA (i, t-1) % 12,181,556 -6.10 31.93 -629.19 18.90
Real Total Assets (i, t-1) Millions € 12,181,556 192,312.00 153,743.20 1,623.72 487,297.40Relationship Length (i,j, t-1) months 12,181,556 9.56 6.15 1.00 23.00
Number Relations (i, t-1) # banks 12,181,556 3.75 2.40 2.00 33.00HHI (i, t-1) % 12,181,556 17.09 8.32 5.69 46.48

BANCO DE ESPAÑA 17 DOCUMENTO DE TRABAJO N.º 1512
6 Main results
Our first set of results is displayed in Table 3. Column (1) is just an OLS regression, whose
estimates are expected to be biased and inconsistent because of the identification challenges
explained in section 3. The coefficient on 𝑉𝐿𝑇𝑅𝑂𝑖𝑡 (henceforth, VLTRO) is negative but
insignificant. The coefficient on VLTRO turns positive but insignificant when we add time-
invariant firm fixed effects in column (2) and when we include firm-month fixed effects in (3).
The coefficient becomes positive and significant at a 5% in column (4), which is consistent
with the intuition that bank fixed effects mitigate the downward bias that arises from not fully
controlling banks’ balance-sheet strength and its correlation with VLTRO uptake. Moreover,
as we know the sign of that bias, in case our strategy did not fully remove it, we could claim
that the coefficient on VLTRO is the lower bound of the true causal effect.
Regarding statistical inference, the standard errors are always clustered at the bank
level to deal with serial correlation within banks over time, one of the solutions advocated by
Bertrand et al. (2004)23, as we cannot rule out that the regression errors are serially correlated
even after controlling for bank fixed effects. Alternatively, we have clustered at the bank-time
level, the level in which the regressor of interest varies, as suggested by Angrist and Pischke
(2009).24 This would imply a large number of available clusters, a necessary condition for the
consistency of clustered standard errors25
To estimate the aggregate impact of the two VLTROs on credit growth we make a
weighted sum of the individual impact of those VLTROs on the credit growth of each bank,
where the weights are computed as the ratio of the bank’s outstanding loans to all loans in
the sample. Algebraically:
, but at the expense of not accounting for within-
bank serial correlation. The results –available upon request- are very similar, just displaying a
less conservative standard error for our key variable (0.024 vs. 0.029 in specification (4)),
which renders VLTRO significant at 1%.
𝐴𝑔𝑔_𝐼𝑚𝑝𝑎𝑐𝑡 = ∑ 𝜕∆𝐶𝑟𝑒𝑑𝑖𝑡𝑖𝑗𝑡𝜕𝑉𝐿𝑇𝑅𝑂𝑖𝑡
∙ 𝑉𝐿𝑇𝑅𝑂𝑖𝑡 · 𝜔𝑖𝐼𝑖=1 (3)
where 𝜕∆𝐶𝑟𝑒𝑑𝑖𝑡𝑖𝑗𝑡𝜕𝑉𝐿𝑇𝑅𝑂𝑖𝑡
= 𝛽 (4)
and
𝜔𝑖 = 𝐶𝑟𝑒𝑑𝑖𝑡𝑖
∑ 𝐶𝑟𝑒𝑑𝑖𝑡𝑖𝐼𝑖=𝐼
(5)
Using the estimate of the coefficient on VLTRO of our preferred method (firm-month
fixed effects and bank fixed effects), the aggregate impact of the two VLTROs on annual
23. Bertrand et al. (2004) show that this technique works well when the number of clusters is large, meaning by “large” 50 U.S. states in their empirical application. Similar numbers are suggested by Angrist and Pischke (2009). As in our application we have 42 clusters (banks), we believe that the number of clusters is large enough. 24. Moulton (1986) shows that, in the presence of intragroup correlation, conventional OLS standard errors or standard errors clustered at a level below the group underestimate the population standard errors. 25. The asymptotic justification of cluster-robust standard errors assumes that the numbers of clusters goes to infinity. With a small number of clusters the cluster-robust standard errors are downwards biased. But, in any case, Cameron et al. (2008) consider “few” five to thirty clusters, while in our application we have 42 clusters.

BANCO DE ESPAÑA 18 DOCUMENTO DE TRABAJO N.º 1512
credit growth was 0.8%. Of course, this does not mean that the VLTROs actually increased
the available credit, but that they reduced the rate of contraction of lending: if they had not
been implemented, credit to non-financial corporations would have decreased at a rate 0.8%
higher than it did. As the average annual growth rate of the credit to non-financial
corporations in the twelve months after the first VLTRO (between December 2011 and
November 2012) was -5.1%26
With respect to the controls, column (4) shows that a higher Loan-To-Deposit Ratio
is associated with higher credit growth within the same bank (as we include bank fixed
effects).
, we consider that the VLTROs had a moderate-sized effect.
27
Higher residents’ deposits to total assets also lead to higher credit growth, while
the opposite occurs in the case of non-residents’ deposits, probably because more stable
retail funding incentivises banks to lend more. A longer relationship between the firm and the
bank (Relationship Length) also implies more credit, consistent with the findings on
relationship lending (e.g., Petersen and Rajan, 1994). By contrast, more industry
concentrated loan portfolios (higher HHI) are related with lower credit growth. Finally, notice
that Capital Ratio is negative (and significant) in column (1), at variance with the conventional
wisdom. This finding confirms our intuition that, in the period of analysis (2011-2012), strong
deleveraging pressures and weak credit demand forced under-capitalised banks to increase
their capital and reduce lending at the same time. Hence the need to control for credit
demand and bank unobserved heterogeneity, as progressively done in columns (2)-(4).
26. Source: Banco de España. 27. By contrast, the coefficient on the Loan-To-Deposit Ratio is negative when bank fixed effects are not included [columns (1)-(3)] so that variability across banks is also exploited. In other words, banks with higher LTD ratios exhibit lower credit growth, probably because they are exposed to higher liquidity risk.

BANCO DE ESPAÑA 19 DOCUMENTO DE TRABAJO N.º 1512
Table 3: impact of VLTROs on credit
Estimator: OLS. Clustered standard errors in parenthesis. *** p<0.01, ** p<0.05, * p<0.10. Dependent variable: monthly annualised growth rate of outstanding loans. HHI is the Herfindahl-Hirschman Index of the bank’s credit portfolio by industry. NPL ratio is the non-performing loan ratio.
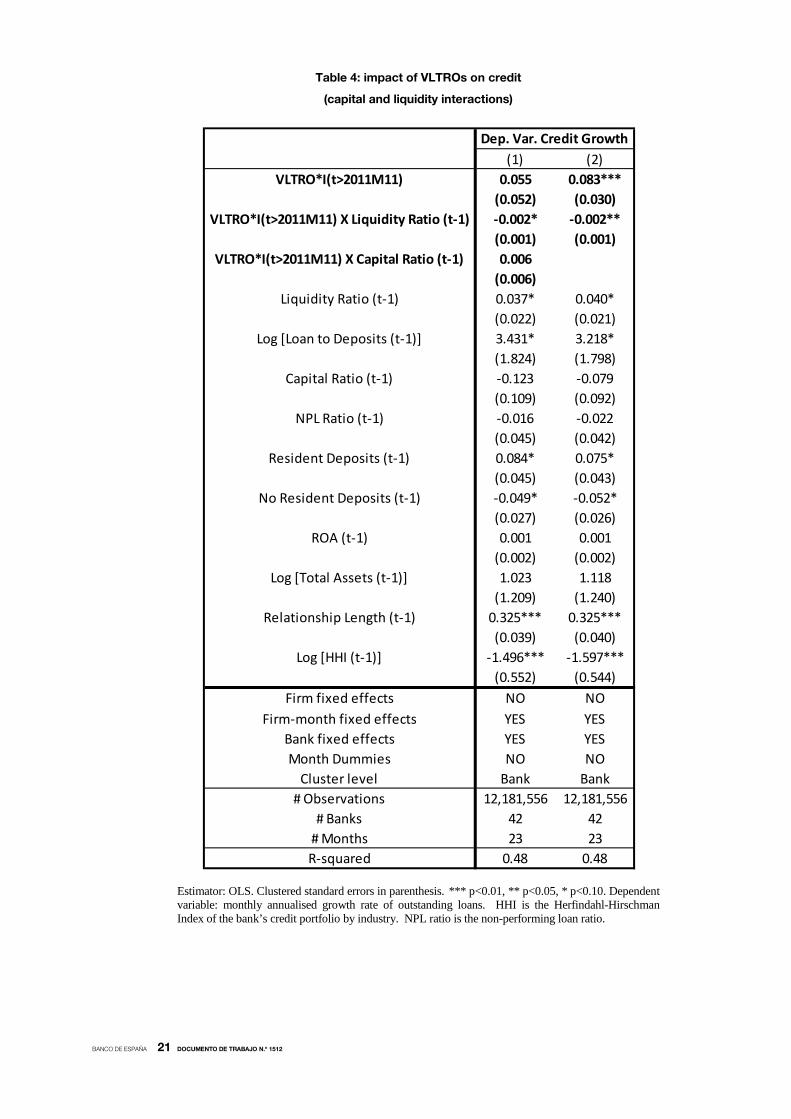
We also wish to study whether the transmission of non-conventional monetary policy
such as the VLTROs may be heterogeneous and it may depend on banks’ characteristics.
For that purpose, Table 4 shows the results of the most complete specification (whole set of
fixed effects) in which we add the interactions of our key regressor with the liquidity and
capital ratios. In column (1) the negative coefficient on the interaction between liquidity and
VLTRO means that the positive impact of VLTROS on credit growth was higher on illiquid
banks, consistent with previous evidence on the bank lending channel (e.g. Jiménez et al.,
2012). By contrast, the coefficient on the interaction between capital and VLTRO is not
(1) (2) (3) (4)VLTRO*I(t>2011M11) -0.002 0.033 0.020 0.076**
(0.065) (0.035) (0.038) (0.029)Liquidity Ratio (t-1) 0.042 -0.005 -0.006 0.027
(0.059) (0.039) (0.042) (0.021)Log [Loan to Deposits (t-1)] -3.194 -8.928*** -8.230*** 3.228*
(3.893) (2.107) (2.070) (1.709)Capital Ratio (t-1) -0.260** -0.076 -0.091 -0.076
(0.113) (0.107) (0.114) (0.088)NPL Ratio (t-1) 0.071 0.059 0.045 -0.001
(0.064) (0.039) (0.045) (0.041)Resident Deposits (t-1) 0.047 -0.042 -0.026 0.073
(0.089) (0.056) (0.049) (0.044)No Resident Deposits (t-1) -0.029 -0.011 -0.001 -0.057**
(0.065) (0.052) (0.054) (0.026)ROA (t-1) 0.004 0.001 0.003 0.001
(0.003) (0.002) (0.002) (0.002)Log [Total Assets (t-1)] 0.132 0.013 0.016 0.940
(0.332) (0.299) (0.268) (1.201)Relationship Length (t-1) 0.664*** 0.091** 0.249*** 0.324***
(0.093) (0.036) (0.043) (0.039)Log [HHI (t-1)] 2.370*** 0.656 0.719 -1.379**
(0.685) (0.545) (0.544) (0.567)Log [Number Relations (t-1)] -1.336*** -3.731***
(0.231) (0.197)Firm fixed effects NO YES NO NO
Firm-month fixed effects NO NO YES YESBank fixed effects NO NO NO YESMonth Dummies YES YES NO NO
Cluster level Bank Bank Bank Bank# Observations 12,181,556 12,181,556 12,181,556 12,181,556
# Banks 42 42 42 42# Months 23 23 23 23R-squared 0.01 0.21 0.48 0.48
Dep. Var. Credit Growth

BANCO DE ESPAÑA 20 DOCUMENTO DE TRABAJO N.º 1512
significant, implying that there was no differential impact regarding capital, at variance with
what documented in previous works on the transmission of conventional monetary policy
(Jiménez et al., 2012). We have two complementary explanations to this finding. First, as
argued by Albertazzi et al. (2014), during systemic crises the nature of the bank lending
channel may change. Second, regulatory capital, rather than leverage, may be the
appropriate variable to look at during those crises. In fact, Albertazzi et al. (2014), who use the
supervisory Tier 1 capital ratio, find that the VLTROs were more effective in improving lending
supply to SMEs (compared to larger firms) for illiquid but well-capitalised banks. By contrast,
Jiménez et al. (2012), in their study of conventional monetary policy mostly before the
economic crisis (2002-2008), find that both illiquid and low-capitalised banks reacted more to
changes in short-term interest rates.
Column (2), in which we drop the interaction between capital and VLTRO to rule out
multicollinearity issues, confirms the result regarding liquidity. The results of column (2) can
also be used to compute the aggregate impact of VLTROs on annual credit growth when
accounting for the heterogenous impact regarding liquidity. To do so we replace equation (4)
by equation (6):
∂∆Creditijt∂VLTROit
= β + γLIQı������
where LIQı������ is the average liquidity of each bank in the 3 months prior to the first VLTRO.28
We
then compute equation (3), obtaining 0.85%, a very similar figure to the previous estimate
28. We use average liquidity values to deal with the volatility of the liquidity ratio.
BANCO DE ESPAÑA 21 DOCUMENTO DE TRABAJO N.º 1512
Table 4: impact of VLTROs on credit
(capital and liquidity interactions)
Estimator: OLS. Clustered standard errors in parenthesis. *** p<0.01, ** p<0.05, * p<0.10. Dependent variable: monthly annualised growth rate of outstanding loans. HHI is the Herfindahl-Hirschman Index of the bank’s credit portfolio by industry. NPL ratio is the non-performing loan ratio.
(1) (2)VLTRO*I(t>2011M11) 0.055 0.083***
(0.052) (0.030)VLTRO*I(t>2011M11) X Liquidity Ratio (t-1) -0.002* -0.002**
(0.001) (0.001)VLTRO*I(t>2011M11) X Capital Ratio (t-1) 0.006
(0.006)Liquidity Ratio (t-1) 0.037* 0.040*
(0.022) (0.021)Log [Loan to Deposits (t-1)] 3.431* 3.218*
(1.824) (1.798)Capital Ratio (t-1) -0.123 -0.079
(0.109) (0.092)NPL Ratio (t-1) -0.016 -0.022
(0.045) (0.042)Resident Deposits (t-1) 0.084* 0.075*
(0.045) (0.043)No Resident Deposits (t-1) -0.049* -0.052*
(0.027) (0.026)ROA (t-1) 0.001 0.001
(0.002) (0.002)Log [Total Assets (t-1)] 1.023 1.118
(1.209) (1.240)Relationship Length (t-1) 0.325*** 0.325***
(0.039) (0.040)Log [HHI (t-1)] -1.496*** -1.597***
(0.552) (0.544)Firm fixed effects NO NO
Firm-month fixed effects YES YESBank fixed effects YES YESMonth Dummies NO NO
Cluster level Bank Bank# Observations 12,181,556 12,181,556
# Banks 42 42# Months 23 23R-squared 0.48 0.48
Dep. Var. Credit Growth

BANCO DE ESPAÑA 22 DOCUMENTO DE TRABAJO N.º 1512
Finally, another important research question that may be addressed is whether the
impact that the VLTROs had on credit to non-financial corporations depended on the size of
the companies. This is an important issue because SMEs depend much more on bank credit
than larger companies as they often do not have access to alternative sources of external
finance (debt and equity markets), which makes them much more vulnerable to a credit
crunch.
In order to answer that question, we add to the previous dataset an indicator variable
constructed by Martínez Carrascal and Mulino (2014) that distinguishes between SMEs and
larger firms. Specifically, they use the balance sheet and the income statement of each firm
from the Central de Balances (CBI), a database owned by Banco de España. With those
data, in the case of firms that are both in the Spanish Credit Register (CIR) and in the CBI,
they assess whether they are SMEs or not by following the criteria of the European
Commission recommendation 2003/361: a company is an SME if it has less than 250
employees and its turnover does not exceed 50 million Euro or its balance sheet total is not
greater than 43 million Euro. With those firms they also run several probit models to estimate
the relationship between size category and total outstanding bank credit for each industry.29
As the information on outstanding credit and industry is available in the CIR as well, they the
use the predicted probabilities for each firm that is not the CBI (around 30%) to estimate its
size category.30
We use the values of the variable at the end of December 2011, i.e., when the first
VLTRO took place. The sample has around 307,700 firms, from which 305,000 are SMEs
and the rest are large companies. We estimate our most complete specification (4) –time-
varying firm fixed effects and bank fixed effects- for the two size categories separately. The
results, presented in Table 5, indicate that the VLTROs had no impact on the credit to large
firms, but they had a sizeable effect on the loans to SMEs. In fact, the coefficient on the key
regressor in the subsample of SMEs is very similar to the coefficient that was estimated using
the whole sample (see Table 3).
29. Specifically, for 99 industries following the NACE classification. 30. Specifically, they classify as an SME those firms that have a predicted probability of being an SME greater than 90% and they classify as a large company those that have a predicted probability lower than 40%. Those firms that have a probability between 40% and 90% are left unclassified. For details about the goodness of fit and classification errors of the model see Martínez Carrascal and Mulino (2014).

BANCO DE ESPAÑA 23 DOCUMENTO DE TRABAJO N.º 1512
Table 5: impact of VLTROs on credit to large firms and SMEs
Estimator: OLS. Clustered standard errors in parenthesis. *** p<0.01, ** p<0.05, * p<0.10. Dependent variable: monthly annualised growth rate of outstanding loans. HHI is the Herfindahl-Hirschman Index of the bank’s credit portfolio by industry. NPL ratio is the non-performing loan ratio. Columns (1) and (2) show the estimations of separate regressions run on sub-samples of large companies and SMEs, respectively, following the classifications of European Commission (2003) and Martínez Carrascal and Mulino (2014).
Large SMEs(1) (2)
VLTRO*I(t>2011M11) 0.001 0.077**(0.033) (0.031)
Liquidity Ratio (t-1) 0.094** 0.026(0.035) (0.021)
Log [Loan to Deposits (t-1)] 7.896*** 3.024*(2.657) (1.747)
Capital Ratio (t-1) -0.257 -0.072(0.310) (0.084)
NPL Ratio (t-1) -0.076 0.004(0.094) (0.041)
Resident Deposits (t-1) 0.209** 0.070(0.103) (0.044)
No Resident Deposits (t-1) -0.049 -0.056**(0.050) (0.027)
ROA (t-1) -0.004 0.001(0.004) (0.002)
Log [Total Assets (t-1)] -2.414 1.065(3.322) (1.123)
Relationship Length (t-1) 0.768*** 0.309***(0.123) (0.039)
Log [HHI (t-1)] -3.232 -1.299**(2.275) (0.595)
Log [Number Relations (t-1)]
Firm fixed effects NO NOFirm-month fixed effects YES YES
Bank fixed effects YES YESMonth Dummies NO NO
Cluster level Bank Bank# Observations 232,175 11,818,378
# Banks 42 42# Months 24 24
Dep. Var. Credit Growth

BANCO DE ESPAÑA 24 DOCUMENTO DE TRABAJO N.º 1512
7 Robustness analyses
7.1 Alternative liquidity and capital measures
Our first robustness check is to use alternative measures of liquidity and capital. Specifically,
we substitute Liquidity Ratio by Liquidity Ratio 2 in our main regressions and we include the
ratio of domestic sovereign debt to total assets (Sovereign Debt) to account for the possible
different impact of sovereign debt holdings from other types of liquid assets. We also replace
Capital Ratio by Capital Ratio 2.31
The results, which are displayed in Table 6, are very similar
to those from Table 3. The coefficient on our regressor of interest, VLTRO, is again
insignificant in specifications (1) to (3) and its magnitude and significance level in our favourite
estimation (4) are very similar. Like Liquidity Ratio, neither Liquidity Ratio 2 nor Sovereign Debt
has a significant impact on credit growth. Like Capital Ratio, Capital Ratio 2 is negative (and
significant) in our inconsistent estimation (1).
31. For brevity of exposition, we only show the results for Liquidity Ratio 2 and Capital Ratio 2, but the analyses with the other two possible combinations (Liquidity Ratio and Capital Ratio 2; Liquidity Ratio 2 and Capital Ratio) have also been carried out, yielding similar results, which are available upon request.

BANCO DE ESPAÑA 25 DOCUMENTO DE TRABAJO N.º 1512
Table 6: impact of VLTROs on credit
(alternative liquidity and capital measures)
Estimator: OLS. Clustered standard errors in parenthesis. *** p<0.01, ** p<0.05, * p<0.10. Dependent variable: monthly annualised growth rate of outstanding loans. HHI is the Herfindahl-Hirschman Index of the bank’s credit portfolio by industry. NPL ratio is the non-performing loan ratio.
We also use these alternative measures of liquidity and capital to assess whether the
transmission of the VLTROs depended on banks’ characteristics via interactions with our key
regressor, as displayed in Table 7. As in Table 4, we find that the impact of VLTRO on credit
growth does not depend on capital heterogeneity. Regarding liquidity, the interaction between
VLTRO and Liquidity Ratio 2 is not significant, but that between VLTRO and Sovereign Debt is
significant and negative: the impact of VLTRO on credit growth is higher for lower sovereign debt
holdings relative to total assets. This finding suggests that not all types of liquid assets played the
same role in the transmission of the funds provided by the VLTROs to the real economy.
(1) (2) (3) (4)VLTRO*I(t>2011M11) 0.017 0.051 0.044 0.066**
(0.087) (0.051) (0.059) (0.030)Liquidity Ratio 2 (t-1) 0.025 -0.008 -0.004 0.009
(0.060) (0.041) (0.046) (0.024)Sovereign Debt (t-1) -0.081 -0.057 -0.080 0.041
(0.112) (0.072) (0.083) (0.048)Log [Loan to Deposits (t-1)] -5.502 -9.368*** -8.713*** 3.072*
(3.401) (1.981) (1.906) (1.781)Capital Ratio 2 (t-1) -0.306*** -0.108 -0.124 -0.090
(0.107) (0.100) (0.108) (0.063)NPL Ratio (t-1) 0.013 0.040 0.022 -0.024
(0.069) (0.037) (0.043) (0.045)Resident Deposits (t-1) -0.001 -0.054 -0.041 0.087*
(0.080) (0.052) (0.045) (0.050)Non-resident Deposits (t-1) -0.018 -0.007 0.005 -0.055*
(0.067) (0.055) (0.058) (0.028)ROA (t-1) 0.009** 0.003 0.004* 0.003*
(0.004) (0.002) (0.003) (0.002)Log [Total Assets (t-1)] 0.014 -0.025 -0.039 1.081
(0.340) (0.305) (0.272) (1.147)Relationship Length (t-1) 0.665*** 0.093*** 0.254*** 0.324***
(0.092) (0.033) (0.040) (0.039)Log [HHI (t-1)] 2.384*** 0.645 0.737 -1.398**
(0.687) (0.538) (0.550) (0.647)Log [Number Relations (t-1)] -1.341*** -3.735***
Firm fixed effects NO YES NO NOFirm-month fixed effects NO NO YES YES
Bank fixed effects NO NO NO YESMonth dummies YES YES NO NO
Cluster level Bank Bank Bank Bank# Observations 12,181,556 12,181,556 12,181,556 12,181,556
# Banks 42 42 42 42# Months 23 23 23 23R-squared 0.01 0.21 0.48 0.48
Dep. Var. Credit Growth

BANCO DE ESPAÑA 26 DOCUMENTO DE TRABAJO N.º 1512
Table 7: impact of VLTROs on credit
(capital and liquidity interactions, alternative measures)
Estimator: OLS. Clustered standard errors in parenthesis. *** p<0.01, ** p<0.05, * p<0.10. Dependent variable: monthly annualised growth rate of outstanding loans. HHI is the Herfindahl-Hirschman Index of the bank’s credit portfolio by industry. NPL ratio is the non-performing loan ratio.
(1) (2)VLTRO*I(t>2011M11) 0.150** 0.142***
(0.062) (0.051)VLTRO*I(t>2011M11) X Liquidity Ratio 2 (t-1) -0.001 -0.001
(0.001) (0.001)VLTRO*I(t>2011M11) X Sovereign Debt (t-1) -0.009** -0.009**
(0.004) (0.004)VLTRO*I(t>2011M11) X Capital Ratio 2 (t-1) -0.002
(0.006)Liquidity Ratio 2 (t-1) 0.028 0.027
(0.026) (0.026)Sovereign Debt (t-1) 0.144* 0.139*
(0.076) (0.071)Log [Loan to Deposits (t-1)] 3.740* 3.764**
(1.880) (1.795)Capital Ratio 2 (t-1) -0.080 -0.092
(0.088) (0.063)NPL Ratio (t-1) -0.037 -0.035
(0.050) (0.047)Resident Deposits (t-1) 0.107** 0.108**
(0.050) (0.050)Non-resident Deposits (t-1) -0.052 -0.050*
(0.032) (0.029)ROA (t-1) 0.003* 0.003*
(0.002) (0.002)Log [Total Assets (t-1)] 1.225 1.185
(1.196) (1.128)Relationship Length (t-1) 0.326*** 0.326***
(0.039) (0.039)Log [HHI (t-1)] -1.645** -1.618**
(0.640) (0.652)Firm fixed effects NO NO
Firm-month fixed effects YES YESBank fixed effects YES YESMonth dummies NO NO
Cluster level Bank Bank# Observations 12,181,556 12,181,556
# Banks 42 42# Months 23 23R-squared 0.48 0.48
Dep. Var. Credit Growth

BANCO DE ESPAÑA 27 DOCUMENTO DE TRABAJO N.º 1512
7.2 Sample without credit cooperatives
A second robustness check consists of running the same regressions in a sub-sample of
credit institutions that excludes credit cooperatives. While many of them did not ask for funds
in the VLTROs, anecdotal evidence suggests that they might have obtained the liquidity
indirectly, through inter-bank loans, which would have allowed them to grant more credit to
the private sector. If that was indeed the case, their inclusion would generate a downward
bias in the coefficient on VLTRO. In addition, the credit cooperatives of our sample only
account for a 3% of the total loans, implying that taking them out does not jeopardise the
external validity of our results. However, a disadvantage of this strategy regards statistical
inference: as we have less banks, we also have less clusters (28 vis-à-vis 42 with the whole
sample). As cluster-robust standard errors are downwards biased when there are few
clusters (Cameron et al., 2008), we may over-reject the null hypothesis concerning the
significance of the regression coefficients.
The results for this subsample, which are presented in Table 8, are slightly different
from those with the whole sample. The coefficient on VLTRO is insignificant in specifications
(1) and (3) but, unlike in previous analyses, it is significant and positive in (2), when time-
invariant fixed effects are included. More remarkably, its magnitude in our favourite estimation
(4) is larger than with the whole sample (0.096 vs. 0.076), which corroborates our intuition
that the inclusion of credit cooperatives could have generated a downward bias. Using this
coefficient the aggregate impact of the two VLTROs on annual credit growth is 1%, 2 pp.
higher than the one estimated with the whole sample.

BANCO DE ESPAÑA 28 DOCUMENTO DE TRABAJO N.º 1512
Table 8: impact of VLTROs on credit
(sample without credit cooperatives)
Estimator: OLS. Clustered standard errors in parenthesis. *** p<0.01, ** p<0.05, * p<0.10. Dependent variable: monthly annualised growth rate of outstanding loans. HHI is the Herfindahl-Hirschman Index of the bank’s credit portfolio by industry. NPL ratio is the non-performing loan ratio.
We can also use this subsample to analyse the heterogeneity in the transmission of
the VLTROs via interactions with our key regressor, as displayed in Table 9. As with the whole
sample, the interaction with capital is not significant while the interaction with liquidity is
negative and significant: the positive impact of VLTROS on credit growth was higher on
illiquid banks, while there was no differential impact regarding capital.
(1) (2) (3) (4)VLTRO*I(t>2011M11) 0.081 0.083* 0.071 0.096**
(0.082) (0.045) (0.048) (0.038)Liquidity Ratio (t-1) 0.148** 0.072 0.076 0.045**
(0.072) (0.044) (0.046) (0.022)Log [Loan to Deposits (t-1)] 4.784 -4.008 -2.831 3.640**
(4.967) (2.555) (2.401) (1.717)Capital Ratio (t-1) -0.251* -0.086 -0.095 -0.093
(0.132) (0.116) (0.128) (0.093)NPL Ratio (t-1) 0.066 0.060 0.053 -0.009
(0.074) (0.039) (0.039) (0.048)Resident Deposits (t-1) 0.169* 0.028 0.054 0.093**
(0.095) (0.059) (0.047) (0.044)No Resident Deposits (t-1) -0.053 -0.027 -0.016 -0.068**
(0.058) (0.048) (0.052) (0.030)ROA (t-1) 0.001 -0.000 0.001 0.001
(0.003) (0.002) (0.002) (0.002)Log [Total Assets (t-1)] 0.776* 0.468 0.478 0.680
(0.415) (0.330) (0.294) (1.211)Relationship Length (t-1) 0.700*** 0.111*** 0.278*** 0.339***
(0.101) (0.038) (0.046) (0.041)Log [HHI (t-1)] 3.117*** 1.239** 1.291** -1.212*
(0.759) (0.562) (0.551) (0.615)Log [Number Relations (t-1)] -1.390*** -3.695***
(0.235) (0.204)Firm fixed effects NO YES NO NO
Firm-month fixed effects NO NO YES YESBank fixed effects NO NO NO YESMonth Dummies YES YES NO NO
Cluster level Bank Bank Bank Bank# Observations 11,435,407 11,435,407 11,435,407 11,435,407
# Banks 28 28 28 28# Months 23 23 23 23R-squared 0.01 0.22 0.50 0.50
Dep. Var. Credit Growth

BANCO DE ESPAÑA 29 DOCUMENTO DE TRABAJO N.º 1512
Table 9: impact of VLTROs on credit (capital and liquidity interactions, sample without credit cooperatives)
Estimator: OLS. Clustered standard errors in parenthesis. *** p<0.01, ** p<0.05, * p<0.10. Dependent variable: monthly annualised growth rate of outstanding loans. HHI is the Herfindahl-Hirschman Index of the bank’s credit portfolio by industry. NPL ratio is the non-performing loan ratio.
(1) (2)VLTRO*I(t>2011M11) 0.074 0.101**
(0.055) (0.039)VLTRO*I(t>2011M11) X Liquidity Ratio (t-1) -0.001 -0.002*
(0.001) (0.001)VLTRO*I(t>2011M11) X Capital Ratio (t-1) 0.008
(0.007)Liquidity Ratio (t-1) 0.048** 0.054**
(0.023) (0.021)Log [Loan to Deposits (t-1)] 3.814** 3.584*
(1.800) (1.821)Capital Ratio (t-1) -0.150 -0.093
(0.114) (0.096)NPL Ratio (t-1) -0.028 -0.028
(0.050) (0.049)Resident Deposits (t-1) 0.103** 0.090**
(0.045) (0.043)No Resident Deposits (t-1) -0.058* -0.064**
(0.032) (0.030)ROA (t-1) 0.001 0.001
(0.002) (0.002)Log [Total Assets (t-1)] 0.788 0.855
(1.199) (1.248)Relationship Length (t-1) 0.340*** 0.339***
(0.041) (0.041)Log [HHI (t-1)] -1.346** -1.395**
(0.612) (0.593)Firm fixed effects NO NO
Firm-month fixed effects YES YESBank fixed effects YES YESMonth Dummies NO NO
Cluster level Bank Bank# Observations 11,435,407 11,435,407
# Banks 28 28# Months 23 23R-squared 0.50 0.50
Dep. Var. Credit Growth

BANCO DE ESPAÑA 30 DOCUMENTO DE TRABAJO N.º 1512
8 Conclusions
The intensification of the European sovereign debt crisis in the second half of 2011 hampered
euro area banks’ access to market based-funding, especially in Greece, Portugal, Ireland,
Italy and Spain. The funding and deleveraging pressures borne by those credit institutions
risked curtailing lending to euro area households and non-financial firms. Against this
background, the ECB carried out two very long term refinancing operations (VLTROs),
characterised as fixed rate tender procedures with full allotment and a maturity of three years,
in December 2011 and February 2012, with the aim to forestall a further contraction of credit
through the mitigation of liquidity and funding risks. The participation in these operations by
banks was very large, implying a massive liquidity injection in the financial sector.
The goal of this paper is to assess the effectiveness of the VLTROs in the case of
Spain. While lending to the non-financial private sector kept declining after the implementation
of those measures, would it have declined much more if the VLTROs hadn’t taken place? The
Spanish experience is particularly informative because Spain was severely hit by the European
sovereign debt crisis, it is one of the largest economies in the euro area and it has a bank-
based financial system.
To answer that question two main identification challenges must be addressed. First,
credit supply must be disentangled from credit demand, as the extremely weak
macroeconomic conditions prevailing in that period reduced credit demand and increased
credit risk, leading to a contraction of credit growth. Second, as banks facing strong funding
and deleveraging pressures were likely both to ask for a large amount of funds and to restrain
credit supply, the VLTRO bids are expected to be an endogenous regressor in naïve
specifications.
To tackle those identification challenges we use a sample on more than one million
bank-firm relationships drawn from the Credit Register of Banco de España. Following Gan
(2007) and Khwaya and Mian (2008), we exploit the fact that many firms simultaneously
borrow from several banks, which allows to compare credit growth across different lenders
for the same firm in the same period. This within-firm comparison controls for all observable
and unobservable, time-invariant and time-varying firm characteristics, including firm-specific
changes in credit demand and risk. Regarding the second problem, we exhaustively control
for banks’ funding difficulties by constructing several measures of balance-sheet strength
(capital, liquidity, credit risk, etc) using the confidential supervisory reports owned by Banco
de España and we add bank fixed effects to account for time-invariant unobserved
heterogeneity.
Our findings suggest that VLTROs had a positive moderate-sized effect on the
supply of bank credit to firms in the twelve months after the first VLTRO (December 2011-
November 2012), providing evidence of a “bank lending channel” in the context of
unconventional monetary policy. Specifically, the aggregate impact of the two VLTROs on
annual credit growth ranged between 0.8% and 1%32
32. Due to our empirical approach, notice that we only measure the temporary impact of the VLTROs on the supply of credit. As the VLTRO uptakes were essentially long-term loans to banks, which had to be repaid at some time, the existence of a permanent effect seems unlikely.
. We also study whether the VLTROs
had a heterogeneous impact on banks depending of their balance-sheet strength. We find, as
BANCO DE ESPAÑA 31 DOCUMENTO DE TRABAJO N.º 1512
in previous literature, that the impact was greater on illiquid banks, but we find no differential
effect regarding capital. We have two complementary explanations to this finding. First, as
argued by Albertazzi et al. (2014), during systemic crises the nature of the bank lending
channel may change. Second, regulatory capital, rather than leverage, may be the
appropriate variable to look at during those crises. Finally, we find that the VLTROs had a
sizeable impact on the credit to SMEs, while they had no effect on the loans to large firms.
This is an important aspect to take into account when assessing the effectiveness of the
VLTROs because SMEs are much more vulnerable to a credit crunch than larger companies,
as they often do not have access to alternative sources of external finance.
Since our identification strategy relies in the use of firms with multiple bank
relationships, a limitation of our study is that we must exclude firms that only operate with one
bank. As those firms account for around 62% of the total number of firms but they only
account for 25% of the outstanding credit33, we may infer that they are smaller (and probably
younger) than those with multiple bank relationships34. As argued by Gan (2007), small and
young firms are more affected by the information asymmetry in the credit markets due to
higher “information costs”, so we should expect the lending channel to be stronger in their
case. This is also consistent with the findings of Kwhaja y Mian (2008, pp. 1426-1427), who
find the lending channel to be stronger in firms that only operate with one bank.35
Another limitation of our study is that it only evaluates the direct impact of the
VLTROs on bank credit, ignoring some important indirect channels, such as their positive
effect on investors’ confidence, on the euro interbank market, on sovereign spreads and on
banks’ balance sheets. All these channels may have been translated into more lending to the
private sector.
Hence, by
excluding those firms, we may consider our estimates the lower bound of the aggregate
effect on the credit on all companies.
33. Source: Spanish Credit Register, December 2011. 34. .This conclusion is consistent with the findings of Hernández-Cánovas and Köeter-Kant (2008) and Ongena and Smith (2000): the larger (and the older) the firm, the higher the likelihood of having multiple banking relationships. 35. The same conclusion can be drawn from Jiménez et al. (2012, pp. 2313-2317), if one compares the results of Table 2 (all firms) with those of Table 3 (only firms with more than one banking relationship).

BANCO DE ESPAÑA 32 DOCUMENTO DE TRABAJO N.º 1512
9 Appendix A: variables’ correlation matrix
Credit Growth (t)
VLTRO*I(t>2011M11)
Liquidity Ratio (t-1)
Liquidity Ratio 2 (t-1)
Sovereign Debt (t-1)
Log [Loan to Deposits (t-1)]
Capital Ratio (t-1)
Capital Ratio 2 (t-1)
NPL Ratio (t-1)Resident
Deposits (t-1)Non-resident Deposits (t-1)
ROA (t-1)Log [Total
Assets (t-1)]Relationship Length (t-1)
Log [Number Relations (t-1)]
Log [HHI (t-1)]
Credit Growth (t) 1
VLTRO*I(t>2011M11) 0.022 1
Liquidity Ratio (t-1) -0.003 -0.366 1
Liquidity Ratio 2 (t-1) 0.002 0.148 0.546 1
Sovereign Debt (t-1) 0.014 0.436 0.063 -0.044 1
Log [Loan to Deposits (t-1)] -0.050 -0.035 -0.227 -0.213 0.116 1
Capital Ratio (t-1) -0.034 -0.091 0.116 0.185 -0.230 0.065 1
Capital Ratio 2 (t-1) -0.040 -0.215 0.267 0.218 -0.277 0.065 0.923 1
NPL Ratio (t-1) 0.038 0.579 -0.468 -0.122 0.238 -0.054 -0.338 -0.497 1
Resident Deposits (t-1) 0.048 -0.048 0.081 0.055 -0.209 -0.892 -0.175 -0.171 0.015 1
Non-resident Deposits (t-1) -0.055 -0.328 0.132 -0.093 -0.033 0.676 0.294 0.349 -0.329 -0.724 1
ROA (t-1) -0.016 -0.309 0.292 0.096 -0.189 0.011 0.166 0.389 -0.439 0.022 0.162 1
Log [Total Assets (t-1)] -0.046 -0.106 -0.014 0.098 -0.076 0.567 0.183 0.256 -0.260 -0.698 0.672 0.093 1
Relationship Length (t-1) 0.050 0.609 -0.377 0.071 0.271 -0.020 0.122 0.019 0.375 -0.118 -0.164 -0.242 0.052 1
Log [Number Relations (t-1)] -0.013 0.035 -0.023 -0.027 0.045 0.031 -0.049 -0.056 0.041 -0.023 -0.008 -0.030 -0.039 0.079 1
Log [HHI (t-1)] 0.061 0.257 -0.143 -0.139 0.126 -0.414 -0.454 -0.515 0.516 0.463 -0.602 -0.245 -0.506 -0.041 0.031 1

BANCO DE ESPAÑA 33 DOCUMENTO DE TRABAJO N.º 1512
10 Appendix B: robustness check for M&A
As explained in the paper, we have treated all M&A as acquisitions by the largest bank
because the alternative option, regarding them as the birth of a new bank, would imply
breaks in the series. Nevertheless, a potential caveat of our approach is that we are implicitly
assuming that the acquiring bank and the bank that arises after the merger is the same credit
institution (conditional on observables such as credit growth or balance-sheet ratios). This
assumption may seem pretty reasonable when the merger takes place between a very large
(acquiring) bank and one or more very small (acquired) banks, as the new credit institution is
likely to have the business model and the management of the former. But the assumption
may be too strong when the merger occurs among several banks of similar size and very
different characteristics, implying that the credit institution created by the merger may be a
very different from any of their predecessors. This issue may be especially problematic in our
case, as we rely on bank fixed effects in our regressions.
To check the sensitivity of the results to this assumption we have eliminated the
observations of all the banks involved in a merger before the merger actually takes place. By
doing so we don’t have to impose that assumption in our identification strategy and we also
avoid any jumps in the series (at the expense, of course, of losing some observations). The
main caveat of this alternative approach is that we lose two banks in our sample, as two
mergers occurred after the VLTROs took place. As our key regressor is the product of the
gross amount of funds borrowed at the two VLTROs scaled by the bank’s total assets
(VLTROi) and an indicator variable I(t ≥ 2011M12) that equals 1 since the implementation of
the first VLTRO, for these two banks the value of the regressor is constant over time. As we
also include bank fixed effects in our regressions, the observations on these banks have to be
excluded.
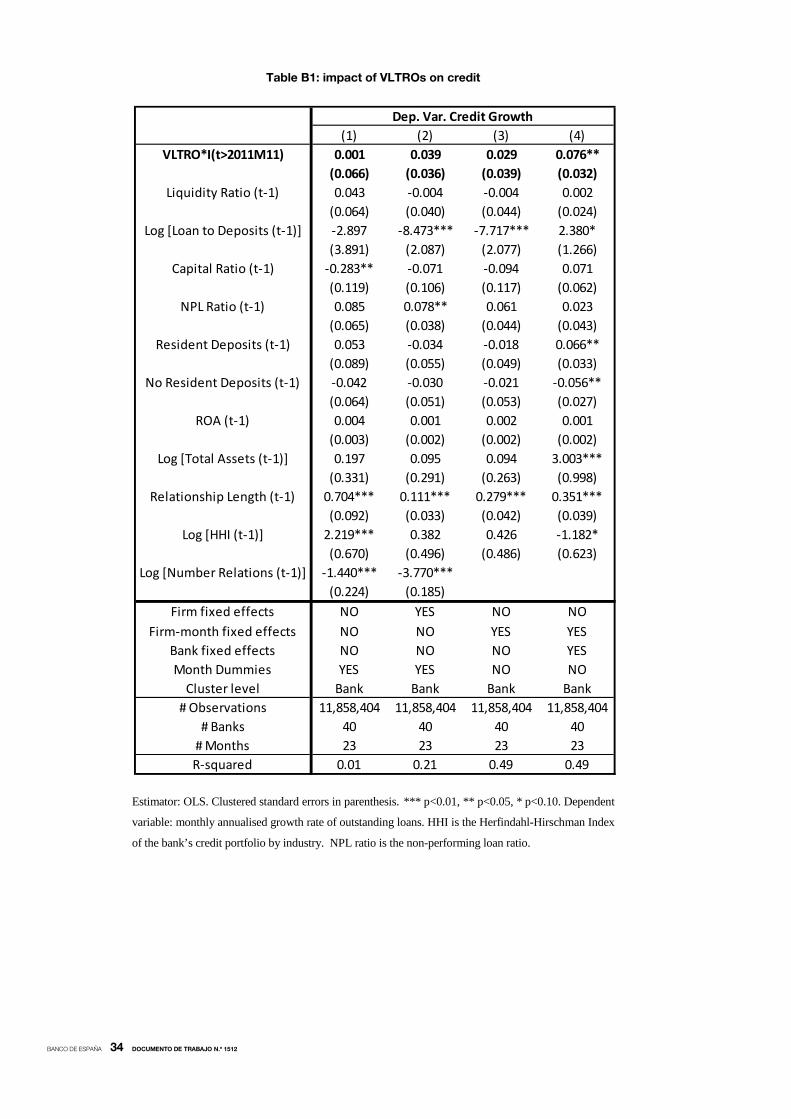
Nevertheless, the main results, shown in Tables B1 and B2, are very similar to those
reported in the main text.36
36. We have also carried out the robustness analyses shown in the main text (alternative capital and liquidity ratios, sample without credit cooperatives) using this dataset. The results, available upon request, are also very similar.
BANCO DE ESPAÑA 34 DOCUMENTO DE TRABAJO N.º 1512
Table B1: impact of VLTROs on credit
Estimator: OLS. Clustered standard errors in parenthesis. *** p<0.01, ** p<0.05, * p<0.10. Dependent
variable: monthly annualised growth rate of outstanding loans. HHI is the Herfindahl-Hirschman Index
of the bank’s credit portfolio by industry. NPL ratio is the non-performing loan ratio.
(1) (2) (3) (4)VLTRO*I(t>2011M11) 0.001 0.039 0.029 0.076**
(0.066) (0.036) (0.039) (0.032)Liquidity Ratio (t-1) 0.043 -0.004 -0.004 0.002
(0.064) (0.040) (0.044) (0.024)Log [Loan to Deposits (t-1)] -2.897 -8.473*** -7.717*** 2.380*
(3.891) (2.087) (2.077) (1.266)Capital Ratio (t-1) -0.283** -0.071 -0.094 0.071
(0.119) (0.106) (0.117) (0.062)NPL Ratio (t-1) 0.085 0.078** 0.061 0.023
(0.065) (0.038) (0.044) (0.043)Resident Deposits (t-1) 0.053 -0.034 -0.018 0.066**
(0.089) (0.055) (0.049) (0.033)No Resident Deposits (t-1) -0.042 -0.030 -0.021 -0.056**
(0.064) (0.051) (0.053) (0.027)ROA (t-1) 0.004 0.001 0.002 0.001
(0.003) (0.002) (0.002) (0.002)Log [Total Assets (t-1)] 0.197 0.095 0.094 3.003***
(0.331) (0.291) (0.263) (0.998)Relationship Length (t-1) 0.704*** 0.111*** 0.279*** 0.351***
(0.092) (0.033) (0.042) (0.039)Log [HHI (t-1)] 2.219*** 0.382 0.426 -1.182*
(0.670) (0.496) (0.486) (0.623)Log [Number Relations (t-1)] -1.440*** -3.770***
(0.224) (0.185)Firm fixed effects NO YES NO NO
Firm-month fixed effects NO NO YES YESBank fixed effects NO NO NO YESMonth Dummies YES YES NO NO
Cluster level Bank Bank Bank Bank# Observations 11,858,404 11,858,404 11,858,404 11,858,404
# Banks 40 40 40 40# Months 23 23 23 23R-squared 0.01 0.21 0.49 0.49
Dep. Var. Credit Growth

BANCO DE ESPAÑA 35 DOCUMENTO DE TRABAJO N.º 1512
Table B2: impact of VLTROs on credit
Estimator: OLS. Clustered standard errors in parenthesis. *** p<0.01, ** p<0.05, * p<0.10. Dependent variable: monthly annualised growth rate of outstanding loans. HHI is the Herfindahl-Hirschman Index of the bank’s credit portfolio by industry. NPL ratio is the non-performing loan ratio.
(1) (2)VLTRO*I(t>2011M11) 0.090* 0.082**
(0.053) (0.032)VLTRO*I(t>2011M11) X Liquidity Ratio (t-1) -0.002** -0.002**
(0.001) (0.001)VLTRO*I(t>2011M11) X Capital Ratio (t-1) -0.002
(0.006)Liquidity Ratio (t-1) 0.014 0.014
(0.025) (0.025)Log [Loan to Deposits (t-1)] 2.264 2.371*
(1.549) (1.374)Capital Ratio (t-1) 0.091 0.073
(0.104) (0.063)NPL Ratio (t-1) 0.000 0.002
(0.047) (0.044)Resident Deposits (t-1) 0.067* 0.070**
(0.035) (0.031)No Resident Deposits (t-1) -0.050* -0.050*
(0.027) (0.026)ROA (t-1) 0.001 0.001
(0.002) (0.002)Log [Total Assets (t-1)] 3.438*** 3.355***
(1.156) (1.053)Relationship Length (t-1) 0.352*** 0.352***
(0.040) (0.040)Log [HHI (t-1)] -1.423** -1.407**
(0.619) (0.601)Firm fixed effects NO NO
Firm-month fixed effects YES YESBank fixed effects YES YESMonth Dummies NO NO
Cluster level Bank Bank# Observations 11,858,404 11,858,404
# Banks 40 40# Months 23 23R-squared 0.49 0.49
Dep. Var. Credit Growth

BANCO DE ESPAÑA 36 DOCUMENTO DE TRABAJO N.º 1512
REFERENCES
ACHARYA, V. and S. STEFFEN (2014): “The Greatest Carry Trade Ever? Understanding Eurozone Bank Risks”, Journal of Financial Economics, forthcoming.
ALBERTAZZI, U., M. BOFONDI and N. PELLEGRINI (2014): “Unconventional Monetary Policy and Lending Supply: The Case of the VLTROs”, mimeo.
ANDRADE, P., C. CAHN, H. FRAISSE and J. MÉSONNIER (2015): “Can Unlimited Liquidity Provision Help to Avoid a Credit Crunch? Evidence from the Eurosystem’s LTROs”, Banque de France Working Paper No. 540.
ANGRIST, J and J-S. PISCHKE (2009): Mostly Harmless Econometrics: An Empiricist’s Companion. Princeton University Press.
BENTOLILA, S., M. JANSEN, G. JIMÉNEZ and S. RUANO (2013): "When Credit Dries Up: Job Losses in the Great Recession," Working Papers 2013-20, FEDEA.
BERNANKE, B. and M. GERTLER (1995): “Inside the Black Box: The Credit Channel of Monetary Policy Transmission,” Journal of Economic Perspectives, Vol. 9, Number 4, pp. 27-48.
BERTRAND, M., E. DUFFLO and S. MULLAINATHAN (2004): “How Much Should We Trust Differences-in-Differences Estimates?,” The Quarterly Journal of Economics 119, pp. 249-275.
CAMERON, A. C., J. B. GELBACH and D. L. MILLER (2008): “Bootstrap-based Improvements for Inference with Clustered Errors,” The Review of Economics and Statistics, August, 90 (3), pp. 414-427.
— (2011): “Robust Inference with Multiway Clustering,” Journal of Business and Economic Statistics 29 (2), pp. 238-249. CASIRAGHI, M., E. GAIOTTI, L. RODANO and A. SECCHI (2013): “The impact of unconventional monetary policy on the
Italian economy during the sovereign debt crisis,” Banca d’Italia Occasional papers, No. 203, Sept. CECIONI C., G. FERRERO and A. SECCHI (2001): “Unconventional Monetary Policy in Theory and in Practice,” Bank of
Italy Occasional Paper, No. 102, September. DARRACQ-PARIES, M. and R. DE SANTIS (2013): “A non-standard monetary policy shock: the ECB’s 3-year LTROs
and the shift in credit supply,” ECB Working Paper, No. 1508. DUBECQ, S., A. MONFORT, J. RENNE and G. ROUSSELLET (2014): “Credit and Liquidity in Interbank Rates: A Quadratic
Approach. Available at SSRN: http://ssrn.com/abstract=2331959 or http://dx.doi.org/10.2139/ssrn.2331959. HERNÁNDEZ-CÁNOVAS, G. and J. KÖETER-KANT (2008): “The institutional environment and the number of bank
relationships: an empirical analysis of European SMEs,” Small Business Economics, 34, pp. 375–390. GAN, J. (2007): “The real effects of asset market bubbles: loan- and firm-level evidence of a lending channel, Review of
Financial Studies, No. 20, 1941–1973. GERTLER, M. and S. GILCHRIST (1994): “Monetary Policy, Business Cycles, and the Behavior of Small Manufacturing
Firms,” The Quarterly Journal of Economics 109 (2): 309–40. GIANNONE, D., M. LENZA, H. PILL and L. REICHLIN (2012): “The ECB and the Interbank Market,” Economic Journal,
122 (November), pp. 467-486. JIMENEZ, G., S. ONGENA, J. PEYDRO-ALCALDE and J. SAURINA (2012): “Credit Supply and Monetary Policy:
Identifying the Bank Balance-Sheet Channel with Loan Applications,” The American Economic Review, Vol. 102 No. 5, pp. 2301-2326.
JOYCE, M., D. MILES, A. SCOTT and D. VAYANOS (2012): “Quantitative Easing and Unconventional Monetary Policy – an Introduction,” Economic Journal, 122 (November), pp. 271-288.
KHWAJA, A. and A. MIAN (2008): “Tracing the Impact of Bank Liquidity Shocks: Evidence from an Emerging Market,” American Economic Review, 98(4), 1413-42.
MARTÍNEZ-CARRASCAL, C. and M. MULINO (2014): “La evolución del crédito bancario a las empresas españolas según su tamaño,” Banco de España Economic Bulletin, January.
MOULTON, B. (1986): “Random Group Effects and the Precision of Regression Estimates,” Journal of Econometrics 32, pp. 385-397.
ONGENA, S., and D. C. SMITH (2000): “What determines the number of bank relationships? Cross-country evidence,” Journal of Financial Intermediation, 9, 26–56.
PANCRAZI, R., H. SEOANE and M. VUKOTIC (2014): “Sovereign risk, private credit and stabilization policies,” mimeo. PETERSEN, M. and R. RAJAN (1994): “The Benefits of Lending Relationships: Evidence from Small Business Data,” The
Journal of Finance, Vol. XLIX, No 1.

BANCO DE ESPAÑA PUBLICATIONS
WORKING PAPERS
1301 JAMES COSTAIN and ANTON NAKOV: Logit price dynamics.
1302 MIGUEL GARCÍA-POSADA: Insolvency institutions and effi ciency: the Spanish case.
1303 MIGUEL GARCÍA-POSADA and JUAN S. MORA-SANGUINETTI: Firm size and judicial effi cacy: evidence for the new
civil procedures in Spain.
1304 MAXIMO CAMACHO and GABRIEL PEREZ-QUIROS: Commodity prices and the business cycle in Latin America: living
and dying by commodities?
1305 CARLOS PÉREZ MONTES: Estimation of regulatory credit risk models.
1306 FERNANDO LÓPEZ VICENTE: The effect of foreclosure regulation: evidence for the US mortgage market at state level.
1307 ENRIQUE MORAL-BENITO and LUIS SERVEN: Testing weak exogeneity in cointegrated panels.
1308 EMMA BERENGUER, RICARDO GIMENO and JUAN M. NAVE: Term structure estimation, liquidity-induced
heteroskedasticity and the price of liquidity risk.
1309 PABLO HERNÁNDEZ DE COS and ENRIQUE MORAL-BENITO: Fiscal multipliers in turbulent times: the case of Spain.
1310 SAMUEL HURTADO: DSGE models and the Lucas critique.
1311 HENRIQUE S. BASSO and JAMES COSTAIN: Fiscal delegation in a monetary union with decentralized public spending.
1312 MAITE BLÁZQUEZ CUESTA and SANTIAGO BUDRÍA: Does income deprivation affect people’s mental well-being?
1313 ENRIQUE ALBEROLA, ÁNGEL ESTRADA and DANIEL SANTABÁRBARA: Growth beyond imbalances. Sustainable
growth rates and output gap reassessment.
1314 CARMEN BROTO and GABRIEL PEREZ-QUIROS: Disentangling contagion among sovereign CDS spreads during the
European debt crisis.
1315 MIGUEL GARCÍA-POSADA and JUAN S. MORA-SANGUINETTI: Are there alternatives to bankruptcy? A study of small
business distress in Spain.
1316 ROBERTO RAMOS and ENRIQUE MORAL-BENITO: Agglomeration matters for trade.
1317 LAURA HOSPIDO and GEMA ZAMARRO: Retirement patterns of couples in Europe.
1318 MAXIMO CAMACHO, GABRIEL PEREZ-QUIROS and PILAR PONCELA: Short-term forecasting for empirical
economists. A survey of the recently proposed algorithms.
1319 CARLOS PÉREZ MONTES: The impact of interbank and public debt markets on the competition for bank deposits.
1320 OLYMPIA BOVER, JOSE MARIA CASADO, SONIA COSTA, PHILIP DU CAJU, YVONNE MCCARTHY,
EVA SIERMINSKA, PANAGIOTA TZAMOURANI, ERNESTO VILLANUEVA and TIBOR ZAVADIL: The distribution
of debt across euro area countries: the role of Individual characteristics, institutions and credit conditions.
1321 BRINDUSA ANGHEL, SARA DE LA RICA and AITOR LACUESTA: Employment polarisation in Spain over the course of
the 1997-2012 cycle.
1322 RODOLFO G. CAMPOS and ILIANA REGGIO: Measurement error in imputation procedures.
1323 PABLO BURRIEL and MARÍA ISABEL GARCÍA-BELMONTE: Meeting our D€STINY. A Disaggregated €uro area Short
Term Indicator model to forecast GDP (Y) growth.
1401 TERESA SASTRE and FRANCESCA VIANI: Countries’ safety and competitiveness, and the estimation of current
account misalignments.
1402 FERNANDO BRONER, ALBERTO MARTIN, AITOR ERCE and JAUME VENTURA: Sovereign debt markets in turbulent
times: creditor discrimination and crowding-out effects.
1403 JAVIER J. PÉREZ and ROCÍO PRIETO: The structure of sub-national public debt: liquidity vs credit risks.
1404 BING XU, ADRIAN VAN RIXTEL and MICHIEL VAN LEUVENSTEIJN: Measuring bank competition in China:
a comparison of new versus conventional approaches applied to loan markets.
1405 MIGUEL GARCÍA-POSADA and JUAN S. MORA-SANGUINETTI: Entrepreneurship and enforcement institutions:
disaggregated evidence for Spain.
1406 MARIYA HAKE, FERNANDO LÓPEZ-VICENTE and LUIS MOLINA: Do the drivers of loan dollarisation differ between
CESEE and Latin America? A meta-analysis.
1407 JOSÉ MANUEL MONTERO and ALBERTO URTASUN: Price-cost mark-ups in the Spanish economy: a microeconomic
perspective.
1408 FRANCISCO DE CASTRO, FRANCISCO MARTÍ, ANTONIO MONTESINOS, JAVIER J. PÉREZ and A. JESÚS
SÁNCHEZ-FUENTES: Fiscal policies in Spain: main stylised facts revisited.

1409 MARÍA J. NIETO: Third-country relations in the Directive establishing a framework for the recovery and resolution
of credit institutions.
1410 ÓSCAR ARCE and SERGIO MAYORDOMO: Short-sale constraints and fi nancial stability: evidence from
the Spanish market.
1411 RODOLFO G. CAMPOS and ILIANA REGGIO: Consumption in the shadow of unemployment.
1412 PAUL EHLING and DAVID HAUSHALTER: When does cash matter? Evidence for private fi rms.
1413 PAUL EHLING and CHRISTIAN HEYERDAHL-LARSEN: Correlations.
1414 IRINA BALTEANU and AITOR ERCE: Banking crises and sovereign defaults in emerging markets: exploring the links.
1415 ÁNGEL ESTRADA, DANIEL GARROTE, EVA VALDEOLIVAS and JAVIER VALLÉS: Household debt and uncertainty:
private consumption after the Great Recession.
1416 DIEGO J. PEDREGAL, JAVIER J. PÉREZ and A. JESÚS SÁNCHEZ-FUENTES: A toolkit to strengthen government
budget surveillance.
1417 J. IGNACIO CONDE-RUIZ, and CLARA I. GONZÁLEZ: From Bismarck to Beveridge: the other pension reform in Spain.
1418 PABLO HERNÁNDEZ DE COS, GERRIT B. KOESTER, ENRIQUE MORAL-BENITO and CHRISTIANE NICKEL:
Signalling fi scal stress in the euro area: a country-specifi c early warning system.
1419 MIGUEL ALMUNIA and DAVID LÓPEZ-RODRÍGUEZ: Heterogeneous responses to effective tax enforcement:
evidence from Spanish fi rms.
1420 ALFONSO R. SÁNCHEZ: The automatic adjustment of pension expenditures in Spain: an evaluation of the 2013
pension reform.
1421 JAVIER ANDRÉS, ÓSCAR ARCE and CARLOS THOMAS: Structural reforms in a debt overhang.
1422 LAURA HOSPIDO and ENRIQUE MORAL-BENITO: The public sector wage premium in Spain: evidence from
longitudinal administrative data.
1423 MARÍA DOLORES GADEA-RIVAS, ANA GÓMEZ-LOSCOS and GABRIEL PÉREZ-QUIRÓS: The Two Greatest. Great
Recession vs. Great Moderation.
1424 ENRIQUE MORAL-BENITO and OLIVER ROEHN: The impact of fi nancial (de)regulation on current account balances.
1425 MAXIMO CAMACHO and JAIME MARTINEZ-MARTIN: Real-time forecasting US GDP from small-scale factor models.
1426 ALFREDO MARTÍN OLIVER, SONIA RUANO PARDO and VICENTE SALAS FUMÁS: Productivity and welfare: an
application to the Spanish banking industry.
1427 JAVIER ANDRÉS and PABLO BURRIEL: Infl ation dynamics in a model with fi rm entry and (some) heterogeneity.
1428 CARMEN BROTO and LUIS MOLINA: Sovereign ratings and their asymmetric response to fundamentals.
1429 JUAN ÁNGEL GARCÍA and RICARDO GIMENO: Flight-to-liquidity fl ows in the euro area sovereign debt crisis.
1430 ANDRÈ LEMELIN, FERNANDO RUBIERA-MOROLLÓN and ANA GÓMEZ-LOSCOS: Measuring urban agglomeration.
A refoundation of the mean city-population size index.
1431 LUIS DÍEZ-CATALÁN and ERNESTO VILLANUEVA: Contract staggering and unemployment during the Great Recession:
evidence from Spain.
1501 LAURA HOSPIDO and EVA MORENO-GALBIS: The Spanish productivity puzzle in the Great Recession.
1502 LAURA HOSPIDO, ERNESTO VILLANUEVA and GEMA ZAMARRO: Finance for all: the impact of fi nancial literacy training
in compulsory secondary education in Spain.
1503 MARIO IZQUIERDO, JUAN F. JIMENO and AITOR LACUESTA: Spain: from immigration to emigration?
1504 PAULINO FONT, MARIO IZQUIERDO and SERGIO PUENTE: Real wage responsiveness to unemployment in Spain:
asymmetries along the business cycle.
1505 JUAN S. MORA-SANGUINETTI and NUNO GAROUPA: Litigation in Spain 2001-2010: Exploring the market
for legal services.
1506 ANDRES ALMAZAN, ALFREDO MARTÍN-OLIVER and JESÚS SAURINA: Securitization and banks’ capital structure.
1507 JUAN F. JIMENO, MARTA MARTÍNEZ-MATUTE and JUAN S. MORA-SANGUINETTI: Employment protection legislation
and labor court activity in Spain.
1508 JOAN PAREDES, JAVIER J. PÉREZ and GABRIEL PEREZ-QUIRÓS: Fiscal targets. A guide to forecasters?
1509 MAXIMO CAMACHO and JAIME MARTINEZ-MARTIN: Monitoring the world business cycle.
1510 JAVIER MENCÍA and ENRIQUE SENTANA: Volatility-related exchange traded assets: an econometric investigation.
1511 PATRICIA GÓMEZ-GONZÁLEZ: Financial innovation in sovereign borrowing and public provision of liquidity.
1512 MIGUEL GARCÍA-POSADA and MARCOS MARCHETTI: The bank lending channel of unconventional monetary policy:
the impact of the VLTROs on credit supply in Spain.
Unidad de Servicios AuxiliaresAlcalá, 48 - 28014 Madrid
E-mail: [email protected]