Embed Size (px)
Citation preview

technical reportthe avoidable crisis of food waste:
35

This project was made possible by a generous donation from the Walmart Foundation.
acknowledgements
Suggested citation: Gooch, M., Bucknell, D., LaPlain, D., Dent, B., Whitehead, P., Felfel, A., Nikkel, L., Maguire, M. (2019). The Avoidable Crisis of Food Waste: Technical Report; Value Chain Management International and Second Harvest; Ontario, Canada.
Accessible from: www.SecondHarvest.ca/Research
Value Chain Management International Inc.
Martin Gooch Chief Executive Officer Email: [email protected] Tel: +1 416.997.7779
Second Harvest
Lori Nikkel Chief Executive Officer Email: [email protected] Tel: +1 416.408.2594 x 294
Key contacts for this project:
This Technical Report has been authored by the following individuals from VCMI:
Martin Gooch, PhD Delia Bucknell Dan Laplain Benjamin Dent, PhD Peter Whitehead, PhD Abdel Felfel, PhD Caroline Glasbey (Editor)
With key input from the following individuals from Second Harvest:
Lori Nikkel Madison Maguire Benita Aalto Christine Bomé
Corresponding author: Martin Gooch
The Food Loss and Waste Stakeholder Advisory Committee played a critical role in ensuring this project delivered primary data on food loss and waste in the Canadian supply chain and that the strategic direction of this project accurately represented the current food waste landscape. We want to thank the following organizations for their contribution:
Dalhousie University Gordon Food Service Loblaw Companies Limited Maple Leaf Foods Metro Inc. Provision Coalition Sodexo Canada University of Guelph Walmart Canada Bette Jean Crews, Independent
Second Harvest is Canada’s largest food rescue organization and an expert in perishable food recovery. Every year we are expanding our network to include more farms, manufacturers, distributors and retailers. We work with hundreds of businesses across the food supply chain, reducing the amount of edible food going to waste, which in turn stops millions of pounds of
greenhouse gases from damaging our environment. The food Second Harvest recovers is redirected to social service organizations and schools, ensuring people have access to the good food they need to be healthy and strong. Second Harvest is a global thought leader and continually innovates processes and shares methods, to create a better future for everyone.
www.SecondHarvest.ca www.FoodRescue.ca
Value Chain Management International (VCMI) has authored/co-authored several publications on food loss and waste and is a leading public and industry voice in bringing awareness to the opportunities and solutions surrounding food waste reduction, traceability, and the environment. VCMI measures waste within the overall analysis of food systems to
create pragmatic and sustainable solutions for businesses and industry organizations along the value chain. VCMI applies specialized value chain diagnostic tools to detect where waste occurs and to determine how to eliminate it. VCMI then participates in the implementation of new practices to solve the issues and ensure successful outcomes.
www.VCM-International.com
37
1
Table of Contents
List of Tables .......................................................................................................................................... 3
List of Figures ......................................................................................................................................... 3
Executive Summary ................................................................................................................................ 4
Glossary of Terms................................................................................................................................. 12
1 Introduction ................................................................................................................................. 14
1.1 Why Reduce FLW? ................................................................................................................ 14
2 Scope and Methodology .............................................................................................................. 15
2.1 Project Scope ........................................................................................................................ 17
2.2 Research Methods ................................................................................................................ 18
2.2.1 Value Chain Analysis ..................................................................................................... 18
2.2.2 Mass Balance ................................................................................................................. 20
2.2.3 Connecting Commodities to Foods and Beverages ...................................................... 20
3 Research Findings ........................................................................................................................ 22
3.1 FLW Estimate: Annual Tonnage and Value ........................................................................... 23
3.2 Measurement and FLW Trends ............................................................................................ 27
3.3 Categorizing Respondents .................................................................................................... 27
3.4 Causes of FLW along the Value Chain .................................................................................. 29
3.5 Improving Food Rescue and Redistribution ......................................................................... 30
3.6 FLW Destinations .................................................................................................................. 32
3.7 Differentiating Avoidable and Unavoidable/Edible and Inedible ......................................... 34
3.8 Environmental Impact .......................................................................................................... 35
3.8.1 Carbon CO2 .................................................................................................................... 35
3.8.2 Surface and Ground Water ........................................................................................... 36
4 Root Causes .................................................................................................................................. 37
4.1 Culture of Accepting FLW ..................................................................................................... 37
4.2 Industry ................................................................................................................................. 39
4.2.1 Business Owners’/Employees’ Acceptance of Waste ................................................... 39
4.2.2 Adversarial, Distrusting Relationships .......................................................................... 39
4.2.3 Purposely Conservative Date Codes ............................................................................. 40
4.2.4 Ineffective FLW Measurement, Reporting and Mitigation ........................................... 40

2
4.2.5 Maximizing Production Capacity and Throughput ....................................................... 40
4.2.6 Reluctance and/or Resistance to Donate Safe Edible Food .......................................... 41
4.3 Redistribution by Community Food Programs ..................................................................... 41
4.3.1 Strategic ........................................................................................................................ 42
4.3.2 Operational ................................................................................................................... 42
4.4 Consumers ............................................................................................................................ 43
4.4.1 Part-filled Shelves.......................................................................................................... 43
4.4.2 Best before Dates .......................................................................................................... 43
4.4.3 Product Aesthetics (Appearance) ................................................................................. 44
4.4.4 Packaging of Products ................................................................................................... 44
4.4.5 Menu Design ................................................................................................................. 44
4.5 Waste Management Practices and Options ......................................................................... 44
4.6 Government Policies, Regulations and Legislation ............................................................... 45
4.6.1 Policies that lead to industry and consumers not internalizing the true cost of FLW .. 46
4.6.2 Unintended consequences of policies, regulations and legislation .............................. 46
4.6.3 A belief that reducing FLW will negatively impact farmers’ and businesses’ viability . 49
5 Solutions and Actions ................................................................................................................... 49
5.1 Three to Succeed .................................................................................................................. 50
5.2 Making Change Happen ........................................................................................................ 51
5.3 Comments on Proposed Solutions and Actions ................................................................... 65
5.3.1 Suitability and Limitations by Food Type and Location ................................................ 65
5.3.2 Differentiating Actions by Chains’ Collaborative Capacity ........................................... 65
6 Future Research ........................................................................................................................... 68
7 Bibliography ................................................................................................................................. 72
Appendix A – Gathering and Analysis of Data ..................................................................................... 75
Appendix B – Methodology ................................................................................................................. 97
Appendix C – GHG Associated with FLW ........................................................................................... 115

3
List of Tables
Table 2-1: Connecting Commodities to Consumer Foods and Beverages ........................................... 21
Table 3-1: Percentage of Survey Responses by Business Type ............................................................ 22
Table 3-2: Estimated FLW along the Chain (in Metric Tonnes - Millions) ........................................... 23
Table 3-3: Canadian Food System Overview: Inputs, Losses, Consumed (Volume and Percent) ....... 24
Table 3-4: Volume and Value of Avoidable, Potentially Edible Waste ................................................ 26
Table 3-5: Three by Three Matrix for Categorizing FLW ...................................................................... 34
Table 3-6: CO2 Equivalent of Total, Avoidable and Unavoidable FLW (Million Tonnes) ...................... 35
Table 3-7: Blue Water Footprint of Total, Avoidable and Unavoidable FLW (Billion Tonnes) ............ 36
Table 5-1: Classification of Value Chains ............................................................................................. 66
List of Figures
Figure 2-1: The Project’s Four Phases .................................................................................................. 16
Figure 2-2: Project Scope ..................................................................................................................... 17
Figure 2-3: Three Subsystems Pertaining to Value Chain Analysis ...................................................... 19
Figure 3-1: Tonnage (in Millions) and Percentage of Total Waste ...................................................... 25
Figure 3-2 Tonnage (in Millions) and Percentage of Unplanned, Post-Processing (Avoidable),
Potentially Edible FLW ......................................................................................................................... 25
Figure 3-3: Measurement Practices vs. FLW Level Trends .................................................................. 27
Figure 3-4: Four Respondent Groups ................................................................................................... 28
Figure 3-5 Immediate Causes of FLW in Industry ................................................................................ 29
Figure 3-6: Causes of Loss during Food Redistribution ........................................................................ 30
Figure 3-7: Median Percentage of Unsold Edible Food and Beverages Not Rescued ......................... 31
Figure 3-8: Ways to Improve Food Rescue and Redistribution ........................................................... 32
Figure 3-9: Utilization of FLW Destinations by Value Chain Members ................................................ 33
Figure 4-1: Vicious Cycle Driving FLW .................................................................................................. 38
Figure 5-1: Change Processes to Reduce FLW ..................................................................................... 51

4
Executive Summary
Stated in simple terms, food loss and waste (FLW) is 1) the discarding of resources along the value
chain utilized in the production and distribution of consumer foods and beverages, and 2) foods
purchased by consumers though not eaten. As shown in the diagram below, the term “food loss” is
typically used to describe the discarding of food that occurs from production through to processing,
while the term “food waste” describes the discarding of food during its distribution to consumers
through retail or foodservice and subsequently in the home. Food waste also applies to food and
beverages that are donated to food rescue organizations but end up being discarded.
Commonly Accepted Distinction between Food Loss and Food Waste
A year-long study, undertaken by Value Chain Management International in partnership with
Second Harvest, has led to the development of this technical report, which is a guide to reducing
FLW in Canada through prevention and redistribution, and reducing FLW going to landfill by reuse
and recycling.
The report reflects the Food Recovery Hierarchy produced by the United States Environmental
Protection Agency.1 The Food Recovery Hierarchy states that the most preferred FLW management
approach is to reduce at source, followed by redistribution to address hunger, reuse (e.g. feeding to
animals), and recycle (e.g. turning FLW into bio-fuel). The least preferred FLW management option
is landfill.
This is a world-first project; the following factors that differentiate our project from prior FLW
research are summarized below.
It is a whole of chain analysis, from primary production through to end of life (incl.
consumed, lost or wasted).
1 https://www.epa.gov/sustainable-management-food/reduce-wasted-food-feeding-hungry-people

5
The whole of chain analysis includes the rescue of all food types from along the value chain
and the effectiveness of efforts involved in redistributing food to community food groups.
It establishes a replicable whole of chain FLW analytical framework, comprising
standardized metrics that can be utilized at enterprise and industry level.
The project encompasses all food types, sourced/processed from terrestrial and marine
commodities.
It identifies then validates loss factors based on primary data provided by industry.
It calculates mass balance: total available commodities produced for food, minus exports,
plus imports (from a whole chain perspective).
It establishes a means to connect commodities to finished products (foods and beverages),
to enable extrapolations to be established between consumer products and primary source.
It identifies the root causes of FLW, where they occur along the value chain, and the extent
to which they differ by food type.
It assesses the destination of FLW occurring along the value chain.
It estimates household FLW by having Canadianized loss factors produced by USDA/ERS.2
Two forms of FLW occur along the food chain: 1) planned (unavoidable) FLW – such as animal
bones; and 2) unplanned / post-processing (avoidable) FLW – such as apples that reach the retail
store, though are not purchased by consumers due to having been bruised in transit. Because it is
preventable, avoidable FLW represents the greatest opportunity to reduce FLW. This can be
achieved by improving the processes involved in producing/catching, manufacturing and
distributing foods and beverages to consumers.
The research identifies that all types of FLW are avoidable to a degree, because reducing avoidable
FLW has a direct and positive effect on the occurrence of unavoidable FLW. An example is bread:
less avoidable waste in foodservice, retail stores and in the home (due to better forecasting,
handling and storage) would result in less production waste further up the chain. This would be
because less grain would be milled in the production of the flour, and in turn less flour used in the
manufacturing of the bread.
The research estimates that the total avoidable and unavoidable FLW occurring annually along
the Canadian food value chain equates to 35.5 million metric tonnes,3 of which 11.2 million
metric tonnes (32%) is avoidable FLW (the equivalent of the weight of almost 95 CN Towers).
Based on the consumer (retail and HRI4) value of food, the value of avoidable FLW equates to
$49.5 billion, representing 51.8 percent of the money Canadians spent on food purchased from
2 https://www.ers.usda.gov/data-products/food-availability-per-capita-data-system/loss-adjusted-food-availability-documentation/ 3 Total FLW estimated to represent 58 percent of commodities entering the Canadian food system 4 HRI = hotels, restaurants and institutions

6
retail stores in Canada in 2016. ($49.5 billion equates to 3% of Canada’s 2016 GDP and would feed
every person living in Canada for almost 5 months.)
Based on an assessment produced for Second Harvest by VCMI, the GHG footprint of FLW occurring
in Canada is 56.5 million tonnes of CO2 equivalent, Based on environmental assessments of FLW
produced by the Food and Agriculture Organization of the United Nations (FAO), the blue water
(surface and ground water) footprint of avoidable FLW occurring in Canada is 1.4 billion tonnes.
Total FLW accounts for almost 60 percent of the food industry’s blue water footprint.
The root causes of the FLW that occurs in Canada include a culture of accepting waste. A direct
correlation can be drawn between some business and governmental decisions and the creation of
avoidable FLW. Other root causes of FLW include the true cost of FLW not being internalized by
industry and consumers. In addition, there is no common template for redistributing food that
would otherwise go to landfill or non-food use. Prior FLW estimations have commonly not
considered foods and by-products going to animal feed as loss and waste, and that masks enormous
inefficiencies.
These and other factors have negatively impacted the motivation and ability to implement the
fundamental changes in behaviour within businesses, across value chains, and among consumers
that are required to manifestly and sustainably reduce FLW.
Why this enormous inefficiency and the causal factors identified by the research exist are not the
fault of one organization, business, sector, or government department. FLW is a systemic issue that
results from how the food system presently operates. Systemic issues can only be fully addressed
by tackling the underlying assumptions, values and practices that determine how the present
system operates.
Addressing the systemic issues identified during the study would provide enormous economic,
environmental and social benefits. Four million Canadians have insufficient access to food.
Nevertheless, of the avoidable and edible FLW that occurs along the value chain, an estimated 86
percent is currently not rescued and redistributed.
The research findings and FLW solutions presented in this report were produced by employing
value chain analysis and mass balance methodologies to:
1. Create a standardized framework for estimating, benchmarking and monitoring FLW at the
business, sector, national, and international level;
2. Estimate unavoidable (planned) and avoidable (unplanned / post processing) FLW occurring
along the food value chain, from the primary production or capture of terrestrial and
marine commodities through to consumer foods and beverages;
3. Identify the root causes of Canadian FLW occurring in different foods and at explicit points
along the value chain; and
4. Develop sustainable solutions for reducing FLW in Canada.
The above is described in greater detail in Appendix A.
7
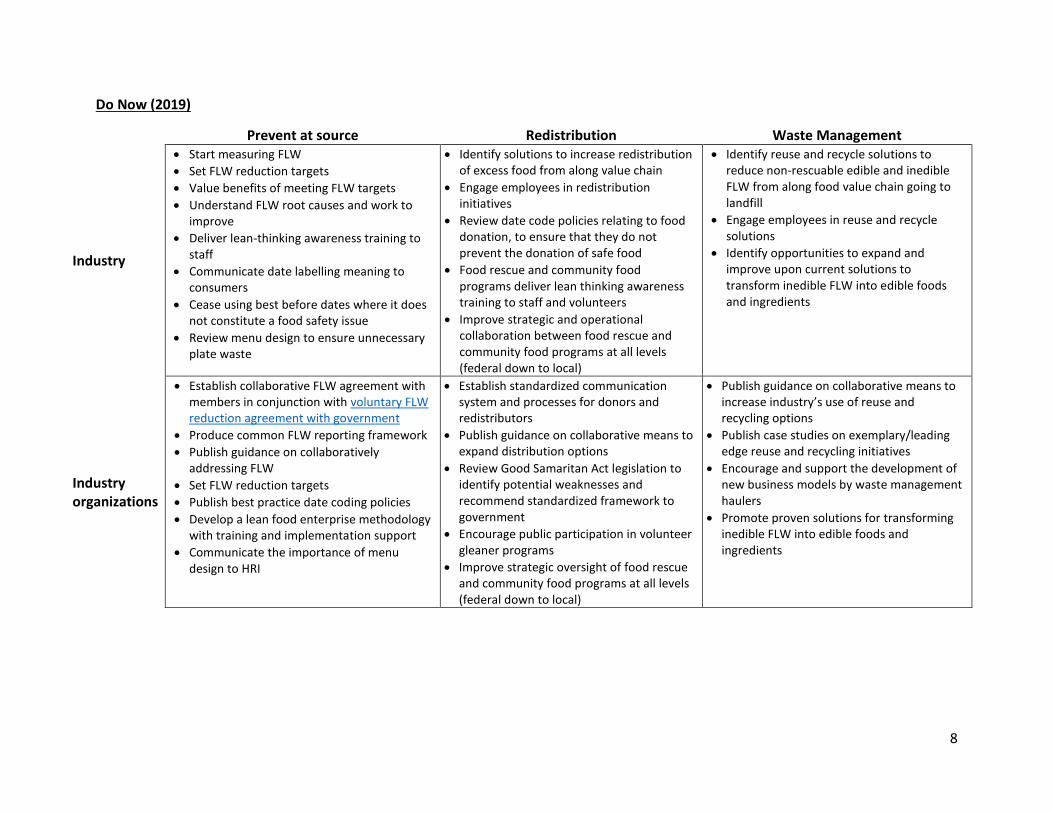
The proposed actions for change that will result in reduced FLW and assist in achieving ten5 of the
targets contained in the United Nations Sustainable Developments Goal 12, to which Canada is a
signatory, are summarized below in matrices contained in the following three tables. The timelines
for implementing these actions are presented as “Do now (2019),” “Do soon (2020-2021)” and
“Build a plan (2022 onwards).” The proposed solutions and actions are detailed at the conclusion of
this report.
The three matrices together form the roadmap for reducing FLW in Canada. Many of the same
actions could be applied worldwide in developed and developing nations to reduce FLW on a global
scale.
5 https://sustainabledevelopment.un.org/sdg12 - SDG goals that the project directly and indirectly connects with
include: 12.1, 12.2, 12.3, 12.4, 12.5, 12.6, 12.7, 12.8, 12.A and 12.B
8
Do Now (2019)
Prevent at source Redistribution Waste Management
Industry
Start measuring FLW
Set FLW reduction targets
Value benefits of meeting FLW targets
Understand FLW root causes and work to improve
Deliver lean-thinking awareness training to staff
Communicate date labelling meaning to consumers
Cease using best before dates where it does not constitute a food safety issue
Review menu design to ensure unnecessary plate waste
Identify solutions to increase redistribution of excess food from along value chain
Engage employees in redistribution initiatives
Review date code policies relating to food donation, to ensure that they do not prevent the donation of safe food
Food rescue and community food programs deliver lean thinking awareness training to staff and volunteers
Improve strategic and operational collaboration between food rescue and community food programs at all levels (federal down to local)
Identify reuse and recycle solutions to reduce non-rescuable edible and inedible FLW from along food value chain going to landfill
Engage employees in reuse and recycle solutions
Identify opportunities to expand and improve upon current solutions to transform inedible FLW into edible foods and ingredients
Industry organizations
Establish collaborative FLW agreement with members in conjunction with voluntary FLW reduction agreement with government
Produce common FLW reporting framework
Publish guidance on collaboratively addressing FLW
Set FLW reduction targets
Publish best practice date coding policies
Develop a lean food enterprise methodology with training and implementation support
Communicate the importance of menu design to HRI
Establish standardized communication system and processes for donors and redistributors
Publish guidance on collaborative means to expand distribution options
Review Good Samaritan Act legislation to identify potential weaknesses and recommend standardized framework to government
Encourage public participation in volunteer gleaner programs
Improve strategic oversight of food rescue and community food programs at all levels (federal down to local)
Publish guidance on collaborative means to increase industry’s use of reuse and recycling options
Publish case studies on exemplary/leading edge reuse and recycling initiatives
Encourage and support the development of new business models by waste management haulers
Promote proven solutions for transforming inedible FLW into edible foods and ingredients
9
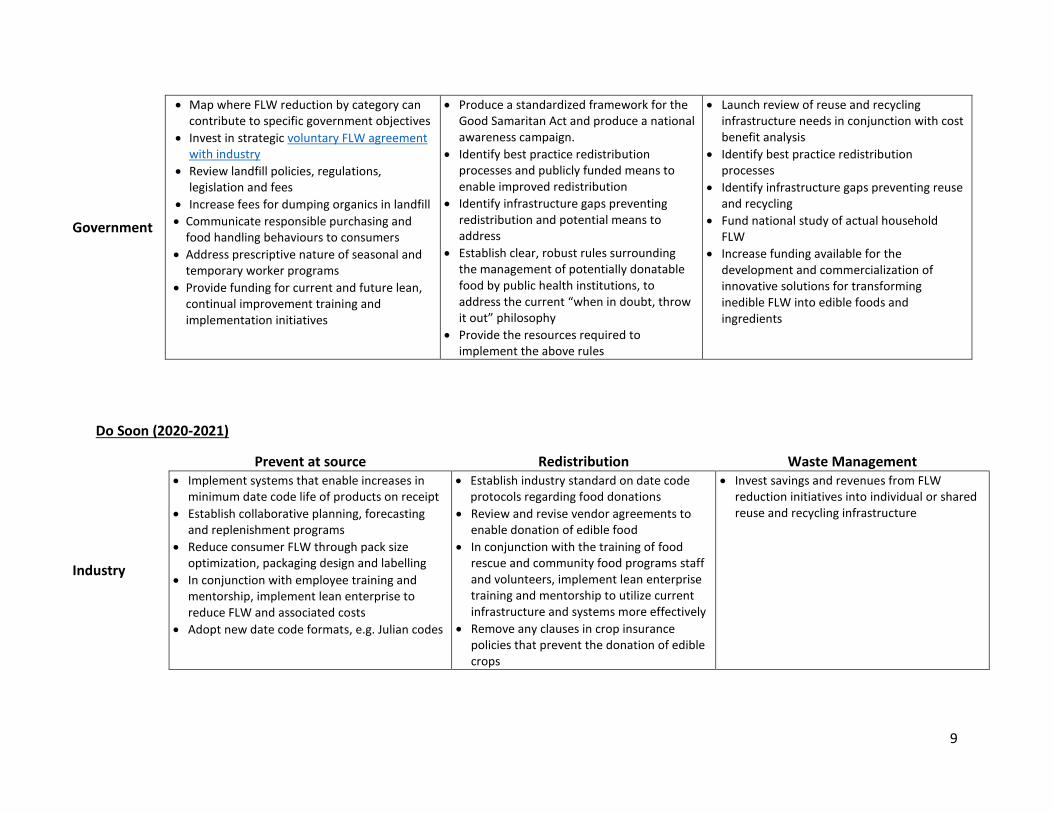
Government
Map where FLW reduction by category can contribute to specific government objectives
Invest in strategic voluntary FLW agreement with industry
Review landfill policies, regulations, legislation and fees
Increase fees for dumping organics in landfill
Communicate responsible purchasing and food handling behaviours to consumers
Address prescriptive nature of seasonal and temporary worker programs
Provide funding for current and future lean, continual improvement training and implementation initiatives
Produce a standardized framework for the Good Samaritan Act and produce a national awareness campaign.
Identify best practice redistribution processes and publicly funded means to enable improved redistribution
Identify infrastructure gaps preventing redistribution and potential means to address
Establish clear, robust rules surrounding the management of potentially donatable food by public health institutions, to address the current “when in doubt, throw it out” philosophy
Provide the resources required to implement the above rules
Launch review of reuse and recycling infrastructure needs in conjunction with cost benefit analysis
Identify best practice redistribution processes
Identify infrastructure gaps preventing reuse and recycling
Fund national study of actual household FLW
Increase funding available for the development and commercialization of innovative solutions for transforming inedible FLW into edible foods and ingredients
Do Soon (2020-2021)
Prevent at source Redistribution Waste Management
Industry
Implement systems that enable increases in minimum date code life of products on receipt
Establish collaborative planning, forecasting and replenishment programs
Reduce consumer FLW through pack size optimization, packaging design and labelling
In conjunction with employee training and mentorship, implement lean enterprise to reduce FLW and associated costs
Adopt new date code formats, e.g. Julian codes
Establish industry standard on date code protocols regarding food donations
Review and revise vendor agreements to enable donation of edible food
In conjunction with the training of food rescue and community food programs staff and volunteers, implement lean enterprise training and mentorship to utilize current infrastructure and systems more effectively
Remove any clauses in crop insurance policies that prevent the donation of edible crops
Invest savings and revenues from FLW reduction initiatives into individual or shared reuse and recycling infrastructure

10
Industry organizations
Assist members to quantify true cost of FLW
Provide CFO and executive mentorship in total cost accounting, FLW reduction best practices
Publish case studies on industry collaboration to reduce FLW
Commence publishing FLW reduction figures
Promote optimized packaging to consumers
Provide food packaging optimization advice
Standardize what a portion should be to reduce plate waste
Create official protocols for serving systems (e.g. buffet process) to encourage donation of excess food
Support implementation of foundational redistribution system, with guidance on modifying to suit local conditions
Establish and communicate best practice standardized guidelines on date code policies regarding donated food
Work with industry and government to eliminate date codes from being abused for competitive advantage
Publish food rescue, redistribution figures
Standardize language around the descriptions used to determine whether unsold food is donated or destroyed
Identify and publish best practice models for implementation by food rescue and community food programs
Support implementation of foundational reuse and recycling systems, with guidance on modifying to suit local conditions
Identify best practice reuse and recycling practices for packaged foods
Publish improvements in reuse and recycling, including amount diverted from landfill
Government
Tie food procurement by public institutions to the reporting of FLW
Commence investment in infrastructure required to enable room service meal preparation and delivery in publicly funded HRI
Review impact of business relationships on FLW levels and destinations
Legislate mandatory reporting of FLW
When issuing RFPs, include need for respondents to measure and reduce the amount of food going to waste
Establish clear national enforceable date coding regulations and legislation
Establish standardized emissions polices, regulations and legislation
Invest in the development of innovative redistribution infrastructure and initiatives, including the implementation of lean by food banks and other hunger relief agencies
Collaborate with industry, food rescue and community food programs on redistribution initiatives to ensure best practices wherever possible
Publish best practice food rescue, redistribution and community food program models
Establish clear guidelines and legal framework for allowing mislabelled food products that do not represent a food safety hazard to be donated
Ensure removal of any clauses in crop insurance policies that prevent the donation of edible crops
Invest revenue from increased landfill and emissions taxes in the development of innovative reuse and recycling infrastructure and initiatives
Establish standardized reuse and recycling polices, regulations and legislation
Establish national ban to prevent FLW going to landfill with firm timelines for its implementation
Establish national ban to prevent FLW being dumped at sea with firm timelines for its implementation
11
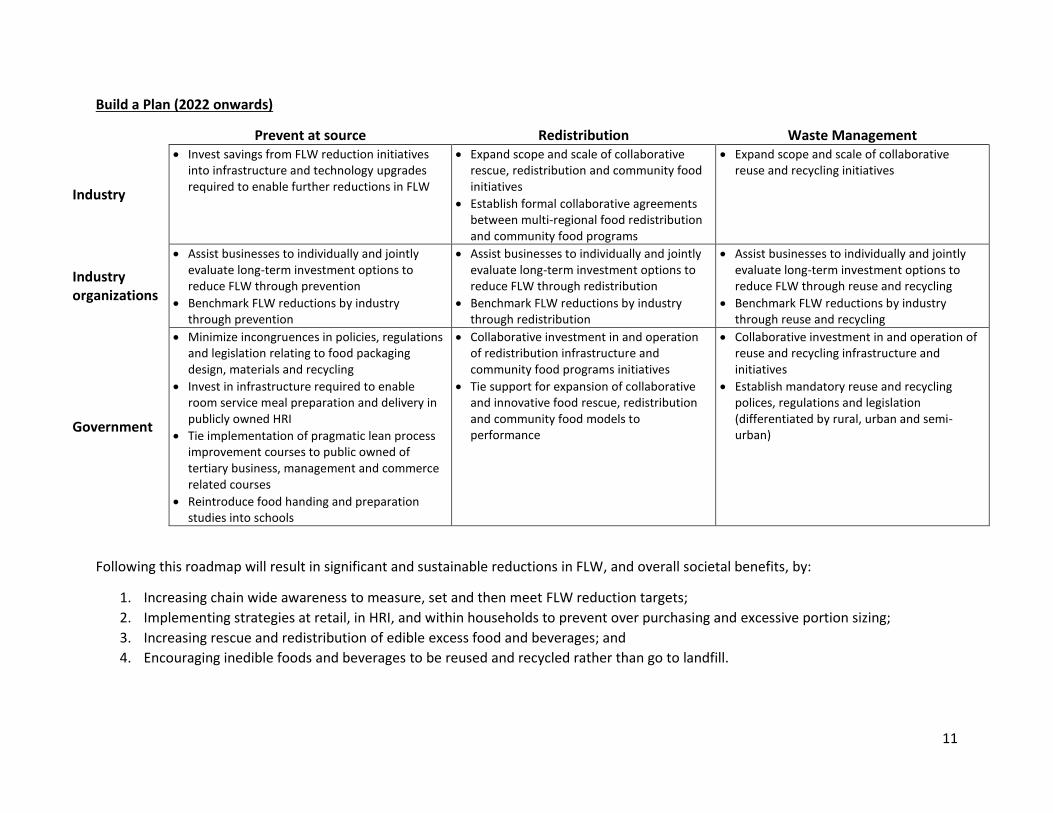
Build a Plan (2022 onwards)
Prevent at source Redistribution Waste Management
Industry
Invest savings from FLW reduction initiatives into infrastructure and technology upgrades required to enable further reductions in FLW
Expand scope and scale of collaborative rescue, redistribution and community food initiatives
Establish formal collaborative agreements between multi-regional food redistribution and community food programs
Expand scope and scale of collaborative reuse and recycling initiatives
Industry organizations
Assist businesses to individually and jointly evaluate long-term investment options to reduce FLW through prevention
Benchmark FLW reductions by industry through prevention
Assist businesses to individually and jointly evaluate long-term investment options to reduce FLW through redistribution
Benchmark FLW reductions by industry through redistribution
Assist businesses to individually and jointly evaluate long-term investment options to reduce FLW through reuse and recycling
Benchmark FLW reductions by industry through reuse and recycling
Government
Minimize incongruences in policies, regulations and legislation relating to food packaging design, materials and recycling
Invest in infrastructure required to enable room service meal preparation and delivery in publicly owned HRI
Tie implementation of pragmatic lean process improvement courses to public owned of tertiary business, management and commerce related courses
Reintroduce food handing and preparation studies into schools
Collaborative investment in and operation of redistribution infrastructure and community food programs initiatives
Tie support for expansion of collaborative and innovative food rescue, redistribution and community food models to performance
Collaborative investment in and operation of reuse and recycling infrastructure and initiatives
Establish mandatory reuse and recycling polices, regulations and legislation (differentiated by rural, urban and semi-urban)
Following this roadmap will result in significant and sustainable reductions in FLW, and overall societal benefits, by:
1. Increasing chain wide awareness to measure, set and then meet FLW reduction targets;
2. Implementing strategies at retail, in HRI, and within households to prevent over purchasing and excessive portion sizing;
3. Increasing rescue and redistribution of edible excess food and beverages; and
4. Encouraging inedible foods and beverages to be reused and recycled rather than go to landfill.

12
Glossary of Terms
As definitions adopted by FLW researchers are often not uniform, this section defines key terms and
positions taken by the project team.
Collaborative Planning, Forecasting & Replenishment
Collaboration between multiple business partners for the purpose of driving continual improvements in marketing, production, and replenishment activities; resulting in increased value for consumers, while simultaneously producing sustainable competitive advantages for the involved businesses.
Food loss
Discarding of edible and inedible commodities and foods during the production, processing and manufacturing of food or beverages for human consumption prior to their distribution and sale in retail or foodservice. Includes commodities used in the production of beverages. Examples include barley used in the production of beer and spirits, grapes used in the production of wine, carrots used in the production of fruit juice.
Food waste Discarding of edible foods and beverages (and inedible parts of) during distribution retail, foodservice, households and during redistribution. Includes beverages, unless explicitly stated otherwise.
Full cost accounting6
The measurement and valuation in monetary terms of the externality costs associated with the environmental and societal impacts of food loss and waste.
Internalize Environmental and social costs resulting from how products are produced, manufactured, consumed and managed throughout their life cycles are incorporated into cost and pricing structures, and stakeholders’ decisions.
Macroeconomic Analysis of the interrelationships that occur within and between different sectors in order to understand how and why the overall economy functions.
Manufacturing Further processing of primary processed products into consumer foods that typically contain multiple ingredients. For example: animal carcasses into frozen entrees; flour, eggs and salt into bread; fruits, nuts, oats into granola.
Planned loss These losses are inevitable. Examples of planned losses include husks, animal skins and bones.
Post-processing loss
These loses occur after processing and are typically due to market related factors, such as products reaching expiry dates, orders being cancelled, products being damaged, or products being rejected/returned.
Processing
The primary processing of commodities into foods purchased by consumers or food ingredients used in the further manufacturing of consumer foods. Examples of practices within this category included the grading and packaging of fruits and vegetables, and the processing of wheat into flour.
Theoretically edible foods
Food that is fit for human consumption.
Theoretically inedible foods
Peels, bones, by-product of processing or food preparation that is not fit for human consumption.
6 FAO Full Cost Accounting Methodology (2014)
13
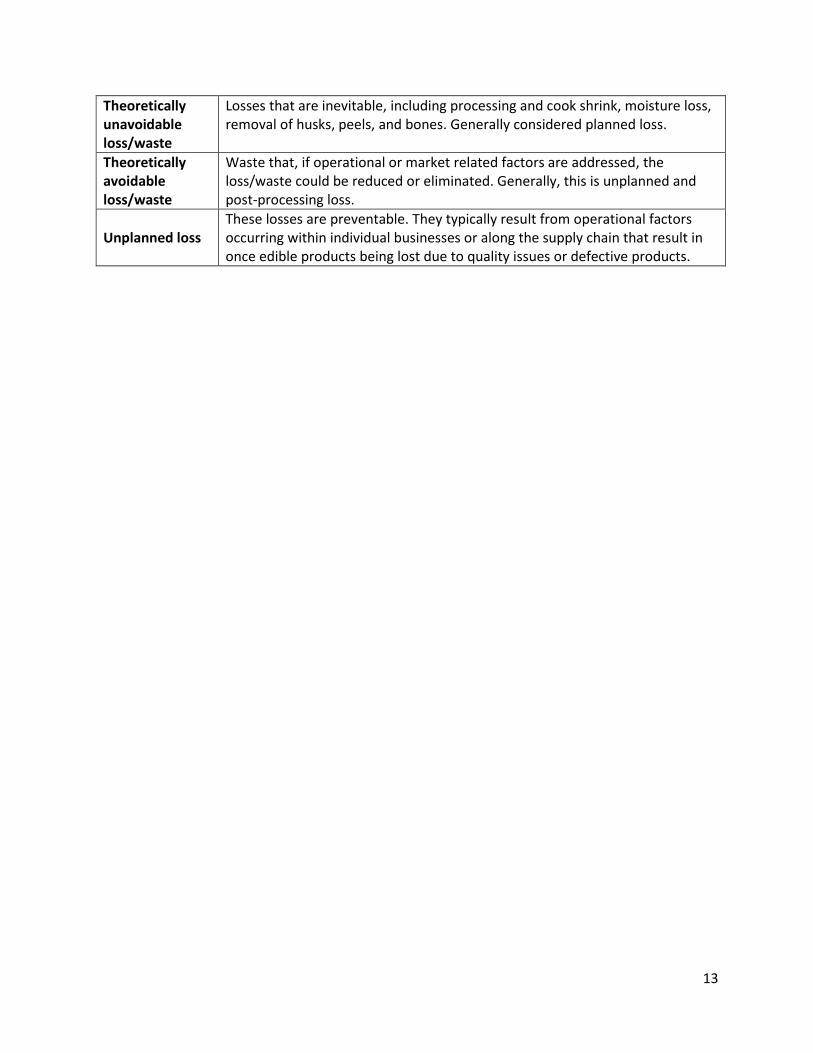
Theoretically unavoidable loss/waste
Losses that are inevitable, including processing and cook shrink, moisture loss, removal of husks, peels, and bones. Generally considered planned loss.
Theoretically avoidable loss/waste
Waste that, if operational or market related factors are addressed, the loss/waste could be reduced or eliminated. Generally, this is unplanned and post-processing loss.
Unplanned loss These losses are preventable. They typically result from operational factors occurring within individual businesses or along the supply chain that result in once edible products being lost due to quality issues or defective products.

14
1 Introduction
The Food and Agriculture Organization of the United Nations (FAO) estimated that, worldwide, one
third of food produced for human consumption is lost or wasted.7 The analysis used to produce this
estimate primarily utilized administrative data8 and theoretical percentages of losses and waste.
FAO’s estimates were not based on primary data obtained for the purposes of calculating food loss
and waste9 (FLW). Studies that used theoretical percentages of loss and waste to estimate regional
FLW include ReFED’s analysis of FLW occurring in the United States.10
The purpose of the evidence-based research undertaken by Value Chain Management International
(VCMI), in partnership with Second Harvest, was to create then populate a whole of chain
framework for estimating FLW and identifying its root causes by sourcing primary data from
industry, then use the findings to:
1) Produce materials for enabling industry to implement sustainable solutions to reduce FLW
through prevention and redistribution, and
2) Reduce FLW going to landfill through improved reuse and recycling.
To enable the comparative effectiveness of FLW reduction efforts to be directly compared and
benchmarked – resulting in the ability to continually improve on best practice – the framework
described in Section 2 utilizes one standardized metric that is internationally recognized: metric
tonnes.
With minimal modification, the same framework could be used to estimate and benchmark the
environmental impacts of FLW, for example, tonnes of GHG or tonnes/litres of water.
1.1 Why Reduce FLW?
FLW represents enormous economic costs to businesses and society. It also represents enormous
environmental impacts and costs. FLW impacts productivity and stifles investment and innovation.
The costs of FLW extend to unnecessary transportation, energy, water, fertilizer, machinery and
equipment, packaging, labour, and capital invested – just to name a few.
Although there is currently enough food to adequately feed the world’s population, we have
regions that have severe malnutrition, while other regions have public health issues, such as
obesity. Four million Canadians (including 1.4 million children) have insufficient access to food,
despite the enormity of avoidable FLW that occurs along the chain and in the home.
7 http://www.fao.org/save-food/resources/keyfindings/en/ 8 Administrative FAO data: production volumes from FAO Statistical Yearbook 2009, national and regional Food Balance Sheets from the year 2007 9 The term “food loss and waste” encompasses food and beverages. 10 ReFED (2016). A Roadmap to Reduce US Food Waste by 20%: Technical Appendix

15
Economically FLW represents the lost value of the food that is waste, the cost of disposal and
negative externalities of the disposal, and the opportunity cost of the farmland.11 FLW is therefore
an indication of inefficiency that drives up costs and lowers productivity, leading to higher prices.
Costs of disposal and over production to accommodate the factored-in losses drive up the costs of
business. If combated, this could lead to lower prices and increase food accessibility, and/or lead to
consumers trading up to higher value products that are more profitable for businesses.
Reducing FLW therefore represents an opportunity for businesses along the entire food chain to
improve their financial performance and competitiveness. These opportunities arise from cost
reduction, competitive positioning and resource efficiency; thus, providing businesses an
opportunity to improve performance in all three pillars of sustainability – environment, economy
and society.
2 Scope and Methodology
In a concerted effort to address the factors described above, VCMI and Second Harvest undertook a
whole of chain evidence-based FLW analysis of the Canadian food industry. A detailed description
of the project’s research methodology is presented in Appendix B.
In 2016 Canada’s agri-food industry generated $111.9 billion GDP and 6.6 percent of Canada’s total
GDP.12
The research encompassed and expanded upon approaches employed in prior FLW research. This
included incorporating the Food Loss and Waste Accounting and Reporting Standard13 (FLWARS)
throughout the analysis and reporting.
As shown in the project pathway presented below (Figure 2-1) the project was completed in four
phases, with a reiterating validation process occurring during phases 2 and 3.
11 Buchner, Barbara, Claude Fischler, Ellen Gustafson, John Reilly, Gabriele Riccardi, Camillo Ricordi, Umberto Veronesi, and Barilla Center for Food & Nutrition (BCFN). 2012. “Food Waste: Causes, Impacts and Proposals.” Barilla Center for Food & Nutrition, 53–61. doi:45854585 12 http://www.agr.gc.ca/eng/about-us/publications/economic-publications/an-overview-of-the-canadian-agriculture-and-agri-food-system-2017/?id=1510326669269 13 Food Loss and Waste Accounting and Reporting Standard
16
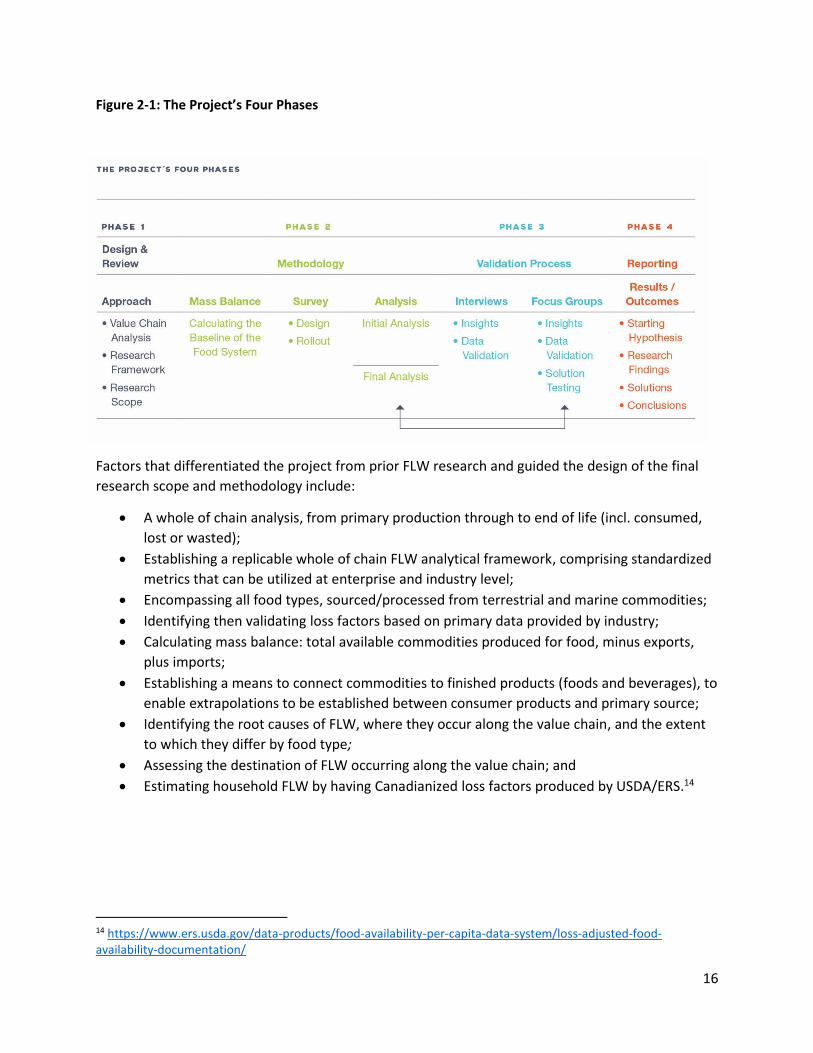
Figure 2-1: The Project’s Four Phases
Factors that differentiated the project from prior FLW research and guided the design of the final
research scope and methodology include:
A whole of chain analysis, from primary production through to end of life (incl. consumed,
lost or wasted);
Establishing a replicable whole of chain FLW analytical framework, comprising standardized
metrics that can be utilized at enterprise and industry level;
Encompassing all food types, sourced/processed from terrestrial and marine commodities;
Identifying then validating loss factors based on primary data provided by industry;
Calculating mass balance: total available commodities produced for food, minus exports,
plus imports;
Establishing a means to connect commodities to finished products (foods and beverages), to
enable extrapolations to be established between consumer products and primary source;
Identifying the root causes of FLW, where they occur along the value chain, and the extent
to which they differ by food type;
Assessing the destination of FLW occurring along the value chain; and
Estimating household FLW by having Canadianized loss factors produced by USDA/ERS.14
14 https://www.ers.usda.gov/data-products/food-availability-per-capita-data-system/loss-adjusted-food-availability-documentation/

17
2.1 Project Scope
The scope of the project is presented below (Figure 2-2), using a modified version of the FLWARS
template. So that the template reflects the research methods and results described in subsequent
sections of this document, working left to right, the column “boundary” has been placed ahead of
“destination.”
Figure 2-2: Project Scope

18
2.2 Research Methods
The research methodology utilized and expanded upon methodologies employed in prior FLW
research. Of particular note regarding the research methods is the application of value chain
analysis (2.1.1) and mass balance (2.1.2) techniques, and directly connecting commodities (2.1.3) to
consumer foods and beverages. The research was also guided and enabled by:
The intellectual property and international experience possessed by the VCMI team, a
number of whom possess two decades of experience extracting waste from businesses and
value chains operating in multiple industries in developed and developing nations; and
A stakeholder advisory group – comprising expert industry stakeholders from farming,
processing, distribution, foodservice, retail, academia, and industry organizations – to help
engage industry, validate research methods and research findings, and ensure no important
considerations were omitted.
2.2.1 Value Chain Analysis
Value chain analysis (VCA) provides a rigorous assessment of the interactions and outcomes that
together shape how a food system operates. VCA can be applied at the enterprise and industry
level. This enables researchers to determine factors impacting the creation of FLW, by having
investigated interrelationships between the three subsystems that together determine how
individual businesses within the food industry – and ultimately the food industry itself – operate. As
presented in Figure 2-3, the three subsystems are:
1) Governance
2) Product and technology
3) Information and communication

19
Figure 2-3: Three Subsystems Pertaining to Value Chain Analysis
20
The VCA process recognizes that FLW is impacted by weaknesses in intra- and inter-firm
relationships – with ineffective operations and communication resulting from a lack of strategic
alignment, operational understanding, trust, commitment, benefit sharing, and collaboration. For
these reasons, the level of collaboration that exists within and between businesses will influence
the amount of FLW occurring along the value chain in which they operate. The same reasons impact
businesses’ motivation and ability to reduce FLW. That these disconnects can be addressed and the
resulting opportunities achieved with little if any capital investment makes FLW solutions an easy
win for businesses, consumers and wider industry stakeholders.
Another important reason for utilizing VCA in FLW research is that individuals’ experiences and
personal beliefs need to be understood, as these influence how they view themselves in context to
the world around them and how they will respond to potential recommendations.
2.2.2 Mass Balance
Mass balance techniques are widely used for the purpose of analysing the volume of materials
flowing through a physical system. This is achieved by accounting for materials that enter and exit a
system. With all commodities, foods and beverages being transported by land, sea and/or air, their
weight in metric tonnes can be readily calculated.
The research established a baseline of food availability at primary production in metric tonnes. This
is total volume of food that is grown, caught and harvested, and enters the Canadian food system.
The process followed to achieve the food availability baseline was:
𝐹𝑜𝑜𝑑 𝑃𝑟𝑜𝑑𝑢𝑐𝑡𝑖𝑜𝑛15 − (𝐸𝑥𝑝𝑜𝑟𝑡𝑠 + 𝐼𝑚𝑝𝑜𝑟𝑡𝑠) ± (𝐴𝑑𝑗𝑢𝑠𝑡𝑚𝑒𝑛𝑡 𝑓𝑜𝑟 𝑃𝑟𝑜𝑐𝑒𝑠𝑠𝑒𝑑 𝐹𝑜𝑜𝑑16)
= 𝐵𝑎𝑠𝑒𝑙𝑖𝑛𝑒
This baseline informed the development of a mass balance model that, through applying loss
factors identified from primary data provided by industry, calculated the waste occurring at each
point in the chain of the food types presented below from production to distribution, then
subsequently retail and/or HRI.17 Household FLW was estimated through the analysis of Statistics
Canada data using modified USDA/ERS loss factors.
2.2.3 Connecting Commodities to Foods and Beverages
To enable whole of chain analysis of foods and beverages, a link was established between products
consumed and the commodities from which they are derived. Following an analysis of commodity
and product categories developed by organizations including FAO, WRAP, ReFED and Canadian
commodity data sheets, the six categories presented below in Table 2-1 were established.
15 Terrestrial and marine 16 Adjustment made after processing and manufacturing within the value chain model 17 Hotels, Restaurants and Institutions (foodservice)

21
Table 2-1: Connecting Commodities to Consumer Foods and Beverages
Category Dairy and
Eggs Field Crops Produce
Meat and
Poultry Marine
Sugars and
Syrups
Consumer
products
incl.
(examples)
• Eggs • Liquid
milk • Cream • Yogurt • Cheese • Butter
• Bread • Baked
goods • Cereal • Beer • Spirits • Soymilk • Vegetable
oils
• Fresh fruits and vegetables (F+V)
• Processed F+V
• Nuts18
• Chocolate19
• Fruit juices • Cider • Wine
• Coffee20
• Tea21
• Fresh cuts • Primal cuts • Processed
meats • Entrees
• Fresh fish • Processed
fish • Fillets • Shell fish • Entrees
• Maple syrup • Sugar • Honey • Soft drinks
Crops/inputs
(examples)
• Milk: cows, goats, sheep
• Eggs: broiler hens
• Wheat • Soybeans • Barley • Durum • Oats • Canola • Flaxseed • Beans
• Root crops • Tree fruits • Berries • Greenhouse • Leafy greens • Hardy greens • Nuts • Sweetcorn
• Livestock • Poultry
• Sea fish • Freshwater
fish • Seafood
• Maple trees • Sugar beet • Apiaries • Corn
The categorization of commodities and establishing the mass balance for foods/beverages
presented above is most convenient for products consumed fresh or after minimal processing. It
also, however, enables a direct link to be established between further processed products and the
commodities from which they are derived (e.g. in bread, ingredients include multiple types of grains
and seeds, sugar, margarine or butter, eggs, salt, water, etc.). Knowing the comparative percentage
of inputs used in the manufacture of processed foods, it is possible to measure and monitor loss
and waste of inputs. Thus, all consumer foods and beverages can be extrapolated – at minimum in
reasonably accurate terms – back to the appropriate commodities and their primary production.
18 With the exception of peanuts, which are a legume, nuts are dry hard fruits: https://www.britannica.com/science/nut-plant-reproductive-body 19 Cocoa pods are fruits: https://www.chocolate.org/blogs/chocolate-blog/about-the-cacao-tree 20 Coffee beans are seeds obtained from the harvesting of edible fruit: https://www.pastemagazine.com/articles/2015/06/coffee-fruit-natures-wasted-superfood.html 21 Tea leaves are sourced from a tree that is pruned for ease of harvesting and produces fruit: http://factsanddetails.com/asian/cat62/sub408/item2610.html#chapter-2
22
This process of categorizing products and commodities guided the gathering and analysis of
secondary data required to populate the mass balance model. The categorization of products and
commodities also guided the:
a. Design of two online surveys used to source primary data from industry,
i. Agricultural production and downstream operations for all foods
ii. Marine production (wild capture and farmed) and processing
b. Analysis of primary data and validation processes,
c. Reconciling of secondary and primary to estimate the volume and value of FLW, and
d. Identification of root causes at key points along the value chain by food type.
3 Research Findings
Section 3 summarizes the following research findings (detailed in Appendix A): the volume and
value of FLW estimated to occur along the food value chain (3.1); respondents’ likelihood to
measure FLW versus the comparative occurrence of FLW along the food and beverage value chain
(3.2); the categories into which respondents were grouped (3.3); the primary reasons given for why
FLW occurs (3.4); and suggested ways to improve food rescue and redistribution (3.5). This section
ends by proposing a means to address the limitations of the current binary process of
differentiating avoidable versus unavoidable and edible versus inedible FLW (3.6), and discusses the
environmental impact of FLW (3.7).
Data analyzed to produce loss factors and FLW estimates was primarily sourced through two online
surveys distributed widely to industry. The two surveys were viewed on a total of 782 occasions,
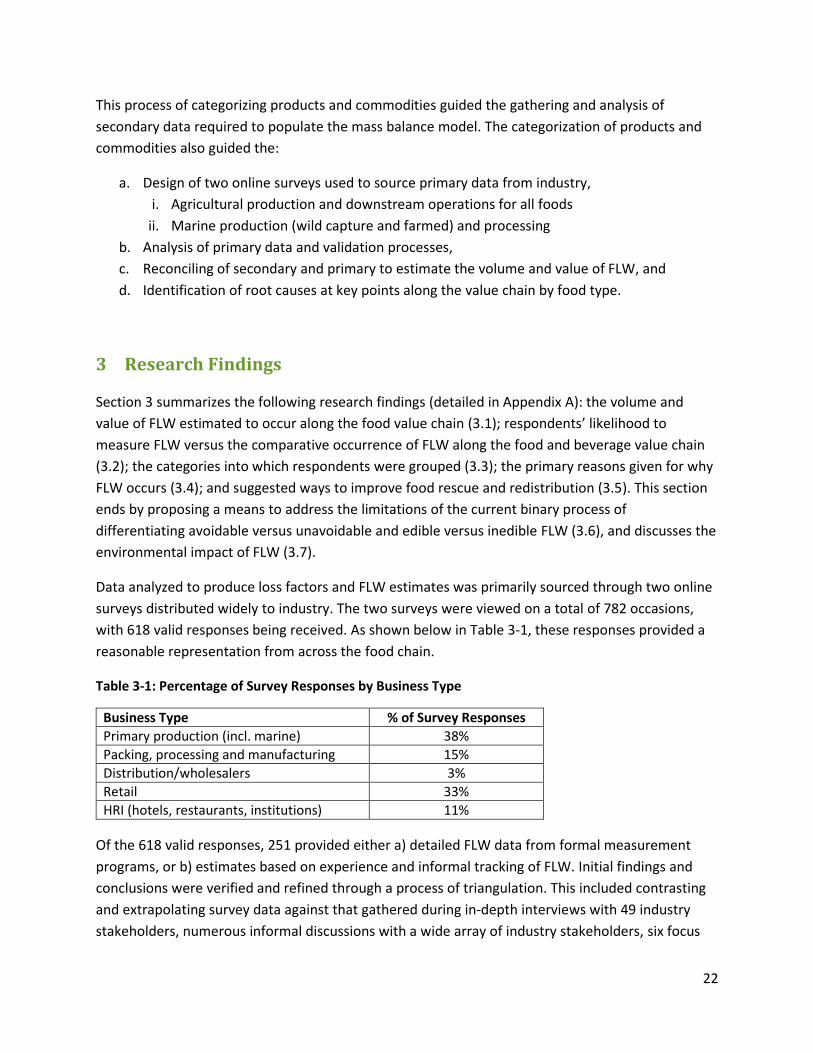
with 618 valid responses being received. As shown below in Table 3-1, these responses provided a
reasonable representation from across the food chain.
Table 3-1: Percentage of Survey Responses by Business Type
Business Type % of Survey Responses
Primary production (incl. marine) 38%
Packing, processing and manufacturing 15%
Distribution/wholesalers 3%
Retail 33%
HRI (hotels, restaurants, institutions) 11%
Of the 618 valid responses, 251 provided either a) detailed FLW data from formal measurement
programs, or b) estimates based on experience and informal tracking of FLW. Initial findings and
conclusions were verified and refined through a process of triangulation. This included contrasting
and extrapolating survey data against that gathered during in-depth interviews with 49 industry
stakeholders, numerous informal discussions with a wide array of industry stakeholders, six focus
23
groups conducted across Canada, and consulting throughout the project with the stakeholder group
referenced in Section 2.2.
3.1 FLW Estimate: Annual Tonnage and Value
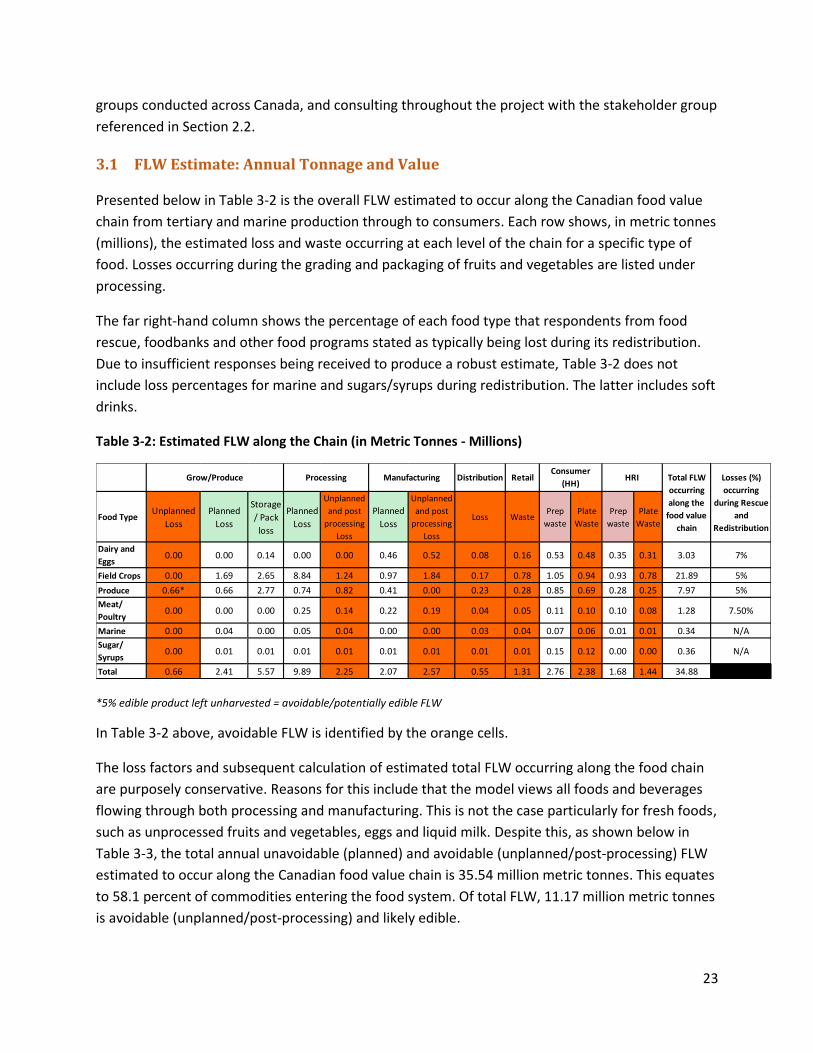
Presented below in Table 3-2 is the overall FLW estimated to occur along the Canadian food value
chain from tertiary and marine production through to consumers. Each row shows, in metric tonnes
(millions), the estimated loss and waste occurring at each level of the chain for a specific type of
food. Losses occurring during the grading and packaging of fruits and vegetables are listed under
processing.
The far right-hand column shows the percentage of each food type that respondents from food
rescue, foodbanks and other food programs stated as typically being lost during its redistribution.
Due to insufficient responses being received to produce a robust estimate, Table 3-2 does not
include loss percentages for marine and sugars/syrups during redistribution. The latter includes soft
drinks.
Table 3-2: Estimated FLW along the Chain (in Metric Tonnes - Millions)
*5% edible product left unharvested = avoidable/potentially edible FLW
In Table 3-2 above, avoidable FLW is identified by the orange cells.
The loss factors and subsequent calculation of estimated total FLW occurring along the food chain
are purposely conservative. Reasons for this include that the model views all foods and beverages
flowing through both processing and manufacturing. This is not the case particularly for fresh foods,
such as unprocessed fruits and vegetables, eggs and liquid milk. Despite this, as shown below in
Table 3-3, the total annual unavoidable (planned) and avoidable (unplanned/post-processing) FLW
estimated to occur along the Canadian food value chain is 35.54 million metric tonnes. This equates
to 58.1 percent of commodities entering the food system. Of total FLW, 11.17 million metric tonnes
is avoidable (unplanned/post-processing) and likely edible.
Food TypeUnplanned
Loss
Planned
Loss
Storage
/ Pack
loss
Planned
Loss
Unplanned
and post
processing
Loss
Planned
Loss
Unplanned
and post
processing
Loss
Loss WastePrep
waste
Plate
Waste
Prep
waste
Plate
Waste
Dairy and
Eggs0.00 0.00 0.14 0.00 0.00 0.46 0.52 0.08 0.16 0.53 0.48 0.35 0.31 3.03 7%
Field Crops 0.00 1.69 2.65 8.84 1.24 0.97 1.84 0.17 0.78 1.05 0.94 0.93 0.78 21.89 5%
Produce 0.66* 0.66 2.77 0.74 0.82 0.41 0.00 0.23 0.28 0.85 0.69 0.28 0.25 7.97 5%
Meat/
Poultry0.00 0.00 0.00 0.25 0.14 0.22 0.19 0.04 0.05 0.11 0.10 0.10 0.08 1.28 7.50%
Marine 0.00 0.04 0.00 0.05 0.04 0.00 0.00 0.03 0.04 0.07 0.06 0.01 0.01 0.34 N/A
Sugar/
Syrups0.00 0.01 0.01 0.01 0.01 0.01 0.01 0.01 0.01 0.15 0.12 0.00 0.00 0.36 N/A
Total 0.66 2.41 5.57 9.89 2.25 2.07 2.57 0.55 1.31 2.76 2.38 1.68 1.44 34.88
Grow/Produce Processing Manufacturing DistributionConsumer
(HH)HRI Total FLW
occurring
along the
food value
chain
Losses (%)
occurring
during Rescue
and
Redistribution
Retail

24
A summary of the total, unavoidable and avoidable FLW – by volume and as a percentage of inputs
that enter the Canadian food system, and across the six type of foods – is summarized in the
following table and pie charts. Table 3-3 presents an aggregated view of the entire system. The
study identified that, of the 61.12 million tonnes of commodities entering the Canadian food
system, 25.58 million tonnes (41.9%) is consumed. The remainder is lost or wasted, much of it
unnecessarily.
Table 3-3: Canadian Food System Overview: Inputs, Losses, Consumed (Volume and Percent)
Figures 3-1 and 3-2 below illustrate the considerable amount of loss estimated to occur during
primary production, processing and manufacturing. An estimated 71 percent of total FLW and 49
percent of avoidable, potentially edible FLW occurs at these stages of the food chain. While all of
loss occurring in primary production was considered to be unavoidable, an adjustment was made in
the calculation of avoidable/potentially edible FLW in fruits and vegetables. This correction was
made to account for produce left in the field, unharvested. The research identified that this is
where a considerable amount of potentially edible FLW occurs.
That the analysis estimates household FLW to be considerably less than that estimated to occur in
other countries (e.g. 43% of total FLW in the US23 and 47% of total FLW in the UK24) speaks to the
conservative nature of the estimates produced by our study.
22 Likely edible 23 ReFED (2018). 27 Solutions to Food Waste 24 WRAP (2015) Estimates of Food and Packaging Waste in the UK Grocery Retail and Hospitality Supply Chains
Million
Tonnes
Percent of
Food Inputs
Percent of
total FLW
Food System Inputs 61.12
Food Consumed 25.58 41.9
Total FLW 35.54 58.1
Avoidable FLW22 11.17 18.3 31.4
Unavoidable FLW 24.37 39.9 68.6

25
Figure 3-1: Tonnage (in Millions) and Percentage of Total Waste
Figure 3-2 Tonnage (in Millions) and Percentage of Unplanned, Post-Processing (Avoidable),
Potentially Edible FLW
26
Apportioning value to FLW was achieved using Statistics Canada data, which reported that retail
food sales for 2016 was $95.5 billion25 and food service receipts were $62.2 billion.26 The volume of
food at the point of purchase by consumers is estimated at 34.49 million tonnes. The analysis of
Statistics Canada and other sources of data established that approximately 65 percent of food is
sold through retail and 35 percent through HRI. Accounting for losses identified in the model, this
equates to 22 million tonnes sold through retail and 12.5 million tonnes purchased at HRI. Thus, we
calculated the average price per tonne of food at retail to be $4,351 and at HRI to be $4,967.
Underlining the conservative nature of estimates produced by our study, other research (e.g.
WRAP27) indicates that the differences in the value of food sold at retail versus that sold at HRI, and
therefore FLW, is considerably greater than that proposed above.
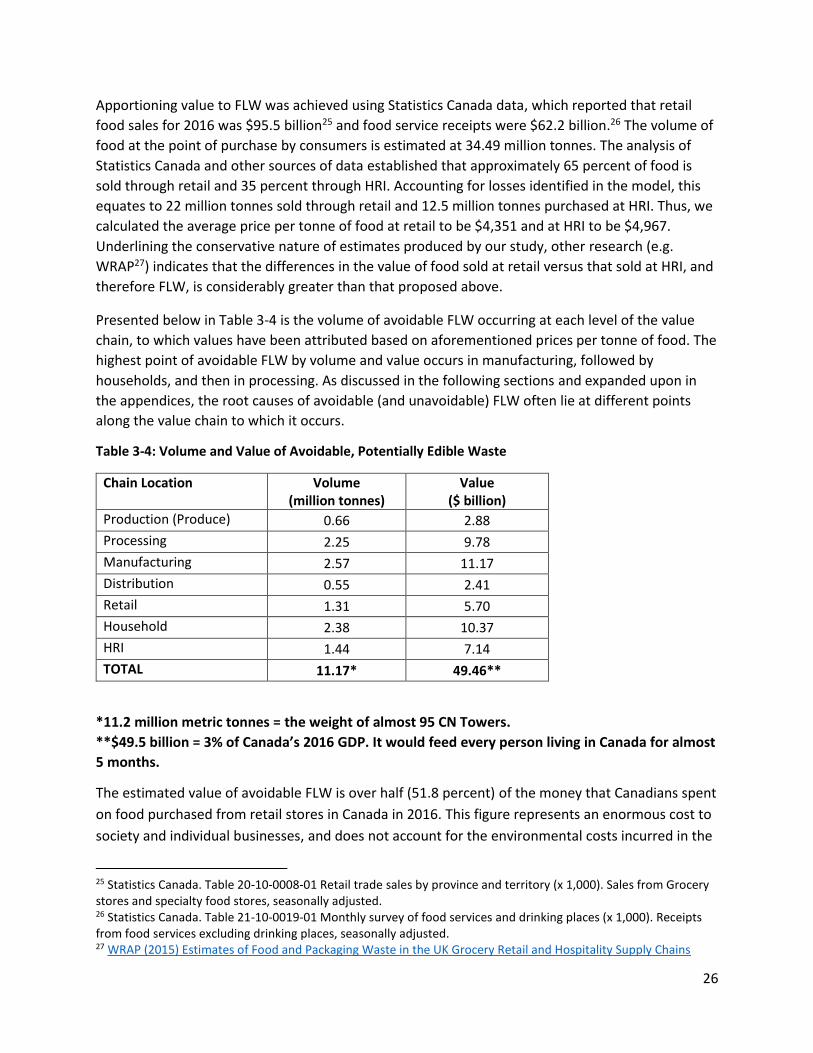
Presented below in Table 3-4 is the volume of avoidable FLW occurring at each level of the value
chain, to which values have been attributed based on aforementioned prices per tonne of food. The
highest point of avoidable FLW by volume and value occurs in manufacturing, followed by
households, and then in processing. As discussed in the following sections and expanded upon in
the appendices, the root causes of avoidable (and unavoidable) FLW often lie at different points
along the value chain to which it occurs.
Table 3-4: Volume and Value of Avoidable, Potentially Edible Waste
Chain Location Volume (million tonnes)
Value ($ billion)
Production (Produce) 0.66 2.88
Processing 2.25 9.78
Manufacturing 2.57 11.17
Distribution 0.55 2.41
Retail 1.31 5.70
Household 2.38 10.37
HRI 1.44 7.14
TOTAL 11.17* 49.46**
*11.2 million metric tonnes = the weight of almost 95 CN Towers.
**$49.5 billion = 3% of Canada’s 2016 GDP. It would feed every person living in Canada for almost
5 months.
The estimated value of avoidable FLW is over half (51.8 percent) of the money that Canadians spent
on food purchased from retail stores in Canada in 2016. This figure represents an enormous cost to
society and individual businesses, and does not account for the environmental costs incurred in the
25 Statistics Canada. Table 20-10-0008-01 Retail trade sales by province and territory (x 1,000). Sales from Grocery stores and specialty food stores, seasonally adjusted. 26 Statistics Canada. Table 21-10-0019-01 Monthly survey of food services and drinking places (x 1,000). Receipts from food services excluding drinking places, seasonally adjusted. 27 WRAP (2015) Estimates of Food and Packaging Waste in the UK Grocery Retail and Hospitality Supply Chains

27
production of food that is loss and wasted, the disposal of the FLW, and greenhouse gas (GHG)
emissions produced by the FLW.
3.2 Measurement and FLW Trends
While a direct correlation cannot be proven between the two opposing trends presented below in
Figure 3-3, the analysis identified that, generally speaking, the highest percentage of FLW occurs at
the same points along the value chain where FLW is least likely to be measured. The potential for a
correlation to exist between FLW and measurement practices is strengthened by the fact that waste
is higher and there is less likelihood to measure FLW in foodservice versus retail.
Figure 3-3: Measurement Practices vs. FLW Level Trends
3.3 Categorizing Respondents
It was clear from online survey responses and in-depth interviews that the respondents could be
categorized into four groups (see Figure 3-4 below). This thereby gave an indication as to the
reasons lying behind the level of FLW occurring along the chain and current measurement practices.
Feedback captured during the focus groups validated the existence of the same four groups across
the wider food industry.
28
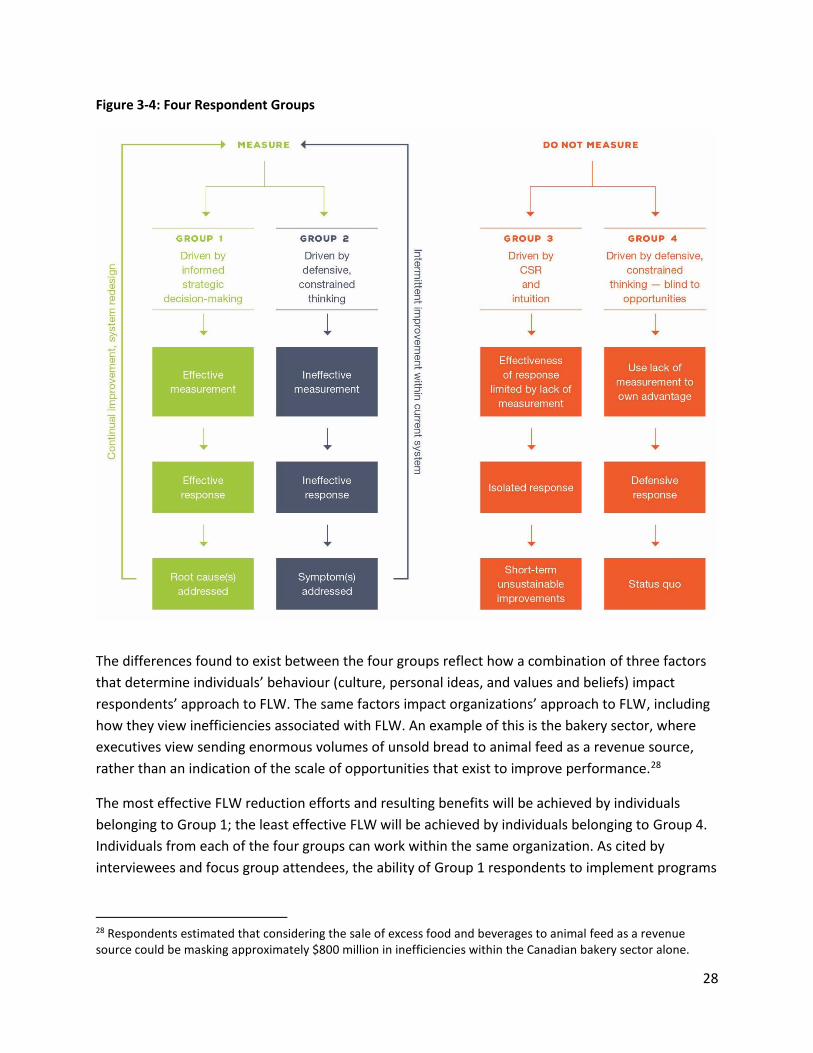
Figure 3-4: Four Respondent Groups
The differences found to exist between the four groups reflect how a combination of three factors
that determine individuals’ behaviour (culture, personal ideas, and values and beliefs) impact
respondents’ approach to FLW. The same factors impact organizations’ approach to FLW, including
how they view inefficiencies associated with FLW. An example of this is the bakery sector, where
executives view sending enormous volumes of unsold bread to animal feed as a revenue source,
rather than an indication of the scale of opportunities that exist to improve performance.28
The most effective FLW reduction efforts and resulting benefits will be achieved by individuals
belonging to Group 1; the least effective FLW will be achieved by individuals belonging to Group 4.
Individuals from each of the four groups can work within the same organization. As cited by
interviewees and focus group attendees, the ability of Group 1 respondents to implement programs
28 Respondents estimated that considering the sale of excess food and beverages to animal feed as a revenue source could be masking approximately $800 million in inefficiencies within the Canadian bakery sector alone.

29
that result in improved performance by reducing waste will typically be determined by their
seniority.
Numerous examples were given of senior executives belonging to Groups 2 or 4 who have
purposely prevented effective FLW programs from being implemented, by not making the
necessary changes to business operations to support FLW reduction efforts. In short, businesses’
approach to combating FLW and realizing the potential benefits starts (or falters) at the top.
3.4 Causes of FLW along the Value Chain
Respondents were asked to identify the primary cause of FLW occurring in their business. The
responses show that: 1) FLW that occurs in industry is commonly a symptom of inefficiency, and 2)
common causes for why FLW occurs in industry are identical to those that drive food waste in the
home. This is particularly so for avoidable (unplanned/post-processing) FLW.
Shown below in Figure 3-5 is an overview of responses from the entire value chain. The immediate
causes of FLW are listed in order of the frequency reported by respondents. All reasons are listed
despite some not pertaining to all parts of the chain (e.g. pest, disease and infection pertains only
to primary production; plate waste pertains only to HRI).
Figure 3-5 Immediate Causes of FLW in Industry
30
The most frequently cited immediate cause of FLW is date codes, followed by spoilage. These two
causes impacted all food types to some extent, except for sugar/syrups. Date code was reported
the most for meat/poultry; this category accounts for 46 percent of responses. Spoilage was
reported the most for produce; this category accounts for 80 percent of responses. That FLW in
produce is due to the widest variety of causes points to this being a food category where
considerable opportunities exist to reduce losses and waste. Pests, diseases and infections are
prominent causes of FLW: in meat and poultry due to mortality rates, and in produce by impacting
appearance/size/etc. These farm-level losses for meat are not included in the FLW model and
estimates presented earlier in Section 3.1. The starting point for meat and poultry entering the
chain is post slaughter. The starting point for marine foods entering the chain is post evisceration.
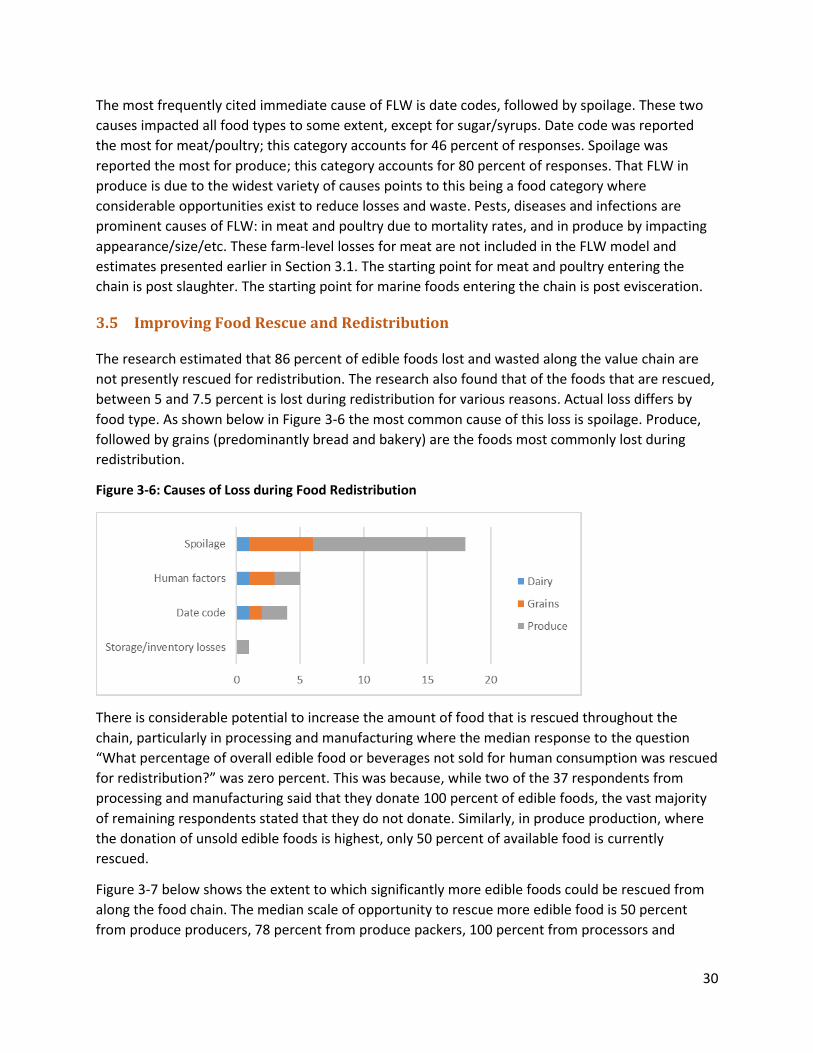
3.5 Improving Food Rescue and Redistribution
The research estimated that 86 percent of edible foods lost and wasted along the value chain are
not presently rescued for redistribution. The research also found that of the foods that are rescued,
between 5 and 7.5 percent is lost during redistribution for various reasons. Actual loss differs by
food type. As shown below in Figure 3-6 the most common cause of this loss is spoilage. Produce,
followed by grains (predominantly bread and bakery) are the foods most commonly lost during
redistribution.
Figure 3-6: Causes of Loss during Food Redistribution
There is considerable potential to increase the amount of food that is rescued throughout the
chain, particularly in processing and manufacturing where the median response to the question
“What percentage of overall edible food or beverages not sold for human consumption was rescued
for redistribution?” was zero percent. This was because, while two of the 37 respondents from
processing and manufacturing said that they donate 100 percent of edible foods, the vast majority
of remaining respondents stated that they do not donate. Similarly, in produce production, where
the donation of unsold edible foods is highest, only 50 percent of available food is currently
rescued.
Figure 3-7 below shows the extent to which significantly more edible foods could be rescued from
along the food chain. The median scale of opportunity to rescue more edible food is 50 percent
from produce producers, 78 percent from produce packers, 100 percent from processors and

31
manufacturers, 90 percent from distributors, 81 percent from retailers, and 98 percent from HRIs.
The number of respondents who provided data at each link in the chain, on which the above
estimates are based, is also shown.
Figure 3-7: Median Percentage of Unsold Edible Food and Beverages Not Rescued
Respondents cited that meat and protein constitute some of the greatest opportunities to rescue a
higher percentage of edible food from being lost and wasted. Why perishable products, such as
produce and bread, are not rescued is partly a result of volume and the ineffectiveness of
redistribution systems. In the words of respondents from community food programs: “We do not
have the ability to share the abundance of produce that occurs here with other areas,” and “We
don’t need any more bread.”
All respondents (those from industry, along with those involved in food rescue and community food
programs) were asked to identify ways to improve the rescue and distribution of foods and
beverages. The results produced from having analyzed the 175 responses on this topic are
presented below in Figure 3-8.

32
Figure 3-8: Ways to Improve Food Rescue and Redistribution
As seen in the above bar chart, respondents believe that the greatest opportunities lie in improving
value chain communication and coordination. This includes, for example, retailers providing greater
clarity to stores about forecasted deliveries that stores could, in turn, use to improve their rescue
and donation practices. Respondents also cited that considerable opportunity exists to improve the
communication and coordination of redistribution systems, resulting in improved performance and
more effective use of existing infrastructure.
3.6 FLW Destinations
Reflecting the FLWARS framework presented in Section 2.1, respondents were asked to indicate
where (in addition to food rescue) their operations directed edible food and inedible FLW.
Respondents were able to indicate more than one destination. Shown below in Figure 3-9 are the
destinations cited by respondents. Each bar shows how often (out of 100%) a destination was cited
by respondents located at each link in the value chain, and the number of responses contained
within each bar. For example, the number of responses received from retail and HRI was 187 and
57, respectively.
33
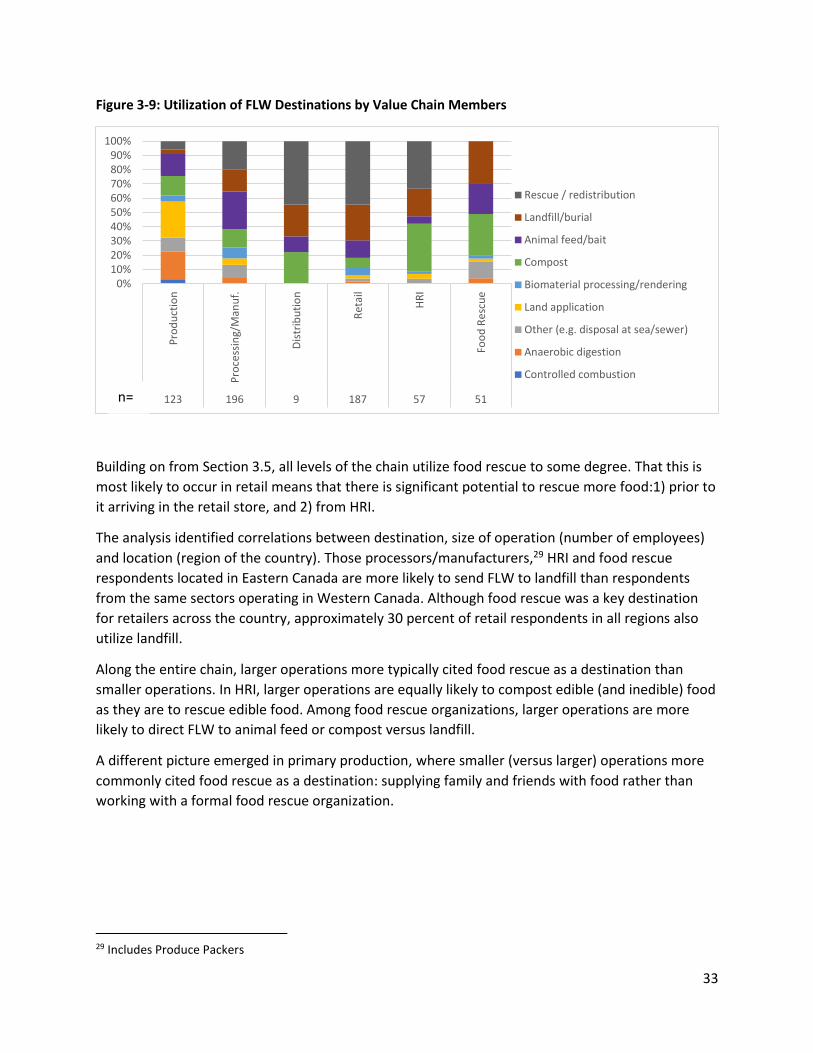
Figure 3-9: Utilization of FLW Destinations by Value Chain Members
Building on from Section 3.5, all levels of the chain utilize food rescue to some degree. That this is
most likely to occur in retail means that there is significant potential to rescue more food:1) prior to
it arriving in the retail store, and 2) from HRI.
The analysis identified correlations between destination, size of operation (number of employees)
and location (region of the country). Those processors/manufacturers,29 HRI and food rescue
respondents located in Eastern Canada are more likely to send FLW to landfill than respondents
from the same sectors operating in Western Canada. Although food rescue was a key destination
for retailers across the country, approximately 30 percent of retail respondents in all regions also
utilize landfill.
Along the entire chain, larger operations more typically cited food rescue as a destination than
smaller operations. In HRI, larger operations are equally likely to compost edible (and inedible) food
as they are to rescue edible food. Among food rescue organizations, larger operations are more
likely to direct FLW to animal feed or compost versus landfill.
A different picture emerged in primary production, where smaller (versus larger) operations more
commonly cited food rescue as a destination: supplying family and friends with food rather than
working with a formal food rescue organization.
29 Includes Produce Packers
0%10%20%30%40%50%60%70%80%90%
100%
Pro
du
ctio
n
Pro
cess
ing/
Man
uf.
Dis
trib
uti
on
Ret
ail
HR
I
Foo
d R
escu
e
123 196 9 187 57 51
Rescue / redistribution
Landfill/burial
Animal feed/bait
Compost
Biomaterial processing/rendering
Land application
Other (e.g. disposal at sea/sewer)
Anaerobic digestion
Controlled combustion
n=

34
3.7 Differentiating Avoidable and Unavoidable/Edible and Inedible
The analysis identified shortcomings and limitations with the present binary categorization of FLW
as 1) avoidable versus unavoidable, and 2) edible versus inedible. A binary approach does not allow
for the nuances that exist in today’s complex food industry or the cultural differences that
determine food choice. For example, some consumers and entire cultures will eat broccoli stalks,
shrimp shells and fish/animal skin.
The recommendation presented below in Table 3-5 includes examples to illustrate how limitations
associated with the current binary system can be addressed in future research through the
utilization of a 3 by 3 matrix.
Table 3-5: Three by Three Matrix for Categorizing FLW
Prime condition Useable Inedible
Avoidable
Unharvested fruit and vegetables
Food not donated due to vendor agreement
Vegetable stalks (e.g. broccoli)
Products thrown away early due to conservative best before date
Product falling onto floor from conveyors or bags splitting that could be made edible through processing into new product
Fruit left to spoil
Crops incorrectly stored
Theoretically avoidable
Undersized crop left in field
Edible fish species caught in by-catch, though not kept, as currently not marketed
Lobster shells disposed of at sea or buried instead of processed into food ingredient
Foods served though not eaten due to portion serving size
Regulatory impact on amount of carcass condemned due to, for example, abscess or other isolated issue
Inventory that spoils due to poor FIFO30
Unavoidable Husks, bran and germ lost
during milling process Orange peel Animal bones disposed of
during HRI and at-home preparation of food
The matrix proposed above reflects that food which is inedible in its present form can be made
edible through manufacturing into a new product. New processes for transforming inedible food
into edible foods or ingredients are rapidly emerging. The importance of the new approach is
underlined by the research having identified that, while some FLW is clearly unavoidable,
categorizing FLW as unavoidable when it could theoretically be avoidable negatively impacts the
motivation for individuals to change their behaviour.
30 FIFO is “first in first out” and simply means food needs to be labeled with the dates they are stored, and older foods need to be put in front or on top so that they are selected first.

35
3.8 Environmental Impact
To indicate the environmental impact of FLW detailed in Section 3.1, a whole of chain CO2
equivalent model produced for Second Harvest by VCMI and life cycle31 assessments produced by
FAO32 were used to calculate the carbon footprint (GHG emissions measured in CO2 equivalent) and
the blue water footprint (consumption of surface and ground water resources).
3.8.1 Carbon CO2
Using published estimates and publicly available data, we established an entire chain estimate of
CO2e. Production, processing and manufacturing estimates came from published LCA33 literature.
Emissions from transportation between chain links were determined based on published truck
emissions and estimated distances of transportation for each food category. As described in
Appendix C, energy consumption at retail, HRI DCs, HRI, and households was extrapolated from
company reports and Canadian statistics. A calculator model was constructed for each food type,
therefore we could estimate the CO2e associated with FLW occurring in that chain. The total CO2e
for all six food types provided the overall FLW CO2e footprint. Using the loss factors of potentially
avoidable FLW from the FLW model, an estimate of potentially avoidable CO2e was derived.
Table 3-6: CO2 Equivalent of Total, Avoidable and Unavoidable FLW (Million Tonnes)
CO2 equivalent
(Million tonnes) Percentage of total CO2
equivalent footprint
Food System Inputs 99.7 100
Food Consumed 43.2 43.3 Total FLW 56.5 56.6
Potentially avoidable FLW34 22.2 22.3
Likely unavoidable FLW 34.3 34.4
As shown in the above table, FLW accounts for close to 60 percent of the food industry’s CO2
equivalent footprint. Just over one fifth of this enormous footprint is entirely unnecessary.
31 “Including agricultural production, post-harvest handling and storage, food processing, distribution, consumption and end-of-life (i.e. disposal).” (FAO 2013:10) 32 FAO (2013). Food Wastage Footprint; Impacts on Natural Resources 33 Life Cycle Assessment: Majority of LCAs only consider the GHG emissions from the production phase of the food supply chain (FSC), as this is where majority of emissions are accumulated in a product (Porter et al. 2016). 34 Likely edible

36
3.8.2 Surface and Ground Water
Similarly, FAO estimated that FLW in the NAO region consumes 16.26km3 of surface and ground
water resources. This means that every tonne of FLW occurring in Canada equates to 128 tonnes of
wasted surface and ground water. The majority (92%) of the food industry’s water footprint occurs
on farm during primary production.35
Based on FAO’s estimate, Table 3-7 below shows that the blue water footprint of total FLW,
avoidable FLW and unavoidable FLW equates to 4.5, 1.4, and 3.1 billion tonnes, respectively. Also
shown are the blue water footprints of total food entering the food system and food consumed.
Table 3-7: Blue Water Footprint of Total, Avoidable and Unavoidable FLW (Billion Tonnes)
Million tonnes
Water footprint
(Billion tonnes) Percentage of total
water footprint
Food System Inputs 61.12 7.8 100
Food Consumed 25.58 3.3 42.3
Total FLW 35.54 4.5 57.7
Avoidable FLW36 11.17 1.4 17.9
Unavoidable FLW 24.37 3.1 39.7
As shown in the above table, similar to the food industry’s CO2 equivalent, FLW accounts for close to
60 percent of the food industry’s blue water footprint; and a large part of this enormous footprint is
entirely unnecessary.
Most telling, therefore, is that the environmental footprint of food consumed – measured in
terms of CO2 equivalent and blue water – is smaller than the environmental footprint of loss and
waste that occurs along the food chain. This raises the question of whether the current food
industry is environmentally sustainable.
35 Hoekstra & Mekonnen (2012). The Water Footprint of Humanity 36 Likely edible

37
4 Root Causes
The systemic inefficiencies described in the previous section result from misalignments occurring
between the three subsystems that determine how individual businesses and the wider food
industry operate: 1) Product and Technology, 2) Information and Communication, and 3)
Governance.
The detailed analysis of data gathered from the online surveys, in-depth interviews, focus groups,
as well as multiple informal discussions with industry stakeholders and process team meetings,
enabled the root causes of these systemic misalignments to be quantified. The root causes of these
systemic misalignments are presented from the perspectives of:
1. Whole of chain
2. Primary production
3. Processing and manufacturing
4. Retail
5. Hotel, restaurant and institutions (HRI)
6. Redistribution
Each of the root causes and their implication for driving unnecessary levels of avoidable
(unplanned/post-processing) and unavoidable (planned) FLW at each link of the chain are discussed
in greater detail in Appendix A.
4.1 Culture of Accepting FLW
Presented below in Figure 4-1 is a graphical representation of how the interactions that occur
between the three subsystems analyzed during the study (1. Product and Technology,
2. Information and Communication, and 3. Governance) influence the levels of avoidable and
unavoidable FLW occurring throughout the Canadian food system. The same interactions influence
individuals’ motivation to change. Unless a sufficient number of individuals – particularly those in
authority – are willing to purposely change their behaviour and motivate others to do so also,
industry wide change will not occur.

38
Figure 4-1: Vicious Cycle Driving FLW
The cycle reflects the fact that the overarching driver of FLW in Canada is a cultural acceptance of
waste. This culture ultimately emanates from the true costs of waste not being internalized by
industry. This, in turn, affects consumers’ attitudes and behaviour.
Industry’s culture of accepting FLW (particularly that which occurs in the home) extends to some
businesses and organizations viewing FLW as a benefit to industry, because it drives increased sales.
Evidence was found of some government representatives possessing similar sentiments.

39
4.2 Industry
The six root causes of what has become a general culture of accepting FLW are listed and described
below. These root causes lead to unnecessary waste by preventing FLW being addressed at source,
or by preventing the redistribution of excess foods and beverages that are edible.
1. Business owners’/employees’ acceptance of waste
2. Adversarial, distrusting relationships
3. Purposely conservative date codes
4. Ineffective FLW measurement, reporting and mitigation
5. Maximizing production capacity and throughput
6. Perceived risk associated with food donation
Each of the six causes are described in sections 4.2.1 to 4.2.6. While respondents cited and
applauded some industry leaders on multiple occasions for best practice, the extent to which these
leaders are able to implement practices that further reduce current levels of FLW is hampered by
the macroeconomic environment within which the Canadian food industry and its international
stakeholders operate.
4.2.1 Business Owners’/Employees’ Acceptance of Waste
Respondents provided numerous examples of where a “so long as the numbers are met, we do not
need to change” attitude exists in businesses operating along the entire value chain. This attitude
exists in situations where the potential financial benefits run to tens of millions of dollars annually,
and investment amortization can be counted in weeks. The practice of senior management setting
“numbers” that include current levels of FLW lessens the motivation to change.
4.2.2 Adversarial, Distrusting Relationships
Multiple respondents stated that ineffective forecasting, planning and replenishment can be more
prevalent among businesses serving the retail sector versus foodservice. The causes of this partly lie
in the adversarial relationships and distrust that typify the general grocery industry. This leads to an
unwillingness to share data, plan and execute collaboratively. This dynamic occurs within and
between businesses, leading to many root causes of avoidable FLW occurring at the interface
between different functions (e.g. procurement and operations) and business partners.
The extent to which the food industry uses promotions to drive sales can exacerbate the negative
impacts of ineffective forecasting and replenishment. It also exacerbates household FLW.
Linked to ineffective forecasts are overproduction and excess inventory. A fear of being penalized
by their customer(s) if demand exceeds forecasts, or if 100 percent on-shelf availability is not met,
drives suppliers to ensure product availability at short notice. Financial penalties are viewed by
some as a source of revenue, which perpetuates this cycle of overproduction and excess inventory.

40
4.2.3 Purposely Conservative Date Codes
In the words of an interviewed retail executive: “In date coding we have created a monster.”
Multiple examples were provided of businesses purposely setting overly conservative best before
dates as a means to drive sales. This results in unnecessary FLW, not least because the same
businesses may not be prepared to donate food that is close to or slightly past its best before date
for redistribution.
Respondents also cited that some foods and beverages carry a best before date unnecessarily. This
was in reference to 1) products that do not need to carry a best before date, because they have
more than two years’ shelf-life; and 2) products where only minor eating quality or nutrient value,
not safety, would be affected.
4.2.4 Ineffective FLW Measurement, Reporting and Mitigation
Reasons pertaining to the ineffective measurement, reporting and mitigation of FLW often revolve
around businesses not internalizing the true cost of FLW. It is undervalued: accounting practices do
not recognize hidden costs (e.g., labour, energy, transport, invested capital, etc.). The cost of FLW is
typically recorded as disposal cost. Other costs are not factored into the analysis, resulting in
neither the culture of accepting FLW nor the impact of misaligned incentives being challenged
corporately.
Reasons why the true cost of FLW is not factored into financial analysis include the fact that food
waste is not segregated from other wastes, or identified by stock keeping unit (SKU). Instead, the
tracking of food waste occurs in the form of aggregated tonnes, typically provided by a third-party
contractor. Businesses’ strategic and operational decisions are based on more granular reports
regarding SKUs and category value. Connecting the two metrics takes determination and
investment, particularly when the bespoke software required to achieve this on a mass scale may
not exist.
In addition, few businesses have senior executives tasked with reducing FLW across their entire
operations. This results in the continuation of misaligned business functions and incentives (within
and between businesses), and helps perpetuate the existence of the aforementioned adversarial
distrusting relationships, all of which are key drivers of avoidable FLW.
4.2.5 Maximizing Production Capacity and Throughput
Much of the food system operates from a produce, batch and queue standpoint. Businesses
operate at (or close to) maximum capacity in order to 1) minimize per unit fixed costs, 2) respond to
inaccurate forecasts and dysfunctional replenishment systems, and 3) maximize return on capital
employed (ROCE). This invariably creates avoidable waste and unnecessary costs. It also ties up
enormous amounts of capital.
41
The alternative approach is known as “lean.” The basis of lean is matching capacity to customer and
consumer demand, and reducing cycle time. As occurs in the automotive or other industries,
collaboration does not mean an end to competitive supplier/buyer relationships; it means
channeling resources into constructive dialogue and continual improvement programs.
4.2.6 Reluctance and/or Resistance to Donate Safe Edible Food
The research estimated that 86 percent of excess edible food is not donated and redistributed. By
definition, some foods are easier to donate and flow through redistribution systems than others.
Regardless of food type, there is a reluctance – even resistance – among some businesses to donate
edible foods to redistribution agencies.
The research found that reluctance is typically due to a handful of causes:
1) The comparative (real or opportunity) cost of donation versus alternative management
options;
2) The complexity (real or perceived) of donation versus alternative management options;
3) Lack of infrastructure and/or ineffective communication between potential donors and
recipient agencies, or logistical capacity – including transport, storage and cool chain;
4) Concern that donation will cause customers to react negatively, questioning the vendor as
to why the product was not offered to them first at a discount;
5) Concern that brand value is undermined, potentially even destroyed – these concerns are
heightened when best before dates come into the mix; and
6) Legal liability. Each province and territory has a Good Samaritan Act, though there is no
standardization between the acts. There is also a general lack of awareness that these acts
exist and the protection that they provide.
Resistance to donate also stems from the above reasons, plus an important caveat:
1) Vendor supply agreements. Vendor agreements can include a clause stating that excess
products must be destroyed, and therefore cannot be donated.
4.3 Redistribution by Community Food Programs
Food rescuers and community food programs play a crucial role in society. The root causes of
inefficiencies that result in avoidable FLW identified as existing in food rescue, redistribution, and
within the community food programs that they supply, are identical to a number of those found to
occur in the food industry and the markets that they serve.
These root causes, along with the necessity to rely on volunteers and the organizational cultures
that can stem from this, can impact the degree to which innovative leaders in the food industry and
community food programs are able to motivate and enable the adoption of sustainable best
practices.

42
4.3.1 Strategic
While there is advocacy for food rescuers and community food programs operating within and
across regions, there is little strategic oversight. This, combined with siloed and sometimes
polarized relationships between organizations and stakeholders at the national,
provincial/territorial and municipal level, leads to ineffective communication and ineffective
execution. This in turn results in existing infrastructure and capabilities not being used to their full
potential.
Limited strategic oversight and coordination acts as a barrier to securing the financial investment
required to address gaps in current infrastructure (e.g. lack of refrigerated storage and transport
capacity). Respondents from industry and community food programs indicated that this gap is the
largest single barrier to increasing the rescuing and redistribution of food. While infrastructure gaps
are particularly acute in rural and semi-urban areas, they can occur anywhere, hence the need for
increased collaboration and strategic oversight.
4.3.2 Operational
The strategic weaknesses described above factor into the lack of standardized communication and
processes implemented by food rescuers and community food programs. Respondents said this
constituted the greatest overall cause negatively impacting the performance of the current system.
It manifests itself as poor communication with donors, ineffective forecasting and distribution, lack
of trained, knowledgeable, professional standard staff/volunteers, and consequently the sub-
optimized operation of existing infrastructure. The opportunity for improvement is illustrated by
numerous food industry respondents making statements similar to: “If more foodbanks operated
like (name withheld for reasons of confidentiality), we could and would donate more.”
Operational performance is also negatively impacted by some rescuers and community food
programs exhibiting a culture of primarily viewing themselves as providers of societal good versus
part of an interconnected system for redistributing food to address hunger relief. This impacts the
staff that they recruit, as well as how staff and volunteers are trained and incentivized. In the words
of respondents from local community food programs that rely on regional community food
programs to meet clients’ demands: “It’s unlikely that someone with a degree in psychology knows
much about food logistics, though that’s the type of person that they tend to hire,” and “We don’t
know what we are going to receive, so [we] source what we can locally, then have excess that goes
to waste, due to doubling up.”
Standardized, well communicated processes would aid rescuers and community food programs to
address the issue of donors expecting them to accept everything, regardless of its suitability for
redistribution.

43
4.4 Consumers
Primary consumer research was beyond the scope of this study. Therefore, any reference to the
root causes of consumer FLW is limited to that provided by respondents in the online surveys,
during the in-depth interviews, or during the focus groups.
The research estimated that 21 percent of avoidable FLW occurs amongst consumers. Consumer
driven waste also occurs in HRI. Evidence provided by respondents, along with research conducted
previously and simultaneous to this project, suggest that, like industry, consumers exhibit a culture
of accepting waste.
Respondents identified five consumer reactions that cause increases in the FLW occurring in
industry, in HRI and within the home. The same reactions occur amongst the clients of community
food programs. These are:
1. Part-filled shelves
2. Best before dates
3. Product aesthetics (looks)
4. Packaging of products
5. Menu design
That the first four factors are said to have less impact on consumer behaviours when purchasing
online versus in a retail store could explain why, anecdotally, respondents identified that they had
experienced markedly less FLW occurring a) in the households of those that have transitioned to E-
tailing, and b) along value chains supplying (and within) E-tailing operations versus retailers and the
value chains through which they source goods.
4.4.1 Part-filled Shelves
Multiple respondents provided evidence that consumers’ purchasing of a product typically slows
when shelves are only part-filled or nearing empty. Keeping shelves full to prevent a slowdown in
consumer purchases and/or dissatisfaction being voiced by consumers leads to overproduction. It
also leads to increased waste at the retail store. In community food programs, how shelves are
stocked drives changes in client behaviour and has the potential to create avoidable FLW.
4.4.2 Best before Dates
Considerable evidence was presented on the impact that products reaching or close to their best
before dates have on consumers’ purchasing decisions. Consumers typically interpret “best before”
to mean “bad after.” As the research identified, this can lead processors and manufacturers to use
overly conservative best before dates as a mechanism to drive increased sales. Clients of
community food programs will shun foods that are close to or have reached their best before dates,
even when offered at no cost.

44
4.4.3 Product Aesthetics (Appearance)
According to respondents, consumers do not buy imperfect looking products, specifically imperfect
fruits and vegetables. An Ontario community food program was amongst those who described how
some of their clients will not accept misshapen vegetables, such as carrots, even when offered at no
cost. In hunger relief agencies, commonly the only means of ensuring imperfect fruits and
vegetables are not wasted is by using them in the preparation of cooked foods.
4.4.4 Packaging of Products
Product shelf life can be extended – often significantly – by packaging it, or changing the design of
the materials in which products are packaged. However, numerous respondents stated that
Canadian consumers have proven to be adverse to products, particularly fresh products, being
packaged. This has negatively impacted the Canadian food industry’s willingness to utilize packaging
to its full potential, resulting in Canada being approximately a decade behind Europe in utilizing
packaging as a means to reducing FLW by extending shelf life.
4.4.5 Menu Design
Respondents identified a direct correlation between menu design and plate waste in HRI. In some
circumstances, the level of FLW caused by menu design, such as the inclusion of items often not
eaten by their customers, is greater than that attributed to portion size.
The packing of standardized boxes by community food programs, regardless of clients’ personal
preferences and dislikes, and their circumstances – including access to refrigerators, freezers and
cooking equipment/utensils – drives avoidable waste.
4.5 Waste Management Practices and Options
Businesses’ waste management decisions for both excess edible food and beverages, as well as
inedible FLW, is predicated on a number of factors. The research identified a handful of root causes
that lie behind businesses’ waste decisions.
1) Sending to landfill is easy. Sending to reuse or recycling requires food to be separated from
other waste and a change in business practices. This requires the investment of resources in
processes, procedures, and potentially the modification of infrastructure, including
buildings.
2) Landfill/tipping fees. Low landfill/tipping fees can make any other management option for
edible and inedible food financially unviable. This is particularly the case where the
population density is low and thus the economies of scale required to establish and operate
the traditional infrastructure to produce bioenergy, for example, are unviable. In such cases,
excess food and beverages invariably continue to be sent to landfill.
3) Resistance from established waste management companies. Waste management is big
business and profitable, partly because organic waste is heavy and therefore expensive to

45
transport. Examples were given of waste management companies using the comparative
expense of reuse or recycling versus sending to landfill as a reason why businesses should
not change their waste management practices.
4) Green bin/composting programs. Respondents involved in produce packing, food
processing, food and beverage manufacturing, distribution, retail, and foodservice stated
that a lack of access to green bin and composting programs prevents them from more
responsibly managing waste streams. While many of these respondents were located in
Western Canada, the same situation exists in much of the country. Population density does
not appear to be the determining factor of whether green bin and composting programs
exist in a particular municipality.
5) Current macroeconomics that drive capital investment and business management decisions
do not support investing in the processes and infrastructure required to cost-effectively
divert more FLW from landfill. The same macroeconomic factors limit the funding provided
to those seeking to develop innovative reuse or recycling solutions. This perpetuates the
current situation.
4.6 Government Policies, Regulations and Legislation
An audit of federal, provincial, territorial, and municipal policies regarding their impact on the
creation of avoidable and unavoidable waste was not the purpose of the project. That said, multiple
respondents provided evidence of the influence that policies, legislation and regulation enacted by
all three levels of government37 can have upon driving avoidable FLW.
Evidence provided by respondents strengthened VCMI’s previous (2016) assessment of the present
situation: “No ministry or level of government has ultimate responsibility or is accountable for food
loss and waste. This leaves industry in the unenviable position of having to grapple with an
environment shaped by misaligned policies, legislation/regulations and systems.”
The study categorized the root causes related to the impact of policies, legislation and regulations
on driving decisions that lead to unnecessarily high levels of avoidable and unavoidable FLW into
three groups:
1. Policies that lead to industry and consumers not internalizing the true cost of FLW;
2. Unintended consequences of policies, regulations and legislation; and
3. A belief that reducing FLW will negatively impact farmers’ and businesses’ viability.
37 The British North America Act (BNAA) Sections 92, 93 and 95 determined the structure of Canadian governmental processes (federal, provincial/territorial, municipal), and, in turn, led to the creation of overlaps and conflicts being built into the Canadian food policy and regulatory system. This leads to the creation of incongruences that impact commercial decisions and lead to the creation of unnecessary FLW.

46
4.6.1 Policies that lead to industry and consumers not internalizing the true cost of FLW
The combined effect of the root causes listed above includes that the true costs of FLW are not
internalized by businesses and consumers. Not internalizing the true costs of FLW can lead, for
example, to businesses choosing to send FLW to landfill rather than recycling. It can also lead to
consumers apportioning less value and care to the foods and beverages that they choose to
purchase.
Why the true costs of food production and management are not internalized by businesses and
consumers include:
1) No national policies, regulations and legislation regarding landfill regulations and tipping
fees. An example of a lack of consistency, just at the municipal level, includes that the
organic tipping fees of neighbouring municipalities can differ by hundreds of dollars per
tonne. That provincial/territorial jurisdictions jointly govern landfill regulations and waste
management infrastructure means that achieving change can take years and rests on the
lowest common denominator.
2) No standardized policies, regulations and legislation pertaining to emissions created during
the production, processing and disposal of food. For example, reducing emissions below
targets agreed with a ministry can create challenges that are similar to those if businesses
exceed targets. The existence of differing legislation across provinces, along with inspectors
differing in how they interpret legislation, directly and negatively impacts businesses’
motivation and ability to reduce emissions through investment in continual improvement
programs.
3) No link existing between landfill regulations and tipping fees to investment of public funds
in the knowledge, skills and infrastructure required to reduce FLW through prevention,
redistribution, recycling and reuse. Reasons why revenues produced by landfill fees are not
reinvested in innovation, infrastructure and training include that it would require
collaboration between different levels of government and different government
departments.
4.6.2 Unintended consequences of policies, regulations and legislation
While the unintended consequences of policies, regulations and legislation on the creation of FLW
might not be understood, and therefore not factored into their design and implementation, below
are the most common examples cited by respondents.
Marine catch licenses and quotas
Wild catch fishing is the final bastion of hunter gathering in the mainstream food industry. Fishers
do not know how many, what type, and what quality/value of fish or marine creature they will
catch until it is in the net or on the line. These and other considerations are often not factored into

47
the development, implementation and enforcement of quotas or other marine legislation, resulting
in significant unnecessary FLW. Examples of such situations include:
1) Legislation can prevent fishers from landing some species unless they have a minimum of
catch, or landing some species at all. Stocking programs lead to artificial imbalances in
species, and fishers purposefully discarding a sizeable percentage of their catch because it is
not their target fish. In all such cases, discarded fish are typically dead or injured.
2) Limiting the timing of when marine species can be caught in a given area, though not the
volume that can be landed, and explicitly linking neither to market demand, health or
quality can create enormous fluctuations in volume and losses. This is most impactful where
seafood is transported live.
Temporary and seasonal workers
The farming and food processing sector has been negatively impacted by changes to the seasonal
and temporary worker regulations. In agriculture and horticulture, too few workers lead to on-farm
losses, due to the inability to harvest crops at peak quality – if at all. Examples provided include:
1) In the wine industry, workforce shortages lead to the inability to correctly manage the vine,
resulting in a heightened risk of pests and diseases. Consequently, the quality of the grapes
is potentially reduced, and subsequently the wine.
2) In the grains industry, workforce shortages lead to harvesting equipment not being fully
utilized. Delay in harvesting leads to crops being downgraded in quality and price, resulting
in crops grown for food being downgraded to animal feed or another non-food use. It also
leads to some crops not being harvested at all.
3) In the fruit industry, workforce shortages lead to crops being harvest past their prime,
resulting in higher percentage of culls and higher than usual losses in storage. It also leads
to crops being left unharvested.
Labelling
Two of the examples provided by respondents regarding the impact of labelling regulations on
driving unnecessary FLW are:
1) Foods imported into Canada can run into issues if the label does not meet Canada’s legal
requirements. Not meeting these requirements results in foods not being able to be sold or
donated, even if the issue does not pertain to food safety. With no other option available,
the foods are sent to landfill.
2) Best before. For food safety reasons – for example, the prevention of Listeria
monocytogenes in ready to eat (RTE) products – clear guidelines exist for the use of best
before dates on some products. If not scientifically tested, the best before dates on many
low acid RTE foods only allow a maximum of five days’ shelf life. This can lead to edible
48
products being disposed of prematurely, particularly those supplied by smaller suppliers
who do not have the financial resources required to complete scientific shelf life studies.
The guidelines for determining industry’s use of best before dates across other food types
are, however, less defined. This leaves the potential for the best before date system to be
abused.
Food Rescue in Public Health Institutions
Public health institutions commonly follow a “when in doubt, throw it out” philosophy towards food
that could potentially be donated. The lack of clear and robust guidance surrounding the
management of excess safe-to-eat foods leads to current rules mandated by provincial and
municipal governments being interpreted and acted upon differently, and potentially edible foods
going to landfill. There are no consistent public health regulations across Canada. Regulations differ
even within the same province, as it is up to municipalities to execute them, resulting in confusion
amongst provincial or national food businesses on when and how they can donate excess product.
Similarly, the system is confusing for food rescue organizations to navigate and to assure food
donors of the correct process.
Crop Insurance
Providers of crop insurance are typically Crown corporations. Weather or other growing factors can
create quality and size issues that prevent a farmer from selling their crops to the commercial
market. To protect themselves financially in the event of such an occurrence, farmers insure their
crops. Many crop insurance claims do not relate to a food safety hazard. Hail-damaged apples, for
instance, look less appealing visually though are still edible and their interior quality likely
unaffected. The claiming of crop insurance can prevent a farmer donating a crop to hunger relief
efforts, resulting in nutritious foods unnecessarily going to waste.
Crop and Livestock Protection
An effective crop and livestock protection regulatory system is critical to maximizing on-farm
productivity and minimizing incidences of meat being condemned. A relationship exists between
the regulation of pesticides and fungicides used in crop production and livestock production
pharmaceuticals and avoidable FLW on the farm and along the value chain. Throughout the
research numerous respondents from all sectors of the food industry cited examples of how the
current Canadian regulatory system can lead to unnecessary losses and waste. For example, not
having access to pharmaceuticals, which are widely used during animal production in other
countries, leads to preventable parasitic infestations and the condemnation of meat during
processing; and not having access to fungicides used in fruit production leads to unsaleable apples,
due to this negatively impacting crops’ quality, storability, shelf life, and appearance. In addition to
avoidable production-related losses, having limited control over known situations can lead farmers
to overproduce for fear of shorting customers.

49
4.6.3 A belief that reducing FLW will negatively impact farmers’ and businesses’ viability
Some government representatives (and industry organizations) believe that reducing FLW would
negatively impact the economic viability of the Canadian food industry, particularly farmers. This
can lead to the reduction in FLW not being supported by government/industry individuals and
potentially departments/agencies.
This line of thinking stems from a belief that a) reducing FLW will impact the equilibrium between
supply and demand, leading to a reduction in commodity prices; and b) reducing FLW will
automatically lead to reductions in what farmers can produce. Therefore, reducing FLW will impact
farmers’ margins and profitability and, by definition, the sales and profitability of those production
inputs.
The argument presented above reflects the concept of scarcity, not the concept of abundance.38
The concept of scarcity reflects a belief that a) the market will pay producers for mediocre quality
products that subsequently go to waste further along the chain; b) reducing costs and improving
resource utilization will not positively impact the food system; c) any unused capacity cannot be
used by farmers and other businesses to access latent demand in markets not currently supplied;
and d) the mechanisms that determine Canadian commodity prices are entirely domestically driven.
5 Solutions and Actions
Waste can arise at any point in the value chain, and it is often the case that the actions of one part
of the chain can give rise to waste in another. Without proper measurement and a whole chain
focus on food waste prevention, FLW costs are cumulative, leading to higher prices for businesses
and consumers alike. This also results in lower margins and profits. That the full costs of waste
ultimately fall on society points to the need for a comprehensive approach that encompasses all
parts of the food system.
Our research did not find any examples of waste being measured and managed systematically
across a whole value chain from farm to fork. However, we know that businesses collaborating as a
team can produce commercial and societal benefits that are not possible when working in isolation.
We also encourage the promotion of teamwork across the industry and its regulators. Partnerships
between businesses and redistribution agencies result in more edible foods and beverages being
rescued. Purposeful management of waste streams enable more inedible foods and beverages to
be reused and recycled instead of going to landfill.
38 Concept of scarcity: only so much available in the market, so the only way for me to negotiate and succeed is to take something away from you (win/lose). Concept of abundance: plenty out there and available in the market, so the only way that we can negotiate and succeed is to improve performance by collaborating to access new markets and improve the utilization of available resources (win/win).

50
5.1 Three to Succeed
The matrices presented at the beginning of this report – “Do now (2019),” “Do soon (2020-2021)”
and “Build a plan (2022 onwards)” – are based on the three overarching approaches listed below
for driving reductions in FLW. The final concluding section of this report sets out recommended
actions for implementing these approaches.
The first two approaches (Measure and Lead) are proven means of reducing FLW in industry and
the home. We believe that they also have a role in reducing FLW by encouraging the rescue of
edible food, and improving the performance of community food programs. The third approach
(Enable) is about creating an enabling environment for a) motivating and supporting industry,
consumers and community food programs to reduce avoidable FLW wherever possible; and b)
reducing FLW going to landfill through reuse and recycling. The three approaches are:
1. Measure
Standardized FLW measurement, valuation and reporting
Improve forecasting, communication and collaboration
Drive innovation in packaging and products that reduce waste 2. Lead
Mentorship and capacity building
Drive changes in business practices
Engage employees in constructive reasoning and response 3. Enable
Address policies, legislation and regulations that are incongruent to reducing FLW
Government and industry commit to constructive, outcome-driven collaboration
The proposed solutions and actions that underpin these approaches can lead to significant and
measurable reductions in FLW, by influencing macro and micro change within industry and among
consumers. Figure 5-1 below presents the envisaged process of how this will occur.
Changing the macroeconomics that influence how industry and community food programs operate
leads to changes in business culture. This includes the accurate measurement and valuation of FLW,
along with the emergence of the leadership required to incentivize and engage industry (along with
consumers and community food programs) in the change process.
Sustained changes in culture and, subsequently, sustained changes in behaviour (including the
management of processes followed by industry, food rescuers and community food programs, and
how products are produced, handled and distributed) are ultimately key to sustainably reducing
FLW. This can only be achieved through:
1. Changes in how FLW is measured and reported;
2. Senior leaders from industry and government proactively and collaboratively championing
the need for change; and
3. Establishing the incentives required to engage employees in implementing practices that
lead to reductions in FLW.

51
As illustrated in Figure 5-1, this process begins with changing the macroeconomics that influence
how the overall food system operates.
Figure 5-1: Change Processes to Reduce FLW
5.2 Making Change Happen
The following tables identify 14 solutions and actions to reduce FLW through prevention and
redistribution, and responsibly manage FLW that does occur through reuse and recycling.
Collaboration can deliver considerably greater and sustainable benefits than businesses can attain
on their own. It is however a difficult option, because it involves setting exacting targets and driving
continuous improvement together. (At the end of this Section we explain the different value chains
that exist and how businesses respond and benefit from each type of chain.)
To take into consideration the specific group scenarios that exist, we have categorized the
recommended actions for each of the 14 solutions by:
A single business acting alone
Value chain partners working together where o Collaboration is low or developing o Collaboration is well established
Food rescue organizations
Industry bodies providing advocacy, leadership and guidance
Different tiers of government
The actions are based on a belief that industry bodies and governments alike should direct the
development and promotion of FLW prevention strategies implemented by businesses operating
along food value chains. Bodies advocating for food rescuers and community food programs also
have a crucial role to play in the implementation of FLW prevention strategies. This would guide
how businesses work independently, or preferably in partnership, to take greater steps to prevent
FLW, by implementing improved measurement and actions particular to the value chains in which
they operate. It will also guide the implementation of improved measurement and actions
throughout rescue and redistribution systems.

52
Categorized as “Business Optimization,” “Marketing and Merchandizing” and “Social and
Environmental Responsibility,” the 14 solutions and associated actions are described below.
Business Optimization
Solution #1: Measure, value and report FLW at business level Applicable to all levels of industry, food rescue/redistribution; all types of food
Implementations by Businesses
As a single business acting alone
Measure, value, report and act upon FLW at business level Where collaboration is low or developing
Monitor and communicate extent of FLW linked to business dealings; for example, by benchmarking supplier performance
Where collaboration is well established
Share and act on FLW data in conjunction with continual improvement program, sharing benefits to motivate continued mutually-beneficial commitment
Implementations by Food Rescue Organizations
In conjunction with those businesses from whom community food programs source foods and beverages,
Implement monitoring systems to address inefficiencies, particularly foods and beverages that go to waste due to disconnects between supply and demand.
Implementations by Industry Body
In conjunction with stakeholder initiatives, such as the Grocery Manufacturers Collaborative, produce a strategy and common framework for individual members to report FLW, set targets and KPIs
Incorporate into a voluntary agreement and FLW reduction targets established with government
Define foods and beverages diverted to animal feed as FLW
Viewing the diverting of excess food to animal feed as a revenue source masks potentially enormous inefficiencies
Incorporate standardized measurement, valuation and reporting practices into CFO training and executive mentorship
Assist individual members to quantify the true value of FLW and scale of financial opportunities achievable by reducing FLW
Ensure effective narrative is used in communications to industry (e.g. emphasize the scale of labour-related costs that can be reduced by addressing FLW at source)
Incorporate into CFO training and executive mentorship
Implementations by Government
Legislate making FLW reporting compulsory
Incorporate into investment in voluntary agreement
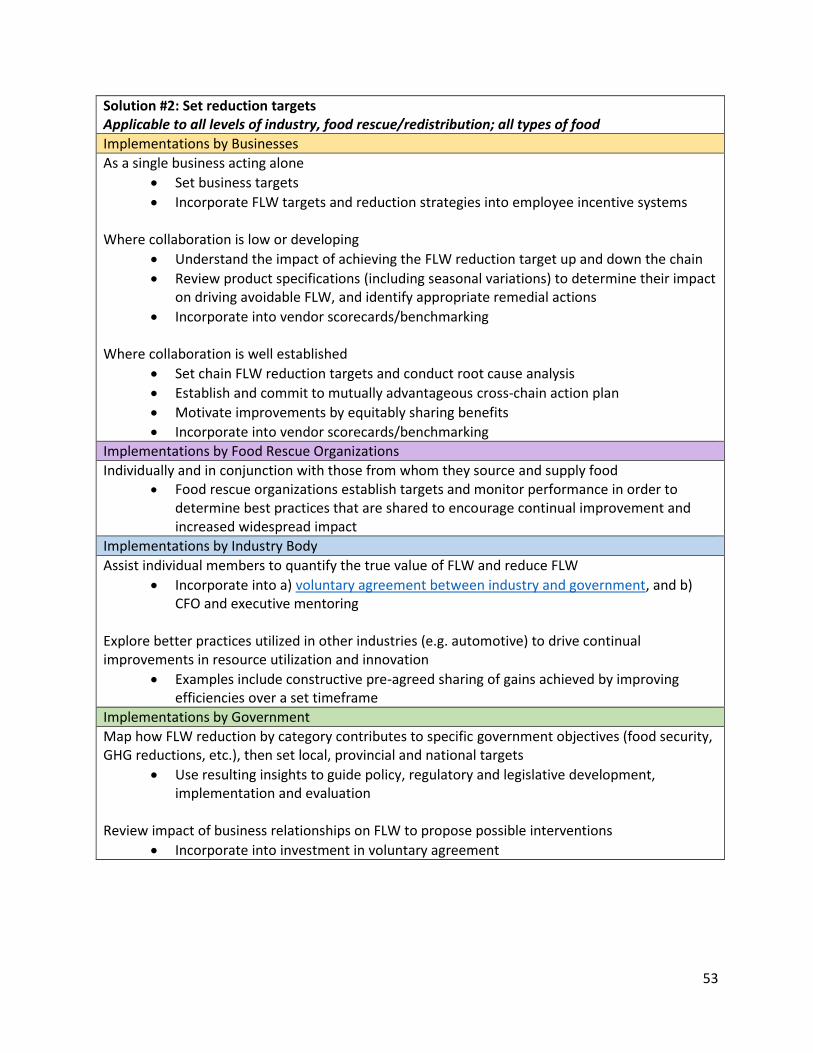
53
Solution #2: Set reduction targets Applicable to all levels of industry, food rescue/redistribution; all types of food
Implementations by Businesses
As a single business acting alone
Set business targets
Incorporate FLW targets and reduction strategies into employee incentive systems Where collaboration is low or developing
Understand the impact of achieving the FLW reduction target up and down the chain
Review product specifications (including seasonal variations) to determine their impact on driving avoidable FLW, and identify appropriate remedial actions
Incorporate into vendor scorecards/benchmarking
Where collaboration is well established
Set chain FLW reduction targets and conduct root cause analysis
Establish and commit to mutually advantageous cross-chain action plan
Motivate improvements by equitably sharing benefits
Incorporate into vendor scorecards/benchmarking
Implementations by Food Rescue Organizations
Individually and in conjunction with those from whom they source and supply food Food rescue organizations establish targets and monitor performance in order to
determine best practices that are shared to encourage continual improvement and increased widespread impact
Implementations by Industry Body
Assist individual members to quantify the true value of FLW and reduce FLW
Incorporate into a) voluntary agreement between industry and government, and b) CFO and executive mentoring
Explore better practices utilized in other industries (e.g. automotive) to drive continual improvements in resource utilization and innovation
Examples include constructive pre-agreed sharing of gains achieved by improving efficiencies over a set timeframe
Implementations by Government
Map how FLW reduction by category contributes to specific government objectives (food security, GHG reductions, etc.), then set local, provincial and national targets
Use resulting insights to guide policy, regulatory and legislative development, implementation and evaluation
Review impact of business relationships on FLW to propose possible interventions
Incorporate into investment in voluntary agreement

54
Solution #3: Engage employees Applicable to all levels of industry, food rescue/redistribution; all types of food
Implementations by Businesses
As a single business acting alone
Assign responsibility at senior executive level for reducing FLW
Identify an individual from senior management or an executive who is responsible for waste prevention and who can direct remedial action
Provide staff training and mentorship to support implementation of lean enterprise practices
Delegate control as well as accountability for FLW and associated waste reduction
Introduce individual/team/store targets and incentives Where collaboration is low or developing
Assign responsibility among senior executives and management to reduce FLW
Incorporate employee accountability for reducing FLW in business agreements and dealings
Where collaboration is well established
Provide inter-firm training and forums to support the implementation of collaborative lean enterprise practices across the multiple businesses and business functions
Leverage collaboration to drive continual reductions in FLW and associated wastes Implementations by Food Rescue Organizations
Engage staff and volunteers in designing then implementing improved processes, protocols and systems, then to share results and best practices, through:
Networking, training and mentorship to create capacity to implement lean thinking throughout the food rescue network
Proactively hiring staff and engaging volunteers who possess logistics training and experience
Engage staff and volunteers in the optimized management of inventory and stocking
Implementations by Industry Body
Invest in voluntary agreement
Commit to a structured process for engaging employees from all levels of industry in enabling and motivating continual improvement in FLW reduction
Develop lean enterprise process improvement training modules for members
Communicate best practices and achievements
Linked to CFO training, executive mentorship, and wider industry communications Partner with universities and colleges to ensure delivery of effective and pragmatic lean process improvement courses
Communicate best practice
Encourage industry to support action learning by students through secondment or other means

55
Implementations by Government
Invest in voluntary agreement
Commit to a structured process for engaging industry leaders from across the food value chain in enabling and motivating continual improvement in FLW reduction
Couple university and college funding with delivery of at least one lean enterprise continual process improvement unit
Apply to all students studying business, management, commerce and food preparation/handling related disciplines
Solution #4: Improve forecasting Applicable to all levels of industry, food rescue/redistribution; all types of food
Implementations by Businesses
As a single business acting alone
Review internal forecasting processes and protocols to identify root cause of forecast deficiencies and address
Where collaboration is low or developing
Provide meaningful forecasts in appropriate metrics/information Where collaboration is well established
Introduce Collaborative Planning, Forecasting and Replenishment processes
Manage promotions to minimize creation of unnecessary FLW
Implement vendor managed inventory where appropriate
Motivate continued commitment by sharing benefits achieved Implementations by Food Rescue Organizations
In conjunction with peers and community food programs, establish the strategic oversight required to ensure implementation of effective and efficient forecasting and replenishment processes, protocols and practices at local, regional and provincial/territorial levels of hunger relief efforts.
Resulting in the improved utilization of current infrastructure and aiding long-term capital investment decisions
Implementations by Industry Body
Identify better practice forecast creation, communication and execution
Incorporate insights into executive mentorship, CFO training and wider industry communications
Publish guidance and case studies on collaborative forecasting and replenishment
Incorporate into the establishment of FLW reduction targets and the monitoring/reporting on industry performance
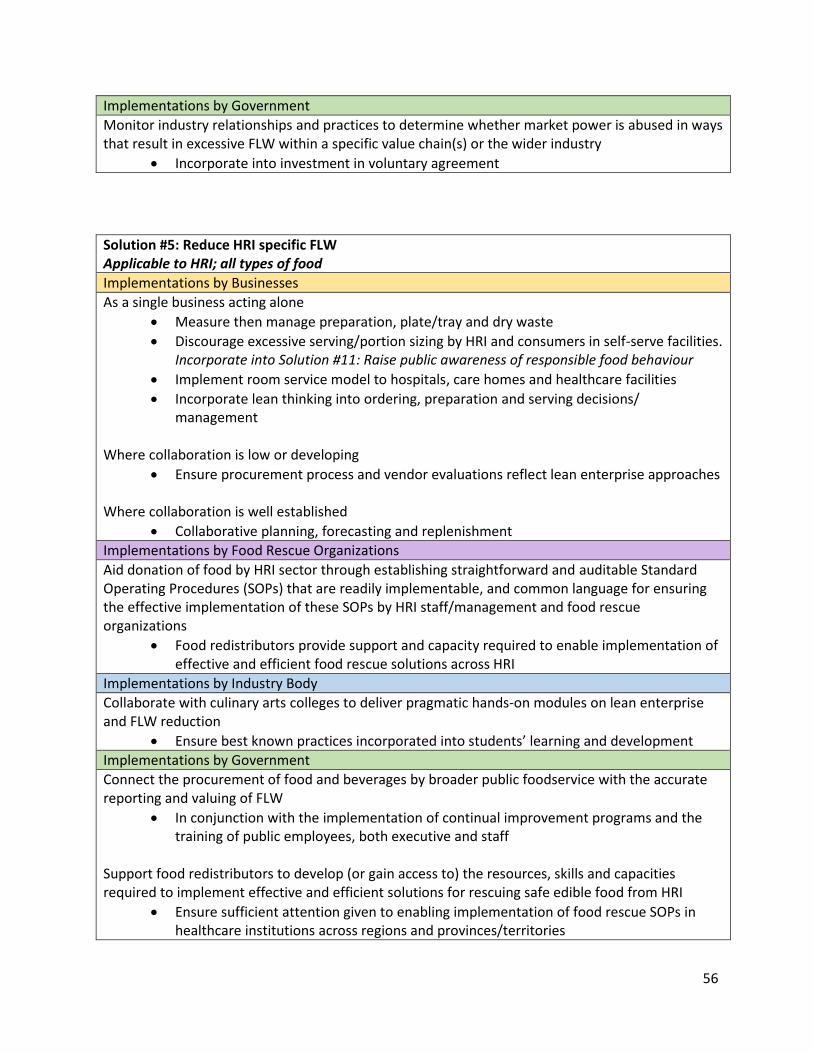
56
Implementations by Government
Monitor industry relationships and practices to determine whether market power is abused in ways that result in excessive FLW within a specific value chain(s) or the wider industry
Incorporate into investment in voluntary agreement
Solution #5: Reduce HRI specific FLW Applicable to HRI; all types of food
Implementations by Businesses
As a single business acting alone
Measure then manage preparation, plate/tray and dry waste
Discourage excessive serving/portion sizing by HRI and consumers in self-serve facilities. Incorporate into Solution #11: Raise public awareness of responsible food behaviour
Implement room service model to hospitals, care homes and healthcare facilities
Incorporate lean thinking into ordering, preparation and serving decisions/ management
Where collaboration is low or developing
Ensure procurement process and vendor evaluations reflect lean enterprise approaches
Where collaboration is well established
Collaborative planning, forecasting and replenishment
Implementations by Food Rescue Organizations
Aid donation of food by HRI sector through establishing straightforward and auditable Standard Operating Procedures (SOPs) that are readily implementable, and common language for ensuring the effective implementation of these SOPs by HRI staff/management and food rescue organizations
Food redistributors provide support and capacity required to enable implementation of effective and efficient food rescue solutions across HRI
Implementations by Industry Body
Collaborate with culinary arts colleges to deliver pragmatic hands-on modules on lean enterprise and FLW reduction
Ensure best known practices incorporated into students’ learning and development
Implementations by Government
Connect the procurement of food and beverages by broader public foodservice with the accurate reporting and valuing of FLW
In conjunction with the implementation of continual improvement programs and the training of public employees, both executive and staff
Support food redistributors to develop (or gain access to) the resources, skills and capacities required to implement effective and efficient solutions for rescuing safe edible food from HRI
Ensure sufficient attention given to enabling implementation of food rescue SOPs in healthcare institutions across regions and provinces/territories

57
Solution #6: Improve date coding information and practices Most applicable to processing, manufacturing, retail and HRI; all types of food
Implementations by Businesses
As a single business acting alone
Review corporate policies and corporate practices to ensure socially and economically responsible date coding practices
Where collaboration is low or developing
Incorporate corporate policies into supplier scorecards, vendor benchmarking, and contractual agreements
Where collaboration is well established
Eliminate best before, use by, and sell by date practices that lead to avoidable FLW
For best before dates where there are no food safety implications, use a format that enables effective stock management though is not obvious to consumers (e.g. Julian codes39)
Increase minimum life on receipt, and monitor practices between suppliers Implementations by Food Rescue Organizations
Establish standardized, clearly defined language for communicating acceptable timeframes for receiving and redistributing products that are close to, or have reached, their best before date to:
Businesses where rescued food is sourced
Community food program staff and volunteers
Community food program clients Implementations by Industry Body
Establish industry standard for corporate date code policies and processes
Establish best practice policies for businesses to evaluate their policies, procedures and protocols
Communicate the purposes and meaning of each date code type to consumers and industry
Ensure responsible behaviour by having established basis of common understanding
Implementations by Government
Establish clear, practical and enforceable policy and regulations on date coding
Includes establishing clear differentiation between use by industry, and legislation by government, of “best before,” “use by” and “sell by” date coding practices
39 For further information, as example, see: https://www.thereadystore.com/food-storage/1221/julian-date/

58
Solution #7: Ensure available, affordable temporary and seasonal labour Most applicable to agriculture, processing and manufacturing sectors; all types of food
Implementations by Businesses
As a single business acting alone
Be aware of program requirements, plan ahead, and implement processes to ensure compliance with temporary and seasonable worker regulations
Where collaboration is low or developing
As with a single business acting alone, be aware of program requirements, plan ahead, and implement processes to ensure compliance with temporary and seasonable worker regulations
Where collaboration is well established
As with a single business acting alone, be aware of program requirements, plan ahead, and implement processes to ensure compliance with temporary and seasonable worker regulations
Explore the possibility of collaboratively sharing workforce to ensure its effective and efficient utilization, such as between farming operations or between farming / marine and processors
Implementations by Food Rescue Organizations
N/A
Implementations by Industry Body
Foster objective results-driven collaboration between industry and government
Establish clearly defined guidelines setting out businesses’ accountabilities when engaging temporary and seasonal labour, including compliance requirements
Implementations by Government
Reintroduce proven programs for temporary and seasonal workers, especially in agriculture
Separate temporary worker and seasonal worker program requirements and monitoring practices
Establish standard operating procedures for inspectors to follow when evaluating applications
Address the prescriptive nature of current programs
Place accountability for the responsible management of the temporary worker and seasonal worker programs on individual businesses
Monitor program implementation through the establishment of standard operating procedures, along with clearly defined rules for inspectors and industry to follow

59
Marketing and Merchandizing
Solution #8: Streamline product ranging (retail, HRI, redistribution) Primarily applicable to retail, HRI, food rescue/redistribution; all types of food
Implementations by Businesses
As a single business acting alone
Ensure SKU range matches stores’ local demographics, deleting any underperforming SKUs
Ensure effective shrink management policies and reporting procedures Where collaboration is low or developing
Review product ranging (products and pack size) to align more specifically with local demand and FLW reduction targets
Where collaboration is well established
Incorporate monitoring of store ranging into collaborative planning, forecasting and replenishment processes
Implementations by Food Rescue Organizations
Ensure food redistribution processes and protocols allow staff and volunteers to respond effectively and efficiently to clients’ needs and preferences
For example, within the bounds of what is practical, be flexible in the size and contents of food boxes / hampers that community food programs provide to their clients
Implementations by Industry Body
Identify and communicate best practice for optimizing stores’ SKU ranging decisions
Communicate to industry pre-competitive examples of success and how achieved
Implementations by Government
N/A
Solution #9: Streamline product availability in retail, HRI and redistribution Primarily applicable manufacturing, retail, HRI, rescue/redistribution; all types of food
Implementations by Businesses
As a single business acting alone
Retailers: use on-shelf messages to explain why availability of particular SKUs is limited and therefore shelves are not fully stocked
HRI: use menu, or other means if more appropriate, to explain why availability of particular items is limited
Vendors: minimize the occurrence of supply outages by implementing lean enterprise practices
Where collaboration is low or developing
Determine if positive correlation between forecast accuracy and product availability is proven to exist. If it does exist, conduct root causes analysis and remediation

60
Vendors: proactively communicate to suppliers and customers if possible forthcoming limitations in supply arise
Where collaboration is well established
Optimize availability through collaborative planning, forecasting and replenishment programs
Implementations by Food Rescue Organizations
Redistributors collaborate with their peers and the community food programs that they supply, locally, regionally and inter-provincially to:
Improve the strategic and operational transparency required to react effectively and efficiently to the needs of individual community food programs
Implementations by Industry Body
Research impact of empty and part-filled shelves on consumer behaviour
Pre-competitive analysis to identify in which products and consumer segments negative reaction is most acute, and avenues/means to successfully address
Implementations by Government
Ensure activities pertaining to voluntary agreement encompass the analysis of penalizing practices imposed by customers on suppliers on the creation of unnecessary FLW
Incorporate into funding of voluntary agreement
Solution #10: Reformulate products and packaging Applicable to processing, manufacturing, retail, HRI; all types of food
Implementations by Businesses
As a single business acting alone
Identify optimized packaging and communicate these changes to consumers. A slight increase in one type of packaging, whether tertiary (for transportation purposes), secondary (boxes/trays such as that often seen on retail shelves), or primary (packaging that consumers take home) can reduce overall packaging requirements and also, in turn, produce significant reductions in food waste
Where collaboration is low or developing
Establish and communicate standard operating procedures for evaluating and determining packaging and product innovations to vendors and packaging material manufacturers
Where collaboration is well established
Optimize tertiary, secondary and primary packaging design to minimize whole of chain food, beverage and packaging wastes
Determine most appropriate pack size(s) and design(s) for target market(s), implement appropriate supply chain processes, then monitor overall performance
Implementations by Food Rescue Organizations
N/A – unless food and beverages specially packaged for purchase by or donation to agencies, in which case a balance must be attained between pack size and target clients

61
Implementations by Industry Body
Establish guidance for businesses to follow when seeking to design optimized packaging solutions, and communicating the benefits of optimized packaging to consumers
Identify and communicate the benefits achieved through best practice
Implementations by Government
Legislation than enables improved development and use of optimized packaging
Minimize incongruences between packaging design, materials and recycling policies, legislation and regulations
Introduce and standardize (nationally) producer responsibility in packaging
Establish national standard for producer responsibility
Collaborative investment by municipalities in infrastructure for reuse and recycling of packaging
Linked to discouraging the disposal of packaging in landfill by industry and consumers
Social and Environmental Responsibility
Solution #11: Raise public awareness of responsible food behaviour Applicable to processing, manufacturing, retail, HRI, food rescue/redistribution; all types of food
Implementations by Businesses
As a single business acting alone
Point-of-sale messaging where consumers can source information on reducing at-home FLW
Optimize pack sizing decisions in product ranging
Partner with the Love Food Hate Waste campaign: https://lovefoodhatewaste.ca/ Where collaboration is low or developing
Pack size optimization, labels providing storage and freezing guidance, portioning and help with using leftovers
Best practice in date labelling and open life guidance
Where collaboration is well established
Pack size optimization, labels providing storage and freezing guidance, portioning and help with using leftovers
Best practice in date labelling and open life guidance
Implementations by Food Rescue Organizations
Identify best practices and standardized common language for ensuring responsible behaviour amongst community food program clients and reducing FLW during redistribution
Implementations by Industry Body
Identify best practices for ensuring responsible purchasing and food handling behaviours amongst consumers
Encourage standardized merchandizing and consumer messaging across industry

62
Expand involvement in Canada’s Love Food Hate Waste campaign
Champion industry’s involvement in program
Implementations by Government
Expand involvement in Canada’s Love Food Hate Waste campaign across all jurisdictions
Invest in enabling its communication via a range of media channels
Reintroduce home economics (food handing and preparation) into high schools nationally
Invest in the required infrastructure and human resources
Solution #12: Increase donation of edible food Applicable to all levels of industry, food rescue/redistribution; all types of food
Implementations by Businesses
As a single business acting alone
Contribute food to local redistribution schemes and community food programs
Contribute services, such as transportation (e.g. reverse logistics), to local redistribution schemes
Engage employees in design, implementation and continual improvement of food donation programs
Where collaboration is low or developing
Review vendor agreements to ensure they do not obstruct redistribution
Where collaboration is well established
Introduce collaborative programs to enable excess food to be donated with the most shelf life, by linking donation process to business forecasting, replenishment and demand processes
Implementations by Food Rescue Organizations
Aid donation of food by any business operating along the value chains supplying retail and HRI, through establishing straightforward and auditable SOPs that are readily implementable and share a common language.
Establish the strategic oversight required to ensure improved communication and coordination between donors, redistributors and community food programs.
Redistributors, through strategic engagement with industry and government, improve the availability of effective and efficient food rescue solutions
Implementations by Industry Body
Investigate extent and causes of resistance to donating edible food
Use findings to counter resistance to donation through constructive information and communication
With NGOs, standardize collection and communication systems between donors and redistributors (system may need to vary between rural and urban settings)

63
Facilitating positive change by enabling more effective communication and interactions between industry and redistribution agencies
Publish advice and case studies on donation liability and vendor agreements
Encourage redistribution through providing industry with constructive advice and providing support network
Implementations by Government
Standardize and communicate Good Samaritan Acts
Ensure consistency between all provinces’ and territories’ Good Samaritan Acts
Collaborative investment in re-distribution infrastructure
Minimizing occurrence of rescued/rescuable food that is wasted due to lack of infrastructure or effective processes
Introduce incentives for businesses to donate excess edible food
Ensure policies, regulations and legislation reflect food waste hierarchy
Coordinate capacity building for food recovery
Solution #13: Improve FLW management Most applicable to processing, manufacturing, retail, HRI, food rescue/redistribution; all types of food
Implementations by Businesses
As a single business acting alone
Segregate FLW from general waste streams, to enable more effective and efficient reuse and recycling of inedible food
Where collaboration is low or developing
Audit current FLW management practices to identify effectiveness of improvement mechanisms, and design/implement remediation actions
Where collaboration is well established
Incorporate monitoring and benchmarking of FLW management performance into collaborative continual improvement program including Joint Business Plans
Implementations by Food Rescue Organizations
Identify where FLW occurs and current management practices, to identify root causes and support continual improvement efforts.
Implementations by Industry Body
Research and report best practice from innovators
Driving innovation through piloting, communication and networking Explore new waste management business models

64
Potential examples include full or part ownership in centrifuges to reduce water content in organic waste at source, enabling opportunities to create new products and markets while reducing transport and handling costs
Implementations by Government
Incorporate food waste hierarchy into policies, regulations and legislation
Ensure policies, regulations and legislation aligned to ensuring minimal FLW sent landfill
Ban organic waste from landfill
Federal, provincial/territorial and municipal governments collaborate to implement economically and environmentally optimal FLW management systems
Invest in alternative infrastructure to enable recycling
Create economics of scale required to reduce comparative cost of reuse and recycling, particularly in rural and semi-urban regions
Audit municipal, provincial and federal regulations/policies at system level to identify incongruences
Insights guide development of standardized process of policy, regulatory and legislative development, implementation and evaluation, resulting in increased alignment of policies, legislation, regulations and their implementation nationally across provinces/territories and municipalities
Solution #14: Incorporate the full cost of food production, management and waste into decision making Applicable to all levels of industry, food rescue/redistribution; all types of food
Implementations by Businesses
As a single business acting alone
Identify true cost of FLW by applying full cost accounting methods
Include all costs of FLW (incl. wasted labour, energy, transport, processing costs), not just costs of disposal into decision making processes and contractual arrangements
Where collaboration is low or developing
Factor true costs of FLW into contractual agreements and vendor scorecards
Where collaboration is well established
Identify scale of opportunities by quantifying volume and value of FLW within individual businesses and along overall value chain. Use insights to drive collaborative continual improvement program.
Implementations by Food Rescue Organizations
Include full cost accounting methods when community food programs are evaluating the effectiveness of contractual purchasing arrangements established with industry.

65
Implementations by Industry Body
Publish true cost of FLW using total cost accounting methods
Establish standardized model for FLW cost accounting
Incorporate into voluntary agreement Provide CFO training and mentorship
Ensure members are able to identify true costs of FLW, along with supporting and championing the use of total cost accounting in financial reporting
Implementations by Government
Introduce means to ensure that the true costs of FLW are internalized by industry and public
Commencing with international review of best practice policies, regulations and legislation for driving internalization of true FLW costs
Ban FLW produced by the food and beverage industry and households from landfill
Ban FLW produced by the food and beverage industry and households from being dumped at sea or into landfill
5.3 Comments on Proposed Solutions and Actions
5.3.1 Suitability and Limitations by Food Type and Location
When taking into consideration the above 14 solutions, the three key priorities are to 1) find the
means to prevent avoidable FLW, 2) increase the availability of food to those individuals who rely
on food rescue services, and 3) increase the effectiveness of food redistribution systems. However,
this is not straightforward. For example, some solutions have greater potential to reduce FLW of
perishable products, like fresh produce. These include changes to date coding protocols and
improving forecasting or using food that does not meet retailer specifications.
The donation of food by manufacturers, distributors, retailers, restaurants and institutions is likely
to be more cost effective in urban and semi-urban locations, where both collection and re-
distribution take place in relatively close proximity. Few of the solutions for improved food rescue
and redistribution require investment in infrastructure and capital expenditure, rather using the
existing infrastructure and systems more effectively. This will lead to greater efficiencies than can
otherwise be attained, thereby reducing the costs and complexities that many businesses currently
associate with food rescue.
5.3.2 Differentiating Actions by Chains’ Collaborative Capacity
The Value Chain Management Centre (the precursor to Value Chain Management International)
developed a classification for value chains40 according to their collaborative capacity. This is set out
in Table 5-1 below. Anecdotally, the research found evidence on similar differences existing in the
relationships that occur amongst and between food rescue organizations and partner community
40 Value Chain Management Centre (2012) Characterizing the Determinants of Successful Value Chains

66
food programs, and the comparative performance that consequently results from these
relationships.
Table 5-1: Classification of Value Chains
Fragmented
Companies primarily compete on a traditional trade footing. The majority of business is conducted as a series of short-term, one-off transactions. Price, volume and quality are commonly paramount to business dealings. The primary onus of strategic decisions is on self-preservation and sharing the bare minimum of transactional information, for fear a company’s insights are used against it. Typically, the result is a fragmented chain comprising businesses that share adversarial and distrusting relationships. These types of businesses often look to past experiences for solutions to current challenges, and have little opportunity to utilize the resources of other members of the value chain. As a result, they are limited in their ability to effectively and efficiently adapt to changing market demands.
Cooperative Companies possess a mutual understanding of how and why they can benefit from cooperating with one another over the medium term at an operational level, rather than undertaking specific short-term or one-off business deals. The attitudes and culture of the businesses involved will determine whether a chain’s structure can develop into a more strategically aligned approach, where the partners can utilize one another’s capabilities for commercial advantage. Whether such an approach is feasible may also be determined by the environment in which the chain operates and in which it competes against other chains and businesses.
Coordinated
Companies with complementary attitudes, cultures and leadership styles choose to coordinate their business arrangements over a short to medium timeframe. A more strategically aligned structure than the one exemplified above causes at least part of the chain to think and act from a strategic – not only operational or tactical – perspective. A strategic perspective arises from operating in an external environment that allows this type of approach to occur. Over time, the participants come to steadily acknowledge the benefits of conducting medium-term business deals with chosen suppliers and buyers, leading to increased levels of commitment and the development of more sophisticated value chain management capabilities.
Collaborative Companies engage in longer-term strategic arrangements that involve collaboratively sharing resources and/or investing in the capabilities required to achieve mutually beneficial outcomes. Successfully adopting this type of model requires the involved businesses to possess compatible cultures, vision and leadership. It also requires an external environment that is conducive to supporting and enabling such an approach. While the model can undoubtedly produce greater rewards than the three alternative models, it also generates increased risks, particularly for businesses that are still developing (as opposed to refining) their value chain management skills.

67
Businesses can use indicators described in the above table to categorize the type of chain(s) in
which they operate and identify which of the proposed solutions and actions are most suited to
their current situation – and those to which they aspire. Where chains can point to examples of
positive systems and behaviours that already exist, they can then more confidently implement the
actions requiring a high level of chain collaboration. Where only some systems or behaviours can be
found, chains should start with those actions requiring little collaboration, and then progress to the
more challenging ones. Where few positive indicators are present, firms should initially focus on
those actions they can do unilaterally.
We maintain that big and small companies can work together to their joint advantage, because
collaboration offers, for example, 1) more opportunities to increase margins through reducing costs
or capturing price premiums; 2) better access to market information and 3) help to identify new
business opportunities.
Farmers and other small producers can be sceptical about the feasibility of collaboration, often
because of unequal size differences with retailers, for example. This, they believe, inevitably creates
an unequal partnership. The research also found evidence regarding how a lack of collaboration
leads to FLW occurring among large businesses. In the UK, such concerns led to the introduction of
a voluntary code of practice, and subsequently to the introduction of a Groceries Code Adjudicator.
A similar process occurred in Australia.
Irrespective of chain relationships and industry level initiatives, we accept that not all the proposed
solutions and corresponding actions can be achieved overnight. It is, however, clear from our
research where businesses should begin, which is to implement the three simple steps set out
below.
1) Measure, value and report FLW in a consistent way in accordance with the international Food Loss and Waste Accounting and Reporting Standard;
2) Set a FLW reduction target that contributes to SDG 12.3, and integrate this into all corporate documents, as well as reporting said target publicly and engaging with your suppliers/customers to take similar action; and
3) Engage employees in taking actions to reduce your own FLW, and, in partnership, help suppliers, customers and consumers reduce theirs.
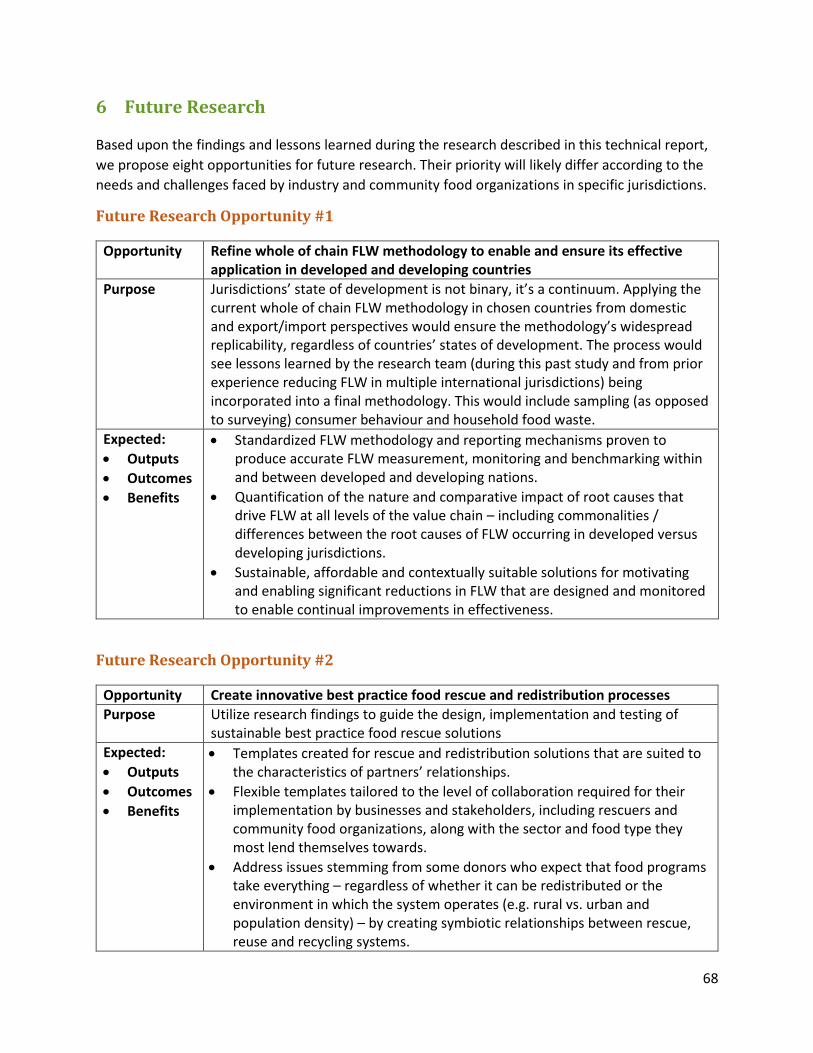
68
6 Future Research
Based upon the findings and lessons learned during the research described in this technical report,
we propose eight opportunities for future research. Their priority will likely differ according to the
needs and challenges faced by industry and community food organizations in specific jurisdictions.
Future Research Opportunity #1
Opportunity Refine whole of chain FLW methodology to enable and ensure its effective application in developed and developing countries
Purpose Jurisdictions’ state of development is not binary, it’s a continuum. Applying the current whole of chain FLW methodology in chosen countries from domestic and export/import perspectives would ensure the methodology’s widespread replicability, regardless of countries’ states of development. The process would see lessons learned by the research team (during this past study and from prior experience reducing FLW in multiple international jurisdictions) being incorporated into a final methodology. This would include sampling (as opposed to surveying) consumer behaviour and household food waste.
Expected:
Outputs
Outcomes
Benefits
Standardized FLW methodology and reporting mechanisms proven to produce accurate FLW measurement, monitoring and benchmarking within and between developed and developing nations.
Quantification of the nature and comparative impact of root causes that drive FLW at all levels of the value chain – including commonalities / differences between the root causes of FLW occurring in developed versus developing jurisdictions.
Sustainable, affordable and contextually suitable solutions for motivating and enabling significant reductions in FLW that are designed and monitored to enable continual improvements in effectiveness.
Future Research Opportunity #2
Opportunity Create innovative best practice food rescue and redistribution processes
Purpose Utilize research findings to guide the design, implementation and testing of sustainable best practice food rescue solutions
Expected:
Outputs
Outcomes
Benefits
Templates created for rescue and redistribution solutions that are suited to the characteristics of partners’ relationships.
Flexible templates tailored to the level of collaboration required for their implementation by businesses and stakeholders, including rescuers and community food organizations, along with the sector and food type they most lend themselves towards.
Address issues stemming from some donors who expect that food programs take everything – regardless of whether it can be redistributed or the environment in which the system operates (e.g. rural vs. urban and population density) – by creating symbiotic relationships between rescue, reuse and recycling systems.

69
Future Research Opportunity #3
Opportunity Test whole of chain FLW methodology at enterprise level
Purpose Prove applicability and value of applying the research methodology in individual businesses along the value chain. Including product life in the analysis would provide actionable insights into how product life is set, how much product life is given to retail/HRI/households, and how to extend product life in households by flowing products faster along the value chain. The analysis of household behaviours should be achieved by sampling, as opposed to surveys.
Expected:
Outputs
Outcomes
Benefits
Standardized FLW measurement and reporting mechanisms proven to enable the implementation of operational improvements that lead to reduced FLW and commercial benefits for businesses operating along the value chain.
Methodology tailored to enable its flexible application by businesses possessing different capabilities, varying levels of collaboration, and operating in differing circumstances.
Ability to extrapolate findings produced by enterprise and industry level analysis of FLW aids implementation of sustainable FLW solutions.
Future Research Opportunity #4
Opportunity Lean enterprise implementation programs tailored to food rescue and redistribution
Purpose Enable the more effective and efficient use of current food redistribution and community food infrastructure by having produced proven, easily implementable lean enterprise materials tailored to food rescue. This would ideally extend to identifying lean enterprise approaches that are effective for reducing FLW among community food program clients.
Expected:
Outputs
Outcomes
Benefits
Robust, easily implementable tools and techniques that food redistributors, community food organizations and their donors can follow to attain, then continually improve upon, their current best practice.
Standardized methodology, enabling lessons learned by organizations and donors possessing different capabilities and operating in differing circumstances to be shared and acted upon to aid widespread continual improvements.
Greater percentage of excess edible food rescued and successfully redistributed, resulting in long-term societal benefits and reduced FLW.
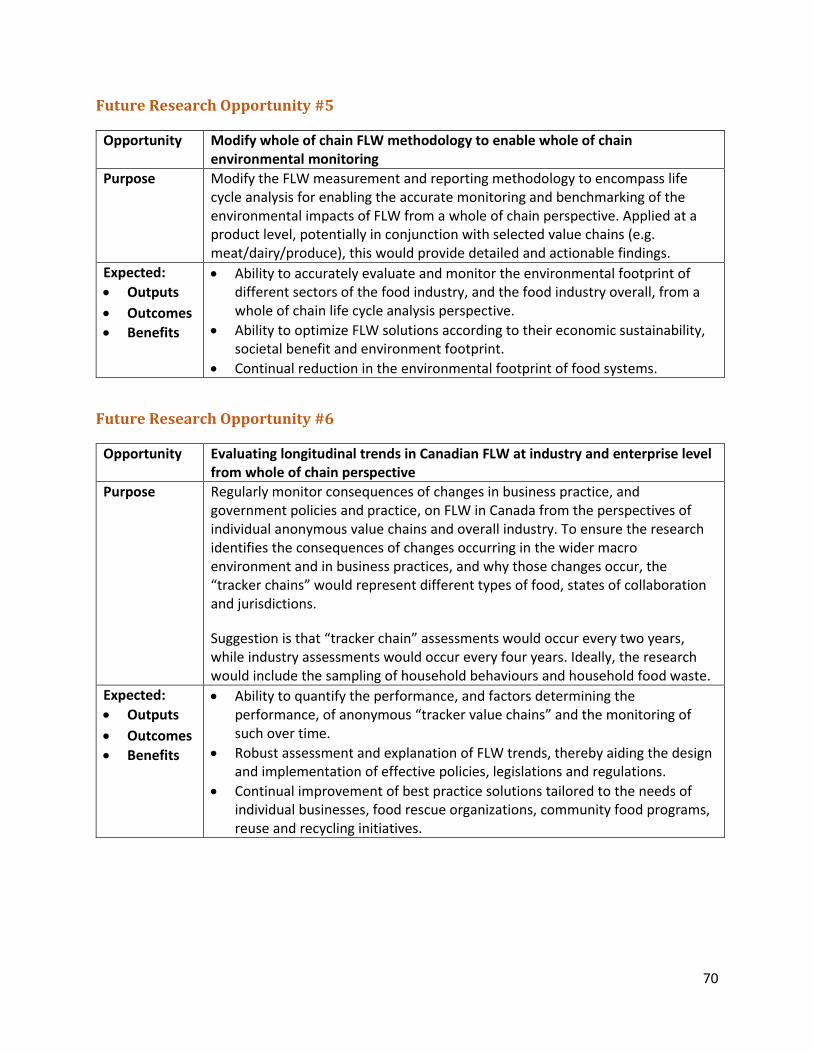
70
Future Research Opportunity #5
Opportunity Modify whole of chain FLW methodology to enable whole of chain environmental monitoring
Purpose Modify the FLW measurement and reporting methodology to encompass life cycle analysis for enabling the accurate monitoring and benchmarking of the environmental impacts of FLW from a whole of chain perspective. Applied at a product level, potentially in conjunction with selected value chains (e.g. meat/dairy/produce), this would provide detailed and actionable findings.
Expected:
Outputs
Outcomes
Benefits
Ability to accurately evaluate and monitor the environmental footprint of different sectors of the food industry, and the food industry overall, from a whole of chain life cycle analysis perspective.
Ability to optimize FLW solutions according to their economic sustainability, societal benefit and environment footprint.
Continual reduction in the environmental footprint of food systems.
Future Research Opportunity #6
Opportunity Evaluating longitudinal trends in Canadian FLW at industry and enterprise level from whole of chain perspective
Purpose Regularly monitor consequences of changes in business practice, and government policies and practice, on FLW in Canada from the perspectives of individual anonymous value chains and overall industry. To ensure the research identifies the consequences of changes occurring in the wider macro environment and in business practices, and why those changes occur, the “tracker chains” would represent different types of food, states of collaboration and jurisdictions.
Suggestion is that “tracker chain” assessments would occur every two years, while industry assessments would occur every four years. Ideally, the research would include the sampling of household behaviours and household food waste.
Expected:
Outputs
Outcomes
Benefits
Ability to quantify the performance, and factors determining the performance, of anonymous “tracker value chains” and the monitoring of such over time.
Robust assessment and explanation of FLW trends, thereby aiding the design and implementation of effective policies, legislations and regulations.
Continual improvement of best practice solutions tailored to the needs of individual businesses, food rescue organizations, community food programs, reuse and recycling initiatives.

71
Future Research Opportunity #7
Opportunity Apply whole of chain FLW methodology to aid the design and implementation of optimized packaging
Purpose Create ability to simultaneously measure, report and benchmark the effectiveness of packaging materials and the design of food packaging from whole of chain, life cycle analysis and environmental perspectives. The addition of sampling household behaviours and household food waste would best quantify how to optimize packaging to reduce FLW among consumers.
Expected:
Outputs
Outcomes
Benefits
Proven whole of chain methodology for simultaneously analyzing 1) FLW, 2) packaging waste, and 3) relationships between the environmental footprints of food and packaging.
Support the development and utilization of innovative tertiary, secondary and primary packaging, and responsible management of packaging waste.
Continual reduction of FLW and packaging waste.
Future Research Opportunity #8
Opportunity Expand application of proven whole of chain FLW methodology into non-food industries
Purpose Use lessons learned to modify, test and refine the whole of chain methodology to enable non-food industries (e.g. forestry, apparel, and mining) to: 1) accurately measure, monitor and benchmark waste; 2) identify root causes; and 3) ascertain environmental impacts associated with waste and root causes.
Expected:
Outputs
Outcomes
Benefits
Standardized whole of chain methodology and reporting mechanisms for accurately measuring and benchmarking waste, and its environmental footprint across multiple industries.
Quantification of nature and comparative impact of root causes of waste at all levels of the value chain, thereby enabling commonalities and differences existing between industries and jurisdictions to be quantified.
Continual improvements in the effectiveness of solutions for significantly reducing waste by enabling lessons learned to be shared across industries.
72
7 Bibliography
Akerlof, George A. 1970. “The Market for ‘Lemons’ Quality Uncertainty and the Market
Mechanism.” The Quarterly Journal of Economics 84 (3): 488–500. doi:10.2307/1879431.
Buchner, Barbara, Claude Fischler, Ellen Gustafson, John Reilly, Gabriele Riccardi, Camillo Ricordi,
Umberto Veronesi, and Barilla Center for Food & Nutrition (BCFN). 2012. “Food Waste:
Causes, Impacts and Proposals.” Barilla Center for Food & Nutrition, 53–61. doi:45854585.
Buzby, Jean C., Hodan F Wells, and Jeffrey Hyman. 2014. “The Estimated Amount, Value, and
Calories of Postharvest Food Losses at the Retail and Consumer Levels in the United States.”
Economic Research Bulletin. doi:10.2139/ssrn.2501659.
Champions 12.3. 2018. “Champions 12.3.” https://champions123.org/.
FAO. (Food and Agriculture Organization). 2017. Food Wastage Footprint & Climate Change. Food
and Agriculture Organization of the United Nations (FAO). Food and Agricultural
Organisation. Accessible from: http://www.fao.org/nr/sustainability/food-loss-and-
waste/en/
FAO (Food and Agriculture Organization). 2016. Food loss and food waste. Food and Agriculture
Organization of the United Nations. Rome, Italy. Accessible at: http://www.fao.org/food-
loss-and-food-waste/en/
FAO. (Food and Agriculture Organization). 2014. Food Wastage Footprint: Full Cost-Accounting.
Food and Agriculture Organization of the United Nations (FAO). Food and Agricultural
Organisation. Accessible from: http://www.fao.org/3/a-i3991e.pdf
Food Chain Centre. 2007. Best Practice for Your Business: Completion Report; Food Chain Centre;
Institute of Grocery Distribution, England
FLWP (Food Loss and Waste Protocol). 2016. Food loss and waste accounting and reporting
standard. Food Loss and Waste Protocol. World Resources Institute. Washington DC, USA.
Accessible from: https://www.wri.org/sites/default/files/REP_FLW_Standard.pdf
Gooch, M. 2018. Measuring Food Loss and Waste; Presentation to the Second Food Loss and Waste
Measurement Expert Group Meeting, Commission for Environmental Cooperation, 14-16
August 2018 Ottawa, Ontario; Value Chain Management International
Gooch, M., Bucknell, D., Whitehead, P. 2018. Quantifying the Value of Packaging: As a Strategy to
Prevent Food Waste in America; AMERIPEN. Accessible from:
https://c.ymcdn.com/sites/www.ameripen.org/resource/resmgr/files/AMERIPEN-
WhitePaper-FoodWast.pdf
Gooch, M., Dent, B., Felfel, A.S., Vanclief, L., Whitehead, P. 2016. Food Waste: Aligning Government
and Industry within Value Chain Solutions. Value Chain Management International.
Accessible from: http://vcm-international.com/wp-content/uploads/2016/10/Food-Waste-
Aligning-Government-and-Industry-VCMI-Oct-4-2016.pdf

73
Gooch, M., Felfel, A. 2014. $27 Billion Revisited: The Cost of Canada’s Annual Food Waste. Value
Chain Management International. Accessible from: http://vcm-international.com/wp-
content/uploads/2014/12/Food-Waste-in-Canada-27-Billion-Revisited-Dec-10-2014.pdf
Gooch, M., Marenick, N., LaPlain, D., Dent, B. 2013. Cut waste, grow profit: reducing food waste by
addressing the disconnect between the attitude and behaviour of producers and managers
of businesses situated along the value chain. Value Chain Management International.
Oakville, Canada. Accessible at: https://vcm-international.com/wp-
content/uploads/2013/06/Cut-Waste-GROW-PROFIT-Food-and-Associated-Wastes-May-30-
2013.pdf
Gooch, M., Felfel, A., Marenick, N. 2010. Food Waste in Canada. Value Chain Management Centre,
George Morris Centre. Accessible from: http://vcm-international.com/wp-
content/uploads/2014/01/Food-Waste-in-Canada-November-2010.pdf
Gustavsson, J., Christel, C., Sonesson, U. 2011. Global Food Losses and Food Waste - Extent, Causes
and Prevention. SAVE FOOD: An Initiative on Food Loss and Waste Reduction. Dusseldorf,
Germany: FAO. doi:10.1098/rstb.2010.0126.
Halton Region. n.d. “Halton-Green Cart.”
http://www.halton.ca/living_in_halton/recycling_waste/curbside_collection/green_cart/#!r
c-cpage=wizard_material_list.
Hanson, Craig, and Peter Mitchell. 2017. “The Business Case for Reducing Food Loss and Waste.”
Champions 12.3, no. March: 1–24.
https://champs123blog.files.wordpress.com/2017/03/report_-business-case-for-reducing-
food-loss-and-waste.pdf.
Kummu M, de Moel H, Porkka M, Siebert S, Varis O, Ward PJ. (2012). Lost food, wasted resources:
Global food supply chain losses and their impacts on freshwater, cropland, and fertiliser use.
Science of the Total Environment. 2012; 438: 477–489. doi: 10.1016/j.scitotenv.2012.08.092
PMID: 23032564
National Geographic. 2018. “What the World Eats.” Accessed September 27.
https://www.nationalgeographic.com/what-the-world-eats/.
NZWC (National Zero Waste Council). 2018. A Food Loss and Waste Strategy for Canada; National
Zero Waste Council; Vancouver, Canada. Accessible at:
http://www.nzwc.ca/focus/food/national-food-waste-strategy/Documents/NZWC-
FoodLossWasteStrategy.pdf
ReFED. 2016. A Roadmap to Reduce U.S. Food Waste by 20 Percent. Rethink Food Waste Through
Economics and data. Washington DC, USA. Accessible at
http://www.refed.com/downloads/ReFED_Report_2016.pdf
Simons, D.W., Taylor, D. and Francis, M. 2003. Cutting costs – adding value to red meat. Food Chain
Centre in Partnership with the Red Meat Industry Forum. London, England.
74
Slavin, Terry. 2016. “Tesco CEO Heads up Global Food Waste Campaign Launched at Davos.” The
Guardian, January 21. https://www.theguardian.com/sustainable-
business/2016/jan/21/tesco-ceo-davos-food-waste-campaign-sustainable-development-
goals-climate-change.
Uzea, N., Gooch, M., Sparling, D. 2014. Developing an Industry Led Approach to Addressing Food
Waste in Canada; Provision Coalition; Guelph, Ontario. Accessible at:
https://provisioncoalition.com/assets/website/pdfs/Provision-Addressing-Food-Waste-In-
Canada-EN.pdf
WRAP. 2015. Estimates of Food and Packaging Waste in the UK Grocery Retail and Hospitality
Supply Chains; WRAP, England. Accessible at:
http://www.wrap.org.uk/sites/files/wrap/UK%20Estimates%20October%2015%20%28FINA
L%29_0.pdf

75
APPENDIX A: Gathering and Analysis of Data
This appendix describes how the mass balance analysis was conducted. It also provides more granular
insights into the research findings than are contained in the body of this report. The results provide a
robust and reliable indication of FLW levels occurring across the Canadian food system, and immediate
causes of FLW as reported by respondents. The findings did not lend themselves to the level of statistical
analysis required to produce defensible granular insights for individual crops at specific levels of the
value chain.
1 Primary Production Data
The mass balance inputs were populated using production data gathered from Statistics Canada (STC),
Agriculture and Agri-food Canada (AAFC) and Fisheries and Ocean Canada (FOC), along with data
provided by industry for sugar. Table A provides details regarding all the sources of production data that
formed the basis of the model used to calculate Canadian FLW.
Table A: Production Data Sources
Food Type Data Source
Dairy and Eggs Canadian Dairy Information Centre (2016) hectolitres converted to tonnes based on density of 1.03kg/litre Number of eggs sold for consumption from STC Table 32-10-0119-01 converted to tonnes based on an egg size of 56g
Field Crops STC Table 32-10-0359-01 provides the most comprehensive data for farm production of the major field crops produced across Canada. As this is a farm level estimation, the data likely includes significant animal feed production. Crops included in this data are barley, canola, oats, peas-dry, rye, soybeans, lentils, wheat, flaxseed, mixed grains, mustard seed, buckwheat, sunflower seed, triticale, beans-all dry (white and coloured), chick peas, fava beans, and corn for grain. Adjustment for animal feed – exports of wheat, barley and corn were subtracted from production, and then the percentages as reported by ANACAN were applied (80% barley, 60% corn and 30% wheat go to animal feed) to calculate the net availability. NB: because the exports of these grains have been tallied here, they have been excluded from the total export number. https://www.anacan.org/about-our-industry/canadian-feed-industry-statistics.html
Meat & Poultry Slaughter numbers and average carcass weights for beef, pork and lamb were gathered from AAFC red meat section data; poultry meat data is from STC Table 32-10-0117-01: Production and disposition of poultry meat. Goat and other specialty meats have not been included. Meat yields were used to estimate the total amount of meat produced, i.e. harvested product. The meat yields used were: Cattle – 66% Sheep – 54.4% Hogs – 69%

76
Production data for produce and sugars and syrups is gathered from 2016 Statistics Canada tables as follows:
Produce Greenhouse production – Table: 32-10-0456-01
Mushroom production – Table: 32-10-0356-01
Fresh and processed fruit production – Table: 32-10-0364-01
Potatoes – Table: 32-10-0358-01 (weight converted from hundredweight to metric tonnes (*.0508023)
Vegetables (non-greenhouse) – Table: 32-10-0365-01
Sugars and Syrups
Maple sugar production – Table: 32-10-0354-01 (maple products expressed as syrup (Gallons) converted to metric tonnes based on 1 gallon of syrup = 13.246 pounds and 1lbs = 0.453592kg)
Honey production – Table: 32-10-0353-01 (lbs converted to tonnes)
Tonnes of refined sugar from sugar beets – Canadian Sugar Industry Statistics
Marine A summation of aquaculture production and Ocean and Freshwater landings statistics provided by Fisheries and Oceans Canada. Data from 2015 (Ocean and Freshwater landings) and 2016 (Aquaculture) are the most recent available.
1.1 Imports and Exports Data
All import and export data was gathered from the Canadian International Merchandise Trade Database.
Using the harmonized system (HS) code exports and imports, the data was categorized into the food
types established by VCMI. By adding imports and subtracting exports, this adjusted the baseline to
establish the raw food product available to flow into the food system. It is acknowledged that the
imports and exports of prepared foods would occur further through the chain, and thus an adjustment
was made within the model prior to distribution to account for processed foods entering and exiting the
Canadian food system. The balance of exports and imports of prepared foods was added to the total
food available to enter into the retail and food service. Where possible, within the model, these
prepared foods were allocated to the appropriate food type. A miscellaneous prepared food type was
added at the point of distribution to account for a small amount of prepared food that could not be
attributed to one specific food category. The scope of the import/export data is summarized in Table B
below.
Table B: Import/Export Data Categorization
HS Chapter
Included Excluded
Dairy and Eggs 4
Milk, cheese, butter, yoghurt, fermented milk products, powdered milk and eggs (fresh and processed)
Fertilized eggs for incubation, edible products of animal origin, not elsewhere specified
Field Crops 10 7
12
All grains
Lentils, peas, beans, and leguminous vegetables
Oilseeds-soya beans, mustards seed, sunflower seed, rape or colza seed, linseed (flaxseed)
Seeds for sowing
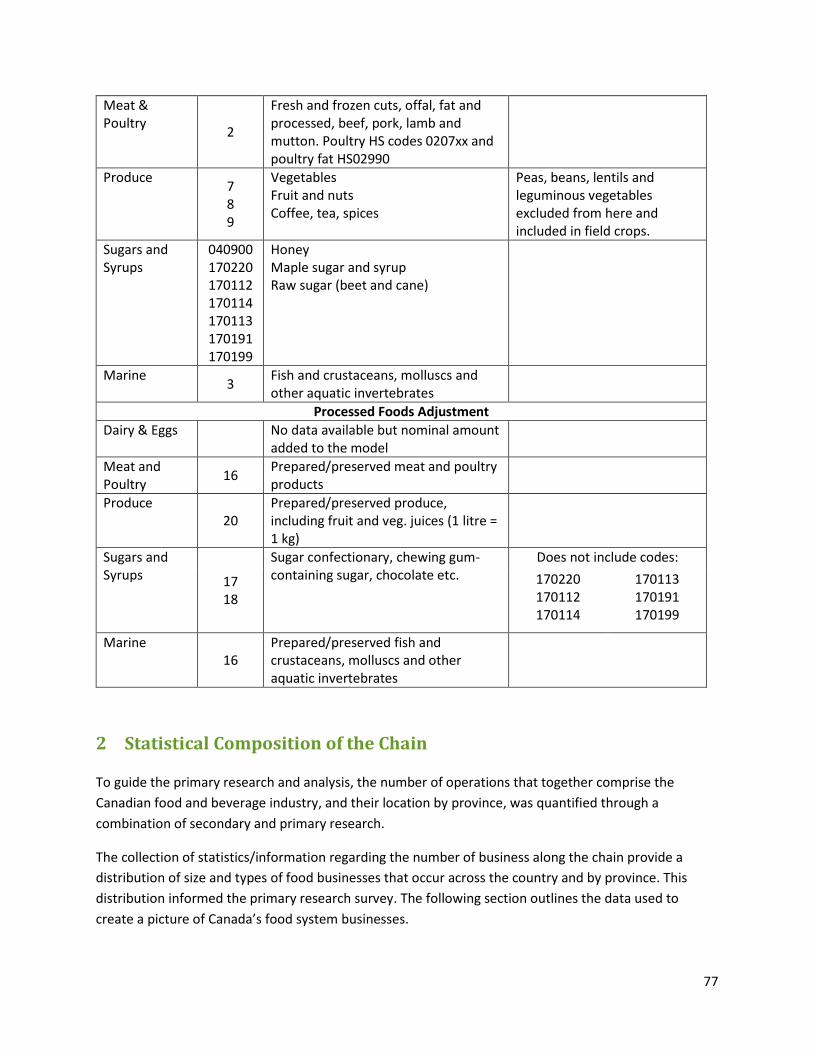
77
Meat & Poultry
2
Fresh and frozen cuts, offal, fat and processed, beef, pork, lamb and mutton. Poultry HS codes 0207xx and poultry fat HS02990
Produce 7 8 9
Vegetables Fruit and nuts Coffee, tea, spices
Peas, beans, lentils and leguminous vegetables excluded from here and included in field crops.
Sugars and Syrups
040900 170220 170112 170114 170113 170191 170199
Honey Maple sugar and syrup Raw sugar (beet and cane)
Marine 3
Fish and crustaceans, molluscs and other aquatic invertebrates
Processed Foods Adjustment
Dairy & Eggs
No data available but nominal amount added to the model
Meat and Poultry
16 Prepared/preserved meat and poultry products
Produce 20
Prepared/preserved produce, including fruit and veg. juices (1 litre = 1 kg)
Sugars and Syrups 17
18
Sugar confectionary, chewing gum-containing sugar, chocolate etc.
Does not include codes:
170220 170112 170114
170113 170191 170199
Marine 16
Prepared/preserved fish and crustaceans, molluscs and other aquatic invertebrates
2 Statistical Composition of the Chain
To guide the primary research and analysis, the number of operations that together comprise the
Canadian food and beverage industry, and their location by province, was quantified through a
combination of secondary and primary research.
The collection of statistics/information regarding the number of business along the chain provide a
distribution of size and types of food businesses that occur across the country and by province. This
distribution informed the primary research survey. The following section outlines the data used to
create a picture of Canada’s food system businesses.
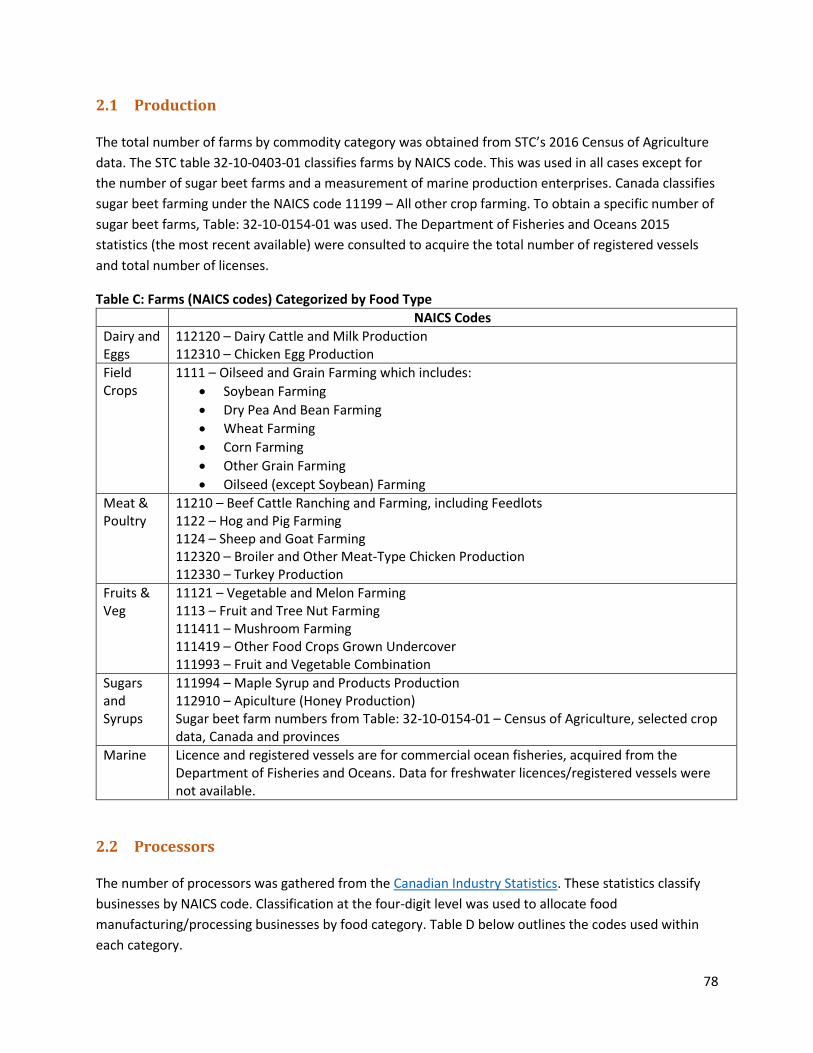
78
2.1 Production
The total number of farms by commodity category was obtained from STC’s 2016 Census of Agriculture
data. The STC table 32-10-0403-01 classifies farms by NAICS code. This was used in all cases except for
the number of sugar beet farms and a measurement of marine production enterprises. Canada classifies
sugar beet farming under the NAICS code 11199 – All other crop farming. To obtain a specific number of
sugar beet farms, Table: 32-10-0154-01 was used. The Department of Fisheries and Oceans 2015
statistics (the most recent available) were consulted to acquire the total number of registered vessels
and total number of licenses.
Table C: Farms (NAICS codes) Categorized by Food Type
NAICS Codes
Dairy and Eggs
112120 – Dairy Cattle and Milk Production 112310 – Chicken Egg Production
Field Crops
1111 – Oilseed and Grain Farming which includes:
Soybean Farming
Dry Pea And Bean Farming
Wheat Farming
Corn Farming
Other Grain Farming
Oilseed (except Soybean) Farming
Meat & Poultry
11210 – Beef Cattle Ranching and Farming, including Feedlots 1122 – Hog and Pig Farming 1124 – Sheep and Goat Farming 112320 – Broiler and Other Meat-Type Chicken Production 112330 – Turkey Production
Fruits & Veg
11121 – Vegetable and Melon Farming 1113 – Fruit and Tree Nut Farming 111411 – Mushroom Farming 111419 – Other Food Crops Grown Undercover 111993 – Fruit and Vegetable Combination
Sugars and Syrups
111994 – Maple Syrup and Products Production 112910 – Apiculture (Honey Production) Sugar beet farm numbers from Table: 32-10-0154-01 – Census of Agriculture, selected crop data, Canada and provinces
Marine Licence and registered vessels are for commercial ocean fisheries, acquired from the Department of Fisheries and Oceans. Data for freshwater licences/registered vessels were not available.
2.2 Processors
The number of processors was gathered from the Canadian Industry Statistics. These statistics classify
businesses by NAICS code. Classification at the four-digit level was used to allocate food
manufacturing/processing businesses by food category. Table D below outlines the codes used within
each category.

79
Table D: Processing and Manufacturing Categorization by Food Type
Includes Comments
Dairy and Eggs
3115 – Dairy Product Manufacturing There is no food manufacturing for eggs.
Field Crops
3112 – Grain and Oilseed Milling 3118 – Bakeries and Tortilla Manufacturing
Meat & Poultry
3116 – Meat Product Manufacturing Includes secondary processing
Fruits & Veg
3114 – Fruit and Veg. Preserving and Specialty Food Manufacturing
31141 – Frozen Food Manufacturing 31142 – Fruit and Veg Canning, Pickling and
Drying
Sugars and Syrups
Although there is a NAICS code 3113 for Sugar and Confectionary Product Manufacturing, we did not include this category, as sugar and syrups go into many streams/food products.
Marine 3117 – Seafood Product Preparation and Packaging
2.3 Distribution Centres/Wholesalers
Major retail and foodservice distribution centres were researched by VCMI contacting corporations
individually. This information is confidential and therefore not presented. Food wholesalers’ numbers
were sourced from Canadian Industry Statistics. This provided an indication of the location and number
of wholesalers and distribution centres across the country.
The Canadian Industry Statistics categorize wholesalers by food category; VCMI allocated them by food
types as per Table E below.

80
Table E: Wholesalers Categorized by Food Type
Food Category Included (NAICS) Comments/Notes
Dairy and Eggs Dairy 41312 & Eggs and Poultry 41313
This includes poultry wholesalers as eggs and poultry are combined in NAICS 41313
Field Crops No specific wholesale NAICS code
Bakery and pasta wholesalers are included in the description of 41319 “Other Specialty – Line Food Merchant Wholesalers”
Meat & Poultry Red Meat and Meat Product Merchant Wholesalers– 41316
Fruits & Veg Fresh Fruit and Veg – 41315
Sugars and Syrups No specific wholesale NAICS code
Candy, syrups wholesalers are included in the description of 41319 “Other Specialty – Line Food Merchant Wholesalers”
Marine Fish and Seafood – 41314
Canada Total (no specific food type)
General-Line Food Merchant Wholesalers – 41311
Other Specialty-Line Food Merchant Wholesalers –41319
2.4 Food Retailers
The Canadian Industry Statistics also provided the data of numbers of food retailers across the country.
These include Grocery Stores, Convenience Stores, Specialty Food Stores, Beer, Wine and Liquor Stores.
As the majority of food retailers are generalists, they were not allocated to specific food types.
2.5 Food Service
Canadian Industry Statistics’ NAICS codes listed in Table F were used to gather data on the foodservice industry.
Table F: Foodservice NAICS Codes
VCMI Food Service Categories NAICS Code and Label
Hotels 7211 – Traveller Accommodation
Food Service Contractors 72231 – Food Service Contractors
Restaurants/QSR 7225 – Full Service Restaurants
Catering/Event Services 72232 – Caterers
Beverage 7224 – Drinking Establishments

81
2.6 Food Rescue
The number of organizations involved in food rescue was researched and provided to VCMI by Second
Harvest staff.
3 Data Analysis
3.1 FLW Measurement through the Chain
The research team expected that measurement of FLW would increase through the chain as the value of
food increases. This was generally true, the clear exception being foodservice (Figure A). The responses
from the survey were divided into those who responded yes or no to the question: “Do you measure
FLW?” They were then further subdivided into those that gave data on their FLW. Lack of response in
FLW values did not correlate with continued lack of response to other questions throughout the survey.
Respondents were given the option to give FLW data in any of the following ways: head (for livestock),
tonnes, litres, percentage, value, and other (please specify). Of those that did provide FLW data, the
majority responded with a percentage. Value was the next most prevalent metric provided. Some
respondents provided the measure in more than one metric: volume, percentage and value.
In primary production, those respondents producing storable produce and poultry were the most likely
to measure FLW. Fifty-nine percent of storable produce producers measure FLW; 54 percent of poultry
producers measure FLW. Approximately 30 percent of producers in the other primary production
categories measure FLW.

82
Figure A: Measurement of FLW through the Chain: Do you measure FLW?1
3.2 Model Development
Losses reported from the survey were applied to the baseline data to provide a roll throughput yield of
the food system. Where possible, percentage loss was calculated from the data given, or used directly if
a percentage was provided. Estimates of FLW are based on conservative losses, unless validated during
interviews. The loss factors were applied at each stage through the chain to give a tonnage loss. At the
point of distribution, food was divided into two streams: retail and HRI. Based on information provided
by interviewees, it was determined that 65 percent of food is sold through retail and 35 percent is sold
through HRI. Loss factors were applied to the consumer-facing sectors and household consumption,
culminating in a total loss throughout the chain.
3.2.1 Household Waste Calculation
Household waste audits were outside the scope of this project. Therefore, secondary data was used to
provide an indication of the food waste that occurs at the household level.
Statistics Canada (STC) provides data on Food Available in Canada (per person). This statistic is
calculated by dividing the domestic disappearance by the Canadian population as of July 1 of the
reference year. However, the domestic disappearance by the Canadian population does not allow for
1 This question was not directly asked of Food Rescuers.
0%
10%
20%
30%
40%
50%
60%
70%
80%
90%
100%
Primary Production Packer, Processor,Manufacturing
Distribution Retail Food Service
Yes-Data Yes-No Data Given No-But an Estimate Provided No-No Data

83
losses at the retail level, in households, restaurants or institutions during storage and preparation, or for
unconsumed food.
Therefore, STC introduced the food available adjusted for losses. These are losses that occur in the
storage, preparation and cooking of the food, as well as the food that makes it to the plate but not
consumed, or plate loss. These losses can occur in the retail store, home, restaurants or institutions. The
objective is to provide a proxy of fork-level consumption based on food supply data.
However, STC provides the losses happening from the retail weights (the domestic disappearance) to
the fork-level consumption as one number. For this project, we needed to have an estimate of the waste
happening at the household level only. We found the Economics Research Services (ERS) of the United
States Department of Agriculture (USDA) provides estimates for the food waste happening at the two
levels.
Assuming that there are significant similarities between the Canadian food retail industry and the US
food retail industry, as well as between the Canadian consumer behavior towards food wastage and the
US consumer, we decided to use the ERS’s estimated food waste distribution between the two levels in
order to breakdown STC’s food waste estimation, which combines the two levels together. We thus
applied ERS’s estimated food waste distribution to the STC’s estimated losses that occur in the supply
chain downstream. As a result, we were able to estimate the household level of food waste, and this is
the data that was used in the model for household waste. The losses that occur in retail and food service
(HRI2) were gathered from the survey data.
3.3 Calculation of FLW
Table G below provides the loss factors used at each stage of the chain, and shows the volume of loss at
each point in the chain, classifying FLW as planned or unplanned. As shown, the analysis of secondary
production data estimated 60.9 million metric tonnes enters the food chain.
As per Table H, the application of these loss factors in the mass balance model calculated the total
tonnage of waste deriving from the whole food chain to be 35.5 million. As mentioned previously from
the loss factors indicated via survey responses, we erred on the conservative side, in part to recognize
that not all products go through both processing and further manufacturing.
2 Hotels, Restaurants and Institutions
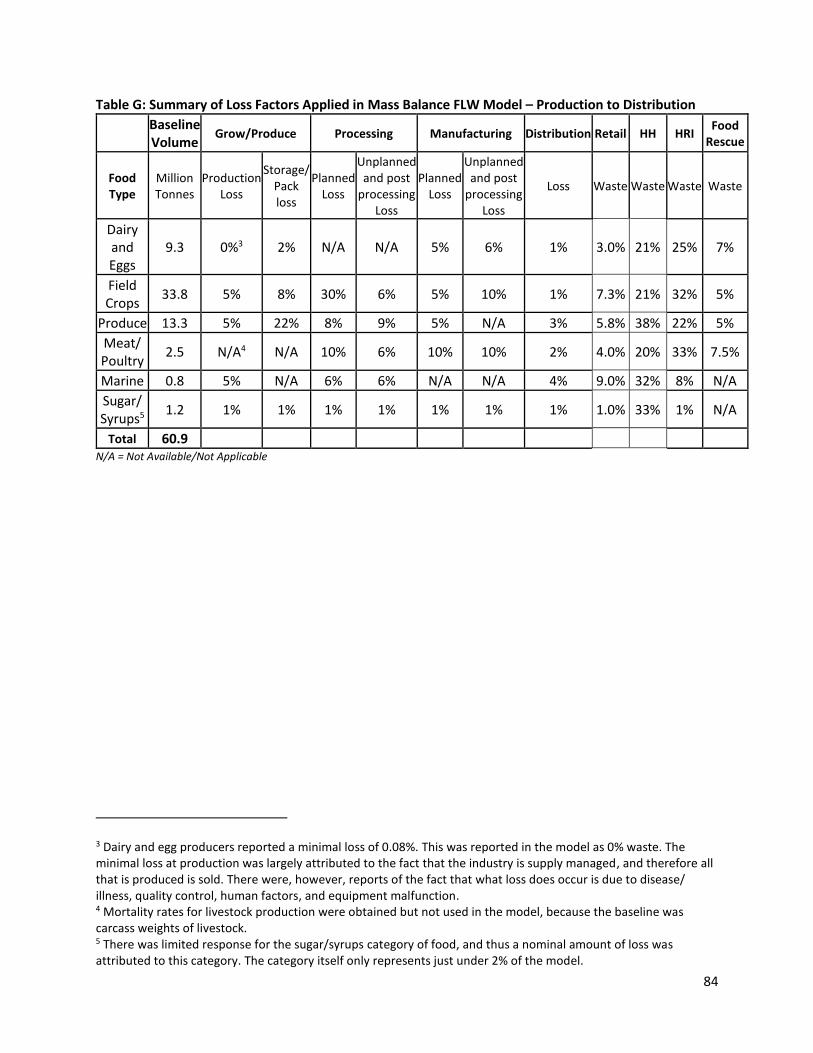
84
Table G: Summary of Loss Factors Applied in Mass Balance FLW Model – Production to Distribution
Baseline Volume
Grow/Produce Processing Manufacturing Distribution Retail HH HRI Food
Rescue
Food Type
Million Tonnes
Production Loss
Storage/ Pack loss
Planned Loss
Unplanned and post
processing Loss
Planned Loss
Unplanned and post
processing Loss
Loss Waste Waste Waste Waste
Dairy and Eggs
9.3 0%3 2% N/A N/A 5% 6% 1% 3.0% 21% 25% 7%
Field Crops
33.8 5% 8% 30% 6% 5% 10% 1% 7.3% 21% 32% 5%
Produce 13.3 5% 22% 8% 9% 5% N/A 3% 5.8% 38% 22% 5%
Meat/ Poultry
2.5 N/A4 N/A 10% 6% 10% 10% 2% 4.0% 20% 33% 7.5%
Marine 0.8 5% N/A 6% 6% N/A N/A 4% 9.0% 32% 8% N/A
Sugar/ Syrups5
1.2 1% 1% 1% 1% 1% 1% 1% 1.0% 33% 1% N/A
Total 60.9
N/A = Not Available/Not Applicable
3 Dairy and egg producers reported a minimal loss of 0.08%. This was reported in the model as 0% waste. The minimal loss at production was largely attributed to the fact that the industry is supply managed, and therefore all that is produced is sold. There were, however, reports of the fact that what loss does occur is due to disease/ illness, quality control, human factors, and equipment malfunction. 4 Mortality rates for livestock production were obtained but not used in the model, because the baseline was carcass weights of livestock. 5 There was limited response for the sugar/syrups category of food, and thus a nominal amount of loss was attributed to this category. The category itself only represents just under 2% of the model.

85
Table H: FLW throughout the Chain by Food Category (Million Tonnes)6
We used the reports of unplanned and post-processing loss waste as a proxy for avoidable and therefore potentially edible waste, as this waste,
had it not occurred, would have resulted in edible products. Production, storage and pack loss were classified as unavoidable losses, as much of
production loss is due to weather, pest and disease. However, when calculating the edible FLW we did make an adjustment to the produce sector,
as we heard, during the research, of edible crops being left in the field unharvested, due to market reasons as opposed to the crop not being
viable. We allocated 5 percent loss in production of produce that is avoidable/potentially edible loss.
6 Totals may not add up due to rounding.
Food TypeUnplanned
Loss
Planned
Loss
Storage
/ Pack
loss
Planned
Loss
Unplanned
and post
processing
Loss
Planned
Loss
Unplanned
and post
processing
Loss
Loss WastePrep
waste
Plate
Waste
Prep
waste
Plate
Waste
Dairy and
Eggs0.00 0.00 0.14 0.00 0.00 0.46 0.52 0.08 0.16 0.53 0.48 0.35 0.31 3.03 7%
Field Crops 0.00 1.69 2.65 8.84 1.24 0.97 1.84 0.17 0.78 1.05 0.94 0.93 0.78 21.89 5%
Produce 0.66 0.66 2.77 0.74 0.82 0.41 0.00 0.23 0.28 0.85 0.69 0.28 0.25 8.63 5%
Meat/
Poultry0.00 0.00 0.00 0.25 0.14 0.22 0.19 0.04 0.05 0.11 0.10 0.10 0.08 1.28 7.50%
Marine 0.00 0.04 0.00 0.05 0.04 0.00 0.00 0.03 0.04 0.07 0.06 0.01 0.01 0.34 N/A
Sugar/
Syrups0.00 0.01 0.01 0.01 0.01 0.01 0.01 0.01 0.01 0.15 0.12 0.00 0.00 0.36 N/A
Total 0.66 2.41 5.57 9.89 2.25 2.07 2.57 0.55 1.31 2.76 2.38 1.68 1.44 35.54
Grow/Produce Processing Manufacturing DistributionConsumer
(HH)HRI Total FLW
occurring
along the
food value
chain
Losses (%)
occurring
during Rescue
and
Redistribution
Retail

86
A considerable amount of loss occurs in production, processing and manufacturing. A total of 69 percent
of FLW occurs in the production, processing and manufacturing sectors. All of the loss occurring in
primary production was considered to be unavoidable; however, an adjustment was made in the
calculation of avoidable/potentially edible FLW in order to account for produce crops that are left in the
field unharvested, as this was highlighted through the research as an area of potentially edible FLW.
3.4 Valuing FLW
Statistics Canada reported that retail food sales for 2016 were $95.5 billion7 and food service receipts
were $62.2 billion.8 We estimated, via the model, that 21.9 million tonnes are sold through retail9 and
12.5 million tonnes sold through HRI. Thus, we calculated the average price per tonne of food at retail to
be $4,351, and at HRI to be $4,967. The retail value is applied to loss and waste occurring at all levels of
the chain except HRI.
As reported above, the model calculated that Canada produces a total of 35.5 million tonnes of FLW per
year; an estimated 11.17 million tonnes of which is unplanned/avoidable and therefore potentially
edible waste. Based on our value of food per tonne, the value of avoidable, potentially edible waste is
$49.46 billion. Of this waste, $10.37 billion is wasted at the household level, while $39.1 billion is a cost
to businesses within the value chain (Table I).
Table I: Volume and Value of Avoidable, Potentially Edible Waste
Chain Location Volume (million tonnes)
Value ($ billion)
Production (Produce) 0.66 2.88
Processing 2.25 9.78
Manufacturing 2.57 11.17
Distribution 0.55 2.41
Retail 1.31 5.70
Household 2.38 10.37
HRI 1.44 7.14
TOTAL 11.17 49.46
7 Statistics Canada. Table 20-10-0008-01 Retail trade sales by province and territory (x 1,000). Sales from grocery stores and specialty food stores, seasonally adjusted. 8 Statistics Canada. Table 21-10-0019-01 Monthly survey of food services and drinking places (x 1,000). Receipts from food services excluding drinking places, seasonally adjusted. 9 After retail losses.
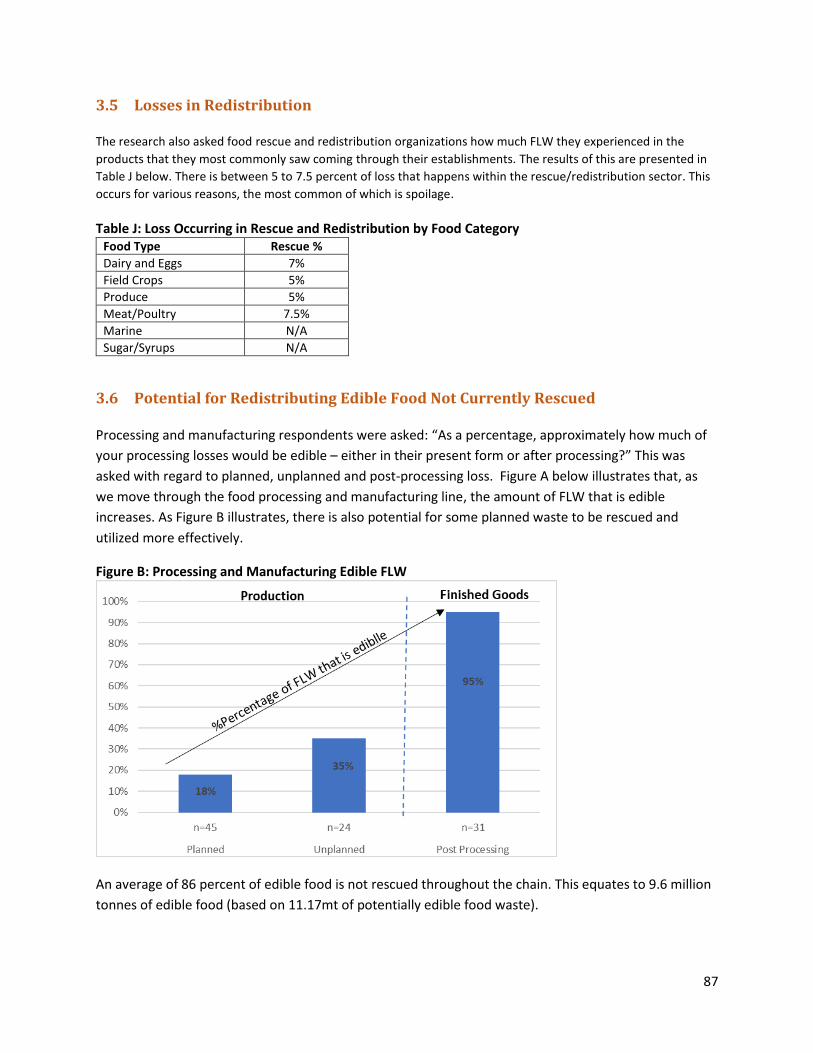
87
3.5 Losses in Redistribution
The research also asked food rescue and redistribution organizations how much FLW they experienced in the
products that they most commonly saw coming through their establishments. The results of this are presented in
Table J below. There is between 5 to 7.5 percent of loss that happens within the rescue/redistribution sector. This
occurs for various reasons, the most common of which is spoilage.
Table J: Loss Occurring in Rescue and Redistribution by Food Category Food Type Rescue %
Dairy and Eggs 7%
Field Crops 5%
Produce 5%
Meat/Poultry 7.5%
Marine N/A
Sugar/Syrups N/A
3.6 Potential for Redistributing Edible Food Not Currently Rescued
Processing and manufacturing respondents were asked: “As a percentage, approximately how much of
your processing losses would be edible – either in their present form or after processing?” This was
asked with regard to planned, unplanned and post-processing loss. Figure A below illustrates that, as
we move through the food processing and manufacturing line, the amount of FLW that is edible
increases. As Figure B illustrates, there is also potential for some planned waste to be rescued and
utilized more effectively.
Figure B: Processing and Manufacturing Edible FLW
An average of 86 percent of edible food is not rescued throughout the chain. This equates to 9.6 million
tonnes of edible food (based on 11.17mt of potentially edible food waste).
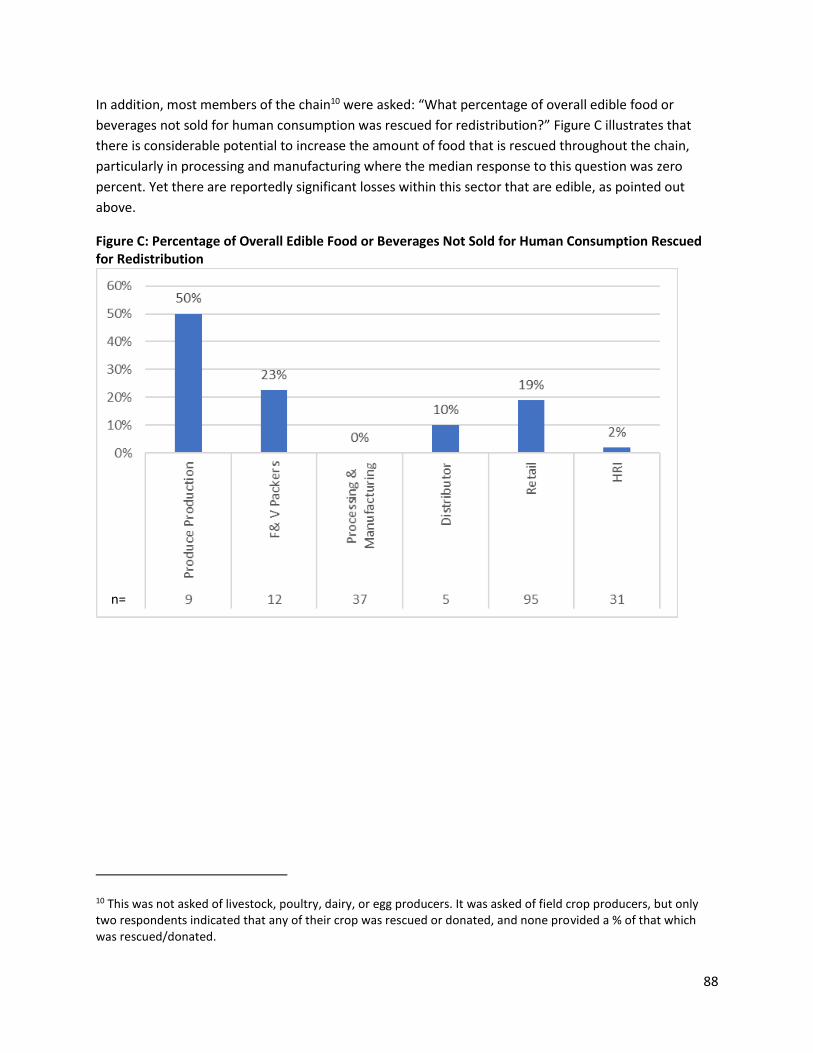
88
In addition, most members of the chain10 were asked: “What percentage of overall edible food or
beverages not sold for human consumption was rescued for redistribution?” Figure C illustrates that
there is considerable potential to increase the amount of food that is rescued throughout the chain,
particularly in processing and manufacturing where the median response to this question was zero
percent. Yet there are reportedly significant losses within this sector that are edible, as pointed out
above.
Figure C: Percentage of Overall Edible Food or Beverages Not Sold for Human Consumption Rescued for Redistribution
10 This was not asked of livestock, poultry, dairy, or egg producers. It was asked of field crop producers, but only two respondents indicated that any of their crop was rescued or donated, and none provided a % of that which was rescued/donated.
n=
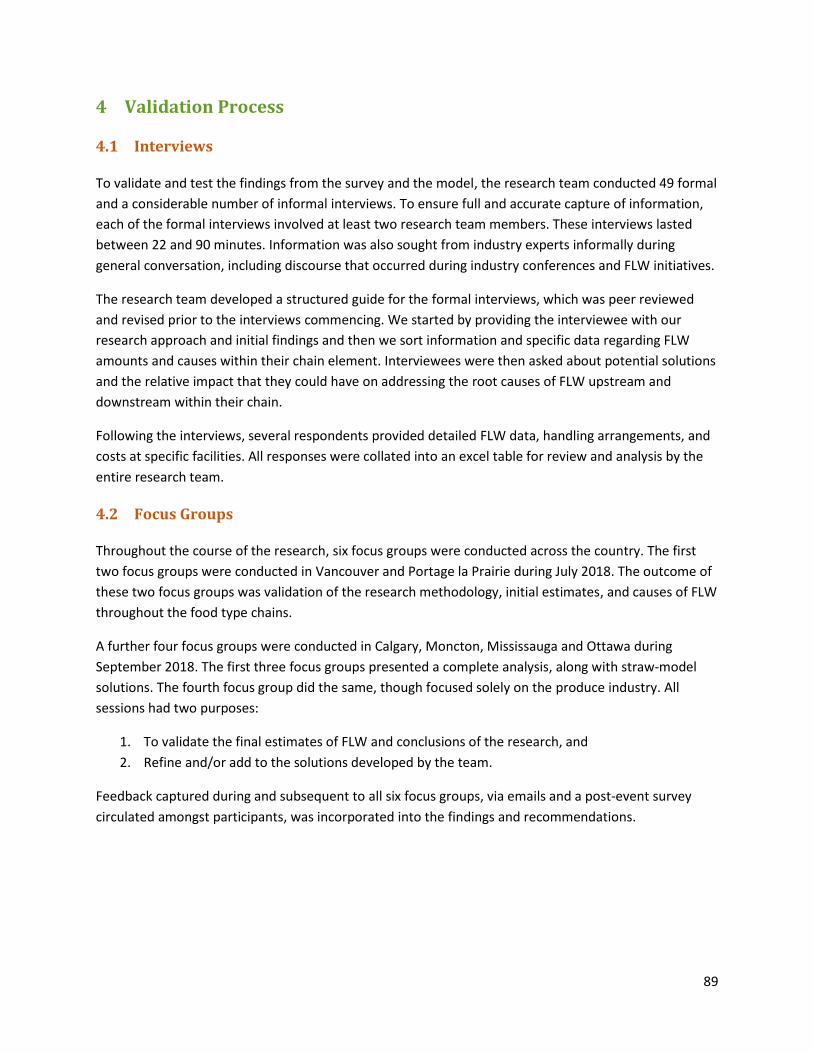
89
4 Validation Process
4.1 Interviews
To validate and test the findings from the survey and the model, the research team conducted 49 formal
and a considerable number of informal interviews. To ensure full and accurate capture of information,
each of the formal interviews involved at least two research team members. These interviews lasted
between 22 and 90 minutes. Information was also sought from industry experts informally during
general conversation, including discourse that occurred during industry conferences and FLW initiatives.
The research team developed a structured guide for the formal interviews, which was peer reviewed
and revised prior to the interviews commencing. We started by providing the interviewee with our
research approach and initial findings and then we sort information and specific data regarding FLW
amounts and causes within their chain element. Interviewees were then asked about potential solutions
and the relative impact that they could have on addressing the root causes of FLW upstream and
downstream within their chain.
Following the interviews, several respondents provided detailed FLW data, handling arrangements, and
costs at specific facilities. All responses were collated into an excel table for review and analysis by the
entire research team.
4.2 Focus Groups
Throughout the course of the research, six focus groups were conducted across the country. The first
two focus groups were conducted in Vancouver and Portage la Prairie during July 2018. The outcome of
these two focus groups was validation of the research methodology, initial estimates, and causes of FLW
throughout the food type chains.
A further four focus groups were conducted in Calgary, Moncton, Mississauga and Ottawa during
September 2018. The first three focus groups presented a complete analysis, along with straw-model
solutions. The fourth focus group did the same, though focused solely on the produce industry. All
sessions had two purposes:
1. To validate the final estimates of FLW and conclusions of the research, and
2. Refine and/or add to the solutions developed by the team.
Feedback captured during and subsequent to all six focus groups, via emails and a post-event survey
circulated amongst participants, was incorporated into the findings and recommendations.

90
4.3 Case Studies
A number of respondents participated in the development of case studies designed to demonstrate how
the measurement process can work at the level of individual value chains. Working with individual
respondents became part of the data validation process.
The first of the case studies is presented below. Other case studies, which include an illustration of using
the reporting process to convey what can be achieved when action is taken to reduce FLW, will be made
available as separate documents. A blank template for completion by businesses and FLW researchers
will also be available as a download.
4.3.1 Onion Chain
We were able to gather information from one respondent that spanned the value chain from production
to distribution. We then adjusted the retail loss factor at retail to be more representative of a storable
produce product, and applied the household loss calculated for onions and shallots within our HH waste
calculation and applied the produce HRI FLW factor. Below is a comparison of the FLW calculated
through the model and that which was calculated using the onion case study.
In the onion case study the various losses were:
10% loss at production was attributed to agricultural issues, such as weather and disease;
10% was attributed to crop left in the field due to size and some mechanical damage;
10% in store loss was due to shrink from drying/curing;
10% during grading packing to meet customer specifications;
Post grading/pack loss was “insignificant,” so we allocated 1% to cover the likelihood that some
losses would occur; and
Distribution loss was also indicated as “rare” so we allocated 0.5%.
At retail, as onions are a relatively resilient storable product, we allocated a loss factor of approximately
half the overall produce loss factor. As mentioned above, household waste was taken from our
calculation from Statistics Canada data, and HRI loss was the same as produce as we had no specific
onion data to substitute into the case study.

91
Table K: Losses through the Chain Onion Case Study Compared with Produce Calculation
Being a more storable and robust product (highlighted in the table above), the overall loss through the
chain for onions is less than that of the collective produce chain. There is a 7 percent difference between
the total FLW identified in the industry analysis versus the case study – 65 percent versus 58 percent,
respectively.
In addition to loss factor information, we acquired information regarding the causes of the losses and
the percentage of those losses that go to various destinations.
4.4 Model Validation and Comparisons
In addition to validating the model inputs of loss factors through the interview and focus group process,
the research team looked at previous research and sources – such as Canadian and US businesses, NGOs
and government representatives – to provide insights and ensure that our numbers were accurate.
The output of the model estimated that the total food consumed in Canada after preparation waste was
2.02kg/pp/day. National Geographic reports that in Mexico daily food utilization is 1.8kg, while in the US
it is 2.7kg (National Geographic, 2018). Our estimation of 2.02kg for Canada is within this range
We compared the percentages of overall waste calculated from our model with those found in the UK.
It is evident from Figure D that a key difference is the household and processing/manufacturing waste.
The fact that the household waste calculated in the UK was collected from household waste audits
suggests that our household waste based on secondary data may be highly conservative.
Food Type BaselineUnplanned
LossPlanned Loss
Storage/
Pack loss
Planned
Loss
Unplanned and
post
processing Loss
Planned
Loss
Unplanned
and post
processing
Loss
Loss Waste Prep wastePlate
WastePrep waste
Plate
Waste
5% 5% 22% 8% 9% 5% N/A 3% 5.80% 19% 19% 11% 11% 65% 5%
Produce
(MMT)13.3 0.66 0.66 2.77 0.74 0.82 0.41 0.00 0.23 0.28 0.85 0.69 0.28 0.25 8.63 5%
On-Farm Distribution Retail
Harvest lossUnplanned
loss
Storage/
Curing
Loss
Grading
Loss
Post Grading/
Packing Loss
Planned
Loss
Post
processingLoss
Store
lossesPrep waste
Plate
WastePrep waste
Plate
Waste
10% 10% 10% 10% 1% N/A N/A 0.5% 3% 22.5% 22.5% 11% 11% 58%
Tonnes 8181 818 736 663 596 54 0 0 27 103 750 581 204 181 4713
Not meeting
size of
required
product
Lot sizes
Drying/
Curing/
Moving
Grading
for Size
Too many days
on hand
Too Many Days
in DC
Moisture
lossFood Prep
Serving
Size
Too many days
in on hand
Mechanical
DamageBacterial Rot
Damaged in
Transit
Damage
from
handling
Damage from
handling
RotGrowth
Defects
20%
20% 80% 80%
100% 100% 80% 100%
80% 20% 20%
Land application
Landfill
Sewer
Loss Factor
Loss Factor
Exact destination will differ according to location.
Most impactful root causes of FLW, listed in order of impact
Rescue / gleaning
Animal feed
Biomaterial processing
Compost / anaerobic
Controlled combustion
5%
50%
50%
50%
50%
Root Cause
#1
#2
Consumer (HH)Processing/Manuf. HRITotal FLW occurring
along the food
value chain
Losses (%)
occurring at
Rescue
Storage/Curing/Grading / packing
N/A
mostly
moisture
loss
NA
NA
#3
Waste Destinations
Retail Consumer (HH) HRI
Total FLW occurring
along the food
value chain
Losses (%)
occurring at
Rescue
Onions Case Study
Grow/Produce Processing Manufacturing Distribution

92
Figure D: Total Waste by Sector – Canada and the UK
Canada

93
A comparison between the data calculated by Buzby et al (2014) for the US and the equivalent
calculated by VCMI is presented below. The difference between the two is only 130 and 140
grams/person/day. These results are very close, and the difference could be attributed to a number of
factors. They include our conservative loss factors through the chain, the allocation of food to retail and
HRI after distribution, or simply a difference in consumption over time or in a different country.
Drawing on the data presented in Buzby, Wells, and Hyman 2014, we compared the amount of food
supplied at retail and consumed in the household. The difference in both cases is just over 100 grams.
This model validation and comparisons suggest that it is a reasonable estimation of the FLW that occurs
through the Canadian food system and can be refined and improved with increased measurement,
resulting in more accurate loss and waste factors. It follows that if we know how much is being
produced and consumed, then the difference remaining is FLW.
Table L: Model Output Comparison
Food: (person/day) Food Supply at Retail (kg)
Household Consumption (kg)
Foodservice Consumption (kg)
Buzby et al (2014) 1.73 1.20 N/A
VCMI (2018) 1.86 1.34 0.77
Difference 0.13 0.14

94
5 Reported Causes of FLW
5.1 Production
The primary cause of loss (as per Figure E) reported in production is from pest, disease and infections.
This cause was a particularly prominent amongst respondent livestock producers, followed by
respondents from the produce sector. The produce sector also accounted for the widest array of causes,
the second and third most impactful causes after pest and disease being grading, followed by
storage/inventory.
Figure E: Causes of Waste in Production by food type
5.2 Processing and Manufacturing
Poor quality inputs were the most commonly cited issue for FLW in the processing and manufacturing
sector (see Figure F). This was reported for all food types except for sugars/syrups. Date code and
human factors were the next most equally common cited causes. Human factors being reported by all
food types and date code by all except sugar/syrups.
0 5 10 15 20 25 30 35 40
Customer (over) specifications
Deliberate over production
Quality control/specifications
Inaccurate forecasts
Human factors
Grading/quality control
Equipment malfunction/failure
Storage/inventory losses
Pests, diseases, infections
Dairy
Grains
Marine
Meat/Poultry
Produce
Sugar/Syrups
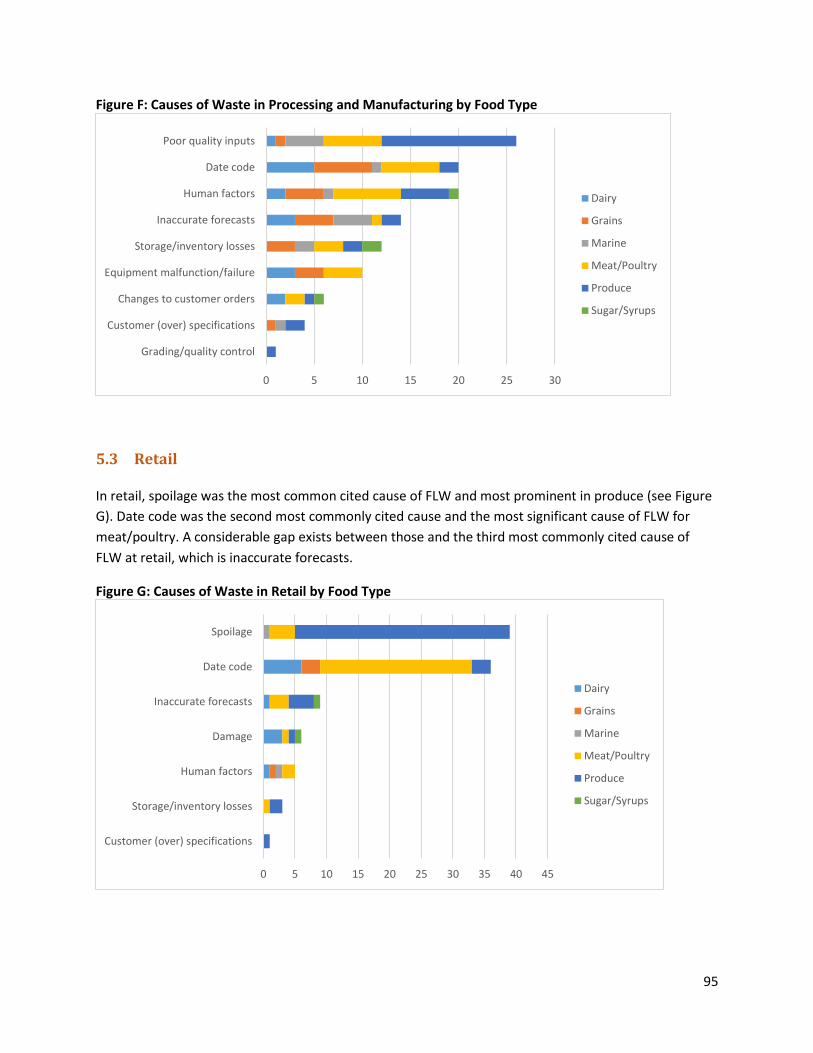
95
Figure F: Causes of Waste in Processing and Manufacturing by Food Type
5.3 Retail
In retail, spoilage was the most common cited cause of FLW and most prominent in produce (see Figure
G). Date code was the second most commonly cited cause and the most significant cause of FLW for
meat/poultry. A considerable gap exists between those and the third most commonly cited cause of
FLW at retail, which is inaccurate forecasts.
Figure G: Causes of Waste in Retail by Food Type
0 5 10 15 20 25 30
Grading/quality control
Customer (over) specifications
Changes to customer orders
Equipment malfunction/failure
Storage/inventory losses
Inaccurate forecasts
Human factors
Date code
Poor quality inputs
Dairy
Grains
Marine
Meat/Poultry
Produce
Sugar/Syrups
0 5 10 15 20 25 30 35 40 45
Customer (over) specifications
Storage/inventory losses
Human factors
Damage
Inaccurate forecasts
Date code
Spoilage
Dairy
Grains
Marine
Meat/Poultry
Produce
Sugar/Syrups

96
5.4 HRI
Date code, preparation waste, and inaccurate forecasts were all equally reported as contributing to FLW
in the HRI sector (see Figure H). Date code was most common for grains. Preparation waste was most
common in produce. As per responses received, inaccurate forecasts affect all four food types; the food
type most commonly affected by inaccurate forecasts being produce.
Figure H: Causes of Waste in HRI by Food Type
0 1 2 3 4 5 6
Storage/inventory losses
Plate waste
Human factors
Inaccurate forecasts
Preparation waste
Date code
Dairy
Grains
Meat/Poultry
Produce
97
APPENDIX B – Methodology
1 The Methodological Approach
The overall methodology followed in this project was designed to analyze food loss and waste (FLW)
from the perspective of industry stakeholders, by gathering first-hand experiences of those that
participated in the research – the respondents. This is known as social constructivism. Such
methodologies enable researchers to interpret findings from the key perspectives and experiences of
individuals involved in the industry. It provides a means to quantifying FLW from an industry/food
system perspective, and produces practical and sustainable recommendations to which stakeholders
respond constructively.
The whole chain approach to waste minimization adopted in this study was tested in the UK by the Food
Chain Centre (FCC), which operated at IGD (Institute of Grocery Distribution) between 2002 and 2007.
The aims of the FCC included the development of food chain analysis from farm to point of sale, in order
to identify how efficiency savings can be made to the benefit of all players. This resulted in reported
savings of £14.4 million amongst those that participated in the programs offered by the FCC over its
years of operation. Approximately 100 business participated. The reported savings do not consider the
ongoing savings that have potentially been realized by the continued implementation and improvement
of lean processes established by the FCC team in conjunction with the involved business. FCC’s work was
grounded in tried and tested business improvement methods that were little known or applied in the
food industry at the time. This has, in effect, provided us with a “proof of concept” that we expanded
upon in this approach.
This research estimated FLW across the Canadian Food System and assessed the root causes of FLW in
order to provide solutions to the issue of FLW. This was done using value chain analysis (VCA) and a
mass balance model, detailed in Section 2 and 2.3, respectively. VCA provides a clear method for
understanding complex commercial systems. In combination with mass balance, it provides a means of
effectively outlining where and why FLW occurs throughout the food system. The research required to
complete the VCA and mass balance was conducted between January and September 2018.
The following sections begin by comparing the methodological approach adopted for this study versus
prior FLW research conducted in Canada and elsewhere. This is followed by a discussion of the VCA
process and its value for addressing FLW, the analytical framework, the project’s scope, and the
establishment of the mass balance baseline.
1.1 FLW Methodological Comparison
The following section describes how the methodology built upon prior research methods employed by
Canadian and international organizations, and resulting materials. Previously released FLW reduction
strategies, such as the National Zero Waste Council’s “A Food Loss and Waste Strategy for Canada,”
Provision Coalition’s “Developing an Industry Led Approach to Addressing Food Waste in Canada,” and

ReFED’s “A Roadmap to Reduce U.S. Food Waste by 20 Percent,” were also reviewed during the
research methodology’s design and implementation.
Several reports have attempted to quantify and address the issue of FLW in Canada and in other
comparable jurisdictions; however, none have combined a national mass balance from the whole of
chain perspective, as this research has done. The estimation of FLW that has arisen from this project is
considerably larger than previous estimates for Canada, which have ranged from 6 to 13 million tonnes.
The fact that we have taken a whole of chain approach and established a more complete set of data and
insights along the food value chain than previous studies have undertaken in estimating FLW, has
naturally resulted in our producing larger estimates of FLW than those produced by prior studies. There
are still limitations to the methodology followed to establish this new estimate. These limitations
include that the loss factors are largely reliant on estimates and assumptions of stakeholders within the
sector, as there is limited measurement of FLW and even less standardized measurement. However, the
research team believes it provides a more complete picture of the extent of FLW across the entire food
life cycle.
Table A provides an overview of methods used to estimate FLW, particularly in Canada, with further
discussion/comparison of these key reports and work on FLW presented below. Reports by Agriculture
and Agri-food Canada (AAFC), National Zero Waste Council (NZWC), ReFED (US), and the Commission for
Environmental Cooperation (CEC) have all been reviewed and considered by the research team.
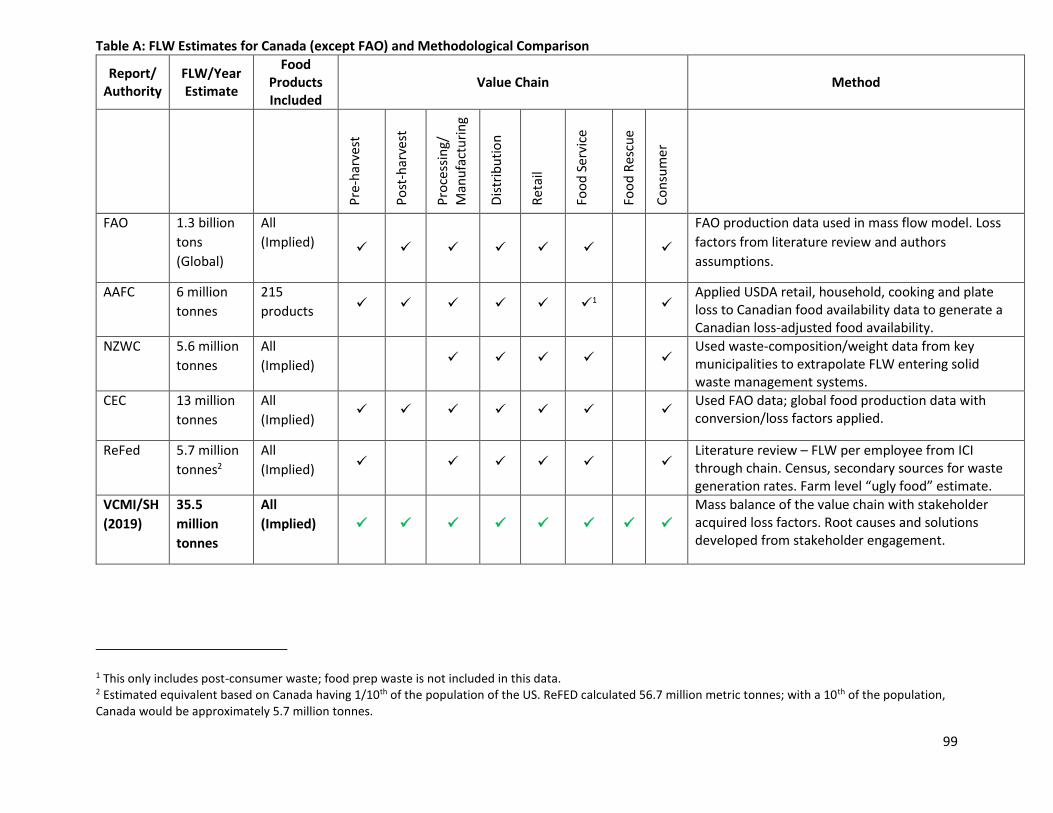
99
Table A: FLW Estimates for Canada (except FAO) and Methodological Comparison
Report/ Authority
FLW/Year Estimate
Food Products Included
Value Chain Method
Pre
-har
vest
Po
st-h
arve
st
Pro
cess
ing/
M
anu
fact
uri
ng
Dis
trib
uti
on
Ret
ail
Foo
d S
ervi
ce
Foo
d R
escu
e
Co
nsu
mer
FAO 1.3 billion
tons
(Global)
All
(Implied)
FAO production data used in mass flow model. Loss
factors from literature review and authors
assumptions.
AAFC 6 million
tonnes
215
products 1
Applied USDA retail, household, cooking and plate loss to Canadian food availability data to generate a Canadian loss-adjusted food availability.
NZWC 5.6 million
tonnes
All
(Implied)
Used waste-composition/weight data from key municipalities to extrapolate FLW entering solid waste management systems.
CEC 13 million
tonnes
All
(Implied)
Used FAO data; global food production data with conversion/loss factors applied.
ReFed 5.7 million
tonnes2
All
(Implied) Literature review – FLW per employee from ICI through chain. Census, secondary sources for waste generation rates. Farm level “ugly food” estimate.
VCMI/SH
(2019)
35.5
million
tonnes
All
(Implied)
Mass balance of the value chain with stakeholder acquired loss factors. Root causes and solutions developed from stakeholder engagement.
1 This only includes post-consumer waste; food prep waste is not included in this data. 2 Estimated equivalent based on Canada having 1/10th of the population of the US. ReFED calculated 56.7 million metric tonnes; with a 10th of the population, Canada would be approximately 5.7 million tonnes.

100
1.1.1 Agriculture and Agri-Food Canada (AAFC) and United States Department of Agriculture
(USDA)
The 2015 overview of the Canadian Agriculture and Agri-food sector published by AAFC had a special
feature on FLW. This was the first time the government had attempted to quantify the issue across
Canada. By applying FLW estimates developed by the USDA (Buzby et al., 2014), AAFC and Statistics
Canada (STC) provided a loss-adjusted food availability statistic product, which is monitored by STC. The
primary purpose of the loss-adjusted food availability statistic is to “more closely estimate actual per
capita intake” (Buzby et al., 2014). The intention of this data was not to estimate FLW; therefore, there
are key gaps within this analysis regarding FLW. For example, foodservice only includes post-consumer
FLW and does not include preparation waste. There is no consideration of food waste prior to retail.
Distribution, processing, production (pre or post-harvest) are also not incorporated into this data.
1.1.2 Commission for Environmental Cooperation (CEC) and United Nations-Food and
Agriculture Organisation (FAO)
The 2017 report from the Commission for Environmental Cooperation (CEC) provides an overview of
FLW across North America (Canada, US and Mexico). Although some measurements of FLW have been
conducted within each of the countries, CEC sought to have a standard measure, against which the
three countries would be compared. The FAO data and methodology were deemed the most
appropriate under the parameters of the CEC report; however, the FAO estimates used in this report
“should be interpreted with a high degree of uncertainty” (CEC, 2017).
Although the FAO study took a similar approach of mass flow (balance) through the food system, the
FAO data had significant limitations regarding availability of data, particularly on a global scale. The loss
and waste through the chain was estimated from FAO’s food balance sheets for the year 2007 and from
a literature review.
The FAO food balance sheet data for Canada omits key commodities that are significant contributors to
the agri-food system. Some of the commodities that have no loss data within the FAO dataset include
bovine meat, poultry meat, milk, and marine. Where data was missing, Gustavsson et al (2011) made
assumptions and estimations based on FLW in comparable regions, commodity groups or steps within
the value chain. This VCMI/SH research provides an update and a more refined analysis of FLW within
the Canadian context, due to the fact that the production data is from 2016 and loss factors have been
collected from the industry directly.
The CEC report provides solutions (labelled as approaches) for addressing FLW. However, they are often
siloed in nature, and do not address the fact that the food value chain is a complex system with
interacting stakeholders.

101
1.1.3 National Zero Waste Council
The NZWC report3 extrapolated weight and composition data from representative municipalities to
assess how much food waste was entering waste management systems across the country (National
Zero Waste Council 2017). This did not explore losses occurring pre-harvest, or during production and
processing. Consequently, NZWC did not account for food waste being fed to animals, which is a key
disposal method, particularly at the production and processing end of the value chain.
1.1.4 WRAP (UK)
WRAP has pioneered the measurement and prevention of food waste in the UK since it was established
in 2000.
Government funding has enabled WRAP to measure food waste in households, retail, manufacturing,
food service, and most recently in agriculture, using comprehensive survey techniques. These studies
have provided policy relevant data on the amounts and make up of food waste, often for the first time.
The work on household food waste led WRAP to introduce the consumer campaign “Love Food Hate
Waste” in 2007. This work aims to raise awareness of food waste and offer practical advice and solutions
to help the public reduce their food waste.
In 2005 WRAP also pioneered a ground-breaking voluntary agreement with the food industry, known as
the Courtauld Commitment, which ran through three phases until 2015. In its third phase, WRAP
reported that over £100 million in business savings was delivered by reducing food waste.
WRAP also ensured that a baseline on waste data was established, and that progress towards the
targets in each phase of the agreement was rigorously monitored to demonstrate progress to
stakeholders. It also provides technical guidelines for businesses to help consumers reduce their food
waste by commissioning independent research on, for instance, household waste and its causes.
In 2016 WRAP launched a 10-year producer to consumer voluntary agreement known as the Courtauld
Commitment 2025. This was to make food and drink production and consumption more sustainable.
Meeting the Courtauld 2025 targets will help the UK achieve UN Sustainable Development Goal 12.3 by
2030.
A scan of the work emanating from the UK on FLW found there to be some whole of chain projects that
looked at specific commodities or products. However, WRAP has always looked at commodities and
products separately. Therefore, there has never been a link established between the commodity
production and product production. In turn, this has prevented the completion of standardized whole of
chain analysis. To combat this break in the chain and allow for measurement of FLW throughout the
chain, VCMI/SH developed a food classification where the food is classified by the commodity that is the
primary ingredient of that food (Section 2.3.1).
3 Produced by Tetra Tech to establish a benchmark for the Love Food Hate Waste (Canada) campaign.
102
1.1.5 ReFED (US)
ReFED (2016) looked at FLW in the US across the value chain. The outcome of ReFED’s analysis was a list
of solutions, with their associated cost-benefit, for industry to consider. To measure the cost-benefit,
their solutions were contextualized by volume and value, founded on the baseline FLW estimation
developed by the ReFED team. The baseline is grounded in FLW per employee of key industrial,
commercial and institutional (ICI) entities throughout the chain and on a per capita basis for households.
Data to populate ReFED’s model was acquired through a literature review, supplemented with
stakeholder interviews and verification.
ReFEDs methodology contrasts with the mass balance approach taken by this project (section 2.3),
which established baseline food input into the system, and then sort loss factors through the chain from
primary research. There is a significant difference in the focus of the ReFED report and VCMI/SH: ReFED
is focused on solutions, whilst VCMI/SH is focussed on the root causes and measurement to assess
ongoing improvement. Although the ReFED work provides some insightful solutions, the VCMI/SH
research provides a standardized metric that enables the measurement of FLW. Through measurement,
benchmarking and monitoring, the effectiveness of various solution implementation can be tested. The
VCMI/SH research builds on ReFED and other prior FLW research by providing a means to acquire
meaningful data upon which to base future policy and solution implementation. This is something that,
to date, has been lacking in all FLW research.
1.1.6 Inclusion of Food Rescue
No report on FLW has ever looked at the amount of FLW that occurs in the food rescue sector, or
included this sector in the research and analysis of FLW issue. This sector is specifically excluded from
the FLWARS, as it states that food rescue and distribution is a secondary food system. FLWARS does
suggest that the methods they present can be used to measure FLW within the food rescue/
redistribution sector; however, it is not considered by the FLWARS to be a component of the primary
food system. It is therefore outside the boundary/scope of the standard. This project has included food
rescue/redistribution as a destination, and has investigated the potential of increasing food diversion to
rescue/redistribution.
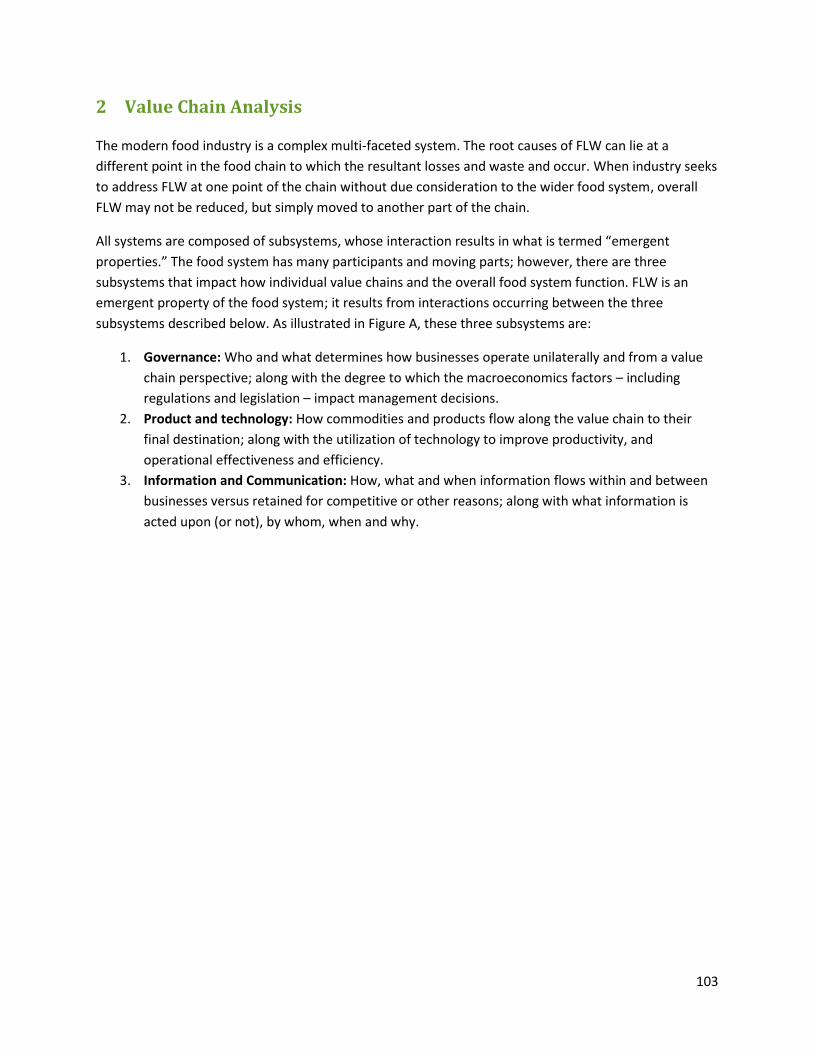
103
2 Value Chain Analysis
The modern food industry is a complex multi-faceted system. The root causes of FLW can lie at a
different point in the food chain to which the resultant losses and waste and occur. When industry seeks
to address FLW at one point of the chain without due consideration to the wider food system, overall
FLW may not be reduced, but simply moved to another part of the chain.
All systems are composed of subsystems, whose interaction results in what is termed “emergent
properties.” The food system has many participants and moving parts; however, there are three
subsystems that impact how individual value chains and the overall food system function. FLW is an
emergent property of the food system; it results from interactions occurring between the three
subsystems described below. As illustrated in Figure A, these three subsystems are:
1. Governance: Who and what determines how businesses operate unilaterally and from a value
chain perspective; along with the degree to which the macroeconomics factors – including
regulations and legislation – impact management decisions.
2. Product and technology: How commodities and products flow along the value chain to their
final destination; along with the utilization of technology to improve productivity, and
operational effectiveness and efficiency.
3. Information and Communication: How, what and when information flows within and between
businesses versus retained for competitive or other reasons; along with what information is
acted upon (or not), by whom, when and why.

104
Figure A: Three Subsystems Pertaining to Value Chain Analysis
The process of VCA examines the food system from a horizontal perspective, allowing a rigorous
assessment of the interactions and outcomes that together shape how the overall food system
operates. This enables researchers to determine factors impacting the creation of FLW, by having

105
investigated interrelationships between the three subsystems (listed above) that together determine
how individual businesses within the food industry – and ultimately the food industry itself – operates.
Triangulating quantitative and qualitative data gathered from different sources enables researchers to
develop a robust and objective picture of FLW and its root causes from a whole of chain perspective.
The VCA process recognizes that FLW is not just affected by lack of investment, operational costs or
deficient technologies.
FLW is also impacted by weaknesses in intra- and inter-firm relationships, with ineffective operations
and communication resulting from a lack of strategic alignment, operational understanding, trust,
commitment, benefit sharing, and collaboration. For these reasons, the level of collaboration that exists
within and between businesses will influence the amount of FLW occurring along the value chain in
which they operate. The same reasons will also impact businesses’ motivation and ability to reduce FLW.
The results produced by VCA aid the development of effective sustainable solutions. This is because
individuals’ experiences and personal beliefs need to be understood, as these influence how individuals
view themselves, in context of the world around them and how they will respond to potential
recommendations.
2.1 Analytical Framework
The food system starts with production of terrestrial and marine foods, and the wild capture of marine
foods. Food is then transported and transformed through the food system to the consumer. At each
step in the chain there is FLW to varying degrees, and the disposal of this waste has various destinations.
In light of the fact that food is transported throughout the system, and that the use of that
transportation system requires the weight of the load to be known, the common metric for the weight
of FLW is metric tonnes. No matter the type of commodity/food, the weight is known or can be
calculated; therefore, mass balance is a logical method for measuring FLW.
A graphic of the research framework is presented in Figure B. The team first established the amount of
production that occurs in Canada. The total amount of food that would typically enter into the food
system was then established, accounting for imports, exports and grains that are used for animal feed.
The losses at each stage were gathered from the industry survey. Information about the destinations of
FLW and the causes of this FLW were requested from the industry, and finally solutions were developed
and verified with stakeholders. As already mentioned, the key measurement of food produced,
distributed sold and consumed as well as FLW should be metric tonnes. The logic behind this is that
most food is likely weighed during production, and formulas exist for translating common measures (e.g.
bushels or apples and bushels of wheat) into metric tonnes. In addition, all food and liquids (e.g. milk)
must be transported by road, air and/or sea at various stages of the production system – so therefore its
weight is known (as mentioned above).
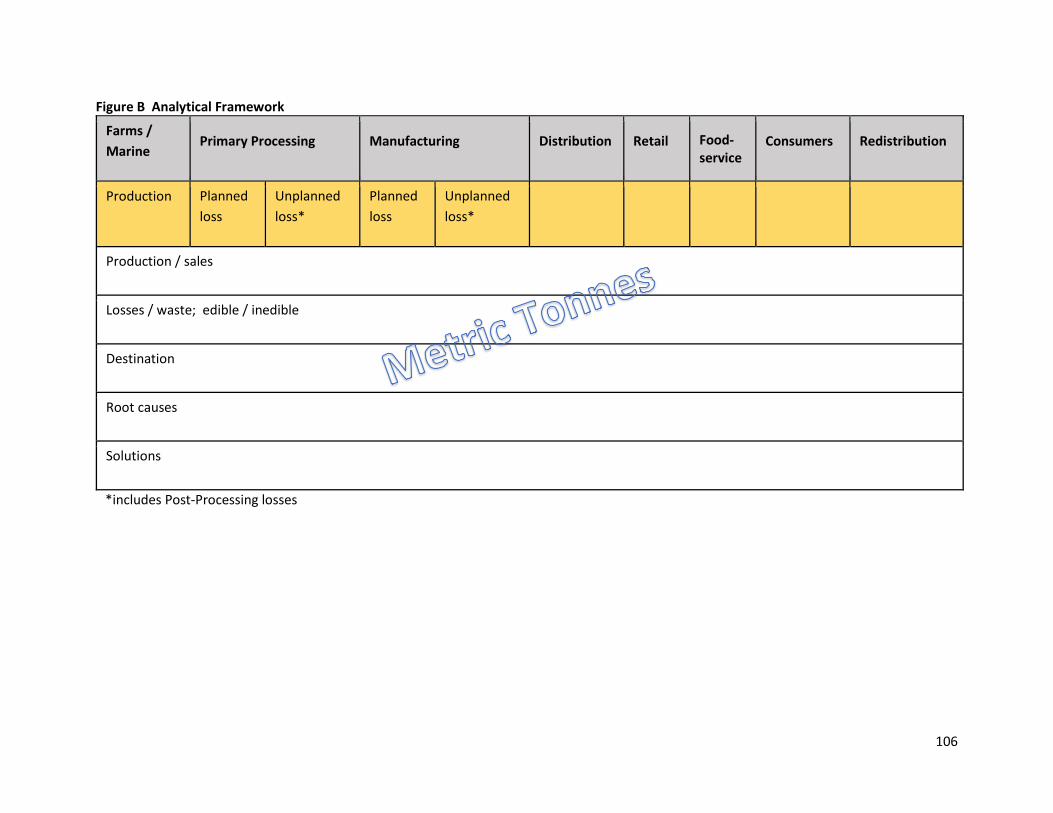
106
Figure B Analytical Framework
Farms /
Marine Primary Processing Manufacturing Distribution Retail Food-
service Consumers Redistribution
Production Planned
loss
Unplanned
loss*
Planned
loss
Unplanned
loss*
Production / sales
Losses / waste; edible / inedible
Destination
Root causes
Solutions
*includes Post-Processing losses

107
2.1.1 Stakeholder Advisory Group
To assist in ensuring the robustness and rigour of the research and conclusions drawn, an advisory group
comprising expert industry stakeholders was established. Representing farming, processing, distribution,
foodservice, retail, academia, and associated industry stakeholders, the group’s primary purpose was to
help ensure that the project achieved its intended outcomes of:
Producing and populating FLW metrics that reflect the Food Loss and Waste Accounting and
Report Standard; and
Creating data, materials and solutions that are conveyed in a Canadian context, though can be
extrapolated across jurisdictions to enable international comparisons.
Advice and feedback provided by the stakeholder group helped ensure that no important considerations
were omitted during the research, analysis and subsequent development of proposed solutions. The
members also assisted in engaging industry throughout the design and implementation of the research.
This included directing the researchers to important sources of secondary data, commenting on the
draft online survey, circulating the survey across the Canadian food industry, recommending experts and
organizations to consult during the data validation process, and participating in the focus groups.
The research commenced by establishing a baseline of food: the total volume of food that is grown,
caught and harvested and enters into the Canadian food system. A comprehensive survey,
supplemented with interviews, provided information regarding FLW throughout the food system. All this
information informed the development of a mass balance model that provided an estimation of FLW or
leakage from the food system. This model calculation was conducted on the six food categories from
production to distribution. After distribution, food flows into retail and/or HRI.4 The model was built to
accommodate this differentiated flow, and the different losses estimated for FLW in food service, retail
and household were applied to a portion of the total food flowing through the model. Results from the
model are described in the body of this report and expanded upon in Appendix A.
In addition to acquiring loss factors, the primary research identified key causes of FLW and the
destinations of FLW. The prevalence of, and barriers to, food rescue and redistribution were also of key
concern within the research. Targeted interviews and focus groups across the country were used to
verify research findings and triangulate them for validation. Focus groups were also used to inform and
guide the development of sustainable solutions, conceptually testing these solutions with industry
experts across Canada. Appendix A provides details regarding the calculation of the food system
baseline, the survey, data analysis, interviews, and the focus groups.
4 Hotels, Restaurants and Institutions (Food service)
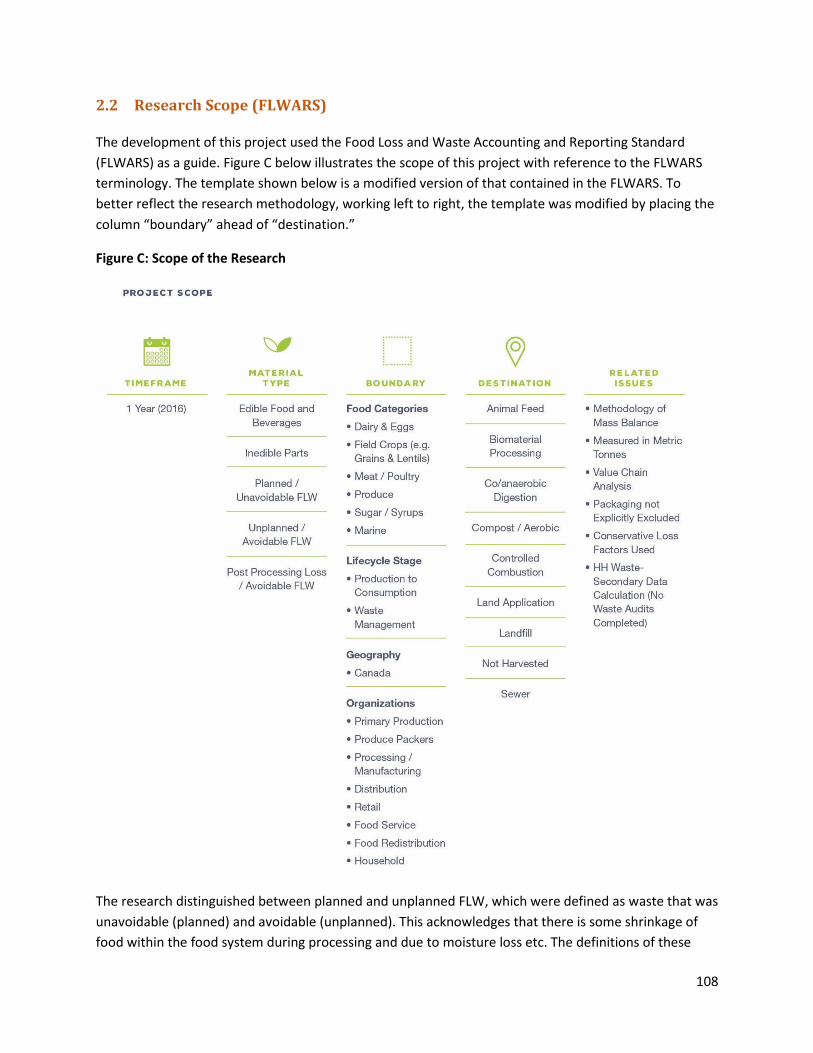
108
2.2 Research Scope (FLWARS)
The development of this project used the Food Loss and Waste Accounting and Reporting Standard
(FLWARS) as a guide. Figure C below illustrates the scope of this project with reference to the FLWARS
terminology. The template shown below is a modified version of that contained in the FLWARS. To
better reflect the research methodology, working left to right, the template was modified by placing the
column “boundary” ahead of “destination.”
Figure C: Scope of the Research
The research distinguished between planned and unplanned FLW, which were defined as waste that was
unavoidable (planned) and avoidable (unplanned). This acknowledges that there is some shrinkage of
food within the food system during processing and due to moisture loss etc. The definitions of these

109
were provided to our survey participants and can be found in the glossary of terms. The project also
enquired into the amount of edible FLW that was occurring along the chain.
All destination types were part of the inquiry, and the boundary included the entire food system across
Canada with food classified into six categories.
The research addressed FLW through the whole of chain: food production from farm (terrestrial/
marine) and wild capture of sea and fresh water commodities to fork (human consumption). It has been
conducted using a systems approach at the commodity and food type level. Therefore, granularity on
specific food and beverage SKUs is not included.
The project does not include a specific assessment/measurement of energy and environmental costs
associated with FLW. This is an area of research that has been completed for other regions of the world
and should be considered as further research regarding FLW within the Canadian context. Food that was
produced for animal feed and its associated waste was also outside the scope of this project.
2.3 Mass Balance Baseline
We used mass balance to quantify the amount of FLW occurring throughout the food system. The
FLWARS presents this as one of the potential methods to be used for estimating FLW, and the research
team felt that this was the best way to estimate FLW for the entire food system within Canada.
Shown below in Table B is the baseline of net available food (for 2016). The formula used to calculate
the baseline is also shown. The baseline consisted of:
𝐹𝑜𝑜𝑑 𝑃𝑟𝑜𝑑𝑢𝑐𝑡𝑖𝑜𝑛5 − (𝐸𝑥𝑝𝑜𝑟𝑡𝑠 + 𝐼𝑚𝑝𝑜𝑟𝑡𝑠) ± (𝐴𝑑𝑗𝑢𝑠𝑡𝑚𝑒𝑛𝑡 𝑓𝑜𝑟 𝑃𝑟𝑜𝑐𝑒𝑠𝑠𝑒𝑑 𝐹𝑜𝑜𝑑6) = 𝐵𝑎𝑠𝑒𝑙𝑖𝑛𝑒
Table B Baseline Volume
5 Terrestrial and marine 6 Adjustment made after processing and manufacturing within the value chain model
Food Type Million Tonnes
Dairy 9.3
Field Crops 33.8
Produce 13.3
Meat/ Poultry 2.5
Marine 0.8
Sugar/ Syrups 1.2
Total Tonnes 60.9
Prepared Food Adjustment
0.22
Food System Supply
61.12
110
Data for food production came from AAFC, STC, and Fisheries and Oceans Canada. Trade data (imports
and exports) came from Canadian International Merchandise Trade Database (CIMT). At the time of the
research, 2017 data was being continually updated; therefore, the research project used 2016 data, as
this was the most recent stable data set. The only exception was some statistics for marine registered
vessels and production, which is from 2015. This was the most recent data available for this sector at the
time of the research.
All data that was collated was measured or converted into metric tonnes. For example, milk and eggs
needed to be converted. Hectolitres were converted to tonnes based on the density of 1.03kg/litre.
Dozens of eggs were converted to tonnes based on the average egg size of 56g. Production statistics for
meat was collected based on carcass weight. An adjustment was made to key feed grain production data
to account for the large amount of grain that is grown for animal feed.
All the production data was categorized into the six food categories used for this research, the rational
for which is discussed below. All data was collected at the provincial level to enable some geographic
analysis. The trade data was attributed to the province of importation or exportation; however, it was
noted that the port of entry was not necessarily the final destination.
A total of 60.9 million tonnes was calculated as the baseline of Canadian food production (Table B).
Further detail on the baseline data sources can be found in Appendix A.
2.3.1 Categorizing Food and Beverages from Whole of Chain Perspective
A key issue of addressing FLW has been disconnects between measurement of production loss and
consumer waste. Previous FLW research measured food loss and food waste separately, and did not
establish a direct connection between the commodities that enter the food system and the consumer
products that are formulated from them. This research has bridged that gap and Table C outlines the
categorization this project adopted: all food is based on the major commodity that it consists of.
Using the mass balance approach, and knowing the comparative percentage of inputs used in the
manufacture of processed foods, it is possible to measure and monitor loss and waste of inputs. Thus,
waste can be portioned to appropriate commodities back to primary production. Within the survey,
processing and manufacturing respondents were asked to provide percentages of the particular food
types that were processed at their facility, and to provide the percentage of planned and unplanned
FLW that occurred in these various food types.
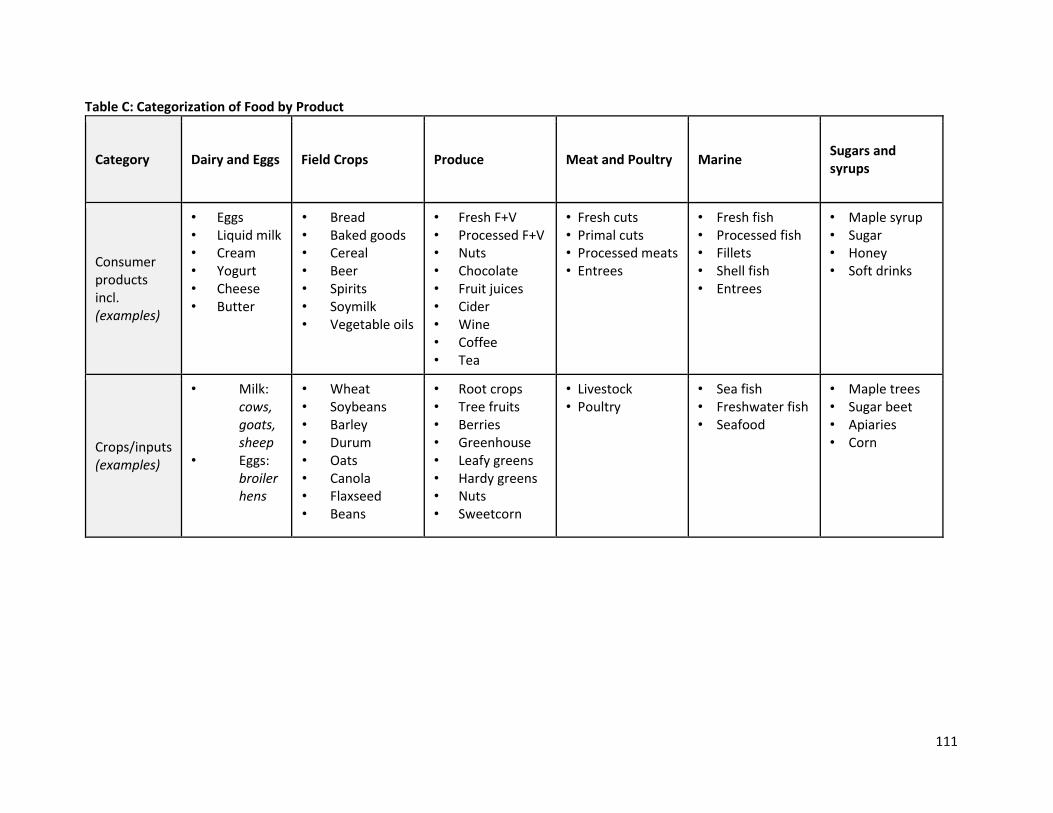
111
Table C: Categorization of Food by Product
Category Dairy and Eggs Field Crops Produce Meat and Poultry Marine Sugars and syrups
Consumer products incl. (examples)
• Eggs • Liquid milk • Cream • Yogurt • Cheese • Butter
• Bread • Baked goods • Cereal • Beer • Spirits • Soymilk • Vegetable oils
• Fresh F+V • Processed F+V • Nuts • Chocolate • Fruit juices • Cider • Wine • Coffee • Tea
• Fresh cuts • Primal cuts • Processed meats • Entrees
• Fresh fish • Processed fish • Fillets • Shell fish • Entrees
• Maple syrup • Sugar • Honey • Soft drinks
Crops/inputs (examples)
• Milk: cows, goats, sheep
• Eggs: broiler hens
• Wheat • Soybeans • Barley • Durum • Oats • Canola • Flaxseed • Beans
• Root crops • Tree fruits • Berries • Greenhouse • Leafy greens • Hardy greens • Nuts • Sweetcorn
• Livestock • Poultry
• Sea fish • Freshwater fish • Seafood
• Maple trees • Sugar beet • Apiaries • Corn

112
3 Survey
We used an online survey to capture data and information regarding FLW from across the country and
throughout the value chain. The survey design was informed by the FLWARS, our expert team, and a
review of background information regarding the “hots spots” of FLW that have been found in Canada,
the US and the UK. The survey ultimately provided the loss factors that went into the model used to
estimate losses along the chain. It also provided initial insights into where and why FLW is occurring.
3.1 Survey Design
We designed the survey to be disseminated throughout the value chain and across the country. It was
designed to capture data for the six different food types, and was directed to different segments of the
value chain. There were common questions throughout the survey; however, once the respondent
identified their position in the chain, skip logic allowed for questions only pertaining to them to be
answered – thus customizing the survey for specific industries and value chains
There were 14 different positions within the chain for a respondent to select from (as referenced in
Table D), eight of which were various types of primary production. The online platform of Survey
Monkey was used to disseminate the survey.
Table D: Value Chain Segments Surveyed
Primary Production Processing & Manufacturing
Distribution Retail Food Service Food Rescue
Livestock
Poultry
Egg
Dairy
Storable Produce
Perishable Produce
Marine
Sugar/Syrup
Produce Packers
Primary Processing
Further Manufacturing
Hotel
Restaurant
Institution
Based on FLWARS, the survey was designed to inquire about edible and inedible FLW, and we also asked
about planned and unplanned (i.e. avoidable and unavoidable FLW). A literature review of FLW hot
spots and prior analysis informed the survey design, particularly with regard to the list of potential
causes of FLW that were presented to survey respondents. In addition to the list developed, there was
an option to indicate a different cause and explain it.
Overall the questions within the survey were designed to:
1. Establish which part of the chain the responded was situated
a. Size of business
b. Physical location of the business (rural, semi-urban, urban)
2. Establish which food type the respondent was primarily reporting on

113
3. Establish if measurement of FLW is currently occurring
4. Establish the amount of FLW that is occurring within the business, i.e. loss factors (where
measurement was not formally conducted, estimates were requested)
5. Establish the type of FLW that is occurring
a. Edible, inedible/planned or unplanned
b. Processing and manufacturing were additionally asked about any post-processing losses
6. What were the causes of FLW
7. Where is this FLW going, i.e. what are the disposal methods
a. Is it being rescued/redistributed?
b. What would increase the amount of food rescue/redistribution?
Respondents were also given the opportunity to provide additional comments and feedback throughout
and at the end of the survey.
3.2 Survey Roll Out
The survey was tested in mid-May 2018, by distributing the draft among fifty individuals with whom
Second Harvest or VMCI had strong relationships and who represented businesses that stretched along
the value chain. These businesses included various farming operations, produce packer/shippers,
processors, manufacturers, retailers, foodservice, and food redistributors. Each potential respondent
received a personal invitation, requesting that they complete the survey online and provide feedback
regarding the usability and/or wording of the survey.
Written feedback was provided via the 43 survey responses received, or separately by email. Five
respondents provided further detailed feedback verbally. Based on this feedback, the survey was revised
prior to its dissemination across Canada in early June 2018. The stakeholder advisory group assisted in
distributing the survey to businesses and industry organizations. Provincial and national organizations –
representing farmers, processors, manufacturers, retailers, foodservice and food redistributors (incl.
food rescue and foodbanks) – distributed the survey link and information via email blasts and
newsletters. The survey was viewed on 732 occasions, with 579 responses received.
Following a request by a representative from the seafood harvesting sector in early July 2018, a separate
complementary survey was designed and distributed amongst individuals involved in the wild catch and
aquaculture sectors. The survey was viewed on 50 occasions, with 41 responses received.
The online surveys closed in late July, with regular downloads and cleaning of data occurring throughout
the six-week period that information on the project was disseminated to industry.

114
3.3 Survey Data Distribution
The survey had a response rate of 79 percent from 782 visits to the online survey. A total of 618 valid
responses7 were received from all along the value chain. Two hundred and fifty-one respondents gave
specific information regarding FLW in their operation. Those that did not give specific information on
FLW were still considered respondents, because they gave information/feedback regarding the issue of
FLW. The distribution of the responses in comparison to the make-up of the industry indicates that
statistically the responses were overrepresented in the processing and retail sectors and under
represented in the primary production and HRI sectors. However, reasonable representation was
received from across the chain.
Business Type % of Industry8 % of Survey Responses
Primary Production (incl. marine) 54% 38%
Packing, Processing and Manufacturing 1% 15%
Distribution/Wholesalers 2% 3%
Retail 9% 33%
HRI (Hotels, Restaurants, Institutions 33% 11%
Responses were received from across the country. As can be seen from the table below, responses were
over represented in Ontario, British Columbia, Manitoba and PEI. Every effort was made to ensure each
region of the country was engaged through follow-up interviews and focus groups.
Provinces % of Industry % responses by Prov.
Newfoundland and Labrador 2% 1%
Prince Edward Island 2% 8%
Nova Scotia 4% 1%
New Brunswick 3% 1%
Quebec 18% 1%
Ontario 28% 46%
Manitoba 6% 15%
Saskatchewan 12% 3%
Alberta 15% 8%
British Columbia 12% 16%
Territories 0% 1%
The above figures show that the researchers’ target of acquiring 250 survey responses, representing
respondents from across the country and throughout the various food type chains, was exceeded.
7 Valid responses were those that had answers to questions, not simply a visit to the survey. 8 Calculated from Industry Canada Statistics

115
APPENDIX C: GHG Associated with FLW
This appendix describes the methodology followed in a project that was related though separate to the
Avoidable Crisis of Food Waste research to produce high level whole of chain estimates of the CO2
equivalent (CO2e) footprint of FLW presented in Section 3.8.1 of the Technical Report.
Using published estimates and publicly available data, we established an entire chain estimate of CO2e.
Production, processing and manufacturing estimates came from published LCA1 literature. Emissions
from transportation between chain links were determined based on published truck emissions and
estimated distances of transportation for each food category. Energy consumption at retail, HRI DCs,
HRI, and households was extrapolated from company reports and Canadian statistics. A calculator
model was constructed for each food type; therefore, we could estimate the CO2e associated with FLW
occurring in that chain. The total CO2e for all six food types reported in “The Avoidable Crisis of Food
Waste (2019)” provided the overall FLW CO2e footprint. Using the loss factors of potentially avoidable
FLW from the FLW model an estimate of potentially avoidable CO2e was derived.
In scope data:
Growing and production, primary processing and manufacturing data with source attribution for the food consumed within Canada, (78mm tonnes produced domestically plus 10mm tonnes imported), but not that which is exported (27mm tonnes)
Retail and distribution as a standard carbon foot print for a typical operation
Emissions associated with truck rolls to and for each element of the value chain
Estimates for HRI and HH food preparation, cook and serve
Out of scope data:
Emissions associated with fishing vessels and aquaculture (unless included in the LCA literature)
Production fertilizer NO2 effect (unless included in the LCA literature)
Animal medication and healthcare (unless included in the LCA literature)
The construction of warehouses, stores and HRI properties
Employee and consumer commute
HRI eatery footprint
Water and wastewater pumping and treatment
Carbon sequestration of fruit trees and grazing/pasture lands.
Production, Processing and Manufacturing:
Majority of LCAs only consider the GHG emissions from the production phase of the food supply chain (FSC), as this is where majority of emissions are accumulated in a product (Porter et al. 2016). Where possible, emissions factors for processing and manufacturing were acquired to apply to our model. All production emissions factors (except Sugar/Syrups) were drawn from Porter et al. (2016), the North America and Oceania regional data set. Generally, this is the average of products within the food types;
1 Life Cycle Assessment
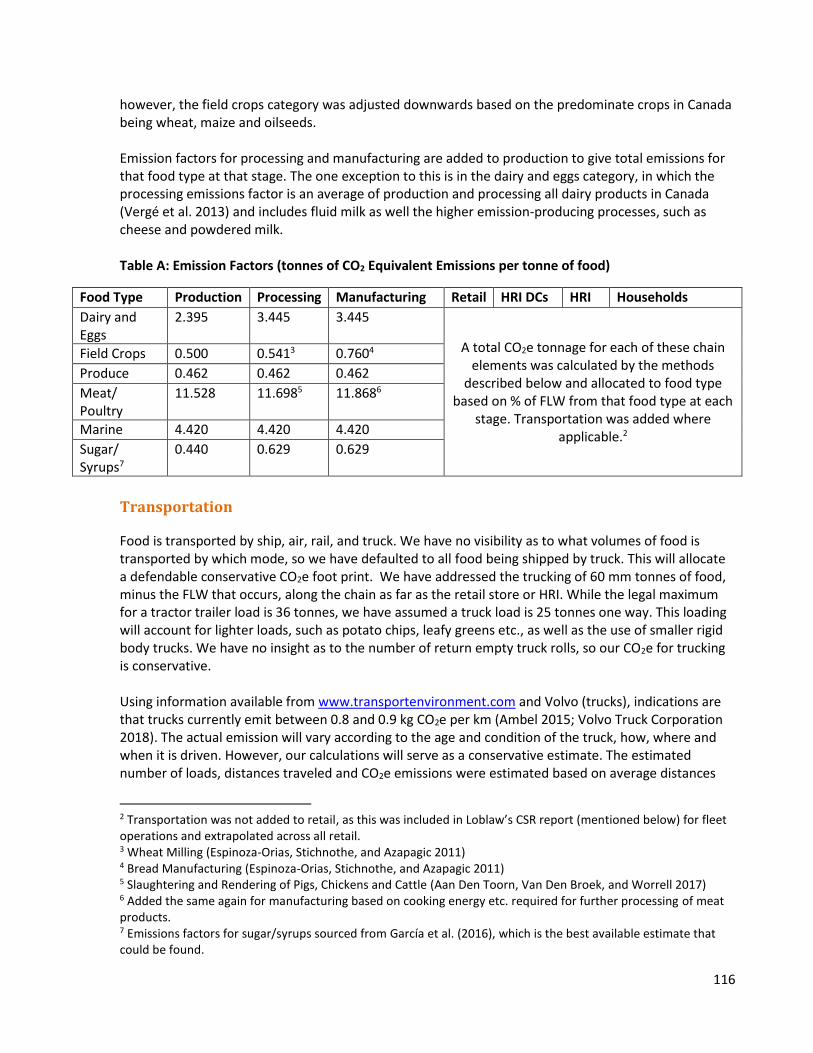
116
however, the field crops category was adjusted downwards based on the predominate crops in Canada being wheat, maize and oilseeds. Emission factors for processing and manufacturing are added to production to give total emissions for that food type at that stage. The one exception to this is in the dairy and eggs category, in which the processing emissions factor is an average of production and processing all dairy products in Canada (Vergé et al. 2013) and includes fluid milk as well the higher emission-producing processes, such as cheese and powdered milk. Table A: Emission Factors (tonnes of CO2 Equivalent Emissions per tonne of food)
Food Type Production Processing Manufacturing Retail HRI DCs HRI Households
Dairy and Eggs
2.395 3.445 3.445
A total CO2e tonnage for each of these chain elements was calculated by the methods
described below and allocated to food type based on % of FLW from that food type at each
stage. Transportation was added where applicable.2
Field Crops 0.500 0.5413 0.7604
Produce 0.462 0.462 0.462
Meat/ Poultry
11.528 11.6985 11.8686
Marine 4.420 4.420 4.420
Sugar/ Syrups7
0.440 0.629 0.629
Transportation
Food is transported by ship, air, rail, and truck. We have no visibility as to what volumes of food is transported by which mode, so we have defaulted to all food being shipped by truck. This will allocate a defendable conservative CO2e foot print. We have addressed the trucking of 60 mm tonnes of food, minus the FLW that occurs, along the chain as far as the retail store or HRI. While the legal maximum for a tractor trailer load is 36 tonnes, we have assumed a truck load is 25 tonnes one way. This loading will account for lighter loads, such as potato chips, leafy greens etc., as well as the use of smaller rigid body trucks. We have no insight as to the number of return empty truck rolls, so our CO2e for trucking is conservative. Using information available from www.transportenvironment.com and Volvo (trucks), indications are that trucks currently emit between 0.8 and 0.9 kg CO2e per km (Ambel 2015; Volvo Truck Corporation 2018). The actual emission will vary according to the age and condition of the truck, how, where and when it is driven. However, our calculations will serve as a conservative estimate. The estimated number of loads, distances traveled and CO2e emissions were estimated based on average distances
2 Transportation was not added to retail, as this was included in Loblaw’s CSR report (mentioned below) for fleet operations and extrapolated across all retail. 3 Wheat Milling (Espinoza-Orias, Stichnothe, and Azapagic 2011) 4 Bread Manufacturing (Espinoza-Orias, Stichnothe, and Azapagic 2011) 5 Slaughtering and Rendering of Pigs, Chickens and Cattle (Aan Den Toorn, Van Den Broek, and Worrell 2017) 6 Added the same again for manufacturing based on cooking energy etc. required for further processing of meat products. 7 Emissions factors for sugar/syrups sourced from García et al. (2016), which is the best available estimate that could be found.
117
particular food types would need to travel for processing/manufacturing and marketing. The transportation estimate does not include the transportation associated with secondary uses such as animal feed, rendered product and/or disposal of food waste.
Retail Stores
In their 2017 Corporate Social Responsibility (CSR) report,8 Loblaw Companies Limited indicated that the corporate carbon footprint for food retail stores and DCs (but not Shoppers Drug Mart for 2016) was close to 1mm tonnes (Loblaw Companies Limited 2017). This comprised:
Natural gas
Electricity
Fleet fuel consumption
Refrigerant releases
Waste
Corporate travel Loblaw Companies Limited revenues for 2016 were $46.4B, of which Shoppers Drug Mart accounted for ~$10.6B. Of the remaining ~$36B, Statistica indicated Loblaw Companies Limited food sales were $31.18B, with the remainder being non-food sales and financial services. If Canadian food sales for 2016 were $95B, and if we extrapolate Loblaw Companies Limited carbon foot print for $31.18B food sales, then the Canadian food retail foot print is: 1mm tonnes x $95B/$31.18B or 3mm tonnes CO2e.
HRI DCs
HRI sales for 2016 were ~$60B. Using the retail calculation above, HRI DCs’ CO2e foot print would be 2mm tonnes for 2016. However, HRI DCs do not operate retail stores, thus natural gas, electricity and refrigerant releases would be much lower. Scaling off Loblaw Companies Limited 1mm tonnes, we estimate these to be around 550k tonnes. We have reduced this by 75% to account for the difference in operation – thus we have 137.5k tonnes plus the balance of 450k tonnes,9 for a total of 587.5k tonnes x 210 ($60B) for a total of 1.175k tonnes CO2e assigned to HRI DCs.
HRI Operations
This will vary considerably by type and size of operation, and sources of information are limited. We
estimated that the typical HRI operation has 28.8 tonnes11 of CO2e associated with the storage, preparation and cooking of food. In 2016 there were approximately 87,000 HRI establishments (2016) in Canada. Therefore the estimated total of CO2e is 87k x 28.8 = 5,220k tonnes.
8 Metro’s CSR report does not report emissions in a manner that would allow the calculation of its unique CO2e. Sobeys’ website has a sustainability section, but it does not appear to address CO2e of its operations. 9 Portion of the carbon footprint not associated with natural gas, electricity and refrigerant releases. 10 Based on HRI sales being approximately double that of retail. 11 Assuming the kitchen consumes 80% of the energy and based on information from Fastcasual.com (2016).

118
Canadian Households
The most recent data we were able to find indicating household emissions from energy consumed within the home (excludes automotive fuel) was ~1.3 tonnes per person – or 3.2 tonnes per household (Clark-Milito and Gagnon 2008). We estimate that 12.5% of this energy is used to store, prepare and cook food; thus we have a national household food related carbon footprint of (3.2 tonnes x 14.5mm households) x 12.5% = 5,800,000 tonnes CO2e.
References
Aan Den Toorn, S. I., M. A. Van Den Broek, and E. Worrell. 2017. “Decarbonising Meat: Exploring
Greenhouse Gas Emissions in the Meat Sector.” Energy Procedia 123. Elsevier B.V.: 353–60.
doi:10.1016/j.egypro.2017.07.268.
Ambel, C. 2015. “Too Big to Ignore – Truck CO 2 Emissions in 2030.” Transport Environment.
https://www.transportenvironment.org/sites/te/files/publications/2015%2009%20TE%20Briefing
%20Truck%20CO2%20Too%20big%20to%20ignore_FINAL.pdf.
Clark-Milito, Alison, and Gabriel Gagnon. 2008. “Greenhouse Gas Emissions-a Focus on Canadian
Households.” EnviroStats 2 (Winter 2008): 1–25. https://www150.statcan.gc.ca/n1/en/pub/16-
002-x/16-002-x2008004-eng.pdf?st=huFNWHqR.
Espinoza-Orias, Namy, Heinz Stichnothe, and Adisa Azapagic. 2011. “The Carbon Footprint of Bread.”
International Journal of Life Cycle Assessment 16 (4): 351–65. doi:10.1007/s11367-011-0271-0.
Fastcasual.com. 2016. “What Is Your Restaurant’s Carbon Footprint?”
https://www.fastcasual.com/articles/what-is-your-restaurants-carbon-footprint/.
García, Carlos A., Edgar S. García-Treviño, Noe Aguilar-Rivera, and Cynthia Armendáriz. 2016. “Carbon
Footprint of Sugar Production in Mexico.” Journal of Cleaner Production 112: 2632–41.
doi:10.1016/j.jclepro.2015.09.113.
Gooch, M., Bucknell, D., LaPlain, D., Dent, B., Whitehead, P., Felfel, A., Nikkel, L., Maguire, M. (2019).
The Avoidable Crisis of Food Waste: Technical Report; Value Chain Management International and
Second Harvest; Ontario, Canada. Accessible from: www.secondharvest.ca/research
Loblaw Companies Limited. 2017. “2017 Corporate Social Responsibility Report.”
doi:10.1212/WNL.1.1.94.
Porter, Stephen D., David S. Reay, Peter Higgins, and Elizabeth Bomberg. 2016. “A Half-Century of
Production-Phase Greenhouse Gas Emissions from Food Loss & Waste in the Global Food Supply
Chain.” Science of the Total Environment 571. Elsevier B.V.: 721–29.
doi:10.1016/j.scitotenv.2016.07.041.
Vergé, X.P.C., D. Maxime, J.A. Dyer, R.L. Desjardins, Y. Arcand, and A. Vanderzaag. 2013. “Carbon
Footprint of Canadian Dairy Products: Calculations and Issues.” Journal of Dairy Science 96 (9).
Elsevier: 6091–6104. doi:10.3168/jds.2013-6563.
Volvo Truck Corporation. 2018. “Emissions from Volvo’s Trucks.”
https://www.volvotrucks.com/content/dam/volvo/volvo-trucks/markets/global/pdf/our-
trucks/Emis_eng_10110_14001.pdf.
Value Chain Management International Inc. 1155 North Service Rd. West, Suite 11, Oakville, ON, L6M 3E3
VCM-International.com
Second Harvest 1450 Lodestar Road, Unit 18, Toronto, ON, M3J 3C1
SecondHarvest.ca
Charitable Registration # 13386 5477 RR0001
34