Embed Size (px)
Citation preview

The Automated ScoreBook ECU Game Results (as of Nov 27, 2017) All games
Overall Conference Date Opponent Score Record Record Time Attend ---- -------- ----- -------- -------- ---- ------ Sep 2, 2017 JAMES MADISON 14-34 L 0- 1- 0 0- 0- 0 3:12 40169 Sep 9, 2017 at West Virginia 20-56 L 0- 2- 0 0- 0- 0 3:32 56797 Sep 16, 2017 #16 VIRGINIA TECH 17-64 L 0- 3- 0 0- 0- 0 3:23 43776 * Sep 24, 2017 at UConn W 41-38 1- 3- 0 1- 0- 0 3:20 14036 * Sep 30, 2017 #18 USF 31-61 L 1- 4- 0 1- 1- 0 3:17 34883 * Oct 7, 2017 TEMPLE 10-34 L 1- 5- 0 1- 2- 0 3:17 31326 * Oct 14, 2017 at #22 UCF 21-63 L 1- 6- 0 1- 3- 0 3:29 40287 Oct 21, 2017 BYU W 33-17 2- 6- 0 1- 3- 0 3:28 38835 * Nov 4, 2017 at Houston 27-52 L 2- 7- 0 1- 4- 0 3:16 29810 * Nov 11, 2017 TULANE O 24-31 L 2- 8- 0 1- 5- 0 3:47 36178 * Nov 18, 2017 CINCINNATI W 48-20 3- 8- 0 2- 5- 0 3:15 31923 * Nov 25, 2017 at Memphis 13-70 L 3- 9- 0 2- 6- 0 3:14 41517
*American Athletic Conference game
--------FIRST DOWNS--------- ----RUSHING---- ----------PASSING---------- --TOTAL OFFENSE-- Return Turn-
Opponent Score Total Rush Pass Pen Number-Yards Comp-Att-Int Yards Plays-Yards Yards Overs
-------- ----- --/-- --/-- --/-- --/-- -------/------- --------/-------- --/-- ------- / ------- --/-- --/--
JAMES MADISON....... 14-34 28/23 3/12 17/11 8/0 30-70 / 42-410 28-53- 3 / 17-24- 1 292/204 83-362 / 66-614 130/12 4/2
West Virginia....... 20-56 21/30 6/12 13/15 2/3 32-142 / 47-211 23-47- 2 / 24-34- 0 328/403 79-470 / 81-614 89/112 2/0
VIRGINIA TECH....... 17-64 12/34 3/16 6/16 3/2 31-40 / 62-287 11-30- 1 / 25-33- 0 241/388 61-281 / 95-675 39/57 3/0
UConn............... 41-38 30/27 10/9 19/15 1/3 47-170 / 38-190 30-39- 0 / 24-39- 1 426/406 86-596 / 77-596 20/52 0/1
USF................. 31-61 23/25 7/15 13/8 3/2 36-108 / 50-390 21-46- 2 / 13-21- 0 306/185 82-414 / 71-575 145/86 2/1
TEMPLE.............. 10-34 15/24 3/6 11/14 1/4 22-34 / 46-179 20-38- 1 / 21-33- 1 253/344 60-287 / 79-523 60/23 1/1
UCF................. 21-63 16/33 5/14 8/16 3/3 37-187 / 42-238 15-33- 1 / 25-31- 0 160/365 70-347 / 73-603 70/168 1/1
BYU................. 33-17 22/22 8/7 12/14 2/1 35-115 / 31-102 20-30- 0 / 26-41- 1 298/319 65-413 / 72-421 46/102 1/1
Houston............. 27-52 33/16 4/7 27/8 2/1 24-36 / 26-142 54-74- 2 / 15-22- 0 468/330 98-504 / 48-472 117/91 3/0
TULANE.............. 24-31 24/22 9/17 12/5 3/0 32-161 / 52-325 25-53- 1 / 12-20- 2 228/121 85-389 / 72-446 17/15 1/3
CINCINNATI.......... 48-20 28/17 6/11 19/6 3/0 33-114 / 31-139 32-46- 0 / 15-28- 1 464/187 79-578 / 59-326 17/120 0/1
Memphis............. 13-70 27/23 8/14 15/8 4/1 37-115 / 34-333 28-54- 3 / 10-15- 0 351/302 91-466 / 49-635 196/141 3/0
Totals.............. 299-540 279/296 72/140 172/136 35/20 396-1292/501-2946 307-543-16/227-341- 7 3815/3554 939-5107/ 842-6500 946/979 21/11
Note: Game totals are displayed in the format TEAM/OPPONENT for each category

The Automated ScoreBookECU Team Game-by-Game Comparison (as of Nov 27, 2017)
All games
First Downs Rushing Passing Total Offense Return Turn-Opponent Score Total Rush Pass Pen Number-Yards Comp-Att-Int Yards Plays-Yards Yards OversJAMES MADISON 14 - 34 28 / 23 3 / 12 17 / 11 8 / 0 30-70 / 42-410 28-53-3 / 17-24-1 292 / 204 83-362 / 66-614 130 / 12 4 / 2West Virginia 20 - 56 21 / 30 6 / 12 13 / 15 2 / 3 32-142 / 47-211 23-47-2 / 24-34-0 328 / 403 79-470 / 81-614 89 / 112 2 / 0VIRGINIA TECH 17 - 64 12 / 34 3 / 16 6 / 16 3 / 2 31-40 / 62-287 11-30-1 / 25-33-0 241 / 388 61-281 / 95-675 39 / 57 3 / 0UConn 41 - 38 30 / 27 10 / 9 19 / 15 1 / 3 47-170 / 38-190 30-39-0 / 24-39-1 426 / 406 86-596 / 77-596 20 / 52 0 / 1USF 31 - 61 23 / 25 7 / 15 13 / 8 3 / 2 36-108 / 50-390 21-46-2 / 13-21-0 306 / 185 82-414 / 71-575 145 / 86 2 / 1TEMPLE 10 - 34 15 / 24 3 / 6 11 / 14 1 / 4 22-34 / 46-179 20-38-1 / 21-33-1 253 / 344 60-287 / 79-523 60 / 23 1 / 1UCF 21 - 63 16 / 33 5 / 14 8 / 16 3 / 3 37-187 / 42-238 15-33-1 / 25-31-0 160 / 365 70-347 / 73-603 70 / 168 1 / 1BYU 33 - 17 22 / 22 8 / 7 12 / 14 2 / 1 35-115 / 31-102 20-30-0 / 26-41-1 298 / 319 65-413 / 72-421 46 / 102 1 / 1Houston 27 - 52 33 / 16 4 / 7 27 / 8 2 / 1 24-36 / 26-142 54-74-2 / 15-22-0 468 / 330 98-504 / 48-472 117 / 91 3 / 0TULANE 24 - 31 24 / 22 9 / 17 12 / 5 3 / 0 32-161 / 52-325 25-53-1 / 12-20-2 228 / 121 85-389 / 72-446 17 / 15 1 / 3CINCINNATI 48 - 20 28 / 17 6 / 11 19 / 6 3 / 0 33-114 / 31-139 32-46-0 / 15-28-1 464 / 187 79-578 / 59-326 17 / 120 0 / 1Memphis 13 - 70 27 / 23 8 / 14 15 / 8 4 / 1 37-115 / 34-333 28-54-3 / 10-15-0 351 / 302 91-466 / 49-635 196 / 141 3 / 0Totals 299 - 540 279 / 296 72 / 140 172 / 136 35 / 20 396-1292 / 501-2946 307-543-16 / 227-341-7 3815 / 3554 939-5107 / 842-6500 946 / 979 21 / 11
3rd Down 4th Down Time of TOP Avg Avg Avg Punting PenaltiesOpponent Conversions Conversions Possession Margin Yds/Rush Yds/Pass Yds/Play Number-Avg Number-Yards SacksJAMES MADISON 6-16 / 5-11 2-5 / 0-1 30:03 / 29:57 0 : 0 6 2.3 / 9.8 5.5 / 8.5 4.4 / 9.3 4-49.2 / 4-43.0 8-61 / 14-172 1 / 1West Virginia 7-17 / 6-13 1-2 / 1-1 31:42 / 28:18 3 : 2 4 4.4 / 4.5 7.0 / 11.9 5.9 / 7.6 5-40.0 / 4-40.0 8-103 / 4-55 1 / 0VIRGINIA TECH 4-15 / 9-15 1-1 / 1-1 20:47 / 39:13 -18:26 1.3 / 4.6 8.0 / 11.8 4.6 / 7.1 6-38.0 / 2-46.0 6-40 / 7-69 1 / 2UConn 8-16 / 6-13 1-1 / 1-1 37:22 / 22:38 1 4 : 4 4 3.6 / 5.0 10.9 / 10.4 6.9 / 7.7 4-43.5 / 5-38.2 8-78 / 4-40 1 / 1USF 8-18 / 10-14 2-3 / 0-0 32:31 / 27:29 5 : 0 2 3.0 / 7.8 6.7 / 8.8 5.0 / 8.1 5-36.0 / 2-32.5 6-58 / 8-102 1 / 1TEMPLE 3-14 / 14-20 1-2 / 1-1 22:40 / 37:20 -14:40 1.5 / 3.9 6.7 / 10.4 4.8 / 6.6 6-45.3 / 2-39.5 8-96 / 8-65 0 / 4UCF 7-17 / 5-9 0-1 / 0-1 32:08 / 27:52 4 : 1 6 5.1 / 5.7 4.8 / 11.8 5.0 / 8.3 8-49.9 / 3-46.3 10-55 / 10-77 2 / 1BYU 4-12 / 6-15 1-1 / 0-2 26:44 / 33:16 -6:32 3.3 / 3.3 9.9 / 7.8 6.4 / 5.8 3-45.7 / 5-46.4 2-15 / 8-69 3 / 1Houston 12-22 / 5-9 2-2 / 0-0 40:23 / 19:37 2 0 : 4 6 1.5 / 5.5 6.3 / 15.0 5.1 / 9.8 3-42.7 / 3-46.0 7-51 / 4-34 0 / 1TULANE 8-18 / 6-15 2-5 / 3-3 26:25 / 33:35 -7:10 5.0 / 6.2 4.3 / 6.1 4.6 / 6.2 4-40.0 / 4-39.5 2-20 / 8-70 0 / 1CINCINNATI 8-16 / 3-10 2-2 / 0-1 33:41 / 26:19 7 : 2 2 3.5 / 4.5 10.1 / 6.7 7.3 / 5.5 2-62.5 / 6-52.7 7-54 / 10-90 1 / 0Memphis 7-18 / 3-6 2-4 / 1-1 39:50 / 20:10 1 9 : 4 0 3.1 / 9.8 6.5 / 20.1 5.1 / 13.0 3-37.3 / 1-48.0 8-74 / 8-88 0 / 2Totals 82-199 / 78-150 17-29 / 8-13 374:16 / 345:44 2 8 : 3 2 3.3 / 5.9 7.0 / 10.4 5.4 / 7.7 53-43.6 / 41-43.7 80-705 / 93-931 11 / 15
Note: Game totals are displayed in the format TEAM/OPPONENT for each category

The Automated ScoreBookECU Team Game-by-Game (as of Nov 27, 2017)
All games
TEAM STATISTICS
Rushing Receiving Passing Kick Returns Punt Returns totDate Opponent no. yds td lg no. yds td lg cmp-att-int yds td lg no. yds td lg no. yds td lg offSep 2 JAMES MADISON 30 70 2 11 28 292 0 29 28-53-3 292 0 29 6 132 0 30 1 1 0 1 362Sep 9 at West Virginia 32 142 0 26 23 328 2 95 23-47-2 328 2 95 5 89 0 26 0 0 0 0 470Sep 16 VIRGINIA TECH 31 40 0 9 11 241 2 76 11-30-1 241 2 76 2 40 0 21 1 -1 0 0 281Sep 24 at UConn 47 170 2 14 30 426 3 75 30-39-0 426 3 75 1 20 0 20 0 0 0 0 596Sep 30 USF 36 108 2 15 21 306 2 44 21-46-2 306 2 44 7 145 0 27 0 0 0 0 414Oct 7 TEMPLE 22 34 0 11 20 253 1 39 20-38-1 253 1 39 2 29 0 15 1 0 0 0 287Oct 14 at UCF 37 187 0 57 15 160 3 41 15-33-1 160 3 41 4 71 0 29 1 -1 0 0 347Oct 21 BYU 35 115 1 13 20 298 2 41 20-30-0 298 2 41 1 21 0 21 0 0 0 0 413Nov 4 at Houston 24 36 0 9 54 468 3 34 54-74-2 468 3 34 5 117 0 48 0 0 0 0 504Nov 11 TULANE 32 161 2 27 25 228 1 28 25-53-1 228 1 28 1 12 0 12 1 -5 0 0 389Nov 18 CINCINNATI 33 114 1 16 32 464 5 95 32-46-0 464 5 95 1 8 0 8 0 0 0 0 578Nov 25 at Memphis 37 115 0 12 28 351 2 33 28-54-3 351 2 33 9 194 0 38 1 2 0 2 466ECU 396 1292 10 57 307 3815 26 95 307-543-16 3815 26 95 44 878 0 48 6 -4 0 2 5107Opponents 501 2946 36 85 227 3554 31 89 227-341-7 3554 31 89 20 533 1 100 17 204 1 66 6500
Games: 12 • Avg/rush: 3.3 • Avg/catch: 12.4 • Pass effic: 125.46 • KR avg: 20.0 • PR avg: -0.7 • All purpose avg/game: 504.4 • Total offense avg/gm: 425.6
Tackles Sacks Fumble Pass Defense blkd PAT Attempts offDate Opponent ua a total tfl-yds no-yds ff fr-yds int-yds qbh brup kick kick rush rcv saf t/o ptsSep 2 JAMES MADISON 38 34 72 3.0-15 1.0-9 2 1-0 1--3 3 1 0 2-2 0 0 0 7 14Sep 9 at West Virginia 60 12 72 5.0-19 1.0-5 0 0-0 0-0 2 5 0 2-2 0 0 0 0 20Sep 16 VIRGINIA TECH 47 68 115 5.0-24 1.0-11 0 0-0 0-0 3 3 0 2-2 0 0 0 0 17Sep 24 at UConn 39 40 79 3.0-8 1.0-4 0 0-0 1-0 0 1 0 5-5 0 0 0 7 41Sep 30 USF 37 36 73 1.0-7 1.0-7 1 1-0 0-0 1 0 0 4-4 0 0 0 0 31Oct 7 TEMPLE 38 46 84 1.0-3 0.0-0 1 0-0 1-31 3 5 0 1-1 0 0 0 0 10Oct 14 at UCF 39 36 75 4.0-11 2.0-6 1 1-0 0-0 2 1 0 3-3 0 0 0 0 21Oct 21 BYU 35 48 83 5.0-23 3.0-20 1 0-0 1-25 1 7 0 3-3 0 0 0 7 33Nov 4 at Houston 25 22 47 2.0-4 0.0-0 0 0-0 0-0 0 2 0 3-3 0 0 0 0 27Nov 11 TULANE 39 34 73 4.0-10 0.0-0 0 1-0 2-10 2 1 0 3-3 0 0 0 3 24Nov 18 CINCINNATI 27 38 65 4.0-22 1.0-12 1 0-0 1-9 1 4 0 6-6 0 0 0 7 48Nov 25 at Memphis 27 12 39 2.0-2 0.0-0 0 0-0 0-0 1 0 0 1-2 0 0 0 0 13ECU 451 426 877 39.0-148 11.0-74 7 4-0 7-72 19 30 0 35-36 0 0 0 31 299Opponents 494 353 847 67.0-210 15.0-112 5 5-6 16-236 56 70 2 69-72 0 0 0 121 540
Punting Field Goals KickoffsDate Opponent no. yds avg long blkd tb fc 50+ i20 md-att long blkd no. yds avg tb obSep 2 JAMES MADISON 4 197 49.2 58 0 1 0 2 2 0-1 0 0 3 138 46.0 1 1Sep 9 at West Virginia 5 200 40.0 55 0 0 2 1 1 2-3 45 0 4 260 65.0 1 0Sep 16 VIRGINIA TECH 6 228 38.0 51 0 0 2 1 1 1-2 35 1 4 260 65.0 2 0Sep 24 at UConn 4 174 43.5 50 0 0 2 1 2 2-3 46 0 8 517 64.6 6 0Sep 30 USF 5 180 36.0 52 0 0 0 2 2 1-1 28 0 5 324 64.8 4 0Oct 7 TEMPLE 6 272 45.3 65 0 2 0 1 1 1-2 25 0 3 195 65.0 3 0Oct 14 at UCF 8 399 49.9 64 0 1 1 4 2 0-0 0 0 4 260 65.0 4 0Oct 21 BYU 3 137 45.7 62 0 0 2 1 1 4-4 42 0 8 520 65.0 4 0Nov 4 at Houston 3 128 42.7 51 0 1 2 1 1 2-3 52 0 6 390 65.0 6 0Nov 11 TULANE 4 160 40.0 50 0 0 4 1 2 1-1 29 0 5 324 64.8 4 0Nov 18 CINCINNATI 2 125 62.5 63 0 1 0 2 1 2-3 50 0 9 577 64.1 4 0Nov 25 at Memphis 3 112 37.3 45 0 0 1 0 1 0-2 0 0 3 182 60.7 1 1ECU 53 2312 43.6 65 0 6 16 17 17 16-25 52 1 62 3947 63.7 40 2Opponents 41 1790 43.7 65 0 1 16 9 18 11-17 44 0 93 5742 61.7 44 3

The Automated ScoreBookECU Opponent Game-by-Game (as of Nov 27, 2017)
All games
OPPONENT STATISTICS
Rushing Receiving Passing Kick Returns Punt Returns totDate Opponent no. yds td lg no. yds td lg cmp-att-int yds td lg no. yds td lg no. yds td lg offSep 2 JAMES MADISON 42 410 4 85 17 204 1 27 17-24-1 204 1 27 1 14 0 14 1 -1 0 0 614Sep 9 at West Virginia 47 211 3 41 24 403 5 75 24-34-0 403 5 75 3 88 0 32 1 23 0 23 614Sep 16 VIRGINIA TECH 62 287 3 34 25 388 5 70 25-33-0 388 5 70 2 37 0 21 3 10 0 5 675Sep 24 at UConn 38 190 2 29 24 406 3 79 24-39-1 406 3 79 2 42 0 22 1 10 0 10 596Sep 30 USF 50 390 5 75 13 185 2 35 13-21-0 185 2 35 1 24 0 24 3 19 0 12 575Oct 7 TEMPLE 46 179 2 22 21 344 2 48 21-33-1 344 2 48 0 0 0 0 2 7 0 8 523Oct 14 at UCF 42 238 5 20 25 365 2 48 25-31-0 365 2 48 0 0 0 0 3 118 1 66 603Oct 21 BYU 31 102 0 17 26 319 2 46 26-41-1 319 2 46 4 93 0 27 1 9 0 9 421Nov 4 at Houston 26 142 3 22 15 330 3 75 15-22-0 330 3 75 0 0 0 0 0 0 0 0 472Nov 11 TULANE 52 325 4 60 12 121 0 35 12-20-2 121 0 35 1 15 0 15 0 0 0 0 446Nov 18 CINCINNATI 31 139 0 15 15 187 3 75 15-28-1 187 3 75 5 120 0 28 0 0 0 0 326Nov 25 at Memphis 34 333 5 60 10 302 3 89 10-15-0 302 3 89 1 100 1 100 2 9 0 6 635Opponents 501 2946 36 85 227 3554 31 89 227-341-7 3554 31 89 20 533 1 100 17 204 1 66 6500ECU 396 1292 10 57 307 3815 26 95 307-543-16 3815 26 95 44 878 0 48 6 -4 0 2 5107
Games: 12 • Avg/rush: 5.9 • Avg/catch: 15.7 • Pass effic: 180.01 • KR avg: 26.6 • PR avg: 12.0 • All purpose avg/game: 622.8 • Total offense avg/gm: 541.7
Tackles Sacks Fumble Pass Defense blkd PAT Attempts offDate Opponent ua a total tfl-yds no-yds ff fr-yds int-yds qbh brup kick kick rush rcv saf t/o ptsSep 2 JAMES MADISON 39 44 83 5.0-14 1.0-6 0 1-0 3--1 7 1 0 4-5 0 0 0 14 34Sep 9 at West Virginia 45 18 63 3.0-5 0.0-0 0 0-0 2-1 3 9 0 8-8 0 0 0 14 56Sep 16 VIRGINIA TECH 29 24 53 11.0-31 2.0-19 2 2-0 1-10 8 4 1 7-7 0 0 0 17 64Sep 24 at UConn 53 36 89 3.0-11 1.0-8 0 0-0 0-0 2 0 0 5-5 0 0 0 0 38Sep 30 USF 41 32 73 7.0-23 1.0-7 0 0-0 2-43 7 8 0 7-8 0 0 0 13 61Oct 7 TEMPLE 29 24 53 8.0-37 4.0-26 0 0-0 1-16 9 7 0 4-4 0 0 0 7 34Oct 14 at UCF 31 40 71 4.0-18 1.0-13 0 0-0 1-50 3 7 0 9-9 0 0 0 7 63Oct 21 BYU 34 36 70 4.0-9 1.0-5 1 1-0 0-0 2 6 0 2-2 0 0 0 7 17Nov 4 at Houston 56 33 89 6.0-24 1.0-8 1 1-6 2-85 3 3 0 7-7 0 0 0 21 52Nov 11 TULANE 42 18 60 5.0-12 1.0-8 1 0-0 1-0 5 12 0 4-4 0 0 0 0 31Nov 18 CINCINNATI 40 30 70 4.0-4 0.0-0 0 0-0 0-0 3 5 0 2-3 0 0 0 0 20Nov 25 at Memphis 55 18 73 7.0-22 2.0-12 0 0-0 3-32 4 8 1 10-10 0 0 0 21 70Opponents 494 353 847 67.0-210 15.0-112 5 5-6 16-236 56 70 2 69-72 0 0 0 121 540ECU 451 426 877 39.0-148 11.0-74 7 4-0 7-72 19 30 0 35-36 0 0 0 31 299
Punting Field Goals KickoffsDate Opponent no. yds avg long blkd tb fc 50+ i20 md-att long blkd no. yds avg tb obSep 2 JAMES MADISON 4 172 43.0 46 0 0 2 0 2 0-1 0 0 6 371 61.8 0 0Sep 9 at West Virginia 4 160 40.0 52 0 0 2 1 2 0-2 0 0 9 534 59.3 3 1Sep 16 VIRGINIA TECH 2 92 46.0 51 0 1 0 1 0 3-3 37 0 12 767 63.9 10 0Sep 24 at UConn 5 191 38.2 45 0 0 1 0 3 1-2 20 0 7 454 64.9 6 0Sep 30 USF 2 65 32.5 34 0 0 0 0 0 2-2 37 0 11 695 63.2 4 0Oct 7 TEMPLE 2 79 39.5 48 0 0 0 0 2 2-3 39 0 7 437 62.4 5 0Oct 14 at UCF 3 139 46.3 51 0 0 1 2 1 0-0 0 0 10 646 64.6 6 0Oct 21 BYU 5 232 46.4 59 0 0 2 2 3 1-2 22 0 2 123 61.5 1 0Nov 4 at Houston 3 138 46.0 48 0 0 3 0 0 1-1 44 0 9 508 56.4 3 0Nov 11 TULANE 4 158 39.5 47 0 0 2 0 1 1-1 26 0 5 297 59.4 3 0Nov 18 CINCINNATI 6 316 52.7 65 0 0 3 3 3 0-0 0 0 4 234 58.5 2 1Nov 25 at Memphis 1 48 48.0 48 0 0 0 0 1 0-0 0 0 11 676 61.5 1 1Opponents 41 1790 43.7 65 0 1 16 9 18 11-17 44 0 93 5742 61.7 44 3ECU 53 2312 43.6 65 0 6 16 17 17 16-25 52 1 62 3947 63.7 40 2

The Automated ScoreBookECU By-Quarter Statistics (as of Nov 27, 2017)
All games
3rd-Down Conversions
Date Opponent Score Overall 1st Qtr 2nd Qtr 3rd Qtr 4th Qtr OvertimeSep 2, 2017 JAMES MADISON L 14-34 6-16 37.5 1-3 33.3 1-4 25.0 2-3 66.7 2-6 33.3Sep 9, 2017 at West Virginia L 20-56 7-17 41.2 1-4 25.0 2-5 40.0 3-5 60.0 1-3 33.3Sep 16, 2017 VIRGINIA TECH L 17-64 4-15 26.7 2-3 66.7 0-4 0.0 1-4 25.0 1-4 25.0Sep 24, 2017 at UConn W 41-38 8-16 50.0 4-5 80.0 0-3 0.0 1-3 33.3 3-5 60.0Sep 30, 2017 USF L 31-61 8-18 44.4 2-6 33.3 3-5 60.0 1-3 33.3 2-4 50.0Oct 7, 2017 TEMPLE L 10-34 3-14 21.4 0-2 0.0 0-5 0.0 2-4 50.0 1-3 33.3Oct 14, 2017 at UCF L 21-63 7-17 41.2 0-2 0.0 4-6 66.7 2-6 33.3 1-3 33.3Oct 21, 2017 BYU W 33-17 4-12 33.3 1-2 50.0 2-4 50.0 1-4 25.0 0-2 0.0Nov 4, 2017 at Houston L 27-52 12-22 54.5 1-4 25.0 5-7 71.4 2-4 50.0 4-7 57.1Nov 11, 2017 TULANE L 24-31 8-18 44.4 2-3 66.7 2-4 50.0 1-3 33.3 3-7 42.9 0-1 0.0Nov 18, 2017 CINCINNATI W 48-20 8-16 50.0 1-3 33.3 4-7 57.1 1-1 100.0 2-5 40.0Nov 25, 2017 at Memphis L 13-70 7-18 38.9 2-6 33.3 1-5 20.0 1-2 50.0 3-5 60.0
ECU 82-199 41.2 17-43 39.5 24-59 40.7 18-42 42.9 23-54 42.6 0-1 0.0Opponents 78-150 52.0 23-38 60.5 13-35 37.1 22-38 57.9 20-38 52.6 0-1 0.0
4th-Down Conversions
Date Opponent Score Overall 1st Qtr 2nd Qtr 3rd Qtr 4th Qtr OvertimeSep 2, 2017 JAMES MADISON L 14-34 2-5 40.0 0-0 0.0 0-0 0.0 0-1 0.0 2-4 50.0Sep 9, 2017 at West Virginia L 20-56 1-2 50.0 1-1 100.0 0-1 0.0 0-0 0.0 0-0 0.0Sep 16, 2017 VIRGINIA TECH L 17-64 1-1 100.0 0-0 0.0 0-0 0.0 0-0 0.0 1-1 100.0Sep 24, 2017 at UConn W 41-38 1-1 100.0 0-0 0.0 1-1 100.0 0-0 0.0 0-0 0.0Sep 30, 2017 USF L 31-61 2-3 66.7 0-0 0.0 1-1 100.0 1-1 100.0 0-1 0.0Oct 7, 2017 TEMPLE L 10-34 1-2 50.0 0-0 0.0 1-1 100.0 0-1 0.0 0-0 0.0Oct 14, 2017 at UCF L 21-63 0-1 0.0 0-0 0.0 0-0 0.0 0-1 0.0 0-0 0.0Oct 21, 2017 BYU W 33-17 1-1 100.0 1-1 100.0 0-0 0.0 0-0 0.0 0-0 0.0Nov 4, 2017 at Houston L 27-52 2-2 100.0 0-0 0.0 0-0 0.0 1-1 100.0 1-1 100.0Nov 11, 2017 TULANE L 24-31 2-5 40.0 1-1 100.0 0-0 0.0 0-1 0.0 1-2 50.0 0-1 0.0Nov 18, 2017 CINCINNATI W 48-20 2-2 100.0 1-1 100.0 1-1 100.0 0-0 0.0 0-0 0.0Nov 25, 2017 at Memphis L 13-70 2-4 50.0 0-0 0.0 1-1 100.0 1-1 100.0 0-2 0.0
ECU 17-29 58.6 4-4 100.0 5-6 83.3 3-7 42.9 5-11 45.5 0-1 0.0Opponents 8-13 61.5 1-2 50.0 3-3 100.0 1-1 100.0 2-6 33.3 1-1 100.0
Time of Possession
Date Opponent Score Overall 1st Qtr 2nd Qtr 3rd Qtr 4th Qtr OvertimeSep 2, 2017 JAMES MADISON L 14-34 30:03 5:08 7:27 7:50 9:38Sep 9, 2017 at West Virginia L 20-56 31:42 9:41 8:48 8:30 4:43Sep 16, 2017 VIRGINIA TECH L 17-64 20:47 6:42 3:03 5:04 5:58Sep 24, 2017 at UConn W 41-38 37:22 11:10 8:30 6:28 11:14Sep 30, 2017 USF L 31-61 32:31 10:22 9:27 5:45 6:57Oct 7, 2017 TEMPLE L 10-34 22:40 5:19 5:50 8:29 3:02Oct 14, 2017 at UCF L 21-63 32:08 5:29 9:45 11:12 5:42Oct 21, 2017 BYU W 33-17 26:44 4:47 7:55 8:13 5:49Nov 4, 2017 at Houston L 27-52 40:23 5:47 12:35 11:14 10:47Nov 11, 2017 TULANE L 24-31 26:25 5:03 6:36 5:46 9:00 0:00Nov 18, 2017 CINCINNATI W 48-20 33:41 10:27 10:19 3:19 9:36Nov 25, 2017 at Memphis L 13-70 39:50 10:09 9:21 9:51 10:29
ECU Total 374:16 90:04 99:36 91:41 92:55 0:00Avg. 31:11 7:30 8:18 7:38 7:44 0:00
Opponents Total 345:44 89:56 80:24 88:19 87:05 0:00Avg. 28:48 7:29 6:42 7:21 7:15 0:00
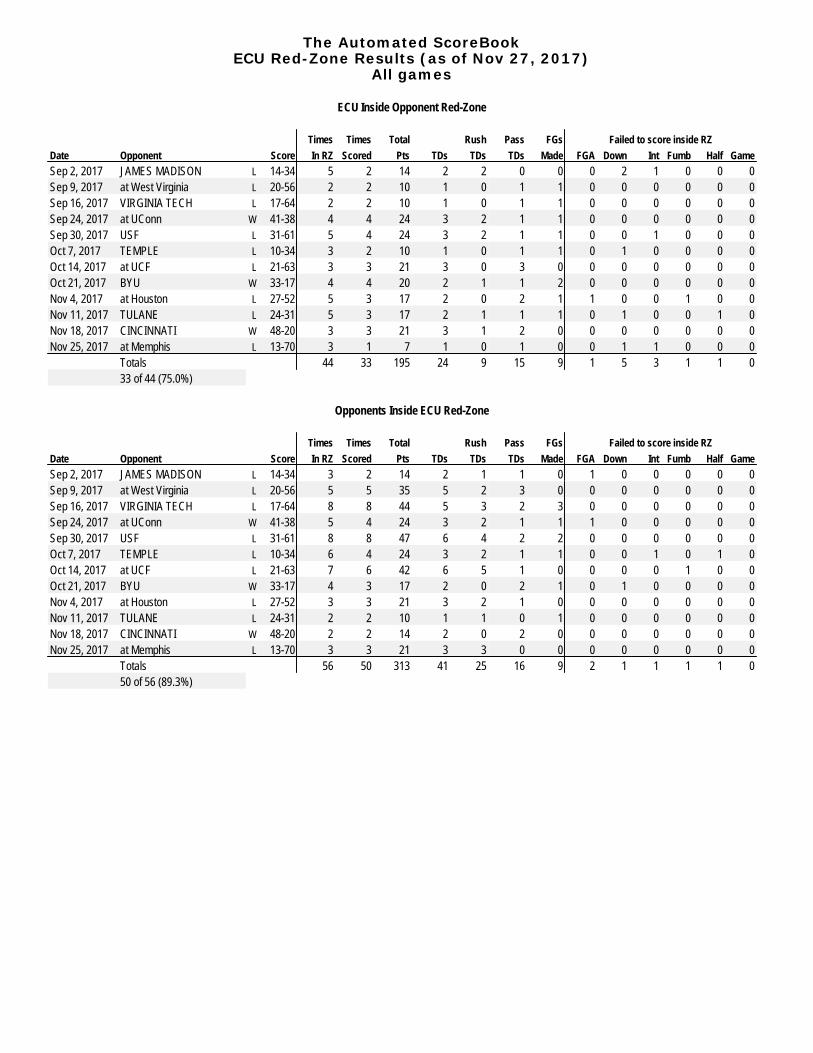
The Automated ScoreBookECU Red-Zone Results (as of Nov 27, 2017)
All games
ECU Inside Opponent Red-Zone
Times Times Total Rush Pass FGs Failed to score inside RZDate Opponent Score In RZ Scored Pts TDs TDs TDs Made FGA Down Int Fumb Half GameSep 2, 2017 JAMES MADISON L 14-34 5 2 14 2 2 0 0 0 2 1 0 0 0Sep 9, 2017 at West Virginia L 20-56 2 2 10 1 0 1 1 0 0 0 0 0 0Sep 16, 2017 VIRGINIA TECH L 17-64 2 2 10 1 0 1 1 0 0 0 0 0 0Sep 24, 2017 at UConn W 41-38 4 4 24 3 2 1 1 0 0 0 0 0 0Sep 30, 2017 USF L 31-61 5 4 24 3 2 1 1 0 0 1 0 0 0Oct 7, 2017 TEMPLE L 10-34 3 2 10 1 0 1 1 0 1 0 0 0 0Oct 14, 2017 at UCF L 21-63 3 3 21 3 0 3 0 0 0 0 0 0 0Oct 21, 2017 BYU W 33-17 4 4 20 2 1 1 2 0 0 0 0 0 0Nov 4, 2017 at Houston L 27-52 5 3 17 2 0 2 1 1 0 0 1 0 0Nov 11, 2017 TULANE L 24-31 5 3 17 2 1 1 1 0 1 0 0 1 0Nov 18, 2017 CINCINNATI W 48-20 3 3 21 3 1 2 0 0 0 0 0 0 0Nov 25, 2017 at Memphis L 13-70 3 1 7 1 0 1 0 0 1 1 0 0 0
Totals 44 33 195 24 9 15 9 1 5 3 1 1 033 of 44 (75.0%)
Opponents Inside ECU Red-Zone
Times Times Total Rush Pass FGs Failed to score inside RZDate Opponent Score In RZ Scored Pts TDs TDs TDs Made FGA Down Int Fumb Half GameSep 2, 2017 JAMES MADISON L 14-34 3 2 14 2 1 1 0 1 0 0 0 0 0Sep 9, 2017 at West Virginia L 20-56 5 5 35 5 2 3 0 0 0 0 0 0 0Sep 16, 2017 VIRGINIA TECH L 17-64 8 8 44 5 3 2 3 0 0 0 0 0 0Sep 24, 2017 at UConn W 41-38 5 4 24 3 2 1 1 1 0 0 0 0 0Sep 30, 2017 USF L 31-61 8 8 47 6 4 2 2 0 0 0 0 0 0Oct 7, 2017 TEMPLE L 10-34 6 4 24 3 2 1 1 0 0 1 0 1 0Oct 14, 2017 at UCF L 21-63 7 6 42 6 5 1 0 0 0 0 1 0 0Oct 21, 2017 BYU W 33-17 4 3 17 2 0 2 1 0 1 0 0 0 0Nov 4, 2017 at Houston L 27-52 3 3 21 3 2 1 0 0 0 0 0 0 0Nov 11, 2017 TULANE L 24-31 2 2 10 1 1 0 1 0 0 0 0 0 0Nov 18, 2017 CINCINNATI W 48-20 2 2 14 2 0 2 0 0 0 0 0 0 0Nov 25, 2017 at Memphis L 13-70 3 3 21 3 3 0 0 0 0 0 0 0 0
Totals 56 50 313 41 25 16 9 2 1 1 1 1 050 of 56 (89.3%)

The Automated ScoreBookECU Overall Team Statistics (as of Nov 27, 2017)
All games
Team Statistics ECU OPPSCORING 299 540 Points Per Game 24.9 45.0 Points Off Turnovers 31 121FIRST DOWNS 279 296 R u s h i n g 72 140 P a s s i n g 172 136 P e n a l t y 35 20RUSHING YARDAGE 1292 2946 Yards gained rushing 1523 3098 Yards lost rushing 231 152 Rushing Attempts 396 501 Average Per Rush 3.3 5.9 Average Per Game 107.7 245.5 TDs Rushing 10 36PASSING YARDAGE 3815 3554 C o m p - A t t - I n t 307-543-16 227-341-7 Average Per Pass 7.0 10.4 Average Per Catch 12.4 15.7 Average Per Game 317.9 296.2 TDs Passing 26 31TOTAL OFFENSE 5107 6500 Total Plays 939 842 Average Per Play 5.4 7.7 Average Per Game 425.6 541.7KICK RETURNS: #-Yards 44-878 20-533PUNT RETURNS: #-Yards 6--4 17-204INT RETURNS: #-Yards 7-72 16-236KICK RETURN AVERAGE 20.0 26.6PUNT RETURN AVERAGE -0.7 12.0INT RETURN AVERAGE 10.3 14.8FUMBLES-LOST 12-5 10-4PENALTIES-Yards 80-705 93-931 Average Per Game 58.8 77.6PUNTS-Yards 53-2312 41-1790 Average Per Punt 43.6 43.7 Net punt average 37.5 43.3KICKOFFS-Yards 62-3947 93-5742 Average Per Kick 63.7 61.7 Net kick average 38.9 40.5TIME OF POSSESSION/Game 3 1 : 1 1 2 8 : 4 93RD-DOWN Conversions 82/199 78/150 3rd-Down Pct 41% 52%4TH-DOWN Conversions 17/29 8/13 4th-Down Pct 59% 62%SACKS BY-Yards 11-74 15-112MISC YARDS -40 0TOUCHDOWNS SCORED 36 73FIELD GOALS-ATTEMPTS 16-25 11-17ON-SIDE KICKS 0-1 0-1RED-ZONE SCORES (33-44) 75% (50-56) 89%RED-ZONE TOUCHDOWNS (24-44) 55% (41-56) 73%PAT-ATTEMPTS (35-36) 97% (69-72) 96%ATTENDANCE 257090 182447 Games/Avg Per Game 7/36727 5/36489 Neutral Site Games 0/0
Score by Quarters 1st 2nd 3rd 4th OT TotalECU 89 57 88 65 0 299Opponents 147 160 148 78 7 540

The Automated ScoreBookECU Overall Individual Statistics (as of Nov 27, 2017)
All games
Rushing gp att gain loss net avg td lg avg/gHOWE, Hussein 12 96 434 15 419 4.4 3 25 34.9PINNIX, Darius 12 74 255 26 229 3.1 2 57 19.1DYE, Tyshon 8 50 224 7 217 4.3 0 26 27.1SIRK, Thomas 11 64 229 64 165 2.6 3 15 15.0SCOTT, Derrell 9 41 145 6 139 3.4 2 27 15.4ANDERSON, Devin 4 29 98 15 83 2.9 0 11 20.8GRAYSON, Davon 11 6 40 0 40 6.7 0 12 3.6FARRIER, Deondr 9 2 20 0 20 10.0 0 13 2.2GREEN, Terrell 9 1 16 0 16 16.0 0 16 1.8BROWN, Trevon 12 2 16 0 16 8.0 0 9 1.3HERRING, Reid 2 4 7 3 4 1.0 0 4 2.0JOHNSON, Quay 10 3 9 6 3 1.0 0 5 0.3WILLIAMS, Jimmy 10 1 2 0 2 2.0 0 2 0.2TEAM 4 5 0 21 -21 -4.2 0 0 -5.2MINSHEW, Grdnr 10 18 28 68 -40 -2.2 0 7 -4.0Total 12 396 1523 231 1292 3.3 10 57 107.7Opponents 12 501 3098 152 2946 5.9 36 85 245.5
Passing gp effic comp-att-int pct yds td lg avg/gMINSHEW, Grdnr 10 129.13 174-304-7 57.2 2140 16 95 214.0SIRK, Thomas 11 118.79 132-238-9 55.5 1655 9 75 150.5HERRING, Reid 2 598.00 1-1-0 100.0 20 1 20 10.0Total 12 125.46 307-543-16 56.5 3815 26 95 317.9Opponents 12 180.01 227-341-7 66.6 3554 31 89 296.2
Receiving gp no. yds avg td lg avg/gBROWN, Trevon 12 60 1069 17.8 7 95 89.1GRAYSON, Davon 11 59 886 15.0 6 75 80.5JOHNSON, Quay 10 47 464 9.9 3 31 46.4WILLIAMS, Jimmy 10 32 447 14.0 3 44 44.7HOWE, Hussein 12 30 219 7.3 0 23 18.2FARRIER, Deondr 9 24 211 8.8 3 31 23.4DEANS, Tahj 9 16 177 11.1 2 23 19.7BAGGETT, Steve 12 11 105 9.5 2 41 8.8PINNIX, Darius 12 9 49 5.4 0 10 4.1DYE, Tyshon 8 6 56 9.3 0 30 7.0SCOTT, Derrell 9 3 31 10.3 0 29 3.4SIRK, Thomas 11 3 28 9.3 0 16 2.5VINES, Mydreon 9 2 39 19.5 0 34 4.3GRAY, Malik 7 2 18 9.0 0 11 2.6MARSHMON, Cam 5 2 13 6.5 0 10 2.6ANDERSON, Devin 4 1 3 3.0 0 3 0.8Total 12 307 3815 12.4 26 95 317.9Opponents 12 227 3554 15.7 31 89 296.2
Punt Returns no. yds avg td lgJOHNSON, Quay 3 -2 -0.7 0 0IRVIN, Tim 1 1 1.0 0 1GORE, Colby 1 -5 -5.0 0 0BROWN, Trevon 1 2 2.0 0 2Total 6 -4 -0.7 0 2Opponents 17 204 12.0 1 66
Interceptions no. yds avg td lgRAMSEUR, Aaron 2 29 14.5 0 31PRICE, Jalen 1 12 12.0 0 12FULP, Bobby 1 -3 -3.0 0 0GIBBS, Cannon 1 25 25.0 0 25LOVE, Chris 1 9 9.0 0 9WIGGINS, Korrin 1 0 0.0 0 0Total 7 72 10.3 0 31Opponents 16 236 14.8 4 74
Kick Returns no. yds avg td lgBROWN, Trevon 21 452 21.5 0 48LOVE, Chris 13 272 20.9 0 30PINNIX, Darius 4 51 12.8 0 25JOHNSON, Quay 2 11 5.5 0 11HOWE, Hussein 2 36 18.0 0 21GRAYSON, Davon 2 49 24.5 0 29GORE, Colby 0 7 0.0 0 7Total 44 878 20.0 0 48Opponents 20 533 26.6 1 100
Fumble Returns no. yds avg td lgTotal 0 0 0.0 0 0Opponents 1 6 6.0 0 6

The Automated ScoreBookECU Overall Individual Statistics (as of Nov 27, 2017)
All games
PATScoring td fg kick rush rcv pass dxp saf ptsVERITY, Jake - 16-25 35-36 - - - - - 83BROWN, Trevon 7 - - - - - - - 42GRAYSON, Davon 6 - - - - - - - 36WILLIAMS, Jimmy 3 - - - - - - - 18FARRIER, Deondr 3 - - - - - - - 18SIRK, Thomas 3 - - - - - - - 18JOHNSON, Quay 3 - - - - - - - 18HOWE, Hussein 3 - - - - - - - 18BAGGETT, Steve 2 - - - - - - - 12DEANS, Tahj 2 - - - - - - - 12SCOTT, Derrell 2 - - - - - - - 12PINNIX, Darius 2 - - - - - - - 12Total 36 16-25 35-36 - - - - - 299Opponents 73 11-17 69-72 - - 0-1 - - 540
Total Offense g plays rush pass total avg/gMINSHEW, Grdnr 10 322 -40 2140 2100 210.0SIRK, Thomas 11 302 165 1655 1820 165.5HOWE, Hussein 12 96 419 0 419 34.9PINNIX, Darius 12 74 229 0 229 19.1DYE, Tyshon 8 50 217 0 217 27.1SCOTT, Derrell 9 41 139 0 139 15.4ANDERSON, Devin 4 29 83 0 83 20.8GRAYSON, Davon 11 6 40 0 40 3.6HERRING, Reid 2 5 4 20 24 12.0FARRIER, Deondr 9 2 20 0 20 2.2BROWN, Trevon 12 2 16 0 16 1.3GREEN, Terrell 9 1 16 0 16 1.8JOHNSON, Quay 10 3 3 0 3 0.3WILLIAMS, Jimmy 10 1 2 0 2 0.2TEAM 4 5 -21 0 -21 -5.2Total 12 939 1292 3815 5107 425.6Opponents 12 842 2946 3554 6500 541.7
Field Goals fg pct. 01-19 20-29 30-39 40-49 50-99 lg blkVERITY, Jake 16-25 64.0 0-0 6-6 3-5 5-9 2-5 52 1
FG Sequence ECU OpponentsJames Madison 51 35West Virginia (23),(45),49 44,45Virginia Tech (35),47 (25),(34),(37)UConn (46),(26),39 (20),33USF (28) (37),(28)Temple (25),50 52,(29),(39)UCF - -BYU (42),(42),(32),(33) (22),41Houston (22),37,(52) (44)Tulane (29) (26)Cincinnati 41,(46),(50) -Memphis 52,40 -
Numbers in (parentheses) indicate field goal was made.
Punting no. yds avg lg tb fc i20 50+ blkBARNES, Austin 50 2200 44.0 65 6 15 16 17 0VERITY, Jake 3 112 37.3 45 0 1 1 0 0Total 53 2312 43.6 65 6 16 17 17 0Opponents 41 1790 43.7 65 1 16 18 9 0
Kickoffs no. yds avg tb ob retn net ydlnPRATT, Caleb 61 3938 64.6 40 1VERITY, Jake 1 9 9.0 0 1Total 62 3947 63.7 40 2 26.6 38.9 26Opponents 93 5742 61.7 44 3 20.0 40.5 24

The Automated ScoreBookECU Overall Individual Statistics (as of Nov 27, 2017)
All games
All Purpose g rush rcv pr kr ir total avg/gBROWN, Trevon 12 16 1069 2 452 0 1539 128.2GRAYSON, Dav 11 40 886 0 49 0 975 88.6HOWE, Hussein 12 419 219 0 36 0 674 56.2JOHNSON, Qua 10 3 464 -2 11 0 476 47.6WILLIAMS, Jim 10 2 447 0 0 0 449 44.9PINNIX, Darius 12 229 49 0 51 0 329 27.4LOVE, Chris 12 0 0 0 272 9 281 23.4DYE, Tyshon 8 217 56 0 0 0 273 34.1FARRIER, Deon 9 20 211 0 0 0 231 25.7SIRK, Thomas 11 165 28 0 0 0 193 17.5DEANS, Tahj 9 0 177 0 0 0 177 19.7SCOTT, Derrell 9 139 31 0 0 0 170 18.9BAGGETT, Stev 12 0 105 0 0 0 105 8.8ANDERSON, De 4 83 3 0 0 0 86 21.5VINES, Mydreon 9 0 39 0 0 0 39 4.3RAMSEUR, Aar 12 0 0 0 0 29 29 2.4GIBBS, Cannon 12 0 0 0 0 25 25 2.1GRAY, Malik 7 0 18 0 0 0 18 2.6GREEN, Terrell 9 16 0 0 0 0 16 1.8MARSHMON, C 5 0 13 0 0 0 13 2.6PRICE, Jalen 12 0 0 0 0 12 12 1.0HERRING, Reid 2 4 0 0 0 0 4 2.0GORE, Colby 10 0 0 -5 7 0 2 0.2IRVIN, Tim 6 0 0 1 0 0 1 0.2FULP, Bobby 10 0 0 0 0 -3 -3 -0.3TEAM 4 -21 0 0 0 0 -21 -5.2MINSHEW, Grd 10 -40 0 0 0 0 -40 -4.0Total 12 1292 3815 -4 878 72 6053 504.4Opponents 12 2946 3554 204 533 236 7473 622.8

The Automated ScoreBookECU Overall Defensive Statistics (as of Nov 27, 2017)
All games
Tackles Sacks Pass defense Fumbles blkd# Defensive Leaders gp ua a tot tfl/yds no-yds int-yds brup qbh rcv-yds ff kick saf15 WIGGINS, Korrin 11 54 42 96 4.0-18 . 1-0 1 . . . . .7 WILLIAMS, Jrdn 12 42 47 89 3.0-7 . . 2 . . 1 . .42 SUTTON, Devon 12 31 37 68 5.5-17 1.0-4 . 3 1 1-0 1 . .51 RAMSEUR, Aaron 12 29 28 57 2.5-3 . 2-29 . 1 . . . .33 GIBBS, Cannon 12 21 29 50 0.5-1 . 1-25 1 . . . . .8 FULP, Bobby 10 29 16 45 1.5-5 1.0-4 1--3 2 . . . . .26 GORE, Colby 10 25 12 37 1.0-8 1.0-8 . 4 . . . . .96 ANDERSON, Kiant 9 22 13 35 6.5-43 4.5-38 . . 7 1-0 2 . .13 ROBINSON, Dvndr 6 17 16 33 1.5-4 . . 1 . 1-0 . . .56 OWENS, Tyree 10 12 18 30 3.5-16 1.5-8 . . 3 . 1 . .35 LOVE, Chris 12 23 7 30 . . 1-9 4 . . . . .1 IRVIN, Tim 6 20 9 29 0.5-1 . . . . . . . .93 PRICE, Jalen 12 10 17 27 1.0-1 . 1-12 . 1 . . . .20 TEAGUE, Austin 12 9 13 22 . . . 1 . . 1 . .5 SEARGENT, Corey 7 11 8 19 . . . 2 . . . . .94 TURNER, Alex 10 6 11 17 1.5-5 1.0-4 . . . . . . .59 HICKERSON, Chnd 9 4 11 15 . . . . . . . . .87 ELMORE, Gaelin 11 8 6 14 . . . 1 1 . . . .44 FUTRELL, Kendal 9 9 4 13 3.0-13 1.0-8 . . 1 . 1 . .6 HOLTON, Marcus 8 6 7 13 . . . 2 . . . . .50 JAMES, Shaun 12 4 8 12 0.5-0 . . 2 2 1-0 . . .31 CANADY, Keyshwn 8 10 2 12 . . . 3 . . . . .21 TILLMAN, Ray 2 6 5 11 . . . . . . . . .97 BAILEY, Demage 12 2 9 11 . . . . 1 . . . .89 PURVIS, Raequan 12 3 8 11 1.0-2 . . . . . . . .30 CARTER, Joe 11 5 6 11 . . . . . . . . .38 BIVENS, Bruce 11 5 5 10 . . . . . . . . .14 PHILLIPS, Trvs 12 7 2 9 . . . 1 . . . . .28 HOWE, Hussein 12 5 3 8 . . . . . . . . .2 SMITH, Xavier 8 1 6 7 1.0-1 . . . . . . . .92 MYERS, Mike 7 2 5 7 . . . . 1 . . . .40 HARVEY, Nate 12 5 1 6 . . . . . . . . .48 GUTIERREZ, Anth 4 1 4 5 . . . . . . . . .2D SWIFT, Michael 9 1 3 4 0.5-2 . . . . . . . .37 HICKS, Trevian 9 1 2 3 0.5-1 . . . . . . . .81 WILLIAMS, Jimmy 10 2 . 2 . . . . . . . . .27 PINNIX, Darius 12 . 1 1 . . . . . . . . .34 CARLOS, Devin 12 . 1 1 . . . . . . . . .45 TAYLOR, Kenyon 2 . 1 1 . . . . . . . . .90 ANDERSON, Rndal 1 1 . 1 . . . . . . . . .95 BOATENG, Bennet 2 . 1 1 . . . . . . . . .5Q MINSHEW, Grdnr 10 1 . 1 . . . . . . . . .47 RATLIFF, Anthny 12 . 1 1 . . . . . . . . .23 JOHNSON, Quay 10 1 . 1 . . . . . . . . .41 BAIRD, Tony 6 . 1 1 . . . . . . . . .
Total 12 451 426 877 39-148 11-74 7-72 30 19 4-0 7 . .Opponents 12 494 353 847 67-210 15-112 16-236 70 56 5-6 5 2 .

The Automated ScoreBookECU Games Played (as of Nov 27, 2017)
All games
## PLAYER GP-GS JMU WVU VT UCONN USF TEM UCF BYU HOU TLN CIN MEM2R ANDERSON, Devin 4/- . . . . . . . . . . . . . . . . . . X X X X X X X X X X X X . . . . . .96 ANDERSON, Kiant 9/9 START START START START START START . . . . . . . . . START START START90 ANDERSON, Rndal 1/- X X X . . . . . . . . . . . . . . . . . . . . . . . . . . . . . . . . .86 BAGGETT, Steve 12/9 START START X X X START START X X X START START START X X X START START97 BAILEY, Demage 12/5 START X X X X X X X X X START X X X X X X START X X X X X X START START75 BAILEY, Sean 2/- . . . . . . . . . . . . . . . . . . . . . . . . . . . . . . X X X X X X41 BAIRD, Tony 6/- . . . . . . X X X . . . X X X . . . . . . . . . X X X X X X X X X X X X64 BARMORE, Des 11/6 X X X X X X X X X X X X START START START START START START . . . X X X17 BARNES, Austin 11/- X X X X X X X X X X X X X X X X X X X X X X X X X X X X X X X X X . . .38 BIVENS, Bruce 11/- . . . X X X X X X X X X X X X X X X X X X X X X X X X X X X X X X X X X95 BOATENG, Bennet 2/- . . . . . . . . . . . . . . . . . . . . . . . . X X X . . . X X X . . .88 BROWN, Trevon 12/7 X X X X X X START START X X X X X X X X X START START START START START31 CANADY, Keyshwn 8/3 X X X X X X X X X . . . X X X X X X . . . . . . . . . START START START34 CARLOS, Devin 12/- X X X X X X X X X X X X X X X X X X X X X X X X X X X X X X X X X X X X30 CARTER, Joe 11/- X X X X X X X X X X X X X X X X X X X X X X X X X X X X X X X X X . . .8W DEANS, Tahj 9/1 X X X X X X X X X . . . . . . . . . X X X X X X START X X X X X X X X X22 DYE, Tyshon 8/2 X X X START START X X X X X X X X X . . . . . . X X X . . . . . . X X X87 ELMORE, Gaelin 11/4 START X X X X X X START START X X X . . . X X X X X X X X X START X X X1W FARRIER, Deondr 9/4 X X X START . . . . . . X X X START X X X . . . X X X START START X X X8 FULP, Bobby 10/9 START START START START START START X X X START START START . . . . . .44 FUTRELL, Kendal 9/4 X X X START X X X X X X . . . . . . . . . START START X X X X X X START33 GIBBS, Cannon 12/6 X X X X X X START START START START START X X X START X X X X X X X X X26 GORE, Colby 10/9 . . . X X X . . . START START START START START START START START START4 GRAY, Malik 7/- . . . . . . X X X X X X X X X . . . . . . . . . X X X X X X X X X X X X85 GRAYSON, Davon 11/11 START START START START START START START START START START . . . START5W GREEN, Terrell 9/- X X X . . . X X X . . . . . . X X X X X X X X X X X X X X X X X X X X X48 GUTIERREZ, Anth 4/- . . . . . . . . . . . . X X X X X X X X X . . . . . . . . . X X X . . .40 HARVEY, Nate 12/- X X X X X X X X X X X X X X X X X X X X X X X X X X X X X X X X X X X X98 HENDERSON, Brnd 1/- . . . . . . X X X . . . . . . . . . . . . . . . . . . . . . . . . . . .70 HERRIN, Cortez 8/5 START X X X START X X X START START . . . . . . . . . . . . X X X START9Q HERRING, Reid 2/- . . . . . . X X X . . . . . . . . . . . . . . . . . . . . . X X X . . .59 HICKERSON, Chnd 9/1 X X X . . . X X X . . . . . . X X X START X X X X X X X X X X X X X X X37 HICKS, Trevian 9/- . . . . . . . . . X X X X X X X X X X X X X X X X X X X X X X X X X X X6 HOLTON, Marcus 8/3 X X X X X X X X X START START X X X START . . . X X X . . . . . . . . .28 HOWE, Hussein 12/1 X X X X X X X X X X X X X X X X X X X X X X X X START X X X X X X X X X1 IRVIN, Tim 6/4 START START START . . . . . . X X X START . . . X X X . . . . . . . . .50 JAMES, Shaun 12/1 X X X X X X START X X X X X X X X X X X X X X X X X X X X X X X X X X X23 JOHNSON, Quay 10/8 START X X X START START START START START START X X X START . . . . . .60 LEE, Austin 5/3 START START . . . . . . X X X X X X START . . . . . . . . . . . . . . .66 LENZEN, Erik 12/- X X X X X X X X X X X X X X X X X X X X X X X X X X X X X X X X X X X X35 LOVE, Chris 12/5 START START START X X X X X X X X X X X X START START X X X X X X X X X83 MARSHMON, Cam 5/- . . . . . . . . . . . . . . . X X X X X X X X X . . . . . . X X X X X X55 McGHIN, Garrett 12/11 START START START X X X START START START START START START START START5Q MINSHEW, Grdnr 10/5 START X X X START . . . X X X . . . X X X X X X X X X START START START99 MONTGOMERY, D. 12/1 X X X X X X X X X X X X X X X X X X X X X X X X X X X X X X X X X START92 MYERS, Mike 7/1 . . . X X X X X X X X X START X X X X X X . . . . . . . . . X X X . . .49 NORRIS, Ben 1/- X X X . . . . . . . . . . . . . . . . . . . . . . . . . . . . . . . . .
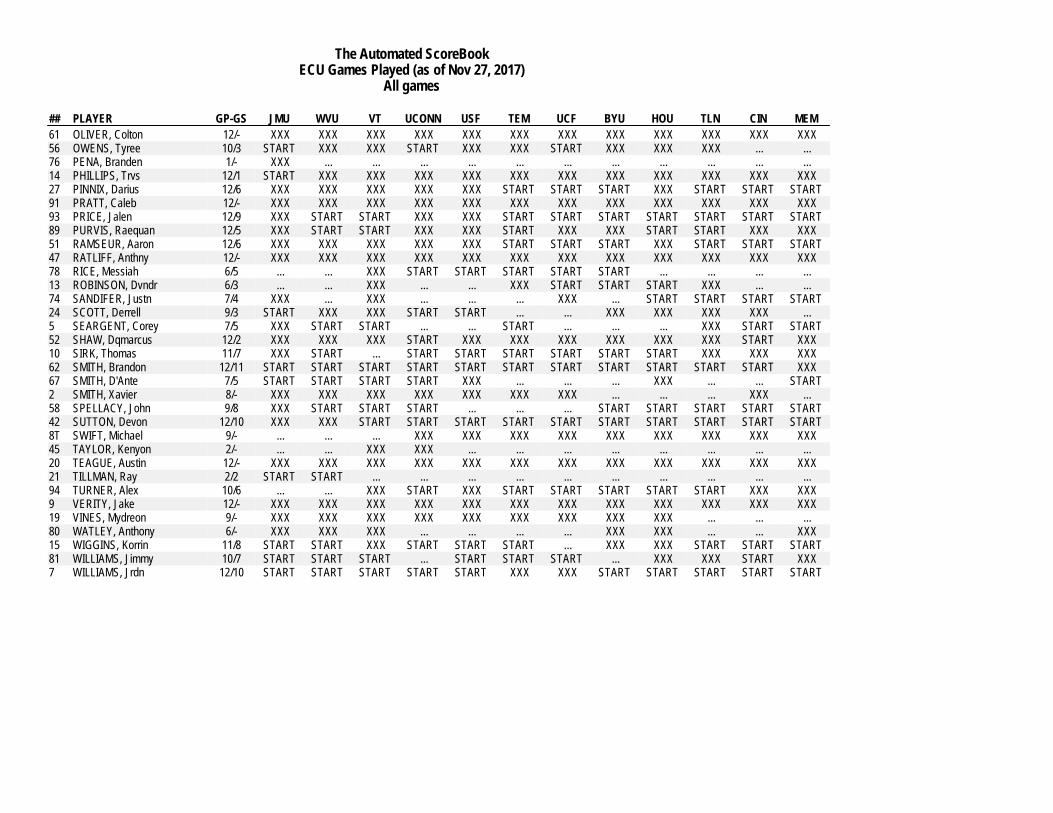
The Automated ScoreBookECU Games Played (as of Nov 27, 2017)
All games
## PLAYER GP-GS JMU WVU VT UCONN USF TEM UCF BYU HOU TLN CIN MEM61 OLIVER, Colton 12/- X X X X X X X X X X X X X X X X X X X X X X X X X X X X X X X X X X X X56 OWENS, Tyree 10/3 START X X X X X X START X X X X X X START X X X X X X X X X . . . . . .76 PENA, Branden 1/- X X X . . . . . . . . . . . . . . . . . . . . . . . . . . . . . . . . .14 PHILLIPS, Trvs 12/1 START X X X X X X X X X X X X X X X X X X X X X X X X X X X X X X X X X27 PINNIX, Darius 12/6 X X X X X X X X X X X X X X X START START START X X X START START START91 PRATT, Caleb 12/- X X X X X X X X X X X X X X X X X X X X X X X X X X X X X X X X X X X X93 PRICE, Jalen 12/9 X X X START START X X X X X X START START START START START START START89 PURVIS, Raequan 12/5 X X X START START X X X X X X START X X X X X X START START X X X X X X51 RAMSEUR, Aaron 12/6 X X X X X X X X X X X X X X X START START START X X X START START START47 RATLIFF, Anthny 12/- X X X X X X X X X X X X X X X X X X X X X X X X X X X X X X X X X X X X78 RICE, Messiah 6/5 . . . . . . X X X START START START START START . . . . . . . . . . . .13 ROBINSON, Dvndr 6/3 . . . . . . X X X . . . . . . X X X START START START X X X . . . . . .74 SANDIFER, Justn 7/4 X X X . . . X X X . . . . . . . . . X X X . . . START START START START24 SCOTT, Derrell 9/3 START X X X X X X START START . . . . . . X X X X X X X X X X X X . . .5 SEARGENT, Corey 7/5 X X X START START . . . . . . START . . . . . . . . . X X X START START52 SHAW, Dqmarcus 12/2 X X X X X X X X X START X X X X X X X X X X X X X X X X X X START X X X10 SIRK, Thomas 11/7 X X X START . . . START START START START START START X X X X X X X X X62 SMITH, Brandon 12/11 START START START START START START START START START START START X X X67 SMITH, D'Ante 7/5 START START START START X X X . . . . . . . . . X X X . . . . . . START2 SMITH, Xavier 8/- X X X X X X X X X X X X X X X X X X X X X . . . . . . . . . X X X . . .58 SPELLACY, John 9/8 X X X START START START . . . . . . . . . START START START START START42 SUTTON, Devon 12/10 X X X X X X START START START START START START START START START START8T SWIFT, Michael 9/- . . . . . . . . . X X X X X X X X X X X X X X X X X X X X X X X X X X X45 TAYLOR, Kenyon 2/- . . . . . . X X X X X X . . . . . . . . . . . . . . . . . . . . . . . .20 TEAGUE, Austin 12/- X X X X X X X X X X X X X X X X X X X X X X X X X X X X X X X X X X X X21 TILLMAN, Ray 2/2 START START . . . . . . . . . . . . . . . . . . . . . . . . . . . . . .94 TURNER, Alex 10/6 . . . . . . X X X START X X X START START START START START X X X X X X9 VERITY, Jake 12/- X X X X X X X X X X X X X X X X X X X X X X X X X X X X X X X X X X X X19 VINES, Mydreon 9/- X X X X X X X X X X X X X X X X X X X X X X X X X X X . . . . . . . . .80 WATLEY, Anthony 6/- X X X X X X X X X . . . . . . . . . . . . X X X X X X . . . . . . X X X15 WIGGINS, Korrin 11/8 START START X X X START START START . . . X X X X X X START START START81 WILLIAMS, Jimmy 10/7 START START START . . . START START START . . . X X X X X X START X X X7 WILLIAMS, Jrdn 12/10 START START START START START X X X X X X START START START START START

The Automated ScoreBookECU Rushing/Receiving Game-by-Game (as of Nov 27, 2017)
All games
RUSHING No-Yds/TD JMU WVU VT UCONN USF TEM UCF BYU HOU TLN CIN MEMHOWE, Hussein RB 96-419/3 4-7/0 9-54/0 4-10/0 4-32/1 7-8/0 4-10/0 12-69/0 7-24/0 1-2/0 14-108/1 16-47/1 14-48/0PINNIX, Darius RB 74-229/2 3-7/1 - 4-2/0 6-18/0 5-4/0 7-30/0 13-93/0 5-13/0 8-18/0 6-5/1 10-36/0 7-3/0DYE, Tyshon RB 50-217/0 - 14-71/0 11-31/0 6-22/0 3-12/0 1--2/0 DNP DNP 3-12/0 DNP DNP 12-71/0SIRK, Thomas QB 64-165/3 4-7/0 7-34/0 DNP 14-31/0 18-87/2 9--14/0 3--8/0 5-25/1 2-0/0 2-3/0 - -SCOTT, Derrell RB 41-139/2 12-45/1 - 9-15/0 13-36/1 2-3/0 DNP DNP 2-5/0 1-6/0 2-29/0 - DNPANDERSON, Devin RB 29-83/0 DNP DNP DNP DNP DNP DNP 8-20/0 12-43/0 4-2/0 5-18/0 DNP DNPGRAYSON, Davon WR 6-40/0 1-4/0 - - 1-10/0 - 1-10/0 - 1-12/0 1-4/0 1-0/0 DNP -FARRIER, Deondr WR 2-20/0 - - DNP DNP - - 1-13/0 DNP - - 1-7/0 -BROWN, Trevon WR 2-16/0 - - - 2-16/0 - - - - - - - -GREEN, Terrell WR 1-16/0 - DNP - DNP DNP - - - - - 1-16/0 -HERRING, Reid QB 4-4/0 DNP DNP 1-1/0 DNP DNP DNP DNP DNP DNP DNP 3-3/0 DNPJOHNSON, Quay WR 3-3/0 - - - 1-5/0 1--6/0 - - - 1-4/0 - DNP DNPWILLIAMS, Jimmy WR 1-2/0 1-2/0 - - DNP - - - DNP - - - -TEAM 5--21/0 2--5/0 1--14/0 DNP DNP DNP DNP DNP 2--2/0 DNP DNP DNP -MINSHEW, Grdnr QB 18--40/0 3-3/0 1--3/0 2--19/0 DNP - DNP - 1--5/0 3--12/0 2--2/0 2-5/0 4--7/0
RECEIVING No-Yds/TD JMU WVU VT UCONN USF TEM UCF BYU HOU TLN CIN MEMBROWN, Trevon WR 60-1069/7 4-43/0 2-103/1 4-107/1 9-92/0 2-20/0 2-19/0 - 3-74/1 11-141/2 7-72/0 9-270/2 7-128/0GRAYSON, Davon WR 59-886/6 7-86/0 5-76/0 1-9/1 11-223/3 5-101/1 2-40/0 6-96/1 10-164/0 6-38/0 4-43/0 DNP 2-10/0JOHNSON, Quay WR 47-464/3 3-28/0 4-30/0 1-27/0 6-60/0 4-48/0 3-51/1 4-35/0 5-51/1 14-115/1 3-19/0 DNP DNPWILLIAMS, Jimmy WR 32-447/3 3-41/0 7-86/1 1-9/0 DNP 2-48/0 5-110/0 - DNP 7-58/0 3-24/0 3-38/1 1-33/1HOWE, Hussein RB 30-219/0 - 1-6/0 1-7/0 3-44/0 1-8/0 5-24/0 - - 5-37/0 5-36/0 4-13/0 5-44/0FARRIER, Deondr WR 24-211/3 7-68/0 2-9/0 DNP DNP - - 3-9/1 DNP 3-21/0 3-34/1 5-39/1 1-31/0DEANS, Tahj WR 16-177/2 2-18/0 - - DNP DNP DNP 1-17/1 - 3-27/0 - 5-56/1 5-59/0BAGGETT, Steve TE 11-105/2 1-5/0 - 1-41/0 - 1-2/1 - - 2-9/0 1-7/0 - 3-19/0 2-22/1DYE, Tyshon RB 6-56/0 - 2-18/0 1-30/0 - 2-7/0 - DNP DNP - DNP DNP 1-1/0PINNIX, Darius RB 9-49/0 - - - - 1-10/0 2-6/0 - - 3-19/0 - 1-8/0 2-6/0VINES, Mydreon WR 2-39/0 - - - - 1-34/0 - - - 1-5/0 DNP DNP DNPSCOTT, Derrell RB 3-31/0 1-3/0 - - - 2-28/0 DNP DNP - - - - DNPSIRK, Thomas QB 3-28/0 - - DNP - - - - - - - 2-21/0 1-7/0GRAY, Malik WR 2-18/0 DNP DNP 1-11/0 1-7/0 - DNP DNP DNP - - - -MARSHMON, Cam WR 2-13/0 DNP DNP DNP DNP DNP 1-3/0 - - DNP DNP - 1-10/0ANDERSON, Devin RB 1-3/0 DNP DNP DNP DNP DNP DNP 1-3/0 - - - DNP DNP
The Automated ScoreBookECU Passing Game-by-Game (as of Nov 27, 2017)
All games
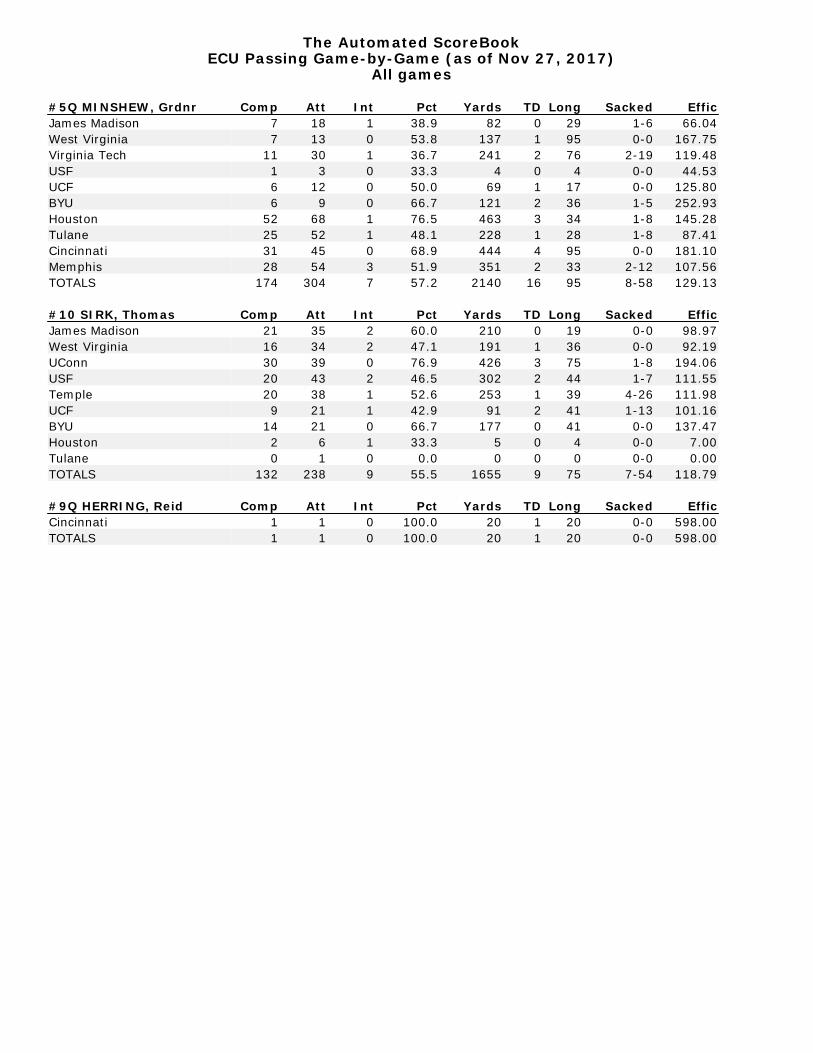
#5Q MINSHEW, Grdnr Comp Att Int Pct Yards TD Long Sacked EfficJames Madison 7 18 1 38.9 82 0 29 1-6 66.04West Virginia 7 13 0 53.8 137 1 95 0-0 167.75Virginia Tech 11 30 1 36.7 241 2 76 2-19 119.48USF 1 3 0 33.3 4 0 4 0-0 44.53UCF 6 12 0 50.0 69 1 17 0-0 125.80BYU 6 9 0 66.7 121 2 36 1-5 252.93Houston 52 68 1 76.5 463 3 34 1-8 145.28Tulane 25 52 1 48.1 228 1 28 1-8 87.41Cincinnati 31 45 0 68.9 444 4 95 0-0 181.10Memphis 28 54 3 51.9 351 2 33 2-12 107.56TOTALS 174 304 7 57.2 2140 16 95 8-58 129.13
#10 SIRK, Thomas Comp Att Int Pct Yards TD Long Sacked EfficJames Madison 21 35 2 60.0 210 0 19 0-0 98.97West Virginia 16 34 2 47.1 191 1 36 0-0 92.19UConn 30 39 0 76.9 426 3 75 1-8 194.06USF 20 43 2 46.5 302 2 44 1-7 111.55Temple 20 38 1 52.6 253 1 39 4-26 111.98UCF 9 21 1 42.9 91 2 41 1-13 101.16BYU 14 21 0 66.7 177 0 41 0-0 137.47Houston 2 6 1 33.3 5 0 4 0-0 7.00Tulane 0 1 0 0.0 0 0 0 0-0 0.00TOTALS 132 238 9 55.5 1655 9 75 7-54 118.79
#9Q HERRING, Reid Comp Att Int Pct Yards TD Long Sacked EfficCincinnati 1 1 0 100.0 20 1 20 0-0 598.00TOTALS 1 1 0 100.0 20 1 20 0-0 598.00

The Automated ScoreBookECU Return Stats Game-by-Game (as of Nov 27, 2017)
All games
PUNT RETURNS No-Yds JMU WVU VT UCONN USF TEM UCF BYU HOU TLN CIN MEMBROWN, Trevon 1-2 - - - - - - - - - - - 1-2IRVIN, Tim 1-1 1-1 - - DNP DNP - - DNP - DNP DNP DNPJOHNSON, Quay 3--2 - - 1--1 - - 1-0 1--1 - - - DNP DNPGORE, Colby 1--5 DNP - DNP - - - - - - 1--5 - -
KICK RETURNS No-Yds JMU WVU VT UCONN USF TEM UCF BYU HOU TLN CIN MEMBROWN, Trevon 21-452 - 1-20 - - 3-52 1-15 3-71 1-21 3-86 - - 9-187LOVE, Chris 13-272 3-68 3-58 1-19 1-20 4-93 1-14 - - - - - -PINNIX, Darius 4-51 - - - - - - - - 2-31 1-12 1-8 -GRAYSON, Davon 2-49 2-49 - - - - - - - - - DNP -HOWE, Hussein 2-36 1-15 - 1-21 - - - - - - - - -JOHNSON, Quay 2-11 - 1-11 - - - - 1-0 - - - DNP DNP
INT. RETURNS No-Yds JMU WVU VT UCONN USF TEM UCF BYU HOU TLN CIN MEMRAMSEUR, Aaron 2-29 - - - - - 1-31 - - - 1--2 - -WIGGINS, Korrin 1-0 - - - 1-0 - - DNP - - - - -GIBBS, Cannon 1-25 - - - - - - - 1-25 - - - -LOVE, Chris 1-9 - - - - - - - - - - 1-9 -FULP, Bobby 1--3 1--3 - - - - - - - - - DNP DNPPRICE, Jalen 1-12 - - - - - - - - - 1-12 - -
FUMBLE RETURNS No-Yds JMU WVU VT UCONN USF TEM UCF BYU HOU TLN CIN MEM

The Automated ScoreBookECU All-Purpose Yards Game-by-Game (as of Nov 27, 2017)
All games
ALL-PURPOSE YARDS Total JMU WVU VT UCONN USF TEM UCF BYU HOU TLN CIN MEMBROWN, Trevon 1539 43 123 107 108 72 34 71 95 227 72 270 317GRAYSON, Davon 975 139 76 9 233 101 50 96 176 42 43 DNP 10HOWE, Hussein 674 22 60 38 76 16 34 69 24 39 144 60 92JOHNSON, Quay 476 28 41 26 65 42 51 34 51 119 19 DNP DNPWILLIAMS, Jimmy 449 43 86 9 DNP 48 110 - DNP 58 24 38 33PINNIX, Darius 329 7 - 2 18 14 36 93 13 68 17 52 9LOVE, Chris 281 68 58 19 20 93 14 - - - - 9 -DYE, Tyshon 273 - 89 61 22 19 -2 DNP DNP 12 DNP DNP 72FARRIER, Deondr 231 68 9 DNP DNP - - 22 DNP 21 34 46 31SIRK, Thomas 193 7 34 DNP 31 87 -14 -8 25 - 3 21 7DEANS, Tahj 177 18 - - DNP DNP DNP 17 - 27 - 56 59SCOTT, Derrell 170 48 - 15 36 31 DNP DNP 5 6 29 - DNPBAGGETT, Steve 105 5 - 41 - 2 - - 9 7 - 19 22ANDERSON, Devin 86 DNP DNP DNP DNP DNP DNP 23 43 2 18 DNP DNPVINES, Mydreon 39 - - - - 34 - - - 5 DNP DNP DNPRAMSEUR, Aaron 29 - - - - - 31 - - - -2 - -GIBBS, Cannon 25 - - - - - - - 25 - - - -GRAY, Malik 18 DNP DNP 11 7 - DNP DNP DNP - - - -GREEN, Terrell 16 - DNP - DNP DNP - - - - - 16 -MARSHMON, Cam 13 DNP DNP DNP DNP DNP 3 - - DNP DNP - 10PRICE, Jalen 12 - - - - - - - - - 12 - -HERRING, Reid 4 DNP DNP 1 DNP DNP DNP DNP DNP DNP DNP 3 DNPGORE, Colby 2 DNP - DNP - - - - - - -5 - 7IRVIN, Tim 1 1 - - DNP DNP - - DNP - DNP DNP DNPFULP, Bobby -3 -3 - - - - - - - - - DNP DNPTEAM -21 -5 -14 - - - - - -2 - - - -MINSHEW, Grdnr -40 3 -3 -19 DNP - DNP - -5 -12 -2 5 -7

The Automated ScoreBookECU Total Tackles Game-by-Game (as of Nov 27, 2017)
All games
Total Tackles UA-A Total JMU WVU VT UCONN USF TEM UCF BYU HOU TLN CIN MEMWIGGINS, Korrin DB 54-42 96 3 - 2 7 - 0 5 - 5 2 - 8 7 - 2 5 - 6 D N P 2 - 4 4 - 4 9 - 5 7 - 4 3 - 2WILLIAMS, Jrdn LB 42-47 89 6 - 8 7 - 4 3 - 7 3 - 5 2 - 4 1 - 2 0 - 1 6 - 4 6 - 4 3 - 2 2 - 5 3 - 1SUTTON, Devon DB 31-37 68 1 - 1 5 - 0 2 - 3 1 - 5 3 - 6 2 - 3 4 - 4 6 - 4 1 - 3 3 - 5 0 - 2 3 - 1RAMSEUR, Aaron LB 29-28 57 - 1 - 0 - - 1 - 4 6 - 5 4 - 5 5 - 7 1 - 1 4 - 3 2 - 2 5 - 1GIBBS, Cannon LB 21-29 50 2 - 0 - 3 - 6 8 - 6 3 - 4 1 - 5 2 - 2 0 - 5 - - 1 - 1 1 - 0FULP, Bobby DB 29-16 45 3 - 1 6 - 0 5 - 6 4 - 3 3 - 0 1 - 2 2 - 1 2 - 2 1 - 0 2 - 1 D N P D N PGORE, Colby DB 25-12 37 D N P 2 - 0 D N P 2 - 1 2 - 1 5 - 1 3 - 1 2 - 1 2 - 3 3 - 2 2 - 0 2 - 2ANDERSON, Kiant DE 22-13 35 3 - 3 1 - 0 3 - 2 4 - 2 4 - 1 2 - 2 D N P D N P D N P 2 - 2 3 - 1 -ROBINSON, Dvndr DB 17-16 33 D N P D N P 1 - 1 D N P D N P 3 - 3 4 - 4 2 - 4 3 - 1 4 - 3 D N P D N PLOVE, Chris DB 23-7 30 5 - 0 2 - 0 4 - 1 - 2 - 2 4 - 1 1 - 0 0 - 2 1 - 1 - 2 - 0 2 - 0OWENS, Tyree DL 12-18 30 0 - 3 4 - 1 0 - 5 2 - 2 1 - 0 0 - 1 2 - 1 1 - 2 0 - 1 2 - 2 D N P D N PIRVIN, Tim DB 20-9 29 5 - 3 7 - 2 2 - 1 D N P D N P 3 - 2 3 - 1 D N P - D N P D N P D N PPRICE, Jalen DT 10-17 27 0 - 4 1 - 1 0 - 1 2 - 2 0 - 1 0 - 1 2 - 2 2 - 1 0 - 2 1 - 2 - 2 - 0TEAGUE, Austin DB 9-13 22 0 - 1 - 0 - 7 2 - 0 1 - 0 - 3 - 1 1 - 0 - 0 - 1 1 - 3 1 - 0SEARGENT, Corey DB 11-8 19 - 4 - 0 6 - 2 D N P D N P - D N P D N P D N P - 0 - 2 1 - 4TURNER, Alex DT 6-11 17 D N P D N P 0 - 1 3 - 1 1 - 1 0 - 1 0 - 2 1 - 1 1 - 1 - 0 - 2 0 - 1HICKERSON, Chnd DE 4-11 15 - D N P - D N P D N P 0 - 4 1 - 3 0 - 3 1 - 0 1 - 0 1 - 1 -ELMORE, Gaelin DE 8-6 14 - 3 - 1 0 - 1 1 - 0 2 - 2 1 - 1 D N P 1 - 0 - 0 - 1 - -FUTRELL, Kendal DE 9-4 13 1 - 0 - 1 - 1 3 - 1 D N P D N P D N P 1 - 1 1 - 0 - 1 - 1 1 - 0HOLTON, Marcus DB 6-7 13 1 - 0 - 0 - 1 0 - 4 1 - 0 1 - 0 2 - 2 D N P 1 - 0 D N P D N P D N PCANADY, Keyshwn DB 10-2 12 0 - 1 - - D N P - - D N P D N P D N P 4 - 0 4 - 1 2 - 0JAMES, Shaun DT 4-8 12 0 - 2 - 1 - 3 - - 0 - 1 2 - 0 - 0 - 1 0 - 1 1 - 0 -PURVIS, Raequan DT 3-8 11 - 0 - 1 2 - 1 - 0 - 1 0 - 1 1 - 2 - - 0 - 1 0 - 1 -BAILEY, Demage DT 2-9 11 - - 0 - 1 - 0 - 3 - 1 - 0 0 - 2 - 1 - 2 0 - 1 -TILLMAN, Ray LB 6-5 11 4 - 4 2 - 1 D N P D N P D N P D N P D N P D N P D N P D N P D N P D N PCARTER, Joe LB 5-6 11 0 - 1 - 3 - 3 2 - 0 - - - 0 - 1 - - 0 - 1 D N PBIVENS, Bruce LB 5-5 10 D N P 5 - 1 0 - 2 - - - - 0 - 1 - - 0 - 1 -PHILLIPS, Trvs DB 7-2 9 2 - 0 1 - 0 2 - 0 - - - - 2 - 0 - 0 - 1 0 - 1 -HOWE, Hussein 5-3 8 - 1 - 0 1 - 1 - 2 - 0 1 - 0 - 0 - 2 - - - -MYERS, Mike DT 2-5 7 D N P 1 - 0 - - 0 - 3 1 - 1 0 - 1 D N P D N P D N P - D N PSMITH, Xavier DB 1-6 7 - - 1 - 2 - - - 0 - 2 D N P D N P D N P 0 - 2 D N PHARVEY, Nate 5-1 6 - - 1 - 0 - 1 - 0 - 1 - 0 1 - 1 - - - 1 - 0GUTIERREZ, Anth LB 1-4 5 D N P D N P D N P D N P 0 - 1 1 - 3 - D N P D N P D N P - D N PSWIFT, Michael DE 1-3 4 D N P D N P D N P - - - 1 - 1 - - - 0 - 2 -HICKS, Trevian DB 1-2 3 D N P D N P D N P - 1 - 0 - - - - - 0 - 2 -WILLIAMS, Jimmy 2-0 2 1 - 0 - 1 - 0 D N P - - - D N P - - - -BAIRD, Tony LB 0-1 1 D N P D N P 0 - 1 D N P - D N P D N P D N P - - - -BOATENG, Bennet DT 0-1 1 D N P D N P D N P D N P D N P D N P D N P D N P - D N P 0 - 1 D N PRATLIFF, Anthny 0-1 1 - - 0 - 1 - - - - - - - - -TAYLOR, Kenyon 0-1 1 D N P D N P 0 - 1 - D N P D N P D N P D N P D N P D N P D N P D N PMINSHEW, Grdnr 1-0 1 - - - D N P - D N P - - 1 - 0 - - -JOHNSON, Quay 1-0 1 - - - - - - - - 1 - 0 - D N P D N PPINNIX, Darius 0-1 1 - - - - - - - - - - 0 - 1 -CARLOS, Devin 0-1 1 - - 0 - 1 - - - - - - - - -ANDERSON, Rndal DE 1-0 1 1 - 0 D N P D N P D N P D N P D N P D N P D N P D N P D N P D N P D N P
The Automated ScoreBookECU Tackle For Loss Game-by-Game (as of Nov 27, 2017)
All games
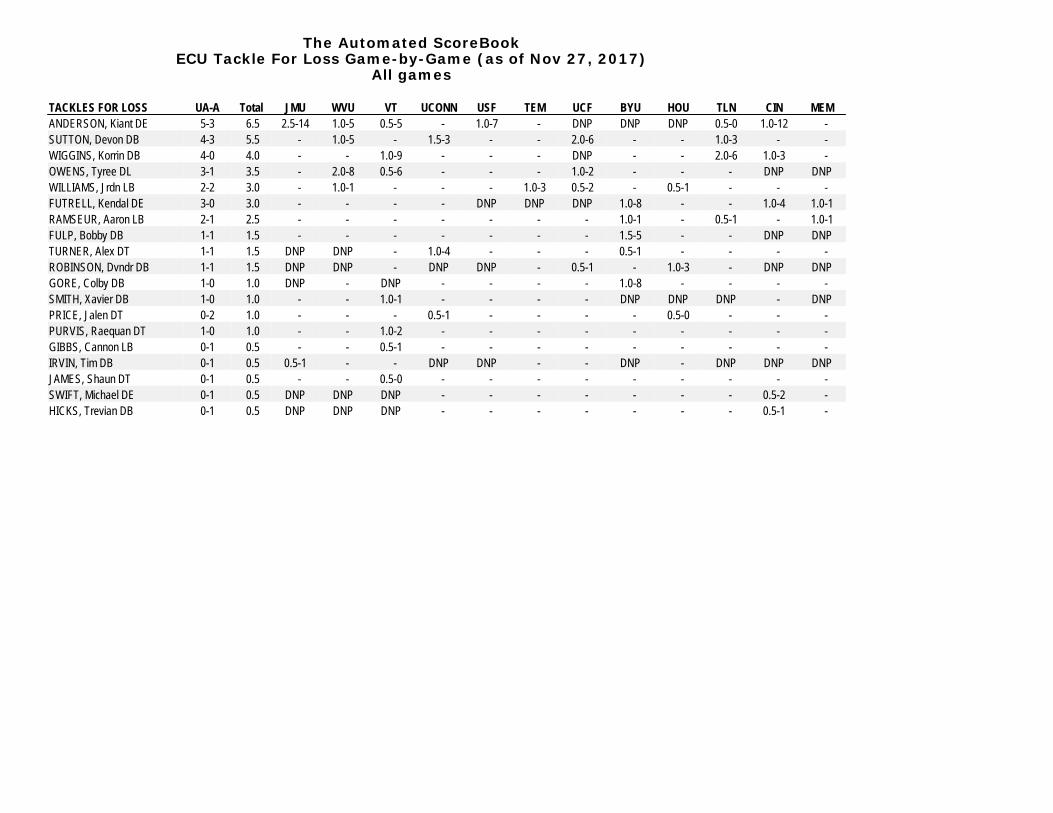
TACKLES FOR LOSS UA-A Total JMU WVU VT UCONN USF TEM UCF BYU HOU TLN CIN MEMANDERSON, Kiant DE 5-3 6 . 5 2.5-14 1.0-5 0.5-5 - 1.0-7 - DNP DNP DNP 0.5-0 1.0-12 -SUTTON, Devon DB 4-3 5 . 5 - 1.0-5 - 1.5-3 - - 2.0-6 - - 1.0-3 - -WIGGINS, Korrin DB 4-0 4 . 0 - - 1.0-9 - - - DNP - - 2.0-6 1.0-3 -OWENS, Tyree DL 3-1 3 . 5 - 2.0-8 0.5-6 - - - 1.0-2 - - - DNP DNPWILLIAMS, Jrdn LB 2-2 3 . 0 - 1.0-1 - - - 1.0-3 0.5-2 - 0.5-1 - - -FUTRELL, Kendal DE 3-0 3 . 0 - - - - DNP DNP DNP 1.0-8 - - 1.0-4 1.0-1RAMSEUR, Aaron LB 2-1 2 . 5 - - - - - - - 1.0-1 - 0.5-1 - 1.0-1FULP, Bobby DB 1-1 1 . 5 - - - - - - - 1.5-5 - - DNP DNPTURNER, Alex DT 1-1 1 . 5 DNP DNP - 1.0-4 - - - 0.5-1 - - - -ROBINSON, Dvndr DB 1-1 1 . 5 DNP DNP - DNP DNP - 0.5-1 - 1.0-3 - DNP DNPGORE, Colby DB 1-0 1 . 0 DNP - DNP - - - - 1.0-8 - - - -SMITH, Xavier DB 1-0 1 . 0 - - 1.0-1 - - - - DNP DNP DNP - DNPPRICE, Jalen DT 0-2 1 . 0 - - - 0.5-1 - - - - 0.5-0 - - -PURVIS, Raequan DT 1-0 1 . 0 - - 1.0-2 - - - - - - - - -GIBBS, Cannon LB 0-1 0 . 5 - - 0.5-1 - - - - - - - - -IRVIN, Tim DB 0-1 0 . 5 0.5-1 - - DNP DNP - - DNP - DNP DNP DNPJAMES, Shaun DT 0-1 0 . 5 - - 0.5-0 - - - - - - - - -SWIFT, Michael DE 0-1 0 . 5 DNP DNP DNP - - - - - - - 0.5-2 -HICKS, Trevian DB 0-1 0 . 5 DNP DNP DNP - - - - - - - 0.5-1 -
The Automated ScoreBookECU Sacks Game-by-Game (as of Nov 27, 2017)
All games
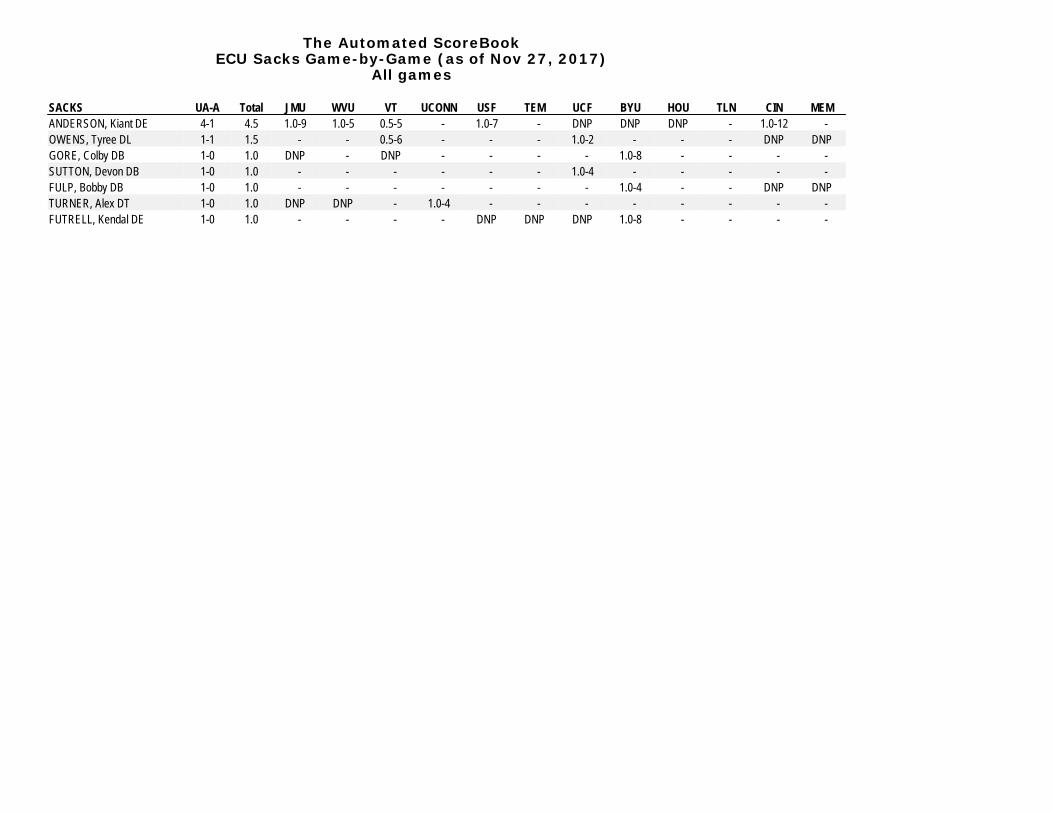
SACKS UA-A Total JMU WVU VT UCONN USF TEM UCF BYU HOU TLN CIN MEMANDERSON, Kiant DE 4-1 4.5 1.0-9 1.0-5 0.5-5 - 1.0-7 - DNP DNP DNP - 1.0-12 -OWENS, Tyree DL 1-1 1.5 - - 0.5-6 - - - 1.0-2 - - - DNP DNPGORE, Colby DB 1-0 1.0 DNP - DNP - - - - 1.0-8 - - - -SUTTON, Devon DB 1-0 1.0 - - - - - - 1.0-4 - - - - -FULP, Bobby DB 1-0 1.0 - - - - - - - 1.0-4 - - DNP DNPTURNER, Alex DT 1-0 1.0 DNP DNP - 1.0-4 - - - - - - - -FUTRELL, Kendal DE 1-0 1.0 - - - - DNP DNP DNP 1.0-8 - - - -
The Automated ScoreBookECU Fumbles Game-by-Game (as of Nov 27, 2017)
All games
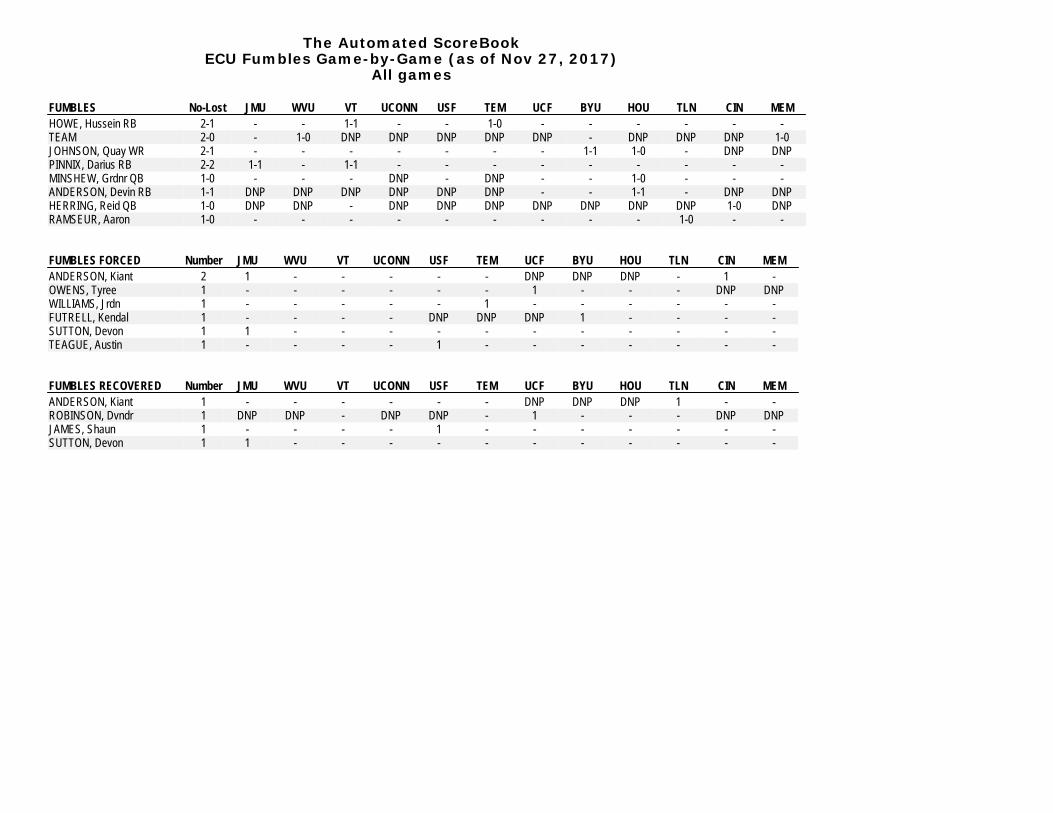
FUMBLES No-Lost JMU WVU VT UCONN USF TEM UCF BYU HOU TLN CIN MEMHOWE, Hussein RB 2-1 - - 1-1 - - 1-0 - - - - - -TEAM 2-0 - 1-0 DNP DNP DNP DNP DNP - DNP DNP DNP 1-0JOHNSON, Quay WR 2-1 - - - - - - - 1-1 1-0 - DNP DNPPINNIX, Darius RB 2-2 1-1 - 1-1 - - - - - - - - -MINSHEW, Grdnr QB 1-0 - - - DNP - DNP - - 1-0 - - -ANDERSON, Devin RB 1-1 DNP DNP DNP DNP DNP DNP - - 1-1 - DNP DNPHERRING, Reid QB 1-0 DNP DNP - DNP DNP DNP DNP DNP DNP DNP 1-0 DNPRAMSEUR, Aaron 1-0 - - - - - - - - - 1-0 - -
FUMBLES FORCED Number JMU WVU VT UCONN USF TEM UCF BYU HOU TLN CIN MEMANDERSON, Kiant 2 1 - - - - - DNP DNP DNP - 1 -OWENS, Tyree 1 - - - - - - 1 - - - DNP DNPWILLIAMS, Jrdn 1 - - - - - 1 - - - - - -FUTRELL, Kendal 1 - - - - DNP DNP DNP 1 - - - -SUTTON, Devon 1 1 - - - - - - - - - - -TEAGUE, Austin 1 - - - - 1 - - - - - - -
FUMBLES RECOVERED Number JMU WVU VT UCONN USF TEM UCF BYU HOU TLN CIN MEMANDERSON, Kiant 1 - - - - - - DNP DNP DNP 1 - -ROBINSON, Dvndr 1 DNP DNP - DNP DNP - 1 - - - DNP DNPJAMES, Shaun 1 - - - - 1 - - - - - - -SUTTON, Devon 1 1 - - - - - - - - - - -
The Automated ScoreBookECU Game Superlatives (as of Nov 27, 2017)
All games
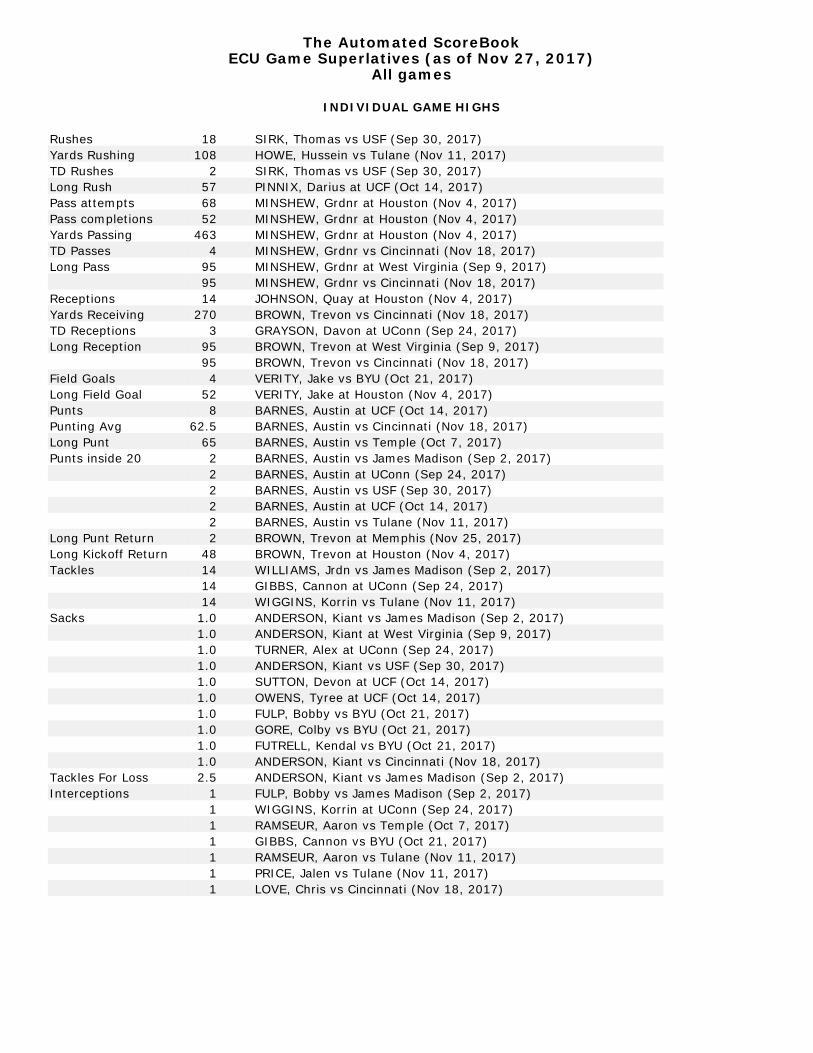
INDIVIDUAL GAME HIGHS
Rushes 18 SIRK, Thomas vs USF (Sep 30, 2017)Yards Rushing 108 HOWE, Hussein vs Tulane (Nov 11, 2017)TD Rushes 2 SIRK, Thomas vs USF (Sep 30, 2017)Long Rush 57 PINNIX, Darius at UCF (Oct 14, 2017)Pass attempts 68 MINSHEW, Grdnr at Houston (Nov 4, 2017)Pass completions 52 MINSHEW, Grdnr at Houston (Nov 4, 2017)Yards Passing 463 MINSHEW, Grdnr at Houston (Nov 4, 2017)TD Passes 4 MINSHEW, Grdnr vs Cincinnati (Nov 18, 2017)Long Pass 95 MINSHEW, Grdnr at West Virginia (Sep 9, 2017)
95 MINSHEW, Grdnr vs Cincinnati (Nov 18, 2017)Receptions 14 JOHNSON, Quay at Houston (Nov 4, 2017)Yards Receiving 270 BROWN, Trevon vs Cincinnati (Nov 18, 2017)TD Receptions 3 GRAYSON, Davon at UConn (Sep 24, 2017)Long Reception 95 BROWN, Trevon at West Virginia (Sep 9, 2017)
95 BROWN, Trevon vs Cincinnati (Nov 18, 2017)Field Goals 4 VERITY, Jake vs BYU (Oct 21, 2017)Long Field Goal 52 VERITY, Jake at Houston (Nov 4, 2017)Punts 8 BARNES, Austin at UCF (Oct 14, 2017)Punting Avg 62.5 BARNES, Austin vs Cincinnati (Nov 18, 2017)Long Punt 65 BARNES, Austin vs Temple (Oct 7, 2017)Punts inside 20 2 BARNES, Austin vs James Madison (Sep 2, 2017)
2 BARNES, Austin at UConn (Sep 24, 2017)2 BARNES, Austin vs USF (Sep 30, 2017)2 BARNES, Austin at UCF (Oct 14, 2017)2 BARNES, Austin vs Tulane (Nov 11, 2017)
Long Punt Return 2 BROWN, Trevon at Memphis (Nov 25, 2017)Long Kickoff Return 48 BROWN, Trevon at Houston (Nov 4, 2017)Tackles 14 WILLIAMS, Jrdn vs James Madison (Sep 2, 2017)
14 GIBBS, Cannon at UConn (Sep 24, 2017)14 WIGGINS, Korrin vs Tulane (Nov 11, 2017)
Sacks 1.0 ANDERSON, Kiant vs James Madison (Sep 2, 2017)1.0 ANDERSON, Kiant at West Virginia (Sep 9, 2017)1.0 TURNER, Alex at UConn (Sep 24, 2017)1.0 ANDERSON, Kiant vs USF (Sep 30, 2017)1.0 SUTTON, Devon at UCF (Oct 14, 2017)1.0 OWENS, Tyree at UCF (Oct 14, 2017)1.0 FULP, Bobby vs BYU (Oct 21, 2017)1.0 GORE, Colby vs BYU (Oct 21, 2017)1.0 FUTRELL, Kendal vs BYU (Oct 21, 2017)1.0 ANDERSON, Kiant vs Cincinnati (Nov 18, 2017)
Tackles For Loss 2.5 ANDERSON, Kiant vs James Madison (Sep 2, 2017)Interceptions 1 FULP, Bobby vs James Madison (Sep 2, 2017)
1 WIGGINS, Korrin at UConn (Sep 24, 2017)1 RAMSEUR, Aaron vs Temple (Oct 7, 2017)1 GIBBS, Cannon vs BYU (Oct 21, 2017)1 RAMSEUR, Aaron vs Tulane (Nov 11, 2017)1 PRICE, Jalen vs Tulane (Nov 11, 2017)1 LOVE, Chris vs Cincinnati (Nov 18, 2017)
The Automated ScoreBookECU Game Superlatives (as of Nov 27, 2017)
All games
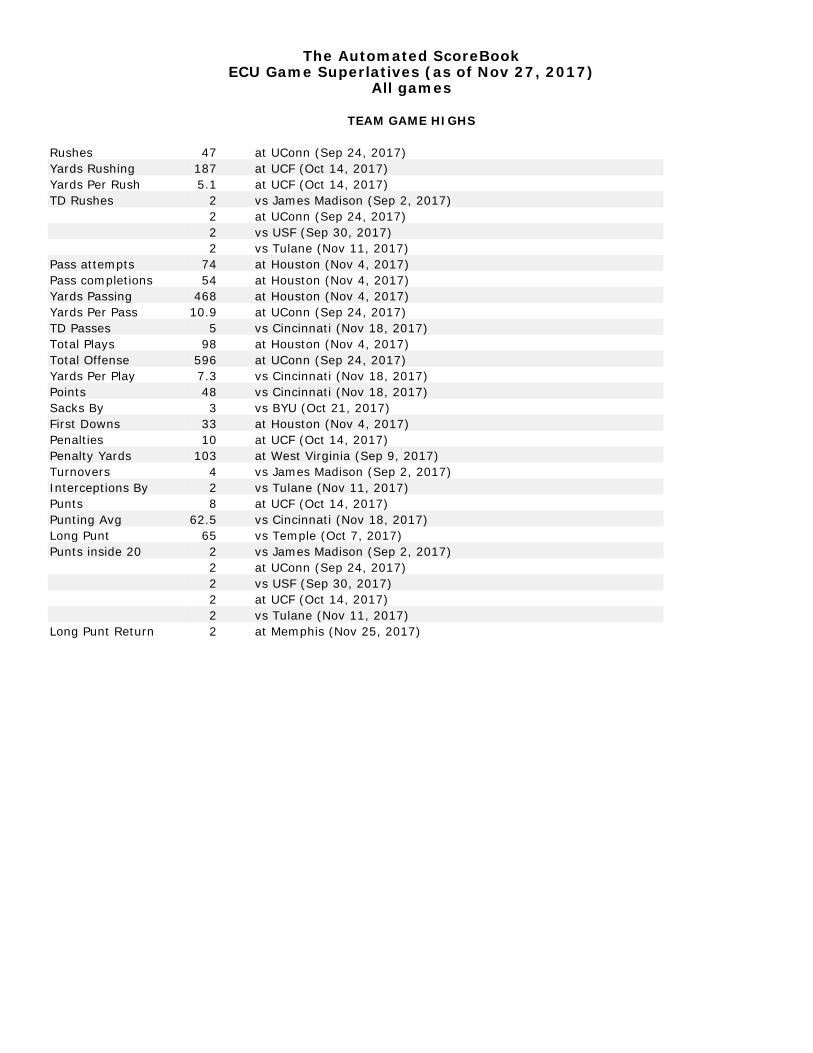
TEAM GAME HIGHS
Rushes 47 at UConn (Sep 24, 2017)Yards Rushing 187 at UCF (Oct 14, 2017)Yards Per Rush 5.1 at UCF (Oct 14, 2017)TD Rushes 2 vs James Madison (Sep 2, 2017)
2 at UConn (Sep 24, 2017)2 vs USF (Sep 30, 2017)2 vs Tulane (Nov 11, 2017)
Pass attempts 74 at Houston (Nov 4, 2017)Pass completions 54 at Houston (Nov 4, 2017)Yards Passing 468 at Houston (Nov 4, 2017)Yards Per Pass 10.9 at UConn (Sep 24, 2017)TD Passes 5 vs Cincinnati (Nov 18, 2017)Total Plays 98 at Houston (Nov 4, 2017)Total Offense 596 at UConn (Sep 24, 2017)Yards Per Play 7.3 vs Cincinnati (Nov 18, 2017)Points 48 vs Cincinnati (Nov 18, 2017)Sacks By 3 vs BYU (Oct 21, 2017)First Downs 33 at Houston (Nov 4, 2017)Penalties 10 at UCF (Oct 14, 2017)Penalty Yards 103 at West Virginia (Sep 9, 2017)Turnovers 4 vs James Madison (Sep 2, 2017)Interceptions By 2 vs Tulane (Nov 11, 2017)Punts 8 at UCF (Oct 14, 2017)Punting Avg 62.5 vs Cincinnati (Nov 18, 2017)Long Punt 65 vs Temple (Oct 7, 2017)Punts inside 20 2 vs James Madison (Sep 2, 2017)
2 at UConn (Sep 24, 2017)2 vs USF (Sep 30, 2017)2 at UCF (Oct 14, 2017)2 vs Tulane (Nov 11, 2017)
Long Punt Return 2 at Memphis (Nov 25, 2017)
The Automated ScoreBookECU Game Superlatives (as of Nov 27, 2017)
All games
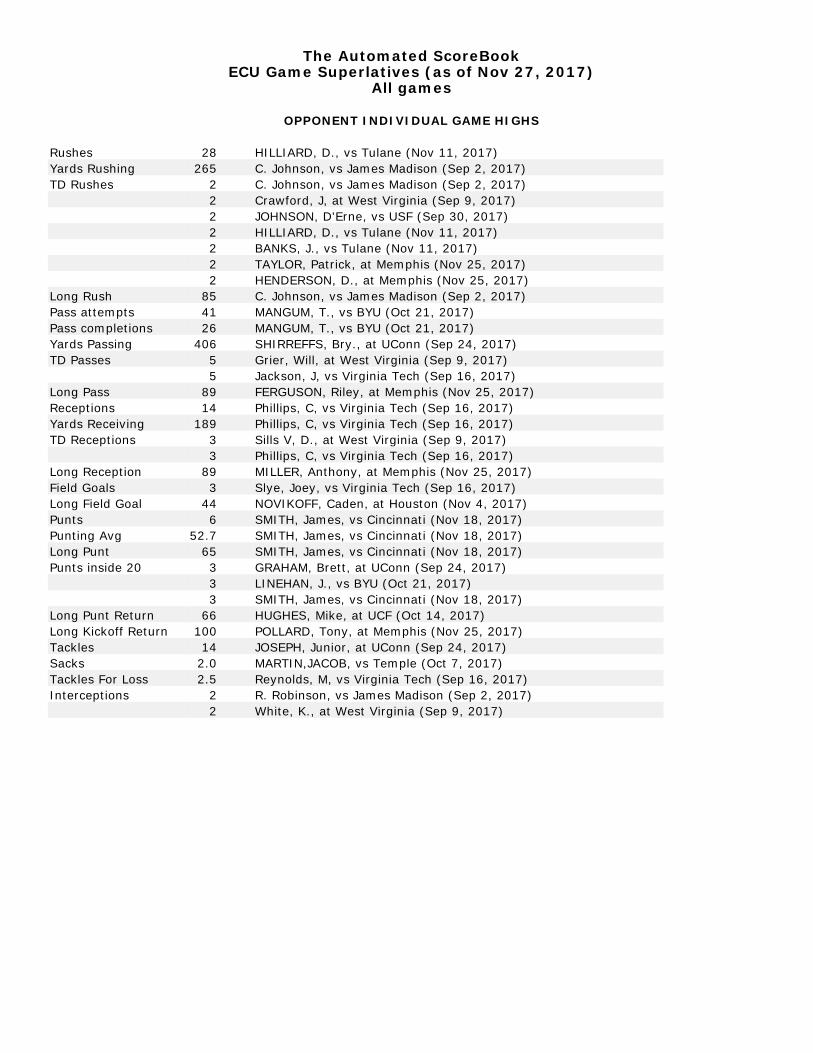
OPPONENT INDIVIDUAL GAME HIGHS
Rushes 28 HILLIARD, D., vs Tulane (Nov 11, 2017)Yards Rushing 265 C. Johnson, vs James Madison (Sep 2, 2017)TD Rushes 2 C. Johnson, vs James Madison (Sep 2, 2017)
2 Crawford, J, at West Virginia (Sep 9, 2017)2 JOHNSON, D'Erne, vs USF (Sep 30, 2017)2 HILLIARD, D., vs Tulane (Nov 11, 2017)2 BANKS, J., vs Tulane (Nov 11, 2017)2 TAYLOR, Patrick, at Memphis (Nov 25, 2017)2 HENDERSON, D., at Memphis (Nov 25, 2017)
Long Rush 85 C. Johnson, vs James Madison (Sep 2, 2017)Pass attempts 41 MANGUM, T., vs BYU (Oct 21, 2017)Pass completions 26 MANGUM, T., vs BYU (Oct 21, 2017)Yards Passing 406 SHIRREFFS, Bry., at UConn (Sep 24, 2017)TD Passes 5 Grier, Will, at West Virginia (Sep 9, 2017)
5 Jackson, J, vs Virginia Tech (Sep 16, 2017)Long Pass 89 FERGUSON, Riley, at Memphis (Nov 25, 2017)Receptions 14 Phillips, C, vs Virginia Tech (Sep 16, 2017)Yards Receiving 189 Phillips, C, vs Virginia Tech (Sep 16, 2017)TD Receptions 3 Sills V, D., at West Virginia (Sep 9, 2017)
3 Phillips, C, vs Virginia Tech (Sep 16, 2017)Long Reception 89 MILLER, Anthony, at Memphis (Nov 25, 2017)Field Goals 3 Slye, Joey, vs Virginia Tech (Sep 16, 2017)Long Field Goal 44 NOVIKOFF, Caden, at Houston (Nov 4, 2017)Punts 6 SMITH, James, vs Cincinnati (Nov 18, 2017)Punting Avg 52.7 SMITH, James, vs Cincinnati (Nov 18, 2017)Long Punt 65 SMITH, James, vs Cincinnati (Nov 18, 2017)Punts inside 20 3 GRAHAM, Brett, at UConn (Sep 24, 2017)
3 LINEHAN, J., vs BYU (Oct 21, 2017)3 SMITH, James, vs Cincinnati (Nov 18, 2017)
Long Punt Return 66 HUGHES, Mike, at UCF (Oct 14, 2017)Long Kickoff Return 100 POLLARD, Tony, at Memphis (Nov 25, 2017)Tackles 14 JOSEPH, Junior, at UConn (Sep 24, 2017)Sacks 2.0 MARTIN,JACOB, vs Temple (Oct 7, 2017)Tackles For Loss 2.5 Reynolds, M, vs Virginia Tech (Sep 16, 2017)Interceptions 2 R. Robinson, vs James Madison (Sep 2, 2017)
2 White, K., at West Virginia (Sep 9, 2017)

The Automated ScoreBookECU Game Superlatives (as of Nov 27, 2017)
All games
OPPONENT TEAM GAME HIGHS
Rushes 62 vs Virginia Tech (Sep 16, 2017)Yards Rushing 410 vs James Madison (Sep 2, 2017)Yards Per Rush 9.8 at Memphis (Nov 25, 2017)TD Rushes 5 vs USF (Sep 30, 2017)
5 at UCF (Oct 14, 2017)5 at Memphis (Nov 25, 2017)
Pass attempts 41 vs BYU (Oct 21, 2017)Pass completions 26 vs BYU (Oct 21, 2017)Yards Passing 406 at UConn (Sep 24, 2017)Yards Per Pass 20.1 at Memphis (Nov 25, 2017)TD Passes 5 at West Virginia (Sep 9, 2017)
5 vs Virginia Tech (Sep 16, 2017)Total Plays 95 vs Virginia Tech (Sep 16, 2017)Total Offense 675 vs Virginia Tech (Sep 16, 2017)Yards Per Play 13.0 at Memphis (Nov 25, 2017)Points 70 at Memphis (Nov 25, 2017)Sacks By 4 vs Temple (Oct 7, 2017)First Downs 34 vs Virginia Tech (Sep 16, 2017)Penalties 14 vs James Madison (Sep 2, 2017)Penalty Yards 172 vs James Madison (Sep 2, 2017)Turnovers 3 vs Tulane (Nov 11, 2017)Interceptions By 3 vs James Madison (Sep 2, 2017)
3 at Memphis (Nov 25, 2017)Punts 6 vs Cincinnati (Nov 18, 2017)Punting Avg 52.7 vs Cincinnati (Nov 18, 2017)Long Punt 65 vs Cincinnati (Nov 18, 2017)Punts inside 20 3 at UConn (Sep 24, 2017)
3 vs BYU (Oct 21, 2017)3 vs Cincinnati (Nov 18, 2017)
Long Punt Return 66 at UCF (Oct 14, 2017)

The Automated ScoreBookECU Combined Team Statistics (as of Nov 27, 2017)
Conference games
Date Opponent Score Att.* Sep 24, 2017 at UConn W 41-38 14036* Sep 30, 2017 #18 USF L 31-61 34883* Oct 7, 2017 TEMPLE L 10-34 31326* Oct 14, 2017 at #22 UCF L 21-63 40287* Nov 4, 2017 at Houston L 27-52 29810* Nov 11, 2017 TULANE L 24-31 36178* Nov 18, 2017 CINCINNATI W 48-20 31923* Nov 25, 2017 at Memphis L 13-70 41517*American Athletic Conference game
Rushing gp att gain loss net avg td lg avg/gHOWE, Hussein 8 72 334 10 324 4.5 3 25 40.5PINNIX, Darius 8 62 226 19 207 3.3 1 57 25.9DYE, Tyshon 5 25 119 4 115 4.6 0 12 23.0SIRK, Thomas 8 48 160 61 99 2.1 2 15 12.4SCOTT, Derrell 5 18 75 1 74 4.1 1 27 14.8ANDERSON, Devin 3 17 53 13 40 2.4 0 10 13.3GRAYSON, Davon 7 4 24 0 24 6.0 0 10 3.4FARRIER, Deondr 7 2 20 0 20 10.0 0 13 2.9GREEN, Terrell 6 1 16 0 16 16.0 0 16 2.7BROWN, Trevon 8 2 16 0 16 8.0 0 9 2.0HERRING, Reid 1 3 6 3 3 1.0 0 4 3.0JOHNSON, Quay 6 3 9 6 3 1.0 0 5 0.5Total 8 268 1077 152 925 3.5 7 57 115.6Opponents 8 319 2001 65 1936 6.1 26 75 242.0
Passing gp effic comp-att-int pct yds td lg avg/gMINSHEW, Grdnr 6 128.31 143-234-5 61.1 1559 11 95 259.8SIRK, Thomas 8 126.94 81-148-5 54.7 1077 8 75 134.6HERRING, Reid 1 598.00 1-1-0 100.0 20 1 20 20.0Total 8 129.01 225-383-10 58.7 2656 20 95 332.0Opponents 8 178.26 135-209-5 64.6 2240 18 89 280.0
Receiving gp no. yds avg td lg avg/gBROWN, Trevon 8 47 742 15.8 4 95 92.8GRAYSON, Davon 7 36 551 15.3 5 75 78.7JOHNSON, Quay 6 34 328 9.6 2 31 54.7HOWE, Hussein 8 28 206 7.4 0 23 25.8WILLIAMS, Jimmy 7 21 311 14.8 2 44 44.4FARRIER, Deondr 7 15 134 8.9 3 31 19.1DEANS, Tahj 5 14 159 11.4 2 23 31.8PINNIX, Darius 8 9 49 5.4 0 10 6.1BAGGETT, Steve 8 7 50 7.1 2 17 6.2SIRK, Thomas 8 3 28 9.3 0 16 3.5DYE, Tyshon 5 3 8 2.7 0 4 1.6VINES, Mydreon 5 2 39 19.5 0 34 7.8SCOTT, Derrell 5 2 28 14.0 0 29 5.6MARSHMON, Cam 4 2 13 6.5 0 10 3.2GRAY, Malik 6 1 7 7.0 0 7 1.2Total 8 225 2656 11.8 20 95 332.0Opponents 8 135 2240 16.6 18 89 280.0
Field Goals fg pct. 01-19 20-29 30-39 40-49 50-99 lg blkVERITY, Jake 9-15 60.0 0-0 5-5 0-2 2-4 2-4 52 0
PATScoring td fg kick rush rcv pass dxp saf ptsVERITY, Jake - 9-15 26-27 - - - - - 53GRAYSON, Davon 5 - - - - - - - 30BROWN, Trevon 4 - - - - - - - 24HOWE, Hussein 3 - - - - - - - 18FARRIER, Deondr 3 - - - - - - - 18SIRK, Thomas 2 - - - - - - - 12JOHNSON, Quay 2 - - - - - - - 12DEANS, Tahj 2 - - - - - - - 12WILLIAMS, Jimmy 2 - - - - - - - 12BAGGETT, Steve 2 - - - - - - - 12SCOTT, Derrell 1 - - - - - - - 6PINNIX, Darius 1 - - - - - - - 6Total 27 9-15 26-27 - - - - - 215Opponents 50 7-9 48-50 - - - - - 369
Score by Quarters 1st 2nd 3rd 4th OT TotalECU 62 54 62 37 0 215Opponents 105 113 93 51 7 369
Record: Overall Home Away NeutralAll games 2-6 1-3 1-3 0-0Conference 2-6 1-3 1-3 0-0Non-Conference 0-0 0-0 0-0 0-0
Team Statistics ECU OPPFIRST DOWNS 196 187 R u s h i n g 52 93 P a s s i n g 124 80 P e n a l t y 20 14RUSHING YARDAGE 925 1936 Rushing Attempts 268 319 Average Per Rush 3.5 6.1 Average Per Game 115.6 242.0 TDs Rushing 7 26PASSING YARDAGE 2656 2240 C o m p - A t t - I n t 225-383-10 135-209-5 Average Per Pass 6.9 10.7 Average Per Catch 11.8 16.6 Average Per Game 332.0 280.0 TDs Passing 20 18TOTAL OFFENSE 3581 4176 Average Per Play 5.5 7.9 Average Per Game 447.6 522.0KICK RETURNS: #-Yards 30-596 10-301PUNT RETURNS: #-Yards 4--4 11-163INT RETURNS: #-Yards 5-50 10-226FUMBLES-LOST 7-1 7-3PENALTIES-Yards 56-486 60-566PUNTS-AVG 35-44.3 26-43.6TIME OF POSSESSION/Game 3 3 : 0 8 2 6 : 5 33RD-DOWN Conversions 61/139 52/964TH-DOWN Conversions 12/20 6/8
Interceptions no. yds avg td lgRAMSEUR, Aaron 2 29 14.5 0 31PRICE, Jalen 1 12 12.0 0 12LOVE, Chris 1 9 9.0 0 9WIGGINS, Korrin 1 0 0.0 0 0
Punting no. yds avg lg tb fc i20 50+ blkBARNES, Austin 32 1438 44.9 65 5 9 11 12 0VERITY, Jake 3 112 37.3 45 0 1 1 0 0
Punt Returns no. yds avg td lgJOHNSON, Quay 2 -1 -0.5 0 0GORE, Colby 1 -5 -5.0 0 0BROWN, Trevon 1 2 2.0 0 2Total 4 -4 -1.0 0 2Opponents 11 163 14.8 1 66
Kick Returns no. yds avg td lgBROWN, Trevon 19 411 21.6 0 48LOVE, Chris 6 127 21.2 0 27PINNIX, Darius 4 51 12.8 0 25JOHNSON, Quay 1 0 0.0 0 0GORE, Colby 0 7 0.0 0 7Total 30 596 19.9 0 48Opponents 10 301 30.1 1 100
All Purpose g rush rcv pr kr ir total avg/gBROWN, Trevon 8 16 742 2 411 0 1171 146.4GRAYSON, Dav 7 24 551 0 0 0 575 82.1HOWE, Hussein 8 324 206 0 0 0 530 66.2JOHNSON, Qua 6 3 328 -1 0 0 330 55.0WILLIAMS, Jimm 7 0 311 0 0 0 311 44.4Total 8 925 2656 -4 596 50 4223 527.9Opponents 8 1936 2240 163 301 226 4866 608.2
Total Offense g plays rush pass total avg/gMINSHEW, Grdnr 6 245 -16 1559 1543 257.2SIRK, Thomas 8 196 99 1077 1176 147.0HOWE, Hussein 8 72 324 0 324 40.5PINNIX, Darius 8 62 207 0 207 25.9DYE, Tyshon 5 25 115 0 115 23.0Total 8 651 925 2656 3581 447.6Opponents 8 528 1936 2240 4176 522.0
Tackles Sacks Pass defense Fumbles blkd## Defensive Leaders gp ua a tot tfl/yds no-yds int-yds brup qbh rcv-yds ff kick saf15 WIGGINS, Korrin 7 37 31 68 3.0-9 . 1-0 1 . . . . .42 SUTTON, Devon 8 17 29 46 4.5-12 1.0-4 . 2 . . . . .7 WILLIAMS, Jrdn 8 20 24 44 2.0-6 . . 1 . . 1 . .51 RAMSEUR, Aaron 8 23 21 44 1.5-2 . 2-29 . . . . . .33 GIBBS, Cannon 8 16 18 34 . . . . . . . . .
Total 8 271 264 535 21-67 5-29 5-50 14 10 3-0 4 . .Opponents 8 347 231 578 44-151 11-82 10-226 50 36 1-6 2 1 .

The Automated ScoreBookECU Combined Team Statistics (as of Nov 27, 2017)
Non-conference games
Date Opponent Score Att.Sep 2, 2017 JAMES MADISON L 14-34 40169Sep 9, 2017 at West Virginia L 20-56 56797Sep 16, 2017 #16 VIRGINIA TECH L 17-64 43776Oct 21, 2017 BYU W 33-17 38835
*American Athletic Conference game
Rushing gp att gain loss net avg td lg avg/gDYE, Tyshon 3 25 105 3 102 4.1 0 26 34.0HOWE, Hussein 4 24 100 5 95 4.0 0 11 23.8SIRK, Thomas 3 16 69 3 66 4.1 1 13 22.0SCOTT, Derrell 4 23 70 5 65 2.8 1 11 16.2ANDERSON, Devin 1 12 45 2 43 3.6 0 11 43.0PINNIX, Darius 4 12 29 7 22 1.8 1 6 5.5GRAYSON, Davon 4 2 16 0 16 8.0 0 12 4.0WILLIAMS, Jimmy 3 1 2 0 2 2.0 0 2 0.7HERRING, Reid 1 1 1 0 1 1.0 0 1 1.0Total 4 128 446 79 367 2.9 3 26 91.8Opponents 4 182 1097 87 1010 5.5 10 85 252.5
Passing gp effic comp-att-int pct yds td lg avg/gSIRK, Thomas 3 105.39 51-90-4 56.7 578 1 41 192.7MINSHEW, Grdnr 4 131.86 31-70-2 44.3 581 5 95 145.2Total 4 116.97 82-160-6 51.2 1159 6 95 289.8Opponents 4 182.78 92-132-2 69.7 1314 13 75 328.5
Receiving gp no. yds avg td lg avg/gGRAYSON, Davon 4 23 335 14.6 1 36 83.8BROWN, Trevon 4 13 327 25.2 3 95 81.8JOHNSON, Quay 4 13 136 10.5 1 27 34.0WILLIAMS, Jimmy 3 11 136 12.4 1 27 45.3FARRIER, Deondr 2 9 77 8.6 0 19 38.5BAGGETT, Steve 4 4 55 13.8 0 41 13.8DYE, Tyshon 3 3 48 16.0 0 30 16.0DEANS, Tahj 4 2 18 9.0 0 12 4.5HOWE, Hussein 4 2 13 6.5 0 6 3.2GRAY, Malik 1 1 11 11.0 0 11 11.0SCOTT, Derrell 4 1 3 3.0 0 3 0.8Total 4 82 1159 14.1 6 95 289.8Opponents 4 92 1314 14.3 13 75 328.5
Field Goals fg pct. 01-19 20-29 30-39 40-49 50-99 lg blkVERITY, Jake 7-10 70.0 0-0 1-1 3-3 3-5 0-1 45 1
PATScoring td fg kick rush rcv pass dxp saf ptsVERITY, Jake - 7-10 9-9 - - - - - 30BROWN, Trevon 3 - - - - - - - 18WILLIAMS, Jimmy 1 - - - - - - - 6PINNIX, Darius 1 - - - - - - - 6SIRK, Thomas 1 - - - - - - - 6SCOTT, Derrell 1 - - - - - - - 6JOHNSON, Quay 1 - - - - - - - 6GRAYSON, Davon 1 - - - - - - - 6Total 9 7-10 9-9 - - - - - 84Opponents 23 4-8 21-22 - - 0-1 - - 171
Score by Quarters 1st 2nd 3rd 4th OT TotalECU 27 3 26 28 0 84Opponents 42 47 55 27 0 171
Record: Overall Home Away NeutralAll games 1-3 1-2 0-1 0-0Conference 0-0 0-0 0-0 0-0Non-Conference 1-3 1-2 0-1 0-0
Team Statistics ECU OPPFIRST DOWNS 83 109 R u s h i n g 20 47 P a s s i n g 48 56 P e n a l t y 15 6RUSHING YARDAGE 367 1010 Rushing Attempts 128 182 Average Per Rush 2.9 5.5 Average Per Game 91.8 252.5 TDs Rushing 3 10PASSING YARDAGE 1159 1314 C o m p - A t t - I n t 82-160-6 92-132-2 Average Per Pass 7.2 10.0 Average Per Catch 14.1 14.3 Average Per Game 289.8 328.5 TDs Passing 6 13TOTAL OFFENSE 1526 2324 Average Per Play 5.3 7.4 Average Per Game 381.5 581.0KICK RETURNS: #-Yards 14-282 10-232PUNT RETURNS: #-Yards 2-0 6-41INT RETURNS: #-Yards 2-22 6-10FUMBLES-LOST 5-4 3-1PENALTIES-Yards 24-219 33-365PUNTS-AVG 18-42.3 15-43.7TIME OF POSSESSION/Game 2 7 : 1 9 3 2 : 4 13RD-DOWN Conversions 21/60 26/544TH-DOWN Conversions 5/9 2/5
Interceptions no. yds avg td lgFULP, Bobby 1 -3 -3.0 0 0GIBBS, Cannon 1 25 25.0 0 25
Punting no. yds avg lg tb fc i20 50+ blkBARNES, Austin 18 762 42.3 62 1 6 5 5 0
Punt Returns no. yds avg td lgJOHNSON, Quay 1 -1 -1.0 0 0IRVIN, Tim 1 1 1.0 0 1Total 2 0 0.0 0 1Opponents 6 41 6.8 0 23
Kick Returns no. yds avg td lgLOVE, Chris 7 145 20.7 0 30GRAYSON, Davon 2 49 24.5 0 29BROWN, Trevon 2 41 20.5 0 21HOWE, Hussein 2 36 18.0 0 21JOHNSON, Quay 1 11 11.0 0 11Total 14 282 20.1 0 30Opponents 10 232 23.2 0 32
All Purpose g rush rcv pr kr ir total avg/gGRAYSON, Dav 4 16 335 0 49 0 400 100.0BROWN, Trevon 4 0 327 0 41 0 368 92.0DYE, Tyshon 3 102 48 0 0 0 150 50.0JOHNSON, Qua 4 0 136 -1 11 0 146 36.5LOVE, Chris 4 0 0 0 145 0 145 36.2Total 4 367 1159 0 282 22 1830 457.5Opponents 4 1010 1314 41 232 10 2607 651.8
Total Offense g plays rush pass total avg/gSIRK, Thomas 3 106 66 578 644 214.7MINSHEW, Grdnr 4 77 -24 581 557 139.2DYE, Tyshon 3 25 102 0 102 34.0HOWE, Hussein 4 24 95 0 95 23.8SCOTT, Derrell 4 23 65 0 65 16.2Total 4 288 367 1159 1526 381.5Opponents 4 314 1010 1314 2324 581.0
Tackles Sacks Pass defense Fumbles blkd## Defensive Leaders gp ua a tot tfl/yds no-yds int-yds brup qbh rcv-yds ff kick saf7 WILLIAMS, Jrdn 4 22 23 45 1.0-1 . . 1 . . . . .15 WIGGINS, Korrin 4 17 11 28 1.0-9 . . . . . . . .8 FULP, Bobby 4 16 9 25 1.5-5 1.0-4 1--3 1 . . . . .42 SUTTON, Devon 4 14 8 22 1.0-5 . . 1 1 1-0 1 . .1 IRVIN, Tim 3 14 6 20 0.5-1 . . . . . . . .
Total 4 180 162 342 18-81 6-45 2-22 16 9 1-0 3 . .Opponents 4 147 122 269 23-59 4-30 6-10 20 20 4-0 3 1 .

2017 ECU Football Final Statistics, Misc...Page 1
CAREER STARTSOFFENSE ‘17 ‘16 ’15 ‘14 Total StreakDavon Grayson, WR 11 0 12 10 *39 1Brandon Smith, T 11 12 11 0 34 0Jimmy Williams, WR 7 12 6 1 26 0Garrett McGhin, C/G 11 11 0 0 22 8Quay Johnson, WR 8 10 0 1 19 0Stephen Baggett, TE 9 8 0 0 17 2Messiah Rice, T 5 10 0 0 15 0Trevon Brown, WR 7 0 5 2 14 5John Spellacy, C 8 0 0 0 8 5Deondre Farrier, WR 4 4 0 0 8 0Gardner Minshew, QB 5 2 0 0 7 3Thomas Sirk, QB 7 0 0 0 7 0Justin Sandifer, T 4 2 0 0 6 4Darius Pinnix, RB 6 0 0 0 6 3Des Barmore, G 6 0 0 0 6 0Cortez Herrin, G 5 0 0 0 5 1D’Ante Smith, T/G 5 0 0 0 5 1Austin Lee, G 3 0 0 0 3 0Derrell Scott, RB 3 0 0 0 3 0Dqmarcus Shaw, G 2 0 0 0 2 0Tyshon Dye, RB 2 0 0 0 2 0Dalton Montgomery, TE 1 0 0 0 1 1Hussein Howe, RB 1 0 0 0 1 0Tahj Deans, WR 1 0 0 0 1 0Terrell Green, WR 0 1 0 0 1 0*includes six (6) starts in 2013
DEFENSE ‘17 ‘16 ‘15 ‘14 Total StreakJordan Williams, ILB 10 5 10 0 25 5Colby Gore, CB 9 9 0 0 18 9Demage Bailey, DT/DE 5 10 2 0 17 2Kiante Anderson, DE 9 6 0 0 15 3Bobby Fulp, SS/FS/CB 9 6 0 0 15 0Devon Sutton, SS/NB 10 4 0 0 14 10Corey Seargent, CB/NB 5 6 0 0 11 2Jalen Price, DT/DE 9 0 0 0 9 7Korrin Wiggins, FS 8 0 0 0 8 3Aaron Ramseur, ILB 6 0 0 0 6 3Alex Turner, DT 6 0 0 0 6 0Chris Love, CB 5 1 0 0 6 0Cannon Gibbs, ILB 6 0 0 0 6 0Kendall Futrell, DE 4 1 0 0 5 1Raequan Purvis, DT/DE 5 0 0 0 5 0Gaelin Elmore, DE 4 0 0 0 4 0Tim Irvin, NB/FS 4 0 0 0 4 0Keyshawn Canady, CB 3 0 0 0 3 3Davondre Robinson, SS 3 0 0 0 3 0Marcus Holton Jr., CB 3 0 0 0 3 0Tyree Owens, DT 3 0 0 0 3 0Mike Myers, DT 1 2 0 0 3 0Ray Tillman, ILB 2 0 0 0 2 0Chandon Hickerson, DE 1 0 0 0 1 0Shaun James, DE 1 0 0 0 1 0Travis Phillips, CB 1 0 0 0 1 0
TOUCHDOWN DRIVES TD Length TD Drive Length 01-09 Yards .....................................................15 ........................................................010-19 Yards .......................................................8 ........................................................220-29 Yards ......................................................6 .........................................................130-39 Yards ...................................................... 3 .........................................................140-49 Yards .....................................................0 ........................................................050-59 Yards......................................................0 .........................................................160-69 Yards .....................................................0 ........................................................570-79 Yards ......................................................2 .......................................................2180-89 Yards .....................................................0 ........................................................ 390-99 Yards .....................................................2 ........................................................2 TD Drive Time Plays on TD Drive0:00-0:29 ........................................................2 1 .................20:30-0:59 .........................................................4 2 .................41:00-1:59 ..........................................................6 3 .................22:00-2:59 .........................................................9 4 .................23:00-3:59 .........................................................6 5 .................24:00-4:59.........................................................4 6 .................25:00-5:59 .........................................................5 7 ................. 36:00-6:59 .........................................................0 8 .................47:00+ ................................................................0 9 .................4Total Time: 6,027 seconds 10+ ................ 11Average TD Drive: 7.3 plays, 2:47
2017 COLOR(S) OF THE DAYHelmet/Jersey/Pants RecordPurple/Black/Black ......................................................................................0-1 (L/TEM)Purple/Purple/White .......................................................................0-2 (L/JMU, L/USF)Purple/Purple/Gold ....................................................................................... 0-1 (L/VT)Purple/Purple/Purple ...................................................................2-0 (W/BYU, W/CIN)Purple/White/Purple .......................................................................0-2 (L/UH, L/MEM)Purple/White/White .................................................................................... 0-1 (L/UCF)White/Purple/White .................................................................................... 0-1 (L/TLN)White/White/Purple ................................................................ 1-1 (L/WVU, W/UCONN)
A PIRATE LOOKS AT 25A look at ECU players who recorded a gain of 25 yards or more on a single play during the 2017 season:RUSHYds Player Opponent TD57 Darius Pinnix....................................... UCF N27 Derrell Scott ........................................ Tulane N26 Tyshon Dye .......................................... West Virginia N25 Hussein Howe ..................................... Tulane Y
RECEIVINGYds Player Opponent TD95 Trevon Brown ...................................... Cincinnati Y 95 Trevon Brown ...................................... West Virginia Y 76 Trevon Brown ...................................... Virginia Tech Y 75 Davon Grayson.................................... Connecticut Y 46 Davon Grayson ................................... Connecticut N45 Trevon Brown ...................................... Cincinnati N44 Davon Grayson ................................... USF N44 Jimmy Williams .................................. USF N41 Trevon Brown ...................................... BYU N41 Davon Grayson ................................... UCF N41 Stephen Baggett ................................ Virginia Tech N39 Jimmy Williams .................................. Temple N36 Davon Grayson ................................... BYU N36 Davon Grayson ................................... West Virginia N35 Jimmy Williams .................................. Temple N34 Trevon Brown ...................................... Houston Y34 Mydreon Vines .................................... USF N33 Jimmy Williams .................................. Memphis Y33 Trevon Brown ...................................... Cincinnati N33 Trevon Brown ...................................... Cincinnati N32 Trevon Brown ...................................... Memphis N31 Deondre Farrier .................................. Memphis N31 Quay Johnson ..................................... Temple N31 Davon Grayson.................................... USF Y 30 Tyshon Dye .......................................... Virginia Tech N28 Trevon Brown ...................................... Tulane N28 Davon Grayson ................................... BYU N28 Davon Grayson ................................... BYU N29 Derrell Scott ........................................ USF N29 Davon Grayson ................................... James Madison N27 Quay Johnson ..................................... Virginia Tech N27 Jimmy Williams .................................. West Virginia N26 Trevon Brown ...................................... BYU Y 26 Davon Grayson ................................... Temple N
ECU BIG PLAYS (25+ yards)Rush (4): Darius Pinnix (1), Tyshon Dye (1), Derrell Scott (1), Hussein Howe (1)Receive (34): Trevon Brown (11), Davon Grayson (11), Jimmy Williams (5), Quay Johnson (2), Stephen Baggett (1), Tyshon Dye (1), Deondre Farrier (1), Derrell Scott (1), Mydreon Vines (1)

2017 ECU Football Final Statistics, Misc...Page 2
AVERAGE GAIN ON FIRST DOWNECU FIRST DOWN PLAYS: .....................................................................................403ECU YARDS GAINED ON FIRST DOWN PLAYS: ....................................... 2,045 yardsECU FIRST DOWN GAINED ON FIRST DOWN PLAYS: .............................................69ECU TOUCHDOWNS SCORED ON FIRST DOWN PLAYS: ...........................................15ECU AVERAGE GAIN ON FIRST DOWN PLAYS: ............................................... 5.1 ypp
OPP FIRST DOWN PLAYS: .....................................................................................398OPP YARDS GAINED ON FIRST DOWN PLAYS: ........................................3,423 yardsOPP FIRST DOWN GAINED ON FIRST DOWN PLAYS: .............................................96OPP TOUCHDOWNS SCORED ON FIRST DOWN PLAYS:.......................................... 33OPP AVERAGE GAIN ON FIRST DOWN PLAYS: .............................................. 8.6 ypp
PERCENTAGE OF SCORINGECU had 157 possessions and scored on 52 of those in 2017, meaning the Pirates scored 33.1 percent of the time they had the ball.NUMBER OF POSSESSIONS: 157NUMBER OF SCORES: 52 (36 TD, 16 FG)SUCCESS PERCENTAGE: 33.1
Opponents had 149 possessions and scored on 78 in 2017, a percentage of 52.3.NUMBER OF POSSESSIONS: 149NUMBER OF OPPONENT SCORES: 78 (67 TD, 11 FG)SUCCESS PERCENTAGE: 52.3
TURNOVERS AND TOUCHDOWNSECU forced 11 turnovers in 2017 and converted 5 into scores. That is a conversion rate of 45.5 percent.NUMBER OF TURNOVERS FORCED: ............................................................................11NUMBER OF TOUCHDOWNS: ...................................................................................... 4NUMBER OF FIELD GOALS: .......................................................................................... 1REASONS FOR NOT SCORING (6): fumble (1), end of half (1), missed FG (1), punt (1), downs (1), interception (1)
Opponents forced 21 ECU turnovers in 2017 and converted 18 into scores, a success rate of 85.7 percent.NUMBER OF TURNOVERS FORCED: ........................................................................... 21NUMBER OF TOUCHDOWNS: ..................................................................................... 17NUMBER OF FIELD GOALS: .......................................................................................... 1REASONS FOR NOT SCORING (3): missed FG (1), interception (1), punt (1)
THREE AND OUTSECU had 157 possessions in 2017 and were held to three downs 30 times or 19.1 percent. Conversely, opponents had the ball 149 times and were held to three downs 20 times or 13.4 percent.ECU POSSESSIONS: .................................................................................................. 157ECU HELD TO THREE DOWNS AND A PUNT: ............................................................. 30OPP POSSESSIONS:..................................................................................................149OPP HELD TO THREE DOWNS AND A PUNT: ............................................................ 20
THE BIG PLAY (20+ yards)ECU BIG OFFENSIVE PLAYS: ............................................................ 56 (4.7 per game)BIG PLAYS BY RUN/PASS: ..................................................................................... 7/49BIG PLAY TOUCHDOWNS: .......................................................................................... 13 20-29 yards: .......................................................................... 30 (6 touchdowns) 30-39 yards: .......................................................................... 14 (3 touchdowns) 40-49 yards: ........................................................................... 7 (0 touchdowns) 50-59 yards: ............................................................................ 1 (0 touchdowns) 60-69 yards: ............................................................................0 (0 touchdowns) 70+ yards: .................................................................................4 (4 touchdowns)
OPP BIG OFFENSIVE PLAYS: ...........................................................77 (6.4 per game)BIG PLAYS BY RUN/PASS: ................................................................................... 21/56BIG PLAY TOUCHDOWNS: ......................................................................................... 25 20-29 yards: ........................................................................... 31 (2 touchdowns) 30-39 yards: ........................................................................... 17 (2 touchdowns) 40-49 yards: .......................................................................... 14 (6 touchdowns) 50-59 yards: ..............................................................................1 (1 touchdowns) 60-69 yards: .............................................................................4 (4 touchdowns) 70+ yards: ............................................................................. 10 (10 touchdowns)
3RD/4TH DOWN CONVERSIONS - BY YARDSThird Down Fourth Down3-1 .................................................10/17 8/9 ..............................................4-13-2 .................................................12/19 1/5 .............................................. 4-23-3 .................................................. 3/15 3/4 .............................................. 4-33-4 ............................................... 12/23 1/3 ..............................................4-43-5 .................................................. 5/13 1/1 ............................................... 4-53-6 ............................................... 10/15 0/0 .............................................4-63-7 ..................................................4/14 1/2 .............................................. 4-73-8 ................................................. 3/12 0/0 .............................................4-83-9 .................................................9/16 0/1 ..............................................4-93-10 .............................................. 14/55 2/4 ............................................ 4-10Total ..................... (41.2%) 82/199 17/29 (58.6%) .................. Total
100-YARD RUSHING GAMESECU: Hussein Howe (108/TLN; 1 season, 1 career) OPP: Cardon Johnson (265/JMU), Justin Crawford (118/WVU), Kevin Mensah (107/UCONN), D’Ernest Johnson (111/USF), David Hood (106/TEM), Dontrell Hilliard (189/TLN), Patrick Taylor (127/MEM), Darrell Henderson (122/MEM)
300-YARD PASSING GAMESECU: Gardner Minshew (463/UH, 444/CIN, 351/MEM; 3 season, 4 career), Thomas Sirk (426/UCONN, 302/USF; 2 season/2 career)OPP: Will Grier (352/WVU), Josh Jackson (372/VT), Bryant Shirreff s (406/UCONN), Logan Marchi (321/TEM), McKenzie Milton (324/UCF), Tanner Mangum (319/BYU), D’Eriq King (330/UH)
SCORING MISCELLANY ‘17 ‘16 ‘15 ‘14 ‘13 5 yrsECU scores fi rst: 2-2 3-6 2-4 6-2 9-2 22-16OPP scores fi rst: 1-7 0-3 3-3 2-3 1-1 7-17ECU leads/1st qtr: 2-2 3-1 3-3 6-0 7-0 21-6OPP leads/1st qtr: 0-6 0-6 1-3 0-3 1-1 2-19Game is tied/1st qtr: 1-1 0-2 1-1 2-2 2-2 6-8ECU leads/half: 2-0 2-0 4-2 7-0 10-0 25-2OPP leads/half: 0-9 1-9 1-5 1-5 0-1 3-29Game is tied/half: 1-0 0-0 0-0 0-0 0-2 1-2ECU leads/3rd qtr: 3-0 3-0 5-2 6-0 8-0 25-2OPP leads/3rd qtr: 0-9 0-9 0-5 1-5 0-3 1-31Game is tied/3rd qtr: 0-0 0-0 0-0 1-0 2-0 3-0ECU/overtime: 0-1 0-0 0-0 0-0 0-1 0-2
SPECIAL TEAMS TACKLES No. Name Tackles 20 Austin Teague ..................................................................................... 8 28 Hussein Howe ..................................................................................... 7 40 Nate Harvey ........................................................................................ 6 30 Joe Carter ............................................................................................ 5 14 Travis Phillips ...................................................................................... 3 37 Trevian Hicks ....................................................................................... 2 35 Chris Love ............................................................................................ 2 51 Aaron Ramseur ................................................................................... 2 7 Jordan Williams .................................................................................. 2 41 Tony Baird ............................................................................................ 1 38 Bruce Bivens ........................................................................................ 1 31 Keyshawn Canady ............................................................................... 1 34 Devin Carlos ......................................................................................... 1 8 Bobby Fulp ........................................................................................... 1 27 Darius Pinnix ........................................................................................ 1 47 Anthony Ratliff .................................................................................... 1 45 Kenyon Taylor ...................................................................................... 1 21 Ray Tillman .......................................................................................... 1Single-Game High: 3 by Austin Teague (CIN), 2 by Joe Carter (UCONN), 2 by Nate Harvey (BYU), 2 by Hussein Howe (VT, USF, BYU), 2 by Chris Love (TEM)

2017 ECU Football Final Statistics, Misc...Page 3
2017 - A BRIEF OVERVIEW ECU posted a 3-9 overall mark and stood tied for fourth (along with Cincinnati and Connecticut) in the American Athletic Conference’s East Division at 2-6 ... The Pirates recorded a victory each month (UConn/Sept. 24, BYU/Oct. 21, Cincinnati/Nov. 18), but were collectively outscored 465 (51.7 ppg) to 177 (19.7) in their nine losses ... Of those setbacks, fi ve were opponents either ranked or receiving votes in the AP or USA Today/Coaches Top 25 polls - Virginia Tech, West Virginia, USF, UCF and Memphis ... A total of 50 diff erent players (24/off ense, 26/defense) made starts in 2017, including 25 fi rst-timers.
2017 ALL-AMERICAN ATHLETIC CONFERENCE SELECTIONS ECU was represented on the second and honorable mention All-American Athletic Conference squads with three selections (by league head coaches):ALL-AMERICAN ATHLETIC CONFERENCEWR Trevon Brown ......................................................................Second Team (off ense)DE Kiante Anderson .......................................................Honorable Mention (defense)WR Davon Grayson .........................................................Honorable Mention (defense)
ECU IN THE 2017 NATIONAL STATISTICSA look at how the Pirates ranked in the 2017 FBS statistics (129 teams):Rush Off ense ..........................118th/107.7 Rush Defense ........................ 124th/245.5Pass Off ense ............................ 12th/317.9 Pass Defense .........................124th/296.2Pass Effi ciency .....................88th/125.46 Pass Eff . Defense ................. 129th/180.01Total Off ense .........................42nd/425.6 Total Defense .........................129th/541.7Scoring Off ense ...................... 94th/24.9 Scoring Defense...................... 129th/45.0First Down Off ense .................. 46th/279 First Down Defense ................. 114th/296Punt Returns ........................ 129th/-0.67 Punt Return Def. ..................... 110th/12.0Kickoff Returns .......................86th/20.0 Kickoff Return Def. ................ 127th/26.6Fumbles Recovered .................... 120th/4 Fumbles Lost .................................. 12th/5Passes Intercepted .................... 102nd/7 Passes Had Int. ........................... 115th/16Turnovers Gained ....................... 118th/11 Turnovers Lost ............................. 85th/21Turnover Margin ...................119th/-0.83 Net Punting............................... 74th/37.5Fewest Penalties .................... 97th/6.67 Fewest Yards Pen. ...................91st/58.753rd Down %...............................53rd/41.2 3rd Down % Defense ............. 128th/52.04th Down % ............................40th/58.6 4th Down % Defense ................103rd/61.5Redzone Effi ciency ................. 111th/75.0 Redzone Eff . Defense ................114th/89.3Tackles For Loss ....................... 129th/3.3 Sacks ........................................ 125th/0.92Sacks Allowed ........................... 17th/1.25 Possession Time .......................36th/31:11TOP 30 INDIVIDUAL LEADERS: P Austin Barnes was 21st in punting average; WR Trevon Brown was 17th in receiving yards per game, 25th in receiving yards, 30th in yards per reception, 30th in all-purpose yards per game.
ECU IN THE 2017 AMERICAN STATISTICSA look at how the Pirates ranked in the 2017 American Conference statistics (12 teams):Rush Off ense ........................... 12th/107.7 Rush Defense ........................... 11th/245.5Pass Off ense ..............................3rd/317.9 Pass Defense ............................11th/296.2Pass Effi ciency ..................... 10th/125.46 Pass Eff . Defense ................... 12th/180.01Total Off ense ............................7th/425.6 Total Defense ...........................12th/541.7Scoring Off ense .......................10th/24.9 Scoring Defense........................ 12th/45.0First Down Off ense .................... 5th/279 First Down Defense ....................9th/296Punt Returns .......................... 12th/-0.67 Punt Return Def. .......................12th/12.0Kickoff Returns .........................8th/20.0 Kickoff Return Def. ..................12th/26.6Fumbles Recovered ....................... 11th/4 Fumbles Lost .....................................1st/5Passes Intercepted ........................ 8th/7 Passes Had Int. .............................12th/16Turnovers Gained ........................ 10th/11 Turnovers Lost ..............................10th/21Turnover Margin .................... 12th/-0.83 Net Punting................................. 7th/37.5Fewest Penalties ...................... 6th/6.67 Fewest Yards Pen. ....................5th/58.753rd Down %................................ 9th/41.2 3rd Down % Defense ............... 12th/52.04th Down % .............................. 6th/58.6 4th Down % Defense ...................9th/61.5Redzone Effi ciency ..................10th/75.0 Redzone Eff . Defense ................. 12th/89.3Tackles For Loss ......................... 12th/3.3 Sacks .......................................... 12th/0.92Sacks Allowed ............................ 3rd/1.25 Possession Time .........................3rd/31:11
THE PIRATE NATION - 8.4 MILLION STRONGECU has always been able to claim plenty of hometown support, even more so when playing at Dowdy-Ficklen Stadium during the fall - establishing itself as a conference and a national attendance leader on a near annual basis ... In all, a total of 8,465,456 fans have seen the Pirates in action since 1963 ... Since the completion of a 7,000-seat expansion project in 2010 (to push capacity to 50,000), the Pirates have drawn 2,194,170 fans ... ECU surpassed the the 2 million post-expansion “milestone” on Sept. 16 when 43,776 watched the Pirates battle Virginia Tech.
ATTENDANCE LEADERSECU topped all American Athletic Conference members in regular season attendance in 2014, 2016 and 2017 ... Overall, ECU ranked 58th nationally in average attendance (36,727) and 76th in capacity percentage (73.45) in 2017 ... A closer look at Top 5 AAC (regular season): 1. ECU (36,727), 2. UCF (36,082), 3. Navy (34,756), 4. Memphis (33,307), 5. Houston (32,583) ... ECU has drawn at least 40,000 fans to Dowdy-Ficklen Stadium in 22 of its last 29 home games dating back to 2013, which included the 2017 opener vs. James Madison (40,169) and the Sept. 16 clash vs. Virginia Tech (43,776).
THE AMERICAN - YEAR FOURECU has posted a 81-60 (.574) all-time mark against current members of the Ameri-can Conference ... The Pirates currently sport series records against Memphis (15-7), Cincinnati (13-8), Tulane (11-4), UCF (10-6), Temple (8-7), Tulsa (8-6), Houston (7-6), SMU (4-3) Connecticut (3-1), Navy (1-5) and USF (1-7).Year AAC Record Finish Home Road ECU Points OPP Points2014 5-3 T2nd 3-1 2-2 273 2062015 3-5 5th/East 1-3 2-2 204 1882016 1-7 T4th/East 1-3 0-4 207 3222017 2-6 T4th/East 1-3 1-3 215 369totals 11-21 ----- 6-10 5-11 899 (28.1) 1,085 (33.9)Since accepting membership in a conference, the Pirates have produced a 33-52 (.388) regular season non-league record ... ECU claimed its fi rst winning non-conference mark since 1999 (a program-best 5-0 clip) with a 3-1 ledger in 2013 and 2014 before turning in successive 2-2 records in 2015 and 2016, along with a 1-3 result in 2017.
ECU: NORTH CAROLINA’S 10-YEAR FBS WIN LEADERFrom 2007 to 2017, ECU (along with NC State) has compiled the most wins among all FBS football playing institutions in the state of North Carolina ... Additionally, the Pirates have won six-straight games vs. in-state opponents (which includes a combined 4-0 mark vs. North Carolina and NC State) and are 8-3 this decade ... A closer look: No. School (next scheduled game) Victories 1. ECU ........................................................................................74 NC State (‘19, ‘22) ..............................................................................................74 3. North Carolina (‘18) ........................................................................................*62 Wake Forest ................................................................................................... 62 5. Duke ................................................................................................................ 61*UNC vacated 16 wins; Appalachian State, Charlotte offi cially joined FBS level in 2015 & 2016, respectively
FINAL 2017 NCAA FBS TOP 25 POLLSAssociated Press Top 25 USA Today Coaches Top 25 No. Team No. Team 1. Alabama (57) 1. Alabama (62) 2. Georgia 2. Georgia 3. Oklahoma 3. Oklahoma 4. Clemson 4. Clemson 5. Ohio State 5. Ohio State 6. UCF (4) 6. Wisconsin 7. Wisconsin 7. UCF 8. Penn State 8. Penn State 9. TCU 9. TCU 10. Auburn 10. Southern Cal 11. Notre Dame 11. Notre Dame 12. Southern Cal 12. Auburn 13. Miami (Fla.) 13. Miami (Fla.) 14. Oklahoma State 14. Oklahoma State 15. Michigan State 15. Washington 16. Washington 16. Michigan State 17. Northwestern 17. Northwestern 18. LSU 18. LSU 19. Mississippi State 19. Stanford 20. Stanford 20. Mississippi State 21. USF 21. USF 22. Boise State 22. Boise State 23. NC State 23. NC State 24. Virginia Tech 24. Memphis 25. Memphis 25. Virginia Tech
bold/italics denotes 2017 opponent

2017 ECU Football Final Statistics, Misc...Page 4
A LOOK AT THE RECORD BOOKSINGLE-GAME (ECU), MOST RECEPTION YARDSNo. Player Date Opp. Rec/Yds. 1. Trevon Brown ......................... 11/18/17 ......Cincinnati .............. 9/270 2. Justin Hardy ...................................10/12/13 ........ Tulane ........................ 17/230 3. Davon Grayson ....................... 09/24/17 .....Connecticut ............11/223
SINGLE-GAME (ECU), MOST PASSING YARDSNo. Player Date Opp. Com/Yds. 1. Shane Carden .................................10/12/13 ........ Tulane ........................41/480 2. Blake Kemp ....................................11/19/15 ......... UCF ............................ 35/465 3. Gardner Minshew .................... 11/04/17 ......Houston ...............52/463
SINGLE-SEASON (ECU), MOST RECEPTION YARDSNo. Player Year Yds. Rec. Avg. TD 1. Zay Jones ................................ 2016 .......... 1,746 .........158 ..........11.1 ............. 8 2. Justin Hardy ............................ 2014 ..........1,494 ..........121 ........ 12.3 ............10 3. Justin Hardy .............................2013 ..........1,284 ......... 114 .........11.3 ............. 8 4. Dwayne Harris ....................... 2010 .......... 1,123 ......... 101 .........11.1 ...........10 5. Lance Lewis ............................. 2010 ........... 1,116 ..........89 ........ 12.5 ............14 6. Justin Hardy .............................2012 ...........1,105 .......... 88 ........ 12.6 .............11 7. Zay Jones .................................2015 ......... 1,099 ..........98 .........11.2 ............. 5 8. Trevon Brown ................... 2017 ....... 1,069 ....... 60 ..... 17.8 .......... 7 9. Aundrea Allison ......................2005 ..........1,024 .......... 83 ........ 12.3 ............. 7 10. Cam Worthy ............................ 2014 .......... 1,016 .......... 55 ........ 18.5 ............. 4
CAREER (ECU), MOST RECEPTIONSNo. Player Years Rec. Yds. Avg. TD 1. Zay Jones .................................... 2013-16 ........ 399 .......4,279 ........ 10.7 ........ 23 2. Justin Hardy ................................2011-14 ........ 387 ....... 4,541 ......... 11.7 ........ 35 3. Dwayne Harris .......................... 2007-10 ....... 268 ...... 3,001 ........ 11.2 .......20 4. Jason Nichols ............................. 1994-97 ......... 152 ........ 1,557 ........ 10.2 ..........9 5. Lance Lewis .................................2010-11 .........149 ........ 1,716 ......... 11.5 ........ 22 6. Aundrae Allison ........................2005-06 .........145 ........ 1,732 ......... 11.9 ..........11 7. Terrance Copper .......................2000-03 .........139 ........1,683 ......... 12.1 .......... 3 8. Davon Grayson ....................2013-17 ...... 135 ..... 1,767 .......13.1 ....... 13 9. Mitchell Galloway ...................... 1993-96 ..........131 ........1,754 .........13.4 ..........9 10. Quay Johnson .................... 2014-17 ......130 ......1,218 .......9.4 ........ 7
CAREER (ECU), MOST RECEPTION YARDSNo. Player Years Yds. Rec. Avg. TD 1. Justin Hardy ................................2011-14 ...... 4,541 ..........387 ......... 11.7 ......... 35 2. Zay Jones.................................... 2013-16 ......4,279 ......... 399 .........10.7 ......... 23 3. Dwayne Harris ......................... 2007-10 ..... 3,001 ......... 268 ........ 11.2 ........20 4. Troy Smith .................................1995-98 ......1,982 ...........129 ........ 15.4 ..........11 5. Trevon Brown ..................... 2014-17 ... 1,829 ........ 115 ...... 15.9 ....... 15 6. Davon Grayson ....................2013-17 ... 1,767 ........ 135 .......13.1 ....... 13 7. Mitchell Galloway ...................... 1993-96 ...... 1,754 ........... 131 .........13.4 ..........9 8. Aundrae Allison ........................2005-06 ...... 1,732 ...........145 ......... 11.9 ..........11 9. Jimmy Williams ...................2013-17 ... 1,722 ........ 119 ......14.5 .......14 10. Lance Lewis .................................2010-11 .......1,716 .......... 149 ......... 11.5 ........ 22
CAREER (ECU), MOST TOUCHDOWN RECEPTIONSNo. Player Years Rec. Yds. Avg. TD 1. Justin Hardy ................................2011-14 ........ 387 ....... 4,541 ......... 11.7 ........ 35 2. Zay Jones .................................... 2013-16 ........ 399 .......4,279 ........ 10.7 ........ 23 3. Lance Lewis .................................2010-11 .........149 ........ 1,716 ......... 11.5 ........ 22 4. Larry Shannon ........................... 1994-97 ......... 101 ........ 1,714 .........17.0 .........21 5. Dwayne Harris ........................... 2007-10 ........ 268 ....... 3,001 ......... 11.2 ........20 6. Walter Wilson ............................1986-89 ...........91 ........1,670 ........ 18.4 .........16 7. Trevon Brown ..................... 2014-17 ...... 115 ..... 1,829 ...... 15.9 ....... 15 8. Jimmy Williams ...................2013-17 ...... 119 ..... 1,722 ......14.5 .......14 9. Davon Grayson ....................2013-17 ...... 135 ..... 1,767 .......13.1 ....... 13 Bryce Williams............................ 2012-15 ..........96 ....... 1,045 ........ 10.9 ......... 13
CAREER (ECU), MOST PASSING YARDSNo. Player Years Att. Com. TD Yds. 1. Shane Carden ..............................2011-14 ...... 1,579 ........1,052 ...........86 ... 11,991 2. David Garrard ............................ 1998-01 .......1,169 ..........666 .......... 60 ...9,029 3. James Pinkney .........................2003-06 .......1,189 ..........687 .......... 46 .... 8,173 4. Marcus Crandell ......................... 1993-96 ....... 1,133 ..........620 ...........58 .... 7,198 5. Dominique Davis .........................2010-11 .......1,103 .......... 727 ...........62 .... 7,192 6. Patrick Pinkney ........................2005-09 ......1,003 ..........603 ...........39 ...6,980 7. Jeff Blake ....................................1988-91 ........ 667 ..........360 ...........43 .... 5,133 8. Travis Hunter .............................1986-89 ........ 587 ..........280 ...........32 ... 3,928 9. Dan Gonzales ............................. 1994-97 .........610 ..........346 ...........23 ... 3,868 10. Gardner Minshew .................2016-17 ..... 506 ....... 293 ........ 24 .. 3,487
THE SCOTTIE MONTGOMERY RECORD AT ECUOverall: .............................................................................................6-18 Home: .........................................................5-8 Away: ......................................................... 1-10 Neutral: ..................................................... 0-0August: ............................................................................................. 0-0 August Home:........................................... 0-0 August Away: ........................................... 0-0September: .........................................................................................3-6 September Home: ..................................... 2-3 September Away: .......................................1-3October: ............................................................................................. 2-5 October Home: .......................................... 2-2 October Away: ...........................................0-3November: ...........................................................................................1-7 November Home: .......................................1-3 November Away: ...................................... 0-4December: ......................................................................................... 0-0 December Home: ..................................... 0-0 December Away: ...................................... 0-0January: ............................................................................................ 0-0Scoring fi rst: ..................................................................................................................5-9Margin 10 points or less: .............................................................................................. 2-2Margin 7 points or less: ................................................................................................ 2-2Margin 3 points or less: ................................................................................................2-0Score 20+ points: ........................................................................................................ 6-10Score 30+ points: ..........................................................................................................6-3Score 40+ points: ......................................................................................................... 4-0Score 50+ points: .......................................................................................................... 1-0Allow 10 or less points: ................................................................................................2-0Allow 20 or less points: .................................................................................................4-1Following a loss: ..........................................................................................................5-13Following a win:............................................................................................................ 1-5Leading after 1st quarter: ............................................................................................ 5-3Trailing after 1st quarter: ........................................................................................... 0-12Tied after 1st quarter: ....................................................................................................1-3Leading after 2nd quarter:.......................................................................................... 4-0Trailing after 2nd quarter: .......................................................................................... 1-18Tied after 2nd quarter: ................................................................................................. 1-0Leading after 3rd quarter: .......................................................................................... 6-0Trailing after 3rd quarter: .......................................................................................... 0-18Tied after 3rd quarter: ................................................................................................. 0-0In overtime: ................................................................................................................... 0-1With 100-yard rusher: ...................................................................................................1-3With 300-yard passer: .................................................................................................3-6With 100-yard receiver: ..............................................................................................5-14Committing 0 turnovers: ..............................................................................................3-1Committing 1 turnover: ................................................................................................ 2-7Committing 2 turnovers: ...............................................................................................1-2Committing 3 turnovers: ............................................................................................. 0-4Committing 4 turnovers: .............................................................................................0-2Committing 5+ turnovers:............................................................................................0-2Forcing 0 turnovers: .................................................................................................... 0-11Forcing 1 turnover: ........................................................................................................5-4Forcing 2 turnovers: ......................................................................................................0-2Forcing 3 turnovers: ....................................................................................................... 1-1Forcing 4 turnovers: .................................................................................................... 0-0Forcing 5+ turnovers: .................................................................................................. 0-0Score defensive TD: ...................................................................................................... 0-0Score special teams TD: ............................................................................................... 0-0

2017 ECU Football Final Statistics, Misc...Page 5
ECU OFFENSIVE SCORING DRIVESJAMES MADISON Quarter Plays Yards TOP ResultPinnix 6-yd run ............................................. 3rd .............. 2 ............ 25 ......0:46 ............ TDD. Scott 1-yd run ............................................4th .............10 ............ 72 ........2:11 ............ TDWEST VIRGINIA Quarter Plays Yards TOP ResultVerity 23-yd fi eld goal ................................... 1st ............. 15 ............70 ......6:30 ............ FGVerity 45-yd fi eld goal .................................. 3rd .............. 9 ............45 ......2:44 ............ FGJ. Williams 19-yd pass from Sirk .................. 3rd .............. 7 ............ 79 ...... 2:52 ............ TDT. Brown 95-yd pass from Minshew ............4th .............. 2 ............98 ......0:42 ............ TDVIRGINIA TECH Quarter Plays Yards TOP ResultGrayson 9-yd pass from Minshew ................ 1st .............. 7 ............ 75 ...... 2:07 ............ TDT. Brown 76-yd pass from Minshew ............. 1st .............. 2 ............ 75 ......0:49 ............ TDVerity 35-yd fi eld goal ................................... 1st .............10 ............ 63 ......3:46 ............ FGCONNECTICUT Quarter Plays Yards TOP ResultGrayson 17-yd pass from Sirk ........................ 1st .............. 9 ............65 ......3:50 ............ TDGrayson 24-yd pass from Sirk ....................... 1st .............. 8 ............ 75 ...... 3:02 ............ TDD. Scott 6-yd run ............................................ 1st .............. 5 ............ 36 .......1:58 ............ TDVerity 46-yd fi eld goal ................................ 2nd ............. 13 ............ 47 ......4:08 ............ FGVerity 26-yd fi eld goal ................................. 2nd ............. 12 ............ 63 ...... 5:34 ............ FGGrayson 75-yd pass from Sirk ...................... 3rd ............... 1 ............ 75 ...... 0:10 ............ TDHowe 14-yd run ............................................. 3rd .............. 4 ............ 75 .......1:20 ............ TDUSF Quarter Plays Yards TOP ResultVerity 28-yd fi eld goal ................................... 1st .............. 7 ............ 47 ......2:20 ............ FGGrayson 31-yd pass from Sirk ........................ 1st .............. 8 ............ 75 ...... 3:57 ............ TDSirk 13-yd run ............................................... 2nd .............. 9 ............ 75 ...... 2:24 ............ TDBaggett 2-yd pass from Sirk ....................... 2nd ............. 12 ............60 .......5:01 ............ TDSirk 1-yd run .................................................. 3rd ............. 12 ............ 73 .......5:17 ............ TDTEMPLE Quarter Plays Yards TOP ResultVerity 25-yd fi eld goal ................................... 1st .............. 9 ............ 57 ...... 3:39 ............ FGQ. Johnson 11-yd pass from Sirk .................. 3rd ..............11 ............ 75 .......4:13 ............ TDUCF Quarter Plays Yards TOP ResultFarrier 5-yd pass from Sirk ........................... 1st .............. 4 ............ 75 .......1:45 ............ TDGrayson 4-yd pass from Sirk ....................... 2nd ............. 12 ............ 75 ......5:44 ............ TDDeans 17-yd pass from Minshew .................4th .............. 7 ............ 75 .......2:17 ............ TDBYU Quarter Plays Yards TOP ResultSirk 1-yd run ................................................... 1st .............10 ............ 72 ...... 3:43 ............ TDVerity 42-yd fi eld goal ................................. 2nd .............14 ............ 73 ......4:59 ............ FGVerity 42-yd fi eld goal .................................. 3rd .............. 6 ............50 .......1:59 ............ FGVerity 32-yd fi eld goal .................................. 3rd .............10 ............50 .......4:16 ............ FGVerity 33-yd fi eld goal .................................. 3rd .............. 7 ............60 .......1:58 ............ FGT. Brown 26-yd pass from Minshew ............4th .............. 3 ............ 67 .......1:05 ............ TDQ. Johnson 9-yd pass from Minshew ..........4th .............. 2 .............12 .......0:51 ............ TDHOUSTON Quarter Plays Yards TOP ResultVerity 22-yd fi eld goal ................................. 2nd .............16 ............70 ......7:40 ............ FGT. Brown 34-yd pass from Minshew ........... 2nd .............. 6 ............ 76 .......1:55 ............ TDT. Brown 9-yd pass from Minshew .............. 3rd .............14 ............ 75 ...... 5:57 ............ TDVerity 52-yd fi eld goal ..................................4th ..............11 ............ 25 ......4:56 ............ FGQ. Johnson 18-yd pass from Minshew .........4th ..............11 ............ 76 ....... 3:17 ............ TDTULANE Quarter Plays Yards TOP ResultPinnix 2-yd run .............................................. 1st ............. 12 ............ 75 ...... 4:33 ............ TDHowe 25-yd run ........................................... 2nd .............. 8 ............ 75 ...... 2:36 ............ TDVerity 29-yd fi eld goal ..................................4th .............. 4 .............. 3 ....... 1:10 ............ FGFarrier 9-yd pass from Minshew..................4th .............14 ............89 ......2:06 ............ TDCINCINNATI Quarter Plays Yards TOP ResultDeans 23-yd pass from Minshew.................. 1st .............. 6 ............65 ......2:30 ............ TDHowe 3-yd run ............................................... 1st .............. 9 ............ 76 .......4:15 ............ TDJ. Williams 11-yd pass from Minshew ......... 2nd ............. 13 ............ 85 .......5:13 ............ TDVerity 46-yd fi eld goal ................................ 2nd .............10 ............46 .......1:05 ............ FGT. Brown 95-yd pass from Minshew ........... 3rd ............... 1 ............95 .......0:15 ............ TDFarrier 22-yd pass from Minshew ................ 3rd .............. 5 ............ 85 .......2:18 ............ TDVerity 50-yd fi eld goal .................................4th ..............11 ............42 ......5:29 ............ FGT. Brown 20-yd pass from Herring .............4th .............. 3 .............16 ....... 1:19 ............ TD
MEMPHIS Quarter Plays Yards TOP ResultJ. Williams 33-yd pass from Minshew ......... 3rd .............. 9 ............66 .......4:17 ............ TDBaggett 5-yd pass from Minshew ............... 3rd .............. 8 ............50 ...... 3:52 ............ TD
OPPONENT OFFENSIVE SCORING DRIVESJAMES MADISON Quarter Plays Yards TOP ResultSchor 4-yd run ............................................... 1st .............. 9 ............ 82 ....... 3:31 ............ TDC. Johnson 85-yd run .................................... 3rd ............... 1 ............ 85 ...... 0:19 ............ TDCarlton 17-yd pass from Schor ..................... 3rd .............10 ............64 ......4:48 ............ TDC. Johnson 80-yd run ...................................4th ............... 1 ............80 .......0:12 ............ TDMarshall 70-yd run ........................................4th .............. 3 .............81 .......1:56 ............ TDWEST VIRGINIA Quarter Plays Yards TOP ResultCrawford 5-yd run.......................................... 1st .............. 9 ............ 75 .......2:16 ............ TDK. White 7-yd pass from Grier ....................... 1st .............. 8 .............71 .......2:13 ............ TD
McKoy 13-yd run ............................................. 1st .............. 3 ............ 53 ......0:45 ............ TDSimms 52-yd pass from Grier ..................... 2nd .............. 6 .............81 .......1:59 ............ TDSills 9-yd pass from Grier ............................ 2nd .............. 3 .............31 ......0:50 ............ TDCrawford 41-yd run ...................................... 2nd .............. 4 ............ 63 .......0:51 ............ TDSills 75-yd pass from Grier .......................... 2nd .............. 2 ............86 ......0:24 ............ TDSills 4-yd pass from Grier ............................. 3rd .............. 6 ............44 .......1:48 ............ TDVIRGINIA TECH Quarter Plays Yards TOP ResultPeoples 1-yd run ............................................ 1st ............. 12 ............84 ......4:09 ............ TDPhillips 10-yd pass from J. Jackson ............ 2nd ............. 13 ............ 79 ...... 4:23 ............ TDSlye 25-yd fi eld goal .................................... 2nd ..............11 ............56 ...... 3:25 ............ FGSlye 34-yd fi eld goal .................................... 2nd ............. 13 ............62 ......5:40 ............ FGSlye 37-yd fi eld goal .................................... 2nd .............. 4 ..............8 .......1:03 ............ FGPhillips 31-yd pass from J. Jackson .............. 3rd .............. 6 ............ 75 ...... 2:07 ............ TDMcMillian 70-yd pass from J. Jackson ......... 3rd ............... 1 ............70 ...... 0:10 ............ TDPhillips 45-yd pass from J. Jackson ............. 3rd .............. 6 ............70 .......2:13 ............ TDSavoy 9-yd pass from J. Jackson ................. 3rd .............. 4 ............ 32 ....... 1:37 ............ TDHolston 1-yd run ............................................ 3rd .............. 7 ............62 ......3:49 ............ TDFox 5-yd run ..................................................4th .............. 2 ............ 34 .......0:51 ............ TDCONNECTICUT Quarter Plays Yards TOP ResultDonaldson 45-yd pass from Shirreff s .......... 1st .............. 5 ............ 75 .......1:22 ............ TDHopkins 1-yd run .......................................... 2nd .............14 ............ 75 ...... 3:59 ............ TDDonaldson 12-yd pass from Shirreff s .......... 3rd .............10 ............ 75 ......2:30 ............ TDNewsome 8-yd run ....................................... 3rd .............. 7 ............ 75 ......2:06 ............ TDTarbutt 20-yd fi eld goal ............................... 3rd ............. 12 ............ 77 ......3:49 ............ FGNewsome 79-yd pass from Shirreff s ...........4th .............. 2 ............ 79 ...... 0:19 ............ TDUSF Quarter Plays Yards TOP ResultD. Johnson 1-yd run ....................................... 1st .............. 9 ............ 39 ...... 2:23 ............ TDFlowers 16-yd run .......................................... 1st .............. 2 ............60 ......0:38 ............ TDNadelman 37-yd fi eld goal .......................... 2nd .............. 8 .............51 ......3:06 ............ FGScantling 75-yd run ..................................... 2nd ............... 1 ............ 75 .......0:12 ............ TDMcCants 14-yd pass from Flowers ................ 3rd .............. 8 ............ 75 .......3:12 ............ TDScantling 4-yd pass from Flowers ............... 3rd ..............11 ............ 75 ......4:40 ............ TDNadelman 28-yd fi eld goal .......................... 3rd .............. 4 .............. 7 ....... 1:23 ............ FGTice 1-yd run ..................................................4th .............. 7 ............ 33 .......1:26 ............ TDD. Johnson 10-yd run ....................................4th .............. 6 ............80 ......2:50 ............ TDTEMPLE Quarter Plays Yards TOP ResultBoumerhi 29-yd fi eld goal .......................... 2nd .............. 7 ............ 55 .......1:59 ............ FGJennings 5-yd pass from Marchi ................. 2nd .............. 8 .............91 ......4:45 ............ TDHood 2-yd run .............................................. 2nd .............. 5 ............ 34 ...... 1:08 ............ TDRitrovato 2-yd run........................................ 2nd .............. 5 ............ 53 ...... 2:33 ............ TDWright 32-yd pass from Marchi ................... 3rd .............. 7 ............80 ......2:56 ............ TDBoumerhi 39-yd fi eld goal ...........................4th .............. 4 ..............8 ...... 1:04 ............ FGUCF Quarter Plays Yards TOP ResultAkins 48-yd pass from Milton ....................... 1st .............. 4 ............ 75 ....... 1:16 ............ TDPittman 4-yd pass from Milton ..................... 1st ............. 12 ............80 ......5:02 ............ TDKillins 3-yd run ............................................... 1st .............. 6 ............69 ...... 1:46 ............ TDMilton 1-yd run ............................................. 2nd .............. 7 ............96 .......2:21 ............ TDMcGowan 4-yd run ...................................... 2nd .............. 6 ............ 75 ....... 1:01 ............ TDVedral 13-yd run ............................................4th .............. 8 ............66 ...... 2:43 ............ TDMcCrae 18-yd run ...........................................4th .............10 ............ 75 ...... 5:22 ............ TDBYU Quarter Plays Yards TOP ResultSimon 12-yd pass from Mangum .................. 1st .............. 5 ............ 28 ...... 2:36 ............ TDAlmond 22-yd fi eld goal ............................. 2nd .............. 9 ............70 .......4:14 ............ FGBushman 12-yd pass from Mangum............4th .............. 8 ............ 73 ...... 2:37 ............ TDHOUSTON Quarter Plays Yards TOP ResultKing 2-yd run ................................................. 1st ..............11 ............ 75 .......4:12 ............ TDCatalon 22-yd run .......................................... 1st ............... 1 ............ 22 ......0:07 ............ TDLark 5-yd pass from King .............................. 1st .............. 8 .............81 ...... 3:38 ............ TDCar 1-yd run .................................................. 2nd .............. 4 ............ 75 ....... 1:21 ............ TDDunbar 75-yd pass from King ...................... 3rd ............... 1 ............ 75 ....... 0:11 ............ TDBonner 62-yd pass from King ...................... 3rd .............. 2 ............65 ......0:42 ............ TDNovikoff 44-yd fi eld goal ............................. 3rd .............. 9 ............ 53 ...... 2:53 ............ FGTULANE Quarter Plays Yards TOP ResultBanks 2-yd run ............................................... 1st .............14 ............ 75 .......7:18 ............ TDHilliard 60-yd run ........................................ 2nd ............... 1 ............60 .......0:12 ............ TDGlover 26-yd fi eld goal ................................ 2nd ............. 13 ............ 67 ...... 5:43 ............ FGHilliard 26-yd run .......................................... 3rd .............10 ............66 ......4:40 ............ TDBanks 16-yd run ............................................. OT .............. 4 ............ 25 ..... 0:00 ............ TDCINCINNATI Quarter Plays Yards TOP ResultLewis 75-yd pass from Moore ..................... 2nd ............... 1 ............ 75 ....... 0:11 ............ TDSavage 10-yd pass from Moore .................. 2nd ..............11 ............80 .......3:21 ............ TDRollins 6-yd pass from Moore ...................... 3rd .............10 ............ 72 .......5:17 ............ TDMEMPHIS Quarter Plays Yards TOP ResultA. Miller 89-yd pass from Ferguson ............. 1st ............... 1 ............89 .......0:15 ............ TDD. Henderson 4-yd run .................................. 1st .............10 ............ 73 ........3:11 ............ TDMayhue 46-pass from Ferguson ................... 1st .............. 5 ............66 .......1:25 ............ TDDorceus 19-yd run ........................................ 2nd .............. 6 ............ 82 ......2:04 ............ TDP. Taylor 41-yd run ........................................ 2nd .............. 5 ............64 .......1:55 ............ TDD. Henderson 14-yd run ............................... 2nd .............. 5 ............ 93 ....... 1:37 ............ TDCoxie 61-pass from Ferguson ....................... 3rd .............. 6 ............ 75 ...... 3:25 ............ TDP. Taylor 60-yd run ........................................4th .............. 4 ............ 75 .......2:12 ............ TD
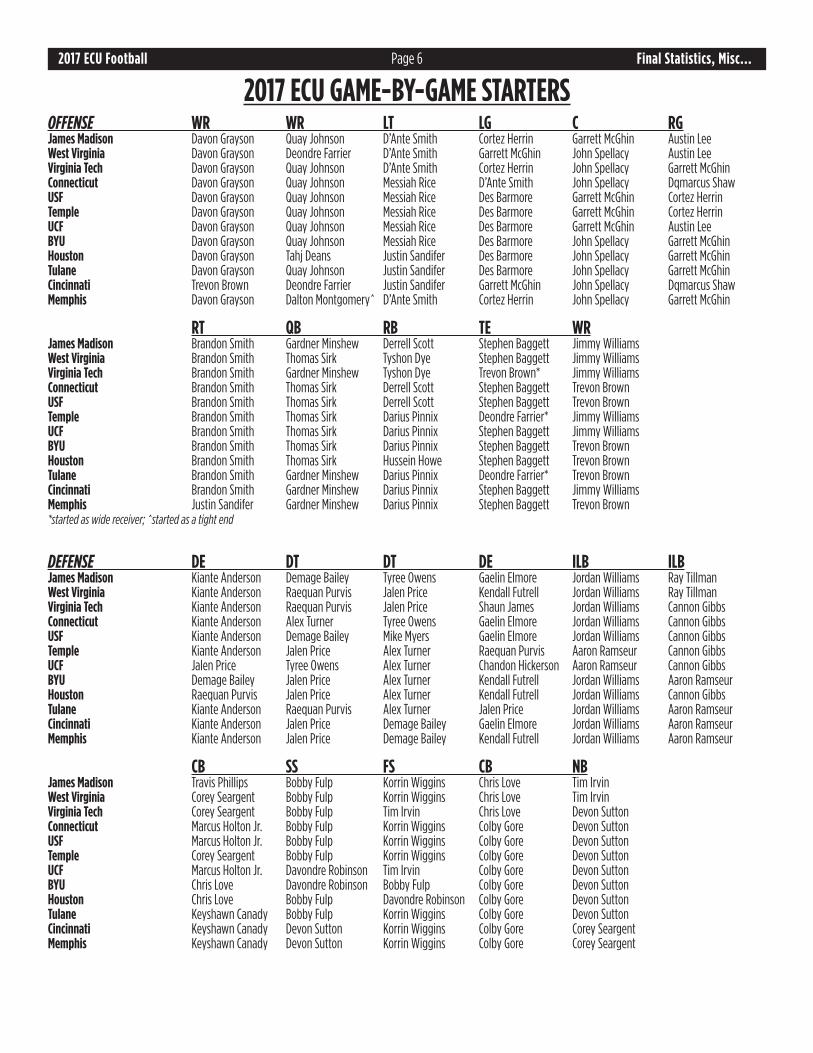
2017 ECU Football Final Statistics, Misc...Page 6
2017 ECU GAME-BY-GAME STARTERSOFFENSE WR WR LT LG C RGJames Madison Davon Grayson Quay Johnson D’Ante Smith Cortez Herrin Garrett McGhin Austin LeeWest Virginia Davon Grayson Deondre Farrier D’Ante Smith Garrett McGhin John Spellacy Austin LeeVirginia Tech Davon Grayson Quay Johnson D’Ante Smith Cortez Herrin John Spellacy Garrett McGhinConnecticut Davon Grayson Quay Johnson Messiah Rice D’Ante Smith John Spellacy Dqmarcus ShawUSF Davon Grayson Quay Johnson Messiah Rice Des Barmore Garrett McGhin Cortez HerrinTemple Davon Grayson Quay Johnson Messiah Rice Des Barmore Garrett McGhin Cortez HerrinUCF Davon Grayson Quay Johnson Messiah Rice Des Barmore Garrett McGhin Austin LeeBYU Davon Grayson Quay Johnson Messiah Rice Des Barmore John Spellacy Garrett McGhinHouston Davon Grayson Tahj Deans Justin Sandifer Des Barmore John Spellacy Garrett McGhinTulane Davon Grayson Quay Johnson Justin Sandifer Des Barmore John Spellacy Garrett McGhinCincinnati Trevon Brown Deondre Farrier Justin Sandifer Garrett McGhin John Spellacy Dqmarcus ShawMemphis Davon Grayson Dalton Montgomery^ D’Ante Smith Cortez Herrin John Spellacy Garrett McGhin
RT QB RB TE WRJames Madison Brandon Smith Gardner Minshew Derrell Scott Stephen Baggett Jimmy WilliamsWest Virginia Brandon Smith Thomas Sirk Tyshon Dye Stephen Baggett Jimmy WilliamsVirginia Tech Brandon Smith Gardner Minshew Tyshon Dye Trevon Brown* Jimmy WilliamsConnecticut Brandon Smith Thomas Sirk Derrell Scott Stephen Baggett Trevon BrownUSF Brandon Smith Thomas Sirk Derrell Scott Stephen Baggett Trevon BrownTemple Brandon Smith Thomas Sirk Darius Pinnix Deondre Farrier* Jimmy WilliamsUCF Brandon Smith Thomas Sirk Darius Pinnix Stephen Baggett Jimmy WilliamsBYU Brandon Smith Thomas Sirk Darius Pinnix Stephen Baggett Trevon BrownHouston Brandon Smith Thomas Sirk Hussein Howe Stephen Baggett Trevon BrownTulane Brandon Smith Gardner Minshew Darius Pinnix Deondre Farrier* Trevon BrownCincinnati Brandon Smith Gardner Minshew Darius Pinnix Stephen Baggett Jimmy WilliamsMemphis Justin Sandifer Gardner Minshew Darius Pinnix Stephen Baggett Trevon Brown*started as wide receiver; ^started as a tight end
DEFENSE DE DT DT DE ILB ILBJames Madison Kiante Anderson Demage Bailey Tyree Owens Gaelin Elmore Jordan Williams Ray TillmanWest Virginia Kiante Anderson Raequan Purvis Jalen Price Kendall Futrell Jordan Williams Ray TillmanVirginia Tech Kiante Anderson Raequan Purvis Jalen Price Shaun James Jordan Williams Cannon GibbsConnecticut Kiante Anderson Alex Turner Tyree Owens Gaelin Elmore Jordan Williams Cannon GibbsUSF Kiante Anderson Demage Bailey Mike Myers Gaelin Elmore Jordan Williams Cannon GibbsTemple Kiante Anderson Jalen Price Alex Turner Raequan Purvis Aaron Ramseur Cannon GibbsUCF Jalen Price Tyree Owens Alex Turner Chandon Hickerson Aaron Ramseur Cannon GibbsBYU Demage Bailey Jalen Price Alex Turner Kendall Futrell Jordan Williams Aaron RamseurHouston Raequan Purvis Jalen Price Alex Turner Kendall Futrell Jordan Williams Cannon GibbsTulane Kiante Anderson Raequan Purvis Alex Turner Jalen Price Jordan Williams Aaron RamseurCincinnati Kiante Anderson Jalen Price Demage Bailey Gaelin Elmore Jordan Williams Aaron RamseurMemphis Kiante Anderson Jalen Price Demage Bailey Kendall Futrell Jordan Williams Aaron Ramseur
CB SS FS CB NBJames Madison Travis Phillips Bobby Fulp Korrin Wiggins Chris Love Tim IrvinWest Virginia Corey Seargent Bobby Fulp Korrin Wiggins Chris Love Tim IrvinVirginia Tech Corey Seargent Bobby Fulp Tim Irvin Chris Love Devon SuttonConnecticut Marcus Holton Jr. Bobby Fulp Korrin Wiggins Colby Gore Devon SuttonUSF Marcus Holton Jr. Bobby Fulp Korrin Wiggins Colby Gore Devon SuttonTemple Corey Seargent Bobby Fulp Korrin Wiggins Colby Gore Devon SuttonUCF Marcus Holton Jr. Davondre Robinson Tim Irvin Colby Gore Devon SuttonBYU Chris Love Davondre Robinson Bobby Fulp Colby Gore Devon SuttonHouston Chris Love Bobby Fulp Davondre Robinson Colby Gore Devon SuttonTulane Keyshawn Canady Bobby Fulp Korrin Wiggins Colby Gore Devon SuttonCincinnati Keyshawn Canady Devon Sutton Korrin Wiggins Colby Gore Corey SeargentMemphis Keyshawn Canady Devon Sutton Korrin Wiggins Colby Gore Corey Seargent
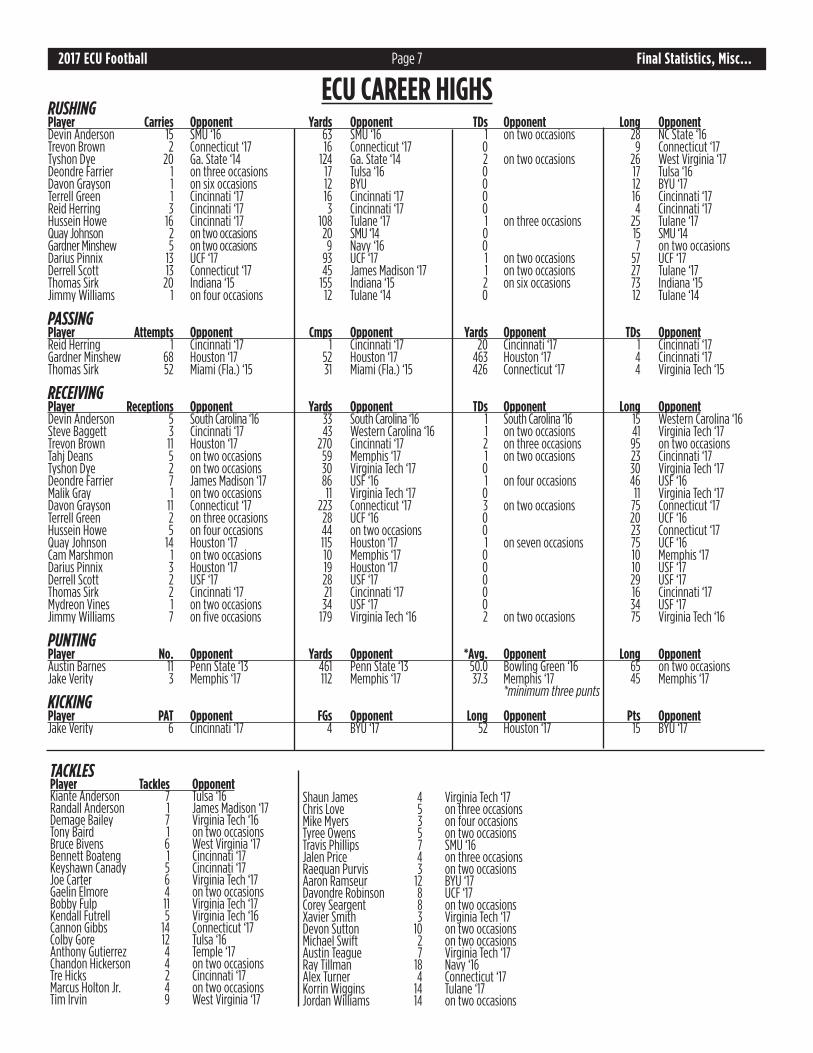
2017 ECU Football Final Statistics, Misc...Page 7
TACKLESPlayer Tackles OpponentKiante Anderson 7 Tulsa ‘16Randall Anderson 1 James Madison ‘17Demage Bailey 7 Virginia Tech ‘16Tony Baird 1 on two occasionsBruce Bivens 6 West Virginia ‘17Bennett Boateng 1 Cincinnati ‘17Keyshawn Canady 5 Cincinnati ‘17Joe Carter 6 Virginia Tech ‘17Gaelin Elmore 4 on two occasionsBobby Fulp 11 Virginia Tech ‘17Kendall Futrell 5 Virginia Tech ‘16Cannon Gibbs 14 Connecticut ‘17Colby Gore 12 Tulsa ‘16Anthony Gutierrez 4 Temple ‘17Chandon Hickerson 4 on two occasionsTre Hicks 2 Cincinnati ‘17Marcus Holton Jr. 4 on two occasionsTim Irvin 9 West Virginia ‘17
Shaun James 4 Virginia Tech ‘17Chris Love 5 on three occasionsMike Myers 3 on four occasionsTyree Owens 5 on two occasionsTravis Phillips 7 SMU ‘16Jalen Price 4 on three occasionsRaequan Purvis 3 on two occasionsAaron Ramseur 12 BYU ‘17Davondre Robinson 8 UCF ‘17Corey Seargent 8 on two occasionsXavier Smith 3 Virginia Tech ‘17Devon Sutton 10 on two occasionsMichael Swift 2 on two occasionsAustin Teague 7 Virginia Tech ‘17Ray Tillman 18 Navy ‘16Alex Turner 4 Connecticut ‘17Korrin Wiggins 14 Tulane ‘17Jordan Williams 14 on two occasions
ECU CAREER HIGHSRUSHINGPlayer Carries Opponent Yards Opponent TDs Opponent Long OpponentDevin Anderson 15 SMU ‘16 63 SMU ‘16 1 on two occasions 28 NC State ‘16Trevon Brown 2 Connecticut ‘17 16 Connecticut ‘17 0 9 Connecticut ‘17Tyshon Dye 20 Ga. State ‘14 124 Ga. State ‘14 2 on two occasions 26 West Virginia ‘17Deondre Farrier 1 on three occasions 17 Tulsa ‘16 0 17 Tulsa ‘16Davon Grayson 1 on six occasions 12 BYU 0 12 BYU ‘17Terrell Green 1 Cincinnati ‘17 16 Cincinnati ‘17 0 16 Cincinnati ‘17Reid Herring 3 Cincinnati ‘17 3 Cincinnati ‘17 0 4 Cincinnati ‘17Hussein Howe 16 Cincinnati ‘17 108 Tulane ‘17 1 on three occasions 25 Tulane ‘17Quay Johnson 2 on two occasions 20 SMU ‘14 0 15 SMU ‘14Gardner Minshew 5 on two occasions 9 Navy ‘16 0 7 on two occasionsDarius Pinnix 13 UCF ‘17 93 UCF ‘17 1 on two occasions 57 UCF ‘17Derrell Scott 13 Connecticut ‘17 45 James Madison ‘17 1 on two occasions 27 Tulane ‘17Thomas Sirk 20 Indiana ‘15 155 Indiana ‘15 2 on six occasions 73 Indiana ‘15Jimmy Williams 1 on four occasions 12 Tulane ‘14 0 12 Tulane ‘14
PASSINGPlayer Attempts Opponent Cmps Opponent Yards Opponent TDs OpponentReid Herring 1 Cincinnati ‘17 1 Cincinnati ‘17 20 Cincinnati ‘17 1 Cincinnati ‘17Gardner Minshew 68 Houston ‘17 52 Houston ‘17 463 Houston ‘17 4 Cincinnati ‘17Thomas Sirk 52 Miami (Fla.) ‘15 31 Miami (Fla.) ‘15 426 Connecticut ‘17 4 Virginia Tech ‘15 RECEIVINGPlayer Receptions Opponent Yards Opponent TDs Opponent Long OpponentDevin Anderson 5 South Carolina ‘16 33 South Carolina ‘16 1 South Carolina ‘16 15 Western Carolina ‘16Steve Baggett 3 Cincinnati ‘17 43 Western Carolina ‘16 1 on two occasions 41 Virginia Tech ‘17Trevon Brown 11 Houston ‘17 270 Cincinnati ‘17 2 on three occasions 95 on two occasionsTahj Deans 5 on two occasions 59 Memphis ‘17 1 on two occasions 23 Cincinnati ‘17Tyshon Dye 2 on two occasions 30 Virginia Tech ‘17 0 30 Virginia Tech ‘17Deondre Farrier 7 James Madison ‘17 86 USF ‘16 1 on four occasions 46 USF ‘16Malik Gray 1 on two occasions 11 Virginia Tech ‘17 0 11 Virginia Tech ‘17Davon Grayson 11 Connecticut ‘17 223 Connecticut ‘17 3 on two occasions 75 Connecticut ‘17Terrell Green 2 on three occasions 28 UCF ‘16 0 20 UCF ‘16Hussein Howe 5 on four occasions 44 on two occasions 0 23 Connecticut ‘17Quay Johnson 14 Houston ‘17 115 Houston ‘17 1 on seven occasions 75 UCF ‘16Cam Marshmon 1 on two occasions 10 Memphis ‘17 0 10 Memphis ‘17Darius Pinnix 3 Houston ‘17 19 Houston ‘17 0 10 USF ‘17Derrell Scott 2 USF ‘17 28 USF ‘17 0 29 USF ‘17Thomas Sirk 2 Cincinnati ‘17 21 Cincinnati ‘17 0 16 Cincinnati ‘17Mydreon Vines 1 on two occasions 34 USF ‘17 0 34 USF ‘17Jimmy Williams 7 on fi ve occasions 179 Virginia Tech ‘16 2 on two occasions 75 Virginia Tech ‘16
PUNTINGPlayer No. Opponent Yards Opponent *Avg. Opponent Long OpponentAustin Barnes 11 Penn State ‘13 461 Penn State ‘13 50.0 Bowling Green ‘16 65 on two occasionsJake Verity 3 Memphis ‘17 112 Memphis ‘17 37.3 Memphis ‘17 45 Memphis ‘17 *minimum three puntsKICKINGPlayer PAT Opponent FGs Opponent Long Opponent Pts OpponentJake Verity 6 Cincinnati ‘17 4 BYU ‘17 52 Houston ‘17 15 BYU ‘17

2017 ECU Football Final Statistics, Misc...Page 8
GAME 1James Madison ................................. 34ECU ..................................................14
September 2, 2017 Dowdy-Ficklen Stadium, Greenville, N.C.
Greenville, N.C. – Defending FCS national champion James Madison used a dominant rushing attack to push its win streak to 13 straight and record a season-opening 34-14 victory over ECU at Dowdy-Ficklen Stadium ... For the Pirates, the loss snapped a run of 25 consecutive triumphs over FCS opponents dating back to 1980 ... The Dukes racked up 410 ground yards against ECU, the 11th-highest total allowed by the Pirates in program history ... Senior Cardon Johnson picked up 265 yards on 17 carries - and average of 15.6 per attempt - and reached paydirt on separate jaunts of 85 and 80 yards in the third and fourth quarters, respectively ... On the fl ipside, the Pirates’ off ense was stymied by a stingy Dukes defense that surrendered only 70 rushing yards (2.3 ypr) and forced four turnovers - three coming on interceptions ... After Johnson’s fi rst long gainer on the fi rst snap of the second half gave JMU a 14-0 cushion, ECU used a Bobby Fulp interception at the Dukes’ 25-yard line to set up Darius Pinnix’s six-yard scoring rush to help the Pirates pull within seven with 10:11 to play in the third period ... ECU advanced deep into James Madison territory on its next three possessions, reaching the 36, 20 and four-yard lines before getting halted on a fumble and pair of fourth-down stops ... JMU’s off ense added more separation with a 17-yard scoring toss from Bryan Schor to Nick Carlton to close the third stanza before Johnson ripped off his 80-yarder and Marcus Marshall followed with a 70-yard TD sprint late in the fourth period ... The Dukes tallied an impressive 453 yards (of 614) on 34 fi rst-down snaps during the contest - an average of 13.3 per play ... Thomas Sirk came off the bench to complete 21-of-35 passes for 210 yards to lead ECU off ensively.
JAMES MADISON ............................... 7 0 14 13 – 34ECU ................................................ 0 0 7 7 – 14
SCORING SUMMARYJMU–Bryan Schor 4 run (Tyler Gray kick), 5:11, 1stJMU–Cardon Johnson 85 run (Gray kick), 14:41, 3rdECU–Darius Pinnix 6 run (Jake Verity kick), 10:11, 3rdJMU–Nick Carlton 17 pass from Schor (Gray kick), 0:06, 3rdJMU–Johnson 80 run (Gray kick failed), 11:36, 4thJMU–Marcus Marshall 70 run (Ethan Ratke kick), 2:34, 4thECU–Derrell Scott 1 run (Verity kick), 0:23, 4thAttendance: 40,169; Weather: overcast, 79 degreesESPN3: Greg Mescall (play-by-play), Rene Ingoglia (analyst)
STATISTICS JMU ECUFirst Downs .........................................................................23 28Rushing Attempts ............................................................. 42 30Rushing Yards ................................................. 410 70Completions-Attempts-Int. ...................................... 17-24-1 28-53-3Passing Yards .................................................. 204 292TOTAL OFFENSE ..................................................614 362Punts-Average ........................................................... 4-43.0 4-49.2Fumbles-Lost.....................................................................2-1 1-1Penalties-Yards ........................................................... 14-172 8-61Sacks By-Yards ................................................................. 1-6 1-93rd Down Conversions .................................................... 5-11 6-164th Down Conversions ..................................................... 0-1 2-5Time of Possession .......................................................29:57 30:03
RUSHING: JMU–C. Johnson 17-265, 2 TD; M. Marshall 10-88, 1 TD; B. Schor 10-48, 1 TD; T. Sharp 4-11. ECU–D. Scott 12-45, 1 TD; D. Pinnix 3-7, 1 TD; T. Sirk 4-7; H. Howe 4-7; D. Grayson 1-4; G. Minshew 3-3; J. Williams 1-2. PASSING: JMU–B. Schor 17-24-1, 204, 1 TD. ECU–T. Sirk 21-35-2, 210; G. Minshew 7-18-1, 82. RECEIVING: JMU–J. Miller 5-43; D. Eldridge 3-51; I. Hyman 3-49; N. Carlton 3-38, 1 TD; C. Johnson 2-12; T. Woods 1-11. ECU–D. Grayson 7-86; D. Farrier 7-68; T. Brown 4-43; J. Williams 3-41; Q. Johnson 3-28; T. Deans 2-18; S. Baggett 1-5; D. Scott 1-3.
GAME 2ECU ................................................. 20West Virginia .................................... 56
September 9, 2017 Milan Puskar Stadium, Morgantown, W.Va.
Morgantown, W.Va. – Mountaineer quarterback Will Grier’s precision passing attack staked West Virginia to a commanding halftime lead before coasting to a 56-20 win over ECU at Milan Puskar Stadium ... In all, Grier completed 19-of-25 passes for 352 yards and fi ve touchdowns - three to David Sills - to send the Pirates to their seventh-straight road loss ... The Mountaineers scored on seven of their fi rst eight possessions, including the fi rst fi ve, to build a 49-3 intermission cushion ... The 49 points were the most ECU had surrendered during fi rst half action in program his-tory ... The Pirates regrouped in the fi nal 30 minutes, outscoring WVU 17-7 on a Jake Verity fi eld goal and a pair of scoring tosses from Thomas Sirk and Gardner Minshew to Jimmy Williams and Trevon Brown, respectively ... Minshew’s 95-yarder to Brown served as the longest TD throw in the school’s annals ... West Virginia also benefi tted from a sturdy ground game, racking up 211 rushing yards and three additional scores ... The Mountaineers, who averaged an impressive 9.3 yards on 38 fi rst down snaps, compiled 479 total yards in the opening half ... Four of WVU’s fi rst seven touchdown drives consumed less than than 1:00 off the clock as a result of big plays.
ECU ................................................ 3 0 10 7 – 20WEST VIRGINIA ................................ 21 28 7 0 – 56
SCORING SUMMARYWVU–Justin Crawford 5 run (Mike Molina kick), 12:44, 1stECU–Jake Verity 23 fi eld goal, 6:08, 1stWVU–Ka’Raun White 7 pass from Will Grier (Molina kick), 3:50, 1stWVU–Kennedy McKoy 13 run (Molina kick), 1:04, 1stWVU–Marcus Simms 52 pass from Grier (Molina kick), 10:31, 2ndWVU–David Sills 9 pass from Grier (Molina kick), 9:31, 2ndWVU–Crawford 41 run (Molina kick), 4:35, 2ndWVU–Sills 75 pass from Grier (Molina kick), 0:30, 2ndECU–Verity 45 fi eld goal, 12:08, 3rdECU–Jimmy Williams 19 pass from Thomas Sirk (Verity kick), 7:55, 3rdWVU–Sills 4 pass from Grier (Molina kick), 6:07, 3rdECU–Trevon Brown 95 pass from Gardner Minshew (Verity kick), 10:13, 4thAttendance: 56,797; Weather: mostly clear, 62 degreesFS2: Brian Custer (play-by-play), Ben Leber (analyst)
STATISTICS ECU WVUFirst Downs ......................................................................... 21 30Rushing Attempts ..............................................................32 47Rushing Yards ..................................................142 211Completions-Attempts-Int. .....................................23-47-2 24-34-0Passing Yards .................................................. 328 403TOTAL OFFENSE ................................................. 470 614Punts-Average ........................................................... 5-40.0 4-40.0Fumbles-Lost.................................................................... 1-0 0-0Penalties-Yards .............................................................8-103 4-55Sacks By-Yards ................................................................. 1-5 0-03rd Down Conversions .................................................... 7-17 6-134th Down Conversions ......................................................1-2 1-1Time of Possession ....................................................... 31:42 28:18
RUSHING: ECU–T. Dye 14-71; H. Howe 9-54; T. Sirk 7-34; G. Minshew 1-(-3). WVU–J. Crawford 15-118, 2 TD; K. McKoy 11-49, 1 TD; T. Bush 9-30; M. Pettaway 6-12; W. Grier 4-6; C. Chugunov 2-(-4). PASSING: ECU–T. Sirk 16-34-2, 191, 1 TD; G. Minshew 7-13-0, 137, 1 TD. WVU–W. Grier 19-25-0, 352, 5 TD; C. Chugunov 5-9-0, 51. RECEIVING: ECU–J. Williams 7-86, 1 TD; D. Grayson 5-76; Q. Johnson 4-30; T. Brown 2-103, 1 TD; T. Dye 2-18; D. Farrier 2-9; H. Howe 1-6. WVU–D. Sills 7-153, 3 TD; K. White 4-49, 1 TD; G. Jennings 4-46; R. Roberson 2-9; M. Simms 1-52, 1 TD; R. Rogers 1-26; K. McKoy 1-21; E. Wellman 1-19; M. Pettaway 1-12; D. Bowen 1-9; D. Maiden 1-7.

2017 ECU Football Final Statistics, Misc...Page 9
GAME 3No. 16 Virginia Tech ........................... 64ECU ..................................................17
September 16, 2017 Dowdy-Ficklen Stadium, Greenville, N.C.
Greenville, N.C. – No. 16 Virginia Tech rallied from a 17-7 fi rst-quarter defi cit with a run of 57 unanswered points to post a 64-17 non-conference triumph over ECU at Dowdy-Ficklen Stadium ... The Pirates used a pair of Gardner Minshew touchdown passes, which included a seven-yarder to Davon Grayson and a 76-yarder to Trevon Brown, and a Jake Verity fi eld goal for the early lead before the Hokies stormed back with scores on nine-straight possessions (six TDs, three FGs) ... Quarterback Josh Jackson spearheaded the charge with a 24-of-31, 372-yard, fi ve-touchdown passing eff ort, while 10 Virginia Tech rushers amassed a combined 287 ground yards ... The Hokies’ defense also made adjustments, blanking the Pirates by limiting them to only 68 yards on their last 11 drives (after ECU gained 213 on its fi rst three possessions) ... Virginia Tech forced three turnovers, cashing those into 17 points ... Brown turned in his second-consecutive 100-yard receiving outing (4-107) to lead ECU off ensively.
VIRGINIA TECH ................................. 7 16 34 7 – 64ECU ............................................... 17 0 0 0 – 17
SCORING SUMMARYECU–Davon Grayson 9 pass from Gardner Minshew (Jake Verity kick), 12:53, 1stVT–Steven Peoples 1 run (Joey Slye kick), 8:44, 1stECU–Trevon Brown 76 pass from Minshew (Verity kick), 7:55, 1stECU–Verity 35 fi eld goal, 2:34, 1stVT–Cam Phillips 10 pass from Josh Jackson (Slye kick), 13:11, 2ndVT–Slye 25 fi eld goal, 8:36, 2ndVT–Slye 34 fi eld goal, 2:07, 2ndVT–Slye 37 fi eld goal, 0:43, 2ndVT–Phillips 31 pass from Jackson (Jackson pass failed), 12:53, 3rdVT–Travon McMillian 70 pass from Jackson (Slye kick), 11:54, 3rdVT–Phillips 45 pass from Jackson (Slye kick), 7:46, 3rdVT–Sean Savoy 9 pass from Jackson (Slye kick), 5:54, 3rdVT–Jalen Holston 1 run (Slye kick), 0:40, 3rdVT–Coleman Fox 5 run (Brian Johnson kick), 6:50, 4thAttendance: 43,776; Weather: partly cloudy, 85 degreesCBSSN: Dave Ryan (play-by-play), Corey Chavous (analyst), Tina Cervasio (reporter)
STATISTICS VT ECUFirst Downs ........................................................................ 34 12Rushing Attempts ............................................................. 62 31Rushing Yards ................................................. 287 40Completions-Attempts-Int. .................................... 25-33-0 11-30-1Passing Yards .................................................. 388 241TOTAL OFFENSE ................................................. 675 281Punts-Average ........................................................... 2-46.0 6-38.0Fumbles-Lost................................................................... 0-0 2-2Penalties-Yards ..............................................................7-69 6-40Sacks By-Yards ................................................................2-19 1-113rd Down Conversions ....................................................9-15 4-154th Down Conversions ...................................................... 1-1 1-1Time of Possession ....................................................... 39:13 20:47
RUSHING: VT–T. McMillian 11-72; A. Bush 5-66; D. McLease 11-55; J. Holston 10-39, 1 TD; C. Fox 8-34, 1 TD; S. Peoples 8-26, 1 TD; C. Carroll 1-5; J. Jackson 3-(-5). ECU–T. Dye 11-31; D. Scott 9-15; H. Howe 4-10; D. Pinnix 4-2; R. Herring 1-1; Minshew 2-(-19). PASSING: VT–J. Jackson 24-31-0, 372, 5 TD; A. Bush 1-2-0, 16. ECU–G. Minshew 11-30-1, 241, 2 TD. RECEIVING: VT–C. Phillips 14-189, 3 TD; S. Savoy 4-30, 1 TD; H. Murphy 2-29; T. McMillian 1-70, 1 TD; J. Clark 1-34; D. McClease 1-15; D. Keene 1-14. ECU–T. Brown 4-107, 1 TD; S. Baggett 1-41; T. Dye 1-30; Q. Johnson 1-27; M. Gray 1-11; J. Williams 1-9; D. Grayson 1-9, 1 TD; H. Howe 1-7.
GAME 4ECU ..................................................41Connecticut ...................................... 38
September 24, 2017 Pratt & Whitney Stadium, East Hartford, Conn.
East Hartford, Conn. – Quarterback Thomas Sirk passed for a career-high 426 yards and connected on three scoring tosses to Davon Grayson to lead ECU to a 41-38 American Athletic Conference win over Connectictut at Pratt & Whitney Stadium ... The Pirates started fast by building a 27-7 second-quarter lead on a rare Sunday afternoon tilt before staving off a furious Husky rally that included 24 second-half points ... ECU’s fi rst victory of the season wasn’t certain until UConn kicker Mike Tarbutt’s 33-yard fi eld goal attempt was wide right as time expired ... Sirk completed 30-of-39 passes, including his fi rst 11 for 133 yards and a pair of scores, and added 31 ground yards to fuel a Pirate off ense that racked up a season-best 596 yards ... Grayson caught TD passes of 17, 24 and 75 yards to fi nish with a career-high 11 receptions for 223 yards - the third-highest single-game receiving total in school history ... After Sirk and Grayson connected for a 75-yarder on the fi rst snap of the second half, UConn outscored ECU 24-7 the remainder the contest to try and pull off the comeback ... The Huskies drove down to the Pirate 15-yard line in the fi nal 2:34 before Tarbutt’s misfi re.
ECU ............................................... 21 6 14 0 – 41CONNECTICUT ................................... 7 7 17 7 – 38
SCORING SUMMARYECU–Davon Grayson 17 pass from Thomas Sirk (Jake Verity kick), 10:14, 1stUCONN–Mason Donaldson 45 pass from Bryant Shirreff s (Mike Tarbutt kick), 8:52, 1stECU–Grayson 24 pass from Sirk (Verity kick), 5:50, 1stECU–Derrell Scott 6 run (Verity kick), 3:46, 1stECU–Verity 46 fi eld goal, 13:12, 2ndECU–Verity 26 fi eld goal, 5:51, 2ndUCONN–Nate Hopkins 1 run (Tarbutt kick), 1:52, 2ndECU–Grayson 75 pass from Sirk (Verity kick), 14:50, 3rdUCONN–Donaldson 12 pass from Shirreff s (Tarbutt kick), 12:20, 3rdECU–Hussein Howe 14 run (Verity kick), 11:00, 3rdUCONN–Arkeel Newsome 8 run (Tarbutt kick), 8:54, 3rdUCONN–Tarbutt 20 fi eld goal, 0:50, 3rdUCONN–Newsome 79 pass from Shirreff s (Tarbutt kick), 5:48, 4thAttendance: 14,036; Weather: clear, 84 degreesESPNU: Mike Corey (play-by-play), Rene Ingoglia (analyst)
STATISTICS ECU UCONNFirst Downs ........................................................................ 30 27Rushing Attempts ............................................................. 47 38Rushing Yards ..................................................170 190Completions-Attempts-Int. ....................................30-39-0 24-39-1Passing Yards .................................................. 426 406TOTAL OFFENSE ................................................. 596 596Punts-Average ............................................................4-43.5 5-38.2Fumbles-Lost................................................................... 0-0 0-0Penalties-Yards .............................................................. 8-78 4-40Sacks By-Yards ................................................................. 1-4 1-83rd Down Conversions ................................................... 8-16 6-134th Down Conversions ...................................................... 1-1 1-1Time of Possession .......................................................37:22 22:38
RUSHING: ECU–D. Scott 13-36, 1 TD; H. Howe 4-32, 1 TD; T. Sirk 14-31; T. Dye 6-22; D. Pinnix 6-18; T. Brown 2-16; D. Grayson 1-10; Q. Johnson 1-5. UCONN–K. Mensah 16-107; N. Hopkins 7-32, 1 TD; B. Shirreff s 8-18; K. Dixon 2-18; A. Newsome 4-15, 1 TD; D. Williams 1-0. PASSING: ECU–T. Sirk 30-39-0, 426, 3 TD. UCONN–B. Shirreff s 24-39-1, 406, 3 TD. RECEIVING: ECU–D. Grayson 11-223, 3 TD; T. Brown 9-92; Q. Johnson 6-60; H. Howe 3-44; M. Gray 1-7. UCONN–A. Newsome 8-170, 1 TD; M. Donaldson 6-108, 2 TD; Q. Skanes 4-47; K. Dixon 2-26; K. Mensah 2-8; A. McLean 1-35; T. Beals 1-12.
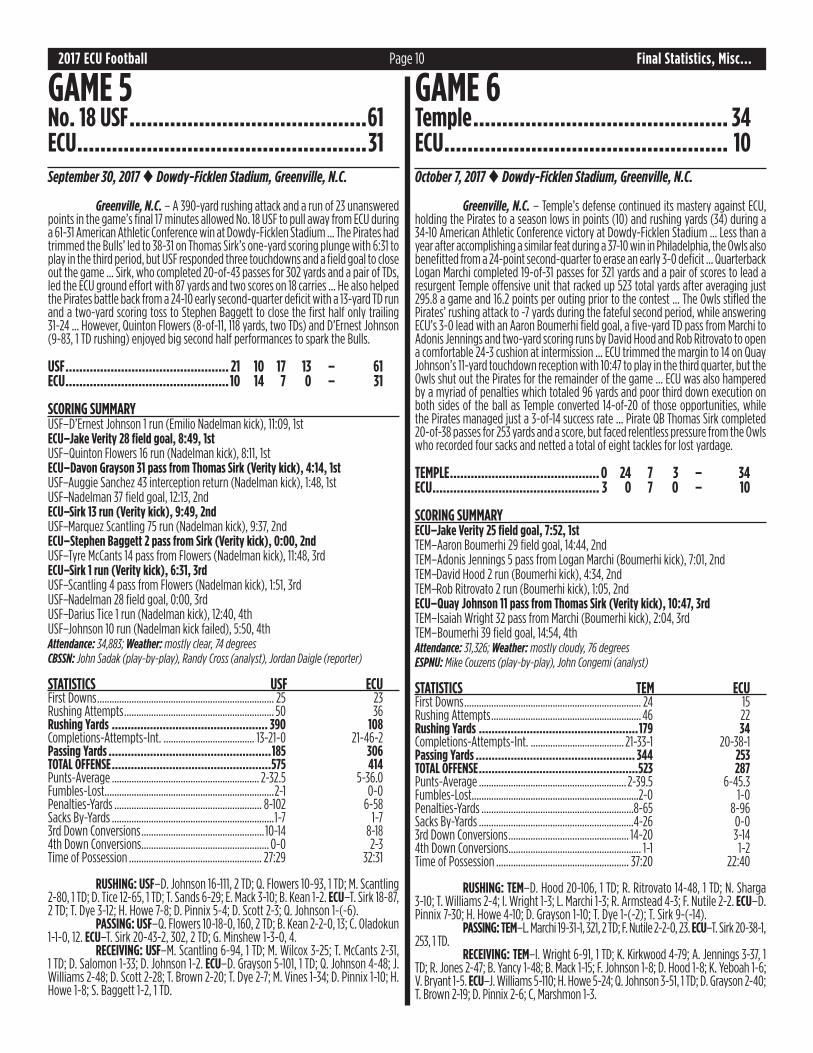
2017 ECU Football Final Statistics, Misc...Page 10
GAME 5No. 18 USF .........................................61ECU ..................................................31
September 30, 2017 Dowdy-Ficklen Stadium, Greenville, N.C.
Greenville, N.C. – A 390-yard rushing attack and a run of 23 unanswered points in the game’s fi nal 17 minutes allowed No. 18 USF to pull away from ECU during a 61-31 American Athletic Conference win at Dowdy-Ficklen Stadium ... The Pirates had trimmed the Bulls’ led to 38-31 on Thomas Sirk’s one-yard scoring plunge with 6:31 to play in the third period, but USF responded three touchdowns and a fi eld goal to close out the game ... Sirk, who completed 20-of-43 passes for 302 yards and a pair of TDs, led the ECU ground eff ort with 87 yards and two scores on 18 carries ... He also helped the Pirates battle back from a 24-10 early second-quarter defi cit with a 13-yard TD run and a two-yard scoring toss to Stephen Baggett to close the fi rst half only trailing 31-24 ... However, Quinton Flowers (8-of-11, 118 yards, two TDs) and D’Ernest Johnson (9-83, 1 TD rushing) enjoyed big second half performances to spark the Bulls.
USF ............................................... 21 10 17 13 – 61ECU ...............................................10 14 7 0 – 31
SCORING SUMMARYUSF–D’Ernest Johnson 1 run (Emilio Nadelman kick), 11:09, 1stECU–Jake Verity 28 fi eld goal, 8:49, 1stUSF–Quinton Flowers 16 run (Nadelman kick), 8:11, 1stECU–Davon Grayson 31 pass from Thomas Sirk (Verity kick), 4:14, 1stUSF–Auggie Sanchez 43 interception return (Nadelman kick), 1:48, 1stUSF–Nadelman 37 fi eld goal, 12:13, 2ndECU–Sirk 13 run (Verity kick), 9:49, 2ndUSF–Marquez Scantling 75 run (Nadelman kick), 9:37, 2ndECU–Stephen Baggett 2 pass from Sirk (Verity kick), 0:00, 2ndUSF–Tyre McCants 14 pass from Flowers (Nadelman kick), 11:48, 3rdECU–Sirk 1 run (Verity kick), 6:31, 3rdUSF–Scantling 4 pass from Flowers (Nadelman kick), 1:51, 3rdUSF–Nadelman 28 fi eld goal, 0:00, 3rdUSF–Darius Tice 1 run (Nadelman kick), 12:40, 4thUSF–Johnson 10 run (Nadelman kick failed), 5:50, 4thAttendance: 34,883; Weather: mostly clear, 74 degreesCBSSN: John Sadak (play-by-play), Randy Cross (analyst), Jordan Daigle (reporter)
STATISTICS USF ECUFirst Downs ........................................................................ 25 23Rushing Attempts ............................................................. 50 36Rushing Yards ................................................. 390 108Completions-Attempts-Int. ..................................... 13-21-0 21-46-2Passing Yards ...................................................185 306TOTAL OFFENSE ..................................................575 414Punts-Average ............................................................ 2-32.5 5-36.0Fumbles-Lost.....................................................................2-1 0-0Penalties-Yards ............................................................ 8-102 6-58Sacks By-Yards ..................................................................1-7 1-73rd Down Conversions .................................................. 10-14 8-184th Down Conversions .................................................... 0-0 2-3Time of Possession ...................................................... 27:29 32:31
RUSHING: USF–D. Johnson 16-111, 2 TD; Q. Flowers 10-93, 1 TD; M. Scantling 2-80, 1 TD; D. Tice 12-65, 1 TD; T. Sands 6-29; E. Mack 3-10; B. Kean 1-2. ECU–T. Sirk 18-87, 2 TD; T. Dye 3-12; H. Howe 7-8; D. Pinnix 5-4; D. Scott 2-3; Q. Johnson 1-(-6). PASSING: USF–Q. Flowers 10-18-0, 160, 2 TD; B. Kean 2-2-0, 13; C. Oladokun 1-1-0, 12. ECU–T. Sirk 20-43-2, 302, 2 TD; G. Minshew 1-3-0, 4. RECEIVING: USF–M. Scantling 6-94, 1 TD; M. Wilcox 3-25; T. McCants 2-31, 1 TD; D. Salomon 1-33; D. Johnson 1-2. ECU–D. Grayson 5-101, 1 TD; Q. Johnson 4-48; J. Williams 2-48; D. Scott 2-28; T. Brown 2-20; T. Dye 2-7; M. Vines 1-34; D. Pinnix 1-10; H. Howe 1-8; S. Baggett 1-2, 1 TD.
GAME 6Temple ............................................ 34ECU ................................................. 10
October 7, 2017 Dowdy-Ficklen Stadium, Greenville, N.C.
Greenville, N.C. – Temple’s defense continued its mastery against ECU, holding the Pirates to a season lows in points (10) and rushing yards (34) during a 34-10 American Athletic Conference victory at Dowdy-Ficklen Stadium ... Less than a year after accomplishing a similar feat during a 37-10 win in Philadelphia, the Owls also benefi tted from a 24-point second-quarter to erase an early 3-0 defi cit ... Quarterback Logan Marchi completed 19-of-31 passes for 321 yards and a pair of scores to lead a resurgent Temple off ensive unit that racked up 523 total yards after averaging just 295.8 a game and 16.2 points per outing prior to the contest ... The Owls stifl ed the Pirates’ rushing attack to -7 yards during the fateful second period, while answering ECU’s 3-0 lead with an Aaron Boumerhi fi eld goal, a fi ve-yard TD pass from Marchi to Adonis Jennings and two-yard scoring runs by David Hood and Rob Ritrovato to open a comfortable 24-3 cushion at intermission ... ECU trimmed the margin to 14 on Quay Johnson’s 11-yard touchdown reception with 10:47 to play in the third quarter, but the Owls shut out the Pirates for the remainder of the game ... ECU was also hampered by a myriad of penalties which totaled 96 yards and poor third down execution on both sides of the ball as Temple converted 14-of-20 of those opportunities, while the Pirates managed just a 3-of-14 success rate ... Pirate QB Thomas Sirk completed 20-of-38 passes for 253 yards and a score, but faced relentless pressure from the Owls who recorded four sacks and netted a total of eight tackles for lost yardage.
TEMPLE ........................................... 0 24 7 3 – 34ECU ................................................ 3 0 7 0 – 10
SCORING SUMMARYECU–Jake Verity 25 fi eld goal, 7:52, 1stTEM–Aaron Boumerhi 29 fi eld goal, 14:44, 2ndTEM–Adonis Jennings 5 pass from Logan Marchi (Boumerhi kick), 7:01, 2ndTEM–David Hood 2 run (Boumerhi kick), 4:34, 2ndTEM–Rob Ritrovato 2 run (Boumerhi kick), 1:05, 2ndECU–Quay Johnson 11 pass from Thomas Sirk (Verity kick), 10:47, 3rdTEM–Isaiah Wright 32 pass from Marchi (Boumerhi kick), 2:04, 3rdTEM–Boumerhi 39 fi eld goal, 14:54, 4thAttendance: 31,326; Weather: mostly cloudy, 76 degreesESPNU: Mike Couzens (play-by-play), John Congemi (analyst)
STATISTICS TEM ECUFirst Downs ........................................................................ 24 15Rushing Attempts ............................................................. 46 22Rushing Yards ..................................................179 34Completions-Attempts-Int. ...................................... 21-33-1 20-38-1Passing Yards .................................................. 344 253TOTAL OFFENSE ..................................................523 287Punts-Average ............................................................ 2-39.5 6-45.3Fumbles-Lost....................................................................2-0 1-0Penalties-Yards ..............................................................8-65 8-96Sacks By-Yards ...............................................................4-26 0-03rd Down Conversions ................................................. 14-20 3-144th Down Conversions ...................................................... 1-1 1-2Time of Possession ...................................................... 37:20 22:40
RUSHING: TEM–D. Hood 20-106, 1 TD; R. Ritrovato 14-48, 1 TD; N. Sharga 3-10; T. Williams 2-4; I. Wright 1-3; L. Marchi 1-3; R. Armstead 4-3; F. Nutile 2-2. ECU–D. Pinnix 7-30; H. Howe 4-10; D. Grayson 1-10; T. Dye 1-(-2); T. Sirk 9-(-14). PASSING: TEM–L. Marchi 19-31-1, 321, 2 TD; F. Nutile 2-2-0, 23. ECU–T. Sirk 20-38-1, 253, 1 TD. RECEIVING: TEM–I. Wright 6-91, 1 TD; K. Kirkwood 4-79; A. Jennings 3-37, 1 TD; R. Jones 2-47; B. Yancy 1-48; B. Mack 1-15; F. Johnson 1-8; D. Hood 1-8; K. Yeboah 1-6; V. Bryant 1-5. ECU–J. Williams 5-110; H. Howe 5-24; Q. Johnson 3-51, 1 TD; D. Grayson 2-40; T. Brown 2-19; D. Pinnix 2-6; C, Marshmon 1-3.

2017 ECU Football Final Statistics, Misc...Page 11
GAME 7ECU ..................................................21No. 22 UCF ....................................... 63
October 14, 2017 Spectrum Stadium, Orlando, Fla.
Orlando, Fla. – For the second consecutive year, UCF tallied points on off ense, defense and special teams to run past ECU for a 63-21 American Athletic Conference victory at Spectrum Stadium ... The Knights quickly built a comfortable 42-14 halftime lead by racking up 392 yards and scoring on fi ve of its fi rst seven of-fensive possessions, which didn’t include Tre Neal’s 50-yard interception return of a Thomas Sirk pass midway through the second quarter ... UCF extended the cushion to 49-14 on Mike Hughes’ 66-yard punt return for a score in the third period before cruising the rest of the way ... While the Pirate defense surrendered 603 total yards, the ECU off ense also had a diffi cult night getting untracked with a season-low 160 passing yards while being limited to just 15 completions ... Darius Pinnix came within seven yards of his fi rst career 100-yard rushing performance, fi nishing with 93 on 13 carries - an average of 7.2 yards per attempt ... UCF quarterback McKenzie Milton spearheaded the Knights’ off ensive attack with a 21-of-27, 324-yard passing outing that also included a pair of scoring tosses ... Sirk managed only nine completions on 21 attempts for 91 yards, but did fi nd Deondre Farrier and Davon Grayson on TD throws.
ECU ................................................ 7 7 0 7 – 21UCF ............................................... 21 21 7 14 – 63
SCORING SUMMARYUCF–Jordan Akins 48 pass from McKenzie Milton (Matthew Wright kick), 13:44, 1stUCF–Jamiyus Pittman 4 pass from Milton (Wright kick), 6:17, 1stECU–Deondre Farrier 5 pass from Thomas Sirk (Jake Verity kick), 4:32, 1stUCF–Adrian Killins 3 run (Wright kick), 0:12, 1stUCF–Milton 1 run (Wright kick), 7:49, 2ndUCF–Tre Neal 50 interception return (Wright kick), 7:25, 2ndECU–Davon Grayson 4 pass from Sirk (Verity kick), 1:41, 2ndUCF–Taj McGowan 4 run (Wright kick), 0:40, 2ndUCF–Mike Hughes 66 punt return (Wright kick), 4:48, 3rdUCF–Noah Vedral 13 run (Wright kick), 12:58, 4thECU–Tahj Deans 17 pass from Gardner Minshew (Verity kick), 10:41, 4thUCF–Greg McCrae 18 run (Wright kick), 5:19, 4thAttendance: 40,287; Weather: mostly clear, 81 degreesCBSSN: Rich Waltz (play-by-play), Aaron Murray (analyst), Cassie McKinney (reporter)
STATISTICS ECU UCFFirst Downs ......................................................................... 16 33Rushing Attempts ..............................................................37 42Rushing Yards ..................................................187 238Completions-Attempts-Int. ...................................... 15-33-1 25-31-0Passing Yards .................................................. 160 365TOTAL OFFENSE ................................................. 347 603Punts-Average ........................................................... 8-49.9 3-46.3Fumbles-Lost................................................................... 0-0 1-1Penalties-Yards ............................................................ 10-55 10-77Sacks By-Yards .................................................................2-6 1-133rd Down Conversions .................................................... 7-17 5-94th Down Conversions ..................................................... 0-1 0-1Time of Possession ...................................................... 32:08 27:52
RUSHING: ECU–D. Pinnix 13-93; H. Howe 12-69; D. Anderson 8-20; D. Farrier 1-13; T. Sirk 3-(-8). UCF–G. McCrae 6-67, 1 TD; C. Richardson 8-59; A. Killins 8-52, 1 TD; T. McGowan 8-26, 1 TD; N. Vedral 4-21, 1 TD; M. Milton 4-6, 1 TD; C. Jordan-Williams 3-6. PASSING: ECU–T. Sirk 9-21-1, 91, 2 TD; G. Minshew 6-12-0, 69, 1 TD. UCF–M. Milton 21-27-0, 324, 2 TD; N. Vedral 4-4-0, 41. RECEIVING: ECU–D. Grayson 6-96, 1 TD; Q. Johnson 4-35; D. Farrier 3-9, 1 TD; T. Deans 1-17, 1 TD; D. Anderson 1-3. UCF–O. Anderson 7-76; T. Smith 5-93; J. Akins 2-52, 1 TD; C. Stewart 2-49; A. Harris 2-29; A. Killins 2-21; M. Williams 1-22; E. Logan-Greene 1-7; G. Davis 1-7; G. McCrae 1-5; J. Pittman 1-4, 1 TD.
GAME 8BYU .................................................17ECU ................................................. 33
October 21, 2017 Dowdy-Ficklen Stadium, Greenville, N.C.
Greenville, N.C. – Jake Verity matched a school single-game record by drilling four fi eld goals and Gardner Minshew tossed a pair of second-half touchdown passes to lift ECU to a 33-17 non-conference triumph over BYU at Dowdy-Ficklen Stadium ... The Pirates scored on their fi rst four possessions after halftime to break open a 10-10 deadlock, while the ECU defense forced two punts, made a fourth down stop and picked off a pass to keep BYU out of the endzone until late in the fourth period ... The Cougars used a short fi eld following a fumble recovery to open an early 7-0 lead, but ECU outscored BYU 33-3 on the strength of Verity’s leg and Minshew’s arm ... After Thomas Sirk’s one-yard scoring plunge with 3:09 left in the opening stanza evened the contest, Verity connected on a pair of 42-yarders and added 32 and 33-yard three-pointers to give the Pirates a 19-10 cushion after three quarters ... Minshew, who replaced an injured Sirk with 3:05 remaining in the third period, capped a quick three-play drive with a 26-yard TD toss to Trevon Brown to open the fourth quarter ... ECU’s defense followed with a fourth-down stop at the Pirate four-yard line on BYU’s next possession before linebacker Cannon Gibbs’ interception set up Minshew’s second scoring pass - a nine-yard screen to Quay Johnson - and provide a comfortable 33-10 cushion with 6:25 remaining ... Davon Grayson turned in his third triple-digit outing of the year with 10 receptions for 164 yards to lead all receivers.
BYU ............................................... 7 3 0 7 – 17ECU ................................................ 7 3 9 14 – 33
SCORING SUMMARYBYU–Micah Simon 12 pass from Tanner Mangum (Rhett Almond kick), 6:52, 1stECU–Thomas Sirk 1 run (Jake Verity kick), 3:09, 1stECU–Verity 42 fi eld goal, 10:35, 2ndBYU–Almond 22 fi eld goal, 0:00, 2ndECU–Verity 42 fi eld goal, 13:01, 3rdECU–Verity 32 fi eld goal, 6:17, 3rdECU–Verity 33 fi eld goal, 1:07, 3rdECU–Trevon Brown 26 pass from Gardner Minshew (Verity kick), 13:47, 4thECU–Quay Johnson 9 pass from Minshew (Verity kick), 6:25, 4thBYU–Matt Bushman 12 pass from Mangum (Almond kick), 3:48, 4thAttendance: 38,835; Weather: partly cloudy, 71 degreesCBSSN: Dave Ryan (play-by-play), Corey Chavous (analyst), Melanie Collins (reporter)
STATISTICS BYU ECUFirst Downs ........................................................................ 22 22Rushing Attempts .............................................................. 31 35Rushing Yards ..................................................102 115Completions-Attempts-Int. ..................................... 26-41-1 20-30-0Passing Yards ...................................................319 298TOTAL OFFENSE ..................................................421 413Punts-Average ........................................................... 5-46.4 3-45.7Fumbles-Lost.................................................................... 1-0 1-1Penalties-Yards ............................................................. 8-69 2-15Sacks By-Yards ................................................................. 1-5 3-203rd Down Conversions ....................................................6-15 4-124th Down Conversions .....................................................0-2 1-1Time of Possession ....................................................... 33:16 26:44
RUSHING: BYU–U. Tolutau 15-62; K. Hall 9-46; R. Burt 2-8; A. Kafentzis 1-5; T. Mangum 4-(-19). ECU–D. Anderson 12-43; T. Sirk 5-25, 1 TD; H. Howe 7-24; D. Pinnix 5-13; D. Grayson 1-12; D. Scott 2-5; G. Minshew 1-(-5). PASSING: BYU–T. Mangum 26-41-1, 319, 2 TD. ECU–T. Sirk 14-21-0, 177; G. Minshew 6-9-0, 121, 2 TD RECEIVING: BYU–A. Hifo 9-148; M. Simon 4-30, 1 TD; M. Bushman 4-24, 1 TD; N. Pau’u 2-29; K. Hall 2-25; B. Tanner 2-24; J. Trinnaman 2-22; B. El-Bakri 1-17. ECU–D. Grayson 10-164; Q. Johnson 5-51, 1 TD; T. Brown 3-74, 1 TD; S. Baggett 2-9.

2017 ECU Football Final Statistics, Misc...Page 12
GAME 9ECU ................................................. 27Houston .......................................... 52
November 4, 2017 TDECU Stadium, Houston, Texas
Houston, Texas – Houston used big plays on off ense and cashed all three takeaways into touchdowns to capture a 52-27 American Athletic Conference win over ECU at TDECU Stadium ... The explosive Cougars had eight plays exceed 20 yards, including back-to-back touchdown tosses of 75 and 62 midway through the third quarter that stymied a Pirate comeback attempt and broke open a narrow 28-17 lead ... The loss spoiled a record-breaking performance by ECU quarterback Gardner Minshew, who established school and AAC single-game standards in completions (52) and attempts (68), while turning in the program’s third-highest air yardage total (463) ... The Pirates used successive Minshew TD throws to Trevon Brown before and after halftime to dent a 28-3 UH lead, but the Cougars answered with a run of 24 points on the two long pass plays, a Caden Novikoff fi eld goal and Brandon McDowell’s 74-yard pick-six with 12:26 remaining to put the game on ice ... In addition to scoring on a one-yard run to open the contest, Cougar quarterback D’Eriq King averaged 22 yards per completion after connecting on 15-of-21 passes for 330 yards and three scores.
ECU ................................................ 0 10 7 10 – 27HOUSTON ....................................... 21 7 17 7 – 52
SCORING SUMMARYUH–D’Eriq King 2 run (Caden Novikoff kick), 10:48, 1stUH–Duke Catalon 22 run (Novikoff kick), 7:02, 1stUH–Courtney Lark 5 pass from King (Novikoff kick), 1:20, 1stECU–Jake Verity 22 fi eld goal, 8:40, 2ndUH–Mulbah Car 1 run (Novikoff kick), 7:19, 2ndECU–Trevon Brown 34 pass from Gardner Minshew (Verity kick), 5:24, 2ndECU–Brown 9 pass from Minshew (Verity kick), 9:03, 3rdUH–Steven Dunbar 75 pass from King (Novikoff kick), 8:52, 3rdUH–Linell Bonner 62 pass from King (Novikoff kick), 6:09, 3rdUH–Novikoff 44 fi eld goal, 1:22, 3rdUH–Brandon McDowell 74 interception return (Novikoff kick), 12:26, 4thECU–Verity 52 fi eld goal, 7:30, 4thECU–Quay Johnson 18 pass from Minshew (Verity kick), 2:48, 4thAttendance: 29,810; Weather: partly cloudy, 79 degreesCBSSN: John Sadak (play-by-play), Randy Cross (analyst), Tina Cervasio (reporter)
STATISTICS ECU UHFirst Downs .........................................................................33 16Rushing Attempts ............................................................. 24 26Rushing Yards ................................................... 36 142Completions-Attempts-Int. .....................................54-74-2 15-22-0Passing Yards .................................................. 468 330TOTAL OFFENSE ................................................. 504 472Punts-Average ............................................................3-42.7 3-46.0Fumbles-Lost.....................................................................3-1 0-0Penalties-Yards ...............................................................7-51 4-34Sacks By-Yards ................................................................ 0-0 1-83rd Down Conversions ..................................................12-22 5-94th Down Conversions .....................................................2-2 0-0Time of Possession ...................................................... 40:23 19:37
RUSHING: ECU–D. Pinnix 8-18; T. Dye 3-12; D. Scott 1-6; D. Grayson 1-4; Q. Johnson 1-4; H. Howe 1-2; D. Anderson 4-2; T. Sirk 2-0; G. Minshew 3-(-12). UH–D. Catalon 9-77, 1 TD; M. Car 8-29, 1 TD; P. Carr 4-16; D. King 3-14, 1 TD; D. Mitchell 2-6. PASSING: ECU–G. Minshew 52-68-1, 463, 3 TD; Sirk 2-6-1, 5. UH–D. King 15-21-0, 330, 3 TD; K. Allen 0-1-0, 0. RECEIVING: ECU–Q. Johnson 14-115, 1 TD; T. Brown 11-141, 2 TD; J. Williams 7-58; D. Grayson 6-38; H. Howe 5-37; T. Deans 3-27; D. Farrier 3-21; D. Pinnix 3-19; S. Baggett 1-7; M. Vines 1-5. UH–L. Bonner 7-147, 1 TD; S. Dunbar 6-171, 1 TD; R. Brooker 1-7; C. Lark 1-5, 1 TD.
GAME 10Tulane ..............................................31ECU ...........................................(OT) 24
November 11, 2017 Dowdy-Ficklen Stadium, Greenville, N.C.
Greenville, N.C. – Tulane converted a pair of criticial fourth-down plays on both sides of the ball during overtime to post a 31-24 American Athletic Conference road triumph against ECU at Dowdy-Ficklen Stadium ... After the Pirates impres-sively executed a two-minute drill to tie the contest at 24 with 36 seconds to play on Gardner Minshew’s nine-yard scoring toss to Deondre Farrier, the Green Wave used a 16-yard TD run by quarterback Jonathan Banks on a fourth-and-one call to cap their OT possession ... ECU quickly marched down to the Tulane one-yard line on its series, but Darius Pinnix was greeted by Robert Kennedy and a host of other Green Wave defenders just short of the goal line for a game-winning stop on a fourth-and-one snap ... The Pirates fought back from a 24-14 defi cit in the fourth quarter, using an inspired defense that allowed only 64 yards and Jake Verity’s 29-yard fi eld goal at the 12:18 mark before Minshew engineered the contest-tying drive ... Prior to seizing the momentum, the Pirates had diffi culty slowing Tulane’s rushing attack as the GreenWave picked up 277 ground yards in the fi rst three stanzas, which included 60 and 26-yard TD jaunts by Dontrell Hilliard ... The loss spoiled a solid performance from sophomore running back Hussein Howe, who turned in ECU’s fi rst triple-digit rushing eff ort of the campaign with 108 yards on 14 carries - an average of 7.7 per attempt ... The Pirate defense also forced a season-high three turnovers, but could only cash those into three points ... Minshew completed 25-of-52 passes for 228 yards and a TD.
TULANE .......................................... 7 10 7 0 7 -31ECU ................................................ 7 7 0 10 0 -24
SCORING SUMMARYTLN–Jonathan Banks 2 run (Merek Glover kick), 7:42, 1stECU–Darius Pinnix 2 run (Jake Verity kick), 3:09, 1stTLN–Dontrell Hilliard 60 run (Glover kick), 8:49, 2ndECU–Hussein Howe 25 run (Verity kick), 6:13, 2ndTLN–Glover 26 fi eld goal, 0:30, 2ndTLN–Hilliard 26 run (Glover kick), 0:36, 3rdECU–Verity 29 fi eld goal, 12:18, 4thECU–Deondre Farrier 9 pass from Gardner Minshew (Verity kick), 0:36, 4thTLN–Banks 16 run (Glover kick), 15:00, OTAttendance: 36,178; Weather: clear, 37 degreesCBSSN: Dave Ryan (play-by-play), Corey Chavous (analyst), Melanie Collins (reporter)
STATISTICS TLN ECUFirst Downs ........................................................................ 22 24Rushing Attempts ............................................................. 52 32Rushing Yards ..................................................325 161Completions-Attempts-Int. .....................................12-20-2 25-53-1Passing Yards ................................................... 121 228TOTAL OFFENSE ................................................. 446 389Punts-Average ............................................................4-39.5 4-40.0Fumbles-Lost..................................................................... 1-1 1-0Penalties-Yards ..............................................................8-70 2-20Sacks By-Yards ................................................................. 1-8 0-03rd Down Conversions ....................................................6-15 8-184th Down Conversions ..................................................... 3-3 2-5Time of Possession .......................................................33:35 26:25
RUSHING: TLN–D. Hilliard 28-189, 2 TD; J. Banks 12-96, 2 TD; D. Bradwell 6-24; S. Badie 5-17. ECU–H. Howe 14-108, 1 TD; D. Scott 2-29; D. Anderson 5-18; D. Pinnix 6-5, 1 TD; T. Sirk 2-3; D. Grayson 1-0; G. Minshew 2-(-2). PASSING: TLN–J. Banks 11-19-2, 110; G. Cuiellette 1-1-0, 11. ECU–G. Minshew 25-52-1, 228, 1 TD; Sirk 0-1-0, 0. RECEIVING: TLN–D. Mooney 6-67; T. Encalade 2-45; J. Robertson 2-14; K. Ardoin 1-0; D. Hilliard 1-(-5). ECU–T. Brown 7-72; H. Howe 5-36; D. Grayson 4-43; D. Farrier 3-34, 1 TD; J. Williams 3-24; Q. Johnson 3-19.
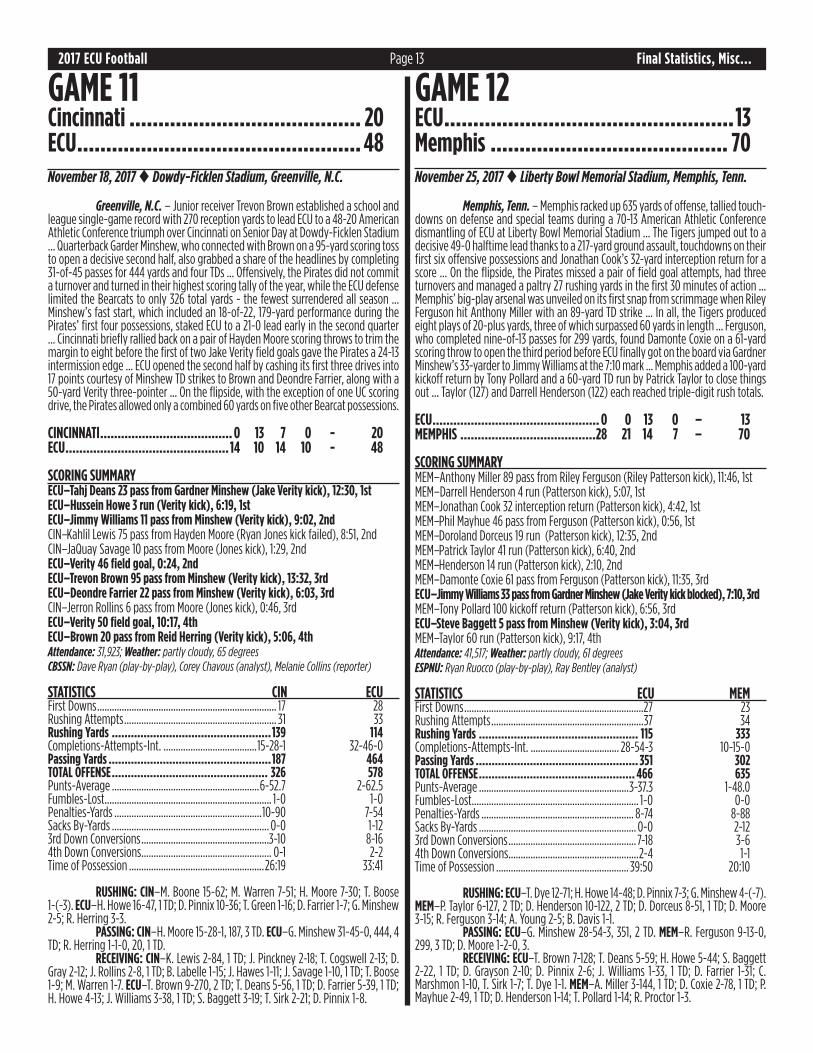
2017 ECU Football Final Statistics, Misc...Page 13
GAME 11Cincinnati ........................................ 20ECU ................................................. 48
November 18, 2017 Dowdy-Ficklen Stadium, Greenville, N.C.
Greenville, N.C. – Junior receiver Trevon Brown established a school and league single-game record with 270 reception yards to lead ECU to a 48-20 American Athletic Conference triumph over Cincinnati on Senior Day at Dowdy-Ficklen Stadium ... Quarterback Garder Minshew, who connected with Brown on a 95-yard scoring toss to open a decisive second half, also grabbed a share of the headlines by completing 31-of-45 passes for 444 yards and four TDs ... Off ensively, the Pirates did not commit a turnover and turned in their highest scoring tally of the year, while the ECU defense limited the Bearcats to only 326 total yards - the fewest surrendered all season ... Minshew’s fast start, which included an 18-of-22, 179-yard performance during the Pirates’ fi rst four possessions, staked ECU to a 21-0 lead early in the second quarter ... Cincinnati briefl y rallied back on a pair of Hayden Moore scoring throws to trim the margin to eight before the fi rst of two Jake Verity fi eld goals gave the Pirates a 24-13 intermission edge ... ECU opened the second half by cashing its fi rst three drives into 17 points courtesy of Minshew TD strikes to Brown and Deondre Farrier, along with a 50-yard Verity three-pointer ... On the fl ipside, with the exception of one UC scoring drive, the Pirates allowed only a combined 60 yards on fi ve other Bearcat possessions.
CINCINNATI ...................................... 0 13 7 0 - 20ECU ............................................... 14 10 14 10 - 48
SCORING SUMMARYECU–Tahj Deans 23 pass from Gardner Minshew (Jake Verity kick), 12:30, 1stECU–Hussein Howe 3 run (Verity kick), 6:19, 1stECU–Jimmy Williams 11 pass from Minshew (Verity kick), 9:02, 2ndCIN–Kahlil Lewis 75 pass from Hayden Moore (Ryan Jones kick failed), 8:51, 2ndCIN–JaQuay Savage 10 pass from Moore (Jones kick), 1:29, 2ndECU–Verity 46 fi eld goal, 0:24, 2ndECU–Trevon Brown 95 pass from Minshew (Verity kick), 13:32, 3rdECU–Deondre Farrier 22 pass from Minshew (Verity kick), 6:03, 3rdCIN–Jerron Rollins 6 pass from Moore (Jones kick), 0:46, 3rdECU–Verity 50 fi eld goal, 10:17, 4thECU–Brown 20 pass from Reid Herring (Verity kick), 5:06, 4thAttendance: 31,923; Weather: partly cloudy, 65 degreesCBSSN: Dave Ryan (play-by-play), Corey Chavous (analyst), Melanie Collins (reporter)
STATISTICS CIN ECUFirst Downs ......................................................................... 17 28Rushing Attempts .............................................................. 31 33Rushing Yards ..................................................139 114Completions-Attempts-Int. ......................................15-28-1 32-46-0Passing Yards ...................................................187 464TOTAL OFFENSE ................................................. 326 578Punts-Average ............................................................6-52.7 2-62.5Fumbles-Lost.................................................................... 1-0 1-0Penalties-Yards ............................................................10-90 7-54Sacks By-Yards ................................................................ 0-0 1-123rd Down Conversions ....................................................3-10 8-164th Down Conversions ..................................................... 0-1 2-2Time of Possession .......................................................26:19 33:41
RUSHING: CIN–M. Boone 15-62; M. Warren 7-51; H. Moore 7-30; T. Boose 1-(-3). ECU–H. Howe 16-47, 1 TD; D. Pinnix 10-36; T. Green 1-16; D. Farrier 1-7; G. Minshew 2-5; R. Herring 3-3. PASSING: CIN–H. Moore 15-28-1, 187, 3 TD. ECU–G. Minshew 31-45-0, 444, 4 TD; R. Herring 1-1-0, 20, 1 TD. RECEIVING: CIN–K. Lewis 2-84, 1 TD; J. Pinckney 2-18; T. Cogswell 2-13; D. Gray 2-12; J. Rollins 2-8, 1 TD; B. Labelle 1-15; J. Hawes 1-11; J. Savage 1-10, 1 TD; T. Boose 1-9; M. Warren 1-7. ECU–T. Brown 9-270, 2 TD; T. Deans 5-56, 1 TD; D. Farrier 5-39, 1 TD; H. Howe 4-13; J. Williams 3-38, 1 TD; S. Baggett 3-19; T. Sirk 2-21; D. Pinnix 1-8.
GAME 12ECU ..................................................13Memphis ......................................... 70
November 25, 2017 Liberty Bowl Memorial Stadium, Memphis, Tenn.
Memphis, Tenn. – Memphis racked up 635 yards of off ense, tallied touch-downs on defense and special teams during a 70-13 American Athletic Conference dismantling of ECU at Liberty Bowl Memorial Stadium ... The Tigers jumped out to a decisive 49-0 halftime lead thanks to a 217-yard ground assault, touchdowns on their fi rst six off ensive possessions and Jonathan Cook’s 32-yard interception return for a score ... On the fl ipside, the Pirates missed a pair of fi eld goal attempts, had three turnovers and managed a paltry 27 rushing yards in the fi rst 30 minutes of action ... Memphis’ big-play arsenal was unveiled on its fi rst snap from scrimmage when Riley Ferguson hit Anthony Miller with an 89-yard TD strike ... In all, the Tigers produced eight plays of 20-plus yards, three of which surpassed 60 yards in length ... Ferguson, who completed nine-of-13 passes for 299 yards, found Damonte Coxie on a 61-yard scoring throw to open the third period before ECU fi nally got on the board via Gardner Minshew’s 33-yarder to Jimmy Williams at the 7:10 mark ... Memphis added a 100-yard kickoff return by Tony Pollard and a 60-yard TD run by Patrick Taylor to close things out ... Taylor (127) and Darrell Henderson (122) each reached triple-digit rush totals.
ECU ................................................ 0 0 13 0 – 13MEMPHIS .......................................28 21 14 7 – 70
SCORING SUMMARYMEM–Anthony Miller 89 pass from Riley Ferguson (Riley Patterson kick), 11:46, 1stMEM–Darrell Henderson 4 run (Patterson kick), 5:07, 1stMEM–Jonathan Cook 32 interception return (Patterson kick), 4:42, 1stMEM–Phil Mayhue 46 pass from Ferguson (Patterson kick), 0:56, 1stMEM–Doroland Dorceus 19 run (Patterson kick), 12:35, 2ndMEM–Patrick Taylor 41 run (Patterson kick), 6:40, 2ndMEM–Henderson 14 run (Patterson kick), 2:10, 2ndMEM–Damonte Coxie 61 pass from Ferguson (Patterson kick), 11:35, 3rdECU–Jimmy Williams 33 pass from Gardner Minshew (Jake Verity kick blocked), 7:10, 3rdMEM–Tony Pollard 100 kickoff return (Patterson kick), 6:56, 3rdECU–Steve Baggett 5 pass from Minshew (Verity kick), 3:04, 3rdMEM–Taylor 60 run (Patterson kick), 9:17, 4thAttendance: 41,517; Weather: partly cloudy, 61 degreesESPNU: Ryan Ruocco (play-by-play), Ray Bentley (analyst)
STATISTICS ECU MEMFirst Downs .........................................................................27 23Rushing Attempts ..............................................................37 34Rushing Yards .................................................. 115 333Completions-Attempts-Int. .................................... 28-54-3 10-15-0Passing Yards ................................................... 351 302TOTAL OFFENSE ................................................. 466 635Punts-Average .............................................................3-37.3 1-48.0Fumbles-Lost.................................................................... 1-0 0-0Penalties-Yards .............................................................. 8-74 8-88Sacks By-Yards ................................................................ 0-0 2-123rd Down Conversions .................................................... 7-18 3-64th Down Conversions .....................................................2-4 1-1Time of Possession ...................................................... 39:50 20:10
RUSHING: ECU–T. Dye 12-71; H. Howe 14-48; D. Pinnix 7-3; G. Minshew 4-(-7). MEM–P. Taylor 6-127, 2 TD; D. Henderson 10-122, 2 TD; D. Dorceus 8-51, 1 TD; D. Moore 3-15; R. Ferguson 3-14; A. Young 2-5; B. Davis 1-1. PASSING: ECU–G. Minshew 28-54-3, 351, 2 TD. MEM–R. Ferguson 9-13-0, 299, 3 TD; D. Moore 1-2-0, 3. RECEIVING: ECU–T. Brown 7-128; T. Deans 5-59; H. Howe 5-44; S. Baggett 2-22, 1 TD; D. Grayson 2-10; D. Pinnix 2-6; J. Williams 1-33, 1 TD; D. Farrier 1-31; C. Marshmon 1-10, T. Sirk 1-7; T. Dye 1-1. MEM–A. Miller 3-144, 1 TD; D. Coxie 2-78, 1 TD; P. Mayhue 2-49, 1 TD; D. Henderson 1-14; T. Pollard 1-14; R. Proctor 1-3.

2017 ECU Football Final Statistics, Misc...Page 14
RUSHINGHAD 500 OR MORE YARDS RUSHING ... ECU: Oct. 10, 1987; vs. Cincinnati (500) - 366 gmsOPP.: Oct. 27, 2012; Navy (512) - 67 gms
HAD 400 OR MORE YARDS RUSHING ... ECU: Nov. 3, 2007; vs. Memphis (491) - 132 gmsOPP.: Sept. 2, 2017; James Madison (410) - 12 gms
HAD 300 OR MORE YARDS RUSHING ... ECU: Oct. 3, 2015; vs. SMU (306) - 32 gmsOPP.: Nov. 25, 2017; Memphis (333) - 1 gm
HAD SIX (6) OR MORE RUSHING TDs ... ECU: Nov. 23, 2012; vs. Marshall (6) - 64 gms OPP.: Nov. 19, 2016; Navy (9) - 14 gms
HAD FIVE (5) OR MORE RUSHING TDs ...ECU: Sept. 20, 2014; vs. North Carolina (5) - 46 gms OPP.: Nov. 25, 2017; Memphis (5) - 1 gm
HAD FOUR (4) OR MORE RUSHING TDs ... ECU: Oct. 3, 2015; vs. SMU (4) - 32 gmsOPP.: Nov. 25, 2017; Memphis (5) - 1 gm
HAD TWO OR MORE PLAYERS WITH 100 YARDS RUSHING IN A GAME ... ECU: Nov. 8, 2003; vs. USF (Vonta Leach, 111/Marvin Townes, 107) - 179 gmsOPP.: Nov. 25, 2017; Memphis (Patrick Taylor, 127/Darrell Henderson,122) - 1 gm
PASSINGHAD 500 OR MORE YARDS PASSING ...ECU: Sept. 5, 1992; vs. Syracuse (521) - 283 gmsOPP.: Dec. 5, 2009; Houston (527) - 102 gms
HAD 400 OR MORE YARDS PASSING ...ECU: Nov. 18, 2017; vs. Cincinnati (464) - 2 gmsOPP.: Sept. 24, 2017; Connecticut (406) - 9 gms
HAD 375 OR MORE YARDS PASSING ...ECU: Nov. 18, 2017; vs. Cincinnati (464) - 2 gmsOPP.: Sept. 24, 2017; Connecticut (406) - 9 gms
HAD 300 OR MORE YARDS PASSING ...ECU: Nov. 25, 2017; vs. Memphis (351) - 1 gmOPP.: Nov. 25, 2017; Memphis (302) - 1 gm
HAD 250 OR MORE YARDS PASSING ...ECU: Nov. 25, 2017; vs. Memphis (351) - 1 gmOPP.: Nov. 25, 2017; Memphis (302) - 1 gm
HAD 50 OR MORE PASS ATTEMPTS ... ECU: Nov. 25, 2017; vs. Memphis (54) - 1 gmOPP.: Oct. 4, 2014; SMU (68) - 44 gms
HAD 40 OR MORE PASS ATTEMPTS ... ECU: Nov. 25, 2017; vs. Memphis (54) - 1 gmOPP.: Oct. 21, 2017; BYU (41) - 5 gms
HAD 30 OR MORE PASS COMPLETIONS ...ECU: Nov. 18, 2017; vs. Cincinnati (32) - 2 gmsOPP.: Nov. 28, 2015; Cincinnati (30) - 25 gms
HAD 25 OR MORE PASS COMPLETIONS ... ECU: Nov. 25, 2017; vs. Memphis (28) - 1 gmOPP.: Oct. 21, 2017; BYU (26) - 5 gms
HAD FIVE (5) OR MORE TD PASSES ... ECU: Nov. 18, 2017; vs. Cincinnati (5) - 2 gmsOPP.: Sept. 16, 2017; Virginia Tech (5) - 10 gms
HAD FOUR (4) OR MORE TD PASSES ... ECU: Nov. 18, 2017; vs. Cincinnati (5) - 2 gmsOPP.: Sept. 16, 2017; Virginia Tech (5) - 10 gms
HAD THREE (3) OR MORE TD PASSES ... ECU: Nov. 18, 2017; vs. Cincinnati (5) - 2 gmsOPP.: Nov. 25, 2017; Memphis (3) - 1 gm
HAD FIVE (5) OR MORE PASSES INTERCEPTED ... ECU: Oct. 2, 1993; vs. Memphis (6) - 301 gmsOPP.: Dec. 3, 2008; Tulsa (5) - 116 gms
HAD FOUR (4) OR MORE PASSES INTERCEPTED ... ECU: Sept. 8, 2012; vs. South Carolina (4) - 73 gmsOPP.: Sept. 26, 2009; UCF (4) - 116 gms
HAD THREE (3) OR MORE PASSES INTERCEPTED ... ECU: Nov. 25, 2017; vs. Memphis (3) - 1 gmOPP.: Nov. 13, 2014; Cincinnati (3) - 41 gms
HAD TWO OR MORE PLAYERS WITH 100 YARDS PASSING IN A GAME ... ECU: Oct. 21, 2017; vs. BYU (Thomas Sirk, 177/Gardner Minshew, 121) - 5 gmsOPP.: Sept. 20, 2014; North Carolina (Marquise Williams, 127/Mitch Trubisky, 103) - 46 gms
RECEIVINGHAD TWO OR MORE PLAYERS WITH 100 YARDS RECEIVING IN A GAME ... ECU: Nov. 4, 2016; vs. Houston (Trevon Brown, 141/Quay Johnson, 115) - 4 gmsOPP.: Nov. 25, 2017; Houston (Steven Dunbar, 171/Linell Bonner, 147) - 4 gms
HAD 10 PLAYERS WITH AT LEAST 1 RECEPTION ... ECU: Nov. 25, 2017; vs. Memphis (11) - 1 gmOPP.: Nov. 18, 2017; Cincinnati (10) - 2 gms
TOTAL OFFENSEHAD 600 OR MORE YARDS TOTAL OFFENSE ... ECU: Sept. 3, 2016; vs. Western Carolina (688) - 24 gmsOPP.: Nov. 25, 2017; Memphis (635) - 1 gm
HAD 500 OR MORE YARDS TOTAL OFFENSE ...ECU: Nov. 18, 2017; vs. Cincinnati (578) - 2 gmsOPP.: Nov. 25, 2017; Memphis (635) - 1 gm
THE LAST TIME A TEAM ...

2017 ECU Football Final Statistics, Misc...Page 15
RECORDED FIVE OR MORE SACKS ... ECU: Oct. 3, 2015; vs. SMU (8) - 32 gmsOPP.: Nov. 5, 2016; Tulsa (7) - 16 gms
RECORDED A SAFETY ... ECU: Sept. 5, 2009; vs. Appalachian State - 114 gmsOPP.: Oct. 1, 2016; UCF - 20 gms
SCORINGHAD 70 OR MORE POINTS ... ECU: Sept. 20, 2014; vs. North Carolina (70) - 46 gmsOPP.: Nov. 25, 2017; Memphis (70) - 1 gm
HAD 60 OR MORE POINTS ... ECU: Sept. 20, 2014; vs. North Carolina (70) - 46 gmsOPP.: Nov. 25, 2017; Memphis (70) - 1 gm
HAD 50 OR MORE POINTS ...ECU: Sept. 3, 2016; vs. Western Carolina (52) - 24 gmsOPP.: Nov. 25, 2017; Memphis (70) - 1 gm
HAD 40 OR MORE POINTS ...ECU: Nov. 18, 2017; vs. Cincinnati (48) - 2 gmsOPP.: Nov. 25, 2017; Memphis (70) - 1 gm
SCORED 40 POINTS IN ONE HALF ...ECU: Oct. 5, 1991; vs. Akron (42-1st) - 327 gmsOPP.: Nov. 25, 2017; Memphis (49-1st) - 1 gm
SCORED 30 OR MORE POINTS IN ONE HALF ...ECU: Sept. 3, 2016; vs. Western Carolina (31-1st) - 24 gmsOPP.: Nov. 25, 2017; Memphis (49-1st) - 1 gm
SCORED 25 OR MORE POINTS IN ONE QUARTER ...ECU: Nov. 11, 2010; vs. UAB (27-4th) - 92 gmsOPP.: Nov. 25, 2017; Memphis (28-1st) - 1 gm
WAS HELD SCORELESS ...ECU: Oct. 4, 1997; vs. Syracuse (0-56) - 254 gmsOPP.: Sept. 2, 2000; vs. Duke (38-0) - 225 gms
WAS HELD SCORELESS AT HOME ...ECU: Sept. 20, 1997; vs. South Carolina (0-26) - 119 gmsOPP.: Sept. 2, 2000; vs. Duke (38-0) - 106 gms
WAS HELD SCORELESS ON THE ROAD ...ECU: Oct. 4, 1997; vs. Syracuse (0-56) - 135 gmsOPP.: Sept. 12, 1998; vs. Chattanooga (31-0) - 131 gms
SCORED A TWO-POINT CONVERSION PASSING ...ECU: Oct. 1, 2016; vs. UCF (Gardner Minshew pass) - 20 gmsOPP.: Nov. 28, 2014; Tulsa (Dane Evans pass) - 39 gms
SCORED A TWO-POINT CONVERSION RUSHING ...ECU: Oct. 20, 2012; vs. UAB (Vintavious Cooper) - 68 gmsOPP.: Nov. 21, 2009; UAB (Joe Webb) - 104 gms
HAD 400 OR MORE YARDS TOTAL OFFENSE ...ECU: Nov. 25, 2017; vs. Memphis (466) - 1 gmOPP.: Nov. 25, 2017; Memphis (635) - 1 gm
HAD 100 OR MORE PLAYS ... ECU: Oct. 1, 2016; vs. UCF (102) - 20 gmsOPP.: Nov. 23, 2012; Marshall (100) - 64 gms
HAD 90 OR MORE PLAYS ... ECU: Nov. 25, 2017; vs. Memphis (91) - 1 gmOPP.: Sept. 16, 2017; Virginia Tech (95) - 10 gms
HAD 80 OR MORE PLAYS ... ECU: Nov. 25, 2017; vs. Memphis (91) - 1 gmOPP.: Sept. 24, 2017; Connecticut (77) - 9 gms
HAD 75 OR MORE PLAYS ... ECU: Nov. 25, 2017; vs. Memphis (91) - 1 gmOPP.: Oct. 7, 2017; Temple (79) - 7 gms
WAS HELD TO 10 OR FEWER FIRST DOWNS ... ECU: Nov. 7, 2008; vs. USF (8) - 27 gmsOPP.: Nov. 1, 2014; Temple (10) - 42 gms
HAD 30 OR MORE FIRST DOWNS ...ECU: Nov. 4, 2017; vs. Houston (33) - 4 gmsOPP.: Oct. 14, 2017; UCF (33) - 6 gms
HAD 25 OR MORE FIRST DOWNS ... ECU: Nov. 25, 2017; vs. Memphis (27) - 1 gmOPP.: Oct. 14, 2017; UCF (33) - 6 gms
WAS HELD TO 0 OR FEWER YARDS RUSHING ... ECU: Sept. 12, 2015; vs. Florida (-13) - 35 gmsOPP.: Oct. 6, 1973; Davidson (-4) - 522 gms
WAS HELD TO 50 OR FEWER YARDS RUSHING ... ECU: Nov. 4, 2017; vs. Houston (36) - 4 gmsOPP.: Oct. 3, 2015; SMU (40) - 32 gms
WAS HELD TO 55 OR FEWER YARDS PASSING ... ECU: Sept. 22, 2007; vs. West Virginia (54) - 138 gmsOPP.: Sept 19, 2015; Navy (41) - 34 gms
WAS HELD TO 100 OR FEWER YARDS PASSING ... ECU: Sept. 22, 2007; vs. West Virginia (54) - 138 gmsOPP.: Sept 19, 2015; Navy (41) - 34 gms
WAS HELD TO 200 OR FEWER YARDS TOTAL OFFENSE ... ECU: Nov. 26, 2016; vs. Temple (183) - 13 gmsOPP.: Nov. 1, 2014; Temple (135) - 41 gms
DEFENSERECORDED SIX OR MORE SACKS ... ECU: Oct. 3, 2015; vs. SMU (8) - 32 gmsOPP.: Nov. 5, 2016; Tulsa (7) - 16 gms
THE LAST TIME A TEAM ...

2017 ECU Football Final Statistics, Misc...Page 16
BLOCKED A PAT KICK ... ECU: Nov. 26, 2016; vs. Temple (Dayon Pratt) - 13 gmsOPP.: Nov. 25, 2017; Memphis (John Tate) - 1 gm
RETURNED A PAT FOR TWO POINTS ... ECU: Nov. 28, 2009; vs. Southern Miss (C.J. Wilson) - 103 gmsOPP.: Aug. 30, 2008; Virginia Tech (Stephan Virgil) - 128 gms
PUNTED TEN TIMES OR MORE ... ECU: Sept 15, 2012; vs. Southern Miss (10) - 69 gmsOPP.: Nov. 19, 2015; UCF (10) - 26 gms
PUNTED TWO TIMES OR LESS ... ECU: Nov. 18, 2017; vs. Cincinnati (2) - 2 gmsOPP.: Nov. 25, 2017; Memphis (1) - 1 gm
MISSED A KICKING PAT ... ECU: Nov. 25, 2017; vs. Memphis (Jake Verity) - 1 gmOPP.: Nov. 18, 2017; Cincinnati (Ryan Jones) - 2 gms
KICKED AN ON-SIDE KICK ... ECU: Sept. 9, 2017; vs. West Virginia - 11 gmsOPP.: Oct. 21, 2017; BYU - 5 gms
MISCELLANEOUSHAD NO PENALTIES ... ECU: Dec. 22, 2012; vs. Louisiana-Lafayette - 62 gmsOPP.: Nov. 26, 2016; Temple - 13 gms
HAD ONE PENALTY ... ECU: Nov. 19, 2016; vs. Navy - 14 gmsOPP.: Nov. 9, 2013; Tulsa - 53 gms
HAD 10 OR MORE PENALTIES ... ECU: Oct. 14, 2017; vs. UCF (10) - 6 gmsOPP.: Nov. 18, 2017; Cincinnati (10) - 2 gms
HAD 100 OR MORE PENALTY YARDS ... ECU: Sept. 9, 2017; vs. West Virginia (103) - 11 gmsOPP.: Sept. 30, 2017; USF (102) - 8 gms
HAD A 100-YARD RUSHER AND A 100-YARD RECEIVER IN THE SAME GAME ... ECU: Nov. 19, 2016; vs. Navy (James Summers, 134 rush/Zay Jones, 212 rec.) - 14 gmsOPP.: Nov. 25, 2017; Memphis (Patrick Taylor, 127 rush/Darrell Henderson, 122 rush/ Anthony Miller, 144 rec.) - 1 gm
HAD 35 OR MORE MINUTES OF TIME OF POSSESSION ... ECU: Nov. 25, 2017; vs. Memphis (39:50) - 1 gmOPP.: Oct. 7, 2017; Temple (37:20) - 7 gms
HAD THREE DIFFERENT PLAYERS THROW A TOUCHDOWN IN THE SAME GAME...ECU: Oct. 29, 2016; vs. Connecticut (Zay Jones, 1/Philip Nelson, 1/James Summers, 1) - 17 gms
HAD A PLAYER THROW, RUSH AND CATCH A TOUCHDOWN IN THE SAME GAME...ECU: Oct. 29, 2016; vs. Connecticut (James Summers) - 17 gms
HAD A QUARTERBACK RUSH FOR 100 OR MORE YARDS ...ECU: Sept. 26, 2015; James Summers vs. Virginia Tech (169) - 32 gms
HAD A QUARTERBACK RUSH FOR TWO OR MORE TDS ...ECU: Sept. 30, 2017; Thomas Sirk vs. USF (2) - 8 gms
TURNOVERSHAD SEVEN (7) OR MORE TURNOVERS ... ECU: Sept. 24, 2011; vs. UAB (7, 3 int., 4 fumbles) - 85 gmsOPP.: Dec. 6, 2008; Tulsa (7, 5 int., 2 fumbles) - 116 gms
HAD SIX (6) OR MORE TURNOVERS ... ECU: Sept. 24, 2011; vs. UAB (7, 3 int., 4 fumbles) - 85 gmsOPP.: Dec. 6, 2008; Tulsa (7, 5 int., 2 fumbles) - 116 gms
HAD FIVE (5) OR MORE FUMBLES ... ECU: Nov. 1, 2014; vs. Temple (8) - 42 gmsOPP.: Nov. 23, 2002; TCU (5) - 191 gms
LOST THREE (3) OR MORE FUMBLES ... ECU: Nov. 1, 2014; vs. Temple (5) - 42 gmsOPP.: Sept. 3, 2011; South Carolina (4) - 87 gms
DID NOT COMMIT A TURNOVER ... ECU: Nov. 18, 2017; vs. Cincinnati - 2 gmOPP.: Nov. 25, 2017; Memphis - 1 gm
RETURNED AN INTERCEPTION FOR A TD ... ECU: Oct. 30, 2015; vs. UConn (DaShawn Benton, 32 yds.) - 28 gmsOPP.: Nov. 25, 2017; Memphis (Jonathan Cook, 32 yds.) - 1 gm
RETURNED A FUMBLE FOR A TD ... ECU: Aug. 31, 2013; vs. Old Dominion (Ty Holmes, 26 yds.) - 63 gmsOPP.: Nov. 13, 2014; Cincinnati (Terrell Hartsfi eld, 27 yds.) - 41 gms
SPECIAL TEAMSRETURNED A PUNT FOR A TD ... ECU: Nov. 20, 2004; vs. Memphis (Travis Williams, 69 yds.) - 167 gmsOPP.: Oct. 14, 2017; UCF (Mike Hughes, 66 yds.) - 6 gms
RETURNED A KICKOFF FOR A TD ... ECU: Sept. 1, 2012; vs. App. State (Lance Ray, 90 yds.) - 75 gmsOPP.: Nov. 25, 2017; Memphis (Tony Pollard, 100 yds.) - 1 gm
BLOCKED ONE PUNT ... ECU: Sept. 3, 2016; vs. Western Carolina (Devaris Brunson) - 23 gmsOPP.: Sept. 24, 2016; Virginia Tech (Cam Phillips) - 21 gms
BLOCKED TWO PUNTS ...ECU: Nov. 16, 2002; vs. UAB - 192 gmsOPP.: Oct. 22, 2015; Temple - 29 gms
RETURNED A BLOCKED PUNT FOR A TD ... ECU: Oct. 10, 2015; vs. BYU (Yiannis Bowden, 0 yds.) - 31 gmsOPP.: Nov. 28, 2014; Tulsa (Matt Hickman, 0 yds.) - 39 gms
BLOCKED A FIELD GOAL ... ECU: Oct. 22, 2016; vs. Cincinnati (Justin Brown) - 18 gmsOPP.: Sept. 16, 2017; Virginia Tech (Tim Settle) - 10 gms
RETURNED A BLOCKED FIELD GOAL FOR A TD ... ECU: Sept. 13, 2008; vs. Tulane (Quentin Cotton, 44 yds.) - 126 gmsOPP.: Oct. 10, 2009; SMU (Bryan McCann, 63 yds.) - 109 gms
THE LAST TIME A TEAM ...

2017 ECU Football Final Statistics, Misc...Page 17
PASSINGPASSED FOR 400 OR MORE YARDS ...ECU: Nov. 18, 2017; Gardner Minshew vs. Cincinnati (444) - 2 gmsOPP.: Sept. 24, 2017; Bryant Shirreff s, Connecticut (406) - 9 gms
PASSED FOR 300 OR MORE YARDS ...ECU: Nov. 25, 2017; Gardner Minshew vs. Memphis (351) - 1 gmOPP.: Nov. 4, 2017; D’Eriq King, Houston (330) - 4 gms
PASSED FOR 250 OR MORE YARDS ...ECU: Nov. 25, 2017; Gardner Minshew vs. Memphis (351) - 1 gmOPP.: Nov. 25, 2017; Riley Ferguson, Memphis (299) - 1 gm
PASSED FOR 200 OR MORE YARDS ...ECU: Nov. 25, 2017; Gardner Minshew vs. Memphis (351) - 1 gmOPP.: Nov. 25, 2017; Riley Ferguson, Memphis (299) - 1 gm
ATTEMPTED 50 OR MORE PASSES ...ECU: Nov. 25, 2017; Gardner Minshew vs. Memphis (54) - 1 gmOPP.: Oct. 4, 2014; Garrett Krstich, SMU (67) - 45 gms
ATTEMPTED 40 OR MORE PASSES ...ECU: Nov. 25, 2017; Gardner Minshew vs. Memphis (54) - 1 gmOPP.: Oct. 21, 2017; Taylor Mangum, BYU (41) - 5 gms
ATTEMPTED 35 OR MORE PASSES ...ECU: Nov. 25, 2017; Gardner Minshew vs. Memphis (54) - 1 gmOPP.: Oct. 21, 2017; Taylor Mangum, BYU (41) - 5 gms
COMPLETED 30 OR MORE PASSES ...ECU: Nov. 18, 2017; Gardner Minshew vs. Cincinnati (31) - 2 gmsOPP.: Nov. 28, 2015; Gunner Kiel, Cincinnati (30) - 25 gms
COMPLETED 25 OR MORE PASSES ...ECU: Nov. 25, 2017; Gardner Minshew vs. Memphis (28) - 1 gmOPP.: Oct. 21, 2017; Taylor Mangum, BYU (26) - 5 gms
THREW FIVE (5) OR MORE TD PASSES ...ECU: Sept. 3, 2016; Philip Nelson vs. Western Carolina (5) - 24 gmsOPP.: Sept. 16, 2017; Josh Jackson, Virginia Tech (5) - 10 gms
THREW FOUR (4) OR MORE TD PASSES ...ECU: Nov. 18, 2017; Gardner Minshew vs. Cincinnati (4) - 2 gmsOPP.: Sept. 16, 2017; Josh Jackson, Virginia Tech (5) - 10 gms
THREW THREE (3) OR MORE TD PASSES ...ECU: Nov. 18, 2017; Gardner Minshew vs. Cincinnati (4) - 2 gmsOPP.: Nov. 25, 2017; Riley Ferguson, Memphis (3) - 1 gm
THREW FIVE (5) OR MORE INTERCEPTIONS ... ECU: Oct. 29, 1992; Michael Anderson vs. Southern Miss (5) - 308 gmsOPP.: Dec. 6, 2008; David Johnson, Tulsa (5) - 106 gms
THREW FOUR (4) OR MORE INTERCEPTIONS ...ECU: Nov. 20, 2004; James Pinkney vs. Memphis (4) - 167 gmsOPP.: Dec. 6, 2008; David Johnson, Tulsa (5) - 106 gms
RUSHINGRUSHED 35 OR MORE TIMES ... ECU: Sept. 28, 2013; Vintavious Cooper vs. North Carolina (35) - 59 gmsOPP.: Oct. 22, 2005; DeAngelo Williams, Memphis (39) - 160 gms
RUSHED 30 OR MORE TIMES ... ECU: Sept. 28, 2013; Vintavious Cooper vs. North Carolina (35) - 59 gmsOPP.: Nov. 26, 2010; Zach Line, SMU (30) - 89 gms
RUSHED 25 OR MORE TIMES ... ECU: Dec. 23, 2013; Vintavious Cooper vs. Ohio (25) - 50 gmsOPP.: Nov. 11, 2017; Dontrell Hilliard, Tulane (28) - 3 gms
RUSHED FOR 300 OR MORE YARDS ... ECU: Nov. 3, 2007; Chris Johnson vs. Memphis (301) - 132 gmsOPP.: Sept. 4, 2004; Kay-Jay Harris, West Virginia (337) - 176 gms
RUSHED FOR 250 OR MORE YARDS ... ECU: Nov. 3, 2007; Chris Johnson vs. Memphis (301) - 132 gmsOPP.: Sept. 2, 2017; Cardon Johnson, James Madison (265) - 12 gms
RUSHED FOR 200 OR MORE YARDS ... ECU: Sept. 20, 2014; Breon Allen vs. North Carolina (211) - 46 gmsOPP.: Sept. 2, 2017; Cardon Johnson, James Madison (265) - 12 gms
RUSHED FOR 150 OR MORE YARDS ... ECU: Sept. 26, 2015; James Summers vs. Virginia Tech (169) - 33 gmsOPP.: Nov. 11, 2017; Dontrell Hilliard, Tulane (189) - 3 gms
RUSHED FOR 100 OR MORE YARDS ...ECU: Nov. 11, 2017; Hussein Howe vs. Tulane (108) - 3 gmsOPP.: Nov. 25, 2017; Patrick Taylor (127) & Darrell Henderson (122), Memphis - 1 gm
RUSHED FOR FOUR OR MORE TDS ... ECU: Sept. 5, 2015; Chris Hairston vs. Towson (4) - 36 gmsOPP.: Nov. 19, 2016; Will Worth (4), Navy - 14 gms
RUSHED FOR THREE OR MORE TDS ... ECU: Sept. 5, 2015; Chris Hairston vs. Towson (4) - 36 gmsOPP.: Nov. 19, 2016; Will Worth (4) and Shawn White (3), Navy - 14 gms
RUSHED FOR TWO OR MORE TDS ...ECU: Sept. 30, 2017; Thomas Sirk vs. USF (2) - 8 gmsOPP.: Nov. 25, 2017; Patrick Taylor (2) & Darrell Henderson (2), Memphis - 1 gm
HAD A RUN OF 80 OR MORE YARDS ...ECU: Nov. 19, 2016; James Summers vs. Navy (81) - 14 gmsOPP.: Sept. 2, 2017; Cardon Johnson, James Madison (80) - 12 gms
HAD A RUN OF 70 OR MORE YARDS ...ECU: Nov. 19, 2016; James Summers vs. Navy (81) - 14 gmsOPP.: Sept. 30, 2017; Marquez Valdes-Scantling, USF (75) - 8 gms
HAD A RUN OF 60 OR MORE YARDS ...ECU: Nov. 19, 2016; James Summers vs. Navy (81) - 14 gmsOPP.: Nov. 25, 2017; Patrick Taylor, Memphis (60) - 1 gm
HAD A RUN OF 50 OR MORE YARDS ...ECU: Oct. 14, 2017; Darrius Pinnix vs. UCF (57) - 6 gmsOPP.: Nov. 25, 2017; Patrick Taylor, Memphis (60) - 1 gm
THE LAST TIME AN INDIVIDUAL ...

2017 ECU Football Final Statistics, Misc...Page 18
HAD 100 OR MORE YARDS RECEIVING ...ECU: Nov. 25, 2017; Trevon Brown vs. Memphis (128) - 1 gmOPP.: Nov. 25, 2017; Anthony Miller, Memphis (144) - 1 gm
CAUGHT THREE (3) OR MORE TD PASSES ... ECU: Sept. 24, 2017; Davon Grayson vs. Connecticut (3) - 9 gmsOPP.: Sept. 16, 2017; Cam Phillips, Virginia Tech (3) - 10 gms
CAUGHT TWO (2) OR MORE TD PASSES ... ECU: Nov. 18, 2017; Trevon Brown vs. Cincinnati (2) - 2 gmsOPP.: Sept. 27, 2017; Mason Donaldson, Connecticut (2) - 10 gms
TOTAL OFFENSEHAD 400 OR MORE YARDS OF TOTAL OFFENSE ... ECU: Nov. 18, 2017; Gardner Minshew vs. Cincinnati (449) - 2 gmsOPP.: Sept. 24, 2017; Bryant Shirreff s, Connecticut (424) - 9 gms
HAD 350 OR MORE YARDS OF TOTAL OFFENSE ...ECU: Nov. 18, 2017; Gardner Minshew vs. Cincinnati (449) - 2 gmsOPP.: Sept. 24, 2017; Bryant Shirreff s, Connecticut (424) - 9 gms
HAD 300 OR MORE YARDS OF TOTAL OFFENSE ...ECU: Nov. 25, 2017; Gardner Minshew vs. Memphis (344) - 1 gmOPP.: Nov. 25, 2017; Riley Ferguson, Memphis (313) - 1 gms
HAD 250 OR MORE YARDS OF TOTAL OFFENSE ...ECU: Nov. 25, 2017; Gardner Minshew vs. Memphis (344) - 1 gmOPP.: Nov. 25, 2017; Riley Ferguson, Memphis (313) - 1 gms HAD A QUARTERBACK PASS AND RUN FOR OVER 100 YARDS IN THE SAME GAME ...ECU: Sept. 26, 2015; James Summers, Virgina Tech (110 pass, 169 rush) - 32 gmsOPP.: Nov. 19, 2016; Will Worth, Navy (113 pass, 159 rush) - 14 gms
SCORINGACCOUNTED FOR FOUR (4) OR MORE TDS ...ECU: Nov. 18, 2017; Gardner Minshew vs. Cincinnati (4 pass) - 2 gmsOPP.: Nov. 4, 2017; D’Eriq King, Houston (3 pass, 1 rush) - 4 gms
ACCOUNTED FOR THREE (3) OR MORE TDS ...ECU: Nov. 18, 2017; Gardner Minshew vs. Cincinnati (4 pass) - 2 gmsOPP.: Nov. 18, 2017; Hayden Moore, Cincinnati (3 pass) - 2 gms
SCORED FOUR (4) OR MORE TDS ... ECU: Sept. 5, 2015; Chris Hairston vs. Towson (4 rush) - 36 gmsOPP.: Nov. 19, 2016; Will Worth, Navy (4 rush) - 14 gms
SCORED THREE (3) OR MORE TDS ...ECU: Sept. 24, 2017; Davon Grayson vs. Connecticut (3 rcv) - 9 gmsOPP.: Sept. 16, 2017; Cam Phillips, Virginia Tech (3 rcv) - 10 gms
SCORED TWO (2) OR MORE TDS ...ECU: Nov. 18, 2017; Trevon Brown vs. Cincinnati (2 rcv) - 2 gmsOPP.: Nov. 25, 2017; Patrick Taylor (2 rush) and Darrell Henderson (2 rush), Memphis - 1 gm
THREW THREE (3) OR MORE INTERCEPTIONS ... ECU: Nov. 25, 2017; Gardner Minshew vs. Memphis (3) - 1 gmOPP.: Nov. 13, 2014; Gunner Kiel, Cincinnati (3) - 41 gms
COMPLETED A PASS FOR 90 OR MORE YARDS ... ECU: Nov. 18, 2017; Gardner Minshew vs. Cincinnati (95) - 2 gmsOPP.: Oct. 10, 2009; Bo Levi Mitchell, SMU (96) - 109 gms
COMPLETED A PASS FOR 80 OR MORE YARDS ...ECU: Nov. 18, 2017; Gardner Minshew vs. Cincinnati (95) - 2 gmsOPP.: Nov. 25, 2017; Riley Ferguson, Memphis (89) - 1 gm
COMPLETED A PASS FOR 70 OR MORE YARDS ... ECU: Nov. 18, 2017; Gardner Minshew vs. Cincinnati (95) - 2 gmsOPP.: Nov. 25, 2017; Riley Ferguson, Memphis (89) - 1 gm
COMPLETED A PASS FOR 60 OR MORE YARDS ...ECU: Nov. 18, 2017; Gardner Minshew vs. Cincinnati (95) - 2 gmsOPP.: Nov. 25, 2017; Riley Ferguson, Memphis (89) - 1 gm
COMPLETED A PASS FOR 50 OR MORE YARDS ... ECU: Nov. 18, 2017; Gardner Minshew vs. Cincinnati (95) - 2 gmsOPP.: Nov. 25, 2017; Riley Ferguson, Memphis (89) - 1 gm
RECEIVINGHAD TWO RECEIVERS CATCH 10 OR MORE PASSES ...ECU: Nov. 4, 2017; Quay Johnson (14) and Trevon Brown (11) vs. Houston - 4 gmsOPP.: Dec. 5, 2009; James Cleveland (19) and Tyron Carrier (11), Houston - 101 gms
CAUGHT 10 OR MORE PASSES ...ECU: Nov. 4, 2017; Quay Johnson (14) and Trevon Brown (11) vs. Houston - 4 gmsOPP.: Sept. 16, 2017; Cam Phillips, Virginia Tech (14) - 10 gms
CAUGHT SEVEN (7) OR MORE PASSES ...ECU: Nov. 25, 2017; Trevon Brown vs. Memphis (7) - 1 gmOPP.: Nov. 4, 2017; Linell Bonner, Houston (7) - 4 gms
HAD 200 OR MORE YARDS RECEIVING ...ECU: Nov. 18, 2017; Trevon Brown vs. Cincinnati (270) - 2 gmsOPP.: Dec. 5, 2009; James Cleveland, Houston (241) - 105 gms
HAD 175 OR MORE YARDS RECEIVING ...ECU: Nov. 18, 2017; Trevon Brown vs. Cincinnati (270) - 2 gmsOPP.: Sept. 16, 2017; Cam Phillips, Virginia Tech (187) - 10 gms
HAD 150 OR MORE YARDS RECEIVING ... ECU: Nov. 18, 2017; Trevon Brown vs. Cincinnati (270) - 2 gmsOPP.: Nov. 4, 2017; Steven Dunbar, Houston (171) - 4 gms
HAD 125 OR MORE YARDS RECEIVING ...ECU: Nov. 25, 2017; Trevon Brown vs. Memphis (128) - 1 gmOPP.: Nov. 25, 2017; Anthony Miller, Memphis (144) - 1 gm
THE LAST TIME AN INDIVIDUAL ...

2017 ECU Football Final Statistics, Misc...Page 19
DEFENSEINTERCEPTED THREE (3) OR MORE PASSES ...ECU: Sept. 21, 1991; Greg Grandison vs. UCF (3) - 325 gmsOPP.: Nov. 6, 2004; Will Gulley, Houston (3) - 169 gms
INTERCEPTED TWO (2) OR MORE PASSES ...ECU: Nov. 13, 2014; Lamar Ivey vs. Cincinnati (2) - 41 gmsOPP.: Sept. 2, 2017; Rashad Robinson, James Madison (2) - 12 gms
RECOVERED TWO (2) OR MORE FUMBLES ...ECU: Nov. 19, 2006; Marcus Hands vs. Marshall (2) - 145 gmsOPP.: Nov. 1, 2014; Will Hayes, Temple (2) - 42 gms
RECORDED FOUR (4.0) OR MORE SACKS ...ECU: Oct. 2, 2015; Montese Overton vs. SMU (4.0) - 32 gms OPP.: Nov. 18, 2000; James Davis, West Virginia (4.0) - 222 gms
RECORDED THREE (3.0) OR MORE SACKS ...ECU: Oct. 2, 2015; Montese Overton vs. SMU (4.0) - 32 gmsOPP.: Sept. 12, 2015; Joey Ivie, Florida (3.0) - 35 gms
RECORDED TWO (2.0) OR MORE SACKS ...ECU: Oct. 10, 2015; Montese Overton vs. BYU (2.0) - 31 gmsOPP.: Oct. 7, 2017; Jacob Martin, Temple (2.0) - 7 gms
RECORDED FOUR (4.0) OR MORE TACKLES FOR LOSS ...ECU: Oct. 2, 2015; Montese Overton vs. SMU (5.0) - 32 gmsOPP.: Sept. 10, 2016; Airius Moore, NC State (4.5) - 23 gms
RECORDED THREE (3.0) OR MORE TACKLES FOR LOSS ...ECU: Oct. 29, 2016; Dayon Pratt vs. Connecticut (3.0) - 17 gmsOPP.: Oct. 1, 2016; Mark Rucker, UCF (3.0) - 20 gms
SPECIAL TEAMSSCORED 12 OR MORE POINTS KICKING ...ECU: Nov. 18, 2017; Jake Verity vs. Cincinnati (12) - 2 gmsOPP.: Sept. 30, 2017; Emili Nadelman, USF (13) - 8 gms
MADE FOUR (4) OR MORE FIELD GOALS ...ECU: Oct. 21, 2017; Jake Verity vs. BYU (4) - 5 gmsOPP.: Dec. 4, 2014; Shawn Moffi tt, UCF (4) - 38 gms
MADE THREE (3) OR MORE FIELD GOALS ... ECU: Oct. 21, 2017; Jake Verity vs. BYU (4) - 5 gmsOPP.: Dec. 4, 2014; Shawn Moffi tt, UCF (4) - 38 gms
KICKED A FIELD GOAL OF 50 OR MORE YARDS ...ECU: Nov. 18, 2017; Jake Verity vs. Cincinnati (50) - 2 gmsOPP.: Nov. 28, 2015; Andrew Gantz, Cincinnati (50) - 25 gms
PUNTED 70 OR MORE YARDS ... ECU: Nov. 7, 2015; Worth Gregory vs. USF (73) - 27 gmsOPP.: Oct. 1, 2016; Caleb Houston, UCF (70) - 20 gms
PUNTED 60 OR MORE YARDS ... ECU: Nov. 18, 2017; Austin Barnes vs. Cincinnati (63, 62) - 2 gmsOPP.: Oct. 1, 2016; Caleb Houston, UCF (70) - 20 gms
THE LAST TIME AN INDIVIDUAL ...TOTALED 150 OR MORE YARDS IN KICK RETURNS ... ECU: Nov. 25, 2017; Trevon Brown vs. Memphis (187) - 1 gmOPP.: Nov. 19, 2015; Tristan Payton, UCF (152) - 24 gms
TOTALED 100 OR MORE YARDS IN KICKOFF RETURNS ... ECU: Nov. 25, 2017; Trevon Brown vs. Memphis (187) - 1 gmOPP.: Nov. 25, 2017; Tony Pollard, Memphis (100) - 1 gm
RETURNED A KICKOFF AND PUNT FOR A TD IN SAME GAME ... ECU: Oct. 27, 1990; Dion Johnson vs. Temple (53 punt, 90 kickoff ) - 325 gmsOPP.: None since 1965 - 606 gms
RETURNED A KICKOFF 90 OR MORE YARDSECU: Sept. 1, 2012; Lance Ray vs. Appalachian State (90) - 75 gmsOPP.: Nov. 25, 2017; Tony Pollard, Memphis (100) - 1 gm
HAD 100 OR MORE PUNT RETURN YARDSECU: Oct. 19, 2013; Justin Hardy vs. Southern Miss (105) - 56 gmsOPP.: Oct. 14, 2017; Mike Hughes, UCF (118) - 6 gms
HAD A PUNT RETURN OF 75 OR MORE YARDSECU: Oct. 5, 2002; Terrance Copper vs. Army (76) - 195 gmsOPP.: Sept. 24, 2016; Greg Stroman, Virginia Tech (87) - 21 gms
HAD A PUNT RETURN OF 50 OR MORE YARDSECU: Oct. 19, 2013; Justin Hardy vs. Southern Miss (66) - 56 gmsOPP.: Oct. 14, 2017; Mike Hughes, UCF (66) - 6 gms

2017 ECU Football Final Statistics, Misc...Page 20
THE LAST TIME A PIRATE TEAM ...
IN ONE QUARTER ...PASSED FOR 75 YARDS OR MORENov. 25, 2017; vs. Memphis (97-2nd, 134-3rd) - 1 gmPASSED FOR 100 YARDS OR MORENov. 25, 2017; vs. Memphis (134-3rd) - 1 gmPASSED FOR 175 YARDS OR MORENov. 18, 2017; vs. Cincinnati (175-3rd) - 2 gmsPASSED FOR 200 YARDS OR MORENov. 5, 2016; vs. Tulsa (211-4th) - 16 gmsPASSED FOR TWO TDS OR MORENov. 25, 2017; vs. Memphis (2-3rd) - 1 gmRUSHED FOR 75 YARDS OR MORENov. 19, 2016; vs. Navy (78-3rd) - 14 gmsRUSHED FOR 100 YARDS OR MOREOct. 30, 2015; vs. UConn (108-4th) - 28 gmsRUSHED FOR TWO TDS OR MOREOct. 3, 2015; vs. SMU (2-2nd) - 32 gmsHAD THREE RECEIVERS CATCH THREE PASSES EACHNov. 4, 2017; vs. Houston (5-2nd) - 4 gmsHAD SEVEN RECEIVERS CATCH ONE PASSNov. 18, 2017; vs. Cincinnati (8-1st) - 2 gms
IN ONE HALF ...PASSED FOR 175 YARDS OR MORENov. 25, 2017; vs. Memphis (185-2nd) - 1 gmPASSED FOR 200 YARDS OR MORENov. 18, 2017; vs. Cincinnati (239-1st, 225-2nd) - 2 gmsPASSED FOR 225 YARDS OR MORE Nov. 18, 2017; vs. Cincinnati (239-1st, 225-2nd) - 2 gmsPASSED FOR 250 YARDS OR MORE Nov. 5, 2016; vs. Tulsa (331-2nd) - 15 gmsPASSED FOR 275 YARDS OR MORE Nov. 5, 2016; vs. Tulsa (331-2nd) - 15 gmsPASSED FOR 300 YARDS OR MORE Nov. 5, 2016; vs. Tulsa (331-2nd) - 15 gmsPASSED FOR THREE OR MORE TDS Nov. 18, 2017; vs. Cincinnati (3-2nd) - 2 gmsPASSED FOR TWO OR MORE TDSNov. 25, 2017; vs. Memphis (2-2nd) - 1 gmRUSHED FOR 150 YARDS OR MORE Sept. 3, 2016; vs. Western Carolina (151-1st) - 24 gmsRUSHED FOR 200 YARDS OR MORESept. 20, 2014; vs. North Carolina (222-2nd) - 45 gmsRUSHED FOR 250 YARDS OR MORE Dec. 23, 2007; vs. Boise St. (264-1st) - 129 gmsRUSHED FOR TWO TDS OR MORE Nov. 12, 2016; vs. SMU (2-1st) - 15 gms
THE LAST TIME A PIRATE PLAYER ...
IN ONE QUARTER ...PASSED FOR 75 YARDS OR MORENov. 25, 2017; Gardner Minshew vs. Memphis (97-2nd, 134-3rd) - 1 gmPASSED FOR 100 YARDS OR MORENov. 25, 2017; Gardner Minshew vs. Memphis (134-3rd) - 1 gmPASSED FOR 175 YARDS OR MORENov. 18, 2017; Gardner Minshew vs. Cincinnati (175-3rd) - 2 gmsPASSED FOR 200 YARDS OR MORENov. 5, 2016; Gardner Minshew vs. Tulsa (211-4th) - 16 gmsRUSHED FOR 75 YARDS OR MORENov. 19, 2016; James Summers vs. Navy (78-3rd) - 14 gmsRUSHED FOR 100 YARDS OR MORESept. 20, 2014; Breon Allen vs. North Carolina (110-3rd) - 456 gmsRUSHED FOR TWO TDS OR MORESept. 5, 2015; Chris Hairston vs. Towson (2-1st) - 36 gmsCAUGHT THREE OR MORE PASSES Nov. 25, 2017; Trevon Brown (3-2nd) and Tahj Deans (3-3rd) vs. Memphis - 1 gmCAUGHT FOUR OR MORE PASSESNov. 11, 2017; Trevon Brown vs. Tulane (4-2nd) - 3 gmsCAUGHT TWO OR MORE TD PASSESSept. 24, 2017; Davon Grayson vs. Connecticut (2-1st) - 9 gmsATTEMPTED THREE OR MORE FIELD GOALSOct. 21, 2017; Jake Verity vs. BYU (3-3rd) - 5 gms
IN ONE HALF ...PASSED FOR 175 YARDS OR MORE Nov. 25, 2017; Gardner Minshew vs. Memphis (185-2nd) - 1 gmPASSED FOR 200 YARDS OR MORENov. 18, 2017; Gardner Minshew vs. Cincinnati (239-1st, 205-2nd) - 2 gmsPASSED FOR 225 YARDS OR MORENov. 18, 2017; Gardner Minshew vs. Cincinnati (239-1st) - 2 gmsRUSHED FOR 100 YARDS OR MORESept. 26, 2015; James Summers vs. Virginia Tech (111-2nd) - 33 gmsRUSHED FOR 150 YARDS OR MORENov. 15, 2009; Dominique Lindsay vs. Tulsa (150-1st) - 105 gmsRUSHED FOR THREE TDS OR MORE Oct. 22, 2011; Reggie Bullock vs. Navy (3-2nd) - 82 gmsRUSHED FOR TWO TDS OR MORESept. 5, 2015; Chris Hairston vs. Towson (2-1st, 2-2nd) - 35 gmsPASSED FOR THREE OR MORE TDSSept. 3, 2016; Philip Nelson vs. Western Carolina (3-1st) - 24 gmsCAUGHT EIGHT OR MORE PASSES Nov. 19, 2016; Zay Jones vs. Navy (10-1st) - 14 gmsCAUGHT SIX OR MORE PASSESNov. 4, 2017; Trevon Brown (6-2nd), Quay Johnson (7-1st, 7-2nd) and JimmyWilliams (7-1st) vs. Houston - 4 gmsHAD 100 YARDS RECEIVING Nov. 18, 2017; Trevon Brown vs. Cincinnati (181-2nd) - 2 gmsCAUGHT TWO OR MORE TD PASSESNov. 18, 2017; Trevon Brown vs. Cincinnati (2-2nd) - 2 gmsMADE THREE OR MORE FIELD GOALSOct. 21, 2017; Jake Verity vs. BYU (3-2nd) - 5 gms
IN A QUARTER, IN A HALF ...

2017 ECU Football Final Statistics, Misc...Page 21
ECU FOOTBALL (1932-2017)<All-Time Top Ten Off ense Lists>
Most Points Scored By ECU1. 74 vs. Newport News ......................November 14, 19592. 70 vs. North Carolina ..................... September 20, 20143. 67 vs. Edenton Flyers ...........................October 28, 19494. 66 vs. East Tennessee State ...............November 7, 19815. 65 vs. Marshall .................................November 23, 20126 63 vs. UAB ......................................... November 16, 20137. 62 vs. Houston ................................ November 11, 20008. 61 vs. Marshall* ................................ December 19, 2001 61 at Virginia ......................................November 8, 197510. 59 vs. Army ........................................... October 5, 2002
Most Points Scored By An Opponent1. 79 by Guilford ................................... November 12, 19322. 76 by Navy .........................................November 6, 20103. 70 by Memphis ....................... November 25, 20174. 66 by Navy ............................. November 19, 20165. 65 by Southern Miss ..............................October 5, 19686. 64 by Virginia Tech ..................September 16, 2017 64 by Marshall* ................................ December 19, 2001 64 by Appalachian State ................. November 18, 19399. 63 by UCF ...................................October 14, 2017 63 by Louisville ................................November 14, 1998 63 by Florida State .........................September 20, 1980
Most Total Yards By ECU1. 789 vs. North Carolina ..................... September 20, 20142. 699 at Virginia ......................................November 8, 19753. 688 vs. Western Carolina .............September 3, 20164. 649 vs. Tulane ........................................October 23, 19995. 641 at Memphis ..................................November 3, 20076. 640 vs. NC State (at Charlotte) ............ November 30, 19967. 625 vs. UAB ......................................... November 16, 20138. 622 at UCF ...........................................November 19, 20159. 621 at South Carolina ..............................October 8, 199410. 608 vs. Cincinnati ....................................October 10, 1987
Most Total Yards By An Opponent1. 769 by Louisville ................................November 14, 19982. 706 by Florida State ............................... October 16, 19823. 675 by Virginia Tech ..................September 16, 20174. 649 by Marshall* ................................ December 19, 20015. 645 by Georgia Southern ................ September 22, 19846. 639 by Rice ........................................November 20, 20107. 635 by Memphis ....................... November 25, 20178. 634 by Syracuse ................................. September 5, 19929. 633 by Marshall ..................................November 23, 2012 10. 626 by South Carolina ........................... October 13, 1990*GMAC Bowl (Mobile, Ala.)
Most Rushing Yards By ECU1. 642 at Virginia ......................................November 8, 19752. 604 at William & Mary .......................November 24, 19793. 500 vs. Cincinnati ....................................October 10, 19874. 498 vs. Richmond ..............................November 10, 19795. 491 at Memphis ..................................November 3, 2007 491 vs. Southern Illinois .......................... October 9, 19767. 486 vs. William & Mary ...................... November 12, 19838. 450 at Appalachian State ....................November 3, 19799. 447 vs. The Citadel ..................................October 13, 197910. 437 vs. VMI ....................................... September 29, 1979
Most Rushing Yards By An Opponent1. 536 by West Virginia ...................... September 28, 20022. 521 by Navy .........................................November 6, 20103. 512 by Navy ............................................ October 27, 20124. 480 by Navy ............................. November 19, 20165. 478 by West Virginia ........................ September 4, 20046. 454 by Miami ....................................... November 8, 19807. 426 by Bowling Green ...................... September 25, 19718. 421 by Syracuse ................................. September 5, 19929. 415 by South Carolina ........................... October 13, 1990 415 by Navy .......................................September 19, 2015
Most Passing Yards By ECU1. 521 vs. Syracuse ................................. September 5, 19922. 488 vs. UCF ................................... October 1, 20163. 480 at Tulane ...........................................October 12, 20134. 473 at UCF ...........................................November 19, 20155. 468 at Houston .......................... November 4, 20176. 464 vs. Cincinnati ...................... November 18, 20177. 447 vs. Old Dominion .............................. August 31, 20138. 446 vs. North Carolina ..................... September 20, 20149. 445 vs. Connecticut ................................October 23, 201410. 440 at Houston ................................... November 9, 2002
Most Passing Yards By An Opponent1. 615 by Louisville ................................November 14, 19982. 576 by Marshall* ................................ December 19, 20013. 527 by Houston ...................................December 5, 20094. 456 by UTEP ............................................October 13, 2007 456 by Florida State ............................... October 16, 19826. 454 by UAB ........................................November 16, 20027. 451 by South Carolina .............................October 8, 19948. 436 by Cincinnati ............................... November 13, 20149. 425 by South Carolina ........................... October 24, 199710. 419 by Marshall ..................................November 23, 2012*GMAC Bowl (Mobile, Ala.), bold denotes Scottie Montgomery era

2017 ECU Football Final Statistics, Misc...Page 22
ECU FOOTBALL (1932-2017)<All-Time Top Ten Defense Lists>
Fewest Points By ECU (most recent)
1. 0 at Syracuse ........................................October 4, 1997 0 vs. South Carolina ..................... September 20, 1997 0 at Illinois .................................... September 23, 1995 0 vs. Illinois* ...................................December 30, 1994 0 at Washington .......................... September 25, 1993 0 at South Carolina ....................... September 17, 1988 0 at West Virginia ................................ October 3, 1987 0 at Auburn .................................. September 20, 1986 0 at Southern Miss .......................... November 2, 1985 0 vs. Temple ................................... September 8, 1984*St. Jude Liberty Bowl (Memphis, Tenn.); ECU has been shutout 59 times in history
Fewest Points By An Opponent (most recent)
1. 0 by Duke....................................... September 2, 2000 0 by UT-Chattanooga ....................September 12, 1998 0 by Illinois State ............................... October 23, 1982 0 by East Tennessee State ............ September 18, 1982 0 by Marshall .................................. November 18, 1978 0 by Southern Illinois .......................... October 8, 1977 0 by Southern Miss ........................September 11, 1976 0 by The Citadel ...................................October 11, 1975 0 by William & Mary .................... September 20, 1975 0 by The Citadel ................................. October 20, 1973 0 by Davidson ...................................... October 6, 1973ECU has shutout its opponent 64 times in history
Fewest Total Yards By ECU1. 12 at Southern Miss ...............................October 5, 19682. 93 vs. South Carolina ..................... September 20, 19973. 102 at Florida State..........................September 20, 19804. 103 at Washington .......................... September 25, 19935. 112 vs. Virginia Tech ..........................September 10, 20116. 115 at South Carolina ............................ October 13, 19907. 125 at North Carolina.............................October 25, 19808. 129 at Southern Illinois .........................October 25, 19699. 140 vs. NC State (at Charlotte) ............November 27, 2004 140 at Southern Miss .......................... November 2, 1985
Fewest Total Yards By An Opponent1. 41 by Catawba ................................September 12, 19642. 44 by Southern Illinois ................... September 16, 19723. 74 by Presbyterian .................................October 5, 19634. 79 by Furman .....................................November 1, 19695. 85 by Furman ......................................... October 1, 19666. 96 by The Citadel ................................. October 20, 19737. 111 by The Citadel .................................October 23, 19658. 112 by Elon ..............................................October 12, 19639. 119 by Marshall .................................. November 18, 197810. 127 by NC State .......................................October 23, 1971
Fewest Rushing Yards By ECU1. -16 vs. TCU* ........................................December 22, 19992. -15 vs. Virginia Tech ..........................September 10, 20113. -13 at Florida .................................... September 12, 20154. -4 at Richmond ....................................October 24, 19705. -3 at Southern Miss ............................October 23, 20046. 1 at West Virginia .........................November 18, 20007. 4 vs. South Carolina ..................... September 20, 1997 4 at Washington .......................... September 25, 19939. 9 at UAB ...........................................November 6, 199910. 11 vs. Cincinnati ........................... September 25, 2004*Mobile Alabama Bowl (Mobile, Ala.)
Fewest Rushing Yards By An Opponent1. -12 by Davidson ...................................... October 6, 19732. -7 by Southern Illinois ................... September 16, 19723. 2 by Duke........................................September 6, 19804. 5 by Furman ......................................... October 1, 19665. 8 by Western Carolina .................... September 1, 19796. 9 by Tulane ......................................November 17, 20127. 11 by Furman ....................................... October 28, 19728. 12 by Louisiana Tech* .......................December 16, 1978 12 by Furman ..................................September 29, 197310. 13 by Catawba ................................September 12, 1964*Independence Bowl (Shreveport, La.)
Fewest Passing Yards By ECU1. 0 at Appalachian State .......................October 19, 1974 0 vs. Southern Illinois ...................September 28, 1974 0 vs. Bowling Green ...................... September 14, 1974 0 at Lenoir-Rhyne ........................... November 3, 19625. 7 at Florida State..........................September 20, 19806. 8 at Southern Miss .......................... November 2, 19857. 8 at NC State .................................. November 22, 19808. 9 vs. William & Mary ........................November 1, 19809. 15 at Furman .................................... November 13, 197610. 18 at North Carolina.........................September 12, 1981
Fewest Passing Yards By An Opponent1. 0 by Furman .....................................November 1, 19692. 6 by Navy ....................................... September 2, 20063. 10 by Ohio .......................................September 19, 19984. 11 by NC State .................................. September 8, 1979 11 by William & Mary ....................... November 11, 19786. 16 by Eastern Kentucky .................. November 24, 19627. 17 by Louisiana-Monroe ................ September 24, 19668. 24 by UAB ............................................. October 10, 19989. 26 by N.C. State ............................... September 18, 197610. 26 by Elon ..............................................October 12, 1963
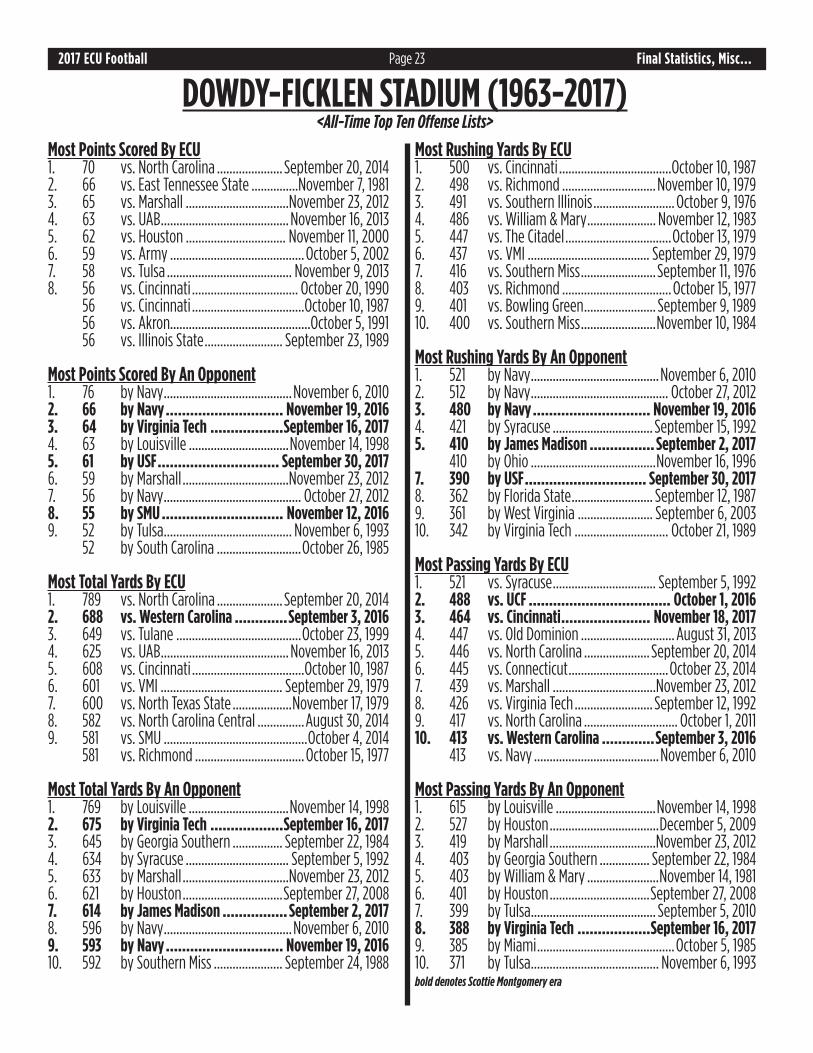
2017 ECU Football Final Statistics, Misc...Page 23
DOWDY-FICKLEN STADIUM (1963-2017)<All-Time Top Ten Off ense Lists>
Most Points Scored By ECU1. 70 vs. North Carolina ..................... September 20, 20142. 66 vs. East Tennessee State ...............November 7, 19813. 65 vs. Marshall .................................November 23, 20124. 63 vs. UAB ......................................... November 16, 20135. 62 vs. Houston ................................ November 11, 20006. 59 vs. Army ........................................... October 5, 20027. 58 vs. Tulsa ........................................ November 9, 20138. 56 vs. Cincinnati .................................. October 20, 1990 56 vs. Cincinnati ....................................October 10, 1987 56 vs. Akron.............................................October 5, 1991 56 vs. Illinois State ......................... September 23, 1989
Most Points Scored By An Opponent1. 76 by Navy .........................................November 6, 2010 2. 66 by Navy ............................. November 19, 20163. 64 by Virginia Tech ..................September 16, 20174. 63 by Louisville ................................November 14, 19985. 61 by USF .............................. September 30, 20176. 59 by Marshall ..................................November 23, 20127. 56 by Navy ............................................ October 27, 20128. 55 by SMU .............................. November 12, 20169. 52 by Tulsa ......................................... November 6, 1993 52 by South Carolina ...........................October 26, 1985
Most Total Yards By ECU1. 789 vs. North Carolina ..................... September 20, 20142. 688 vs. Western Carolina .............September 3, 20163. 649 vs. Tulane ........................................October 23, 19994. 625 vs. UAB ......................................... November 16, 20135. 608 vs. Cincinnati ....................................October 10, 19876. 601 vs. VMI ....................................... September 29, 19797. 600 vs. North Texas State ...................November 17, 19798. 582 vs. North Carolina Central ...............August 30, 20149. 581 vs. SMU ..............................................October 4, 2014 581 vs. Richmond ................................... October 15, 1977
Most Total Yards By An Opponent1. 769 by Louisville ................................November 14, 19982. 675 by Virginia Tech ..................September 16, 20173. 645 by Georgia Southern ................ September 22, 19844. 634 by Syracuse ................................. September 5, 19925. 633 by Marshall ..................................November 23, 20126. 621 by Houston ................................September 27, 20087. 614 by James Madison ................ September 2, 20178. 596 by Navy .........................................November 6, 20109. 593 by Navy ............................. November 19, 201610. 592 by Southern Miss ...................... September 24, 1988
Most Rushing Yards By ECU1. 500 vs. Cincinnati ....................................October 10, 19872. 498 vs. Richmond ..............................November 10, 19793. 491 vs. Southern Illinois .......................... October 9, 19764. 486 vs. William & Mary ...................... November 12, 19835. 447 vs. The Citadel ..................................October 13, 19796. 437 vs. VMI ....................................... September 29, 19797. 416 vs. Southern Miss ........................September 11, 19768. 403 vs. Richmond ................................... October 15, 19779. 401 vs. Bowling Green ....................... September 9, 198910. 400 vs. Southern Miss ........................November 10, 1984
Most Rushing Yards By An Opponent1. 521 by Navy .........................................November 6, 20102. 512 by Navy ............................................ October 27, 20123. 480 by Navy ............................. November 19, 20164. 421 by Syracuse ................................ September 15, 19925. 410 by James Madison ................ September 2, 2017 410 by Ohio ........................................November 16, 19967. 390 by USF .............................. September 30, 20178. 362 by Florida State .......................... September 12, 19879. 361 by West Virginia ........................ September 6, 200310. 342 by Virginia Tech .............................. October 21, 1989
Most Passing Yards By ECU1. 521 vs. Syracuse ................................. September 5, 19922. 488 vs. UCF ................................... October 1, 20163. 464 vs. Cincinnati ...................... November 18, 20174. 447 vs. Old Dominion .............................. August 31, 20135. 446 vs. North Carolina ..................... September 20, 20146. 445 vs. Connecticut ................................October 23, 20147. 439 vs. Marshall .................................November 23, 20128. 426 vs. Virginia Tech ......................... September 12, 19929. 417 vs. North Carolina .............................. October 1, 201110. 413 vs. Western Carolina .............September 3, 2016 413 vs. Navy ........................................November 6, 2010
Most Passing Yards By An Opponent1. 615 by Louisville ................................November 14, 19982. 527 by Houston ...................................December 5, 20093. 419 by Marshall ..................................November 23, 20124. 403 by Georgia Southern ................ September 22, 19845. 403 by William & Mary .......................November 14, 19816. 401 by Houston ................................September 27, 20087. 399 by Tulsa ........................................ September 5, 20108. 388 by Virginia Tech ..................September 16, 20179. 385 by Miami ............................................October 5, 198510. 371 by Tulsa ......................................... November 6, 1993bold denotes Scottie Montgomery era

2017 ECU Football Final Statistics, Misc...Page 24
EAST CAROLINA ROAD FOOTBALL (1932-2017)<All-Time Top Ten Off ense Lists>
Most Points Scored By ECU1. 61 at Virginia ......................................November 8, 19752. 56 at Memphis ..................................November 3, 2007 56 at South Carolina ..............................October 8, 19944. 55 at North Carolina....................... September 28, 20135. 54 at UAB ...........................................November 11, 2010 54 at Houston ................................... November 9, 20027. 53 at Fort Bragg .............................. November 28, 19468. 51 at Tulane ...................................... September 8, 20019. 49 at SMU ................................................ October 3, 2015 49 at Tulsa ....................................... November 28, 2014
Most Points Scored By An Opponent1. 70 by Memphis ....................... November 25, 20172. 65 by Southern Miss ..............................October 5, 19683. 64 by Appalachian State ................. November 18, 19394. 63 by UCF ...................................October 14, 2017 63 by Florida State ...........................November 14, 19986. 62 by Rice ........................................November 20, 20107. 59 by Marshall ................................. November 29, 2013 59 by Louisville .....................................October 2, 2004 59 by Lenoir-Rhyne .......................... November 8, 195810. 57 by NC State ...................................September 8, 1973 57 by Lenoir-Rhyne .......................... November 3, 1956
Most Total Yards By ECU1. 699 at Virginia ......................................November 8, 19752. 641 at Memphis ..................................November 3, 20073. 622 at UCF ...........................................November 19, 20154. 621 at South Carolina ..............................October 8, 19945. 603 at North Carolina....................... September 28, 20136. 600 at UAB ..............................................October 20, 20127. 598 at Houston ................................... November 9, 20028. 596 at Connecticut ................... September 24, 20179. 591 at Virginia Tech ............................ November 9, 199610. 579 at Cincinnati ................................ November 13, 2014
Most Total Yards By An Opponent1. 706 by Florida State ............................... October 16, 19822. 639 by Rice ........................................November 20, 20103. 635 by Memphis ....................... November 25, 20174. 626 by South Carolina ........................... October 13, 19905. 621 by West Virginia ........................ September 4, 20046. 616 by Tulsa ...............................November 5, 20167. 614 by West Virginia ...................September 9, 20178. 603 by UCF ...................................October 14, 20179. 599 by West Virginia .......................September 22, 200710. 596 by Connecticut ................... September 24, 2017
Most Rushing Yards By ECU1. 642 at Virginia ......................................November 8, 19752. 604 at William & Mary .......................November 24, 19793. 491 at Memphis ..................................November 3, 20074. 450 at Appalachian State ....................November 3, 19795. 382 at Davidson ................................ November 28, 19706. 378 at William & Mary ....................... November 13, 19827. 370 at North Carolina............................. October 25, 19758. 368 at Richmond ..................................... October 11, 19809. 358 at Louisiana-Lafayette .....................October 17, 198110. 351 at Cincinnati ................................November 19, 1988
Most Rushing Yards By An Opponent1. 536 by West Virginia ...................... September 28, 20022. 478 by West Virginia ........................ September 4, 20043. 454 by Miami ....................................... November 8, 19804. 426 by Bowling Green ...................... September 25, 19715. 415 by Navy .......................................September 19, 2015 415 by South Carolina ........................... October 13, 19907. 410 by Rice ........................................November 20, 20108. 407 by Wake Forest ..........................September 17, 20059. 403 by Navy ....................................... September 2, 200610. 399 by Temple ........................................ October 11, 1986
Most Passing Yards By ECU1. 480 at Tulane ...........................................October 12, 20132. 473 at UCF ...........................................November 19, 20153. 468 at Houston .......................... November 4, 20174. 440 at Houston ................................... November 9, 20025. 436 at Tulsa ...............................November 5, 20166. 427 vs. Florida+ ........................................January 3, 2015 427 at Virginia Tech .......................... September 13, 20148. 426 at Connecticut ................... September 24, 20179. 425 at Cincinnati ................................ November 13, 201410. 414 at Memphis .................................November 21, 1998+Birmingham Bowl
Most Passing Yards By An Opponent1. 456 by UTEP ............................................October 13, 2007 456 by Florida State ............................... October 16, 19823. 454 by UAB ........................................November 16, 20024. 451 by South Carolina .............................October 8, 19945. 436 by Cincinnati ............................... November 13, 20146. 425 by South Carolina ........................... October 24, 19977. 418 by UAB ..........................................November 11, 20108. 416 by Memphis ..................................November 3, 20079. 406 by Connecticut ................... September 24, 201710. 403 by West Virginia ...................September 9, 2017bold denotes Scottie Montgomery era