Embed Size (px)
Citation preview

REVIEW
The Audioscan: a high frequency resolution audiometrictechnique and its clinical applications
F. ZHAO,� D. STEPHENSy & C. MEYER-BISCHz�Cardiff University School of Psychology, yWelsh Hearing Institute, University Hospital of Wales, Cardiff, Wales,
and zExecpt, Nancy, France
Accepted for publication 15 October 2001
Z H AO F. S T E P H E N S D. & M E Y E R-B I S C H C.
(2002) Clin. Otolaryngol. 27, 4–10
The Audioscan: a high frequency resolution audiometric technique and its clinicalapplications
The Audioscan is a form of high definition audiometry based on iso-hearing level frequency sweeps, which was
developed by Meyer-Bisch in 1990. Compared with traditional tone audiometry, it sweeps across the preset
frequency range at a predetermined sweep rate and provides a continuous audiometric curve. Because the device has
a maximum frequency range of 125–16 000 Hz with 64 frequencies per octave, the Audioscan method can,
theoretically, give 64 times as many values as fixed-frequency audiometry, which may give greater accuracy and
sensitivity. An advantage of this is its capacity to detect mild audiometric deficits such as narrow notches
situated between the frequencies normally tested. These may represent very limited auditory lesions, at a stage
when they cannot be detected by routine audiological methods. Thus, the Audioscan method can give not only a
detailed audiometric curve, but also provide important indicators of mild auditory dysfunction. The Audioscan
device (e.g. Essilor model) is commercially available for clinical purpose. It is a software-based system, which can
also be used for pure tone audiometry and Bekesy audiometry. This paper reviews the general aspects of the
Audioscan technique and current applications for detecting auditory dysfunction. This would be valuable to provide
some guidelines on the Audioscan assessment, and contribute to a clarification of the clinical application of
Audioscan and facilitate further research.
Keywords Audioscan notches noise-induced hearing impairment tinnitus genetic hearing impairment
King-Kopetzky syndrome
The Audioscan technique
ba s ic pr i nc i pl e s
The principle of the Audioscan technique is to provide a
frequency sweep at a constant hearing level across frequencies
instead of an intensity sweep through individual frequen-
cies.1,2 Thus, the sweep becomes horizontal instead of ver-
tical. The ranges of frequencies swept and levels explored are
determined by a programmed system which can be preset by
the tester. The starting level sweep rate and step size can also
be programmed. The logic of the algorithm is based on the
detection of audiometric irregularities, and defining them in
frequency and intensity. Therefore, the Audioscan provides
high sensitivity in the exploration of auditory deficits.
proc edur e
The first frequency sweep has a constant starting level. It starts
by just testing at octave intervals over the preset range until it
reaches a level at which there is a response. The subject
presses a button when he/she hears the stimulus and for as long
as he/she hears it. This information is recorded in the memory
of the machine. The programme then produces stimuli of the
next intensity and tests only in those parts of the frequency
range at which there was no response. The stimulus level is
subsequently further increased until the subject has responded
throughout the defined frequency range.
Clin. Otolaryngol. 2002, 27, 4–10
4 # 2002 Blackwell Science Ltd
Correspondence: Dr Fei Zhao, School of Psychology, CardiffUniversity, PO Box 901, Cardiff CF10 3GY, Wales (e-mail:[email protected]).

During Audioscan testing, the tone is presented at 1 kHz and
then goes on to high frequencies. Once at the maximum
frequency, the 1 kHz tone is retested before sweeping to low
frequencies. For example, say that the test intensity is initially
presented at 0 dB HL and the sweep frequency scan between
250 and 8 kHz revealed a range of frequencies between Fa1 and
Fb1 at which the signal was not heard. Thus tones between
250 Hz and Fa1 Hz, together with those between Fb1 and 8 kHz
were heard throughout the sweep by the subject. To complete
the audiogram, the device calculates the central frequency Fm¼(Fa1�Fb1)1/2. The sweep then starts again at Fm with a signal
level of 5 dB HL. The sweep is initially towards the higher
frequencies and then towards the lower (Fig. 1). This results in
the definition of two new values of Fa2 and Fb2. The process
then starts again at increasing steps of 5 dB until a continuous
response is obtained between Fa2 and Fb2. An Audioscan
audiogram may have a number of notches as shown in Fig. 2.
pa r am et e r s
For Audioscan testing the following parameters can be
adjusted by programming the device:
� Full frequency range: 125–16 000 Hz
� Starting level: between �10 dB and þ50 dB HL
� Sweep rate: between 7 and 99 s/octave
� Start side: right or left earphone
� Stimulus style: pulsed tone or continuous tone
� Step size: 1–10 dB
Therefore, a range of protocols can be chosen depending on
the specific measurement objectives sought.
Interpretation of the Audioscan results
As the Audioscan can test up to 64 frequencies within an
octave, it can provide detailed information on threshold
changes within that octave range. Moreover, the other impor-
tant information contained in an Audioscan is linked to the
presence of notches, which have been considered to be
indicators of mild auditory dysfunction.
notch m ea sur em ent
The parameters of notch measurement were recommended by
Laroche and Hetu,3 and are as follows (Fig. 3): the Centre
Frequency (Fa) corresponds to the frequency of the deepest
point of the notch; the Starting point (Sa): is the best hearing
threshold (dB HL) preceding the notch; The Absolute Value
in dB (Na) represents the absolute value of the notch lower
extremity (expressed in dB HL) measured at Fa; the Depth
(Pa) is the difference in dB between Na and Sa; and the Width
at 50% of depth (Wa) is determined using 50% of the total
notch depth; it is measured as a proportion of an octave.
Figure 1. The procedure of the sweeptechnique in the Audioscan test.
Figure 2. An example of an Audioscanaudiogram.
Techniques and applications of the Audioscan 5
# 2002 Blackwell Science Ltd, Clinical Otolaryngology, 27, 4–10

work i ng de f i n i t i on of audio scan notch
Using the Audioscan technique, a significant notch was
defined as being 15 dB or deeper than the surrounding fre-
quencies with the notch width not entering into the criterion.4
Factors influencing the results
The Audioscan technique is a type of semiautomatic audio-
metry. The ranges of frequencies swept and levels explored
are preprogrammed and then controlled by the patient’s
responses. Like all other psychoacoustical methods, a number
of factors affect the accuracy of the results of an Audioscan
test, for example, background noise, familiarity of the subject
with the method, concentration, alertness and duration of the
test, etc. In particular, the starting point of the response
depends very much on the test conditions and familiarity of
the subjects with the method. Therefore, to avoid the influence
of such factors, it is necessary to give the patients practice
listening to the Audioscan test before starting the test proper.
To overcome any initial unfamiliarity with the system on the
part of the patient, it has been suggested that the programme
should be stopped and then restarted after the subject
responds, discarding the initial response. If the subject under-
stands the normal test procedure and follows immediately by
releasing or pressing the button, the test procedure will then be
continued. Otherwise, if he/she does not release or press the
button, he/she will be carefully reinstructed, and then the test
procedure will begin again. This is important to improve the
reliability and accuracy of the test.
The reliability and sensitivity of Audioscan testing
The reliability and sensitivity of the Audioscan has been
evaluated systematically by Laroche and Hetu,3 who focused
mainly on the reliability and sensitivity of Audioscan thresh-
olds by comparison with the results obtained with fixed-
frequency Bekesy audiometry, when the sweep speed was
set at 10 or 20 s/octave, and the step size at 5 dB. The
measurement error (standard error) typically falls between
3.5 and 4.5 dB, a range of values which compares well with
those for Bekesy audiometry under optimal conditions. In
their study, high correlation coefficients between Bekesy and
Audioscan thresholds supported the validity of Audioscan
testing.
Furthermore, a pilot study by Meredith4 investigated the
reliability of the Audioscan notches as a function of the sweep
rate. The results indicated that Audioscan notches were found
less frequently in a group of three subjects when tested with
fast sweep rates (10 and 20 s/octave) than at slower sweep
rates (30 and 40 s/octave). In the study of Zhao et al.5 the
reliability of notches detected with a sweep rate of 30 s/octave
was significantly better than that at 15 s/octave. Nearly 50% (5
out of 12) of subjects failed to show notches at all when tested
at 15 s/octave although all had notches when tested at 30 s/
octave. This indicates that the reliability with the slower
sweep rate was better than that with the fast rate. This is in
keeping with the findings reported by Laroche and Hetu,3 who
found that the test-retest reliability was affected by sweep
speed, in that the reliability with their slower sweep rate (20 s/
octave) was better than that with fast sweep rate (10 s/octave).
The prevalence of Audioscan notchesin the control subjects
Various studies have investigated the prevalence of Audioscan
notches in normal control subjects. However, there is a
relatively wide range prevalence of Audioscan notches in
normal subjects among these studies, ranging from 13 to
25% in the frequency range up to 3000 Hz and 36–50% in
Figure 3. The parameters of notch mea-surement on the Audioscan.
# 2002 Blackwell Science Ltd, Clinical Otolaryngology, 27, 4–10
6 F. Zhao et al.

the range up to 8000 Hz. These differences are mainly because
of a variety of influencing factors, for example, different
stimulus parameters and interpretative criteria used, test con-
ditions (e.g. background noise levels), and variability of the
experience of the subjects being tested. In addition, the
differences may also be influenced by the different genetic
backgrounds of the subjects tested.6
Demographic factors have been considered in the study by
Stephens et al.7 who argued that more data should be collected
in a large control group, which includes a normally distributed
age range of both genders. Subsequently a series of normative
results was collected from 70 normally hearing controls who
were selected on the basis of one per year age group per gender
from age 16 to 50.5 In this study, the prevalence of Audioscan
notches was 35.7% in the frequency band between 250 and
8000 Hz. Out of these, a total of 11 subjects (15.7%) had
notches between 500 and 3000 Hz, and 16 subjects had notches
between 3001 and 8000 Hz (22.9%) (two subjects with
notches in both frequency bands). These results are generally
in agreement with the findings in the previous studies.8–10
Furthermore, Fig. 4 shows the distributions of notches in the
two different frequency bands analysed by age band. In the
band from 3001 to 8000 Hz, there was a trend for the pre-
valence of notches to increase with the age band in each
gender. It demonstrates the accumulative influence of noise
exposure and other exogenous factors on the auditory system
of the individuals. However, in the 500–3000 Hz band, a stable
percentage of the notches was found in each age band and each
gender. This finding may imply that the notches in this region
represent a susceptible region in the cochlea influenced by
endogenous factors (e.g. a genetic factor).
There was no significant difference in the percentage of the
notches between males and females in the control group.
Moreover, no gender effects were found in the prevalence
of Audioscan notches either in the frequency band of 500–
3000 Hz or in the frequency band of 3001–8000 Hz. This
result is in accord with the finding by Stephens et al.,7 which
showed no significant sex effects on Audioscan notches in
normally hearing control subjects.
Clinical application of the Audioscan test
scr e en i ng f or no i s e - i nduced h ea r i ng
impa i rm ent
Meyer-Bisch1 used the Audioscan to detect small notches in
the hearing of those subjected to occupational noise. The
narrow notches found in the 3–8 kHz zone corresponded to
occupational noise-induced hearing impairment and other
disorders due to loud noise. He argued that it provided an
accurate indication of early hearing abnormalities in patients
exposed to noise. In the study of Laroche and Hetu,3 the
authors also confirmed the usefulness of Audioscan testing for
early identification of notches in the screening for noise-
induced hearing impairment. Screening for mild hearing
impairment owing to noise is a very important application
for the Audioscan method.
In an epidemiological survey on 1500 subjects who were
exposed to loud amplified music, such as personal cassette
players (PCP), discotheques and/or, rock concerts, a statisti-
cally significant deterioration of the average hearing thresh-
olds was found in young people using a PCP> 7 h/week
compared with those using one 2–7 h/week and compared
with their matched controls.11 The same trend was found in
subjects who went to rock concerts at least twice a month
compared with their matched controls. This suggests therefore
that the Audioscan method can provide sufficient accuracy
and sensitivity to measure very fine hearing deficits at an early
stage where prophylactic measures may be able to stop the
development of debilitating hearing impairment.
a ppl icat ion to t i nn i tu s pat i ent w ith
normal h ea r i ng
A total of 26 patients complaining of tinnitus and with normal
hearing on pure tone audiometry were investigated with the
Audioscan in the study of Sirimanna et al.; 96% (25 out of 26)
had notches between 250 and 8000 Hz.12 Moreover, matched
tinnitus pitch corresponded to the Audioscan notch within one
Figure 4. Percentage of subjects withAudioscan notches by age and gender, intwo frequency bands, in normally hearingsubjects.
# 2002 Blackwell Science Ltd, Clinical Otolaryngology, 27, 4–10
Techniques and applications of the Audioscan 7

octave in 24 out of the 26 subjects (92%). In all but one, the
Audioscan notches were found on the same side as the tinni-
tus ear. It may be postulated that such a tinnitus population
had a very high prevalence of localized damage to the inner
ear. Testing with transient-evoked otoacoustic emissions
(TEOAEs), showed that 75% (18 out of 24) subjects had
poor TEOAEs. This suggested that, even though the popula-
tion studied here had normal hearing thresholds, they had
subclinical cochlear (outer hair cell) damage, supporting the
hypothesis of peripheral tinnitus generation.
a ppl icat ion to carr i e r s of g en et ic
h ear i ng im pa i rm ent
Usher syndrome
Meredith4 first employed the Audioscan to detect carriers of
genes for hearing impairment to identify the audiometric
characteristics that might represent some carrier status of
certain types of genetic hearing impairment. He examined
different stimulus parameters and found a sweep rate of 30 s/
octave over the frequency range 500–3000 Hz and that a notch
size criterion of 15 dB or more gave optimal results in
differentiating the subjects from non-carriers.
When the test was administered to obligate carriers of
Usher syndrome type II, 100% of obligate carriers (five cases)
were found to have notches as were 43% of possible carriers
(14 cases), which is compatible with theoretical estimation of
50% risk of carrying the genes.13 Moreover, the number of
notches present in a similar normal population was only about
13.3%, which was similar to the estimation of Chung et al.14
of the carriers for non-syndromal recessive genetic hearing
impairment in the normal population. Therefore, the authors
concluded that the Audioscan technique might offer a sensi-
tive technique for the detection of carriers in families with
Usher syndrome type II.
However, other authors have obtained less consistent results
but have used different stimulus parameters and criteria for
notches.9,15 The study by Wagenaar et al.15 failed to replicate
the Usher II findings in patients with Usher syndrome type I.
Although in eight out of 50 control ears (16%) a notch was
found, the Audioscan method demonstrated notches in the
500 Hz�3 kHz range in only three out of the 10 (30%) of
obligate carriers. Differences between the results of this study
and compared with the findings of Meredith et al.13 might be
as a result of the fact that two different populations are being
compared. It seems possible that there is a real difference
between carriers of Usher type I and Usher type II syndromes.
So far, six different gene locations have been described for
Usher 1 syndrome and three for Usher 2,16 so that some of the
differences may be explained by the genetic heterogeneity. In
addition, there were several differences in the stimulus para-
meters and criteria used between the two studies (Table 1).
Table 1. Comparison of the findings of Audioscan notches in different studies on carriers of genetic hearing impairment
Genetic condition
Criteria of Notches Parameters Findings
DepthFrequencyband Width
Frequencyrange Sweep rate
Startinglevel
Obligatecarriers
Possiblecarriers
US type IIMeredith13 15 dB 0.5–3 kHz n.d. 300–4000 30 s/octave �5 dB 5 (5)¼ 100% 6 (14)¼ 43%Laoide-Kemp10 15 dB 0.5–6 kHz 1 octave 250–8000 30 s/octave n.s. 0 (4)¼ 0%�
2 (4)¼ 50%y3 (4)¼ 75%z
US type IWagenaar15 15 dB 0.5–3 kHz 250–8000 15 s/octave n.s. 3 (10)¼ 30%Laoide-Kemp10 15 dB 0.5–6 kHz 1 octave 250–8000 30 s/octave n.s. 3 (4)¼ 75%�
3 (4)¼ 75%y4 (4)¼ 100%z
NSARHLMeredith4 15 dB 0.5–3 kHz n.d. 300–4000 30 s/octave � 5 dB 25 (45)¼ 56%Stephens7 15 dB 0.5–3 kHz n.d. 300–4000 30 s/octave � 5 dB 7 (12)¼ 58% 10 (15)¼ 67%Cohen9 15 dB 0.25–8 kHz n.d. 250–8000 30 s/octave 5 dB below
the bestthreshold
6 (24)¼ 25%� 6 (8)¼ 75%
13 (24)¼ 54%§Laoide-Kemp10 15 dB 0.5–6 kHz 1 octave 250–8000 30 s/octave n.s. 11 (32)¼ 34%� 20 (49)¼ 41%�
16 (32)¼ 50%y 28 (49)¼ 57%y28 (32)¼ 75%z 31 (49)¼ 63%z
Lina-Granade6 15 dB 0.5–3 kHz n.d. 300–4000 30 s/octave n.s. 5 (14)¼ 36%Alport syndrome
Sirimanna17 15 dB 0.5–3 kHz n.d. 250–8000 30 s/octave �5 dB 8 (8)¼ 100% 8 (15)¼ 73%
Frequency bands: �0.25–3 kHz; y3–4 kHz; z4–6 Hz; §3–8 kHz.n.d.¼ not defined, n.s.¼ not specified.
# 2002 Blackwell Science Ltd, Clinical Otolaryngology, 27, 4–10
8 F. Zhao et al.
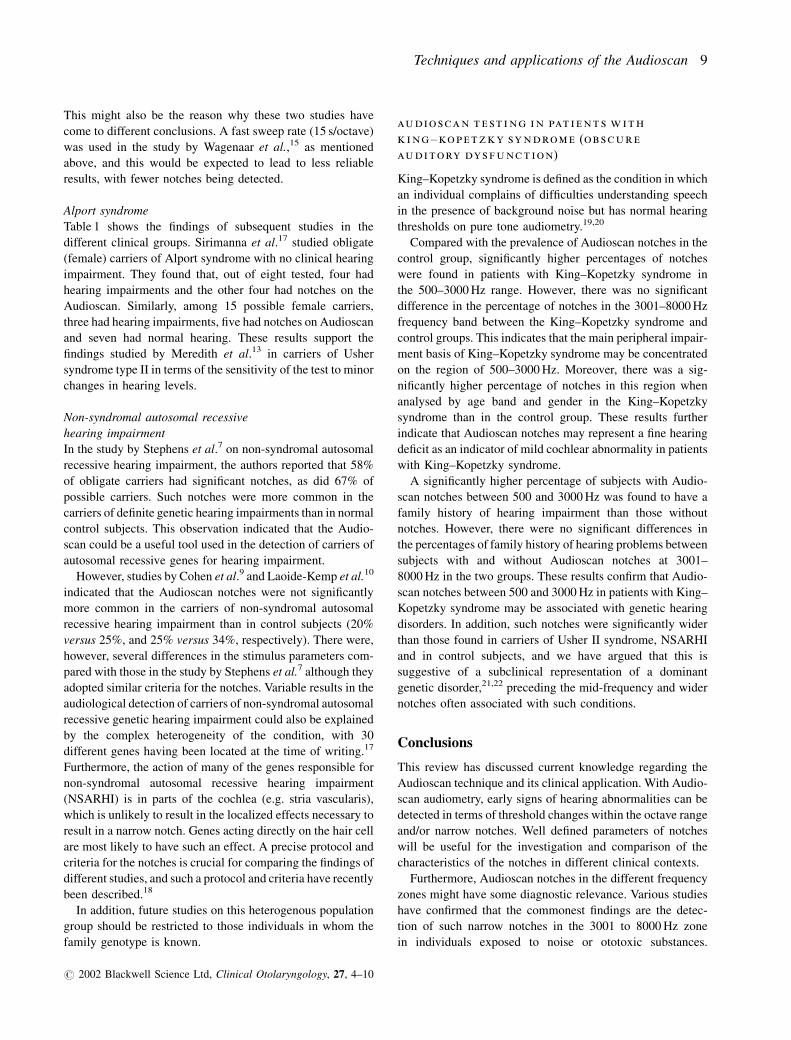
This might also be the reason why these two studies have
come to different conclusions. A fast sweep rate (15 s/octave)
was used in the study by Wagenaar et al.,15 as mentioned
above, and this would be expected to lead to less reliable
results, with fewer notches being detected.
Alport syndrome
Table 1 shows the findings of subsequent studies in the
different clinical groups. Sirimanna et al.17 studied obligate
(female) carriers of Alport syndrome with no clinical hearing
impairment. They found that, out of eight tested, four had
hearing impairments and the other four had notches on the
Audioscan. Similarly, among 15 possible female carriers,
three had hearing impairments, five had notches on Audioscan
and seven had normal hearing. These results support the
findings studied by Meredith et al.13 in carriers of Usher
syndrome type II in terms of the sensitivity of the test to minor
changes in hearing levels.
Non-syndromal autosomal recessive
hearing impairment
In the study by Stephens et al.7 on non-syndromal autosomal
recessive hearing impairment, the authors reported that 58%
of obligate carriers had significant notches, as did 67% of
possible carriers. Such notches were more common in the
carriers of definite genetic hearing impairments than in normal
control subjects. This observation indicated that the Audio-
scan could be a useful tool used in the detection of carriers of
autosomal recessive genes for hearing impairment.
However, studies by Cohen et al.9 and Laoide-Kemp et al.10
indicated that the Audioscan notches were not significantly
more common in the carriers of non-syndromal autosomal
recessive hearing impairment than in control subjects (20%
versus 25%, and 25% versus 34%, respectively). There were,
however, several differences in the stimulus parameters com-
pared with those in the study by Stephens et al.7 although they
adopted similar criteria for the notches. Variable results in the
audiological detection of carriers of non-syndromal autosomal
recessive genetic hearing impairment could also be explained
by the complex heterogeneity of the condition, with 30
different genes having been located at the time of writing.17
Furthermore, the action of many of the genes responsible for
non-syndromal autosomal recessive hearing impairment
(NSARHI) is in parts of the cochlea (e.g. stria vascularis),
which is unlikely to result in the localized effects necessary to
result in a narrow notch. Genes acting directly on the hair cell
are most likely to have such an effect. A precise protocol and
criteria for the notches is crucial for comparing the findings of
different studies, and such a protocol and criteria have recently
been described.18
In addition, future studies on this heterogenous population
group should be restricted to those individuals in whom the
family genotype is known.
audio scan t e st i ng i n pat i ent s w ith
k i ng^kopetzky sy ndrom e (ob scur e
auditory dys fu nct ion)
King–Kopetzky syndrome is defined as the condition in which
an individual complains of difficulties understanding speech
in the presence of background noise but has normal hearing
thresholds on pure tone audiometry.19,20
Compared with the prevalence of Audioscan notches in the
control group, significantly higher percentages of notches
were found in patients with King–Kopetzky syndrome in
the 500–3000 Hz range. However, there was no significant
difference in the percentage of notches in the 3001–8000 Hz
frequency band between the King–Kopetzky syndrome and
control groups. This indicates that the main peripheral impair-
ment basis of King–Kopetzky syndrome may be concentrated
on the region of 500–3000 Hz. Moreover, there was a sig-
nificantly higher percentage of notches in this region when
analysed by age band and gender in the King–Kopetzky
syndrome than in the control group. These results further
indicate that Audioscan notches may represent a fine hearing
deficit as an indicator of mild cochlear abnormality in patients
with King–Kopetzky syndrome.
A significantly higher percentage of subjects with Audio-
scan notches between 500 and 3000 Hz was found to have a
family history of hearing impairment than those without
notches. However, there were no significant differences in
the percentages of family history of hearing problems between
subjects with and without Audioscan notches at 3001–
8000 Hz in the two groups. These results confirm that Audio-
scan notches between 500 and 3000 Hz in patients with King–
Kopetzky syndrome may be associated with genetic hearing
disorders. In addition, such notches were significantly wider
than those found in carriers of Usher II syndrome, NSARHI
and in control subjects, and we have argued that this is
suggestive of a subclinical representation of a dominant
genetic disorder,21,22 preceding the mid-frequency and wider
notches often associated with such conditions.
Conclusions
This review has discussed current knowledge regarding the
Audioscan technique and its clinical application. With Audio-
scan audiometry, early signs of hearing abnormalities can be
detected in terms of threshold changes within the octave range
and/or narrow notches. Well defined parameters of notches
will be useful for the investigation and comparison of the
characteristics of the notches in different clinical contexts.
Furthermore, Audioscan notches in the different frequency
zones might have some diagnostic relevance. Various studies
have confirmed that the commonest findings are the detec-
tion of such narrow notches in the 3001 to 8000 Hz zone
in individuals exposed to noise or ototoxic substances.
# 2002 Blackwell Science Ltd, Clinical Otolaryngology, 27, 4–10
Techniques and applications of the Audioscan 9

Moreover, Audioscan notches in the frequency range of 500–
3000 Hz are commonly associated with genetic hearing dis-
orders, and the Audioscan may be capable of identifying mild
auditory dysfunction, which may be influenced by the genetic
background. The mechanism is unclear but it may be the more
susceptible zone to genetic disorders or degenerative pro-
cesses affecting the cochlea.
The main weakness of the Audioscan is that unless large
step sizes are used, the test duration in patients with significant
hearing losses can be long, thus reducing its reliability. We
would, thus, recommend use of the Audioscan in patients with
clinically normal hearing, but the use of sweep frequency
Bekesy audiometry in those in whom a hearing loss is
expected. This can be achieved simply by a change in the
menu of the Audioscan programme.
References
1 MEYER-BISCH C. (1990) Audiometrie automatique de depistagepreventif: le balayage frequentiel asservi (Audioscan). CahiersNotes Documentaires 139, 335–345
2 MEYER-BISCH C. (1996a) Audioscan: a high-definition audio-metry technique based on constant-level frequency sweeps: anew method with new hearing indicators. Audiology 35, 63–72
3 LAROCHE C. & HETU R. (1997) A study of the reliability ofautomatic audiometry by the frequency scanning method(Audioscan). Audiology 36, 1–18
4 MEREDITH R. (1991) Audiometric identification of carriers ofnon-manifesting genes for deafness. MSc Thesis, University ofSouthampton
5 ZHAO F., STEPHENS S.D.G., MEREDITH R. et al. (1998) Parameteranalyses of Audioscan notches in carriers of genetic hearing loss.In Developments in Genetic Hearing Impairment I, pp. 60–67.Stephens, D., Read, A. & Martini, A. (eds). Whurr, London
6 LINA-GRANADE G., KREISS M., GELAS T. et al. (1998) Cochlearirregularities in obligate carriers of recessive genetic hearingimpairment and in controls. In Developments in Genetic HearingImpairment I, pp. 68–73. Stephens, D., Read, A. & Martini, A.(eds). Whurr, London
7 STEPHENS D., MEREDITH R., SIRIMANNA T. et al. (1995)Application of the Audioscan in the detection of carriers ofgenetic hearing loss. Audiology 34, 91–97
8 SIRIMANNA T. (1993) Identification of carriers of Alport’ssyndrome by audiometry. MSc Thesis, University of Manchester,Manchester, UK
9 COHEN M., FRANCIS M., LUXON L.M. et al.. (1996) Dips onBekesy or Audioscan fail to identify carriers of autosomalrecessive non-syndromic hearing loss. Acta Otolaryngol. 116,521–527
10 LAOIDE-KEMP S., PARKER D., PRATT S. et al. (1996) Audio-metric identification of carriers of non-syndromal autosomalrecessive genes for hearing loss. Paper presented at the 23rdInternational Congress on Audiology, Bari, Italy
11 MEYER-BISCH C. (1996b) Epidemiological evaluation of hearingdamage related to strongly amplified music (personal cassetteplayers, discotheques, rock concerts): high-definition audio-metric survey on 1364 subjects. Audiology 35, 121–142
12 SIRIMANNA T., STEPHENS D. & BOARD T., (1996) Tinnitus andAudioscan notches. J. Audiol. Med. 5, 38–48
13 MEREDITH R., STEPHENS D. & SIRIMANNA T. (1992) Audio-metric detection of carriers of Usher’s syndrome type II. J.Audiol. Med. 1, 11–19
14 CHUNG C.S., ROBINSON O.W. & MORTON N.E. (1958) A note ondeaf mutism. Ann. Hum Genet 23, 357–366
15 WAGENAAR M., SNIK A.F.M., KIMBERLING W.J. et al. (1996)Carriers of the Usher syndrome type I: is audiometricalidentification possible? Am. J. Otolaryngol. 17, 853–858
16 VAN CAMP G. & SMITH R.J.H. (2001) Hereditary Hearing LossHomepage. World Wide Web URL: http://dnalab-http://www.uia.ac.be/dnalab/hhh
17 SIRIMANNA K.S., FRANCE E. & STEPHENS S.D.G. (1995)Alport’s syndrome: can the carriers be identified by audiometry?Clin. Otolaryngol. 20, 158–163.
18 STEPHENS D., LINA-GRANDE G., HATZOPOULOS S. et al. (1999)Audiometric investigation of carriers. In Developments inGenetic Hearing Impairment I, pp. 33–35. Stephens, D., Read,A. & Martini, A. (eds). Whurr, London
19 SAUNDERS G.H. & HAGGARD M.P. (1989) The clinicalassessment of obscure auditory dysfunction. Ear Hearing 10,200–208
20 STEPHENS D. & RENDELL R.J. (1988) Auditory disability withnormal hearing. Quaderni Audiologia 4, 233–238
21 ZHAO F. & STEPHENS D. (1999) Audioscan testing in patientswith King–Kopetzky syndrome. Acta Otolaryngol. 119,306–310
22 STEPHENS D. & ZHAO F. (2000) The role of a familyhistory in King–Kopetzky Syndrome. Acta Otolaryngol. 120,197–200
# 2002 Blackwell Science Ltd, Clinical Otolaryngology, 27, 4–10
10 F. Zhao et al.