Embed Size (px)
Citation preview
Vol. 122 (2012) ACTA PHYSICA POLONICA A No. 5
Optical and Acoustical Methods in Science and Technology
Extrinsic Optical Fiber Sensor
for Medical Audiometric Applications
K. Prokopczuk∗, T. Pocz¦sny, P. Sobotka and A.W. Doma«ski
Faculty of Physics, Warsaw University of Technology, Koszykowa 75, 00-662 Warszawa, Poland
The paper presents optical �ber sensor designed for medical audiometric measurements. Currently, highlyprecise audiometric examinations require attachment of re�ective element inside the ear. We propose alternativecontactless optical and non-invasive method for audiometric applications. Presented sensor utilizes extrinsic inten-sity modulation combined with interferometric method to measure low amplitude vibrations with �at frequencyresponse curve and no resonance e�ects. Experiment was performed with tympanic membrane model stimulatedby external loudspeaker. Experimental results show usage possibility of presented sensor for laryngological andaudiometric tests of ear membrane response, which is important for both diagnosis and implants sensitivity �ttingfor people with hearing de�cits.
PACS: 42.81.Pa, 42.79.Pw
1. Introduction
Typical audiometric examination of tympanic mem-brane and ossicular mobility is based on stimulating themby external sound with �xed loudness and measuringtheir de�ection amplitude. It gives an information about�exibility of membrane, e�ciency of pressure transfer be-tween mechanisms inside ear, and �nally about sensitiv-ity of hearing. For patients with relatively good hearingmembrane �exibility is high and pressure transfer is e�-cient. When amplitude of membrane de�ection is lowerthan normal, it is sign of limited and impaired ability tohear. Correct adaptation of hearing aids requires infor-mation of tympanic membranes mobility.Most highly precise audiometric and tympanometric
examinations need sophisticated and complex measure-ment methods [1�3]. In this area, optical methods ofvibration monitoring are recently becoming more popu-lar and e�ective due to contactless measurement possi-bility [4�7]. The aim of work was to propose an optical�ber method of measuring vibration amplitude of tym-panic membrane or ear ossicles stimulated by externalsound. The paper presents two concepts of optical �bersensor designed for medical audiometric measurements.Presented sensors utilize optical �bers to illuminate partof tympanic membrane surface and to collect re�ectedlight containing information about membrane movement.Presented sensors utilize extrinsic intensity modulation(EIM) and EIM combined with interferometric method(EIMI) to measure very low amplitude vibrations with�at frequency response curve and no resonance e�ects.
∗ corresponding author; e-mail: [email protected]
To measure tympanic membrane mobility a very sensi-tive and accurate optical measurement method is needed.Our recent optical vibration sensing solutions utiliz-ing EIM were focused mainly on industrial applications[8�10]. For medical applications, we decided to use EIMmethod due to its relatively high sensitivity and ease inilluminating small area of tympanic membrane surface.The main issue in EIM applications is the need for
calibration every time when sensor changes its opera-tion position e.g. due to patient movement. Also dur-ing experiment we combined EIM with interferometry tominimize in�uence of human body natural movementson measurement results. The combination of these twomethods allows for achieving a signal which contains in-formation about amplitude in both envelope of signal andthe number of fringes modulating the signal. We �nallyproposed the EIMI method, where sensor can be com-pletely auto-calibrated by very simple and fast softwarealgorithms. This method is based on extrinsic modula-tion of intensity and phase. This gives a possibility ofusing the EIMI sensor handheld and without need forpatient immobilization.
2. Principle of operation of EIM
and EIMI sensors
We present two concepts of an optoelectronic vibrationsensor for audiometric applications � �rst one is basedon typical EIM which utilizes two �bers in sensing head:�rst one as transmitting �ber, second one as receiving�ber. Simpli�ed scheme of EIM sensing head was shownin Fig. 1a. This type of head works as displacement sen-sor � response characteristic is shown in Figs. 2 and 3.Examples of industrial applications of such sensing headwere presented in previous works [8�10].
(957)
958 K. Prokopczuk et al.
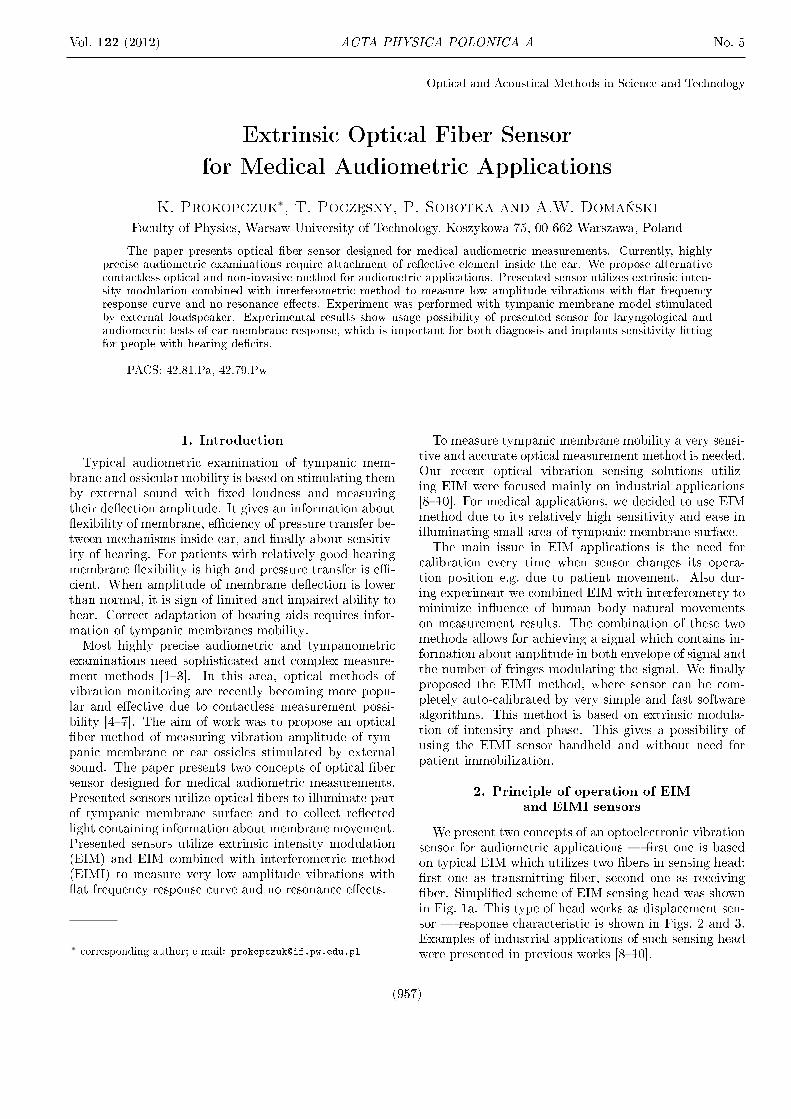
Fig. 1. Schemes of sensing heads (a) with two �bers �typical EIM, (b) with one �ber � EIM combined withinterferometric method (EIMI).
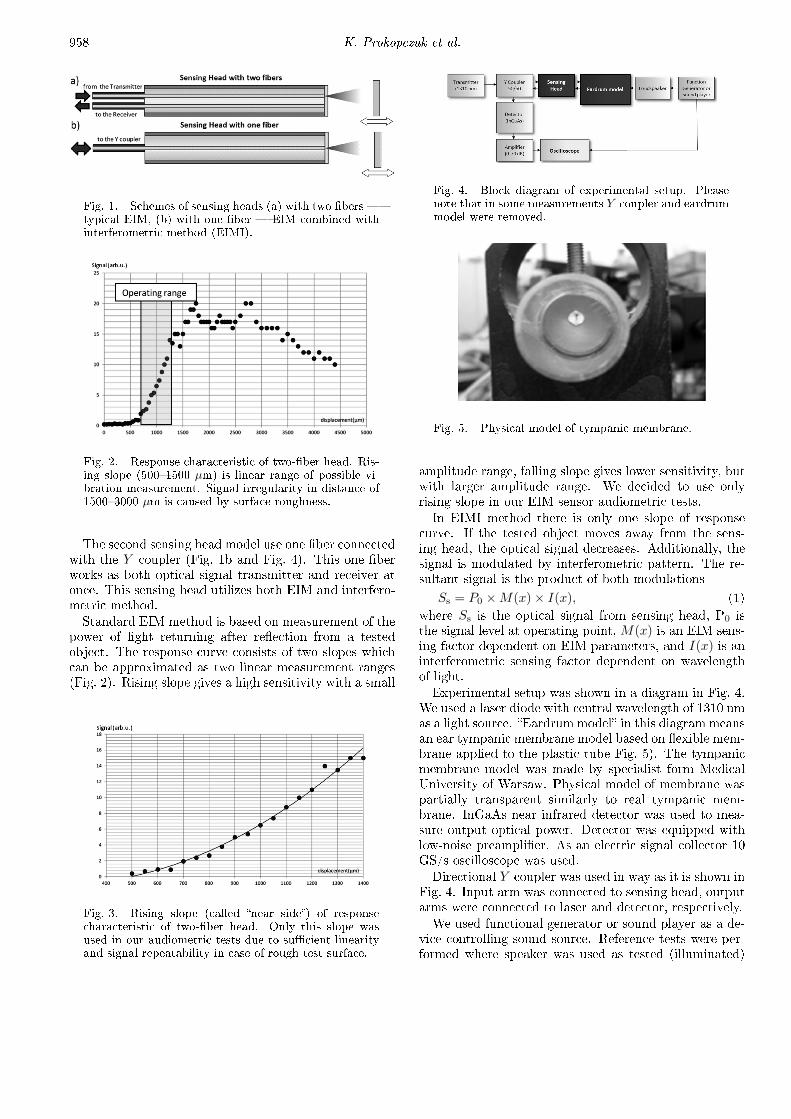
Fig. 2. Response characteristic of two-�ber head. Ris-ing slope (500�1500 µm) is linear range of possible vi-bration measurement. Signal irregularity in distance of1500�3000 µm is caused by surface roughness.
The second sensing head model use one �ber connectedwith the Y coupler (Fig. 1b and Fig. 4). This one �berworks as both optical signal transmitter and receiver atonce. This sensing head utilizes both EIM and interfero-metric method.Standard EIM method is based on measurement of the
power of light returning after re�ection from a testedobject. The response curve consists of two slopes whichcan be approximated as two linear measurement ranges(Fig. 2). Rising slope gives a high sensitivity with a small
Fig. 3. Rising slope (called �near side�) of responsecharacteristic of two-�ber head. Only this slope wasused in our audiometric tests due to su�cient linearityand signal repeatability in case of rough test surface.
Fig. 4. Block diagram of experimental setup. Pleasenote that in some measurements Y coupler and eardrummodel were removed.
Fig. 5. Physical model of tympanic membrane.
amplitude range, falling slope gives lower sensitivity, butwith larger amplitude range. We decided to use onlyrising slope in our EIM sensor audiometric tests.In EIMI method there is only one slope of response
curve. If the tested object moves away from the sens-ing head, the optical signal decreases. Additionally, thesignal is modulated by interferometric pattern. The re-sultant signal is the product of both modulations
Ss = P0 ×M(x)× I(x), (1)
where Ss is the optical signal from sensing head, P0 isthe signal level at operating point, M(x) is an EIM sens-ing factor dependent on EIM parameters, and I(x) is aninterferometric sensing factor dependent on wavelengthof light.Experimental setup was shown in a diagram in Fig. 4.
We used a laser diode with central wavelength of 1310 nmas a light source. �Eardrummodel� in this diagram meansan ear tympanic membrane model based on �exible mem-brane applied to the plastic tube Fig. 5). The tympanicmembrane model was made by specialist form MedicalUniversity of Warsaw. Physical model of membrane waspartially transparent similarly to real tympanic mem-brane. InGaAs near infrared detector was used to mea-sure output optical power. Detector was equipped withlow-noise preampli�er. As an electric signal collector 10GS/s oscilloscope was used.Directional Y coupler was used in way as it is shown in
Fig. 4. Input arm was connected to sensing head, outputarms were connected to laser and detector, respectively.We used functional generator or sound player as a de-
vice controlling sound source. Reference tests were per-formed where speaker was used as tested (illuminated)
Extrinsic Optical Fiber Sensor . . . 959
objects. The other experiments were performed withspeaker stimulating tympanic membrane model from dis-tance, and optical signal was collected from a membranesurface (Fig. 6).
Fig. 6. Scheme of experiment, where tympanic mem-brane model was stimulated to vibration by loudspeakerfrom a distance. This situation is similar to audiometrictest of tympanic membrane and ossicles mobility.
3. Sensing head with two �bers for EIM
In initial tests we were using a typical two-�ber EIMhead as a vibration sensor. Response characteristic ofEIM sensor is shown in Fig. 2. The characteristic was ob-tained by step shifting object away from the head. Shapeof response curve is dependent on type of �bers and dis-tance between them [8]. Tested EIM sensing head con-sisted of two single-mode (SM) telecommunication �bers.Use of SM instead of MM �bers allowed us to limit theimpact of varied distribution of light on rough surfacesand to narrow the area of illumination.The measurement results were obtained with operating
point set on rising slope of response curve. Zoom of risingslope is shown in Fig. 3. This slope is approximatelylinear, but an accounting of sensitivity diversity is neededto calculate vibration amplitude precisely. It can be asigni�cant problem in real medical applications, wherehuman body is in constant motion.In initial tests the sensing head was directed to the
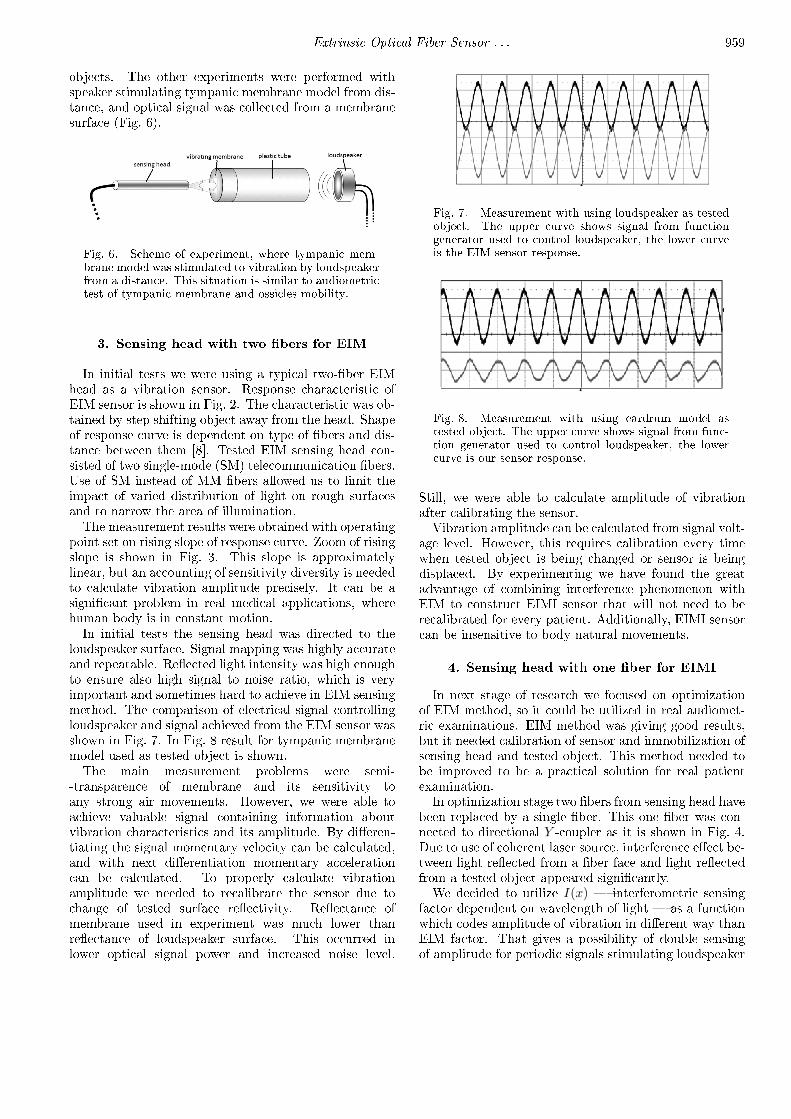
loudspeaker surface. Signal mapping was highly accurateand repeatable. Re�ected light intensity was high enoughto ensure also high signal to noise ratio, which is veryimportant and sometimes hard to achieve in EIM sensingmethod. The comparison of electrical signal controllingloudspeaker and signal achieved from the EIM sensor wasshown in Fig. 7. In Fig. 8 result for tympanic membranemodel used as tested object is shown.The main measurement problems were semi-
-transparence of membrane and its sensitivity toany strong air movements. However, we were able toachieve valuable signal containing information aboutvibration characteristics and its amplitude. By di�eren-tiating the signal momentary velocity can be calculated,and with next di�erentiation momentary accelerationcan be calculated. To properly calculate vibrationamplitude we needed to recalibrate the sensor due tochange of tested surface re�ectivity. Re�ectance ofmembrane used in experiment was much lower thanre�ectance of loudspeaker surface. This occurred inlower optical signal power and increased noise level.
Fig. 7. Measurement with using loudspeaker as testedobject. The upper curve shows signal from functiongenerator used to control loudspeaker, the lower curveis the EIM sensor response.
Fig. 8. Measurement with using eardrum model astested object. The upper curve shows signal from func-tion generator used to control loudspeaker, the lowercurve is our sensor response.
Still, we were able to calculate amplitude of vibrationafter calibrating the sensor.Vibration amplitude can be calculated from signal volt-
age level. However, this requires calibration every timewhen tested object is being changed or sensor is beingdisplaced. By experimenting we have found the greatadvantage of combining interference phenomenon withEIM to construct EIMI sensor that will not need to berecalibrated for every patient. Additionally, EIMI sensorcan be insensitive to body natural movements.
4. Sensing head with one �ber for EIMI
In next stage of research we focused on optimizationof EIM method, so it could be utilized in real audiomet-ric examinations. EIM method was giving good results,but it needed calibration of sensor and immobilization ofsensing head and tested object. This method needed tobe improved to be a practical solution for real patientexamination.In optimization stage two �bers from sensing head have
been replaced by a single �ber. This one �ber was con-nected to directional Y -coupler as it is shown in Fig. 4.Due to use of coherent laser source, interference e�ect be-tween light re�ected from a �ber face and light re�ectedfrom a tested object appeared signi�cantly.We decided to utilize I(x) � interferometric sensing
factor dependent on wavelength of light � as a functionwhich codes amplitude of vibration in di�erent way thanEIM factor. That gives a possibility of double sensingof amplitude for periodic signals stimulating loudspeaker
960 K. Prokopczuk et al.
and such sensor does not need to be calibrated every timewhen sensing head is being moved.
The EIMI sensor was �rstly tested for displacementmeasurement. In this case the tested object was movedby nanometric stage. Displacement measurement wasshown in Fig. 9. Signal presented in Fig. 9 shows inter-ferometric fringes sliding during movement of the testedobject by 20 µm. By simple calculation displacement canbe designated from amount of fringes.
Fig. 9. Registered signal and its zoom while moving atested object by 20 µm. λ is wavelength of light and mis a number of signal peaks per shift. Factors M(x) andI(x) occur in formula (1).
Envelope of signal is achieved from EIM factor M(x).Additional modulation is achieved from EIMI factor I(x).Vibration measurement is shown in Fig. 10. Both factorsM(x) and I(x) provide information about displacementor vibration amplitude. EIM factor is very easy to encode(no software is needed), but it needs a calibration everytime when working distance between sensing head andtested object is being changed. With two sensing factorscontaining information about vibration amplitude onlysimple software algorithms are needed to auto-calibratesensor.
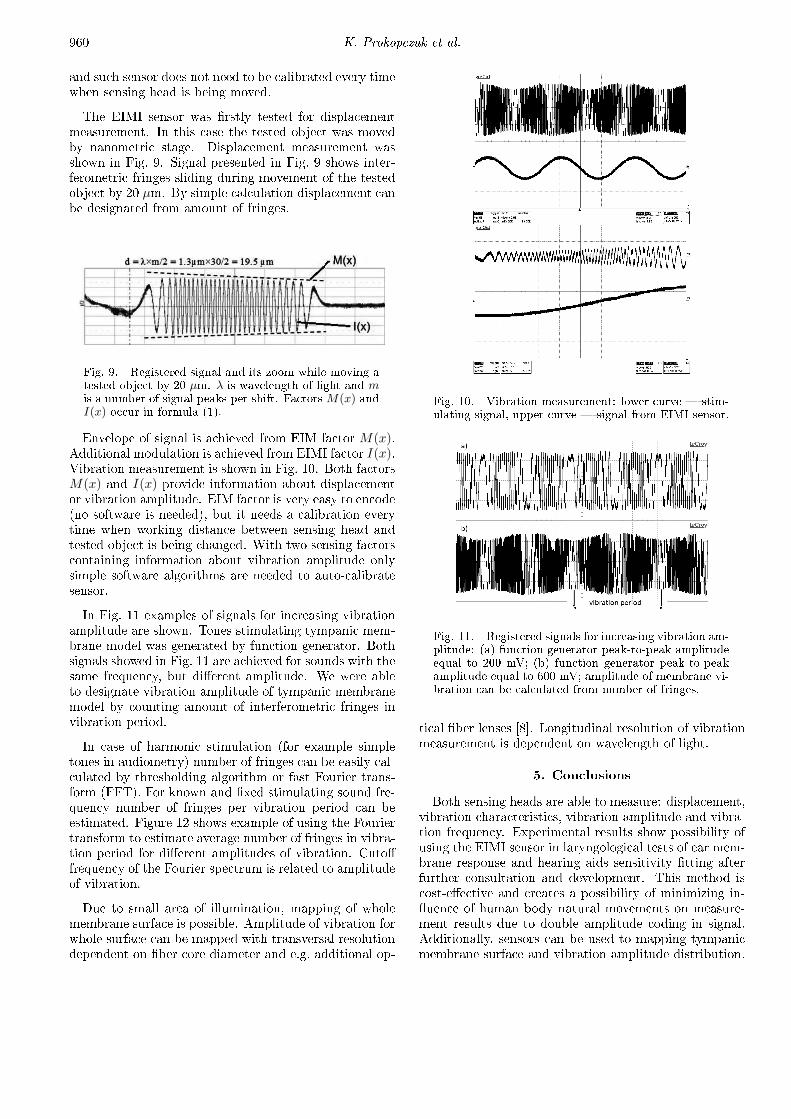
In Fig. 11 examples of signals for increasing vibrationamplitude are shown. Tones stimulating tympanic mem-brane model was generated by function generator. Bothsignals showed in Fig. 11 are achieved for sounds with thesame frequency, but di�erent amplitude. We were ableto designate vibration amplitude of tympanic membranemodel by counting amount of interferometric fringes invibration period.
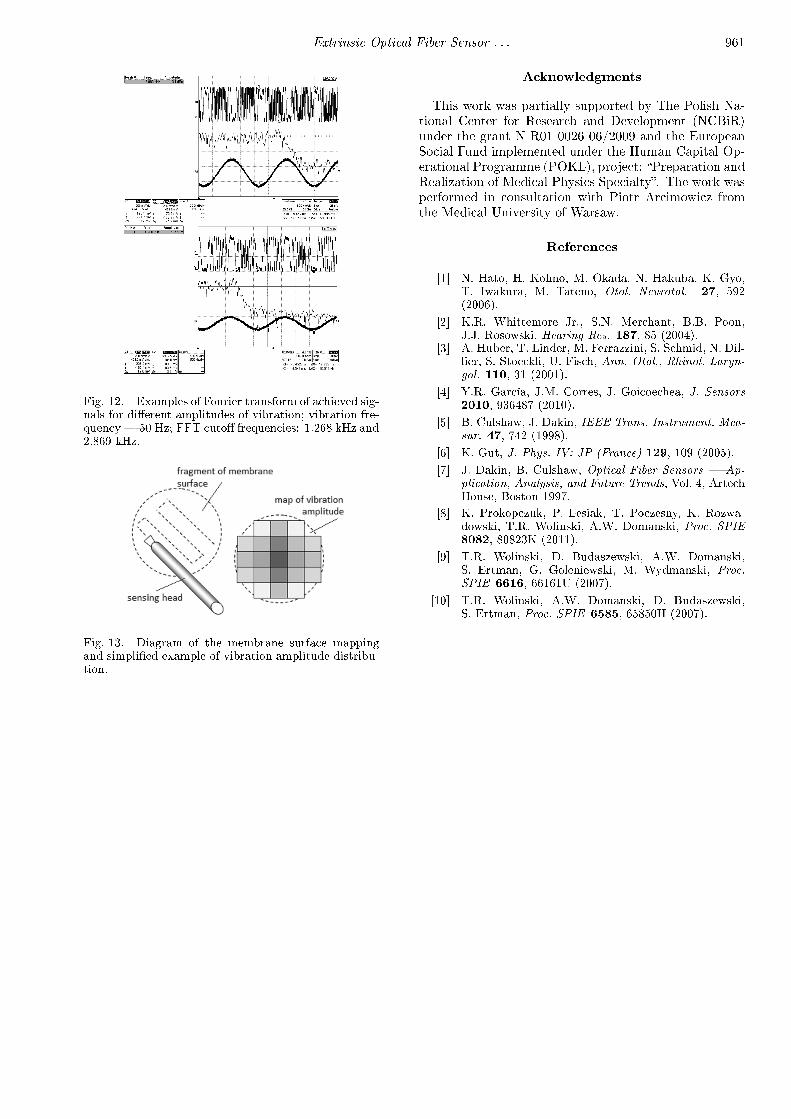
In case of harmonic stimulation (for example simpletones in audiometry) number of fringes can be easily cal-culated by thresholding algorithm or fast Fourier trans-form (FFT). For known and �xed stimulating sound fre-quency number of fringes per vibration period can beestimated. Figure 12 shows example of using the Fouriertransform to estimate average number of fringes in vibra-tion period for di�erent amplitudes of vibration. Cuto�frequency of the Fourier spectrum is related to amplitudeof vibration.
Due to small area of illumination, mapping of wholemembrane surface is possible. Amplitude of vibration forwhole surface can be mapped with transversal resolutiondependent on �ber core diameter and e.g. additional op-
Fig. 10. Vibration measurement: lower curve � stim-ulating signal, upper curve � signal from EIMI sensor.
Fig. 11. Registered signals for increasing vibration am-plitude: (a) function generator peak-to-peak amplitudeequal to 200 mV; (b) function generator peak-to-peakamplitude equal to 600 mV; amplitude of membrane vi-bration can be calculated from number of fringes.
tical �ber lenses [8]. Longitudinal resolution of vibrationmeasurement is dependent on wavelength of light.
5. Conclusions
Both sensing heads are able to measure: displacement,vibration characteristics, vibration amplitude and vibra-tion frequency. Experimental results show possibility ofusing the EIMI sensor in laryngological tests of ear mem-brane response and hearing aids sensitivity �tting afterfurther consultation and development. This method iscost-e�ective and creates a possibility of minimizing in-�uence of human body natural movements on measure-ment results due to double amplitude coding in signal.Additionally, sensors can be used to mapping tympanicmembrane surface and vibration amplitude distribution.
Extrinsic Optical Fiber Sensor . . . 961
Fig. 12. Examples of Fourier transform of achieved sig-nals for di�erent amplitudes of vibration; vibration fre-quency � 50 Hz; FFT cuto� frequencies: 1.268 kHz and2.869 kHz.
Fig. 13. Diagram of the membrane surface mappingand simpli�ed example of vibration amplitude distribu-tion.
Acknowledgments
This work was partially supported by The Polish Na-tional Center for Research and Development (NCBiR)under the grant N R01 0026 06/2009 and the EuropeanSocial Fund implemented under the Human Capital Op-erational Programme (POKL), project: �Preparation andRealization of Medical Physics Specialty�. The work wasperformed in consultation with Piotr Arcimowicz fromthe Medical University of Warsaw.
References
[1] N. Hato, H. Kohno, M. Okada, N. Hakuba, K. Gyo,T. Iwakura, M. Tateno, Otol. Neurotol. 27, 592(2006).
[2] K.R. Whittemore Jr., S.N. Merchant, B.B. Poon,J.J. Rosowski, Hearing Res. 187, 85 (2004).
[3] A. Huber, T. Linder, M. Ferrazzini, S. Schmid, N. Dil-lier, S. Stoeckli, U. Fisch, Ann. Otol., Rhinol. Laryn-gol. 110, 31 (2001).
[4] Y.R. García, J.M. Corres, J. Goicoechea, J. Sensors2010, 936487 (2010).
[5] B. Culshaw, J. Dakin, IEEE Trans. Instrument. Mea-sur. 47, 742 (1998).
[6] K. Gut, J. Phys. IV: JP (France) 129, 109 (2005).
[7] J. Dakin, B. Culshaw, Optical Fiber Sensors � Ap-plication, Analysis, and Future Trends, Vol. 4, ArtechHouse, Boston 1997.
[8] K. Prokopczuk, P. Lesiak, T. Poczesny, K. Rozwa-dowski, T.R. Wolinski, A.W. Domanski, Proc. SPIE8082, 80823K (2011).
[9] T.R. Wolinski, D. Budaszewski, A.W. Domanski,S. Ertman, G. Goleniewski, M. Wydmanski, Proc.SPIE 6616, 66161U (2007).
[10] T.R. Wolinski, A.W. Domanski, D. Budaszewski,S. Ertman, Proc. SPIE 6585, 65850H (2007).


![Audiometric Testing and Interpretation - IHS Conventionihsconvention.org/wp-content/uploads/2017/09/12-Audiometic-Testing.pdf · Audiometric Testing and Interpretation [Photo of Presenter]](https://img.pdfslide.us/doc/110x75/5ad2c0947f8b9a0f198cc497/audiometric-testing-and-interpretation-ihs-con-testing-and-interpretation-photo.jpg)