Embed Size (px)
Citation preview

iCARUS 44, 552--607 (1980)
The Astronomical Theory of Climatic Change on Mars
O W E N B. T O O N AND J A M E S B. P O L L A C K
Theoretical and Planetary Studies Branch, Ames Research Center, NASA, Moffett Field, California 94035
W I L L I A M W A R D
Jet Propulsion Laboratory, Pasadena, California 91103
J O S E P H A . B U R N S
Theoretical and Applied Mechanics Department, Cornell University, Ithaca, New York 14853
AND
K E N N E T H B I L S K I
lnformatics, Incorporated, Palo Alto, California 94303
Received May 8, 1980; revised October 21, 1980
We examine the response of Martian climate to changes in solar energy deposition caused by variations of the Martian orbit and obliquity. We systematically investigate the seasonal cycles of carbon dioxide, water, and dust to provide a complete picture of the climate for various orbital configurations. We find that at low obliquity (15 °) the atmospheric pressure will fall below 1 mbar; dust storms will cease; thick permanent CO2 caps will form; the regolith will release CO2; and H20 polar ice sheets will develop as the permafrost boundaries move poleward. At high obliquity (35 °) the annual average polar temperature will increase by about 10°K, slightly desorbing the polar regolith and causing the atmospheric pressure to increase by not more than 10 to 20 mbar. Summer polar ground temperatures as high as 273°K will occur. Water ice caps will be unstable and may disappear as the equilibrium permafrost boundary moves equatorward. However, at high eccen- tricity, polar ice sheets will be favored at one pole over the other. At high obliquity dust storms may occur during summers in both hemispheres, independent of the eccentricity cycle. Eccentricity and longitude of perihelion are most significant at modest obliquity (25°). At high eccentricity and when the longitude of perihelion is close to the location of solstice hemispherical asymmetry in dust- storm generation and in polar ice extent and albedo will occur.
The systematic examination of the relation of climate and planetary orbit provides a new theory for the formation of the polar laminae. The terraced structure of the polar laminae originates when eccentricity and/or obliquity variations begin to drive water ice off the dusty permanent I-L20 polar caps. Then a thin (meters) layer of consolidated dust forms on top of a dirty, slightly thicker (tens of meters) ice sheet and the composite is preserved as a layer of laminae composed predominately of water ice. Because of insolation variation on slopes, a series of poleward- and equatorward-facing scarps are formed where the edges of the laminae are exposed. Independently of orbital variations, these scarps propagate poleward both by erosion of the equatorward slopes and by deposition on the poleward slopes. Scarp propagation resurfaces and recycles the laminae forming the distinctive spiral bands of terraces observed and provides a supply of water to form new permanent ice caps. The polar laminae boundary marks the furthest equatorward extension of the permanent I-IeO caps as the orbit varies. The polar debris boundary marks the furthest equatorward extension of the annual COz caps as the orbit varies.
The Martian regolith is now a significant geochemical sink for carbon dioxide. CO2 has been irreversibly removed from the atmosphere by carbonate formation. CO~ has also been removed by regolith adsorption. Polar temperature increases caused by orbital variations are not great enough
552
0019-1035/80/120552-56502.00/0 Copyright © 1980 by Academic Press, Inc. All rights of reproduction in any form reserved.

" MARTIAN CLIMATE 553
to release large quantities of adsorbed COs. Early in Martian history, before the formation of carbonates and an extensive clay regolith, large quantities of CO2 may have resided in the atmosphere-polar cap system. Orbital variations could have initiated a high-pressure climate by driving COs out of early permanent CO2 polar caps. Prior to the formation of high-albedo iron oxides on the Martian surface, 500 mbar of atmospheric CO2 was enough to maintain the global average temperature at the freezing point of water. Such high temperatures may have played a role in creating some of the fluvial features observed on Mars.
For the present orbital configuration and climate of Mars we show that: regolith damping of the seasonal CO2 cycle is unlikely; the mean atmospheric pressure is probably in equilibrium with the regolith; the low albedo of the north H20 polar cap can be explained by an admixture of 85% ice and 15% dust; and the albedo of the polar caps as well as the polar heat budget are very sensitive to small variations in dust deposition. We suggest that a small variation in dust content of the HzO and COs caps is mainly responsible for the difference in I-£zO and CO2 deposition in the north and south polar regions at present.
INTRODUCTION
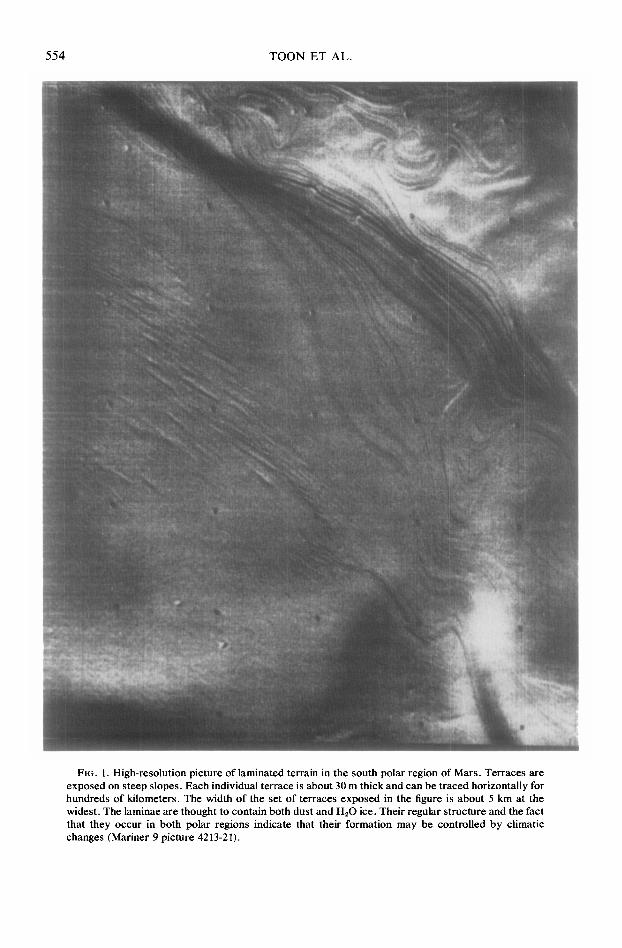
Mariner 9 spacecraft observations of Mars during 1971 and 1972, as well as more extensive Viking observations beginning in 1976, provide evidence that current Mar- tian conditions are not typical of all of Martian geologic history. The Martian po- lar regions are covered with extensive lay- ered terrain (Fig. 1), probably composed mainly of wind-deposited dust and water ice, suggesting cyclic polar processes (Cutts et al . , 1976). The existence of hun- dreds of desiccated stream beds indicates that liquid water once flowed over and under the Martian surface even though Mars is extremely cold and dry today (Ma- sursky et al. , 1977; Sharp and Malin, 1975). The abundance ratios of nitrogen isotopes and noble gases found in the current Mar- tian atmosphere require that earlier Mars had an atmosphere with much greater N2 abundance than at present and that large quantities of CO2 and I-I~O have been out- gassed but now lie in hidden reservoirs (McElroy et al. , 1977; Owen et al. , 1977; Anders and Owen, 1977; Pollack and Black, 1979).
In this paper we explore the details of one process that may be important for Martian geologic history---climate changes caused by variations in the orbit and obli- quity of Mars. Solar energy is the basic factor controlling climate on the terrestrial planets, and its distribution with latitude and with season is determined by the orbit
and spin orientation of the planet. Ward (1973, 1974, 1979) and Murray et al. (1973) have previously shown that the orbital ele- ments of Mars now undergo very large changes due to the interaction of the torque of the Sun on the aspherical body of Mars and the torque of the planets on the inclined and eccentric orbit of Mars. Ward et al. (1979) have shown that geologic processes acting to change the figure of Mars may have modified the solar torque so that the variations in the orbital elements of Mars may once have been somewhat different from the variations as they are now.
The orbital elements of Mars are subject to much greater variation than are those of Earth. The idea that terretrial ice ages might be caused by changes in the Earth's orbital elements is very old, although Mi- lankovitch (1930) is most widely known for developing it mathematically. Several em- pirical studies (Hays et al. , 1976) have shown that the periodicity of observed ter- restrial ice ages is well correlated with the periodicity of the Earth's orbital elements. There have been few theoretical attempts to model terrestrial climate changes caused by orbital element variation. Several inves- tigators (Mason, 1976; Pollard, 1978) have presented simple theoretical arguments suggesting that the energy imbalance caused by the changing orbit of the Earth was sufficient to cause ice sheet growth, but no model has yet shown an ice age develop- ment with the time history observed. Prior to the last few million years Earth was
554 TOON ET AL.
FIG. 1. High-resolution picture of laminated terrain in the south polar region of Mars. Terraces are exposed on steep slopes. Each individual terrace is about 30 m thick and can be traced horizontally for hundreds of kilometers. The width of the set of terraces exposed in the figure is about 5 km at the widest. The laminae are thought to contain both dust and H20 ice. Their regular structure and the fact that they occur in both polar regions indicate that their formation may be controlled by climatic changes (Mariner 9 picture 4213-21).
MARTIAN CLIMATE 555
warmer than at present. Large-scale ice sheets have been generally absent except during a few glacial ages (Pollack, 1979). The astronomical theory of ice ages is unable to account for such long-time-scale changes in climate.
There are two difficulties in modeling terrestrial ice ages caused by orbital changes that do not occur for Mars. First, the solar insolation changes caused by the orbital variations for Earth are very small. Second, the Earth's climate is extremely complex because of latent heat release and the transport of heat by the oceans and by the atmosphere. For Mars the orbital changes are large, oceans are absent, latent heat release is unimportant except at the poles, and the atmosphere is not dense enough to carry much heat. Thus the theo- retical problem is more tractable for Mars than for Earth. Unfortunately, our limited observational knowledge of Mars does present problems in assigning boundary conditions and in knowing the importance of various processes even on present-day Mars. In addition, as for the Earth, varia- tions in seasonal cycles are important for Mars, yet the seasonal cycles are much more difficult to model than the annual means.
The Martian climate is primarily defined by the seasonal cycles of temperature, CO2, I-I~O, and atmospheric dust. We systemati- cally explore the variations in these cycles as the orbital elements change. In Section I we review the solar insolation changes caused by orbital element changes. The temperature and carbon dioxide cycles are considered in Section II for the simple case of CO2 polar caps containing limited amounts of CO2. In Section III we discuss the CO2 cycle in the more complex case when CO2 interacts with the regolith. In Section IV we discuss the dust cycle which depends upon the CO2 cycle. In Section V we consider the water vapor cycle and the interactions of water vapor with permafrost.
One conclusion from our study of the cycles of CO2, ~20, dust, and temperature
is that the Martian climate has been rather similar to the present climate since the formation of large CO2 reservoirs in the regolith. Early in Martian history, before the formation of these reservoirs, large amounts of COg may have resided in the atmosphere. In Section VI we discuss the nature of the climate when the atmospheric pressure was greater.
Our discussions of the theory of the variations of the volatile, temperature, and dust cycles are summarized at the end of each section. In Section VII we present an overview of the Martian climate for various orbital configurations and discuss the ob- servational evidence for the predicted cli- mate changes. In particular a new theory of the formation and evolution of the polar laminae is suggested.
I. SOLAR INSOLATION VARIATION
There are three orbital elements which affect solar insolation and which are each apt to change significantly: obliquity, 0; eccentricity, e ; and longitude of perihelion, to. The obliquity is the angle between a planet's spin axis and its orbit normal. As 0 increases, the planet's pole tilts further away from the orbit normal so that the polar energy supply in the summertime is increased. Changing 0 causes neither varia- tion in the planetwide energy received nor hemispherical asymmetry. The Earth's ob- liquity is now 23.5 ° and varies between 22. l and 24.5 ° with a period of about 4 × I04 years (Berger, 1976; Hays et al., 1976). The obliquity of Mars is now 25.2 ° and oscillates by about _+ 13 ° with a dominant periodicity of 1.2 × 10⁵ years and a modulation period of about 1.3 × 10⁶ years (Ward, 1979). The Martian obliquity is forced by torques near a resonance condition so that the mean obliquity also slightly oscillates. Major geo- logic events, such as the formation of the Tharsis ridge, may have altered the proxim- ity to the resonance condition, and earlier Mars may have had a mean obliquity near 32 ° with maxima and minima of 45 and 25 ° . Even more extreme values are possible

556 TOON ET AL.
under dynamically allowed motions that have not been fully explored theoretically (Ward et al., 1979).
The eccentricity of a planet's orbit de- scribes the departure from circularity. Since the solar flux at a planet depends upon the square of the planetary distance from the Sun, an eccentricity change alters the energy received annually by a planet. However, the magnitude of the alteration is negligible for the climate changes to be discussed. On an annual average changes in e do not redistribute energy with latitude and do not create asymmetry between the hemispheres. The eccentricity of the Earth's orbit varies from 0 to 0.06, with a period near 9.5 x 10⁴ years (Berger, 1976); it is presently 0.0167. For Mars the present eccentricity is 0.09 and its minima and maxima are 0 and 0.14 (Ward, 1979). The oscillation has two superposed periods: one of 1.8 to 2.3 x 10 s years with an amplitude
of about 0.1 and the other of 9.5 × 10⁴ years with an amplitude of 0.04.
The longitude of perihelion is the angle between the data of equinox and the time of perihelion passage. For Earth and Mars, the equinoxes precess through 360 ° with periods of about 2.1 × 10⁴ and 1.75 x 10⁴ years (Hays et al., 1976; Ward, 1974). The precession of the equinoxes causes no change in the annual average solar insola- tion. However, for an eccentric orbit, both the diurnal and seasonal average insolation are strongly affected by the time of perihe- lion passage so that latitudinally and hemi- spherically asymmetric energy changes oc- cur. • Ward (1974) has previously developed
formulas to calculate the daily and annually averaged insolation from the orbital ele- ments. The daily averaged insolation at latitude 5, with solar constants So at the mean Mars-Sun distance is
i = So Ill + e cos v )2] (7 / s ines in8 + sin~9 cos ecos 8) (I + e~) 2 J \ rr "
(1)
Physically, the term in the first bracket represents the change in solar intensity caused by the r -2 variation in the Mars-Sun distance. The true anomaly of the Sun, v, measures orbital position from perihelion. The second bracket contains two geometric effects: the length of the Martian day at latitude 8, as well as the angle between the local surface normal and the noontime solar beam. These depend directly on solar lati- tude ~, and solar longitude 0, and indirectly on 8, 0, v, and to (Ward, 1979).
Ward (1974) presented plots of [ for various latitudes, eccentricities, and obliq- uities. For obliquities and eccentricities within the range of Martian values the equatorial insolation varies moderately through the year while the polar insola- tion varies from zero to a value larger than that at the equator (for O > 17°).
The poles can receive more summertime
insolation than the equator because the distance around the latitude circle in the polar regions is much less than that in the equatorial regions. The equatorial regions receive sunlight during the day but not at night, so large daily temperature fluctua- tions occur. During the polar summer the Sun never sets, giving no daily temperature fluctuations.
Figure 2 presents calculations by Ward (1974) of the annual average solar insolation for various obliquities. It is important to note that the energy supplied to the equator is a weak function of obliquity compared with the energy supplied to the pole. For obliquities larger than 54 ° the poles receive more annual average energy than the equa- tor. Even so, the poles only receive the energy during summer, so the equatorial energy will undergo a smaller seasonal os- cillation than does the polar energy. The

MARTIAN CLIMATE 557
,5 i i
.4 t 90°
v 30.
01/I" ,
90 60 30 0 LATITUDE, deg
FIG. 2. The latitude dependence of the annual average solar insolation expressed as a fraction of the solar constant at 1.52 AU for various obliquities. Ward (1974) pointed out that for obliquities less than 50 ° the polar insolation is a strong function of obliquity, but the equatorial energy deposition is a weak function of obliquity. As obliquity increases, polar insolation in- creases but equatorial insolation declines.
annum average insolation is a very weak function of e.
It should be noted that time series for the insolation reflect the basic periodicities in 0, e, and to in a complex manner. It is partly for this reason that for the Earth compari- sons of simple climate theories with ice age data have proved elusive (Hays et al., 1976).
II. THE SEASONAL CYCLES OF COz AND TEMPERATURE WHEN CO2 POLAR DEPOSITS
ARE LIMITED
In previous models of climate change on Mars it was assumed that Mars had large permanent CO2 polar caps (Ward et al., 1974; Gierasch and Toon, 1973; Sagan et al., 1973). Latent heat exchange with solid COs polar caps would maintain the polar regions at a constant temperature through- out the year. Therefore, previous climate models were based primarily upon annual average calculations. Viking observations, however, show that the north permanent polar cap does not contain COs and the south permanent polar cap probably con- tains no more than a small amount of COs, if any (Kieffer et al., 1976; James et al., 1979). Therefore, we have made new calcu- lations of the COs and temperature cycles assuming that not enough COs exists to
form permanent CO2 polar caps under present Martian conditions.
(a) M o d e l Descript ion
The current Martian atmospheric pres- sure is so low that atmospheric heat trans- port is negligible (Gierasch and Toon, 1973). Hence, the ground temperature at any location is determined primarily by local radiative and latent heat sources. At present water does not supply much latent heat, nor do globally significant water clouds form. Hence, a model considering only CO2 is a good description for the current climate and for small changes about this condition.
In this paper we employ a model that is essentially identical to those of Leighton and Murray (1966) and Kieffer et al. (1977). Our model balances absorbed solar radia- tion, infrared radiation from the surface, and heat conduction into the ground. COz condenses whenever the ground tempera- ture falls below the temperature at which the atmospheric pressure equals the vapor pressure above solid CO2. The heat diffu- sion equation is solved with a semi-implicit scheme developed by Cuzzi and Muhleman (1972). The ground is divided into ten 1.5- cm layers and ten 15-cm layers; the total depth is approximately two seasonal ther- mal wavelengths. The model has 5 ° latitude grid points and it calculates the energy balance every half hour, updating the changing solar insolation every 5 days. The model was run for 10 years to achieve stability, with the lower-layer temperature updated to the annual average after each year to avoid a long lag time. The 9th- and 10th-year temperatures and pressures were consistent to within 0.01°K and 0.01 mbar.
The model surface albedo is assumed to be 0.25, within the error bars of the Viking value of 0.214 _ 0.063 (Kieffer et al., 1977). The Viking mean value itself may be some- what low because of incomplete coverage of Mars by the spacecraft observations. We have not treated the albedo of the perma- nent I-I~O polar caps since they are of small

558 TOON ET AL.
geographic extent. We assume that: the CO2 frost albedo is 0.65; the soil density is 1.6 g cm-3; the thermal inertia is 0.006 cal cm -2 sec -1 deg-1; and, the specific heat is 0.17 cal g-1 deg-1. All these values are close to those adopted by Kieffer et al. (1977). The t h e r m a l balance of the a tmosphere is not considered in detail, so the energy received by the ground from atmospher ic infrared radiation cannot be precisely cal- culated. We treat the a tmospher ic radiation as 1% of the noon solar radiation. We use a ground emissivi ty of 0.9. Kieffer et al. (1977) assume that the a tmosphere radiates 2% of the noon solar radiation and that the ground emissivi ty is 1. These differences between the two models are mutually com- pensating and neither affects surface tem- perature by more than a few degrees.
An important assumption of our model is that the total amount of CO2 in the atmo- sphere and seasonal polar caps is about 9 mbar . We chose this value because it makes the CO,, caps d isappear near solstice under present conditions, so permanent CO2 polar caps are not found at ei ther pole. The a tmosphere is known to contain about 6 mbar of CO2 and models of the seasonal caps suggest that they contain no more than a few millibars of CO2 (Briggs, 1974; Davies et al. , 1977).
There are several features of the present Martian climate that are not well t reated by models such as ours. For example , the models are not meant to follow accurately the details of polar cap recession, so they do not have albedos which are functions of frost thickness. Nei ther do the models con- sider the polar hood which affects the polar radiation balance. Of course, all parame- ters, such as thermal inertia and albedo, vary strongly with location about the mean values we use; in addition some soil proper- ties may be functions of depth. Kieffer et al. (1977) report very low polar night tem- peratures , well below those that should occur if CO2 latent heating maintains the tempera ture at the frost point. They suggest that the winter polar a tmosphere becomes
depleted in COz and enriched in minor species which would influence the polar energy balance. However , the observed low tempera tures may instead reflect low surface emissivi ty or the presence of high clouds. Until the observat ions are more complete ly unders tood they cannot be eas- ily considered in models.
We have modeled two orbital con- figurations. In the first, 0 = 15, 25, 35, and 45 ° for e = 0. These models have complete symmet ry between the hemi- spheres and the seasonal cycle is indepen- dent of to. The values of 0 represent the ex t reme reasonable values for the current oscillation cycle (15 to 35 ° ) and the hypo- thetical oscillation (Ward et al., 1979) prior to the format ion of the Tharsis ridge (25 to 45°). Values of 0 slightly smaller than 15 ° may actually be reached (e.g., I 1°), but the corresponding climates will p robab ly not be substantially different f rom those at 15 ° .
The other situation we have modeled is the case when e = 0. ! 4, its max imum value. Again we study 0 = 15, 25, 35, and 45 °. We have set to = 270 ° so that solstice occurs at perihelion. Thus, one summer pole receives the max imum possible insolation. We have also per formed one calculation in which 0 = 45 ° and to = 0 ° so that perihelion is at equinox, producing the max imum equato- rial insolation at one equinox and the mini- mum insolation at the other. The equato- rial, equinoctial insolation max ima are independent of 0.
(b) Ca lcu la ted T e m p e r a t u r e and P r e s s u r e Cyc les , e = 0
Figure 3 illustrates calculations of daily average surface tempera tures as a function of latitude and t ime of year for e = 0 and various values of 0. Mars present ly has e = 0.09, 0 = 25 ° , and to = 250 ° , so it is intermediate be tween the case shown in Fig. 3B and that shown in Fig. 6A. In Fig. 3B the summer tempera tures are nearly independent of latitude. The polar annual cap sublimes away somewhat after the so- lar energy peaks because of the finite en-

MARTIAN CLIMATE 559
250
o
~ 200
g
~, 150
130
i f i , i i i i i
- - . - - 90 ° L A T I T U D E W I T H A = 0 .65 - - - - - 60 ° Pt = 8 .9 m b a r
. . . . 30 ° e = 0
_____ 0 ° 8 = 15 ° 90 ° w i t h A = 0 .40 co = 270 °
/ /"
i i i i i i 810 i i 200 240 280 320 O 4 0 120 160
S O L A R A N O M A L Y , d e g
o .
~ 250
uJ 200
0 i 150
i ~ i i ~ , i i i / 90 ° L A T I T U D E
- - - - - - 60° Pt = 8 .9 m b a r
. . . . 30° e = 0 - I
------ O° 0 = 25 ° - ]
~ - . . . ~ . co = 270 ° ~ ~ ~ / ~ - - " ~ -
. . . . . 7..~ _ .~ ~ _ _ ~ - . . . . . -
/' / ~ \ ' \
200 240 280 320 0 0 0 120 160
S O L A R A N O M A L Y , d e g
o
~z: '250
~ 20o
150
i , f i i , i i i
- - 90 ° L A T I T U D E
_ _ _ - - 60 ° Pt = 8 .9 m b a r
30 °
/
/ / ! ~ \ "'-,
i i i i i / i L i 200 240 280 320 6 4 0 80 120 160
S O L A R A N O M A L Y , d e g
, , i q 90 ° L A T I T U D E
o~ - - - - - 60 °
~:" 250 . . . . 3 ° ° m~ - - - - _ 0 °
/ / / / /
200 /
1 5 0 ~
I I I 200 240 280 320
Pt = 8 .9 r n b a r
e = O
0 = 45 °
, w = 270 °
~\ \\\ ' \ \~\
i i I i i / 0 40 80 120 160
S O L A R A N O M A L y . d e g
FIG. 3. The daily averaged ground temperature at var ious latitudes is i l lustrated for perihel ion occurr ing at solstice, a circular orbit , and varying obl iquity . All the ca lculat ions e m p l o y a CO~ albedo A = 0.65 and a CO= abundance o f 8.9 mbar e x c e p t for o n e case in (A) w h e r e the calculat ion for the
polar temperatures w a s run with A = 0.4. The seasona l variat ion in polar temperature s h o w s that l o w CO albedos will prevent permanent polar cap formation. A n o t h e r case was run with A = 0.65 bu t P = 5 mbar . T h e cons tant l o w polar temperature s h o w s that, if the a lbedo is high, a permanent polar cap will form e v e n if the abundance o f CO~ is low. Parts (C) and (D) indicate that high polar s u m m e r
temperatures o c c u r at large obl iquity .
ergy required to evaporate the high-albedo COz frost. During most of the year CO2 deposition maintains polar temperatures constantly near 150°K. The amplitude of the thermal seasonal wave increases with lati- tude. All these results are in basic agree- ment with observations of Mars.
At obliquities greater than 35 ° the sum- mer polar temperatures exceed summer equatorial ones. In fact, for O = 45 °, sum- mer polar ground temperatures exceed 273°K throughout the entire day for about 45 Martian days. Of course on Mars under
present conditions low latitudes experience very large excursions of daily temperature, which often have peaks exceeding 273 ° for portions of the day (Kieffer et al . , 1977). As the obliquity increases, the polar CO,, de- posits evaporate earlier and earlier since the sunlight is more intense because of the higher sun angle and the greater length of the summer day at subpolar latitudes. How- ever, polar CO2 ice deposits form further equatorward during winter since the length of the winter day is lessened at higher obliquity. As the obliquity increases, the

560 TOON ET AL.
magnitude of the annual thermal wave grows at all latitudes.
As the obliquity becomes less than 25 ° , the poles become colder, the equator be- comes warmer , and the annual thermal wave ampli tude decreases. The behavior of polar CO., depends upon its albedo. In Fig. 3A we present two alternate models: one which inhibits polar cap format ion due to very restricted CO., abundance (P = 5 mbar and CO., f rost a lbedo Aca2 = 0.65); and one which inhibits polar cap format ion due to enhanced solar heating (P = 9 mbar and Aco., = 0.4). Permanent polar caps form only for the case with higher albedo.
A high polar cap albedo at low obliquity is the more likely case. The permanent north polar cap of Mars, composed of H.,O, has an albedo near 0.4 (Kieffer et al., 1976). There are two reasons for the low albedo. Mars is present ly a dusty place, and the thickness of wa te r ice annually sublimed and redeposi ted on the poles is small (.~ 1 cm). Hence the dust-to-ice ratio is large and the ice is not self-cleaning. For CO., perma- nent deposits neither o f these effects should occur. A high-albedo cap causes a low atmospher ic pressure (Fig. 4) and at low atmospher ic pressure dust lifting will not
14 I i J i i i r i i
13 15 "~ O B L I Q U I T Y W I T H A = 6.BS
12 _ _ _ _ _ _ 2 6 °
.~ 11 - - . - - 3 5 ° • = 0
6 10 - - - - - 4 5 ° w = 270 °
w" . . . . 15 ° w i t h A = 0 . 4 0 A = 0 ,65
: . . . . . . . . . . . . . . . . -e-.: . . . . . . . . . . . . . . . . . . . . - 7 ~ - - (
"~ o "-.. "~ . ' \ . "-'I" ~ 4
~ s 2
o . . . . . , 8'0 ' ' 200 240 280 320 0 4 120 160 S O L A R A N O M A L Y , deg
FIG. 4. The seasonal variation of atmospheric pres- sure is shown for a circular orbit and for various obliquities. At low obliquity a permanent CO= cap may form, decreasing the pressure. Note that the annual mean pressure declines slightly as the obliquity in- creases above 25 ° because of the formation of larger annual polar caps.
0 i i i i i i
5 10 15 ° O B L I Q U I T Y W I T H A = 0 .65 • = 0
20 - - - - - - 25° w = 270 °
' 3 0 - - ' - - 35° A = 0 .65
, 0 . . . . .,,, A=0,0t( - - - - < - .
i S0 J" i I - - - - - - ~ " ' ~ , ~ ,
90 r " ' , ~ , - - ~ / , ' l i I i I k I \ 200 240 280 320 0 40 80 120 160
S O L A R A N O M A L Y , deg
FIG. 5. The seasonal variation of the CO= polar cap boundary as a function of obliquity for a circular orbit. The annual cap is larger for larger obliquity.
occur (Ward et al., 1974; Pollack, 1979). Fur thermore , our model with A = 0.65 suggests that 100 cm of polar CO,, will annually be deposited and removed at O = 15 ° , cleaning the CO,, each year.
Figures 4 and 5 show how atmospher ic pressure P and the location of the polar cap boundary vary with time of year for various 0. As 0 increases the polar cap boundary moves equatorward , the annual mean at- mospher ic pressure decreases slightly, and the ampli tude of the seasonal pressure wave increases. Earl ier models with unlim- ited CO2 (Ward et al., 1974; Gierasch and Toon, 1973) predicted large increases in P with increasing 0. Ward et al. (1974) also found, even with unlimited CO2, that an- nual polar caps would extend to lower latitudes when the obliquity increased, as Fig. 5 indicates. However , with limited CO2, the seasonal caps contain less CO,, than with unlimited CO2 and do not reach latitudes as low. The reason that the atmo- spheric pressure decreases with increasing obliquity is that greater amounts of CO2 go into the larger seasonal cap.
I f the polar albedo remains high for per- manent COz caps, then at 15 ° obliquity the annual pressure will be quite low, 1 mbar or less. The precise value of a tmospher ic pres- sure at low 0 is sensitive to the choice of the CO2 albedo. Ward et al. (1974) chose Aco~ = 0.70 and found =that-at 0 = 15 ° atmo- spheric pressures were only a few tenths of a millibar.
M A R T I A N C L I M A T E 561
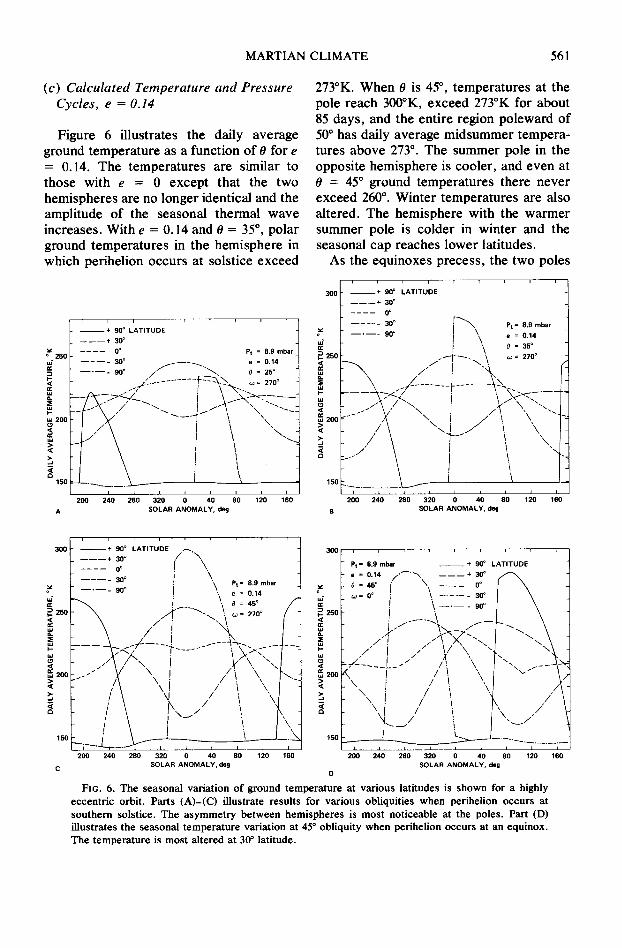
(c) Calculated Temperature and Pressure Cycles, e = 0.14
Figure 6 illustrates the daily average ground tempera ture as a function of 0 for e = 0.14. The tempera tures are similar to those with e = 0 except that the two hemispheres are no longer identical and the amplitude of the seasonal thermal wave increases. With e = 0.14 and 0 = 35 °, polar ground tempera tures in the hemisphere in which perihelion occurs at solstice exceed
f i m 200
> <
150
i , , r , r , r + 90 ° LAT ITUDE
- - - - + 30 ° . . . . 0° Pt = 8.9 mbar
30 ° - - - e = 0.14 - - ' - - - 90 ° J ~ ' - " ~ ' ~ . 0 = 25 °
S"L_ . . . . . . . . F ~ ' ~ . ,~ : 27o o
# " X J , ~ ! k - - - " x - . _
- /X - - i - \ -"-..-- L ~ \ i \ "'-.
-I \ i _L . . . . . . . L _ _ - , ',
i i i i i i i i I
200 240 280 320 0 40 80 120 160 SOLAR A N O M A L Y , deg
273°K. When O is 45 °, t empera tures at the pole reach 300°K, exceed 273°K for about 85 days, and the entire region poleward of 50 ° has daily average midsummer tempera- tures above 273 ° . The summer pole in the opposite hemisphere is cooler, and even at 0 = 45 ° ground tempera tures there never exceed 260 ° . Winter tempera tures are also altered. The hemisphere with the warmer summer pole is colder in winter and the seasonal cap reaches lower latitudes.
As the equinoxes precess , the two poles
:00";AT,TU' E . . . . l -:-+ Y [- . . . . 30° [ ~ ' ~ . P, = 8.9 mbar
° ~ ~- . . . . 90 ° l \ e : 0.14
~= 25ol- " - i - ~ - \ <~ = 27°° < i ' ~ . / " " ~ .
= 2 9 0 v - - ,~ \ i / \ \ " / \ \ - . . i i / i '\
/ \ ~ r ~ ~ " \
15o . . . . . . . . . ~ \ I i i i i i 410 i i i
200 240 280 320 0 80 120 160 B SOLAR A N O M A L Y , deg
f i i i . 1
:d 300 + 90 ° LAT ITUDE . ~ .
- - - - - - + 30 ° / . . . . o o i \ . . . . 30 ° / ' \ . . . . 90° i " \ Pt = 8.9 mbar
o . \ e = 0.14 I ~ o = 4 5 o
25o X ~ r - ~ . \ \ = = 270 ° \ / i "q
Xl ',, 1
i ~ " • , 7 7 7 290 240 280 320 0 40 80 120 100
C SOLAR A N O M A L Y , deg
150
390
o
~ o
i
,¢,, 200
150
, i i
Pt = 8.9 mbar _ _ + 90 ° LATITUDE e = 0.14 f ' ~ ' ~ , + 30 °
0 = 4 5 ° [ \ - - - - °° r \ ~=oo! \-:-_:::: \
/ i , , }" \ "k. "
\ \ I / i "q . ", i / i /
_ ? 2 . . . . . .
i l i i i i i i i
200 240 280 320 0 40 80 120 160 SOLAR A N O M A L Y , deg
D
FIG. 6. The seasonal variation of g round tempera ture at various latitudes is shown for a highly eccentr ic orbit. Parts (A)- (C) illustrate resul ts for var ious obliquities when perihelion occurs at southern solstice. The a symmet ry be tween hemispheres is mos t noticeable at the poles. Part (D) il lustrates the seasonal tempera ture variation at 45 ° obliquity when perihelion occurs at an equinox. The tempera ture is mos t altered at 30 ° latitude.
562 TOON ET AL.
switch roles. The intermediate case, oJ = 0, is illustrated in Fig. 6D. Here the hemi- spheres are nearly symmetr ic except for hysteresis effects. The equatorial tempera- ture shows a strong max imum at the perihe- lion equinox.
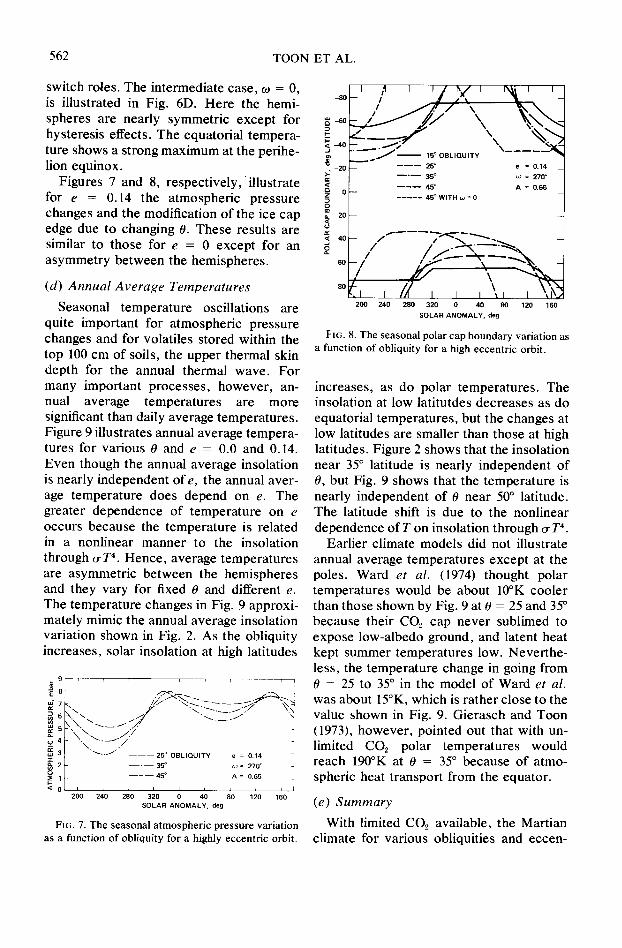
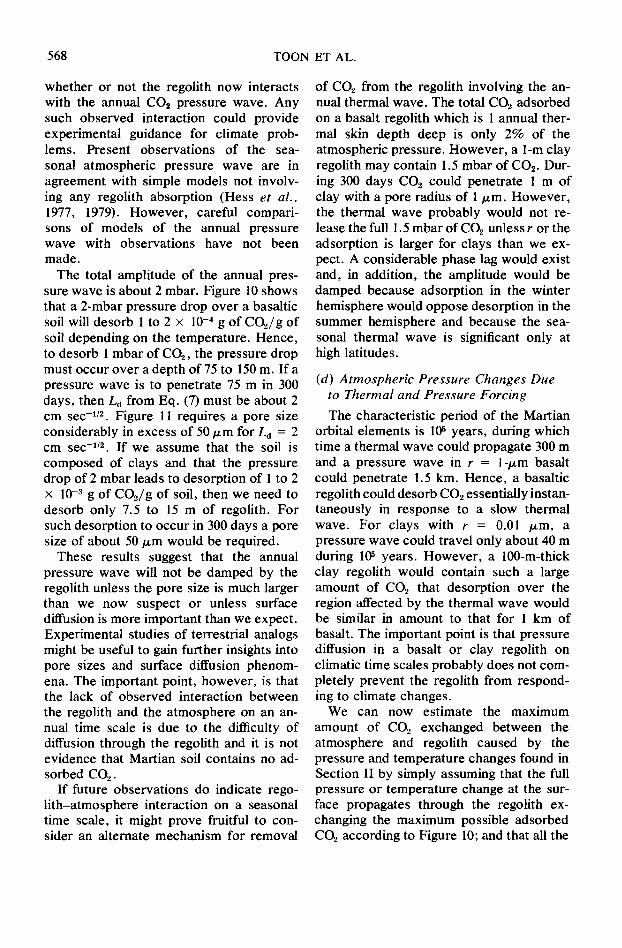
Figures 7 and 8, respect ively, i l lus t ra te for e = 0.14 the a tmospher ic pressure changes and the modification of the ice cap edge due to changing 0. These results are similar to those for e = 0 except for an a symmet ry be tween the hemispheres .
(d) Annual Average Temperatures
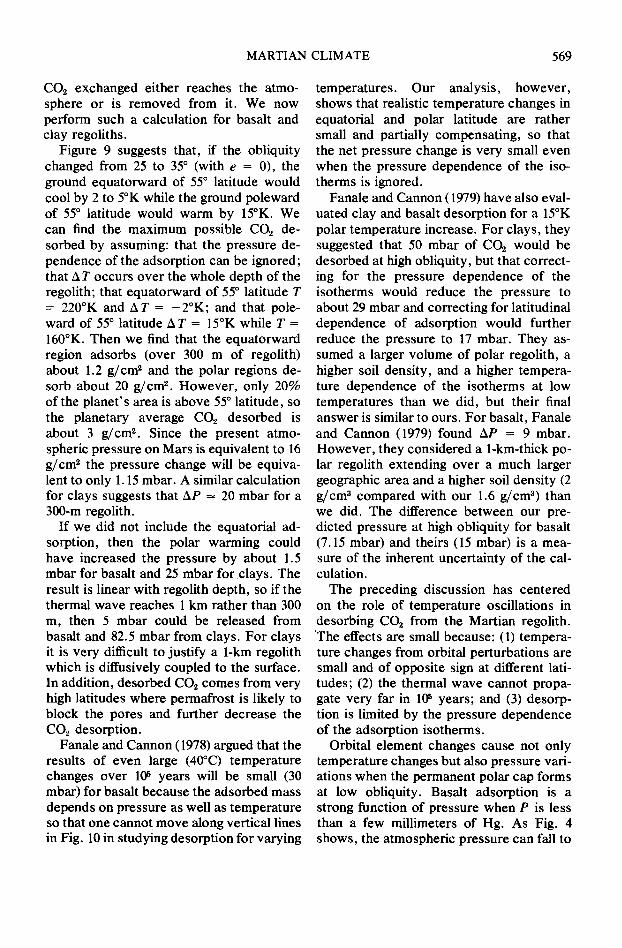
Seasonal tempera ture oscillations are quite important for a tmospher ic pressure changes and for volatiles stored within the top 100 cm of soils, the upper thermal skin depth for the annual thermal wave. For many important processes , however , an- nual average tempera tures are more significant than daily average temperatures . Figure 9 illustrates annual average tempera- tures for various 0 and e = 0.0 and 0.14. Even though the annual average insolation is nearly independent of e, the annual aver- age tempera ture does depend on e. The greater dependence of tempera ture on e occurs because the tempera ture is related in a nonlinear manner to the insolation through tr T 4. Hence , average tempera tures are asymmetr ic be tween the hemispheres and they vary for fixed 0 and different e. The tempera ture changes in Fig. 9 approxi- mately mimic the annual average insolation variation shown in Fig. 2. As the obliquity increases, solar insolation at high latitudes
9
~ 6
¢j 4
,,=,3
o
r r i i
, \ \ . / / d " "~ - / \ ' \ . ~ -~__ i J / , , z - - -
- "\\.. .1:7 - , \ . J /
- - - - - - 25 ° OBL IOUITY e = 0 .14
- - ' - - 35 ° w = 270 ~
- - - - - 45 ° A = 0 .65
<~ 0 i i L i i i i i i 200 240 280 320 0 40 80 120 160
SOLAR ANOMALY, deg
FIG. 7. The seasonal atmospheric pressure variation as a function of obliquity for a highly eccentric orbit.
- 80
- 60
I.-
~ , - 40
== -o >.. - 20
~ 0
<~ 20
¢J ~C < 40
6 O
, ' l ' Z % - - i t ~ ' t - -
, , . ,
- - - - - - - " 25 ° e = 0 .14
I . - - 35 ° <~ = 270 °
- - - - I 45 ° A = 0 .65
. . . . . 45 ° W ITH co = 0
/ / /
/ 4 , / l , , , \ , , ":,','J
200 240 280 320 0 40 80 120 160
SOLAR ANOMALY, deg
FIG. 8. The seasonal polar cap boundary variation as a function of obliquity for a high eccentric orbit.
increases, as do polar tempera tures . The insolation at low latitutdes decreases as do equatorial temperatures , but the changes at low latitudes are smaller than those at high latitudes. Figure 2 shows that the insolation near 35 ° latitude is nearly independent of 0, but Fig. 9 shows that the tempera ture is nearly independent of 0 near 50 ° latitude. The latitude shift is due to the nonlinear dependence of T on insolation through o-T 4.
Earlier climate models did not illustrate annual average tempera tures except at the poles. Ward et al. (1974) thought polar tempera tures would be about 10°K cooler than those shown by Fig. 9 at 0 = 25 and 35 ° because their CO., cap never sublimed to expose low-albedo ground, and latent heat kept summer tempera tures low. Never the- less, the tempera ture change in going f rom 0 = 25 to 35 ° in the model of Ward et al. was about 15°K, which is rather close to the value shown in Fig. 9. Gierasch and Toon (1973), however , pointed out that with un- limited CO2 polar tempera tures would reach 190°K at 0 = 35 ° because of atmo- spheric heat t ransport f rom the equator.
(e) Summary
With limited CO,, available, the Martian climate for various obliquities and eccen-

MARTIAN CLIMATE 563
2 3 0 I i I I i i I ~ I I I i i i i i 1 - -
~ 210
==.. 2oo
19o
~ 160
=" 1,o I . , 3o_8 ; ~-8'0'_,o -2o ; 2; ,'° ~o I .
LATITUDE, (leg
FIG. 9. The annual average temperature at different latitudes for various obliquities and eccentricities. Annual average temperatures for all latitudes are given for an eccentricity of 0.14, while for negative latitudes and 0 = 25 ° and 0 = 45 °, they are given for eccentrici- ties of both 0.0 and 0.14. The higher polar temperature at negative latitudes, with 0 = 25 ° and 0 = 45 °, corresponds to e = 0.0. The annual average tempera- ture variation is similar to the insolation variation illustrated in Fig. 2. The temperature is not a linear function of insolation and is a stronger function of eccentricity than is implied by the dependence of annual average insolation on eccentricity. The polar temperatures do not vary greatly between 25 and 35 ° obliquity. Annual average temperatures are important because most of the regolith responds to annual aver- age temperatures rather than daily average tempera- tures.
tricities is similar to the present climate. As the obliquity or eccentricity increase, sea- sonal extremes are exaggerated. The major changes from present-day Martian condi- tions are that very high (273°K) summer- time daily average polar ground tempera- tures occur at high obliquity and that permanent CO2 pola r caps form at low obliquity if the CO2 albedo remains high, as seems most likely. The annual average temperatures depend slightly on the or- bital parameters. The annual average po- lar ground temperature may increase by about 10 to 15°K as the obliquity in- creases from 25 to 35 ° . Previous Martian climate models erroneously assumed that Mars currently has massive COz perma- nent polar caps. These early models pre- dicted large pressure and temperature changes that are not found in the present limited CO2 model.
III. THE SEASONAL CYCLE OF COx I N C L U D I N G CO2 EXCHANGE WITH THE
REGOLITH
In the previous section we discussed Martian climate changes involving the CO2 in the atmosphere and in the annual polar caps. However, much more CO2 may lie hidden on Mars. Here we consider whether or not some of this hidden CO2 could partic- ipate in climate changes.
(a) C02 Reservoirs
Early analyses of Viking measurements of noble gas concentrations suggest that Mars outgassed 150 to 500 mbar of CO2 (Anders and Owen, 1977). Since the Pio- neer exploration of Venus, theories of the noble gas distributions on the terrestrial planets have been revised, and recent work relating the Viking observations of noble gas inventories to the abundances of other vol- atiles on Mars implies that 1 to 3 bars of CO2 may have been outgassed during Mar- tian geologic history (Pollack and Black, 1979). Much of the outgassed CO2 may now be in the form of carbonates (Toulmin et al., Anders and Owen, 1977). If 4% of the soil mass is CO2 in a carbonate phase, and if the regolith is 100 m thick, then about 800 g cm -2 of regolith could be CO2. This is equivalent to about 50 current atmospheres or about 300 mbar pressure. Unfortunately, CO2 converted to carbonates would be per- manently prevented from returning to the atmosphere barring extensive volcanic re- processing of surface materials.
CO2 may also be adsorbed on the rego- lith, as suggested by Davis (1969) and Fanale and Cannon (1971, 1974, 1978). Di- rect evidence that heated Martian soil evolves CO2 was obtained by Viking, but we cannot quantify the fraction desorbed because of the additional possibility of car- bonates breaking down (e.g., Biemanh et al., 1977).
The Martian topsoil may be composed of a combination of clays and iron oxides (Toon et al., 1976; Toulmin et al., 1977). However, the crust of Mars is most likely

564 TOON ET AL.
some type of mafic igneous rock such as basalt. Whether most of the regolith is composed of clays, like the surface layer. or basalt, like the crust, is unknown. The Fanale and Cannon (1971, 1974, 1978) ex- perimental studies of CO2 adsorption on basalt, pulverized to simulate Martian soil, suggest that a 1-km-thick basalt regolith could adsorb 300 to 800 g cm -2 of COs. In a basal t -carbonate regolith, carbonate would contain most of the CO2. Fanale and Can- non (1978, 1979) suggested that clay min- erals may adsorb 10 times more CO2 than basalts. In such a case 300 to 800 g cm -s of COs could be contained in a 100 m clay regolith. A c lay-carbonate regolith would have CO2 equally partit ioned between clay and carbonate.
To utilize adsorption data it is convenient to obtain an analytic expression to fit the available data. Figure 10 presents basalt adsorption data of Fanale and Cannon (1971, 1974, 1978, 1979) which were ob- tained for different basalt powders with different measured surface areas (5.8 m s g-1 in 1971 and 4.4 m s g-1 in 1978). Normally the volume adsorbed is directly propor- tional to the surface area, so we have normalized the data to 4.4 m s g-Z which brings the Fanale and Cannon measure- ments at 195 and 196°K into good agree- ment.
Unfortunately, there is no universal the- ory of adsorption. After rejecting several theoretically justifiable analytic forms, we found a good empirical fit to the adsorbed mass per gram of basalt at low temperature using
Pa = po (As /Ao)exp (FT)
(P /Po) x g CO2/g soil, (2)
where P is the pressure in millimeters of Hg, P0 is 1 mm, T is the temperature, p0 is 1.5 x l0 -s g COs/g soil (equivalent to 7.8 cm s STP g-l), As is the actual adsorption surface area, ,4o is 4.4 m 2 g-l , X is 0.275, and F is - 1.5 × 10-S°K. This empirical equation satisfies three impor tan t criteria: as P a p -
168°K + / FANALE AND CANNON (1978}
195°K • 196OK }
8 273°K FANALE AND CANNON (1971) o 302°K
: 160°K
O~ ~ e ~ ~ _ I . . . . J . . . . . . 302°K1
0 5 10 15 20 25 30 35 40 45 50 ATMOSPHERIC PRESSURE, mbar
A
4O
36 I 160°K
, ~ S O L I D CO2 FORMS y / / o,.,o°,q ':A'A'.E
.~ 28 I- / u19e°KI A N D C A N N O N
[ / /~ ~ 1 5 8 ° K ) ( 1 9 7 9 )
~ 24 [- ~ 180°K
d 195 ° K
8 s H / ~ - 23oo,~ o
0 10 20 30 40 50 60 70 ATMOSPHERIC PRESSURE, mbar
FIG. 10. The mass o f CO2 absorbed per g ram of soil is i l lustrated as a funct ion o f pressure for various tempera tures . In (A) the solid curves are simple ana- lytic functional fits to Fanale and C a n n o n ' s (1971, 1974, 1978, 1979) da ta for basalt . In (B) the solid curves are functional fits to Fanale and C a n n o n ' s data for clays.
proach 0, Pa approaches 0; Pa is linear in surface area; and Pa depends on only two constant coefficients, F and X.
Equation (2), as shown in Fig. 10A, over- estimates the COs adsorbed by basalt at high temperatures. However , so little COs is then adsorbed and Mars is so much colder than 300°K that this error is not significant for our work. Two important aspects of Fig. 10A are that large tempera- ture changes are needed to remove substan-

MARTIAN CLIMATE 565
tial fractions of CO2 from the ground and that the curves have a strong pressure dependence, especially below 2 mbar.
Fanale and Cannon (1979) recently per- formed clay (nontronite) adsorption mea- surements, which are illustrated in Fig. 10B along with an empirical fit using Eq. (2). In Eq. (2) we employed the same values of X and F as for basalt. We used 9 x l0 -a g COJg soil for p0. The value of As at 158°K is 78 m 2 g-1. Fanale and Cannon (1979) point out that the COs adsorption area for clays is temperature dependent because I-I~O occupies fewer adsorption sites at lower temperatures leaving more sites available for CO2. To simulate this effect we introduced additional temperature de- pendence by setting AT = A~58(158/T) 2. The poor fit to the data in Fig. 10B at 195°K illustrates that the adsorption area has a more complex temperature dependence than this. Further experimental work is necessary to obtain a meaningful improve- ment in the analytic fit, however. As for basalt, clay adsorption depends strongly on pressure for low pressures. Unfortunately the available data do not extend to low enough pressures to define the trend very well. At low temperatures (160°K) clays release about 10 times more COz than do basalts for the same temperature change. However, near 200°K clays only release a few times more COz than do basalts for a given temperature change.
The depth of the Martian regolith also determines the total CO~ adsorbed. Fanale (1976) argued that the regolith may be 1 to 2 km deep based upon photographic indica- tions from Mariner 9 and estimated ejecta volumes from craters. However, Fanale and Cannon (1979) suggested that some of the regolith material may have been lithified during Martian geologic history and they therefore adopted a mean regolith depth of a few hundred meters. Anders and Owen (1977) suggested, from comparison of pre- dicted chlorine and sulfur abundances with Viking observations of C1 and S concentra- tions in the soil, that the regolith is only 70
m deep. However, the new theories of noble gas distributions on the terrestrial planets (Pollack and Black, 1979) would probably considerably raise the predicted abundances of C1 and S and therefore con- siderably increase the estimated regolith depth. Hence, the regolith is estimated to be between 100 and 1000 m deep with an intermediate value being most likely.
(b) Characteristic Diffusion Times of CO., in the Martian Regolith
CO2 could be driven between atmosphere and regolith either by temperature or by pressure changes. In Section II we de- scribed typical surface pressure and surface temperature changes caused by orbital ele- ment variations. However, it is necessary to extrapolate these changes into the ground. A complete solution requires a coupled thermal and vapor diffusion model at several latitudes which is integrated over long time periods. Before proceeding to discuss this problem, we consider the ther- mal and vapor diffusion time scales, which are often greatly different.
The thermal skin depth (the depth where A T = e -1 of A T at the surface) is
)k t = (~I / T r ) l l 2 ( I / p s C H )
"=-- 2 .2 x 10 -2 c m sec - ' /2 (~/~)1/2. (3)
Here y is the period of the thermal varia- tion, and we have used typical Martian surface thermal inertia I (6 × 10 -a cal cm -2 sec -~/z °K), heat capacity CH (0.17 cal g-i OK-i), and soil density Ps (1.6 g cm-a). The thermal inertia, remotely sensed, is relevant for the soil surface, but at depth in the regolith it could increase because of soil compaction. The thermal conductivity also depends on pressure when the gas mean free path is comparable to the pore size in the rocks. Thermal inertia increases ap- proximately as the fourth root of pressure in the range from 1 to 100 mbar for coarse basalt powders (Wechsler and Glaser, 1965). For clays with very small pore sizes the pressure dependence might be much

566 TOON ET AL.
less. Viking observat ions produced no cor- relation be tween surface thermal inertia and elevation except for ex t reme eleva- tions, suggesting either that the pressure dependence is low or that some other factor such as particle size is more important . Due to these compact ion and pressure effects, the thermal skin depth is uncertain by a factor of several. The time for a thermal wave to reach the bot tom of a 1-km regolith is about 10 ~ years and the time with a 100-m regolith is about 104 years. A shallow rego- E 00g lith is op t imum for responding to thermal 0 t forcing.
The time scale for propagat ion of a pres- sure wave depends upon soil porosi ty , E, tortuosity, q, pore size, r, and adsorption. Viking measurements (Clark et al., 1977) suggest that E is 0.60 + 0.15. We adopt a value of 0.5 to represent the regolith column. The tortuosity (which represents the ratio of blind to open paths available to a diffusing molecule) is not known, and we take a value of 5 in agreement with Smolu- chowski ' s ideas (1968). The pore size is the most uncertain parameter .
The pore size could be fixed by the grain size of Martian soil, which is thought to be between 10 and 100 /xm (Kieffer et al., 1977; Shorthill et al., 1976). Howeve r , r is most likely to be set by the smallest avail- able particles. Toon et al. (1977) and Pol- lack et al. (1977) concluded that the size of Martian dust s torm particles was about 1 p.m, which suggests a pore radius r -< 1 p.m. In some materials the pore size distribution is bimodal, so that large pores occur be- tween grains and small pores occur on grain surfaces. Diffusion occurs preferentially in the larger pores , while adsorption occurs where mainly in the smaller ones. The radius of these smaller pores can be determined from adsorption measurements as r = ½ (pore vo lume/sur face area). For Fanale and Can- non 's basalt this calculation yields r -~ 0.05 ~m. For basalt, it is unlikely that this pore radius is the relevant one for diffusion cal- culations because it is much smaller than the dimensions of the basalt grains. How-
ever , clays are composed of very thin plates which can be closely packed. For clays the adsorption area pore size may be close to the relevant one for diffusion. A clay with 10 t imes the adsorpt ion area as basalt has r -~ 5 x 10 -a txm. Hence the possible range of r on Mars is be tween 5 × 10 -3 and 1/~m.
The diffusion equation in a porous ad- sorbing medium is (Barrer, 1967)
= E O D g O p g
o o Ot PsPa + Ds ~ p~oa, (4)
where Pg is the mass density of the gas, Dg is the effective volume diffusion coefficient, Ps is the soil density, Pa is the adsorbed mass per gram of rock, and Ds is the surface diffusion coefficient. Physically, the second te rm on the fight-hand side of Eq. (4) represents the local convers ion f rom ad- sorbed CO., to gaseous CO,, and the final term represents a surface flux which occurs on adsorbing materials as the molecules hop along the surface. We shall ignore the surface flux because its diffusion coefficient is ex t remely complex and cannot be ade- quately predicted. Fur thermore , its neglect yields a smaller error than is already present because of uncertainties about the pore size.
We can conver t Eq. (4) to a simpler form by using Eq. (2) and the ideal gas equat ion
0P _ 1 0 Kd 0 P, (5) 0t C 0z 0z
exp(FT) Poo P -
Kd E ( ~ r rr 2r/h = q - X + 4 (1 + 2r/X)
I ' 4 (1+ 2r/X)) gr (~-~f--) ~l~" +
- - - E + XPads°rbed p ,
(6)

MARTIAN CLIMATE 567
Here Rg is the CO`, gas constant and h is the ~o,
mean free path of CO`, (6 / zm at Pre f = 6 mm). Here A, = 6 /zm (6 ram/P).
The expression for Kd (Barrer, 1967) in- cludes the fact that when the pore radius is ~ 1
* E larger than the mean free path for gas ~, molecule collision the CO,, flows out along streamlines. When r/A, is less than 1 the ~ CO`, molecules collide with the pore walls ~ 10-,
and diffuse from the ground. In our case we g expect r/A, ,~ 1 (if r = 1/xm, r/A, = 0.1). In ~ the range 0 < r/A. < 1.5, Kd varies from its value when r/A, = 0 by only 5%. Hence we ~ 10-2 can extract K0 from the derivative in Eq. (5) and define a vapor diffusion skin depth as
Xd = (TI~)ll2( KdlC) in = (y/Tr)VZLo. (7)
Values of Ld are given in Fig. 11 for basalt powders having various pore sizes and tem- peratures. Figure 1I also illustrates the corresponding thermal diffusion term. For clays at low temperatures, the value of C is 10 times larger than for basalt and the diffusion length is 101/2 times smaller than those depicted in Fig. 11. Of course, clays are also very likely to have a smaller pore radius than do basalt soils.
Figure 11 shows that except for the small pore sizes typical of clays, the pressure diffusion length exceeds the thermal lengths. For example, during the time that an annual thermal wave penetrates 1 m, a pressure wave will penetrate about 5 m in basalt with r = 1 /zm. If adsorption did not occur the pressure wave could penetrate to 30 m. Adsorption greatly damps diffusion because part of any vapor phase pressure drop is made by desorption, and much more mass resides in the adsorbed phase than in the vapor phase.
It should be recognized that no experi- mental studies of diffusion of CO2 through analogs of typical Martian soils are avail- able. Studies of terrestrial analogs would be quite useful to determine more precisely the time required for COz to move through soils.
I I I I I I I I
r = 50/Jm
~ r= l O . m
~ '- NO ADSORPTION
170°K
r= 1/Jm
r = 0,01 /am
f
lO" I [ 10 20
I I I I I I 30 40 50 60 70 80
ATMOSPHERIC PRESSURE, mbar 90
FIG. 11. The diffusion wavelength is illustrated for various pressures and pore sizes for basalt. For very large pore sizes CO= can rapidly flow through the soil, but at small pore sizes CO2 cannot rapidly diffuse through the soil. For r = 1 txm we illustrate several cases of interest. We show that diffusion wavelengths for various temperatures do not differ greatly. We also demonstrate a diffusion wavelength curve for a soil that does not adsorb CO2. The presence of adsorption severely damps the pressure wavelength. Clays are generally 10 times as adsorbing as basalts. Hence the diffusion wavelengths for clays are roughly 10 t/z times smaller than those illustrated here. Also shown is the thermal diffusion wavelength, which is only weakly dependent on pressure. CO2 will normally diffuse faster than heat through basalt unless the pore size is less than about 0.1 txm. COz will diffuse faster than heat through clay unless the pore size is less than about 0.5 p,m. The quantity depicted is not a proper wavelength or skin depth until it is multiplied by the square root of the forcing period.
(c) Damping o f the Annual Pressure Wave by the Regolith
Dzurisin and Ingersoll (1975) suggested that the annual CO2 pressure wave (recall Figs. 4 and 7) might be damped if the atmosphere were in contact with an isother- mal CO2 reservoir such as the regolith. Before considering exchange of CO2 with the regolith over time scales relevant for climate, it is first of interest to consider
568 TOON ET AL.
whether or not the regolith now interacts with the annual CO2 pressure wave. Any such observed interaction could provide experimental guidance for climate prob- lems. Present observations of the sea- sonal atmospheric pressure wave are in agreement with simple models not involv- ing any regolith absorption (Hess et al., 1977, 1979). However , careful compari- sons of models of the annual pressure wave with observations have not been made.
The total amplitude of the annual pres- sure wave is about 2 mbar. Figure 10 shows that a 2-mbar pressure drop over a basaltic soil will desorb 1 to 2 × 10 -4 g of CO2/g of soil depending on the temperature. Hence, to desorb 1 mbar of CO2, the pressure drop must occur over a depth of 75 to 150 m. If a pressure wave is to penetrate 75 m in 300 days, then Ld from Eq. (7) must be about 2 cm sec -lj2. Figure 11 requires a pore size considerably in excess of 50/xm for Lo = 2 cm sec -1/z. If we assume that the soil is composed of clays and that the pressure drop of 2 mbar leads to desorption of 1 to 2 × 10 -3 g of CO2/g of soil, then we need to desorb only 7.5 to 15 m of regolith. For such desorption to occur in 300 days a pore size of about 50/~m would be required.
These results suggest that the annual pressure wave will not be damped by the regolith unless the pore size is much larger than we now suspect or unless surface diffusion is more important than we expect. Experimental studies of terrestrial analogs might be useful to gain further insights into pore sizes and surface diffusion phenom- ena. The important point, however , is that the lack of observed interaction between the regolith and the atmosphere on an an- nual time scale is due to the difficulty of diffusion through the regolith and it is not evidence that Martian soil contains no ad- sorbed CO2.
If future observations do indicate rego- l i th-atmosphere interaction on a seasonal time scale, it might prove fruitful to con- sider an alternate mechanism for removal
of CO2 from the regolith involving the an- nual thermal wave. The total COs adsorbed on a basalt regolith which is 1 annual ther- mal skin depth deep is only 2% of the atmospheric pressure. However , a 1-m clay regolith may contain 1.5 mbar of COs. Dur- ing 300 days CO2 could penetrate 1 m of clay with a pore radius of 1/~m. However , the thermal wave probably would not re- lease the full 1.5 mbar of CO2 unless r or the adsorption is larger for clays than we ex- pect. A considerable phase lag would exist and, in addition, the amplitude would be damped because adsorption in the winter hemisphere would oppose desorption in the summer hemisphere and because the sea- sonal thermal wave is significant only at high latitudes.
(d) Atmospheric Pressure Changes Due to Thermal and Pressure Forcing
The characteristic period of the Martian orbital elements is 105 years, during which time a thermal wave could propagate 300 m and a pressure wave in r = l-/zm basalt could penetrate 1.5 km. Hence, a basaltic regolith could desorb COs essentially instan- taneously in response to a slow thermal wave. For clays with r = 0.01 /zm, a pressure wave could travel only about 40 m during 105 years. However , a 100-m-thick clay regolith would contain such a large amount of CO2 that desorption over the region affected by the thermal wave would be similar in amount to that for 1 km of basalt. The important point is that pressure diffusion in a basalt or clay regolith on climatic time scales probably does not com- pletely prevent the regolith from respond- ing to climate changes.
We can now estimate the maximum amount of CO,, exchanged between the atmosphere and regolith caused by the pressure and temperature changes found in Section II by simply assuming that the full pressure or temperature change at the sur- face propagates through the regohth ex- changing the maximum possible adsorbed CO2 according to Figure 10; and that all the
MARTIAN CLIMATE 569
COz exchanged either reaches the atmo- sphere or is removed from it. We now perform such a calculation for basalt and clay regoliths.
Figure 9 suggests that, if the obliquity changed from 25 to 35 ° (with e = 0), the ground equatorward of 55 ° latitude would cool by 2 to 5°K while the ground poleward of 55 ° latitude would warm by 15°K. We can find the maximum possible COo de- sorbed by assuming: that the pressure de- pendence of the adsorption can be ignored; that A T occurs over the whole depth of the regolith; that equatorward of 55 ° latitude T = 220°K and AT = -2°K; and that pole- ward of 55 ° latitude A T = 15°K while T = 160°K. Then we find that the equatorward region adsorbs (over 300 m of regolith) about 1.2 g/cm 2 and the polar regions de- sorb about 20 g/cm z. However, only 20% of the planet' s area is above 55 ° latitude, so the planetary average CO2 desorbed is about 3 g/cm 2. Since the present atmo- spheric pressure on Mars is equivalent to 16 g/cm 2 the pressure change will be equiva- lent to only 1.15 mbar. A similar calculation for clays suggests that Ap = 20 mbar for a 300-m regolith.
If we did not include the equatorial ad- sorption, then the polar warming could have increased the pressure by about 1.5 mbar for basalt and 25 mbar for clays. The result is linear with regolith depth, so if the thermal wave reaches 1 km rather than 300 m, then 5 mbar could be released from basalt and 82.5 mbar from clays. For clays it is very difficult to justify a 1-km regolith which is diffusively coupled to the surface. In addition, desorbed CO2 comes from very high latitudes where permafrost is likely to block the pores and further decrease the CO2 desorption.
Fanale and Cannon (1978) argued that the results of even large (40°C) temperature changes over 105 years will be small (30 mbar) for basalt because the adsorbed mass depends on pressure as well as temperature so that one cannot move along vertical lines in Fig. 10 in studying desorption for varying
temperatures. Our analysis, however, shows that realistic temperature changes in equatorial and polar latitude are rather small and partially compensating, so that the net pressure change is very small even when the pressure dependence of the iso- therms is ignored.
Fanale and Cannon (1979) have also eval- uated clay and basalt desorption for a 15°K polar temperature increase. For clays, they suggested that 50 mbar of COz would be desorbed at high obliquity, but that correct- ing for the pressure dependence of the isotherms would reduce the pressure to about 29 mbar and correcting for latitudinal dependence of adsorption would further reduce the pressure to 17 mbar. They as- sumed a larger volume of polar regolith, a higher soil density, and a higher tempera- ture dependence of the isotherms at low temperatures than we did, but their final answer is similar to ours. For basalt, Fanale and Cannon (1979) found AP = 9 mbar. However, they considered a 1-km-thick po- lar regolith extending over a much larger geographic area and a higher soil density (2 g/cm a compared with our 1.6 g/cm a) than we did. The difference between our pre- dicted pressure at high obliquity for basalt (7.15 mbar) and theirs (15 mbar) is a mea- sure of the inherent uncertainty of the cal- culation.
The preceding discussion has centered on the role of temperature oscillations in desorbing CO2 from the Martian regolith. 'The effects are small because: (1) tempera- ture changes from orbital perturbations are small and of opposite sign at different lati- tudes; (2) the thermal wave cannot propa- gate very far in 10 s years; and (3) desorp- tion is limited by the pressure dependence of the adsorption isotherms.
Orbital element changes cause not only temperature changes but also pressure vari- ations when the permanent polar cap forms at low obliquity. Basalt adsorption is a strong function of pressure when P is less than a few millimeters of Hg. As Fig. 4 shows, the atmospheric pressure can fall to
570 TOON ET AL.
1 mm or less at low 0. Such low pressures could lead to nearly complete desorption of a basaltic, r = 1/xm, Martian regolith. (The temperature changes due to the altered 0 have negligible effects on adsorption by comparison.) For clays with r -~ 0.01 /zm perhaps only 40 m could be desorbed. For clays we are not certain that the isotherms are strongly sloping with pressure at 1 mm, but a strong slope must develop at some low pressure. In either case, permanent CO., caps may form not only from the present atmospheric mass but also from the adsorbed mass. Assuming that the perma- nent caps occupy 1% of the area of Mars, the thickness of a permanent cap formed from the present atmosphere would be about 10 m. If there is even as little as 30 times as much CO,, mass in the regolith as in the current atmosphere, the polar caps at low obliquity could reach a depth of 300 m.
It is interesting to speculate concerning possible hysteresis effects in the regoli th- polar cap system. For example, suppose declining obliquity reduces the atmospheric pressure to a very low value and slowly desorbs the regolith. If some other process, such as an episode of volcanic activity, occurred to blacken the polar cap, then the CO,, could be driven into the atmosphere. The CO,, might not return to the cap if feedback effects maintained high polar tem- peratures (Gierasch and Toon, 1973) and the CO2 could not reenter the regolith im- mediately because of diffusion-time con- straints.
(e) Regolith Maintenance o f Mean Atmospheric Pressure over Geologic Time Scales
The remaining question concerning rego- lith adsorbed CO2 is its role in maintaining the mean Martian atmospheric pressure. Leighton and Murray (1966) noted that the Martian atmospheric pressure is very close to the vapor pressure of CO2 at reasonable Martian polar temperatures. Ingersoll (1974) pointed out, however , that the polar temperature, and therefore the vapor pres-
sure, is a very strong function of surface albedo, which is not well known, so that the equality of the vapor pressure and the ob- served pressure is not very exact. Viking results (Kieffer et al., 1976) have now shown that the north polar permanent cap of Mars is not solid CO2, although the south polar cap may contain some solid CO,,. Since the behavior of the south polar cap during Viking observations seemed anoma- lous (James et al., 1979), it is likely that the south polar cap does not contain a substan- tial CO,, reservoir. Even if the entire cap were CO,, it would only contain the equiva- lent of 6 mbar of CO,, (Fanale and Cannon, 1979). Hence , the atmospheric pressure is probably not the vapor pressure of polar CO,, deposits. This means that the observed pressure is either a nonequilibrium tran- sient or that it is in equilibrium with the regolith as previously suggested by Fanale and Cannon (1978).
Figure 11 emphasizes that for moderate pore sizes even a 1-km regolith would be in equilibrium with the atmosphere on time scales longer than about 1@ years, which is much shorter than reasonable time scales for outgassing, or carbonate formation. In addition, the annual mean pressure is not a strong function of obliquity except for ob- liquities less than 20 ° , or greater than 30 ° , and Ward 's (1979) calculations suggest that the Martian obliquity has not been lower than 20 ° nor higher than 30 ° for nearly 5 × 10⁵ years. Hence , it is likely that the current pressure is in equilibrium with the regolith. As previously discussed, the thermal wave due to the obliquity oscillation should pro- duce only small pressure changes.
If the atmospheric pressure is controlled by regolith adsorption, then the present atmospheric pressure on Mars is the result of the total CO2 outgassed, the present regolith depth, and the present conversion of CO2 into nonadsorbed forms. The pres- sure is exceedingly sensitive to any modification of these parameters. For ex- ample, if the depth of a basalt regolith were increased by 20% the adsorbed CO,, per

MARTIAN CLIMATE 571
gram would decrease by 20% and Fig. 10 indicates that the atmospheric pressure would fall by about 50%. Likewise, CO2 is probably converted to carbonate on Mars, although we have no direct evidence of the carbonate abundance (Gooding, 1978). If 4% of the regolith is CO2 tied up in carbon- ates, then approximately 20 times more CO2 is stored as carbonate than as adsorbed CO~ on basalt. Figure l0 shows that in- creasing the adsorbed COs by a factor of 20 by converting the carbonates to CO2 would lead to an immense increase in the atmo- spheric pressure. The precise pressure can- not be calculated because the adsorption at high pressures has not been measured and many adsorption isotherms have greatly increased dependence of adsorption on pressure at higher pressures (e.g., Bru- nauer et al., 1967). However, for a current regolith containing 50 mbar of adsorbed CO2, it would certainly seem possible for the atmospheric pressure to exceed 150 mbar if all the hypothetical carbonates were converted to adsorbed CO2. If the regolith is composed to clays, then carbonates may contain only 50% of the total CO2, and converting the carbonates to CO2 would only result in a modest pressure increase.
Over geologic history various processes, such as greenhouse warming, might have maintained the Martian surface tempera- ture at much higher temperatures than at present. The curves in Fig. 10 show that at low temperatures basalt adsorption is a strong function of pressure. For example, all the CO2 desorbed by a sample of 6 mbar, if warmed from 160 to 195°K, would be readsorbed before the pressure reached 25 mbar. However, experimental data suggest that at high temperatures (273°K) the ad- sorption is a weak function of pressure. If some processes (greenhouse warming in an early atmosphere) considerably warmed Mars for a long period, then little CO,, would be adsorbed on the regolith.
There may have been some period when Mars had no regolith, had only a weakly adsorbing regolith, or had a regolith that
was distributed quite differently than now. Perhaps early in Martian geologic history CO2 had been outgassed, but no regolith or only a thin basalt regolith had formed. Then CO2 would remain in the atmosphere-polar cap system. Alternatively, suppose that the regolith on Mars is not distributed uni- formly with latitude. At present, extensive dust laminae of total thickness between 1 and 6 km extend poleward of 80 ° at both Martian poles (Dzurisin and Blasius, 1975; Cutts et al., 1976). In addition, high Mar- tian latitudes are covered by a deep mantle presumably of loose, wind-eroded debris (Soderblom et al., 1973). At present T = 170°K for these materials, but suppose that in the past they were all at the equator where T = 220°K and that they then cov- ered one-half the planet's surface to a depth of 500 m. The resulting amount of desorbed COe, if the regolith were basalt, would have been about 15 mbar. If the regolith were clay, then 180 mbar of CO,, could have been desorbed although the pressure depen- dence of the isotherms would damp some- what the net CO2 entering the atmosphere.
( f ) Summary
As much as 1 to 3 bars of CO2 may be adsorbed on the Martian regolith or perma- nently tied up as carbonates in the regolith. Diffusion of CO2 through the Martian soil is slow, preventing the adsorbed CO2 from affecting the annual CO~ pressure cycle. On climatic time scales diffusion cannot be ignored, but it probably does not prevent the regolith from responding to climate changes in the surface pressure and temper- ature. In agreement with Fanale and Can- non (1979) we find, even given the most favorable assumptions, that polar ground temperature changes are too small to de- sorb large quantities of CO2 at high obliqui- ties. The pressure at 0 = 35 ° is likely to be no greater than 20 mbar for either a clay regolith or a basalt regolith. At low obliqui- ties, the low atmospheric pressure caused by the formation of a permanent COz polar cap may strongly desorb the regolith and
572 TOON ET AL.
large quantities of CO2 from the regolith may be deposited on the polar caps. The present atmospheric pressure is likely to be in equilibrium with the regolith as sug- gested by Fanale and Cannon (1978). Over geologic time the atmospheric pressure has probably greatly decreased as carbonates have formed, as highly adsorbing clays have formed, as the regolith has become deeper, and as the regolith has been prefer- entially deposited in polar regions. During a possible early epoch with high surface tem- peratures, adsorption would not have been an important sink for COz.
IV. THE SEASONAL CYCLE OF ATMOSPHERIC DUST
Global-scale dust storms, which now oc- cur every Martian year, are an important component of Martian meteorology and cli- matology. The atmospheric thermal struc- ture is stablized by solar energy deposition in suspended dust grains. Particulate back- scattering of solar radiation may sig- nificantly reduce the solar energy reach- ing the summer polar cap and alter its heat budget. Dust grains deposited in the perma- nent and seasonal ice caps substantially modify the ice albedo which also alters the polar heat budget.
As we have discussed, variations in the orbital elements can modify the atmo- spheric pressure, the temperature, and the seasonal polar cap boundary. Below we review ideas about how these modifications may alter the dust storm cycle and then we discuss how changes in the dust storm cycle can "feedback" to modify pressure, temperature, and polar cap boundaries.
(a) Effects o f Climate Changes on Dust Storm Generation and Decay
The generation of global dust storms on Mars requires local winds at the high veloc- ity end of the Martian wind spectrum. These winds lift dust locally. Then a posi- tive feedback occurs between radiant en- ergy deposition in the suspended dust grains and the global winds; this then en-
hances dust-lifting winds over a large area of the planet (Pollack et al., 1979). The wind speed required to lift dust depends upon the pressure, while the wind veloci- ties themselves depend upon horizontal thermal gradients.
Wind tunnel studies (Pollack et al., 1976) have shown that the wind speed, u, at the top of the boundary layer required to lift dust varies with pressure as u a P -°.35. At present, u is about 95 m/sec, but ifP were 1 mbar, u would be 230 m/sec. I f P were 25 mbar, u would be about 40 m/sec. Since Martian winds now are barely sufficient to lift dust, it is clear that at lower obliquities and lower atmospheric pressures dust lift- ing will not occur (Ward et al., 1974; Pol- lack, 1979). At slightly higher pressures,_ which could be reached at high obliquity if the regolith is composed of highly adsorb- ing clays, dust lifting should occur much more easily than it does today (Pollack, 1979).
At the present time, global dust storms occur preferentially during southern hemi- sphere summer, presumably because wind speeds reach their peak at that time as the solar insolation is maximized at perihelion passage. At slightly higher pressures, dust storm generation may occur during the summers of both hemispheres because of the less restrictive wind speed require- ments. Hence, at both larger and smaller obliquities than those of today, dust storm generation may be independent of the ec- centricity and precessional cycles.
The mechanisms responsible for creating winds strong enough to lift dust are not known well enough, nor are they simple enough, to allow more than qualitiative extrapolations to other climates. Pollack et al. (1979) discuss the possible importance of polar cap, tidal, topographical, frontal, and seasonal winds for dust storm genera- tion at present.
Polar cap winds are driven by the thermal contrast between frost-free and frost-cov- ered terrain and by the CO2 mass flux into and out of the polar caps. Peterfreund and

MARTIAN CLIMATE 573
Kieffer (1979) reported that polar cap winds generate many local dust storms. The ther- mal contrast winds will be unaffected by changes in the orbital elements, but the CO2 mass flux will be enhanced and the edge of the polar cap will move equatorward at high obliquity because of the larger seasonal exchange of CO2 as seen in Figs. 4 and 5.
Topographical winds are driven by large- scale elevation differences, while tidal winds are driven by the diurnal movement of the subsolar point. The winds should be affected in three ways by orbital element changes. First, both wind systems depend upon the small value of the radiative relaxa- tion time of the Martian atmosphere. At higher obliquities, and hence higher pres- sures, these wind systems could be damped because the radiative relaxation time will become longer. Second, at higher eccen- tricities the diurnal temperature gradients will be accentuated near perihelion, and this may increase the amplitude of tidal and topographic winds. Finally, the time of year of perihelion passage and the obliquity may affect the phase, amplitude, and latitude of wind speed maxima. These changes could be important if tidal or topographic winds interact either with each other or with sea- sonal winds to produce additive effects.
Seasonal and frontal winds will be altered by thermal gradient modifications due to obliquity changes. The frequency of frontal systems may increase and fronts may be concentrated in lower latitudes at higher obliquity because midlatitude temperature gradients will decrease while lower latitude gradients will increase (Figs. 3 and 6). In addition, at high obliquity, summertime temperature gradients as large as those during winter, but of opposite sign, will occur between the summer pole and equa- tor. Strong summertime easterlies would be expected with possible summertime frontal activity.
Global dust storms start to decay as soon as the storms are generated because radia- tive heating in an optically thick dust layer stabilizes the atmosphere and shuts off the
winds that drive the dust-lifting processes (Pollack et al., 1979). For this reason, global dust storms during a single season may not be more frequent at high obliquity than they are at present during southern hemisphere summer. The decay of the dust storms should be nearly independent of any orbital changes. The removal of the dust from the atmosphere apparently occurs preferentially in polar regions as CO2 "snow" forms around the dust grains and makes them large enough to fall out of the atmosphere (Pollack et al., 1979). Jones et al. (1979) observed from Viking that even nighttime CO2 frost formation is sufficient to remove dust from the atmosphere. Polar CO2 deposits will cover a larger geographic area at higher obliquity and more mass will be exchanged between the atmosphere and poles at higher obliquity. Hence, dust may be removed from the atmosphere slightly faster at high obliquity than at low obli- quity. Pollack (1979) has pointed out that the polar debris mantles probably mark the limits of the CO2 annual cap at high obli- quity.
(b) Effects of Changes in Dust Storm Activity on the C02 Cycle
The CO2 cycle on Mars is controlled by the polar energy budget which is a strong function of the orbital parameters and of the polar cap albedo. As the obliquity varies from 15 to 35 ° the annual average solar energy available at the pole changes by nearly a factor of 2. If the COz frost albedo were to change from 0.6 to 0.8, or if the permanent I-~20 ice cap albedo were to change from 0.4 to 0.7, the energy budget would also change by a factor of 2. Below we shall show that changes in the dust-to- ice mixing ratio can cause such changes in the ice albedo so that modifications of dust storm activity due to orbital element change may be just as important to the polar energy budget as are variations in solar insolation caused directly by orbital element variations.
The albedo of the Martian polar caps is
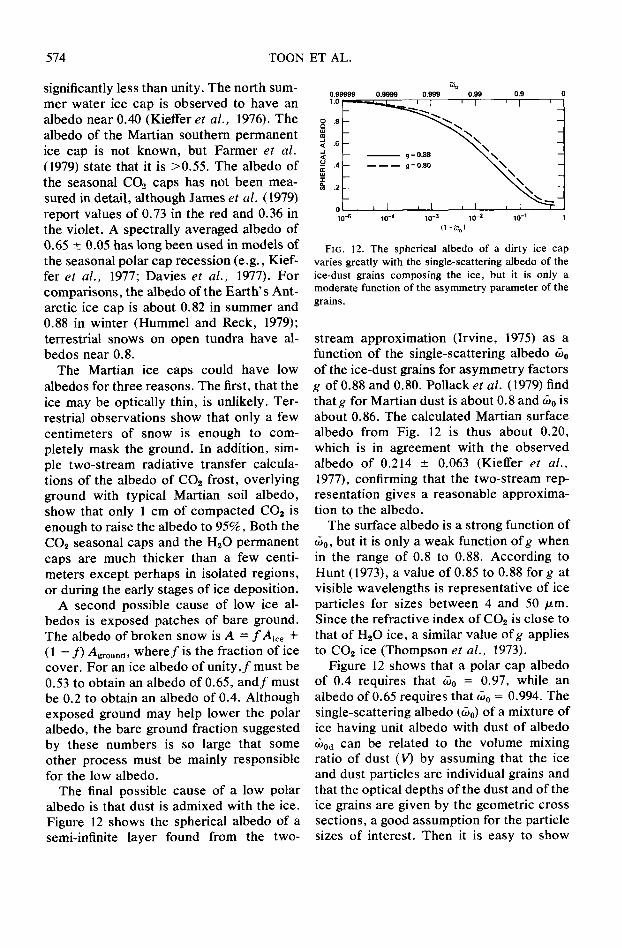
574 TOON ET AL.
significantly less than unity. The north sum- mer water ice cap is observed to have an albedo near 0.40 (Kieffer et al. , 1976). The albedo of the Martian southern permanent ice cap is not known, but Farmer et al. (1979) state that it is >0.55. The albedo of the seasonal CO2 caps has not been mea- sured in detail, although James et al. (1979) report values of 0.73 in the red and 0.36 in the violet. A spectrally averaged albedo of 0.65 +_ 0.05 has long been used in models of the seasonal polar cap recession (e.g., Kief- fer et al., 1977; Davies et al., 1977). For comparisons, the albedo of the Ear th ' s Ant- arctic ice cap is about 0.82 in summer and 0.88 in winter (Hummel and Reck, 1979); terrestrial snows on open tundra have al- bedos near 0.8.
The Martian ice caps could have low albedos for three reasons. The first, that the ice may be optically thin, is unlikely. Ter- restrial observations show that only a few centimeters of snow is enough to com- pletely mask the ground. In addition, sim- ple two-stream radiative transfer calcula- tions of the albedo of CO~ frost, overlying ground with typical Martian soil albedo, show that only 1 cm of compacted CO2 is enough to raise the albedo to 95%, Both the CO~ seasonal caps and the H~O permanent caps are much thicker than a few centi- meters except perhaps in isolated regions, or during the early stages of ice deposition.
A second possible cause of low ice al- bedos is exposed patches of bare ground. The albedo of broken snow is A = f A i e e + (l - f ) Aground, w h e r e f is the fraction of ice cover. For an ice albedo of u n i t y , f must be 0.53 to obtain an albedo of 0.65, a n d f must be 0.2 to obtain an albedo of 0.4. Although exposed ground may help lower the polar albedo, the bare ground fraction suggested by these numbers is so large that some other process must be mainly responsible for the low albedo.
The final possible cause of a low polar albedo is that dust is admixed with the ice. Figure 12 shows the spherical albedo of a semi-infinite layer found from the two-
~o 0.99999 0.9999 0.999 0.99 0.9 0 1"0 1 ~ " ~ [ ' [ ' ' ' 4
t ,~ .0
- - g=o.e9 " ~ \ -~
~ .2
0 , I i I L I , , " ~ " 1 10 -5 10 -4 10 -3 10 -2 10 -1 1
(1 -~o)
FIG. 12. The spherical albedo of a dirty ice cap varies greatly with the single-scattering albedo of the ice-dust grains compos ing the ice, but it is only a moderate funct ion o f the a symmet ry parameter of the grains.
stream approximation (Irvine, 1975) as a function of the single-scattering albedo t~0 of the ice-dust grains for asymmetry factors g of 0.88 and 0.80. Pollack et al. (1979) find tha tg for Martian dust is about 0.8 and &0 is about 0.86. The calculated Martian surface albedo from Fig. 12 is thus about 0.20, which is in agreement with the observed albedo of 0.214 _+ 0.063 (Kieffer et al. , 1977), confirming that the two-stream rep- resentation gives a reasonable approxima- tion to the albedo.
The surface albedo is a strong function of t~0, but it is only a weak function o fg when in the range of 0.8 to 0.88. According to Hunt (1973), a value of 0.85 to 0.88 fo rg at visible wavelengths is representat ive of ice particles for sizes between 4 and 50 /zm. Since the refractive index of CO2 is close to that of H,O ice, a similar value o fg applies to CO2 ice (Thompson et al. , 1973).
Figure 12 shows that a polar cap albedo of 0.4 requires that &0 = 0.97, while an albedo of 0.65 requires that &0 = 0.994. The single-scattering albedo (t~0) of a mixture of ice having unit albedo with dust of albedo &0d can be related to the volume mixing ratio of dust (V) by assuming that the ice and dust particles are individual grains and that the optical depths of the dust and of the ice grains are given by the geometric cross sections, a good assumption for the particle sizes of interest. Then it is easy to show

MARTIAN CLIMATE 575
that
V = (N,/Nd)~/2[(I - &o)/(tho - &od)] 3/2 (8)
where N i / N d is the ratio of the number of ice particles to the number of dust particles.
Pollack et al. (1979) suggest that each water ice particle arrives at the polar cap surrounding a dust particle so that N~ = Nd. Hence, the dust- to-H,O ice mixing ratio in the north polar cap, if it has an albedo of 0.4, is about 15%.
We cannot use Ni /Nd = I for COs, however , since it is likely that much more COs is deposited directly onto the cap from the vapor phase than is formed as dust- contaminated snowflakes in the atmo- sphere. The difference in the behavior of H20 and CO2 frost occurs because, unlike H,O, the vapor abundance of COs is quite high above the pole, so that COs can di- rectly condense onto the surface. An addi- tional factor is that large COs flakes falling rapidly through the atmosphere will prefer- entially sweep up large numbers of dust particles in their path. A few large COs flakes will therefore be mixed with many smaller dust particles.
From Viking observations of the abun- dance of dust in the Martian atmosphere Pollack et al. (1979) estimated that 2 × l0 -2 g cm -2 year -1 of dust is deposited poleward of 60 ° in the north polar region of Mars. Hess et al. (1979) estimated from the ob- served pressure variation on Mars that the mass of COs deposited in the south polar region is about 35 g /cm 2 of CO2 spread over 45 ° latitude. The mass of COs in the sea- sonal north polar cap should be less (Fig. 7). Hence the volume mixing ratio of dust to COs in the north polar cap is approxi- mately l0 -3. Using Eq. (8) and a polar albedo of 0.65 we find that for each COs particle there are about 100 dust particles. If the average dust particle radius is 1 /~m, then the average COs radius is 50 ~m.
If we assume that the COs deposition is constant, we can calculate the polar albedo change caused by variation in the dust mixing ratio by using Eq. (8) scaled from
the N~/Nd values just found. For twice the dust input of Pollack et al. (1979), the polar albedo would decrease from 0.65 to 0.55. For one-half this dust input, the albedo would increase to 0.7, and for one-tenth this dust input, the albedo would become 0.85.
Because of the strong sensitivity of al- bedo to dust content , a strong feedback exists between dust storm frequency, polar albedo, and CO2 pressure. At high obli- quity, the release of COs from clay reser- voirs may provide enough additional pres- sure to increase dust storm frequency. The greater dust storm frequency in turn should cause the COs albedo at both poles to be low and so encourage higher pressures. On the other hand, at low obliquity the lower pressures (Fig. 4) will decrease the dust storm frequency, the polar cap albedo will increase, and still lower pressures should be favored. This feedback should greatly enhance the possibility of the formation of permanent COs polar caps at both poles when the obliquity is lower than at present.
Dust storms under present conditions occur preferentially during southern hemi- sphere summer. Therefore , the albedo of CO2 frost should be higher in the southern hemisphere than in the northern hemi- sphere. If the dust-to-COs mixing ratio is lower in the southern hemisphere than in the northern hemisphere by a factor of 10, the albedo difference could cause the solar energy budgets of the northern and south- ern poles to differ by a factor of 2. Better observations of the difference in the al- bedos between the two seasonal caps and the variations of albedo as the caps sublime during the spring might provide insight into the importance of dust to the polar cap albedos.
The effect of embedded dust on the polar ice albedo is very large. Atmospheric dust could also affect the polar energy budget by blocking solar and thermal radiation. Pol- lack et al. (1979) showed that the surface energy budget at low latitudes is not sub- stantially influenced by atmospheric dust

576 TOON ET AL.
because the increased ground-level infrared radiation from the dust offsets the ground- level solar energy deficit. Calculations of the radiation balance in the polar regions have been performed by James et al. (1979). They found that dust with a t~ 0 of 0.75 would reduce the amount of solar energy absorbed at the polar surface if the polar albedo were 0.5, whereas if the polar albedo were 0.6 the energy absorbed would increase. If ~0 were 0.85, James et al. determined that the dust decreased the amount of energy absorbed at the pole for both polar cap albedos. James et al. ignored the contribution of the dust to the infrared radiation at the ground, which Pollack et al. (1979) found to be important. Suspended dust may either increase or decrease the energy available at the polar surface de- pending upon the values of polar albedo, single scattering albedo, and the ratio of infrared-to-visible dust extinction. Much further work is required on this difficult problem, but the sensitivity suggests that the net effect is probably not large, espe- cially when it is compared with the factor- of-2 change in the energy budget that could result from admixing different amounts of dust and COs in the polar ice.
( c ) S u m m a r y
In agreement with previous studies (Ward et al. , 1974; Pollack et al., 1979; Pollack, 1979), we find that at low obliquity low pressures will prevent dust storms. At high obliquity, slightly higher pressures will enable dust storms to occur throughout the Martian year independently of the preces- sion of the equinoxes. Since dust storms are self-limiting, the intensity of individual storms, their lifetimes, and their frequency of occurrence should be similar to those found now during southern hemisphere summer. At moderate obliquities, dust storms will be most prevalent at large ec- centricity when perhelion occurs near sol- stice. A strong feedback occurs between dust storm frequency and polar cap albedo. At low obliquity the COs seasonal or per-
manent polar cap albedo should be greater than the seasonal cap albedo now. At high obliquity the COs seasonal caps at both poles should have albedos similar to, or perhaps slightly less than, that of the present seasonal north polar COs cap. At times of moderate 0 and high e, such as the present, the two COs seasonal polar caps should have significantly different albedos because of the seasonal asymmetry in dust storm occurrence. The solar energy budget of the two polar caps could easily differ by a factor of 2 because of the difference in the dust content of CO~ frost. Better observa- tions of the present polar cap albedoes would be valuable.
v. THE SEASONAL CYCLE OF H~O
Water vapor in the Martian atmosphere undergoes a strong seasonal variation as it condenses on and sublimes from the perma- nent H20 polar caps. Over long times, water vapor also interacts with permafrost and with water bound to soil particles. We now consider the water seasonal cycle un- der different orbital and obliquity condi- tions with most concern being given to the stability of the polar caps. Then we discuss long term changes in the amount of perma- frost and soil water.
(a ) 1-I20 R e s e r v o i r s - - - A t m o s p h e r e a n d Polar Caps
Presently the Martian atmosphere con- tains seasonally varying water vapor equiv- alent to 0.3 to 1.3 km 3 of ice (Farmer and Doms, 1979; Farmer et al. , 1977). Two permanent water ice caps are located at the Martian poles; their combined area is about 10 ~ km z, approximately one-half the area of the Earth's Greenland ice cap or one-tenth the area of the Earth's Antarctic ice cap. The thickness of the Martian polar caps is not known, but Cutts et al. (1976) suggest that ice is very thin (~< 1 cm) in areas of the south pole where the visible ice cover is variable. Dzurisin and Blasius (1975) de- duced that the ice cover is typically a few hundred meters or less since ice does not

MARTIAN CLIMATE 577
cover topographic areas with greater height differences. Murray and Malin (1973) identified one polar region in which ice did seem to cover the topography, implying that the thickness in that region may exceed a few hundred meters .
(b) M a x i m u m S u m m e r Ice Cap Tempera tures and Subl imat ion Ra t e s
We have shown by using a simple model (Figs. 3 and 6) that summer polar ground tempera tures can be quite high at large obliquities. The thermal history of an ice cap is more complex than that of the soil and, thus, a more detailed model is required to explore its t empera ture variation and the associated water vapor loss rate. The heat balance equation for an ice cap is
(1 - A ) I + A H - et~T 4
OT OT - Kite O---z - Ec = p C p - ~ " (9)
The initial te rm is the daily averaged available solar radiation. This t e rm con- tains an ice albedo A taken as 0.4 in agreement with present values for the north polar cap (Kieffer et al., 1976). The Martian south polar cap has a higher al- bedo (>0.55, Fa rmer and Doms, 1979). The term i is the daily average solar inso- lation. At the pole there is no variat ion of the insolation during the day. Ice is mod- erately t ransparent to solar radiation, but Martian ice contains a large quanti ty of dust, as evidenced by the low albedo, so we have assumed that all the solar energy is deposi ted in the top layer (1.5 cm thick) of our ice cap model. Deposit ing the solar energy in a thicker layer would result in lower temperatures .
The second term in Eq. (9) represents a tmospher ic heating caused by thermal conduct ion f rom the a tmosphere to the ground, infrared radiation f rom COs, and infrared radiation f rom H~O. In order to evaluate these te rms we assume that the summer a tmosphere is isothermal and is a lways warmer than the polar cap by TA -- T = 10°C. This assumpt ion is reasonable
since bare ground near the pole is warmer than ice at the pole, which will lead to a wa rm a tmosphere over the pole, and since observat ions show that the atmo- sphere ove r the pole is stable (Kieffer et al., 1976). For heat conduct ion in a stable a tmosphere we follow Gierasch and Toon (1973 t and use
A l t l = f lPU(TA - T),
where
fl = 2.6 x 10 -5 °K -1
U = typical wind speed = l0 a cm see -~,
P = pressure in dynes cm -2. (10)
The a tmospher ic heating due to CO2 and H20 are found by using the emissivities of Gierasch and Goody (1968) and Cess (1974):
AHCO2 = 6 × 10³In(1 + 1.97 > 10-3p)
exp ( -960 /Tg)e rgs cm -2 sec -~,
A H H 2 0 = 0.75 O-TA4[1 -- exp( - (Pn~oP) It2
9.1 × 10⁻⁵)]ergs cm -2 sec -t.
In calculating the water emissivity PH2o, the water vapor pressure (in dynes cm -2) at the surface is used. The water is taken to be uniformly mixed, and it is assumed that the column abundance of water does not ex- ceed that which had been previously sub- limed from the water cap.
The energy loss te rms in Eq. (9) include ground radiation losses (we take an emis- sivity of 0.95) and conduct ion into the ice. The conduct ivi ty of pure ice at 273°K is about 5 × 10 -a cal cm -~ sec -~ °K-~ and at 150°K it is about 10 -3 cal cm -~ sec -~ °K-~ (Hobbs 1974). Snow at 273°K has a density dependent K of 6.8 x 10 -a P]now. Dense arctic snow with p = 0.33 g cm -a has K = 7 × 10 -4 cal cm -1 sec -1 °K-1 (Maykut and Untersteiner , 1971). Permafros t with 20% soil content can have a 50% lower K than does pure ice (Clark, 1966). To encompass the possible range of conductivit ies we per- form calculations with K = 8.6 × l0 -a (Davies et al., 1977) and with K = l × 10 -a cal cm -~ sec -~ °K-1.

578 TOON ET AL.
The final e n e r g y loss t e rm is e v a p o r a t i v e cool ing . T w o e v a p o r a t i v e m e c h a n i s m s are at work . A tu rbu l en t w a t e r v a p o r flux oc- cu r s as w inds b l o w a c r o s s the ice ( Inger- sol l , 1974):
EC1 = O.O02pw(O)UL,
L = la ten t hea t o f ice
= 2.8 × 10'°ergs g - l ,
pw(0) = w a t e r v a p o r mass dens i ty . (11)
A l so c o n v e c t i v e w a t e r v a p o r e v a p o r a t i o n o c c u r s b e c a u s e w a t e r is l igh te r than CO2 ( Ingerso l l , 1970)
EC2 = O.17pw(O)D[(Ap/p)(g /vZ)] v3 L
ergs c m -2 sec - l ,
w h e r e
~P/P = 26PH2o / (44P- 26PH20), V = 3.75 × IO-7(TSr2/T + 269) (R/P)cm 2
sec -~ = v i s cos i t y o f COz, D = 32T312/P c m 2 sec -1 = dif fus ion
coeff ic ient o f HsO in COs, R = gas cons t an t .
H e r e we a s s u m e tha t t he re is negl ig ib le w a t e r v a p o r e x c e p t j u s t a b o v e the ice.
The final t e rm in Eq. (9) is the t e m p e r a - ture change o f the ice. W e used an ice hea t c a p a c i t y o f 1.4 × 10⁷ ergs g-Z OK-~ w h i c h is a p p r o p r i a t e for 200°K ( H o b b s , 1974). W e a lso c o n s i d e r e d the e n e r g y in the v a p o r p h a s e m o l e c u l e s c a u s e d b y v a p o r p r e s s u r e changes , bu t this effect is negl ig ib ly smal l .
To so lve Eq. (9) we used the s ame ther- mal m o d e l as p r e v i o u s l y e m p l o y e d for the g r o u n d e x c e p t tha t we t o o k 20 l aye r s o f 1.5- cm t h i c k n e s s and 20 l aye r s o f 30-cm th ick- ness . W e b e g a n the ca l cu l a t i on at the t ime o f c o m p l e t e COs sub l ima t ion as found f rom our ea r l i e r c a l cu l a t i ons (Figs . 3 and 6) and set the beg inn ing ice t e m p e r a t u r e at all d e p t h s in the ice at the annua l m e a n tem- p e r a t u r e f rom our ea r l i e r ca l cu la t ions .
F igu re 13 i l lus t ra tes ice su r face t e m p e r a - tu res for va r i ous va lues o f ob l iqu i ty wi th the m a x i m u m poss ib l e e c c e n t r i c i t y . A l so n o t e d is the to ta l t h i c k n e s s o f ice s u b l i m e d f rom each c a p dur ing the s u m m e r season .
300 I I I I I [ I I I . . . . . 45 ° OBLIQUITY (45 cm, 20 cm)
35 ° (20 cm, 5 cm) 25 ° (1.5 cm, 0.2 cm)
250 t f~,, I! I \ " ~ ' e = 0.14
" ~ ".', A = 0.40 ' X \ x',,
I I I [ I ' ~ ' 1 200 240 280 320 0 40 80 120
SOLAR ANOMALY, deg
/
1- 160
FIG. 13. The seasonal dependence of the tempera- ture of a water ice cap is a strong function of the obliquity. Given in parentheses are the thicknesses of ice lost from each polar cap during the summer. The greater thickness is lost from the pole reaching higher temperature. Substantial water loss rates occur at high obliquity. As discussed in the text, the loss rate is very sensitive to ice albedo and thermal conductivity.
Bo th caps are a s s u m e d to have an a l b e d o o f 0.4 and a K of 10 -z cal c m -1 sec - t °K -~. The so la r in so la t ion i n t eg ra t ed o v e r the y e a r is iden t i ca l at bo th po le s b e c a u s e the pole wi th the l a rge r inso la t ion at so l s t i ce has the s h o r t e r s u m m e r . H o w e v e r , sub l ima t ion o f ice at the two po le s is not the s ame b e c a u s e it d e p e n d s n o n l i n e a r l y on the inso la t ion . M o s t e v a p o r a t i o n o c c u r s w h e n the ice is w a r m e s t .
A n e v a l u a t i o n o f the sens i t i v i ty o f the resu l t s p r e s e n t e d in Fig. 13 to the p r o c e s s e s i nc luded in Eq. (9) sugges t s tha t the a lbe do , t he rma l c o n d u c t i v i t y , and e v a p o r a t i v e losses a re the m a j o r unce r t a in t i e s . Tab le I p r e s e n t s the resu l t s f rom a n u m b e r o f ca lcu- la t ions exp lo r ing the va r i a t ion o f the w a t e r mass loss ra te c a u s e d b y c ha nge s in t hese p a r a m e t e r s .
H i g h e r w a t e r loss r a t e s cou ld o c c u r if the p o l a r a l b e d o were less than 0.4 but , be- c a u s e the n o r t h e r n h e m i s p h e r e w i n t e r is n o w as d u s t y as is pos s ib l e , we do not be l i eve tha t l o w e r a l b e d o s a re l ike ly . A ca l cu l a t i on wi th Kiee = 10 -4 cal cm -1 sec -~ °K -1 p r o d u c e d negl ig ib le d i f fe rences f rom the r e su l t s g iven in Fig. 13. D a v i e s et al.
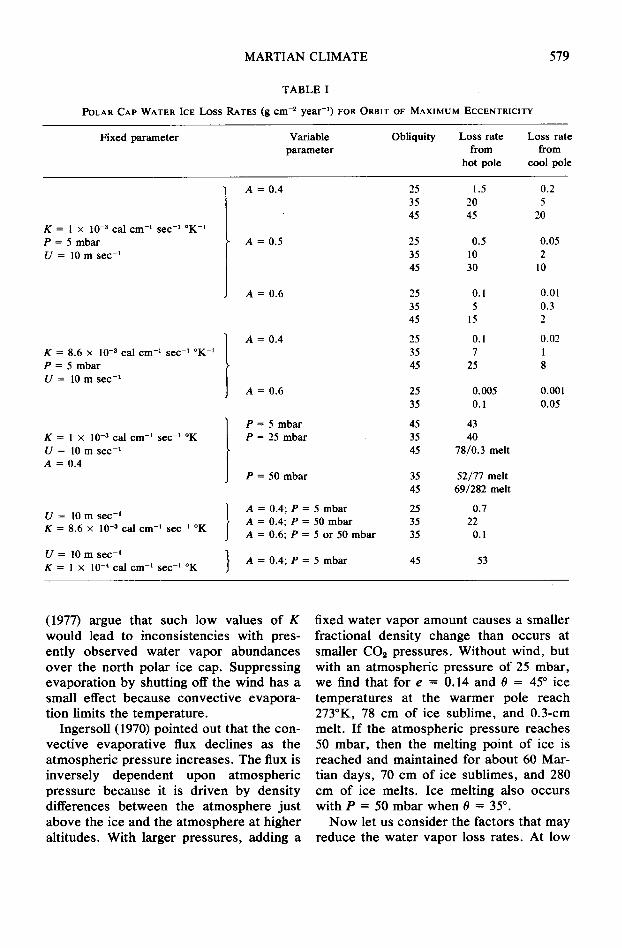
M A R T I A N C L I M A T E
TABLE I
POLAR CAP WATER ICE LOSS RATES (gcm -2 year -~) FOR ORBIT OF MAXIMUM ECCENTRICITY
579
Fixed parameter Variable Obliquity Loss rate parameter from
hot pole
Loss rate from
cool pole
K = 1 x 10 -3 cal cm -~ see -1 °K -~ P = 5 mbar U = 10 m see -1
K = 8.6 × 10 -a cal cm -~ sec -1 °K-t P = 5 mbar U = 10 m sec -~
K = 1 × 10 -a cal cm -~ see - ' °K U = 10 m sec -~ A = 0.4
U = 10 m see -1 K = 8.6 × 10 -a cal cm -~ sec -t OK
U = 10 m sec -1 K = 1 x 10 -4 cal cm -~ sec -t °K
t A = 0.4
A =0 .5
A = 0.6
A = 0.4
A = 0.6
P = 5 mbar P = 25 mbar
P = 50 mbar
A = 0 . 4 ; P = 5 mbar A = 0.4; P = 50 mbar A = 0.6; P = 5 or 50 mbar
A = 0 . 4 ; P = 5 mbar
25 1.5 35 20 45 45
25 0.5 35 10 45 30
25 0.1 35 5 45 15
25 0.1 35 7 45 25
25 0.005 35 0.1
45 43 35 40 45 78/0.3 melt
35 52/77 melt 45 69/282 melt
25 0.7 35 22 35 0.1
45 53
0.2 5
20
0.05 2
10
0.01 0.3 2
0.02 1 8
0.001 0.05
(1977) a r g u e t h a t s u c h l o w v a l u e s o f K
w o u l d l e a d t o i n c o n s i s t e n c i e s w i t h p r e s -
e n t l y o b s e r v e d w a t e r v a p o r a b u n d a n c e s
o v e r t h e n o r t h p o l a r i ce c a p . S u p p r e s s i n g
e v a p o r a t i o n b y s h u t t i n g o f f t h e w i n d h a s a
s m a l l e f f e c t b e c a u s e c o n v e c t i v e e v a p o r a -
t i o n l im i t s t h e t e m p e r a t u r e .
I n g e r s o l l (1970) p o i n t e d o u t t h a t t h e c o n -
v e c t i v e e v a p o r a t i v e f lux d e c l i n e s as t h e
a t m o s p h e r i c p r e s s u r e i n c r e a s e s . T h e f lux is
i n v e r s e l y d e p e n d e n t u p o n a t m o s p h e r i c
p r e s s u r e b e c a u s e it is d r i v e n b y d e n s i t y
d i f f e r e n c e s b e t w e e n t h e a t m o s p h e r e j u s t
a b o v e t h e i ce a n d t h e a t m o s p h e r e a t h i g h e r
a l t i t u d e s . W i t h l a r g e r p r e s s u r e s , a d d i n g a
f i x e d w a t e r v a p o r a m o u n t c a u s e s a s m a l l e r
f r a c t i o n a l d e n s i t y c h a n g e t h a n o c c u r s a t
s m a l l e r C O s p r e s s u r e s . W i t h o u t w i n d , b u t
w i t h a n a t m o s p h e r i c p r e s s u r e o f 25 m b a r ,
w e f ind t h a t f o r e = 0 .14 a n d 0 = 45 ° i ce
t e m p e r a t u r e s a t t h e w a r m e r p o l e r e a c h
273°K, 78 c m o f i ce s u b l i m e , a n d 0 . 3 - c m
m e l t . I f t h e a t m o s p h e r i c p r e s s u r e r e a c h e s
50 m b a r , t h e n t h e m e l t i n g p o i n t o f i ce is
r e a c h e d a n d m a i n t a i n e d f o r a b o u t 60 M a r -
t i a n d a y s , 70 c m o f ice s u b l i m e s , a n d 280
c m o f i ce m e l t s . I c e m e l t i n g a l s o o c c u r s
w i t h P = 50 m b a r w h e n 0 = 35 °.
N o w le t u s c o n s i d e r t h e f a c t o r s t h a t m a y
r e d u c e t h e w a t e r v a p o r l o s s r a t e s . A t l o w
580 TOON ET AL.
obliquity, suppressing evaporat ion reduces the water loss rate, as can be seen in Table I by comparing the 0 = 25 ° cases with and without wind. At high obliquity, evapora- tion is the tempera ture limiting process . In order to balance the energy, approximate ly the same physical mass must be lost even if the evapora t ion rate is reduced. This oc- curs by raising the temperature , which in turn increases the incoming energy f rom atmospher ic infrared radiation and hence causes greater mass loss.
The most effective way to limit the mass loss is to increase the thermal conductivi ty or the albedo. Table I shows that, at large obliquity, large water loss rates (several cen t imers /year ) do not occur if the albedo and the conductivi ty are both high. Ice melting will not occur at 0 = 35 °, even at 50- mbar pressure, if the conductivi ty is high.
At a modera te 0, such as 25 °, the albedo and thermal conductivi ty also strongly con- trol the water loss rate. The present south polar cap of Mars may have an albedo of >0.5 (Farmer et al., 1979), even though the northern cap has an albedo of 0.4. Table I shows that the southern cap with an albedo of 0.6 would lose less water than the north- ern cap with an albedo of 0.4, as is ob- served. In addition, Table I shows that changing the thermal conductivi ty in the range from 1 x 10 - a t o 8 × 10 -a alters the water loss by a very large factor.
Compar ing the hot- and cold-pole loss rates in Table I with the loss rates for changes in various parameters shows that the water loss rate dependence on eccen- tricity is no stronger than its dependence upon obliquity, thermal conductivi ty, or albedo. Hence asymmetr ies be tween the permanent polar caps could be caused equally well by differences in albedo, ther- mal conductivi ty, or position in the preces- sional cycle, and the differences may well be frozen in f rom an earlier phase of the obliquity cycle.
Figure 13 and Table I do not show water loss rates f rom the polar regions for obliqui- ties less than 25 ° . The loss rates are likely to
decline radically as 0 decreases because the polar ice albedo and conductivi ty will rise at low obliquity as dust s torm f requency drops because of declining CO2 pressure. More importantly, if pe rmanent CO2 polar caps form, the water loss rate will drop to an ex t remely small value. For example , at a t empera ture of 150°K the water vapor loss rate is about 10 -6 g cm -2 summer -I with a wind speed of 10 m / s e c at 5 mbar of pressure. Ingersoll (1974) and Leighton and Murray (1966) previously pointed out the great importance of permanent CO2 de- posits as traps for water vapor .
(c) Water Ice Deposition Rates at the Poles and Exchange between Polar and Nonpolar Ice Reservoirs
Water ice not only sublimes f rom the summer poles, but it also is t ranspor ted toward the winter pole. Some ice may reach the winter permanent pole to replace ice lost during the previous summer , other ice may be deposited in the annual CO2 polar cap, and yet more ice may exchange with mineral surfaces and permafrost .
The available evidence does not allow us to est imate the net gain or loss rates for the current permanent polar caps. The only numerical data on water return to the poles are those of Fa rmer et al. (1979) who ob- served that the globally integrated atmo- spheric water vapor declined during the northern hemisphere winter by an amount equivalent to 4 × 10 -3 g cm -~ spread pole- ward at 60°N. The latitude was chosen to agree with the boundary of the seasonal north polar cap. Pollack et al. (1977, 1979) noted that dust particles probably serve as the carriers of water into the polar regions and that the mass of ice per dust particle is about the same as the mass of dust, sug- gesting a water vapor deposit ion rate of about 2 × I0 -z g cm -z year -1 over the area of the north annual polar cap. The number is approximate ly equal to the deposit ion each year of all the water vapor in a hemi- sphere containing 10 precipitable microme- ters o f water. Hence this value is close to

MARTIAN CLIMATE 581
an upper limit for the possible current ice deposition rate.
These water vapor return rates are less by 1 to 2 orders of magnitude than the water loss rates shown by Fig. 13 for O = 25 °. The implication is that both Martian polar caps are currently being des t royed or (Table I) that the ice conductivity is close to pure ice for both caps and additionally that the south cap has an albedo near 0.6. The highest temperature reached in the south cap calculation for A = 0.6 and K = 8.6 × 10⁻³ cal-i g-Z OK-i was 193°K, which is much higher than the CO~ frost point on present-day Mars.
There is no reason to believe that polar caps on Mars are permanent features. At other times in Martian history the caps may have been larger, smaller, or even nonexist- ent. A similar physical situation exists on Earth, and the evidence shows that the Earth 's permanent polar caps were much larger 2 × l05 years ago and were absent 4 x 10⁷ years ago. Large ice sheets have probably existed on Earth for a total of less than 10% of the Earth 's geologic history (Pollack, 1979).
Since Mars has no oceans, its polar caps can undergo long-term alterations only by exchanging H20 with the regolith. The Martian permanent polar caps occupy 1% of the planet. If the regolith were 10% H20 by volume, then only 10 to 100 m of glob- ally distributed regolith is needed to accom- modate all the ice in polar caps 100 to 1000 m thick. Carr and Schaber (1977) suggest that the ice content of some Martian soils may be as high as 50%. If permafrost with 50% ice content spreads from 45 to 40 ° latitude, then the ice in a 100-m ice cap could be stored in only 30 m of soil. The available data (Farmer e t al . , 1977, Farmer and Doms, 1979) do not show any obvious indication of a seasonal regolith source or sink of water, but it is likely that water is currently stored reversibly in the regolith as permafrost , adsorbed water, and water of hydration. We shall consider each of these reservoirs in turn.
Clark (1978) shows that montmoriUonite clays strongly adsorb H20 and that sul- fates, such as MgSO4, undergo rapid hydra- tion at temperatures near 210°K with present Martian water vapor abundances. A soil dominated by clays, but also contain- ing about 10% magnesium sulfate, would contain 30, 15, or 5% of its dry weight as water for temperatures of 195, 215, and 235°K, respectively, for a column water content of 10 pr /zm of uniformly mixed water. At 215 ° about half this H20 would be at tached to the sulfates. By contrast , a basalt regolith at 215°K along with a water pressure of l0 pr /xm would only adsorb about 0.3% of its weight as HzO (Fanale and Cannon, 1974).
The storage of H~O in clays and sulfates is likely to be a strong function of latitude, depth, and season. Because of the strong temperature dependence of the adsorption and because of hysteresis effects, the diur- nal thermal wave probably permanently dessicates the equatorial and midlatitude soil within a few centimeters of the surface, while the upper meter of soil in the polar regions could exchange water because of the seasonal thermal wave (see Clark, 1978).
Figure 14 illustrates the adsorbed water on smectite clays for various temperatures and pressures (Anderson e t al . , 1978). For an average water vapor amount of 10 pr /xm, soil colder than 195°K will be in vapor equilibrium with permafrost rather than with adsorbed water. On the other hand, soil only a few degrees warmer than 195 ° will be strongly desorbed. In polar regions, where substantial adsorption occurs, the major exchange will be between permafrost and atmospheric water vapor as long as permafrost is present. Of course, the con- tact between the permafrost and atmo- sphere will be indirect because even in the polar regions the annual thermal wave will seasonally remove the permafrost in the upper soil layers. At slightly lower lati- tudes, just beyond the permafrost margin, substantial clay regolith adsorption will oc-

.1 .5
180 °
TOON ET AL.
H20 COLUMN, or/am
1 10 100
>- .4
..d o
%.a -r
~.2 o a
o .1 N
582
190 ° 200 ° 210 °
o
0 I I A I i .01 .1 1 10
WATER PRESSURE, #bar
FIG. 14. The mass of water adsorbed per gram of clay is a very strong function of the water pressure and of the temperature. Adsorption will precede permafrost formation, but when enough water is available to fill completely the adsorption sites so as to make permafrost, then permafrost formation will be the dominant physical process occurring. Because of the large quantity of water probably available, permafrost formation is likely to be more important for Martian climate than adsorption. The precipitable water column abundance was found by assuming that the water was uniformly mixed.
cur. At still lower latitudes only a few percent of the regolith could be adsorbed H=O. The low-latitude (high-temperature) adsorption is a weak function of tempera- ture but a modes t function of pressure . For example , if the H~O pressure fell f rom 10 to 1 pr /zm, soil at 205 ° would lose about 2% of its weight in water. In this way a 102-m thick regolith covering half the planet might lose about 4 × 10 ~ g cm -2 of H20, which is sufficient to add about 200 m of ice to the poles.
Permafros t has been considered by sev- eral authors. Carr and Schaber (1977) dis- cussed geologic evidence for permafros t and suggested that permafros t was wide- spread with H=O composing 50% of the soil volume in some regions. Fanale (1976) and Farmer and Doms (1979) have shown "that permafros t could be in equilibrium with the present a tmospher ic water content at lati- tudes above 40 °. However , Smoluchowski (1968) has pointed out that only a few tens of meters of fine-grained regolith are sufficient to prevent permafros t f rom sub-
liming f rom equatorial regions over the age of Mars.
The edge of the equilibrium permafros t boundary depends upon tempera ture and a tmospher ic water content. Presently, ice is in equilibrium at a tempera ture near 200°K. A factor-of-10 change in water va- por amount would change the equilibrium tempera ture boundary by about 10 to 15°K, which is equivalent to a latitude shift o f about 100 for lower water amounts and 20 ° for higher water amounts . Likewise, for fixed H20 abundance the boundary may shift if the mean tempera ture shifts. At 35 ° obliquity the permafros t should extend 5 ° further equatorward than it does now. At 15 ° obliquity the permafros t should extend about 3 ° fur ther poleward than at present .
In the above discussion we have sug- gested that substantial amounts of perma- frost and adsorbed water could move into and out o f the soil as Pw and T vary. We have already indicated that the tempera ture wave can penetra te 100 m in only 104 years. We must also consider the diffusion of H20

MARTIAN CLIMATE 583
into and out of the soil. This problem has all the complexity of the COo diffusion prob- lem discussed earlier.
The H00 diffusion problem differs from that of COo in several ways. First, relative to the atmospheric abundance much more H~O is adsorbed on soil than is CO2. In solving the COo problem we showed that, even if all the CO2 in one pressure wave- length were desorbed, it would contribute only a small amount of CO2 to the atmo- sphere and, therefore, we did not actually solve the diffusion problem. For H~O, how- ever, we must indeed solve the diffusion equation because of the large water abun- dance. A single molecule of HoO can diffuse to a great depth based upon diffusion lengths such as those shown in Fig. l l. However, the gradient of the vapor density caused by diffusion greatly limits the actual mass flux. Second, because the H00 in the atmosphere is a very tiny fraction of that adsorbed or present as permafrost, damp- ing of pore diffusion by adsorption is very important and surface diffusion along the adsorbing surfaces could also be sig- nificant. Finally, the diffusion mean free path for HoO depends on both the pore radius and the COs pressure. For small pore sizes (r < 1.0 tzm) HoO molecules collide mainly with pore walls in attempting to escape, while for larger pore sizes HoO molecules collide with CO~ molecules. Hence, H~O diffusion may depend upon CO2 pressure changes.
As a guide to the diffusion problem we can ignore the adsorption processes and calculate at time t the distance Z to the top of an evaporating permafrost layer by as- suming that the diffusion occurs essentially in steady state. Then
Z = [2Dt((pw(Z) - pw(O))/piee] 1'2 (12)
while the mass lost during t is EpieeZ, where E is the porosity of the soil. This calcula- tion, and the results, are essentially identi- cal to those of Smoluchowski (1968) for the same temperature and diffusion coefficient.
Table II gives the values of Z for t = 5 ×
104 years, for temperatures [which control the water vapor pressure pw(Z)] from 200 to 200°K, for pw(0) = 0, and for diffusion coefficients D between 0.01 and 10 cm 2 sec -1. Diffusion coefficients D cannot be much larger than 10 cm 2 sec -1 because that limit is set by the present COo pressure. For pore sizes of a few microns or less D in centimeters squared per second is approxi- mately numerically equal to the pore size in microns.
It is obvious from Table II that only a thin layer of permafrost can be lost or gained during a 5 × 10⁴-year period. There are two physical limitations expressed by these numbers. Most important, the mass in the vapor phase over the ice is very low. For example, at 210°K uniform mixing would allow only about 50 pr /zm of vapor phase H00 above exposed ice. Diffusion greatly limits the amount of water in the column to a lesser value at any given time and also prevents rapid replacement of any vapor removed from the column. Suppose, for example, that exposed ice at 210°K is allowed to replenish by diffusion the column of air above it with H00 10 times during a year. Then during 5 × l& years only 25 m of ice could be lost.
As we pointed out earlier, the ice-loss rates from exposed polar ice can be quite large at high obliquity but quite small at low obliquity. At low obliquity the atmospheric H00 pressure will drop and temperatures at latitudes equatorward of 60 ° latitude will increase. Both factors will push both the edge of the equilibrium permafrost bound-
T A B L E II
DEPTH OF PERMAFROST (cm) AFTER 5 X 10⁴ YEARS
Diffusion coefficient (cm 2 sec -1)
Temperature (°K)
200 210 220
0.01 10 20 40 0.1 35 65 130 1 110 200 410
10 340 650 1300

584 TOON ET AL.
ary and the edge of the regolith adsorption boundary poleward at low obliquity. Hence , the regolith will a t tempt to supply ice to the pole. The actual amount of ice supplied is very difficult to determine. Because of the great temperature depen- dence for the vapor pressure of ice, most of the supply of vapor will come from the present permafrost region whose annual mean temperature is about 200°K. Table II suggests that this region could lose about 0.5 m of ice over 5 × 10⁴ years. If this permafrost region of Mars occupies 10% of the planet 's area, and the perma- nent polar cap occupies 1%, then perhaps 5 m of ice would be added to the ice cap. It is conceivable that ten times as much as this could be added if the upper few meters of regolith had a very large pore size. In that case the low COz pressure at low obliquity could greatly increase the HzO diffusion rate. Another possibility is that geologic processes, such as slumping on slopes, could be important and might continually keep fresh permafrost ex- posed. It is unlikely, however , that winds would expose fresh permafrost because of the inability of winds at low atmospheric pressure to move dust. The seasonal ther- mal wave may also play a significant role in allowing permafrost to escape when the pressure is low. The region poleward of 60 ° latitude has an annual temperature of 175°K. At such a low temperatures only a few centimeters of permafrost could be desorbed. However , summer- time temperatures would increase the temperature of the upper meter of soil so that diffusive losses would increase. I f the upper meter of permafrost over one- third of the planet is lost, then 30 m of ice would be added to the caps.
At high obliquity, the poles will lose more water during the summer season than now, and temperatures equatorward of 55 ° latitude will drop. These processes Will move the equilibrium permafrost boundary to lower latitudes. For example, if the mean 1-120 amount increased to 60 pr tzm at 35 °
obliquity, then the permfrost boundary could move to about 25 ° latitude. The vapor pressure above ice at about 210°K is 60 pr /zm, and about 20% of the planet 's area is between 25 and 40 ° latitude. Table II sug- gests that under these circumstances the regolith might consume 20 m of ice from the caps. The amount of ice consumed could increase if higher water vapor abundances occur, or if the regolith has a very large pore size in its upper ten meters and the CO2 pressure does not increase dramati- cally at high obliquity. Wind-blown dust might also speed the processes by hydrat- ing in suspension and then becoming bur- ied, or by simply covering exposed sur- face ice. High ice cap loss rates may force increased permafrost . If the polar cap loss rates exceed the gain rate, and if the permafrost cannot take up the differ- ence, then the high atmospheric vapor pressures will occur. These high pres- sures will drive ice into the regolith and they will force the polar cap gain rate to increase until balance is achieved.
The reader may note that several differ- ent processes control the polar cap budget. If the two polar caps are out of balance with each other the feedbacks reinforce the im- balance by lowering the albedo of the cap losing net water. If both caps are out of balance with the a tmosphere-regol i th sys- tem, the feedbacks depend on the sign of the imbalance. At low obliquity, permanent CO2 caps will have net H20 gain rates, and the atmospheric water will be reduced until the ice cap gain balances the loss by the permafrost. At high obliquity, when large polar-ice-loss rates occur, the loss will con- tinue if permafrost can adsorb the loss. If not, atmospheric water will build up, in- creasing the polar cap gain rate. A high water gain will increase polar cap albedos and decrease the ice loss rate. Hence at high obliquity the polar caps may balance their gain and loss rates so that the differ- ence is equal to the regolith removal rate.
The movement of water vapor through adsorbing soil is difficult to calculate theo-

MARTIAN
retically. Experimental studies of this process, using terrestrial analogs, could be quite valuable for improving our estimates of permafrost transfer rates.
(d) Formation o f Ice Sheets on the Polar Laminae
The polar laminae appear to be dusty ice deposits extending slightly beyond the north polar cap to 80°N latitude and well beyond the south polar cap to 70°S (Cutts 1973). Pollack (1979) has proposed that the permanent polar cap, the polar laminae, and the polar debris mantle form a contin- uous sequence of geologic formations dif- fering, according to their latitude, in their ability to retain water ice. Specifically, the debris mantels originated from atmospheric dust that was deposited in the annual CO~ caps but was unable to retain any attached ice during the summer. This process was observed by Viking (Jones et al., 1979). The polar caps retain water ice for very long periods. The laminae are the interme- diate case of dust sometimes able to retain
CLIMATE 585
ice and sometimes not, so that the ice-to- dust mixing ratio varies with depth. Ice as permafrost is stable at the latitudes of the laminae, but the laminae are too thick to have formed by vapor diffusion of ice into soil. A dusty ice sheet covered with a meter of dust would be stable at the latitudes of the laminae because the dust would prevent high summertime surface temperatures from reaching the ice and causing it to sublime. Buried ice would be at the annual mean temperature and would be cold enough to be in equilibrium with atmo- sphere water vapor amounts or more likely to grow by picking up atmospheric water. Therefore the laminae ice would not diffuse out through a thin overlying dust layer. Here we attempt to identify the conditions that might have led to ice being perma- nently deposited in the area of the polar laminae before a dust layer covered it or before a thick, high-albedo ice sheet was present to stabilize the ice.
Table III presents water loss rates at 80 and 70 ° latitudes for an albedo of 0.25,
T A B L E I I I
LAMINAE WATER LOSS RATE (g c m -2 y e a r -~)
F i x e d p a r a m e t e r V a r i a b l e p a r a m e t e r O b l i q u i t y L o s s r a t e
f r o m
hot pole
L o s s r a t e
f r o m
coo l po le
A = 0.25
U = 10 m s e c -~
K = 1 x 10 - 4 c a i c m -1 sec - 1 ° K -~
U = 10 m s e e -1
K = 1 × 10 -4 cal c m -I s ec -1 ° K - t
P = 5 m b a r
A = 0.4
U = 10 m s e c -1
K = 1 x 10 -a cal c m - t s ec -~ ° K
P = 5 m b a r
A = 0.4
P = 5 m b a r 15 0.5 0.05
lat 80 ° 20 5 0.7
25 15 5
P = 1 m b a r 15 0.5 0.03
lat 80 ° 20 5 0.5
P = 1 m b a r 15 4 0.2
lat 70 ° 20 l0 0.7
80 ° lat 20 2 0. l
70 ° lat 20 5 0.2
80 ° lat 20 0.2 0.005
70 ° lat 20 1 0.01

586 TOON ET AL.
typical soil conductivi ty, and for obliquities of 15, 20, and 25 ° . In performing these calculations we used the daily averaged solar insolation, even though there is a diurnal cycle at both 70 and 80 ° . It may be noted that the lower CO2 pressures at 0 = 15 ° play only a small role in the water budget by reducing the CO~ greenhouse warming slightly.
These calculations suggest that, at very low obliquity, ice can begin to accumulate if the rate of supply is on the order of 0.1 to 0.5 g cm -z year -1 . This is a very high rate of supply, as we pointed out previously, and it suggests that the ice componen t of the laminae does not form simply as an ex- tended thin dusty ice sheet.
It is most likely that the laminae originate at low obliquity when a large permanent polar cap of CO2 forms f rom the present a tmosphere and f rom CO2 desorbed out of the regolith. Such a permanent cap of CO~ would trap water released from permafros t reservoirs very effectively. The laminae may also form at modera te obliquity by growth of permanent ice sheets if one pole has much lower ice loss rates than the other. Then the preexisting permanent ice sheet at the low-loss-rate pole may grow at the expense of the other polar cap. Of course, alternatives exist. Perhaps wind deposits H20 ice into small piles, or per- haps shadowing by surface relief allows some ice to remain each summer . These patches of ice might then be able to grow into a more extensive, stable ice sheet. Large-scale slopes could also play a role by preventing solar energy from directly reaching the ice. Once enough ice (proba- bly a few centimeters) is present to raise the albedo of the ice well above that of the ground, the loss rate of water ice without the permanent CO~ might be low enough to allow frost to accumulate .
Table I I I shows some typical loss rates f rom established polar ice sheets at 20 ° obliquity. With K = 10 a cal cm -1 sec -1 °K -1 and high albedo (0.4), the water ice loss rates at 80 ° for the cooler pole are very low.
In the dust-free conditions at low obliquity, an even higher albedo may be anticipated.
At 70 ° latitude the calculated loss rates of ice are larger than those at 80 ° , but the differences are not a lways striking. Several additional factors not included in our calcu- lations may contribute to the laminae being confined to high latitudes. Permanent CO2 deposits are unlikely to have ever extended much beyond 80 ° , so large H~O ice sheets at low latitudes could not have been established. In addition, the cal- culations we per formed ignore the diurnal cycle. We have already shown (Figs. 3 and 6) that the daily average summer tempera- ture is not a strong function of latitude at low obliquity, which is why the loss rates differ only slightly be tween 70 and 80 ° . Water loss rates are likely to be controlled even at 70 ° by diurnal t empera ture cycles. A much more complex model , including an a tmospher ic boundary layer, diurnal con- densation and evapora t ion cycles, and diur- nal t ranspor t out of the boundary layer, is needed to examine fully the water loss rates under these conditions. Finally, at low lati- tudes, exposed ice would not be stable at high obliquities, and the ice componen t of the low-latitude laminae might therefore have been eroded, whereas the CO2 annual caps part ly protect the laminae at higher latitudes.
The reader may note that there is no clear distinction in observed thickness, struc- ture, or geographical extent be tween the present north polar cap and a layer of northern laminae with a thin cap of dust. Ice surrounding dust grains never seems to be stable on bare polar ground according to our calculations of ice loss rates. Rather, it seems more likely that the laminae are remnant , buried, pe rmanent H~O ice caps that formed at both poles during periods of low obliquity or at the colder pole during periods of modera te obliquity and high ec- centricity.
(e) Summary At low obliquity, CO2 permanent caps

MARTIAN CLIMATE 587
will effectively trap water vapor. Perma- nent H20 ice caps will form partly from atmospheric water vapor, but mainly through water supplied from permafrost. The thickness of such caps could be tens of meters, but slow diffusion of water vapor through the upper several meters of regolith limits the cap thickness. At intermediate obliquities, water loss rates from the polar caps will be very large unless the conduc- tivity of the polar ice is close to that of pure ice. At high eccentricity one polar cap will have a significantly larger water ice loss rate than the other if both caps have the same albedo. However, the cap with the higher insolation will probably have a higher albedo than the other cap because dust storms will preferentially occur during the winter season of the low insolation cap. The albedo difference equalizes the water loss rate, or perhaps causes the high insola- tion pole to lose less water than the low insolation pole. This situation probably oc- curs on present-day Mars. At high obliquity both poles experience large ice loss rates, moving the permafrost boundary equator- ward. At high obliquity it is possible that a small amount of ice could melt in wind- sheltered regions, if the atmospheric pres- sure increased substantially. Ice is stable in the region of the polar laminae only when thick, high-albedo ice sheets are present. No obvious mechanism exists to incorpo- rate ice into forming dusty laminae. It is most likely that the laminae are buried, remnant, permanent polar caps. Hence over long time periods the latitude bound- ary of the polar debris mantle marks the furthest equatorward boundary of the an- nual CO~ caps and the boundary of the laminae marks the furthest equatorward boundary of the permanent water ice caps.
VI. T H E R E L A T I O N B E T W E E N O R B I T A L V A R I A T I O N S A N D H 2 0 - C O 2 - C L O U D
G R E E N H O U S E S
Numerous dessicated channels cover the surface of Mars. Their origin is unknown, but an early Martian climate, warmer and
wetter than now, may have played a role in their formation. Pollack (1979), Sagan and Mullen (1972), and Sagan (1977) pointed out that reduced atmospheres composed of CI-I4 and NH3 could maintain high surface temperatures through a greenhouse effect with small (100 mbar) pressures of CH4. Such atmospheres are consistent with many models of outgassing for Mars and Earth (Fanale, 1971), with theories of the origin of life on Earth, with ideas on the nature of the early terrestrial atmosphere, and with concepts about the maintenance of the early Earth's high surface tempera- tures despite low solar luminosity. The great disadvantage of reduced atmospheres is that they are unstable with respect to hydrogen escape following photodissocia- tion and may therefore have very short lifetimes.
Another possibility is that high surface temperatures were maintained by a green- house effect in a CO2-H20-cloud atmo- sphere (Pollack, 1979; Cess et a l . , 1980). Such an atmosphere has the advantages of having a relatively long lifetime and of being chemically identical to the presently observed atmosphere. Many investigators (e.g., Walker, 1976) believe that the Earth's early atmosphere were dominated by CO2 rather than CH4. Owen et al. (1979) show that the temperature of the early Earth could have been maintained above freezing despite lower solar luminosity by a plausible CO2-H~O atmosphere. Fanale (1971) pointed out that the outgassed atmosphere of Mars would be dominated by CO2 and H2 assuming the H20 to be cold trapped. The formation of CH4 occurred only if the es- cape of H~ was not rapid compared with the outgassing rate. He adopted a catastrophic, accretional degassing model so that Hz had a relatively long enough lifetime to convert CO2 to CH4. In 1971 it was believed that Mars was not geologically active, but now the observed prevalence of large volcanoes suggests continual geologic activity. More- over, most evidence (Anders and Owen, 1977; Pollack and Black, 1979) suggests

588 TOON ET AL.
that Mars is not fully degassed, which may imply a more gradual degassing epoch. The question of degassing history and the CO2/CH4 ratio needs to be reanalyzed based upon the data obtained since 1971. The disadvantage of a COs atmosphere is that relatively large amounts of COs are required to maintain high temperatures. Early estimates by Anders and Owen (1977) suggested that less than 500 mbar of COs had been outgassed on Mars. However, more recent estimates (Pollack and Black, 1979) that consider revised theories of noble gas abundances on the terrestrial planets suggest that 1 to 3 bars of COs may have been outgassed. These outgassing esti- mates make an early CO~-H20 greenhouse much more plausible.
Below we explore in greater detail the nature of CO2-H20-cloud greenhouses. First, we discuss the maintenance of sub- stantial quantities of atmospheric gases. Then we elucidate some difficulties in de- termining precisely the pressures needed for keeping high surface temperatures. It should be noted that the climate considered represents a substantial departure from that of present-day Mars. A complete analysis of such climates is beyond the scope of the present work.
(a) Maintenance of COs and H~O in the Atmosphere
The present atmospheric pressure on Mars is far too low to produce an effective greenhouse. High COs pressures are re- quired to produce appreciable greenhouse warming by the 15-/.tm CO2 bands and other weaker COs bands, and also to pressure broaden H~O bands. Since atmospheric H~O is restricted by the atmospheric tem- perature, an increased CO2 greenhouse ef- fect is also needed to raise temperatures to allow more H20 into the atmosphere. As we have shown, changes in the orbital elements of Mars are unable to drive more than a few tens of millibars of COs out of the regolith and into the atmosphere-polar cap system. Hence to achieve significant
CO2 pressures and a significant CO2-H20 greenhouse, we must return to a period before the formation of an extensive clay- carbonate regolith.
The processes forming the Martian rego- lith are uncertain. Fanale (1976) argued that meteoroid bombardment produced a 2-km thick basaltic megaregolith. As pointed out earlier, basalt is not strongly adsorbing at high surface temperatures so, if the CO2 atmosphere appeared before the formation of a basalt regolith, a high-surface-tempera- ture climate could be stable. However, if the CO2 outgassed slowly as the regolith formed, it would be incorporated into the regolith. Likewise, if at low obliquity the CO2 pressure were reduced and tempera- tures fell, then CO2 would be permanently lost to the regolith. Higher obliquity could not return the CO2 to the cold atmosphere. Channel features are found only on heavily cratered terrain, so a scenario of early CO2 outgassing, gradual regolith production by meteoroid impacts, carbonate formation, and loss of an atmosphere is consistent with the timing of the end of channel formation.
Another plausible scenario that might lead to high surface pressures is that mete- oroid bombardment produced a basaltic regolith only 100 m thick which could not adsorb all the available CO2 as it was out- gassed. However, geochemical processes operating at high surface temperatures may have slowly produced more adsorbing clays from the basalts. Some CO~ may have been converted into carbonates, and clays as well as basalt may have been transported to polar regions where low temperatures in- creased adsorption. The outgassing rate, the rate of formation of clays and carbon- ates, and the rate of transport of regolith to the poles would have determined the lon- gevity of the high-temperature state. These geochemical processes may cause any high- temperature climate to be self-destructive since the rate of carbonate and clay forma- tion is greatly enhanced by high tempera- tures and by the availability of liquid water. Future studies of the rate of loss of atmo-

MARTIAN CLIMATE 589
spheric pressure due to carbonate and clay formation would be quite interesting. F. Fanale (private communication, 1980) sug- gests that a high-CO~-pressure, high-tem- perature climate might not last more than 106 years. On Earth, volcanism associated with continental drift recycles clays and carbonates into CO2 and other volatiles in the atmosphere, but continental drift has not occurred on Mars.
During the period before the loss of CO2 to geologic reservoirs, it is necessary to maintain the CO= in the atmosphere, and this requires high polar temperatures. As we shall discuss in the next section, a 0.5- to 2-bar CO= atmospheric pressure can maintain global average temperatures above 273°K. It is likely that heat transport
by such an atmosphere, in a manner analo- gous to that on the Earth, could maintain polar temperatures above 230°K. Hence CO2 once established at 0.5- to 2-bars pres- sure would not tend to form permanent polar caps since CO2 would be far below its vapor pressure at polar temperatures.
The process stabilizing the atmosphere in the above example is atmospheric heat transport to the poles. Gierasch and Toon (1973) examined the importance of atmo- spheric heat transport to the stability of the atmospheric pressure on Mars against changes in the polar heat budget. Their conclusions are illustrated in Fig. 15 where the solid lines represent solutions of a simplified polar heat balance equation for various levels of annual average available
190
o
~ 1 7 0
I - - ,¢ CC LU a_
LLI I - -
150
I I I , I I I I I
e=O.1 /~ = 0.013
I I I ] I
CLATHRATE /
/ / /A
ip. ,111,
= 2.6 x 10⁴ erg cm -2 s -1
2.2
1.8
1.4 "~ I
~ i i i ] i i i i I ! I I I J I i I 1 10 -1 100 101 102 103 104
ATMOSPHERIC PRESSURE, mbar
FIG. 15. Because of the strong dependence of atmospheric heat transport on atmospheric pressure, the polar temperature increases rapidly with atmospheric pressure. The various solid lines illustrate this dependence for different amounts of solar energy at the pole. The dashed curves are the vapor pressure relations for CO= and for CO=-H=O clathrate. Single intersections of solid and dashed curves represent stable climates. When multiple intersections occur, both the higher- and lower-pressure intersections are stable. As the solar energy available at the pole increases, more CO= is added to the atmosphere. Because of feedback, the pressure is very sensitive to solar insolation. ~ and fl are variable parameters entering the heat balance equation. (See Gierasch and Toon, 1973.)

590 TOON ET AL.
solar insolation, S. The heat balance equa- tion determines the tempera ture of the po- lar cap consis tent with the a tmospher ic heat t ransport , which in turn is controlled by the pressure of the a tmosphere . An additional constraint when permanent CO2 polar caps are present is that the atmo- spheric pressure is controlled by the polar cap tempera ture through the vapor pres- sure relation. This relation is illustrated in Fig. 15 by dashed lines for COs and COs- H20 clathrate. Stable climatic states are represented by intersections of the dashed and solid lines. For example , the S curve labeled 1.8 × 10⁴ ergs cm -2 sec -~ intersects the COs vapor pressure curve at a polar tempera ture of about 144°K and an atmo- spheric pressure of 6 mbar. I f Mars had permanent CO2 caps with albedos of 0.77, then S would now have this value and the model would represent present-day Mars. If the obliquity increased to 35 °, then S would increase to about 2.4 (for fixed al- bedo) and the only stable climate would have a pressure above 1 bar.
The climate illustrated by Fig. 15 has multiple solutions. As a result of the multi- ple solutions, if there are permanent CO, polar caps, then, once initiated, a high- pressure climate is stable until the solar energy input to the pole drops well below the solar input needed to initiate the high- tempera ture state. Gierasch and Toon (1973) did not include the greenhouse warming caused by increased COz, so the high-pressure climate is even more stable than Fig. 15 suggests. Of course, the pro- duction of clays and carbonates would eventually destroy the high-pressure cli- mate.
Another very likely possibility is that CO, -HzO clathrate might dominate the po- lar cap (Dobrovolskis and Ingersoll, 1975; Miller and Smythe, 1970). Clathrate is ther- modynamical ly favored over CO, at Mar- tian polar tempera tures and, since H~O ice is brought into the caps as finely divided grains in good contact with the a tmosphere , it is likely that clathrate formation would
readily occur. Figure 15 indicates that CO2 clathrate greatly limits the Martian atmo- spheric pressure, and, for the range of values of S shown, a tmospher ic pressures greater than 20 mbar are difficult to obtain. It is possible that increased greenhouse warming would increase the slope of the thermal balance solution (the solid lines in Fig. 15) and thereby allow much higher pressures . The value of S may also be much larger than the values indicated in Fig. 15.
Figure 15 shows that a high-pressure climate must either be initiated by, or main- tained by, an increase in available solar insolation. Figure 2 indicates that obliquity variations are capable of considerably mod- ulating the polar heat budget. The solar insolation is also very sensitive to the polar cap albedo. Normalizing to a CO2 albedo of 0.6 and on obliquity of 25 °, we find
S ( A , 0 ) / S ( 0 . 6 , 2 5 ° ) = 5.91(1 - A) sin 0. (13)
This ratio is 0.6, 1.35, and 1.67 for obliqui- ties of 15, 35, and 45 °, respect ively, wi thA fixed at 0.6. For an obliquity of 25 ° it takes values of 1.25 and 0.75 for polar cap al- bedos of 0.5 and 0.7, respect ively. With A = 0.6 a n d 0 = 25 ° , S = 3.1.
Hence , if the CO2 albedo is now 0.6, then Fig. 15 suggests that if COz were available, a runaway condition could occur at present . If, earlier in Martian history, the solar luminosity were 0.7 of its present value, S at 0 = 25 ° would be 2.0, even for an albedo of 0.6.
The polar energy would be greatly in- creased by lowering the albedo or increas- ing the obliquity. Ward e t al . (1979) sug- gested that during its early history Mars may have had a mean obliquity near 32 ° with excursions to 45 and 25 ° . Such an obliquity would make a high-pressure cli- mate easier to achieve and maintain. For example , with 0 = 45 °, A = 0.5, and current luminosity, S could reach a value of 6 × l04 ergs cm -z sec -1. Hence we can conclude that reasonable modifications of the polar albedo and obliquity are probably

MARTIAN CLIMATE 591
sufficient to initiate a high-pressure cli- mate for either COs or its clathrate.
(b ) C02-H~O-Cloud Greenhouse
Pollack (1979) computed surface temper- atures for various CO~ pressures, relative humidities, and tropospheric lapse rates, and he found that global average tempera- tures above 273°K occurred when the CO2 surface pressure was about 2 bars. Cess et al. (1980) performed similar calculations but they concluded that a pressure of only 1 bar would produce a temperature above 273°K. Both pressure estimates greatly ex- ceed early predictions of the Martian CO2 inventory (Anders and Owen, 1977). How- ever, new predictions of outgassed CO2 exceed the pressures required to obtain a surface temperature greater than 273°K by either of these radiative calculations (Pol- lack and Black, 1979). The dependence of surface temperature upon surface pressure increases rapidly and becomes highly non- linear as the surface temperature ap- proaches 273°K. Hence predictions of the pressure needed to obtain a surface temper-
ature of 273°K are quite sensitive to the details of the radiative model. The major differences between the models of Pollack (1979) and Cess et al. (1980) are that the latter authors employ a greater pressure- broadening coefficient than Pollack and that the details of the treatment of the CO2 bands are slightly different. Here we shall point out that clouds and a possible low surface albedo might have been important to climate early in Martian history. Very low surface pressures are found to produce high surface temperatures.
Table IV presents radiative-convective calculations of surface temperatures for various pressures of CO2, a planetary al- bedo of 0.25, and for various values of an insolation factor,f, which is the ratio of the available solar energy to that presently available with globally averaged condi- tions.
Most of the cloud-free values given in Table IV were taken from the calculations of Pollack (1979), who assumed a fixed- temperature profile with a lapse rate, F, of 3.5°K km -1 and a relative humidity Rh of
TABLE IV
RESULTS OF GREENHOUSE CALCULATIONS
Insolation factor,
f
Surface pressure (mbar)
6 100 300 600 1000 1500
No cloud Global average
Global average w i thA = 0.1 or equator with A = 0.25
Equator with A = 0 . 1
Cloud Global average
Equator with A = 0 . 1
1.0
1.25
1.5
2.0
1.0 1.25 1.5
217 228 233 (248; F = 3.5) (218) (250; F = 5)
232 244 255 (284; F = 5)
242 258
265 295
273
260 298 280
285
252 (259; F = 3.5) (263; F = 5.0)
(254;Rh = 0.5)
(272)

592 TOON ET AL.
unity. He obtained the surface temperature by balancing the outgoing thermal flux against the available solar energy. Pollack showed that his results were not very sensi- tive to the lapse rate, nor the relative hu- midity.
Also presented in parentheses in Table IV are new results for cloud-free condi- tions. These calculations were performed with a radia t ive-convect ive scheme that converges to a radiative equilibrium ther- mal profile in regions where the profile is subadiabatic. The solar energy is assumed to be deposited only at the surface. The calculations also include a pressure broad- ening coefficient appropriate for CO2 that Pollack (1979) inadvertently overlooked. However , the difference in the surface tem- peratures calculated with the two methods is only a few degrees except at high pres- sures. The new calculations show that only 1.5 bars of CO~ are needed to obtain a 273°K mean temperature.
The basic conclusion to be drawn from the numbers in Table IV is that CO2 pres- sures near 1.5 bars are required under cloud-free conditions in this model to achieve global average surface tempera- tures above the freezing point of water. The temperatures are not very sensitive to rela- tive humidity nor to lapse rate, as is appar- ent from the i -bar values in Table IV.
Table IV also suggests several means by which lower pressures might yield high temperatures. For example, the present al- bedo of Mars is quite high, A - 0.25, because of the presence of abundant iron oxides. As we have already pointed out large atmospheric pressures could only be achieved before extensive regolith modification by geochemical processes. At this stage in Martian history, iron oxides may not have been formed. Kieffer et al. (1977) report that Mars presently has a bimodal surface albedo distribution, sug- gesting that the Martian surface is com- posed of one material with an albedo near 0. I and another, much brighter material. Hence, it is reasonable to assume that the
planetary albedo was near 0.1 in early Mar- tian history. The insolation factor for this albedo is 1.2, and COz pressures near 600 mbar could then yield global temperatures above freezing!
Global average temperatures of 273°K may not be the relevant criteria for fluvial features. For example, if one only desires equatorial average temperatures of 273°K, then for an obliquity of 25 °, f = 1.22 on a yearly mean and P = 600 mbar is needed. If the albedo is 0.1 and only high equatorial temperatures are needed, then a n f of about 1.5 and 300 mbar of CO2 will suffice. At high surface pressures, atmospheric heat transport will lower equatorial tempera- tures and raise polar ones. Hence precise estimates of the COz pressures needed to achieve high equatorial temperatures are difficult to make.
The calculations tabulated in Table IV consider only the greenhouse warming due to CO2 and H20. Perhaps other trace gases that are effective at producing a greenhouse might have been present in the early Mar- tian atmosphere. For example, Oyama et
al. (1979) suggest that SO2 may be impor- tant for the Venus greenhouse. We plan to consider further the importance of trace gases in future work.
Another possibility for enhanced green- house effects is that high clouds may form. The advantage of clouds is that pressure broadening is not needed to make them efficient infrared radiators. The disadvan- tage of clouds as greenhouse constituents is that they reflect solar insolation. Whether clouds warm or cool depends upon their optical depth in the visible and infrared, their area, their altitude, and their composi- tion (Schneider, 1972).
Several cloud materials might contribute to a greenhouse. Dust now dominates the thermal balance on Mars. However , it is unlikely that dust could form more exten- sive clouds than at present because solar energy deposition in the dust stabilizes the atmosphere and stops the dust lifting pro- cesses. CO2 ice has very narrow infrared

MARTIAN CLIMATE 593
bands and would not be an efficient green- house material. Our radia t ive-convect ive calculations confirm the speculation of Gierasch and Toon (1973) that a high pres- sure COz thermal profile has its upper atmo- sphere at temperatures below the CO2 frost point. This situation occurs in calculations for present-day Mars, which is corrected by appealing to efficient large-scale vertical heat transport through dynamics (Pollack et al., 1979). A similar process, and perhaps solar energy deposition in the gas as well, is needed to prevent the formation of CO2 clouds over most of Mars at high pressures.
Below we consider only water ice clouds because they have greater infrared emis- sion than CO~ clouds and, unlike dust, water cloud particles do not have to be lifted from the surface. Table IV presents a series of cloud greenhouse calculations per- formed with a radia t ive-convect ive 1-D model. As we have noted, the effect of clouds on the radiation budget depends upon various cloud properties. Rather than at tempt to explore the entire range of possi- bilities, we have studied only those clouds that should be among the most effective at increasing the surface temperature. This deliberate bias is intended to determine the maximum additional warming that clouds might plausibly contribute, and is not meant to represent the most likely case. Hence we chose a water cloud fractional coverage of 75%, a particle size distribution with a mean size of 4 /xm, a cloud visible optical depth of about 5, and a cloud top pressure of 10% of the surface pressure. We also used a relative humidity of unity and an adiabatic lapse rate of 5°K km -x.
If the clouds are effective as greenhouse warmers, then using as large an area of coverage as possible enhances their impact. However , it did not seem reasonable to expect 100% cloud cover since the water vapor sources would be localized to the equatorial and summer polar regions and restricted to a small fraction of the planet 's surface since no oceans are anticipated. Particles of sizes near 4 /xm do not have
substantial fall velocities, so they could remain in the atmosphere for long periods of time. Particles of such size have large visible asymmetry factors, so the clouds have relatively low visible albedos, but the clouds' drops are large enough so that the clouds effectively block infrared radiation. A large visible optical depth insures that the clouds will have infrared optical depths that are large (1 to 3). Finally, optically thick clouds radiate effectively at the ambient temperature. The higher the ambient tem- perature, the more energy they radiate to space and the less effective they are at creating a greenhouse. Therefore, high-alti- tude clouds are the best greenhouse candi- dates, but once they reach an altitude where the temperature varies slowly with height, further increases in altitude do not substantially improve the ability of the clouds to create a greenhouse. We chose a cloud top pressure altitude of 10% of the surface pressure since it was the lowest altitude at which the thermal profile became nearly constant. Typical terrestrial radia- t i ve -convec t ive models place clouds at 0.4 to 0.5 of the surface pressure.
We assumed in our cloud calculations that all the available solar energy was de- posited at the ground. The solar energy was reduced over 75% of the planet by reflection at the cloud top surface cal- culated with a two-stream approximation for a conservatively scattering cloud (It- vine, 1975), including multiple ground reflections.
For particles of the size of interest the asymmetry factor, g, is about 0.85. With ground albedo A = 0.25 and cloud optical depth of 5, the planetary albedo is about 0.43. This case represents f = 1. If the surface albedo were 0.1, the planetary al- bedo would be 0.35 a n d f = 1.15.
Table IV shows that favorably placed clouds may raise surface temperatures over a cloud-free case by about 20 to 40°K. Global average temperatures above 273°K then require less than 600 mbar of pressure. If the surface albedo is 0.1, a global surface

594 TOON ET AL.
temperature of 273°K occurs at pressures near 300 mbar. A high equatorial tempera- ture occurs near 300 mbar for an albedo of 0.25 and, if the surface albedo is low, then equatorial temperatures can be 273°K for pressures near 100 mbar.
(c) Summary
New estimates of the COs outgassed over Martian geologic history suggest that more than enough CO2 is available to produce a significant greenhouse effect (Pollack and Black, 1979). A high-obliquity state might be required to initiate a high-pressure cli- mate, but once initiated, greenhouse warm- ing and atmospheric heat transport might prevent polar cap formation even at low obliquity. The atmosphere would be de- stroyed as carbonates and adsorbing clays form and as the regolith is t ransported to polar regions. If COs had been slowly out- gassed after the formation of a thick, cold, adsorbing regolith, the atmospheric pres- sure could never have built up. New green- house calculations by Cess et al. (1980) suggest that only 1 bar of COs is needed to achieve global average temperatures above 273°K with the current Mars albedo and solar luminosity. We studied a less sensi- tive radiation model that predicts that 1.5 bars are needed to achieve 273°K. We found with this less sensitive model that if the surface albedo of Mars were lower in its early history, or if equatorial conditions are more relevant than global averages ones, or if extensive high clouds form, then only 500 mbar of COs are needed to obtain tempera- tures of 273°K. A great many details of a high-pressure COs climate need to be con- sidered further. In particular, the upper atmosphere needs to be warmed to prevent COs frost formation. Atmospheric heat transport to polar regions needs to be taken into account, for it may significantly de- press equatorial temperatures and raise po- lar ones.
VII. DISCUSSION
In the preceding sections we considered
variations in the CO2, dust, and HsO cycles caused by changes in the orbit and obliquity on Mars. We also discussed the implica- tions of enhanced COs pressures for green- house warming. Here we would like to unify the ideas developed by describing how the climate might differ between the present orbital configuration and various alternatives. Then we will mention the ob- servational evidence for climate change and finally propose models for the formation of the polar laminae and of the fluvial features.
At present, the Martian obliquity is about 25 ° , but periodically in the recent past the obliquity has reached values less than 15 ° (Ward, 1979). As the obliquity decreases, the poles receive less solar energy and, if, the polar cap albedo is not too low, as seems likely, permanent CO2 polar caps will form. The formation of permanent po- lar caps will reduce the atmospheric pres- sure to values of 1 mbar or less. The precise value of the pressure depends on the al- bedo; higher albedos will cause lower pres- sures. The reduced atmospheric COs pres- sure will strongly desorb COs from the regolith augmenting the permanent CO2 caps with the limit being set by the ability of CO2 to diffuse from the regolith and also by the amount of COs presently adsorbed on the regolith. The regolith could contribute a several-hundred-meter thickness of COs over the area of the present caps, while the present atmospheric pressure corresponds to only about 10 m.
Permanent COs caps will be strong water vapor sinks and thus atmospheric water vapor will decline at low obliquity. In addi- tion, equatorial and midlatitude annual mean temperatures will be several degrees higher than current values. Lessening amount of atmospheric water vapor and increased midlatitude temperatures will force the equilibrium permafrost boundary to a higher latitude than now. Water will be supplied to the permanent polar caps, but the water supply to the caps will be strongly limited by diffusion so that during a half obliquity cycle of 5 × 10⁴ years a few

MARTIAN CLIMATE 595
meters of H~O might be added over the area of the present permanent polar caps. Other processes assisting diffusion, such as slumping that exposes fresh ice, or the presence of large pore sizes or cracks near the surface, could substantially augment the H20 supplied to the poles. The seasonal thermal wave might drive high latitude per- mafrost to the poles, thus adding a few tens of meters of ice to the caps. If per- manent CO2 polar caps cover a larger geo- graphic area than the present permanent H20 caps, or if local slopes and other thermal balance factors are favorable, ex- tensive water ice sheets may develop over the area now covered by the polar laminae. If these sheets reach great enough depths to have high albedos and high thermal conductivities they will be stable at higher obliquities than those at which they formed.
As the CO2 pressure drops, dust-storm activity will cease, because at low pressure only unreasonable wind speeds, in excess of the speed of sound, would be able to lift dust. Since no dust will be available, both the CO2 and HzO caps would have much higher albedos than the present 1-120 and CO2 caps. Hence the decline of dust storms strongly augments the trend of the CO2 and HzO cycles.
The atmospheric circulation at low obli- quity will be quite different than at present. Since there will be no dust storms, the vertical thermal structure will be under greater dynamic control. Feedback be- tween tidal winds and local dust storms will not occur. Large temperature gradients, perhaps similar to those at the present southern summer pole, will drive violent winds at the edge of the summer permanent polar caps. Larger meridional winds will be caused by the necessity of supplying the mass of the annual CO2 polar caps with a less massive atmosphere. The radiative time constant will be less than at present and the ground temperature will be under even greater radiative control than it is n o w .
The orbital eccentrici ty and longitude of perihelion will probably play no significant role in determining the basic climate at low obliquity.
Ward (1979) shows that periodically the Martian obliquity may reach values as high as 35 °. Ward et al. (1979) suggest that the obliquity could have had a mean value of 32 ° and reached an extreme near 45 ° prior to the formation of the Tharsis ridge. As the obliquity increases the poles receive more solar energy so that temperatures of the ground and ice will increase.
Polar ground temperatures during sum- mer can exceed 260°K at 0 = 35 ° when e = 0.14. However , at 0 = 35 °, annual average polar temperatures will exceed present temperatures by only about 10°K whereas equatorward of 60 ° latitude annual average temperatures will be several degrees cooler than at present.
The small changes in annual average tem- perature will slightly decrease adsorption in the polar regolith and increase adsorption in the equatorial regolith. A globally distrib- uted basalt regolith would desorb enough CO2 to provide an increase of only a few millibars of pressure. Larger increases might occur if the regolith were concen- trated in polar regions or if the regolith were composed of clays. A clay regolith could potentially release several tens of millibars of COz to the atmosphere. Such small pressure increases are significant for dust storm activity, but not for greenhouse warming.
High temperatures for water ice can oc- cur at large obliquity. In wind-sheltered regions, at fairly high atmospheric pres- sures (50 mbar), low-albedo water ice could melt at 0 = 35 °. However , it is more likely that thermal conduction and evaporative heat losses will prevent water ice from reaching the melting point. The water vapor loss rate from the polar cap is a strong function of temperature and therefore of albedo and thermal conductivity; neverthe- less, it is likely that large water loss rates will occur. Dusty water ice would be highly

596 TOON ET AL.
unstable in the polar laminae area. Atmo- spheric water vapor amounts will increase, and since equatorial temperatures will de- cline at high obliquity, the equilibrium per- mafrost boundary will move to lower lati- tudes. The polar water ice will at tempt to transfer to the regolith, but regolith diffu- sion will limit the amount of new perma- frost formed. Only a few tens of meters of polar ice might find its way into the regolith unless atmospheric water vapor builds up to high levels or soil pore sizes are very large near the Martian surface. The polar caps will disappear at high obliquity if per- mafrost formation is rapid enough.
The dust storm cycle will be strongly modified at high obliquity if a few tens of millibars of CO2 are desorbed from regolith reservoirs. In that case wind speeds needed to lift dust will decline significantly. Dust storms will occur during the summers in both hemispheres. However , it is unlikely that dust storms will be more prevalent or intense than they are today during southern hemisphere summer. Atmospheric heating due to solar energy deposition in the dust will stabilize the atmosphere and will pre- vent substantially more dust storm activity than at present. Since dust storms will occur during both summers, the rate of supply of dust to the two polar regions will be more nearly comparable than is the case now. Because more water will be mobilized in summer and then deposited with the dust in winter than now, it is likely that both permanent polar caps, if they exist, will have a slightly higher albedo than the present northern H20 polar cap but a lower albedo than the present southern H20 polar cap.
The atmospheric circulation at high obli- quity will be character ized by strong sum- mertime easterlies because summer polar temperatures are higher than equatorial ones. Unlike the present Martian summer, which is relatively free of baroclinic distur- bances, a high-obliquity summer may have frontal activity. If the atmospheric pressure increases, the radiative time constant will
increase proport ionately so that tidal and topographic winds will be damped.
The orbital eccentricity and the longitude of perihelion may be less important at high obliquity than it is now. The dust-storm cycle will be unaffected by the eccentrici ty (if atmospheric pressures increase). How- ever, the water balance between the poles may be controlled by the eccentric orbit. If permanent water ice polar caps are found at high obliquity, they will be much more likely to transfer between the poles with the precession of the equinoxes than they are now. Then the pole with summer contain- ing perihelion will have the smaller polar cap.
Ward (1974, 1979) and Murray et al.
(1973) show that the eccentrici ty of Mars varies from 0.0 to 0.14 and that the longi- tude of perihelion slowly varies. The ec- centricity barely affects the annual aver- age temperatures. Therefore , permafrost boundaries (now located near ___40 ° lati- tude) and regolith adsorption processes cannot be affected substantially by changes in e or to. Eccentr ici ty and to do not significantly affect the climate at very low 0, but they might make significant changes in the water cycle at very large 0. Ward (1979) shows that during a modest fraction of Martian history, 0 oscillations about the mean are fairly small. During these periods, variations in e and 0 play important roles by creating hemispherical asymmetries.
When the Martian orbit is circular, the hemispheres have comparable energy budgets. It i s likely that global scale dust storms do not occur during such periods at modest 0, but our knowledge of Martian dust-storm generation is not sufficient to determine whether dust storms occur at e = 0. If dust storms do not occur, then the albedos of both polar caps should be large during such periods, while if dust storms do occur, both poles would have albedos like that of the present northern water ice cap. Detailed stratigraphy of the polar caps may some day answer this question.
At large eccentricities, hemispherical

MARTIAN CLIMATE 597
asymmetry is accentuated, especially when perihelion occurs near a solstice, as at present. Then global dust storms will occur preferentially during the summer in which perihelion occurs, the albedo of that sum- mer cap will be higher than the albedo of the other cap, and the water ice cap in that hemisphere will be smaller than the other because of larger water loss rates. This simple picture can be upset by feedbacks between the dust cycle and the water and CO2 cycles. For example, the present smaller southern water ice cap, found at the pole receiving greater summer insolation as expected, lost less water vapor than the larger northern cap during the year of Vi- king observations. Presumably this contra- diction is caused by a recent change in the heat balance caused by dust storms creat- ing a lower ice albedo at the northern pole.
In order to verify or improve upon these ideas concerning climate changes due to orbital element forcing, we need the follow- ing basic knowledge: the permanent polar cap albedo in the southern hemisphere; the thermal conductivity of the permanent po- lar caps and polar laminae; the geographical distribution, depth, pore size, and composi- tion of the regolith; the amount of CO2 and H20 adsorbed on the regolith; the amount of CO2 in the southern permanent polar cap; and the thickness of the water ice in the polar caps. Experimental studies of the diffusion of CO2 and H20 through porous, adsorbing soils would be quite useful. We also need better theoret- ical models of the mechanisms generating dust storms, of regolith desorption, of the transport for 1-120 and dust, and of the polar heat budget. This information would improve our understanding of the pro- cesses causing climatic change.
Evidence for climatic change is also re- quired. It is important to note that varia- tions in eccentricity and longitude of peri- helion will be recorded as hemispherical asymmetries, while changes in the obliquity cycle will be recorded symmetrically. Un- fortunately, since both cycles occur, it will
not be easy to separate symmetric and asymmetric variations without precise dat- ing.
The most obvious evidence that the orbit affects the climate is that global dust storms now occur only during southern hemi- sphere summer. This asymmetry most likely is due to higher winds occurring when solar insolation is maximized near perihelion. As perihelion precesses, the time of year when dust storms occur will change.
A second suggestion of the importance of eccentricity and perihelion passage, long used as evidence for strong orbital insola- tion control over the water budget, is that the area of the southern polar cap is much less than that of the northern polar cap. Unfortunately, there are several unre- solved difficulties. The observed water budget of Farmer et al. (1979) showed less water loss from the south pole than the northern one, and James et al. (1979) sug- gest that the south pole might have a resid- ual CO2 cap. These observations imply that the orbit does not contro| the polar heat budget directly through the insolation. Probably the dust-storm asymmetry has created different albedos at the north and south poles so that orbital insolation varia- tions control the heat budget indirectly through the dust storms. Another possibil- ity is that the difference in the water loss rates between the caps is so small at present obliquities that only a small fraction of the polar cap mass can be transferred between the caps during a precessional cycle. In that case the present areal cover- age of the two caps is a fossil of a higher obliquity state. A final possibility is that geological factors such as regional slope differences may control the polar heat budget. The importance of regional topog- raphy is strongly suggested by the fact that neither polar cap is symmetric about the rotational axis. Detailed models of the polar cap heat balance are necessary to deter- mine the importance of topography to the heat balance.

598 TOON ET AL.
Another asymmetric geological feature, possibly related to climate, is the vast (105 km2), low-albedo, dune field partially encir- cling the north pole in the region poleward of 80 ° latitude which does not contain lami- nae or permanent ice. Cutts et al. (1976) find that the dunes have a complex relation to the polar ice, sometimes overlying the ice and sometimes underlying it, suggesting that the dunes and ice are interactive.
It is possible that the north polar dunes are the remnant of some easily erodable geologic structure found only in the north polar region and therefore have no climatic significance. However , the mechanism of supply of dust and water to the polar cap region can naturally explain them. Individ- ual dust grains entering polar latitudes be- come coated with H20 ice and eventually fall out onto the annual caps when COz condenses on the particles. During the fol- lowing summer, at most latitudes, the dust grains are freed when the COs and ice sublime away, and a general polar debris mantle, rather than dunes, forms. How- ever, the dust which falls on the permanent polar caps does not completely lose its coat of water ice, and so is t rapped on the polar cap. The dunes are found within the same latitude belt as the permanent cap, but because of their lower albedo and presum- ably lower thermal conductivity, the dunes are less able to retain water ice than the polar caps, although they are better able to keep water ice than the lower latitude dust deposits. The small amount of ice left around the dust grains at least until sum- mer serves to cement many of them to- gether into large saltating particles. The single-scattering albedo of a large particle is lower than that of a small particle com- posed of the same material. Therefore, dunes composed of clumps of fine dust particles could have lower spherical al- bedo. Under this scenario the dunes would not occur in the southern hemisphere be- cause ice is less stable, due to the higher summertime solar insolation. Haberle et al. (1979) also pointed out that an ice cement
could form saltating grains from dust. They suggested that the greater dust supply to the north pole favored dunes there. While we agree that the dust supply is significant, we feel that the greater longevity of the ice at northern latitudes is also of great impor- tance.
Although the southern polar laminae are larger in area than the northern ones, the northern laminae are thicker than the southern ones. By mass the laminae are symmetric about the equator. The structure of the laminae has been described in detail by Cutts et al. (1973, 1976, 1979). They are layers of dust and possibly ice exposed in places as fine terraces of approximately equal thickness (-~30 m) that extend uni- formly over hundreds of kilometers (Fig. 1). The scarps along which the terraces are exposed were originally thought to be edges of a series of stacked plates, each com- posed of many terraces. More recent obser- vations (Cutts et al . , 1979) indicate that the scarps, which spiral about the poles are primarily the edges of troughs cut into the laminae, although isolated escarpments also exist. Cutts et al. (1979) have also identified an undulating character to the fiat regions separating the troughs. The nearly complete absence of craters in the laminae suggests that they are fairly youthful or that they are continually being resurfaced.
We require mechanisms for creating three properties of the laminae. First, it is necessary to explain why dust preferen- tially collects in the polar areas. Second, we must elucidate the formation of the terraces. Finally, it is necessary to account for the troughs and large-scale escarp- ments. All three of these observations can be explained through the use of a model having a variable dust-to-ice mixing ratio. The variation is driven by the orbital ele- ment changes that alter the polar heat budget and the dust storm cycle.
Both poles are probably permanent net dust sinks because dust storms do not pref- erentially remove dust from the polar re- gions, and because particles from dust
MARTIAN CLIMATE 599
storms are preferentially deposited in the polar regions. Global dust storms now orig- inate in the southern hemisphere and spread northward. Hence the dust is not preferentially obtained from the north polar region. We do not know the source regions of dust in the southern hemisphere, but there is no reason to believe that the pole is a preferred source region. Dust and ice are codeposi ted as small particles in the north annual cap and to a lesser extent in the south annual cap because CO2 snow forma- tion is a strong atmospheric clearing mech- anism (Pollack e t a l . , 1979).
Cutts et al. (1973, 1979) suggested that dust collects at the poles because erosion is prevented in the polar regions by water ice cementing the grains. Such a process is probably significant in the permanent cap region. However , extensive debris mantles surrounding both poles to fairly low lati- tudes (35°), but not covering equatorial regions (Soderblom, e t a l . , 1973), suggest that ice formation is not the dominant process keeping dust in the polar regions. We are inclined to believe that the poles are a net dust sink because of enhanced deposi- tion there by CO2 snow, since global dust storms do not originate there, and because the polar dust grains cannot be easily lifted by the wind. Water ice formation about dust particles increases their sizes by only small amounts. Winds are probably able to suspend such ice-dust particles nearly as easily as single dust particles. However , dust particles of such size are not directly lifted by the wind but are injected by larger saltating particles. Such large particles may be generally absent in the polar regions since they are not carried there by winds and this missing ingredient suppresses wind erosion.
No observational evidence is available to strongly limit theories concerning the rea- sons that the polar ice and dust form a terraced structure in the laminae. Evidently erosion-resistive soil occurs at regular depths, but whether the erosion-resistive segment is caused by chemical cementing
of grains, variations in particle size, changes in particle composit ion, or some other proper ty is not known. A reasonable hypothesis is that the terracing is caused by variations in the dust-to-ice mixing ratio through the laminae. The more resistive fiats are primarily compacted dust, while the more easily eroded segments are largely water ice with a minor component of un- consolidated dust. When the terrace edges are exposed to the atmosphere the water ice sublimes and the surrounding ground loses its strength and therefore slumps. Strong evidence for this mechanism is that debris mantles are not terraced at lower latitudes, where surface ice is probably never stable. The cause of the varying dust- to-ice ratio may partly be changes in the relative deposition rate of dust and ice as suggested by Pollack (1979). In addition, and perhaps more importantly, water ice can be preferentially removed as water vapor sublimes from a shrinking polar cap. As water vapor sublimes, dust imbedded in the ice will become concentrated until eventually a thin layer of nearly pure dust caps the ice so as to prevent further ice loss.
There are two types of changes that will create variations in the dust-to-ice mixing ratio: changes in the longitude of perihe- lion, and changes in the obliquity. For an eccentric orbit one pole is favored to re- ceive both dust and polar ice. For example, the north polar cap of Mars now covers most of the laminae in the northern hemi- sphere, and dust storms lead to high dust deposition rates there. As perihelion pre- cesses, the north cap will begin to lose water to the south cap. As the north cap shrinks, the dust at the top of the cap will become concentrated into a layer. Eventu- ally, the dust layer will become thick enough to protect the underlying ice from the seasonal temperature cycle. If the present dust-to-ice mixing ratio is 0.15 (as implied from the present polar albedo), then to obtain a 1.5-m-thick layer of dust, 8.5 m of ice must be lost. This is about all the

600 TOON ET AL.
ice that could be lost f rom the pole unless the upper dust layer is heavily eroded. Hence one layer will be formed during half a precessional cycle at one pole, and one layer will be formed during the other half cycle at the other pole. The strongest evi- dence that such a mechanism occurs is that the north polar cap now covers most of the northern laminae.
One problem with this model is that large amounts of ice are being lost f rom the permanent polar cap sys tem and transfer- red to the laminae. In order to account for the present H20 cap, the continued formation of laminae, and their nearly uniform thick- ness, one must assume that the rate of supply of water to the larger polar cap from nonpolar cap reservoirs is very constant in t ime and is equal to the rate of loss of water caused by burial in the laminae. As we shall discuss, the formation of scarps in the laminae may supply the needed H20. An added problem is that the water loss rate must be substantial for the present obli- quity so that water can be driven between the poles. The permanent polar cap thick- ness must be modera te ly close to the lami- nae thickness plus 10 m, or about 40 m.
The second terracing mechanism is obli- quity oscillations. At low obliquities dust- s torm activity will cease, and H20 ice sheets will form within permanent COs caps over a large polar area from water supplied by permafrost . Once formed, these sheets will be stable as the obliquity increases. At modera te obliquities dust s torms will occur so that both ice and dust will be deposited. At larger obliquities any exposed ice will be driven off the permanent caps and back into regolith reservoirs . A layer of dust will cap the underlying ice and stablize it against the seasonal tempera ture wave. Permafros t reservoirs must be able to supply the differ- ence be tween the permanent cap water and that lost to the laminae during each obli- quity cycle. This loss of water to the lami- nae need not imply a huge permafros t source of water. The format ion of scarps in the laminae may also recycle the needed
water. This mechanism does not require large polar water loss rates at the present obliquity. It does, however , imply that a permanent polar-cap thickness on the order of 40 m is needed to form a 30-m layer of laminae, since at high obliquity only a sin- gle 10-m layer of ice needs to be lost to create a dust cap from dust embedded in the ice.
In reality, both eccentr ici ty and obliquity variations may be forming laminated ter- rain. Hence a complex record of formation may eventually be found in the laminae structure.
A problem with forming the terraces in either of these ways is that one 30-m layer is created approximate ly every 105 years. The supply of water and dust to the north cap as est imated by Pollack et al. (1979) is sufficient to build a 30-m layer during 10 ~ years. However , the total thickness of the laminae is only a few kilometers (Dzurisin and Blasius, 1975). Hence only 10 r years is represented in the laminae if each layer is conserved and represents 105 years. Al- though the lack of craters suggets a possible youthful age for the laminae, it is difficult to imagine why they should have begun to be formed only I0 r years ago.
One possibility is that the laminae are not conserved. Cutts et al. (1976) note that the laminae crater age can be explained by a crater filling rate of I km/106 years. Such a t ime is consistent with the time for orbital motions to create 1 km of laminae. The most plausible mechanism for destroying 1 km of laminae every 106 years is horizontal propagat ion of the scarps that incise the laminae. As we shall discuss, and as How- ard (1978) has pointed out, laminae com- posed mainly of water ice could propagate. The troughs are spaced at intervals of about 50 km and do have depths on the order of 1 km. The laminae will be obli terated as they form if the troughs migrate at the modest rate of 5 cm year -1 and if the dust released is r emoved gradually by winds. This process may be the major one regulating the thickness of the individual laminae.

MARTIAN CLIMATE 601
Another mechanism that could increase the estimated age of the laminae is plastic thinning due to outward flow caused by the overburden load, followed by sublimation at the edges as suggested for low-latitude permafrost features by Squyres (1978). If the laminae are 90% ice, simply removing the ice at the bottom but retaining the dust extends the age of the laminae to 108 years. A reasonable hiatus in dust storm and ice deposition activity does not suffice to ex- tend greatly the age of the laminae. For example, large eccentricities only occur during about half of Martian history; if dust storms only occur at large eccentricity, then the age of the laminae could be in- creased by a mere factor of 2.
The final property of the laminae to ex- plain, and the one that has attracted most attention, is the deep troughs that dissect the laminae. Earlier these troughs were thought to be the edges of sets of young laminae stacked uniformly on top of older laminae. Such a structure suggested a dou- bly periodic constructional mechanism to Murray et al. (1973). The present concept of the structure of the laminae does not suggest a series of steps of progressively younger age.
More recent work has revolved around the idea that both erosional processes and constructional processes play an important role (Howard, 1978; Cutts et al . , 1979). Howard assumed (incorrectly) that the laminae were part of a stepped topography. He thought that the steps were all of the same age and believed that the higher inso- lation on the equatorward-facing slopes preferentially removed ice from the slopes and led to its deposition on the high-albedo flat areas separating the slopes. Winds car- ried away dust from the slopes leading to a poleward migration and formation of steep faces. Howard favored a model in which the layers forming the terraces of the lami- nae are being formed from the material composing the slopes as they erode. Hence he believed that the laminae in the north are forming under present conditions, while
those in the south, where there are not albedo differences between flats and scarps, are not forming at present. Why the slopes are terraced is not clear in Howard's model. An advantage of Howard's hypoth- esis is that the laminae continually recycle material and do not require water to be supplied from the regolith. Howard thought that the laminae are composed mainly of water ice.
Cutts et al. (1979) agreed with Howard that insolation control is important in form- ing the slopes, but they believed that the laminae are mostly dust and that the ice serves mainly as a dust trap. Hence, Cutts et al. have no mechanism to extend the age of the laminae by recycling material. Ac- cording to their model the equatorward- facing slopes of the troughs do not retain ice because they receive higher insolation than flats. Since the slopes do not retain ice, they do not retain dust either. Cutts et al. pointed out the existence of an undulat- ing character for the fiats separating the troughs. They thought that these undula- tions are caused by a gradually advancing or receding permanent polar cap and a cyclic dust deposition cycle that causes the dust retention region to gradually shift in a wavelike manner. Such a mechanism im- plies different time scales or phases for dust cycles and water cycles.
We propose a model of the laminae that is closely related to Howard's (1978) model. As we pointed out, we believe that approximately 40-m-thick layers composed of ice and dust are deposited during obli- quity and/or eccentricity cycles as the rem- nants of the permanent polar caps of these eras. As the obliquity and eccentricity change, the ice is forced off the polar caps. The dust at the upper surface is concen- trated until eventually a thin layer of insu- lating dust covers the dusty ice and pre- vents further water loss through the upper surface. Hence, we believe that orbitally forced insolation variations are responsible for the terraced structure. However, we believe, like Howard, that regional slope

602 TOON ET AL.
differences create insolation differences un- connected with orbital variations. These regional slopes cause water ice to be unsta- ble on equatorward-facing slopes. Hence these are defrosted zones. Since the lami- nae are largely water ice, the terraced structure is exposed and eroded along these slopes. The slopes propagate poleward and the propagation eventually leads to the ob- served defrosted bands of rather uniform horizontal structure. Water ice is unstable on these slopes at all eccentricities and most obliquities, so they cut through nu- merous terraces.
If equatorward-facing slopes are unsta- ble, it follows that poleward-facing slopes are more stable than fiat terrain. Hence in addition to equatorward-facing slopes propagating poleward by erosion, one also expects poleward-facing slopes mov- ing poleward by deposition. We propose that such propagating slopes form the al- ternate sides of the troughs There is no reason for the deposition and erosion pro- cesses to proceed at identical rates. Hence one may see isolated escarpments in various regions. The undulating terrain may represent such propagating, isolated features. Conceivably, the interaction of these structures may lead to growth or decay of their amplitude.
This model has several advantages. The terraces are formed by orbital variations. In Howard 's (1978) simplest model the ter- races were formed concurrently with the troughs. Therefore , the south pole pre- sented a problem because it now has no high-albedo flats that could grow. The es- carpments and troughs in our model are formed through insolation controlled by slopes. We believe that both poleward and equatorward slopes will propagate respec- tively by deposition and erosion. Hence troughs can form, as well as undulating terrain. Unlike Cutts et al. (1979), we feel that the laminae are composed mainly of water ice so that the scarps can move. Propagation allows the development of long uniform scarps from original small nonuni- formities such as craters, as pointed out by
Howard (1978). Propagation releases ice at the laminae edges and recycles the polar laminae, both filling and destroying craters and reducing the necessi ty for continual resupply of the laminae with permafrost water ice. This recycling allows the laminae to be much older than 107 years, despite the fact that one 30-m layer forms every 10 ~ years.
The final features thought to suggest Martian climate change are the channels. There are many different types of these features, implying different origins. (See Sharp and Malin, 1975). Some channels, mostly found in chaotic terrain, seem to have been formed during a single episode following the catastrophic collapse of a volatile-rich terrain. Although the morphol- ogy of other features, such as channels on crater rims and channel networks covering mountain systems, suggests rainfall, it does not require rainfall. Many geologists be- lieve that the channels were fed primarily from ground water sources. A much better knowledge of the requirements for the for- mation of the channels, such as duration of flow, number of repeated episodes of flow, water source, and whether or not the flow was capped by ice, is needed before any reliable climatological inferences can be drawn.
The geographic distribution of the chan- nels is also not well known. Sagan et al. (1973) presented data showing that the channels are concentrated in the equatorial regions, but the distribution may represent observational bias rather than the true dis- tribution. Sagan et al. (1973) pointed out that, if channels are more abundant in the equatorial regions, a climate-controlled wa- ter origin would be favored. Pieri (1976) noted that small Martian channels (which are the most numerous channels and are typically less than 150 km long and 1 to 10 km wide) are restricted to low-albedo, highly cratered terrains. The former restric- tion is possibly observational since in high- albedo terrains the lack of contrast makes it more difficult to see the channels, and since high-albedo terrains tend to be covered

MARTIAN CLIMATE 603
with a debris mantle that may hide the stream beds.
The restriction of the small channels to highly cratered terrain may be a significant clue to their age. Most geologists believe that the small channels, which are the most suggestive of a climatic origin, are older than the larger channels that appear to have been formed catastrophically. This belief is based on crater counts (Pieri, 1976; Sharp and Malin, 1975). The age of both channel types, according to these workers, seems to be billions of years. Channels are absent in younger geologic unit of the planet, such as most volcanic areas. An opposite point of view was expressed by Masursky et al. (1977), who asserted that cratering counts show that channels have formed during all periods from 3 × 10⁹ until 5 × l0 s years ago.
Many Martian channels probably form as the result of geological processes, such as volcanic activity or other geothermal events which melt subsurface ice. The time history of such channels depends on the geological thermal history of Mars. Most Martian channels do not have any obvious geothermal region at their source. Since these channels are geographically wide- spread, a global heat source is suggested to supply liquid H20. A plausible heat source is increased surface temperatures caused by climatic warming.
One possible cause of climatic warming is that the solar luminosity may have been higher at some past time. Although the possibility cannot be excluded, the current theory of solar evolution does not suggest that the solar luminosity was ever substan- tially higher in the past. In fact, the oppo- site is most likely. In addition, a solar- luminosity increase large enough to raise Martian temperatures substantially would also lead to very much higher terrestrial temperatures, possibly high enough to cause a runaway greenhouse on Earth (Pol- lack, 1979).
The most likely cause of warmer climate is an early, more massive atmosphere capa- ble of producing a substantial greenhouse.
Pollack (1979) has pointed out that only modest total pressures in CH4, NHa atmo- spheres are needed to raise global average temperatures above freezing. Unfortu- nately, the photochemical stability of such atmospheres is unknown. If one assumes that during the climatic epoch in question the temperature of the top 100 m of previ- ously frozen soil must increase substan- tially, then the atmosphere must maintain high temperatures for 104 years, the thermal penetration time.
A massive CO2 atmosphere has several advantages over a reduced one. CO2 is presently observed in great abundance on Mars, Venus, and Earth. Some theories of the evolution of the atmospheres of the terrestrial planets (Walker, 1976) suggest that early CO2-dominated atmospheres, containing very little hydrogen, are more likely than highly reduced, hydrogen-rich atmospheres. A CO2 atmosphere has a long lifetime, being eventually destroyed by geo- chemical processes that form carbonates and a clay regolith. About 1 bar of CO2 is needed to yield global average Martian sur- face temperatures above freezing with present solar luminosity and Martian al- bedo (Cess et a l . , 1980). However, we have shown that much lower CO2 pressure--as low as 100 mbar in the extreme, but 500 mbar being more reasonable--could yield sizable greenhouse effects. In particular, if the Martian surface albedo were lower prior to the formation of abundant iron oxides, then only about 500 mbar of CO~ would be needed to yield a global average temperature at the freezing point of water. Abundant high HsO clouds could also con- tribute to a greenhouse, and, furthermore, it is not clear the global average tempera- tures are the relevant ones for creating channels. Equatorial temperatures will be substantially higher than global average ones. Another likely possibility is that, other trace gases, such as SOs, may augment the COs greenhouse.
The present polar temperatures on Mars are so cold that if the abundance of COs were increased it would freeze out at the

604 TOON ET AL.
poles or en te r the regolith. A m m o n i a would also freeze out at p re sen t -day t empera - tures . Var ia t ions in the Mar t i an orbi t and , in par t icular , higher obl iqui t ies at an early per iod (before the fo rmat ion of ca rbona te s or an adso rb ing regolith) may have b e e n an impor t an t tr igger in mov ing f rozen volat i les into the a tmosphe re so that a subs tan t ia l g r eenhouse could occur . It is no t cer ta in whe the r or no t a g reenhouse , once initi- a ted, would be s table at low obl iqui ty . Cer- ta in ly large cl imate changes , e v e n dur ing a g r eenhouse epoch, would occur because of ob l iqu i ty and orbi tal var ia t ions . The sug- ges t ion by Ward et a l . (1979) that the ear ly Mar t i an ob l iqu i ty may have a lways b e e n as large, and usua l ly larger than , the p resen t one may be qui te impor tan t . H o w e v e r , our knowledge of the d y n a m i c s of a c l imate so subs tan t ia l ly different f rom the p resen t Mar t i an c l imate is too scan ty to de te rmine clearly the s ignif icance of changes in orbi t and obl iqui ty .
Our u n d e r s t a n d i n g of the poss ib le causes of c l imate change on Mars is rapidly in- c reas ing as we learn more abou t the dy- namics of the p resen t Mar t i an cl imate. H o w e v e r , a great m a n y uncer t a in t i e s per- sist as to the na tu re of the c l imate changes that have ac tua l ly occur red . Our cu r ren t s t ra t igraphy is very crude , so the t iming and dura t ion of mos t even t s are poor ly k n o w n . In order to u n d e r s t a n d the forma- t ion m e c h a n i s m s of the channe l s and of the polar l aminae we mus t k n o w more abou t these s t ruc tures , such as the water- to- ice ratio in the l aminae , the na tu re of the phys ica l change across te r races in the lami- nae , and the re la t ion of channe l s to their fluid reservoirs . We mus t rely on the future exp lora t ion of Mars to resolve m a n y of these uncer ta in t i es .
ACKNOWLEDGMENTS
We greatly appreciate discussions with C. Leovy, A. Ingersoll, A. Seiff, J. Cuzzi, and F. Fanale, and preprints from J. Cutts, F. Fanale, and B. Farmer. The work by Toon was partly supported by a NASA joint research interchange with Cornell University (NCA2- OR 175-702).
REFERENCES
ANDERS, E., AND OWEN, T. (1977). Mars and Earth: Origin and abundance of volatiles. Science 198, 453- 465.
ANDERSON, D. M., SCHWARZ, M. J., AND RICE, A. R. (1978). Water vapor adsorption by sodium mont- morillonite at -5°C. Icarus 34, 638-644.
BAggER, R. M. (1967). Surface and volume flow in porous media. In The Solid-Gas Interface 2 (E. A. Flood, Ed.), Vol. 2, pp. 557-609. Dekker, New York.
BEGGER, A. L. (1976). Obliquity and precession for the last 5,000,000 years. Astron. Astrophys. 51, 127- 135.
BIEMANN, K., ORO, J., TOULMIN, P., III, ORGEL, L. E., NIER, A. O., ANDERSON, D. M., SIMMONDS, P. G., FLORY, D., DIAZ, A. V., RUSHNECK, D. R., BILLER, J. l . , AND LAFLEUR, A. G. (1977). The search for organic substances and inorganic volatile compounds in the surface of Mars. J. Geophys. Res. 82, 4641-4658.
BRIGGS, G. A. (1974). The nature of the residual Martian polar caps. Icarus 23, 167-191.
BRUNAUER, S., COPELAND, L. E., AND KANTRO, D. L. (1967). The Langmuir and BET Theories. In The Solid-Gas Interface (E. A. Flood, Ed.), Vol. 1, pp. 77-105. Dekker, New York.
CARR, M. H., AND SCHABER, G. G. (1977). Martian permafrost features. J. Geophys. Res. 82, 4039- 4054.
CESS, R. D. (1974). Radiative transfer due to atmo- spheric water vapor. Global considerations of the Earth's energy balance. J. Quant. Spectrosc. Ra- dirt. Transfer 14, 861-871.
CESS, R. O., RAMANATHAN, V., AND OWEN, T. (1980). The Martian paleoclimate and enhanced atmospheric carbon dioxide. Icarus 41, 159-165.
CLARK, B. C., III (1978). Implication of abundant hygroscopic minerals in the Martian regolith. Icarus 34, 645-665.
CLARK, B. C.., III, BAIRD, A. K., ROSE, H. J., JR., TOULMIN, P., III, CHRISTIAN, R., KELLIHER, W. C., CASTRO, A. J., ROWE, C. D., KEIL, K., AND HuSS, G. R. (1977). The Viking X-ray fluorescence experiment, analytical methods and early results. J. Geophys. Res. 82, 4577-4594.
CLARK, S. P., JR. (1966). Handbook o f Physical Con- stants, Geological Society of America Memoirs, Vol. 97, p. 478. Geol. Soc. Amer., New York.
CUTTS, J. A. (1973). Nature and origin of layered deposits of the Martian polar regions. J. Geophys. Res. 78, 4231-4249.
CUTTS, J. A., BLASIUS, K. R., CARR, M. H., GREELEY, R., AND MASURSKY, H. (1976). North polar regions of Mars: Imaging results from Viking 2. Science 194, 1329-1337.
CUTTS, J. A., BLASIUS, K. R., AND ROBERTS, W. J.

M A R T I A N C L I M A T E 605
(1979). Evolution of Martian polar landscapes: In- terplay of long-term variations in perennial ice cover and dust storm intensity. J. Geophys. Res. 84, 2975- 2994.
Cuzzl, J. N., AND MUHLEMAN, D. O. (1972). The microwave spectrum and nature of the subsurface of Mars. Icarus 17, 548-560.
DAVIES, D. W., FARMER, C. B., AND LAPORTE, D. D. (1977). Behavior of volatiles in Mars' polar areas: A model incorporating new experimental data. J. Geophys. Res. 82, 3815-3822.
DAvis, B. W. (1969). Some speculations on adsorption and desorption of CO2 in Martian bright areas. Icarus 11, 155-158.
DOBROVOLSKIS, A., AND INGERSOLL, A. P. (1975). Carbon dioxide-water clathrate as a reservoir of COs on Mars. Icarus 26, 353-357.
DZURISIN, D., AND BLASIUS, K. R. (1975). Topogra- phy of the polar layered deposits of Mars. J. Geophys. Res. 80, 3286-3306.
DZURISIN, D., AND INGERSOLL, A. P. (1975). Seasonal buffering of atmospheric pressure on Mars. Icarus 26, 437-440.
FANALE, F. P. (1971). History of Martian volatiles: Implications for organic synthesis. Icarus 15, 279- 303.
FANALE, F. P. (1976). Martian volatiles: Their degas- sing history and geochemical fate. Icarus 28, 179- 202.
FANALE, F. P., AND CANNON, W. A. (1971). Adsorp- tion on the Martian regolith. Nature 230, 502- 504.
FANALE, F. P., AND CANNON, W. A. (1974). Ex- change of adsorbed H20 and CO2 between the regolith and atmosphere of Mars caused by changes in the surface insolation. J. Geophys. Res. 79, 3397- 3402.
FANALE, F. P., AND CANr~ON, W. A. (1978). Mars: The role of the regolith in determining atmospheric pressure and response to insolation changes. J. Geophys. Res. 83, 2321-2325.
FANALE, F. P., AND CANNON, W. A. (1979). Mars: CO2 Adsorption and capillary condensation on clays--significance for volatile storage and at- mospheric history. J. Geophys. Res. 84, 8404- 8414.
FARMER, C. B., DAVIES, D. W., HOLLAND, A. L., LAPORTE, D. D., AND DOMS, P. E. (1977). Mars: Water vapor observations from the Viking orbiters. J. Geophys. Res. 82, 4225-4248.
FARMER, C. B., AND DOMS, P. E. (1979). Global seasonal variation of water vapor on Mars and the implications for permafrost. J. Geophys. Res. 84, 2881-2888.
GIERASCH, P. J., AND GOODY, R. M. (1968). A study of the thermal and dynamical structure of the Mar- tian lower atmosphere. Planetary Space Sci. 16, 615-646.
GIERASCH, P. J., AND TOON, O. B. (1973). Atmo-
spheric pressure variation and the climate of Mars. J. Atmos. Sci. 30, 1502-1508.
GOODING, J. L. (1978). Chemical weathering on Mars. Icarus 33, 483-513.
HABERLE, R. M., LEOVY, C. B., AND POLLACK, J. B. (1979). A numerical model of the Martian polar cap winds. Icarus 39, 151-183.
HAYS, J. D., IMBRIE, J., AND SHACKLETON, N. J. (1976). Variations in the Earth's orbit: Pacemaker of the ice ages. Science 194, 1121-1132.
HESS, S. L., HENRY, R. M., LEOVY, C. B., RYAN, J. A., AND TILLMAN, J. E. (1977). Meteorological results from the surface of Mars: Viking l and 2. J. Geophys. Res. 82, 4559-4574.
HESS, S. L., HENRY, R. M., AND TILLMAN, J. E. (1979). The seasonal variation of atmospheric pres- sure on Mars as affected by the south polar cap. J. Geophys. Res. 84, 2923-2927.
HoRns, P. V. (1974). Ice Physics, p. 359. Oxford Univ. Press (Clarendon), London/New York.
HOWARD, A. D. (1978). Origin of the stepped topogra- phy of the Martian poles. Icarus 34, 581-599.
HUMMEL, J. R., AND RECK, R. (1979). A global surface albedo model. J. Appl. Meteor. 18, 239-253.
HUNT, G. E. (1973). Radiative properties of terrestrial clouds at visible and infra-red thermal window wavelengths. Quart. J. Roy. Meteor. Soc. 99, 346- 369.
INGERSOLL, A. P. (1970). Occurrence of liquid water. Science 168, 972-973.
INGERSOLL, A. P. (1974). Mars: The case against permanent COz frost caps. J. Geophys. Res. 79, 3403-3410.
IRVINE, W. M. (1975). Multiple scattering in planetary atmospheres. Icarus 25, 175-204.
JAMES, P. B., BRIGGS, G., BARNES, J., AND SPRUCK, A. (1979). Seasonal recession of Mars' South Polar cap as seen by Viking. J. Geophys. Res. 84, 2889- 2922.
JONES, K. L., ARVIDSON, R. E., GUINNESS, I. A., BRAGG, S. L., WALL. S. D., CARLSTON, C. E., AND PICK, D. G. (1979). One Mars year: Viking Lander imaging observations of sediment transport and H~O-condensates. Science 204, 799-806.
KIEFFER, H. H., CHASE, S. C., JR., MARTIN, T. Z., MINER, E. D., AND PALLUCONI, F. D. (1976). Martian north pole summer temperatures: Dirty water ice. Science 194, 1341-1344.
KIEFFER, H. H., MARTIN, T. Z., PETERFREUND, A. R., JAKOSKY, B. M., MINER, E. D., AND PALLU- CONI, F. D. (1977). Thermal and albedo mapping of Mars during the Viking primary mission. J. Geophys. Res. 82, 4249-4291.
LEIGHTON, R. R., AND MURRAY, B. C. (1966). Behav- ior of carbon dioxide and other volatiles on Mars. Science 153, 136-144.
MASON, B. J. (1976). Towards the undertanding and prediction of climate variations. Quart. J. Roy. Meteor. Soc. 102, 473-498.
606 T O O N ET AL.
MASURSKY, H., BOYCE, J. M., DIAL, A. L. SCHABER, G. G., AND STROBELL, M. E. (1977). Classification and time of formation of Martian channels based on Viking data. J. Geophys. Res. 82, 4016-4038.
MAYKUT, G. A., AND UNTERSTEINER, N. (1971). Some results from a time dependent thermodynamic model of sea ice. J. Geophys. Res. 76, 1550-1575.
MCELROY, M. B., KONG, T. Y., AND YUNG, Y. L. (1977). Photochemistry and evolution of Mars' at- mosphere: A Viking perspective. J. Geophys. Res. 82, 4379-4388.
MILANKOVITCH, M. (1930). Mathematische Klemale- hie und astronomische theorie der klemas- chqankungen. Handbuch der Klimatologie (W. Koppen and R. Geiger, Eds.), Vol. I, Teil A. Berlin.
MILLER, S. L., AND SMYTHE, W. D. (1970). Carbon dioxide clathrate in the Martian ice cap. Science 170, 531-533.
MURRAY, B. C., AND MALIN, M. C. (1973a). Polar volatiles on Mars---Theory versus observations. Science 182, 437-442.
MURRAY, B. C., WARD, W. R., AND YEUNG, S. C. (1973b). Periodic insolation variations on Mars. Science 180, 638-640.
OWEN, T., BIEMANN, g . , RUSHNECK, D. R., BILLER, J. B., HOWARTH, D. W., AND LAFLEUR, A. L. (1977). The composition of the atmosphere at the surface at Mars. J. Geophys. Res. 82, 4635- 4639.
OWEN, T., CESS, R., AND RAMANATHAN, V. (1979). Infrared CO2 greenhouse to compensate for reduced solar luminosity on early Earth. Nature 277, 640- 642.
OYAMA, V. I., CARLE, G. C., WOELLER, F., AND POLLACK, J. B. (1979). Venus lower atmosphere composition: Analysis by gas chromatography. Sci- ence 203, 802-805.
PETERFREUND, A. R., AND KIEFFER, H. H. (1979). Thermal infrared properties of the Martian atmo- sphere. 3. Local dust clouds. J. Geophys. Res. 84, 2853-2863.
PIERI, O. (t976). Martian channels. Distribution of small channels on the Martian surface. Icarus 27, 25-50.
POLLACK, J. B. (1979). Climatic change on the terres- trial planets. Icarus 37, 479-553.
POLLACK, J. B., AND BLACK, D. C. (1979). Implica- tions of the gas compositional measurements of Pioneer Venus for the origin of planetary atmo- spheres. Science 205, 56--59.
POLLACK, J. B., COLBURN, D. S., FLASAR, F. M., KAHN, R., CARLSTON, C. E., AND PIDEK, O. (1979). Properties and effects of dust particles suspended in the Martian atmosphere. J. Geophys. Res. 84, 2929-2945.
POLLACK, J. B., COLBURN, D., KAHN, R., HUNTER, J., VAN CAMP, W., CARLSTON, C. E., AND WOLF, M. R. (1977). Properties of aerosols in the Martian
atmosphere, as inferred from Viking lander imaging data. J. Geophys. Res. 82, 4479-4496.
POLLACK, J. B., HABERLE, R., GREELEY, R., AND IVERSEN, J. (1976). Estimates of wind speeds re- quired for particle motion on Mars. Icarus 29, 395- 417.
POE LARD, D. (1978). An investigation of the astronom- ical theory of the ice ages using a simple climate-ice sheet model. Nature 272, 233-235.
SAGAN, C. (1977). Reducing greenhouses and the temperature history of Earth and Mars. Nature 269, 224-226.
SAGAN, C., AND MULLEN G. (1972). Earth and Mars: Evolution of atmospheres and surface temperatures. Science 177, 52-56.
SAGAN, C., TOON, O. B., AND GIERASCH, P. J. (1973). Climatic change on Mars. Science lgl , 1045-1049.
SCHNEIDER, S. H. (1972). Cloudiness as a global chmatic feedback mechanism: The effects on the radiation balance and surface temperature of varia- tions in cloudiness. J. Atmos. Sci. 29, 1413-1422.
SHARP, R. P., AND MALIN, M. C. (1975). Channels on Mars. Geol. Soc. Amer. Bull. 86, 593-609.
SHORTHILL, R. W., MOORE, H. J., HULTON, R. B., SCOTT, R. F., AND SPITZER, C. R. (1976). The environs of the Viking 2 lander. Science 194, 1309- 1318.
SMOLUCHOWSKI, R. (1968). Mars: Retention of ice. Science 159, 1348-1350.
SODERBLOM, L. S., KREIDLER, T. J., AND MASURSKY H. (1973). Latitudinal distribution of a debris mantle on the Martian surface. J. Geophys. Res. 78, 4117- 4122.
SQUYRES, S. W. (1978). Mars: Flow of erosional debris. Icarus 34, 600-613.
THOMPSON, S. B., ARNOLD, F., AND SANDERSON, R. (1973). Optical effects of cryodeposits on low scatter mirrors. Astronaut. Aeronaut. 35, 229-235.
TOON, O. B., POLLACK, J. B., AND SAGAN, C. (1977). Physical properties of the particles composing the Martian dust storm of 1971-1972. Icarus 30, 663- 696.
TOULMIN, P., III, BAIRD, A. K., CLARK, B. C., KEIL, K., RosE, H. J., JR., CHRISTIAN, R. P., EVANS, P. H., AND KELLIHER, W. C. (1977). Geochemical and mineralogical interpretation of the Viking inor- ganic chemical results. J. Geophys. Res. 82, 4625- 4634.
WALKER, J. C. G. (1976). Implications for atmospheric evolution of the inhomogeneous accretion model of the origin of the Earth. In The Early History of Earth (B. G. Windley, Ed.), pp. 537-546. Wiley, New York.
WARD, W. R. (1974). Climatic variations on Mars, 1, Astronomical theory of insolation. J. Geophys. Res. 79, 3375-3386.
WARD, W. R. (1973). Large-scale variations in the obliquity of Mars. Science 181, 260-262.
WARD, W. R. (1979). Present obliquity oscillations of
M A R T I A N C L I M A T E 607
Mars: Fourth order accuracy in orbital e and I. J. Geophys. Res. 84, 237-241.
WARD, W. R., BURNS, J. A., AND TOON, O. B. (1979). 2, Past obliquity oscillations of Mars: Role of the Tharsis uplift. J. Geophys. Res. 84, 243-259.
WARD, W. R., MURRAy, B. C., AND MALIN, M. C.
(1974). Climatic variations on Mars. 2. Evolution of carbon dioxide atmosphere and polar caps. J. Geophys. Res. 79, 3387-3395.
WECHSLER, A. E., AND GLASER, P. E. (1965). Pres- sure effects on postulated lunar materials. Icarus 4, 335-352.