Embed Size (px)
Citation preview

http://mcr.sagepub.com/Review
Medical Care Research and
http://mcr.sagepub.com/content/71/3/280The online version of this article can be found at:
DOI: 10.1177/1077558713519167
2014 71: 280 originally published online 22 January 2014Med Care Res RevMichael D. Rosko and Ryan L. Mutter
RegulationThe Association of Hospital Cost-Inefficiency With Certificate-of-Need
Published by:
http://www.sagepublications.com
can be found at:Medical Care Research and ReviewAdditional services and information for
http://mcr.sagepub.com/cgi/alertsEmail Alerts:
http://mcr.sagepub.com/subscriptionsSubscriptions:
http://www.sagepub.com/journalsReprints.navReprints:
http://www.sagepub.com/journalsPermissions.navPermissions:
http://mcr.sagepub.com/content/71/3/280.refs.htmlCitations:
What is This?
- Jan 22, 2014OnlineFirst Version of Record
- May 1, 2014Version of Record >>
at Gebze Yuksek Teknoloji Enstitu on May 10, 2014mcr.sagepub.comDownloaded from at Gebze Yuksek Teknoloji Enstitu on May 10, 2014mcr.sagepub.comDownloaded from

Medical Care Research and Review2014, Vol. 71(3) 280 –298
© The Author(s) 2014Reprints and permissions:
sagepub.com/journalsPermissions.nav DOI: 10.1177/1077558713519167
mcr.sagepub.com
Empirical Research
The Association of Hospital Cost-Inefficiency With Certificate-of-Need Regulation
Michael D. Rosko1 and Ryan L. Mutter2
AbstractCertificate-of-need (CON) regulations can promote hospital efficiency by reducing duplication of services; however, there are practical and theoretical reasons why they might be ineffective, and the empirical evidence generated has been mixed. This study compares the cost-inefficiency of urban, acute care hospitals in states with CON regulations against those in states without CON requirements. Stochastic frontier analysis was performed on pooled time-series, cross-sectional data from 1,552 hospitals in 37 states for the period 2005 to 2009 with controls for variations in hospital product mix, quality, and patient burden of illness. Average estimated cost-inefficiency was less in CON states (8.10%) than in non-CON states (12.46%). Results suggest that CON regulation may be an effective policy instrument in an era of a new medical arms race. However, broader analysis of the effects of CON regulation on efficiency, quality, access, prices, and innovation is needed before a policy recommendation can be made.
Keywordscertificate-of-need, efficiency, hospitals, stochastic frontier analysis
This article, submitted to Medical Care Research and Review on April 30, 2013, was revised and accepted for publication on December 5, 2013.
1Widener University, Chester, PA, USA2Substance Abuse and Mental Health Services Administration, Center for Behavioral Health Statistics and Quality, Rockville, MD, USA
Corresponding Author:Michael D. Rosko, School of Business Administration, Widener University, One University Place, Chester, PA 19013, USA. Email: [email protected]
519167 MCRXXX10.1177/1077558713519167Medical Care Research and ReviewRosko and Mutterresearch-article2014
at Gebze Yuksek Teknoloji Enstitu on May 10, 2014mcr.sagepub.comDownloaded from
Rosko and Mutter 281
Introduction
Containment of hospital costs has been a significant public policy concern for more than 50 years. Various approaches have been implemented to restrain hospital expendi-tures, including the following: (a) revenue regulation, (b) utilization controls, (c) foster-ing competition and creating market-like incentives, and (d) limiting capital expansion through certificate of need (CON) regulations. This article focuses on the later.
CON regulation was widely embraced in the 1970s as a cost-containment policy instrument. By 1980, every state except for Louisiana had passed CON legislation (Hellinger, 2009). However, support for CON waned in the 1980s as the introduction of market-like incentives in prospective payment programs introduced by Medicare and several states and the growth of risk-contracting caused the competitive paradigm to shift from service-based competition toward price-leadership (Devers, Brewster, & Casalino, 2003). Eleven states repealed their CON laws in the 1980s, and 12 additional states later repealed sections of their CON laws that covered acute care hospitals. Currently, 27 states have CON requirements for acute care hospitals (American Health Planning Association, 2013).
It was hoped that CON laws could slow the medical arms race in which hospitals compete on the basis of providing the latest medical technology and services that could result in expensive duplication of services and inefficient use of capital (Luft, Robinson, Garnick, Maerki, & McPhee, 1986). CON regulation could slow increases in hospital expenditures in two ways: (a) it could limit the building of new hospitals or (b) it could restrict the growth of new services. Either would concentrate capital in fewer providers, thereby enhancing capital utilization. However, empirical research has provided mixed support for the efficacy of CON regulations as a cost containment tool. For example, a review of early studies concluded CON regulation exerted little or no influence on hospital expenditures (Rosko & Broyles, 1988). Noether (1988) concluded that CON regulation was associated with higher costs because of inefficient resource allocation and that CON laws may also serve as entry barriers that deter com-petitive pressures to reduce costs. Ho and Ku-Goto (2013) and Rivers, Fottler, and Younis (2007) also associated CON with increased hospital costs. Similarly, a report by the Federal Trade Commission and Department of Justice (2004) concluded: “The Agencies believe that, on balance, CON programs are not successful in containing health care costs, and that they pose serious anticompetitive risks that usually out-weigh their purported economic benefits” (p. 22). It is possible that even if CON laws were associated with increased efficiency, the benefit to consumers might be limited if providers exercise market power and keep prices up in order to reap higher margins.
Although some in policy circles believe that CON regulation is a poor fit for today’s U.S. health care system, there is evidence that a new medical arms race is emerging. In the contemporary landscape providers are practicing a “retail strategy” in which services in the most profitable product-lines are expanded (Berenson, Bodenheimer, & Pham, 2006). This can be done by expanding services in general acute care hospitals or expanding services in other related entities such as ambulatory surgical centers and
at Gebze Yuksek Teknoloji Enstitu on May 10, 2014mcr.sagepub.comDownloaded from
282 Medical Care Research and Review 71(3)
small specialty hospitals. At acute care hospitals, the medical arms race is associated with specialization and accreditation (e.g., acquiring trauma center status). This expan-sion of medical technology was part of what CON laws were intended to guard against.
Another change in the health care environment is the passage of the Affordable Care Act (ACA). The implementation of the ACA will eventually give millions of Americans greater access to health care. However, without commensurate increases in supply or improvements in efficiency, health care price inflation might accelerate. Following health care reform in Massachusetts, expenditures for health care services have increased (Mechanic, Altman, & McDonough, 2012). While a precise determina-tion of the source of these expenditure increases has not been made, some research suggests they could have occurred because of a surge in hospital demand by those who were uninsured previously (Thompson, Huerta, & Ford, 2012). Total hospital expen-ditures increased at an estimated annual rate of 4.1% in 2013 and are projected to increase by 5.8% in 2014. The implementation of the ACA was cited as an important factor driving the acceleration of spending for hospital care in 2014 and beyond (Cuckler et al., 2013). While much of this demand may be for primary care, there cer-tainly can be effects on acute care hospital services. For example, the Rand Study provided some evidence that inpatient hospital care and outpatient care are comple-ments (Phelps, 2010). Expansion in the supply of hospital-based acute care services might be necessary to meet increased demand stemming from the expansion of health insurance coverage; however, supply increases will need to occur in ways that do not contribute to cost and price increases themselves. CON laws may be a useful strategy toward that end.
Only a few studies have examined the empirical association between CON regula-tion and hospital efficiency. Whereas cost decreases alone could occur through the reduction of services (with adverse consequences for access), efficiency is an impor-tant metric to analyze because efficiency increases potentially allow expenditures to be decreased and access to be increased simultaneously. Two of the three studies that examined the association of CON laws with efficiency employed nonparametric fron-tier techniques (Bates, Mukherjee, & Santerre, 2006; Ferrier, Leleu, & Valdmanis, 2010). The other used regression analysis (Eakin, 1991). Mixed results were reported. For example, Bates et al. (2006) used a two-stage approach and estimated three Tobit models and the coefficient of CON was significant (p < .05) and positive in only one model, suggesting that CON either had no association or a slight positive association with technical efficiency. Ferrier et al. (2010), who estimated directional distance functions (Debreu, 1951), reported that CON states had higher technical efficiency but lower scale efficiency compared with non-CON states. Therefore, further evidence on this topic is warranted.
New Contribution
This study examines the association between state use of CON laws and hospital effi-ciency using stochastic frontier analysis (SFA) with a recent panel data set that has a rich set of controls. Most studies examining the association of CON regulation with
at Gebze Yuksek Teknoloji Enstitu on May 10, 2014mcr.sagepub.comDownloaded from
Rosko and Mutter 283
costs or efficiency have used data well over a decade old, and the most current study used a data series that ended in 2002. Thus, most CON studies do not pertain to the current era in which a new medical arms race featuring service-line competition may be prevalent (Bates et al., 2006; Bazzoli, Gerland, & May, 2006; Devers et al., 2003). Our use of SFA to study the association of cost inefficiency with CON regulation offers an important advance in the CON literature. Unlike basic DEA studies like that conducted by Bates et al. (2006), SFA considers inefficiency from all sources (i.e., including allocative, scale, and scope inefficiencies), not just technical inefficiency. There is debate about the relative merits of DEA and SFA (Coelli, Rao, O’Donnell, & Battese, 2005). A strength of SFA is that it allows for measurement error and random shocks that might affect the estimation of efficiency. In contrast, DEA assumes that all departures from the best practice production frontier (i.e., where a completely efficient hospital would operate given its inputs and outputs) are due to inefficiency. Also, unlike previous studies that measured the association of CON programs with hospital efficiency, this study uses a rich set of product descriptor and quality variables. This helps avoid potential misclassification of product heterogeneity as inefficiency (Greene, 2004).
Stochastic Frontier Analysis
Stochastic frontier analysis (SFA) was developed independently by Aigner, Lovell, and Schmidt (1977) and Meeusen and van den Broeck (1977). Rosko and Mutter (2010) summarized the results from 27 U.S. hospital SFA studies. Although frontier analysis can have a production or cost orientation, this article employs the latter, which is consistent with most hospital applications (Rosko & Mutter, 2008).1 SFA decom-poses variations from the best practice cost frontier into a random or classical error and a deterministic error, which is assumed to represent cost-inefficiency. SFA studies of hospitals typically use a model that includes cost function variables and inefficiency-effects variables. The cost function variables are used to estimate a best practice cost frontier (i.e., where a completely efficient hospital would operate given its input prices and outputs). The inefficiency-effects variables locate a hospital with respect to the cost frontier on the basis of correlates of cost-inefficiency.
The estimation of the best practice cost frontier begins with the neo-classical cost function that assumes that total expenses depend on input prices and volume(s) of output(s). Inputs are not used as they belong in a production function (Kumbhakar & Lovell, 2000). However, recognizing that outputs, like admissions, are heterogeneous, it is important to control variations in input requirements for different types of admis-sions by including product descriptor variables that reflect differences in care needs and quality. Following theory (Kumbhakar & Lovell, 2000) and the hospital literature (Grannemann, Brown, & Pauly, 1986; Rosko & Mutter, 2008), we use the following hybrid cost function:
TC f Y W PD eit it it it it= ( ) + , ,, (1)
at Gebze Yuksek Teknoloji Enstitu on May 10, 2014mcr.sagepub.comDownloaded from
284 Medical Care Research and Review 71(3)
where TC represents total costs; Y is a vector of outputs; W is a vector of input prices; PD is a vector of product descriptors; i and t are the respective indexes for the hospital being observed and the year when the observation was made; and e is the error term, which can be decomposed as follows:
e v uit it it= + , (2)
where v is statistical noise (i.e., assumed to be distributed as N(0, σ2)) and u consists of positive departures from the cost-frontier and represents cost-inefficiency (i.e., the percentage by which observed costs exceed minimum costs predicted for the best practice cost frontier; Lovell, 1993). Although u is frequently assumed to follow a half-normal distribution, there is no theoretical reason for the selection of this or other distributional forms for u. Coelli et al. (2005) indicate that the specification of a more general distribution, such as the truncated normal (Stevenson, 1980), has partially alle-viated this problem. Concerns about this issue may be overstated as reviews of both the general literature (Coelli et al., 2005) and the health care literature (Rosko & Mutter, 2008) have consistently reported that varying assumptions about the distribu-tion of the deterministic error has little impact on estimated inefficiencies.
Cost-inefficiency aggregates technical, allocative, scale, and scope inefficiency into a single measure. Technical inefficiency arises when the firm does not maximize output given a set of inputs employed. For example, if a hospital that employed a com-bination of inputs that was capable of producing 1,000 units of output produced only 700 units of output, it would be considered 30% inefficient or 70% efficient. Allocative inefficiency results when firms do not use the least costly combination of inputs in producing output. This occurs when the ratio of the marginal product of capital to the price of capital is not equal to the ratio of the marginal product of labor to the price of labor. Scale inefficiencies occur when the firm departs from the minimum point of its long-run average cost curve. When this occurs, firms are said to be operating at a point on their long-run average cost curve where either increasing returns (i.e., the firm is too small) or decreasing returns (i.e., the firm is too large) exist. Thus, scale inefficien-cies are reflective of the size of the firm. Scope inefficiencies are due to the firm’s inability to reap the advantages that sometimes occur in the joint production of outputs that require similar inputs (e.g., providing medical and surgical care in the same gen-eral hospital). They reflect the scope of the firm’s operations (e.g., whether it is too specialized or too diversified).
Controlling heterogeneity is an important concern in conducting hospital SFA stud-ies because variations in the amount or type of care required by patients could other-wise be confused with inefficiency (Greene, 2004; Rosko & Mutter, 2008). For example, without adjustment for case-mix intensity, the cost-inefficiency of academic medical centers and other hospitals that serve a disproportionate number of severely ill patients would be systematically overstated. Mutter, Rosko, and Wong (2008) demon-strate the importance of controlling for quality and patient burden of illness in studies of hospitals using SFA. In their review of hospital SFA studies, Rosko and Mutter (2008) found that output heterogeneity is usually controlled by including product
at Gebze Yuksek Teknoloji Enstitu on May 10, 2014mcr.sagepub.comDownloaded from
Rosko and Mutter 285
descriptor variables for quality and case-mix. The former include structural measures such as teaching activities and risk-adjusted outcomes while the latter include a variety of inpatient and outpatient case-mix measures.
Research Design and Method
Data Sources
This study is based on panel data of 1,552 U.S. short-term, urban acute care hospitals for the period 2005 to 2009 (T = 5). Since it was critical to control for heterogeneity by including patient burden of illness variables and in-hospital outcome measures of quality in the model, the study was restricted to the 37 states2 for which the State Inpatient Databases (SIDs)3 were available through the Healthcare Cost and Utilization Project (HCUP)4 for the entire study period. A balanced panel was used. We compared hospital cost-inefficiency in states having CON programs that regulated acute care beds during the study period with hospitals in states that did not.5 We restricted the study to urban areas because rural areas might face different market conditions and because previous work (Folland & Hofler, 2001; Zuckerman, Hadley, & Iezzoni, 1994) found that it would be inappropriate to pool urban and rural hospitals because their cost structures differ.
The primary source for hospital-level data was the American Hospital Association (AHA) Annual Survey of Hospitals. Medicare Hospital Cost Reports were used to calculate the price of capital and the percentage of acute care beds. The case-mix index came from the Centers for Medicare & Medicaid Services. Health maintenance orga-nization (HMO) penetration at the county level came from Thomson Reuters. AHA data were used to calculate a Herfindahl–Hirschman Index (HHI) to reflect hospital competition at the county level.
Model Specification
Following the methods of Mutter et al. (2008), a hybrid translog cost function was employed in the SFA. The general form of the translog cost model was used to esti-mate the stochastic frontier for U.S. hospitals. It can be expressed as follows:
(3)
where TC, Y, W, PD, v, and u are the variables described above; J is the number of output variables; K is the number of price variables; R is the number of product descriptor variables; and α, β, δ, γ, η, and ρ are parameters to be estimated.
To estimate hospital-specific inefficiency, we used a time-varying model proposed by Battese and Coelli (1995). In this model the inefficiency effects are defined by
ln .TC Y W Yit
j
J
j jit
k
K
k kit
j
J
l
J
jl ji= + + += = = =∑ ∑ ∑∑α α β δ0
1 1 1 1
5ln ln ln tt litYln +
.51 1 1 1 1k
K
m
K
km kit mit
j
J
k
K
jk jit kit
r
R
W W Y W= = = = =∑∑ ∑∑+ +γ ρln ln ln ln ∑∑ + +ηr rit it itPD v u
at Gebze Yuksek Teknoloji Enstitu on May 10, 2014mcr.sagepub.comDownloaded from

286 Medical Care Research and Review 71(3)
u Z w uitn
N
n it it it= ∑ + ≥=1
0κ , (4)
where Zit is a vector of N explanatory variables associated with the inefficiency-effects; κ is a vector of unknown parameters to be estimated; and wit are unobservable random variables, assumed to be independently distributed with mean zero and unknown variance, σ2. This model allows an estimation of the impact of firm-specific and environmental factors on inefficiency (Hjalmarsson, Kumbhakar, & Heshmati, 1996). By including time in the Z vector with other firm-specific variables, ineffi-ciency can differ by firm and over time.
The parameters of the cost frontier and the inefficiency effects variables were simultaneously estimated by a maximum likelihood method using the FRONTIER 4.1 program, which uses a random-effects regression technique (Coelli, 1996). The cost efficiency of the ith hospital in the tth year is defined as the ratio of the estimated sto-chastic frontier total costs to observed total costs. The stochastic total cost frontier is defined by the value total costs would be if uit (i.e., the cost efficiency effect) were equal to zero (i.e., full efficiency). Battese, Heshmati, and Hjalmarsson (2000) show that
CE uit it= −( ) exp , (5)
where CEit is the cost efficiency and uit as defined previously. This indicates that cost efficiency is no greater than 1 and the reciprocal of this quantity, exp(uit), is no less than 1. The amount by which exp(uit) exceeds 1 is a measure of cost-inefficiency.
Cost Function Variables
The standard assumption of linear homogeneity in input prices is imposed by normal-izing the equation by the wage rate. Thus, the dependent variable is the logarithm of total expenses divided by the wage rate. The continuous output and input price vari-ables are log-transformed. Inpatient admissions, postadmission days (equals total inpatient days minus total admissions), and outpatient visits are included as outputs in the cost function. Hospital outputs were treated as exogenous, an assumption common to hospital cost studies (Grannemann et al., 1986).
Two inputs, capital and labor, are recognized by the cost-function. The price of labor was approximated by the area average annual salary per full-time-equivalent employee and the price of capital was approximated by depreciation and interest expenses per bed. For both inputs, the average price was computed for all short-term general hospitals in the Core Based Statistical Area in which the study hospital was located. A more complete specification of input prices would be desirable. However, given the relatively poor quality of input price information, we followed past practices (Grannemann et al., 1986; Rosko & Mutter, 2008; Zuckerman et al., 1994) and used this limited set of price variables.
at Gebze Yuksek Teknoloji Enstitu on May 10, 2014mcr.sagepub.comDownloaded from
Rosko and Mutter 287
To control variations in output, a variety of product descriptor variables were employed. Since we are estimating a cost function, we limit these to variables that reflect output quality and intensity of care required to produce output. These variables include the following: the Medicare Case-Mix Index, ratio of emergency department visits to total outpatient visits, ratio of outpatient surgeries to total outpatient visits, proportion of total hospital beds classified as acute care, and ratio of births to total admissions. These variables are consistent with the model employed by Rosko and Mutter (2008). All of these reflect severity case-mix and the first four are expected to have positive coefficients. The absence of publicly available case-mix indices for out-patient care necessitated the use of proxies for this measure. While the Medicare Case-Mix Index has been shown to be highly correlated with the overall case-mix index of hospitals, we included the ratio of births to total admissions to reflect one dimension of case-mix among the non-Medicare population. Since some hospitals serve a mix-ture of acute care and nonacute care patients, we included the proportion of total hos-pital beds classified as acute care to reflect patients who would not be included in the DRG-based Medicare Case-Mix Index. Teaching status was incorporated by the use of binary variables for major (i.e., member of the Council of Teaching Hospitals) and other teaching hospitals. Nonteaching hospitals are the omitted reference category. In addition to these variables, a vector of 29 log-transformed comorbidity variables mea-suring the rates of those comorbidities per discharge at the hospital level were also included (Elixhauser, Steiner, Harris, & Coffey, 1998). The comorbidity variables were identified by the application of the Comorbidity Software to HCUP data and control for patient burden of illness.6 Mutter et al. (2008) found that without these controls, differences in patient burden of illness can masquerade as hospital inefficiency.
To control for patient safety and inpatient quality, we included four risk-adjusted, hospital-level measures of patient safety from the application of Version 3.2a of the Agency for Healthcare Research and Quality (AHRQ) Patient Safety Indicator (PSI) software to the SID: rates of failure to rescue, iatrogenic pneumothorax, infection due to medical care, and accidental puncture/laceration. We included five risk-adjusted, hospital-level measures of inpatient quality from Version 3.2a of the AHRQ Inpatient Quality Indicator (IQI) software applied to the SID: rates of in-hospital mortality for acute myocardial infarction (AMI), congestive heart failure (CHF), stroke, gastroin-testinal hemorrhage, and pneumonia. To maintain an adequate sample size, we selected IQIs and PSIs that had nonzero denominators for at least 1,500 hospitals per year and which were not among the PSIs found to have a high percentage of events that were present on admission (Houchens, Elixhauser, & Romano, 2008). The IQIs and PSIs were transformed by taking their square root since some hospitals had a value of zero for those variables (Mutter, Wong, & Goldfarb, 2008).
We included a measure of reservation quality in the cost function. The use of reser-vation quality is consistent with the notion that all empty beds are not waste (Folland & Hofler, 2001). Rather, they provide for the contingency of surges in demand to prevent situations in which there are no available beds for newly admitted patients. Folland and Hofler (2001) point out that the use of this variable may reduce a potential
at Gebze Yuksek Teknoloji Enstitu on May 10, 2014mcr.sagepub.comDownloaded from

288 Medical Care Research and Review 71(3)
bias against small hospitals that typically experience greater variability in inpatient utilization. Our method of calculating reservation quality by dividing the difference between total beds and average daily census by the square root of average daily census follows the approach of Joskow (1980). We also included a time trend in the cost function.
Inefficiency Effects Variables
To correctly draw inferences about the impact of CON regulation on hospital cost-inefficiency, it is important to control for major factors that may affect hospital inef-ficiency. While a binary variable for the presence of CON regulation is of primary interest, we also controlled for other correlates of cost inefficiency. We developed this set of control variables from X-inefficiency Theory (Leibenstein, 1987) and a review of hospital SFA studies (Rosko & Mutter, 2010).
To control for the effect of ownership form on inefficiency, binary variables (1/0) for investor-owned hospitals and public hospitals were used. Not-for-profit hospitals served as the omitted reference category. Variables for Medicare share of admissions and Medicaid share of admissions were used to reflect pressures associated with pub-lic payers. Since November 1983, a prospective payment system (PPS) has been used to regulate payment rates made by Medicare. Hospitals are allowed to keep the surplus between the payment rate and actual costs of providing service. Conversely, hospitals can lose money if their costs exceed the PPS rate. Medicaid payment policies vary across states. Many states have implemented some form of PPS; however, even in states where PPS is not used, the payment rates generally are set well below cost (Santerre & Neun, 2007).
Since a number of SFA studies have shown that hospitals belonging to multihospi-tal systems are more efficient than free-standing hospitals (Rosko & Mutter, 2010), system membership was entered as a (1/0) binary variable. HHI was used to reflect competitive pressures. It was calculated by summing the squares of the market shares of admissions for all of the general acute care hospitals in the county. In this calcula-tion, hospitals in the same health care system in the same county were treated as the same producer. This index takes on a value of 1 in monopolistic markets and approaches 0 as output is dispersed among more firms. Thus, higher values reflect less competi-tive pressure. If service-based competition is being practiced, then cost-inefficiency should be greater in more competitive markets.
HMO penetration, defined as the percentage of the population in the county that is enrolled in HMOs, reflects the financial pressures exerted by managed care organiza-tions. Rosko and Mutter’s (2010) review of SFA studies found that HMO penetration rate is usually positively associated with hospital cost-efficiency. However, other results were found in a few studies.
The final control variable is time trend (equal to 1 in 2005, equal to 2 in 2006, etc.). This variable allows time-varying efficiency. In contrast, the trend variable in the cost function permits a neutral shift in the cost frontier. Descriptive statistics are provided in Table 1.
at Gebze Yuksek Teknoloji Enstitu on May 10, 2014mcr.sagepub.comDownloaded from
Rosko and Mutter 289
Results
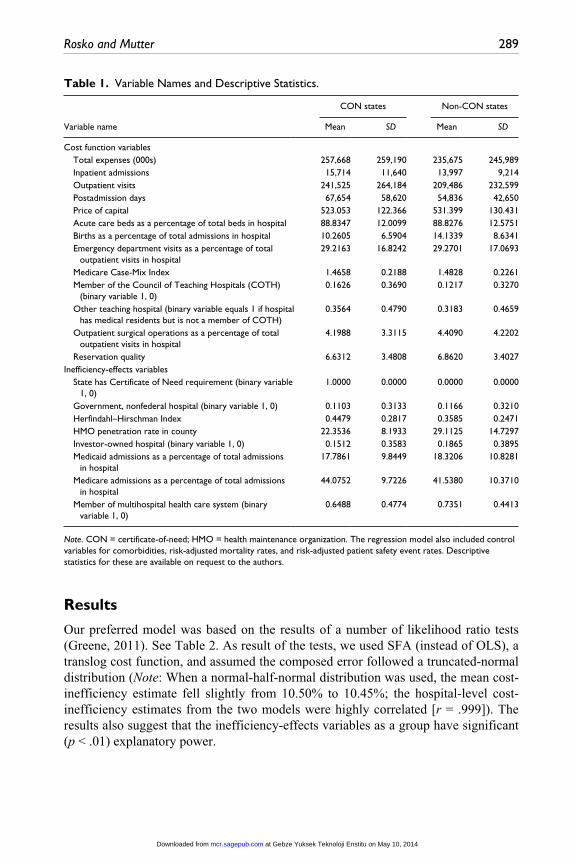
Our preferred model was based on the results of a number of likelihood ratio tests (Greene, 2011). See Table 2. As result of the tests, we used SFA (instead of OLS), a translog cost function, and assumed the composed error followed a truncated-normal distribution (Note: When a normal-half-normal distribution was used, the mean cost-inefficiency estimate fell slightly from 10.50% to 10.45%; the hospital-level cost-inefficiency estimates from the two models were highly correlated [r = .999]). The results also suggest that the inefficiency-effects variables as a group have significant (p < .01) explanatory power.
Table 1. Variable Names and Descriptive Statistics.
Variable name
CON states Non-CON states
Mean SD Mean SD
Cost function variables Total expenses (000s) 257,668 259,190 235,675 245,989 Inpatient admissions 15,714 11,640 13,997 9,214 Outpatient visits 241,525 264,184 209,486 232,599 Postadmission days 67,654 58,620 54,836 42,650 Price of capital 523.053 122.366 531.399 130.431 Acute care beds as a percentage of total beds in hospital 88.8347 12.0099 88.8276 12.5751 Births as a percentage of total admissions in hospital 10.2605 6.5904 14.1339 8.6341 Emergency department visits as a percentage of total
outpatient visits in hospital29.2163 16.8242 29.2701 17.0693
Medicare Case-Mix Index 1.4658 0.2188 1.4828 0.2261 Member of the Council of Teaching Hospitals (COTH)
(binary variable 1, 0)0.1626 0.3690 0.1217 0.3270
Other teaching hospital (binary variable equals 1 if hospital has medical residents but is not a member of COTH)
0.3564 0.4790 0.3183 0.4659
Outpatient surgical operations as a percentage of total outpatient visits in hospital
4.1988 3.3115 4.4090 4.2202
Reservation quality 6.6312 3.4808 6.8620 3.4027Inefficiency-effects variables State has Certificate of Need requirement (binary variable
1, 0)1.0000 0.0000 0.0000 0.0000
Government, nonfederal hospital (binary variable 1, 0) 0.1103 0.3133 0.1166 0.3210 Herfindahl–Hirschman Index 0.4479 0.2817 0.3585 0.2471 HMO penetration rate in county 22.3536 8.1933 29.1125 14.7297 Investor-owned hospital (binary variable 1, 0) 0.1512 0.3583 0.1865 0.3895 Medicaid admissions as a percentage of total admissions
in hospital17.7861 9.8449 18.3206 10.8281
Medicare admissions as a percentage of total admissions in hospital
44.0752 9.7226 41.5380 10.3710
Member of multihospital health care system (binary variable 1, 0)
0.6488 0.4774 0.7351 0.4413
Note. CON = certificate-of-need; HMO = health maintenance organization. The regression model also included control variables for comorbidities, risk-adjusted mortality rates, and risk-adjusted patient safety event rates. Descriptive statistics for these are available on request to the authors.
at Gebze Yuksek Teknoloji Enstitu on May 10, 2014mcr.sagepub.comDownloaded from

290 Medical Care Research and Review 71(3)
Table 3 provides parameter estimates for the cost function components of the pre-ferred model. Some of the estimated coefficients of the input price and output vari-ables were counterintuitive or not significantly different from zero (p < .05). This occurred because the translog cost function requires the use of squared and interaction terms for these variables, which are highly correlated. As is well known, multicol-linearity reduces the reliability of parameter estimates but does not introduce a bias. When the Cobb-Douglas model (which restricts the parameters of the squared and interaction terms to equal zero) was used, the estimates of the input price and output variables were highly significant (p < .001) and positive as expected.
Most of the product descriptor variables reflecting case mix were positive and sta-tistically significant. The Medicare Case Mix Index was positive and significant. The coefficient for the major teaching hospital variable was larger than that estimated for the other teaching hospital variable. Having a higher percentage of acute care beds, more emergency department visits as a percentage of total outpatient visits, and more outpatient surgical operations as a percentage of outpatient visits to the hospital were also associated with higher costs. Higher reservation quality was also associated with higher costs.
Parameter estimates for the inefficiency-effects variables are shown in Table 4. Eight of the nine inefficiency-effects variables had significant parameter estimates. HHI was the exception.
The coefficient on CON regulation was negative and significant, which suggests that hospitals located in states that have CON regulation are more cost-efficient than hospi-tals located in other states. Univariate analysis (see Table 5) found that hospitals operat-ing under a regime of CON regulation had a mean cost-inefficiency score of 8.10%, while hospitals in the comparison group had a mean cost-inefficiency score of 12.46%.
Table 2. Generalized Likelihood-Ratio Tests of Null Hypotheses for Parameters of the Translog Stochastic Cost Frontier Model.
Model Log likelihood Lambdaa Implication
OLS, translog 1778.6039 NA NASFA, translog, truncated-normal 2092.1339 627.0601 Use SFA rather than OLSSFA, Cobb-Douglas, truncated
normal1889.6815 404.9048 Use translog rather than
Cobb-DouglasSFA, translog, truncated-normal,
no efficiency-effects variables1812.6299 559.0080 Use inefficiency effects
variablesSFA, translog, half-normal 2087.4160 9.4358 Use normal-truncated
normal error rather than normal-half-normal distribution for residuals
Note. NA = not available; OLS = ordinary lease square; SFA = stochastic frontier analysis.a. All Lambda values are significant at p < .01.
at Gebze Yuksek Teknoloji Enstitu on May 10, 2014mcr.sagepub.comDownloaded from

Rosko and Mutter 291
This difference between the two groups was highly significant (p < .001). Compared with the unregulated hospitals, hospitals in CON states had a higher occupancy rate (67.73% vs. 65.49%) and a lower average adjusted (for case-mix and outpatient activ-ity) cost per admission ($9,037 vs. $9,849) and lower operating margin (−0.0159 vs. −0.0064). There was not a significant difference in labor productivity (t = 0.887).
The inefficiency-effects results also indicate that for-profit hospitals are the most cost-efficient ownership category while public hospitals are the least. Hospitals with a greater proportion of admissions covered by Medicare or by Medicaid tend to be more cost-efficient. Hospitals that were members of multihospital systems tended to be
Table 3. Parameter Estimates for the SFA Cost Frontier Model (Translog With Truncated-Normal Residual, n = 7,760; 2005-2009 Panel).
Variable Coefficient t Ratio
Cost-function variablesConstant 13.4022 13.5068*Ln(Inpatient admissions) −0.0030 −0.0100Ln(Outpatient visits) 0.0475 0.4493Ln(Postadmission days) 0.0471 0.1811Ln(Price of capital) −1.8139 −6.4435*Ln(Price of capital-squared) 0.3363 6.8360*Ln(Inpatient admissions-squared) −0.2778 −6.8618*Ln(Outpatient visits-squared) −0.0191 −2.4267**Ln(Postadmission days-squared) −0.1880 −6.1324*Ln(Inpatient admissions * Outpatient visits) 0.0247 0.8040Ln(Inpatient admissions * Postadmission days) 0.5556 8.8636*Ln(Outpatient visits * Postadmission days) −0.0051 −0.2049Ln(Price of capital * Inpatient admissions) −0.0123 −0.2795Ln(Price of capital * Outpatient visits) 0.0496 3.3100*Ln(Price of capital * Postadmission days) −0.0521 −1.4061Medicare Case-Mix Index 0.4718 30.1367*Member of the Council of Teaching Hospitals 0.1134 12.1166*Other teaching hospital 0.0206 3.8585*Acute care beds as a percentage of total beds in
hospital0.0008 3.2702*
Births as a percentage of total admissions in hospital 0.0001 0.1697Emergency department visits as a percentage of total
outpatient visits in hospital0.0008 3.7643*
Outpatient surgical operations as a percentage of total outpatient visits in hospital
0.0116 13.9808*
Reservation quality 0.0068 10.1703*Trend −0.0083 −2.6043*
Note. The regression model also included control variables for comorbidities, risk-adjusted mortality rates, and risk-adjusted patient safety event rates.*p < .01. **p < .05.
at Gebze Yuksek Teknoloji Enstitu on May 10, 2014mcr.sagepub.comDownloaded from

292 Medical Care Research and Review 71(3)
more cost-efficient than their free-standing counterparts. Hospitals located in areas with more HMO penetration tended to be less cost-efficient.7 Finally, the coefficient of the HHI was negative but only weakly significant (p < .10). The negative sign is consistent with service-based competition.
Discussion
This study has a number of potential limitations. First, it relies on SFA, an approach that has drawbacks. Some concerns about SFA that have been raised in the past include that it relies on strong assumptions about the nature of the cost function and the assumed distribution of the composed error term and that the heterogeneity of hospital output could skew results (Newhouse, 1994). As noted above, subsequent empirical work and greater access to hospital data and advances in measurement have alleviated some of these concerns. Second, the analysis was restricted to hospitals in 37 states that participated in HCUP during the entire study period. The results, while from a diverse group of states, are not necessarily generalizable to non-HCUP states. However, the mean values of variables reflecting size, ownership and system member-ship of hospitals in the study states are very similar to those of all 50 states.
Contrary to the conventional wisdom that CON regulations have either been inef-fective or counterproductive, we found that hospitals in states with CON regulations for acute care beds were more cost-efficient than hospitals located in other states. Our analyses suggest the differences could be driven by variations in capital efficiency. Mean total capital expenses per bed were significantly (p < .01) less in the hospitals in the CON states ($55,058) than in other states ($57,972). Also, the mean occupancy rate (see Table 5) was 2.24% higher in hospitals that operated under a CON regime
Table 4. Parameter Estimates for the SFA Inefficiency-Effects Variables.
Inefficiency-effects variables Coefficient t Ratio
MU –0.6465 –8.9848*State has Certificate of Need requirement –0.6456 –9.8262*Investor-owned hospital –0.8141 –12.3268*Government, nonfederal hospital 0.3265 11.6366*Medicare admissions as a percentage of total
admissions in hospital–0.0135 –9.9898*
Medicaid admissions as a percentage of total admissions in hospital
–0.0098 –8.1961*
Member of multihospital health care system –0.3337 –10.7889*Herfindahl–Hirschman Index –0.0717 –1.8311**HMO penetration rate in county 0.0064 7.4267*Trend 0.1198 9.8333*Sigma-squared 0.1824 23.2196*Gamma 0.8603 120.2799*
*p < .01. **p < .10.
at Gebze Yuksek Teknoloji Enstitu on May 10, 2014mcr.sagepub.comDownloaded from
Rosko and Mutter 293
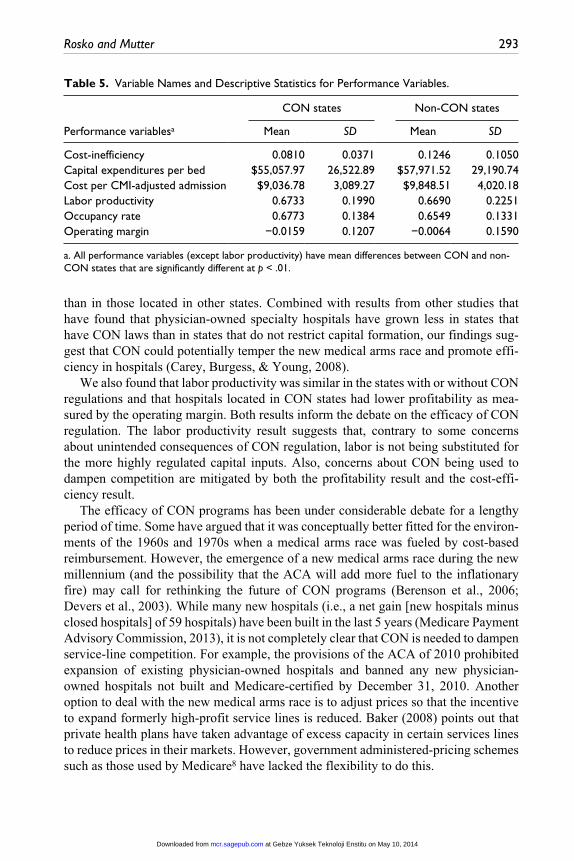
than in those located in other states. Combined with results from other studies that have found that physician-owned specialty hospitals have grown less in states that have CON laws than in states that do not restrict capital formation, our findings sug-gest that CON could potentially temper the new medical arms race and promote effi-ciency in hospitals (Carey, Burgess, & Young, 2008).
We also found that labor productivity was similar in the states with or without CON regulations and that hospitals located in CON states had lower profitability as mea-sured by the operating margin. Both results inform the debate on the efficacy of CON regulation. The labor productivity result suggests that, contrary to some concerns about unintended consequences of CON regulation, labor is not being substituted for the more highly regulated capital inputs. Also, concerns about CON being used to dampen competition are mitigated by both the profitability result and the cost-effi-ciency result.
The efficacy of CON programs has been under considerable debate for a lengthy period of time. Some have argued that it was conceptually better fitted for the environ-ments of the 1960s and 1970s when a medical arms race was fueled by cost-based reimbursement. However, the emergence of a new medical arms race during the new millennium (and the possibility that the ACA will add more fuel to the inflationary fire) may call for rethinking the future of CON programs (Berenson et al., 2006; Devers et al., 2003). While many new hospitals (i.e., a net gain [new hospitals minus closed hospitals] of 59 hospitals) have been built in the last 5 years (Medicare Payment Advisory Commission, 2013), it is not completely clear that CON is needed to dampen service-line competition. For example, the provisions of the ACA of 2010 prohibited expansion of existing physician-owned hospitals and banned any new physician-owned hospitals not built and Medicare-certified by December 31, 2010. Another option to deal with the new medical arms race is to adjust prices so that the incentive to expand formerly high-profit service lines is reduced. Baker (2008) points out that private health plans have taken advantage of excess capacity in certain services lines to reduce prices in their markets. However, government administered-pricing schemes such as those used by Medicare8 have lacked the flexibility to do this.
Table 5. Variable Names and Descriptive Statistics for Performance Variables.
Performance variablesa
CON states Non-CON states
Mean SD Mean SD
Cost-inefficiency 0.0810 0.0371 0.1246 0.1050Capital expenditures per bed $55,057.97 26,522.89 $57,971.52 29,190.74Cost per CMI-adjusted admission $9,036.78 3,089.27 $9,848.51 4,020.18Labor productivity 0.6733 0.1990 0.6690 0.2251Occupancy rate 0.6773 0.1384 0.6549 0.1331Operating margin −0.0159 0.1207 −0.0064 0.1590
a. All performance variables (except labor productivity) have mean differences between CON and non-CON states that are significantly different at p < .01.
at Gebze Yuksek Teknoloji Enstitu on May 10, 2014mcr.sagepub.comDownloaded from

294 Medical Care Research and Review 71(3)
In conclusion, our results have found a plausible association between CON regula-tion and greater hospital cost-efficiency. We believe that our research informs the often contentious debate over the efficacy of CON laws. After a period of aggregate contraction the pace of hospital construction has seen recent increases (Baker, 2008; Bazzoli et al., 2006). And increased capacity may be associated with increased expen-ditures and reduced quality (via the volume–outcomes relationship). However, find-ings to the obverse are also available. CON regulation has a complex impact on costs, prices, access, and quality in a variety of settings that extend beyond acute hospital care, which is the focus of this study. We recommend that a meta-analysis on the impact of CON regulation on cost, pricing behavior, access, innovation, and quality be conducted to determine the efficacy of CON laws in a new environment that features service-based competition, accountable care organizations and high-deductible health plans. It is possible that while CON regulation might facilitate the efficient production of hospital care, other policy mechanisms are superior when a broader context is considered.
Authors’ Note
This research was done while Ryan L. Mutter was at Agency for Healthcare Research and Quality, Center for Delivery, Organization and Markets. This article does not represent the policy of either the Agency for Healthcare Research and Quality (AHRQ) or the U.S. Department of Health and Human Services (DHHS). The views expressed herein are those of the authors and no official endorsement by AHRQ or DHHS is intended or should be inferred.
Acknowledgments
We gratefully acknowledge the data organizations in participating states that contributed data to HCUP and that we used in this study: Arizona Department of Health Services, Arkansas Department of Health, California Office of Statewide Health Planning & Development, Colorado Hospital Association, Connecticut Hospital Association, Florida Agency for Health Care Administration, Georgia Hospital Association, Hawaii Health Information Corporation, Illinois Department of Public Health, Indiana Hospital Association, Iowa Hospital Association, Kansas Hospital Association, Kentucky Cabinet for Health and Family Services, Maryland Health Services Cost Review Commission, Massachusetts Center for Health Information and Analysis, Michigan Health & Hospital Association, Minnesota Hospital Association, Missouri Hospital Industry Data Institute, Nebraska Hospital Association, New Hampshire Department of Health & Human Services, New Jersey Department of Health, New York State Department of Health, Nevada Department of Health and Human Services, North Carolina Department of Health and Human Services, Ohio Hospital Association, Oklahoma State Department of Health, Oregon Association of Hospitals and Health Systems, Rhode Island Department of Health, South Carolina Budget & Control Board, South Dakota Association of Healthcare Organizations, Tennessee Hospital Association, Texas Department of State Health Services, Utah Department of Health, Vermont Association of Hospitals and Health Systems, Washington State Department of Health, West Virginia Health Care Authority, and Wisconsin Department of Health Services.
We thank Andrew Karasick, research assistant in the Graduate Program of Health Care Management at Widener University, for his assistance in the preparation of the article.
at Gebze Yuksek Teknoloji Enstitu on May 10, 2014mcr.sagepub.comDownloaded from

Rosko and Mutter 295
Declaration of Conflicting Interests
The author(s) declared no potential conflicts of interest with respect to the research, authorship, and/or publication of this article.
Funding
The author(s) received no financial support for the research, authorship, and/or publication of this article.
Notes
1. A production orientation, which would measure technical inefficiency, is difficult to use for multiproduct organizations like hospitals. It would require a composite output measure that would be difficult if not impossible to validly construct. On the other hand, cost-inefficiency SFA models can include multiple outputs and/or multiple product descriptors as independent variables.
2. The 37 states are Arizona, Arkansas, California, Colorado, Connecticut, Florida, Georgia, Hawaii, Illinois, Indiana, Iowa, Kansas, Kentucky, Maryland, Massachusetts, Michigan, Minnesota, Missouri, Nebraska, New Hampshire, New Jersey, New York, Nevada, North Carolina, Ohio, Oklahoma, Oregon, Rhode Island, South Carolina, South Dakota, Tennessee, Texas, Utah, Vermont, Washington, West Virginia, and Wisconsin.
3. The SID contains the universe of the inpatient discharge abstracts in participating states, translated into a uniform format to facilitate multistate comparisons and analyses. See https://www.hcup-us.ahrq.gov/sidoverview.jsp for more information.
4. HCUP is a family of health care databases and related software tools and products developed through a federal–state–industry partnership and sponsored by the Agency for Healthcare Research and Quality. See http://www.hcup-us.ahrq.gov/ for more information.
5. According to the American Health Planning Association (2013), during the study period 27 states enforced CON regulations for acute care hospital beds. The states that require a CON for acute care hospitals are the following: Alabama, Alaska, Connecticut, Delaware, Florida, Georgia, Hawaii, Illinois, Iowa, Kentucky, Maine, Maryland, Michigan, Mississippi, Missouri, Nevada, New Hampshire, New Jersey, New York, North Carolina, Rhode Island, South Carolina, Tennessee, Vermont, Virginia, Washington, and West Virginia.
6. The Comorbidity Software assigns variables that identify comorbidities in hospital dis-charge records using the diagnosis coding of International Classification of Diseases, Ninth Edition, Clinical Modifications (ICD-9-CM). The comorbidities are described in Elixhauser et al. (1998). The software is available for free download at http://www.hcup-us.ahrq.gov/toolssoftware/comorbidity/comorbidity.jsp.
7. This result was counterintuitive. We considered the possibility that the demand for HMOs might be greater areas where hospitals are more cost-inefficient. This would constitute an endogenous relationship. Methods for detecting and dealing with endogeneity are not as well developed in SFA as they are in linear regression methods (Mutter, Greene, Spector, Rosko, & Mukamel, 2013). However, as a crude test (Note: the Hausman test is not appropriate for SFA) we substituted an instrumental variable for HMO penetration based on Rosko (2001). The results did not change when this variable was included in the model.
8. Medicare has refined its DRG system to address cream-skimming by specialty hospitals (Medicare Payment Advisory Commission, 2005). However, its impact has not been defini-tively determined.
at Gebze Yuksek Teknoloji Enstitu on May 10, 2014mcr.sagepub.comDownloaded from
296 Medical Care Research and Review 71(3)
References
Aigner, D., Lovell, K., & Schmidt, P. (1977). Formulation and estimation of stochastic frontier: production models. Journal of Econometrics, 6, 21-37.
American Health Planning Association. (2013). Certificate of need coverage summary by state, 2010. Retrieved from http://www.ahpanet.org/matrix_copn.html
Baker, L. (2008). The challenges of health system capacity growth (NIHCM Research Brief). Washington, DC: National Institute for Health Care Management.
Bates, L., Mukherjee, K., & Santerre, R. (2006). Market structure and technical efficiency in the hospital services industry: A DEA approach. Medical Care Research and Review, 63, 499-524.
Battese, G., & Coelli, T. (1995). A model for technical inefficiency effects in a stochastic fron-tier production function for panel data. Empirical Economics, 20, 325-332.
Battese, G., Heshmati, A., & Hjalmarsson, L. (2000). Efficiency of labour use in the Swedish banking industry: A stochastic frontier approach. Empirical Economics, 25, 623-640.
Bazzoli, G., Gerland, A., & May, J. (2006). Construction activity in U.S. hospitals. Health Affairs, 25, 783-791.
Berenson, R., Bodenheimer, T., & Pham, H. (2006). Specialty-service lines: Salvos in the new medical arms race. Health Affairs, 25, 337-343.
Carey, K., Burgess, J., & Young, G. (2008). Specialty and full-service hospitals: A comparative cost analysis. Health Services Research, 43, 1869-1887.
Coelli, T. (1996). A guide to FRONTIER Version 4.1: a computer program for production and cost function estimation (CEPA Working Paper No. 96/07). Armidale, New South Wales, Australia: University of New England.
Coelli, T., Rao, D., O’Donnell, C., & Battese, G. (2005). An introduction to efficiency and pro-ductivity analysis (2nd ed.). New York, NY: Springer.
Cuckler, G., Sisko, A., Keehan, S., Smith, S., Madison, A., Poisal, J., Wolfe, C., Lizonitz, J., & Stone, D. (2013). National Health Expenditure Projections, 2012-22: Slow growth until coverage expands and economy improves. Health Affairs, 32, 1820-1831.
Debreu, G. (1951). The coefficient of resource utilization. Econometrica, 19, 273-292.Devers, K. J., Brewster, L. R., & Casalino, L. P. (2003). Changes in hospital competitive strat-
egy: A new medical arms race? Health Services Research, 38, 447-469.Eakin, K. (1991). Allocative inefficiency in the production of hospital services. Southern
Economic Journal, 58, 240-248.Elixhauser, A., Steiner, C., Harris, R., & Coffey, R. (1998). Comorbidity measures for use with
administrative data. Medical Care, 36, 8-27.Federal Trade Commission and Department of Justice. (2004). Improving health care: A dose
of competition. Retrieved from http://www.justice.gov/atr/public/health_care/204694.pdfFerrier, G., Leleu, H., & Valdmanis, V. (2010). The impact of CON regulation on hospital effi-
ciency. Health Care Management Science, 13, 84-100.Folland, S., & Hofler, R. (2001). How reliable are hospital efficiency estimates? Exploiting the
dual to homothetic production. Health Economics, 10, 683-698.Grannemann, T., Brown, R., & Pauly, M. (1986). Estimating hospital costs: A multiple-output
analysis. Journal of Health Economics, 5, 107-127.Greene, W. (2004). Distinguishing between heterogeneity and inefficiency: Stochastic frontier
analysis of the world health organization’s panel data on national health care systems. Health Economics, 13, 959-980.
Greene, W. (2011). Econometric analysis (7th ed.). Upper Saddle River, NJ: Prentice Hall.
at Gebze Yuksek Teknoloji Enstitu on May 10, 2014mcr.sagepub.comDownloaded from
Rosko and Mutter 297
Hellinger, F. (2009). The effect of certificate-of-need laws on hospital beds and healthcare expenditures: An empirical analysis. American Journal of Managed Care, 15, 737-744.
Hjalmarsson, L., Kumbhakar, S., & Heshmati, A. (1996). DEA, DFA, and SFA: A comparison. Journal of Productivity Analysis, 7, 303-328.
Ho, V., & Ku-Goto, M. (2013). State deregulation and Medicare costs for acute cardiac care. Medical Care Research and Review, 70, 185-205.
Houchens, R., Elixhauser, A., & Romano, P. (2008). How often are potential “patient safety events” present on admission? Joint Commission Journal on Quality, 34, 154-163.
Joskow, P. (1980). The effects of competition and regulation on hospital bed supply and the reservation quality of the hospital. Bell Journal of Economics, 11, 421-447.
Kumbhakar, S., & Lovell, C. A. K. (2000). Stochastic frontier analysis. Cambridge, England: Cambridge University Press.
Leibenstein, H. (1987). Inside the firm: The inefficiencies of hierarchy. Cambridge, MA: Harvard University Press.
Lovell, C. K. (1993). Production frontiers and productive efficiency. In H. Fried, C. K. Lovell, & S. S. Schmidt (Eds.), The measurement of productive efficiency (pp. 3-67). New York, NY: Oxford University Press.
Luft, H., Robinson, J., Garnick, D., Maerki, S., & McPhee, S. (1986). The role of specialized clinical services in competition among hospitals. Inquiry, 23, 83-94.
Medicare Payment Advisory Commission. (2005, March). Physician-owned specialty hospi-tals: Report to the Congress. Washington, DC: Author.
Medicare Payment Advisory Commission. (2013). A data book: Health Care Spending and the Medicare Program. Retrieved from http://www.medpac.gov/documents/Jun12DataBookEntireReport.pdf
Mechanic, R., Altman, S., & McDonough, J. (2012). The new era of payment reform, spend-ing targets, and cost containment in Massachusetts: Early lessons for the nation. Health Affairs, 31, 2334-2342.
Meeusen, W., & van den Broeck, J. (1977). Efficiency estimation from Cobb-Douglas produc-tion functions with composed error. International Economic Review, 18, 435-444.
Mutter, R., Greene, W., Spector, W., Rosko, M., & Mukamel, D. (2013). Investigating the impact of endogeneity on inefficiency estimates in the application of stochastic frontier analysis to nursing homes. Journal of Productivity Analysis, 39, 101-110.
Mutter, R., Rosko, M., & Wong, H. (2008). Measuring hospital inefficiency: The effects of con-trolling for quality and patient burden of illness. Health Services Research, 43, 1992-2013.
Mutter, R., Wong, H., & Goldfarb, M. (2008). The effects of hospital competition on inpatient quality of care. Inquiry, 45, 263-279.
Newhouse, J. (1994). Frontier estimation: How useful a tool for health economics? Journal of Health Economics, 13, 317-322.
Noether, M. (1988). Competition among hospital. Journal of Health Economics, 7, 259-284.Phelps, C. (2010). Health economics (4th ed.). New York, NY: Addison-Wesley.Rivers, P., Fottler, M., & Younis, M. (2007). Does certificate of need really contain hospital
costs in the United States? Health Education Journal, 66, 229-244.Rosko, M. (2001). Cost efficiency of U.S. hospitals: A stochastic frontier approach. Health
Economics, 10, 539-551.Rosko, M., & Broyles, R. (1988). The economics of health care: A reference handbook.
Westport, CT: Greenwood Press.Rosko, M., & Mutter, R. (2008). Stochastic frontier analysis of hospital inefficiency: A review
of empirical issues and an assessment of robustness. Medical Care Research and Review, 65, 131-166.
at Gebze Yuksek Teknoloji Enstitu on May 10, 2014mcr.sagepub.comDownloaded from

298 Medical Care Research and Review 71(3)
Rosko, M., & Mutter, R. (2010). What have we learned from the application of stochastic fron-tier analysis to U.S. hospitals? Medical Care Research and Review, 68, 75S-100S.
Santerre, R., & Neun, S. (2007). Health economics: Theories, insights and industry studies (4th ed.). Mason OH: Thomson-South-Western.
Stevenson, R. (1980). Likelihood functions for generalized stochastic frontier estimation. Journal of Economics, 13, 57-66.
Thompson, M., Huerta, T., & Ford, E. (2012). Mandatory insurance coverage and hospital productivity in Massachusetts: Bending the curve? Health Care Management Review, 37, 294-300.
Zuckerman, S., Hadley, J., & Iezzoni, L. (1994). Measuring hospital efficiency with frontier cost functions. Journal of Health Economics, 13, 255-280.
at Gebze Yuksek Teknoloji Enstitu on May 10, 2014mcr.sagepub.comDownloaded from