Embed Size (px)
Citation preview
Policy Study #155
March 1993
WATER-UTILITY REGULATION: RATES AND COST RECOVERY
By Patrick C. Mann
EXECUTIVE SUMMARY
Water utilities are under significant financial pressure as a result of increasing urbanization, deteriorating infrastructure, and increasingly stringent drinking water-quality regulations. In addition, recurring droughts and the difficulty of developing new sources of supply indicate that, relative to demand, water is becoming more scarce. The present ability of water utilities to address these problems is partially constrained by regulation.
Designed to prevent monopoly pricing, price regulation of water utilities has generated several forms of inefficiency. First, poorly designed rates misallocate water among different consumers and may result in insufficient revenues to cover costs. Second, the lack of incentives to minimize water-provision costs creates cost inefficiency. And third, scarce regulatory resources are wasted when the costs of regulation exceed the benefits.
Five costing, financing and rate initiatives, if implemented, could reduce the inefficiencies inherent in traditional rate regulation. These include:
⋅ integrating marginal or incremental costing into the rate-design process; ⋅ implementing where feasible, seasonal pricing, zonal pricing, conservation
surcharges, availability charges, and system development charges;
⋅ installing incentive regulation mechanisms, including price caps, cost indexing, incentive rates of return, and incentives for demand-side or conservation capital investment;
⋅ implementing selective state deregulation of investor-owned water utilities, weighing consumer benefits against regulatory costs; and
⋅ implementing selective state regulation of publicly owned water utilities, weighing consumer benefits against regulatory costs.
The water industry has been historically slow to adopt water pricing and costing changes. Thus, any progress towards introducing these initiatives will require regulatory officials to offer both public and privately owned water utilities greater incentives to develop more-efficient water-supply practices.
TABLE OF CONTENTS
I. INTRODUCTION
A. Problems with Current Water Pricing and Costing Approaches
B. The Historical Neglect of Water-Supply Issues
II. WATER-UTILITY SECTOR AND REGULATION
A. Profile of the Water-Utility Sector
B. The State of Regulation
C. Conventional Costing, Pricing, and Financing
III. COSTING ISSUES IN WATER-RATE REGULATION
A. Marginal Versus Average Costing
B. The Integration of Marginal and Average Costing
C. Other Costing Developments
IV. NEW INITIATIVES IN WATER FINANCING AND PRICING
A. Seasonal Pricing
B. Zonal Pricing
C. Conservation Surcharge
D. Dedicated-Capacity Charges
E. System-Development Charges
V. SOME REGULATORY ISSUES
A. The Deregulation of Water Utilities
B. Reforming the Regulatory Process
VI. POLICY RECOMMENDATIONS
A. Integrate Incremental Costing into Rate Design
B. Enhance Efficiency Through Rate and Financing Innovations
C. Apply Incentive Regulation
D. Implement Selective Deregulation
E. Implement Selective Regulation
VII. CONCLUSION
ABOUT THE AUTHOR
ACKNOWLEDGEMENTS
ENDNOTES AND REFERENCES
I. INTRODUCTION
A. Problems with Current Water Pricing and Costing Approaches
Water utilities can be considered natural monopolies. The large fixed capital investment that characterizes the system of transportation, purification, and distribution of water typically makes a single water utility the most-efficient form of providing water service. Structured this way, water utilities face little or no competition. Consequently, to prevent monopoly pricing, price regulation has generally been applied.
However, this regulation tends to generate several forms of resource misallocation or inefficiency. These include: 1) allocative inefficiency caused by poorly designed rates; 2) cost inefficiency caused by the lack of incentives to minimize water provision costs; and 3) regulatory inefficiency caused by failure to weigh cost against benefits in allocating regulatory resources.
Both state and local rate regulation of water utilities can be made more efficient. Certain costing, financing, and pricing initiatives could reduce the inefficiencies associated with monopoly regulation. These include:
⋅ integrating marginal or incremental costing into the rate-design process;
⋅ implementing where feasible, seasonal pricing, zonal pricing, conservation surcharges, availability charges, and system development charges;
⋅ installing incentive regulation mechanisms, including price caps, cost indexing, incentive rates of return, and incentives for demand-side or conservation capital investment;
⋅ implementing selective state deregulation of investor-owned water utilities, weighing consumer benefits against regulatory costs; and
⋅ implementing selective state regulation of publicly owned water utilities, weighing consumer benefits against regulatory costs.
By generating pricing signals that more accurately reflect water's scarcity value, these initiatives would be consistent with the development of market-based allocation systems for regional water supplies.
Several factors are driving the interest in alternative techniques of financing and pricing. First, growing urbanization is increasing both average and peak
customer demands. Second, public-water infrastructure is deteriorating, particularly in the Midwest and Northeast. For some water utilities, replacement of facilities may be more costly than capacity expansion. Third, the amended Safe Drinking Water Act is driving up both water utility operating and capital costs. For some water utilities, compliance with the new water-quality regulations may be more costly than either capacity expansion or capacity replacement.
In addition to these infrastructure pressures, droughts and growing conflict among different users for water indicate that water generally is becoming increasingly scarce relative to demand. In the West, for example, competition for water among agricultural, urban, and environmental users has increased the opportunity cost of water. In addition, severe intermittent droughts on both the East and West Coasts have constrained available water supplies.
Together, these factors underscore that water is a scarce economic good; its efficient use requires more market-oriented pricing to better reflect the resource's growing scarcity value. To balance both water demand and supply, water prices must also better-reflect the costs of production. Customers who impose costs on a water-supply system should pay for these costs. Thus, for example, consumers who cause capacity costs to increase because of seasonal demands or because of their location away from water-production facilities, should pay for these costs. Pricing based on cost-causation directs consumers to efficiently use water services and enables water utilities to generate sufficient revenues to expand and properly maintain their systems.
By focusing on one particular use—domestic or urban water consumption—this paper does not examine the allocational conflicts between alternative water uses—for example, urban versus agricultural—and the question of the economic value (or opportunity cost of different water uses). However, by increasing efficiency in urban water use, rational water utility-pricing policies can help to ameliorate allocational conflicts.
B. The Historical Neglect of Water-Supply Issues
Several decades ago, economist Jerome Milliman evaluated the status of public water economics and found it deficient in many respects, particularly regarding costing and pricing.1 Milliman predicted that within the near future, public-water economics would undergo substantial change, with reform occurring in both costing methods and rate design. This prediction, at best, has been only partially realized. Some changes have occurred in water pricing, but these changes have not been widespread.
Underpricing of Water
Historically, water-supply economics has focused on the benefits and costs of large-scale federal projects such as reservoirs and dams, while ignoring the issues of water costing and pricing. Several factors explain the historical neglect of public-water economics. First, water service has generally been provided at a lower cost than other public-utility services; for example, increases in energy prices as well as in the general price level in the past several decades have exceeded increases in water prices in most parts of the United States. Second, water service tends to constitute a relatively small proportion of aggregate consumer expenditures and business-firm costs.
The neglect can also be linked to government policies that subsidize water-development projects, generating artificially low water prices. This approach has contributed to two inaccurate perceptions: 1) that low-cost, high-quality water supplies are plentiful; and 2) the quantity of water demanded by users is insensitive to its costs.
Consequently, when faced with shortages and unable to implement supply-side solutions, state and local authorities have tended to respond with either voluntary or mandatory rationing, rather than changing the level of rates or redesigning rate structures. Municipal water utility officials also find it politically difficult to raise prices and implement demand-side management practices.
More generally, underpricing of water services is a function of several factors, including the use of historical accounting (rather than present or future) costs in the rate-setting process, and the use of average (rather than marginal or incremental) cost as the primary pricing standard. By employing inappropriate cost criteria for water supply, these measures lead to distorted resource allocation decisions, including increased water usage, which places additional stress on system capacity and its maintenance.
Moreover, underpricing results in the deferral or postponement of system maintenance and capital replacement. Inadequate system repair and deteriorating water facilities result from both inefficient pricing and also from municipalities viewing the local water system as a revenue source (revenues that can be diverted to nonwater uses) rather than as an important and necessary component of local infrastructure.
Empirical analysis lends credibility to the underpricing hypothesis.2 For the period 1960–1970, real water prices were relatively stable for residential, commercial, and industrial users. For the period 1970–1980, real water prices for residential and commercial customers declined, while the real price of industrial service increased.
However, a survey of rates for water systems varying in location and size for the period 1979–1989 indicates that the underpricing of residential water service is decreasing.3 The survey indicated that water rates increased at an average annual rate of 7.0 percent during this period, which was nearly double that of the inflation rate. Thus, the real price of residential water increased in the past decade.
Moreover, the cost of water can be expected to keep rising for several reasons. First, the country's economic growth places greater demands on public water supplies. Per capita water usage has increased with increasing urbanization. Per capita use increased approximately 50 percent between 1950 and 1985.4 Second, there is a need to replace aging water-supply infrastructure. Third, in the quest for safer, contaminant-free water, water utilities must significantly increase spending on operating and capital costs. The 1986 amendments to the Safe Drinking Water Act (SDWA) have imposed new quality standards. One source estimates that SDWA compliance during the present decade will add $1.3 billion to the annual operating costs and $2.0 billion to the annual capital expenditures of water utilities.5
Despite these forces of change, the public-water sector is still beset by inefficient practices and regulation. Consider, for example, the municipally owned water system in New York City. In 1991, 450,000 unmetered customers in the city were being billed at a rate not reflecting usage. These unmetered accounts constituted over 56 percent of total customers.6 Consequently, a large portion of the city's residents have little information or incentive to properly use water. In addition, by not being able to fully measure water consumption, the city water authority's ability to detect water leaks is limited.
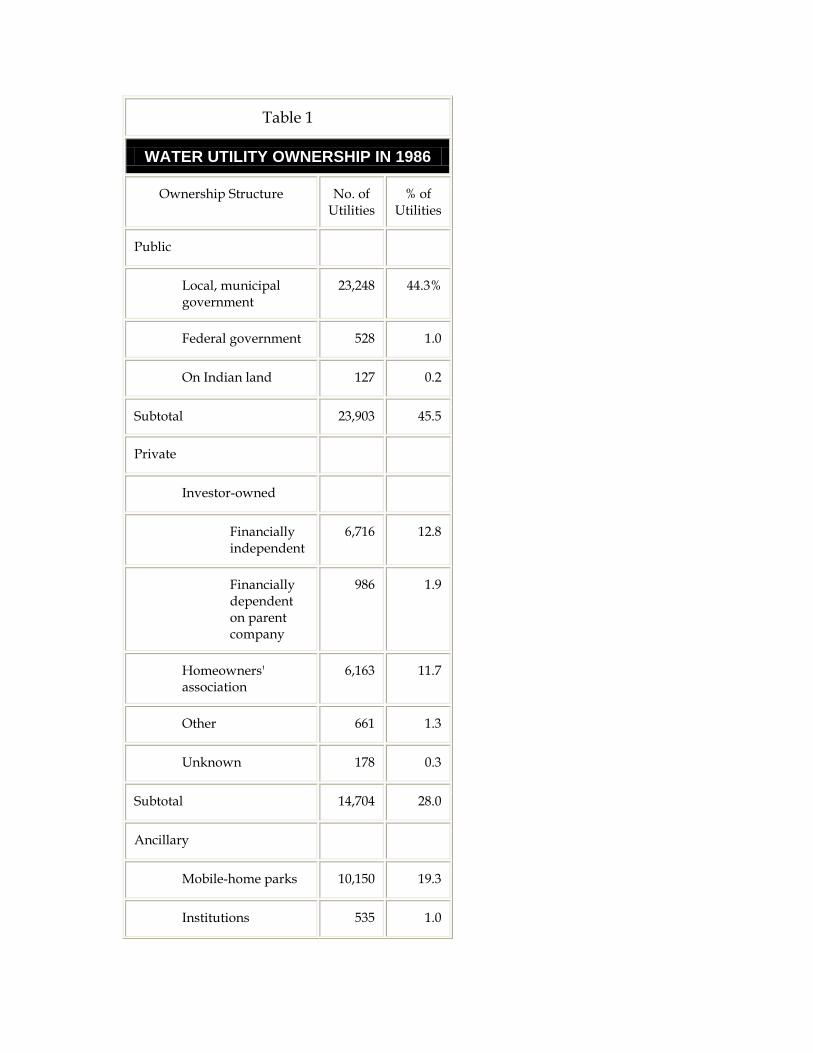
Table 1
WATER UTILITY OWNERSHIP IN 1986
Ownership Structure No. of Utilities
% of Utilities
Public
Local, municipal government
23,248 44.3%
Federal government 528 1.0
On Indian land 127 0.2
Subtotal 23,903 45.5
Private
Investor-owned
Financially independent
6,716 12.8
Financially dependent on parent company
986 1.9
Homeowners' association
6,163 11.7
Other 661 1.3
Unknown 178 0.3
Subtotal 14,704 28.0
Ancillary
Mobile-home parks 10,150 19.3
Institutions 535 1.0
II. WATER-UTILITY SECTOR AND REGULATION
A. Profile of the Water-Utility Sector
Public-water systems serve approximately 90 percent of the population of the United States. Private wells and other sources supply the remainder. A 1986 survey by the United States Environmental Protection Agency (EPA) estimates total public water systems in the United States to number nearly 53,000.7 The EPA data include only those systems serving at least 25 permanent residents and/or having at least 15 residential connections.
These public or community systems range from very small water utilities to large systems like the New York City Water Board (with approximately 800,000 customers in 1991). Table 1 provides the EPA data on the ownership of water utilities. Publicly owned systems (for example, public water districts and municipally owned systems) account for 46 percent of total number of water systems. Investor-owned firms (15 percent), homeowner's associations (12 percent), and ancillary systems, including mobile-home parks (19 percent), institutions, schools, and hospitals make up the remainder.
In addition, at least 100,000 noncommunity water systems in the United States serve either a transient population or have less than 15 residential connections. The noncommunity systems provide service to hospitals, schools, hotels, nursing homes, small mobile-home parks, and restaurants.
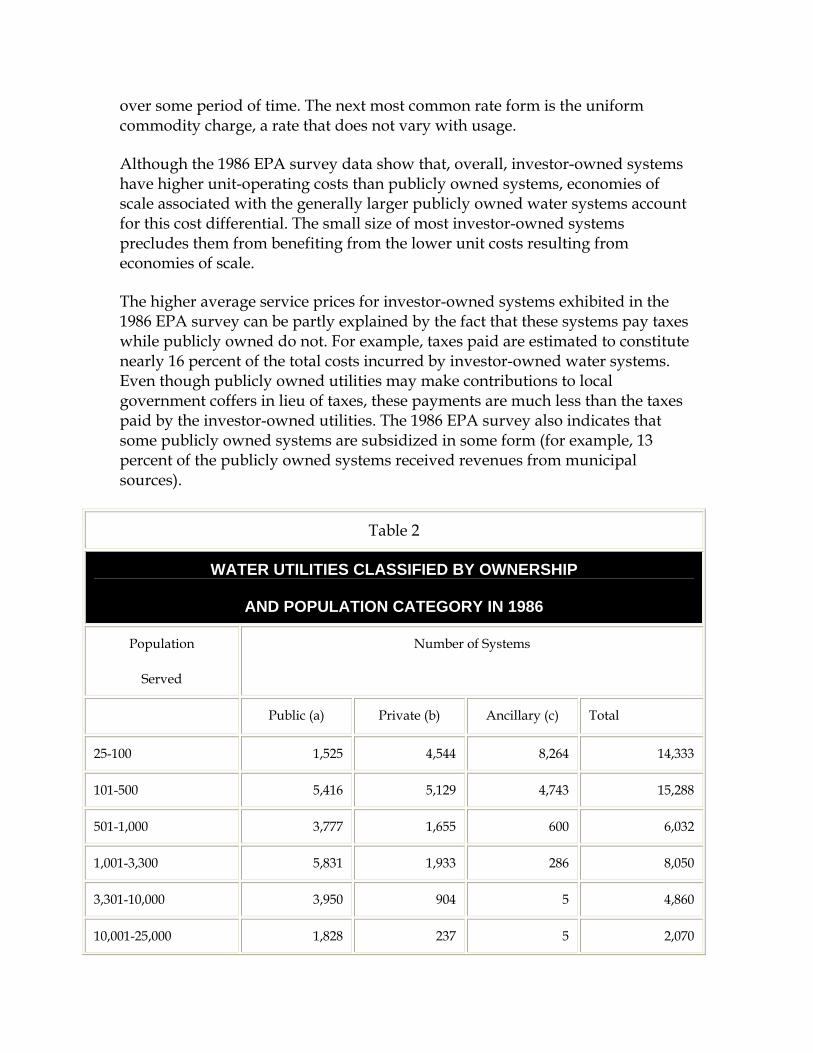
In Table 2, the public-water industry is characterized by many small systems serving relatively few people. Slightly over 1 percent of public-water systems provide service to over 50 percent of the population served by these systems.8 Conversely, 90 percent of the systems provide service to only 12 percent of total population served. The bulk of the larger systems are publicly owned.
The large number of noncommunity systems as well as the large number of very small community systems illustrate the fragmented nature of the public-water sector. Rate regulation and water-quality regulation problems are especially acute for small community systems that have relatively fewer resources to devote to these functions.
The 1986 EPA survey data indicate that both privately owned and publicly owned systems most commonly use variable rates, which either increase ("increasing block") or decrease ("decreasing block") as consumption increases
over some period of time. The next most common rate form is the uniform commodity charge, a rate that does not vary with usage.
Although the 1986 EPA survey data show that, overall, investor-owned systems have higher unit-operating costs than publicly owned systems, economies of scale associated with the generally larger publicly owned water systems account for this cost differential. The small size of most investor-owned systems precludes them from benefiting from the lower unit costs resulting from economies of scale.
The higher average service prices for investor-owned systems exhibited in the 1986 EPA survey can be partly explained by the fact that these systems pay taxes while publicly owned do not. For example, taxes paid are estimated to constitute nearly 16 percent of the total costs incurred by investor-owned water systems. Even though publicly owned utilities may make contributions to local government coffers in lieu of taxes, these payments are much less than the taxes paid by the investor-owned utilities. The 1986 EPA survey also indicates that some publicly owned systems are subsidized in some form (for example, 13 percent of the publicly owned systems received revenues from municipal sources).
Table 2
WATER UTILITIES CLASSIFIED BY OWNERSHIP
AND POPULATION CATEGORY IN 1986
Population
Served
Number of Systems
Public (a) Private (b) Ancillary (c) Total
25-100 1,525 4,544 8,264 14,333
101-500 5,416 5,129 4,743 15,288
501-1,000 3,777 1,655 600 6,032
1,001-3,300 5,831 1,933 286 8,050
3,301-10,000 3,950 904 5 4,860
10,001-25,000 1,828 237 5 2,070
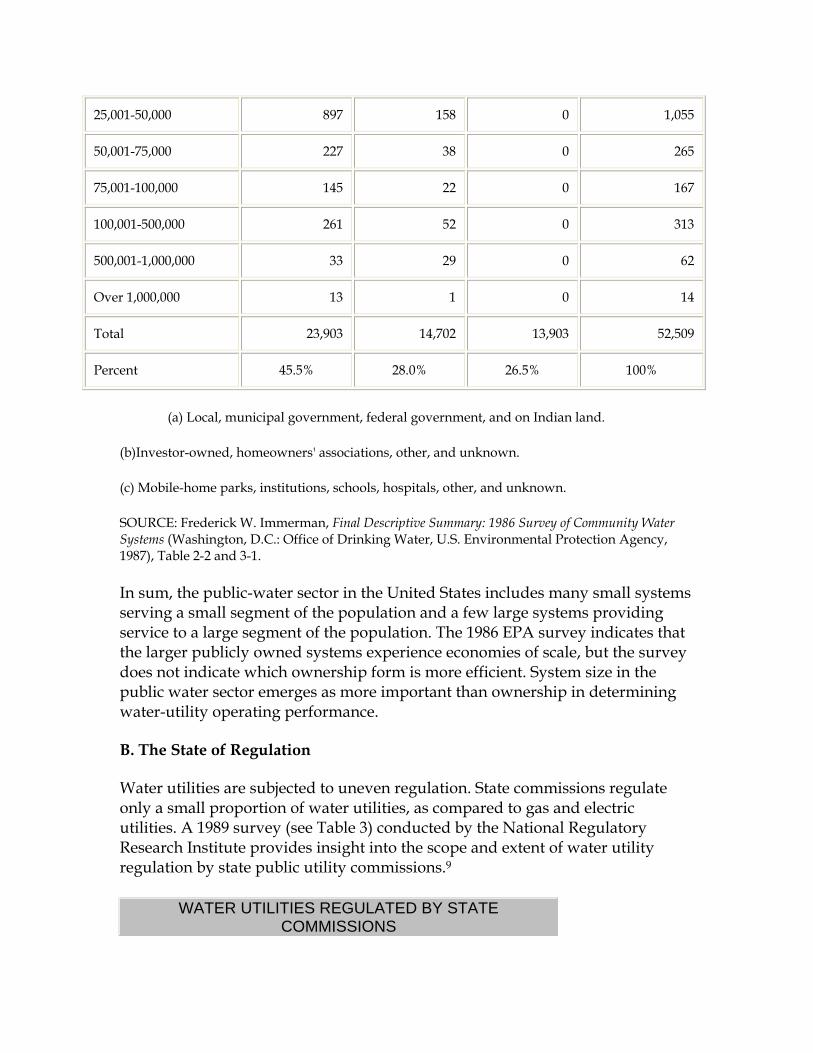
25,001-50,000 897 158 0 1,055
50,001-75,000 227 38 0 265
75,001-100,000 145 22 0 167
100,001-500,000 261 52 0 313
500,001-1,000,000 33 29 0 62
Over 1,000,000 13 1 0 14
Total 23,903 14,702 13,903 52,509
Percent 45.5% 28.0% 26.5% 100%
(a) Local, municipal government, federal government, and on Indian land.
(b)Investor-owned, homeowners' associations, other, and unknown.
(c) Mobile-home parks, institutions, schools, hospitals, other, and unknown.
SOURCE: Frederick W. Immerman, Final Descriptive Summary: 1986 Survey of Community Water Systems (Washington, D.C.: Office of Drinking Water, U.S. Environmental Protection Agency, 1987), Table 2-2 and 3-1.
In sum, the public-water sector in the United States includes many small systems serving a small segment of the population and a few large systems providing service to a large segment of the population. The 1986 EPA survey indicates that the larger publicly owned systems experience economies of scale, but the survey does not indicate which ownership form is more efficient. System size in the public water sector emerges as more important than ownership in determining water-utility operating performance.
B. The State of Regulation
Water utilities are subjected to uneven regulation. State commissions regulate only a small proportion of water utilities, as compared to gas and electric utilities. A 1989 survey (see Table 3) conducted by the National Regulatory Research Institute provides insight into the scope and extent of water utility regulation by state public utility commissions.9
WATER UTILITIES REGULATED BY STATE COMMISSIONS
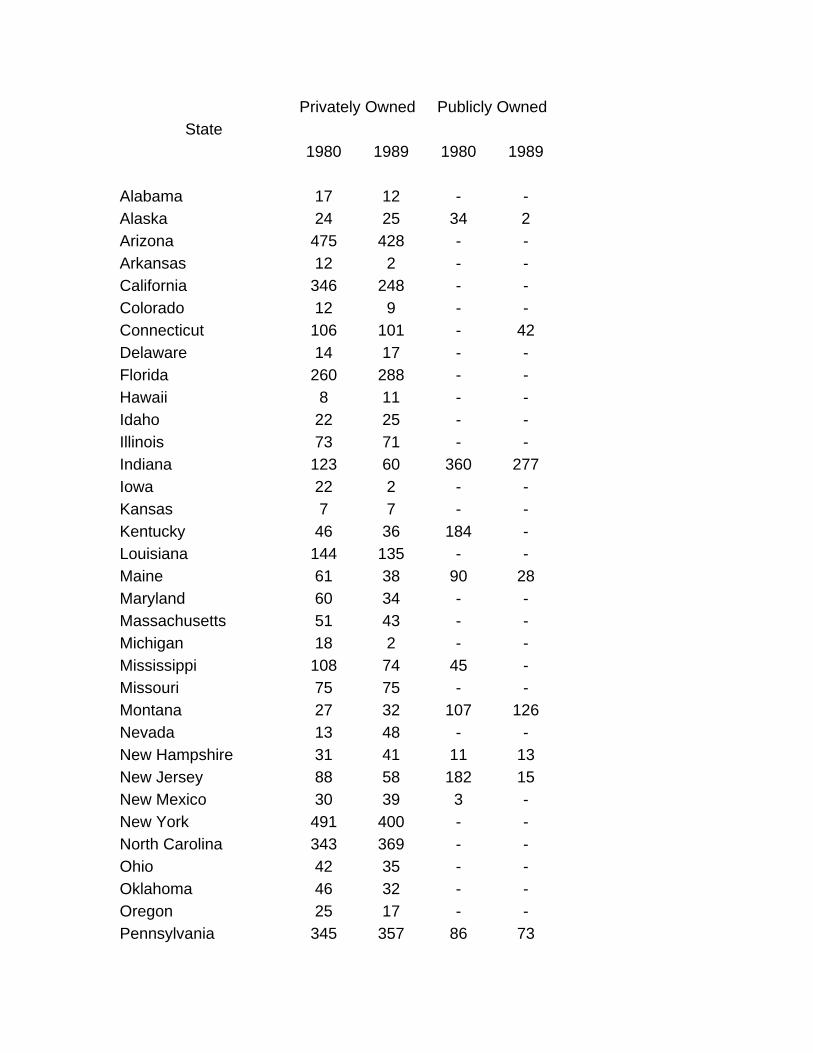
Privately Owned Publicly Owned State
1980 1989 1980 1989 Alabama 17 12 - - Alaska 24 25 34 2 Arizona 475 428 - - Arkansas 12 2 - - California 346 248 - - Colorado 12 9 - - Connecticut 106 101 - 42 Delaware 14 17 - - Florida 260 288 - - Hawaii 8 11 - - Idaho 22 25 - - Illinois 73 71 - - Indiana 123 60 360 277 Iowa 22 2 - - Kansas 7 7 - - Kentucky 46 36 184 - Louisiana 144 135 - - Maine 61 38 90 28 Maryland 60 34 - - Massachusetts 51 43 - - Michigan 18 2 - - Mississippi 108 74 45 - Missouri 75 75 - - Montana 27 32 107 126 Nevada 13 48 - - New Hampshire 31 41 11 13 New Jersey 88 58 182 15 New Mexico 30 39 3 - New York 491 400 - - North Carolina 343 369 - - Ohio 42 35 - - Oklahoma 46 32 - - Oregon 25 17 - - Pennsylvania 345 357 86 73
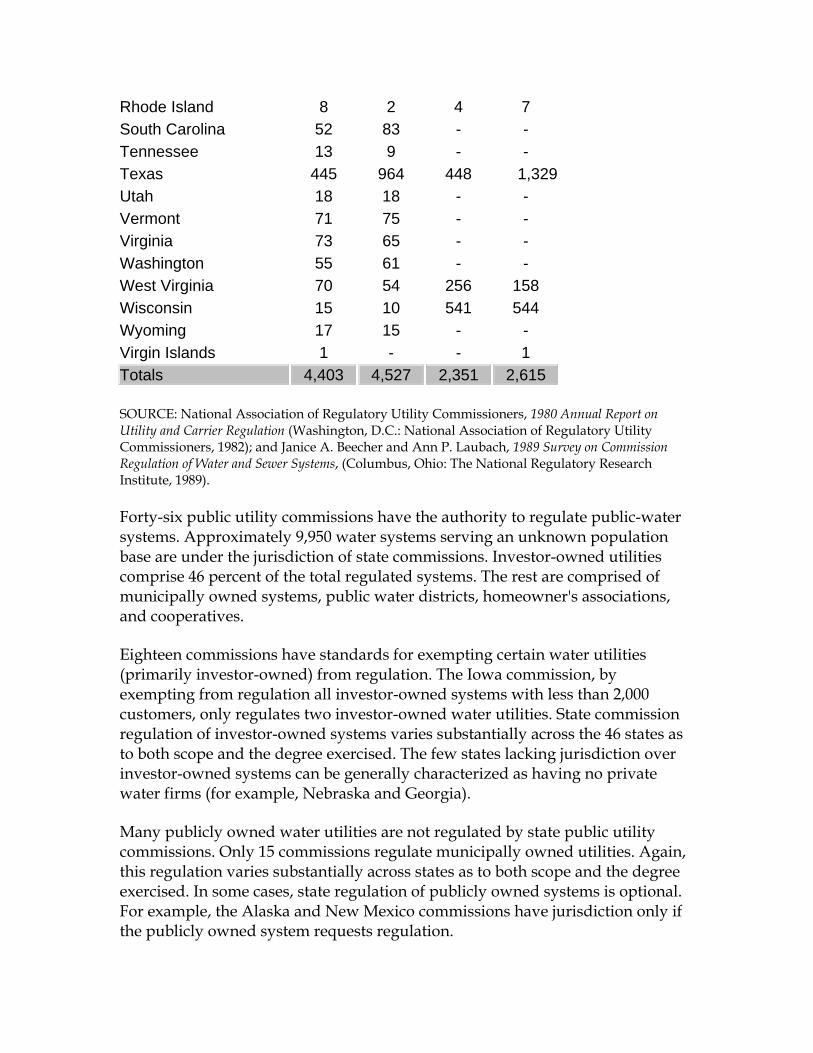
Rhode Island 8 2 4 7 South Carolina 52 83 - - Tennessee 13 9 - - Texas 445 964 448 1,329Utah 18 18 - - Vermont 71 75 - - Virginia 73 65 - - Washington 55 61 - - West Virginia 70 54 256 158 Wisconsin 15 10 541 544 Wyoming 17 15 - - Virgin Islands 1 - - 1 Totals 4,403 4,527 2,351 2,615
SOURCE: National Association of Regulatory Utility Commissioners, 1980 Annual Report on Utility and Carrier Regulation (Washington, D.C.: National Association of Regulatory Utility Commissioners, 1982); and Janice A. Beecher and Ann P. Laubach, 1989 Survey on Commission Regulation of Water and Sewer Systems, (Columbus, Ohio: The National Regulatory Research Institute, 1989).
Forty-six public utility commissions have the authority to regulate public-water systems. Approximately 9,950 water systems serving an unknown population base are under the jurisdiction of state commissions. Investor-owned utilities comprise 46 percent of the total regulated systems. The rest are comprised of municipally owned systems, public water districts, homeowner's associations, and cooperatives.
Eighteen commissions have standards for exempting certain water utilities (primarily investor-owned) from regulation. The Iowa commission, by exempting from regulation all investor-owned systems with less than 2,000 customers, only regulates two investor-owned water utilities. State commission regulation of investor-owned systems varies substantially across the 46 states as to both scope and the degree exercised. The few states lacking jurisdiction over investor-owned systems can be generally characterized as having no private water firms (for example, Nebraska and Georgia).
Many publicly owned water utilities are not regulated by state public utility commissions. Only 15 commissions regulate municipally owned utilities. Again, this regulation varies substantially across states as to both scope and the degree exercised. In some cases, state regulation of publicly owned systems is optional. For example, the Alaska and New Mexico commissions have jurisdiction only if the publicly owned system requests regulation.
In many states, the proportion of public water supplied by utilities regulated by state commissions is relatively small. For example, the 248 investor-owned water utilities under the jurisdiction of the California Public Utilities Commission provide an estimated 2 percent of the total public water supply in California. Thus, any attempts by the California PUC to promote efficient pricing and conservation will have but a small effect on the overall use of public-water supplies in that state.
The water utilities not under state commission jurisdiction are mostly publicly owned. These water systems, approximately 44,000 in total, are typically subject to some form of local regulation. However, little information is available on the local regulation of the publicly owned utilities. This lack of information makes it difficult to analyze the effects of local regulation, as compared to state regulation.
Generally, local regulation involves oversight by mayors, city councils, elected water boards, and appointed water commissions. Most publicly owned systems are either a part of local government or are independent of local government. As a part of local government, rates are generally subject to mayor or council approval; as an independent agency, rates are under the jurisdiction of a local elected or appointed commission.
The variances in local fiscal environment, hydrological conditions, system age, size and density of the local public water market, and demand characteristics suggest that universal regulatory policies for the public-water sector are inappropriate. Both rate and environmental regulatory policies must be sufficiently flexible to reflect the diversity of water systems both across and within regulatory jurisdictions. However, the Safe Drinking Water Act is essentially being applied uniformly across all water systems, despite the fact that many of the contaminants regulated exist only in certain regions.
C. Conventional Costing, Pricing, and Financing
There are two generally accepted methods for determining the total revenue requirements of a water utility. These two approaches for determining revenue requirements vary with ownership form.10 Under the "utility" approach, the total cost of service for investor-owned utilities is the sum of operating expenses, taxes, depreciation, and rate of return on rate base. Under the "cash-needs" approach, the total cost of service for publicly owned utilities is the sum of operating expenses, payments in lieu of taxes (for example, transfers to the municipal general fund), debt service payments (including interest charges and repayment of principal), and capital expenditures not financed by either debt capital or capital contributions. The "utility" approach may be used for those publicly owned utilities under state commission jurisdiction.
The two approaches differ primarily in how they treat capital expenditures. With the "utility" approach, the capital expenditures are covered in the depreciation and rate-of-return components. With the "cash-needs" approach, capital expenditures are covered in the debt service and capital expenditures components. If depreciation rates better reflect the useful service lives of facilities and if rates of return reflect current financial-market conditions, the "utility" approach is the superior accounting method.
A 1990 National Regulatory Research Institute survey of state commissions regarding cost analysis in water-rate cases indicates that a majority of commissions use average- or embedded-cost approaches.11 Two average-cost approaches are employed.12
In some cases, the commodity-demand method is employed; this costing method considers the level of peak demand but does not incorporate either the timing of peak demand or the level of average demand in the allocation of capacity costs. The commodity-demand approach, by ignoring direct responsibility for system peak demands, allocates some capacity costs to all user classes.
In other cases, the base-extra capacity method is used; this costing method considers peak demand and average demand but does not incorporate the timing of peak demand in the allocation of capacity costs. The base-extra capacity method apportions some capacity costs on the basis of usage as well as some on the basis of maximum demands.
The public-water sector typically employs a single rate structure that applies to all retail customers. In theory, the rate structure recovers the costs of service for different user classes by the proper design of the usage blocks. For example, the first usage block could be designed to incorporate the bulk of small residential usage, the second usage block could incorporate large residential usage, the third usage block could incorporate commercial usage, and the final block(s) could cover large industrial or institutional users.
A common rate structure in water service, but one that has recently declined in importance, is the declining or decreasing block rate, in which the applicable (incremental) unit price declines with higher usage blocks. Conceptually, this rate form is cost justified when unit costs decrease with increased usage. That is, there are economies of scale associated with system-capacity expansion and improved load factors associated with increased capacity utilization rates.
A less common rate structure, but a form that is rapidly gaining acceptance, is the uniform commodity rate in which one rate applies to all usage (thus the
incremental unit price equals the average unit price). Another less common rate structure, but also a type that is rapidly gaining acceptance, is the increasing or inverted block rate, in which the applicable incremental price increases with higher usage blocks. The inverted block rate structure has been advocated as a form of conservation pricing.
The frequency of these rate forms varies across regions. For example, a 1990 Ernst and Young rate survey of over 100 cities in the United States indicates that 50 percent have declining block schedules, nearly 40 percent have inverted block schedules, and slightly more than 10 percent have uniform rates.13 In contrast, a similar survey of public water systems in California indicates that only a small minority have declining block rates; instead, most California systems have uniform or increasing block rates.14 The divergence of California from that of the entire United States generally reflects relative water scarcity.
Water-rate structures, similar to other utility-rate structures, are based on the concept of averages, that is, a customer with an average maximum day demand. The design of customer classes extends the averaging concept to customers within classes (indicating that the average customer differs among different customer classes). However, many customers in any specific class have different load factors (the ratio of average demand to maximum demand) and different maximum demands. Thus, whether the water utility has one general class or several customer classes, the result is an element of price discrimination and cross-subsidization—rates never perfectly match the cost of service to specific customers within the general class or within specific customer classes.
In terms of capital financing, the conventional techniques for investor-owned water utilities include the issuance of common and preferred stock (equity financing), the issuance of long-term bonds (debt financing), and the generation of water revenues (internal financing). For publicly owned utilities, the conventional techniques include the issuance of long-term tax-exempt bonds and the generation of water revenues. The fact that publicly owned water utilities, in contrast to privately owned water utilities, have greater access to tax-subsidized municipal borrowing gives them considerable advantage in raising capital.
III. COSTING ISSUES IN WATER-RATE REGULATION
The determination of the costing method, the selection of the capital-financing method, and design of rates for a water utility are separate but intrinsically
related processes. Since pricing focuses on sending "correct" or efficient signals to consumers—signals that indicate the relative scarcity of the resource, in a regulatory context rate design cannot be separated from the costing method. The regulatory purpose of cost analysis is to provide a basis for rate design. Conceptually, rate design uses the cost-allocation outcome as a benchmark.
The basic focus of water-rate determination is on cost causation. The cost-causation standard asserts that those customers who cause the costs to be incurred should pay for those costs. Other rate criteria such as equity, consumer acceptability, and administrative feasibility are generally subordinate to the cost-causation standard.
A. Marginal Versus Average Costing
Both marginal and average costs provide regulators with benchmarks for water-rate design. In choosing between costing approaches, one should consider the merits and demerits of each costing method17 (see Table 4 below).
Table 4
In essence, water rates based on marginal costs reflect the immediate and future cost of resources used (the avoided cost or cost which could be saved) in water provision. Water rates based on average costs create the illusion that the resources used in the future in providing water service cost the same as in the past. An empirical issue is whether the efficiency advantages of marginal cost rates exceed their implementation problems.16
Marginal Cost: Implementation Issues
One implementation problem is the higher transaction costs associated with the measurement of short-run and long-run marginal cost. Short-run marginal cost is defined as the change in operating cost caused by varying the utilization rate of existing capacity. Short-run marginal cost is also known as marginal operating cost (MOC). Long-run marginal cost is defined as the change in capacity cost and operating cost caused by varying system capacity. Long-run marginal cost includes both MOC and marginal capacity cost (MCC).
In the calculation of MOC and MCC for public-water provision, alternative approaches can be considered. These approaches vary in sophistication, complexity, and in data requirements. The selection of estimation methods for MOC and MCC involves tradeoffs across efficiency, revenue adequacy, and administrative feasibility.
One method for estimating MCC in water provision is the Turvey method.17 An alternative method for estimating MCC in water provision is the Average Incremental Cost (AIC) method.18 In both approaches as well as in other MCC estimation techniques, the cost outcome is highly sensitive to both the cost numerator and the output denominator.
Both the Turvey and AIC approaches are compatible with economic efficiency. However, the data requirements of the Turvey method are less than that of the AIC method. As a result, there has been more application of the former than the latter.19
B. The Integration of Marginal and Average Costing
In a regulatory context, one important difference between embedded- and marginal-cost approaches is procedural. With embedded-cost methods, revenue requirement determination is followed by cost classification, interclass cost allocation, unit-cost calculation, and finally, rate design. The process starts with the premise of total revenue-total cost equality, followed by an interclass cost allocation that achieves this equality. In contrast, marginal-cost methods initially do not attempt to achieve an equality of revenues and costs. With marginal-cost methods, the selection of a planning horizon is followed by the estimation of marginal unit costs, cost classification, and then rate design, which may involve a reconciliation of costs and revenues. The process starts with the premise of price-marginal cost equality followed by adjustments to insure that rates are compatible with revenue requirements.
A second important difference is that embedded-cost approaches focus on historical costs and usage, while marginal-cost approaches focus on immediate and future costs and usage. However, this difference between the two cost approaches tends to be overstated. For example, average cost is often used as a proxy for incremental distribution cost and incremental customer cost since incremental cost calculations for these components tend to be less precise than for the production of utility services.
Attempts by regulatory commissions to integrate marginal costing with average costing in utility pricing have been limited. William Melody, a pioneer in examining the possible integration of average and marginal cost approaches,20 suggested that average cost be used in allocating revenue requirements to specific customer classes and services, that is, embedded cost would determine rate levels for individual classes and services. He suggested that marginal cost be used for designing rates for customer classes and services, that is, incremental cost would assist in the structuring of prices.
Rethinking Rate Design
Despite the various institutional and political barriers, serious consideration should be given by regulators to the integration of the average and marginal cost approaches in water rate design. For example, seasonal (summer and winter) estimates of MOC could be important inputs in developing seasonal rate structures. The MOC estimates could be used as components in the design of various rate structures including uniform and inverted-block rates. Also, the MOC estimates provide a minimum standard below which no rate (for example, a wholesale rate) should be set.
Finally, seasonal MCC estimates could be important inputs in designing seasonal rates or in establishing the differential between the initial and second block rates in an inverted-block rate structure.
C. Other Costing Developments
A recent important contribution to water costing is an alternative categorization method in which water costs are separated into two components—nodal and network.23 The nodal component involves the production center (source of supply, transmission, and treatment); the network component involves the delivery system (distribution). This classification is instructive for both rate regulators and system-design engineers, since the effects of system scale and consumer density can differ substantially between the two components. For example, the nodal component can incur scale economies offset by diseconomies in the network component.
Empirical evidence shows that regionalization and system consolidation produce economies of scale in treatment that can be offset by increasing delivery costs.22 Models have focused on the cost tradeoffs between treatment economies and distribution diseconomies.23 These models have quantified the linkage between lower treatment costs and higher distribution costs resulting from system expansion. This negative linkage implies that declining block rates may not be cost-justified in some cases.
IV. NEW INITIATIVES IN WATER FINANCING AND PRICING
Two challenges face the public-water sector: 1) the acquisition of adequate financing for capacity replacement; and 2) the design of rates to ensure efficient water use and adequate flow of water revenues.24 The method of capital
financing is important in insuring that there is some approximation of intergenerational equity—both present and future consumers bear their share of the actual costs of water provision. The pricing method is important in insuring that rates track the actual costs of serving the various customer classes.
Financing and Pricing Initiatives
Several financing and pricing initiatives have emerged: seasonal pricing, zonal pricing, conservation surcharges, availability charges, and system development charges. Each initiative may enhance efficiency in public-water provision and may make public-water provision more market-oriented.
Each initiative has been considered in numerous regulatory jurisdictions. However, implementation generally has been sporadic.
⋅ Seasonal (time-differentiated) pricing recognizes that the incremental cost of providing water service in the peak demand periods (summer) may exceed the incremental cost of provision in the off-peak periods (winter).
⋅ Zonal (spatially differentiated) pricing recognizes that both the capacity and operating costs of providing water service to customers at different locations in a service area may vary.
⋅ Conservation surcharges recognize that conservation can be a means of avoiding costly capacity expansion.
⋅ Availability charges recognize that future (unconnected) customers cause certain provision costs to be incurred, prior to them actually being provided water service.
⋅ System-development charges recognize that the connection of new customers impose specific costs on the water system.
The initiatives raise several issues. One is the unresolved issue of whether cost-based practices such as seasonal pricing and zonal pricing are more apt to be implemented by investor-owned utilities than by publicly owned utilities. Second is the unresolved issue of the magnitude of the efficiency gains from each of these initiatives, as compared to the costs of implementation.
A. Seasonal Pricing
Most water systems experience distinct seasonal peaks, due to weather-sensitive demand and supply. Seasonal pricing recognizes the cost variance between serving peak and off-peak demands. Seasonal rates provide price signals to
consumers as to the actual cost savings that could result from changing usage patterns, or conversely, the costs incurred by consumers not changing consumption patterns. Seasonal rates avoid the potential adverse results associated with voluntary conservation, that is, declines in average but not maximum demand, creating both revenue erosion and increased unit-provision costs.
The benefits of seasonal rates include increased operational efficiency (through capacity utilization improvements) and reduced peak demands, both of which should enhance the financial condition of the water utility. Reducing maximum demands can extend available water supplies and postpone (or possibly eliminate) the pressures for capacity expansion. For water consumers who are willing and capable of modifying usage patterns, seasonal rates are a means of reducing water bills.
In contrast, uniform rates over time induce unnecessary capacity expansion. For example, water rates not differentiated by time are generally set at less than the unit cost of meeting maximum demands and in excess of the unit cost of meeting off-peak demands. This cross-subsidization provides an incentive to expand production (treatment) to provide service to peak users. In brief, the averaging of peak and off-peak costs provides an involuntary subsidy to peak users from off-peak users.
The emphasis on seasonal, rather than on time-of-day, pricing in water service is mostly a function of system design.25 There is much more variation in the incremental cost associated with seasonal-demand cycles than with daily demand cycles. For example, treatment and source-of-supply facilities are generally designed to meet maximum-day-demands. Distribution capacity and storage facilities are generally designed to meet peak hour flows anticipated from fire protection.
Although seasonal pricing logically flows from marginal costing, seasonal rates in place in the United States have generally been based on average rather than on marginal cost. For example, the seasonal rates in place in Tucson, Arizona and Spring Valley, New York do not directly incorporate marginal costs. Still, benefits were derived from implementing the rates. For example, after the Spring Valley Water Company initiated seasonal rates, the peak-to-average ratio of water consumption fell about 13 percent for a decrease in peak demand of nearly 3 million gallons per day.26 Consequently, the need for new peaking-capacity facilities was postponed beyond the year 2000.
Seasonal pricing has some implementation problems.27 Given price-insensitive water demands, seasonal pricing may have only minimal effects on usage
patterns; thus, the anticipated benefit of deferred capacity expansion may not materialize, despite prices tracking costs. This poses the question of whether efficient water prices should be charged if they do not result in the anticipated benefits. In addition, seasonal rates can generate substantial fluctuations in revenues. These fluctuations affect investment risk and return on equity for investor-owned water utilities.
The implementation of seasonal pricing may require that the method of metering customers be modified. Any rate structure that incorporates rate differences based on time of use requires usage data by specific time period, or in this case, by season. A seasonal rate structure can be no more sophisticated than the capability of the water utility to measure usage for the periods to which the seasonal rate structure is to be applied. Finally, effective seasonal pricing has several prerequisites. These include peak demands that occur consistently during the same season, the existence of substantial demand variations between peak and off-peak seasons, and the capability of estimating the cost differences in providing peak and off-peak demands. These prerequisites indicate that seasonal rates may not be appropriate in some cases.29
B. Zonal Pricing
Efficient water pricing cannot be accomplished by reliance solely on time-differentiated rates. Seasonal rates may need to be complemented by spatially differentiated or zonal rates. In some cases, a uniform rate for the entire service area of the water utility can generate inefficiencies and can involve cross-subsidization. Zonal pricing recognizes that the location of consumers, particularly relative to production facilities, can affect the cost of providing water service to those consumers and that terrain can generate differences in pumping costs across a service area.
Employing the cost-causation standard, if water-provision costs vary substantially across areas within the total service area, then the rate structure should incorporate zonal rates. For example, one zonal pricing model incorporated rates varying by pumping districts within the service area.29 Thus, location of customers is a cost-causation factor that primarily involves pumping costs; however, location can also reflect differences in per capita usage, consumer density, and peak demands.
Many municipalities employ a simple form of zonal pricing with rate differentials between internal (intra-city) and external (outside-city) consumers. However, in some cases, these particular rate variances have probably been motivated by political purposes, including the taxation of nonvoters and the inducement of annexation, rather than by efficiency considerations. These
internal/external differences generally do not reflect present cost differences. The differences have been maintained over time partly due to inertia and partly due to a tax-the-outsider syndrome.
Thus, the key issue in implementing zonal rates is that of cost justification. If substantial cost differences within the service area exist, then zonal rates are an appropriate form of rate unbundling (an unbundling that would occur in a competitive market) that attains more efficient water rates. However, zonal rates that are arbitrary (political in nature) only enhance the inefficiency of water rates.
Implementation of zonal rates may generate substantial administrative and implementation costs. Indeed, the expense of developing zonal cost data has limited the application of zonal pricing. The major prerequisite to efficient zonal pricing is the capability of the water utility to accurately calculate the cost differences in providing service to different zones.
C. Conservation Surcharge
The conservation surcharge integrates marginal and average cost in water-rate design. The development of the conservation surcharge (or capacity deferral benefit) involves the estimation of costs that would be avoided if consumers decreased their water usage.30 The end result is a commodity charge that focuses on the cost savings from conservation (the cost reduction resulting from the elimination of discretionary usage). The conservation surcharge identifies discretionary usage and then estimates the cost impacts of consumers continuing long-term usage patterns at levels inclusive of this discretionary usage.
The first step in calculating the conservation surcharge is to identify discretionary usage. The estimation of the usage/output denominator involves substantial judgment on the part of the rate analyst. Discretionary usage levels vary across customer classes. For single-family residential customers, a portion of lawn sprinkling and other external usage can be identified as discretionary. For example, a threshold of twice their winter consumption may be applied to individual residential consumers, that is, usage amounts in excess of twice the level of winter usage would be identified as discretionary. For nonresidential customers, a variety of uses can be considered in determining discretionary usage.
The second step in calculating the conservation surcharge is the determination of the avoided-cost numerator. The numerator can be viewed as the expenditures required to supply the discretionary usage, if the latter is not eliminated by conservation. The cost numerator reflects the cost savings associated with delaying the capacity increment, if the excess usage is eliminated, or conversely,
the capital expenditures that are required to meet the excess demand, if the latter is not eliminated by conservation. Dividing the avoided cost by the accumulated discretionary usage produces a unit charge to be applied to the excess usage.
The conservation surcharge unbundles the usage in excess of normal levels and provides a price signal reflecting the opportunity cost associated with the decision of consumers to continue this excess usage. The conservation surcharge can stand alone and be appended to a variety of rate designs. Some of the accumulated revenues from the conservation surcharge could finance conservation programs.
The conservation surcharge has several merits:
⋅ it can be integrated with the embedded-cost approach typically used in rate regulation;
⋅ it transmits to consumers an efficient forward-looking price signal;
⋅ it can complement least-cost planning as conservation expenditures are substituted for costly capacity construction; and
⋅ it can complement incentive regulation, that is, permitting funding of conservation programs provides an incentive for the water utility to implement these programs.
The approach is compatible with the standard of cost causation as the charge is levied directly on consumers causing the triggering of the capacity increment. Consumers electing to conserve
avoid paying for capacity that is linked to excess usage; the conservation surcharge is a form of avoided-cost pricing. Consumers electing not to conserve, pay for the capacity that will be eventually required to supply the excess demand.
Both consumers and regulators may object to the conservation surcharge, since it generates revenues in excess of the revenue requirements of the water utility. In addition, there may be controversy as to what portion of the accumulated revenues should go for conservation programs and what portion should be set aside for financing new capacity. Finally, there are problems in defining excess usage—water usage must be categorized as either avoidable or unavoidable. For example, employing the twice-the-winter usage standard discriminates against consumers who have conserved on domestic (indoors) use while benefiting consumers who have conserved on outdoor use.
The conservation surcharge was proposed in a 1991 water-rate case before the New York Public Service Commission.31 It was not adopted due in part to its being external to the revenue-requirements process and due in part to problems of implementation and administration. For example, the utility-billing system must permit the identification of discretionary usage and the application of the surcharge in the peak-demand periods.
D. Dedicated-Capacity Charges
Dedicated-capacity charges involve a relatively new financing method for public-water systems. Dedicated-capacity charges have the purpose of recovering costs from customers for capacity constructed primarily for providing service to these specific customers. The availability charge is one type of dedicated-capacity charge.32
The availability or readiness-to-serve charge is a charge designed to recover the costs incurred by a water system in constructing facilities primarily for the benefit of future customers. The availability charge is imposed only between the time service is made available to the potential customer and the time actual service is initiated. When water service is actually received, the availability charge is terminated.
The availability charge is particularly appropriate in cases where a new housing development is created, and the water utility constructs facilities primarily for that development. The initial system costs may exceed the level that can be realistically recovered from the low initial customer base. Thus, lot owners may be charged for having service available, even though they are not actually receiving service. The availability charge is an access charge reflecting the cost of providing consumer access or entry to the water system. Access charges are payments for system access regardless of usage and should recover only the usage-insensitive costs incurred when consumers join the system. The justification for the availability charge is that a water utility incurs certain costs regardless of whether or not the consumer receives service.
The availability charge adheres to the standard of cost-causation, where the water utility has made significant capital investment to provide service to future customers. The rationale for the availability charge is substantially reduced in cases where the developer has provided (contributed) the distribution system infrastructure.
In some cases, availability charges may not have a rational costing basis. For example, the availability charge may include operating costs that are unrelated to the potential connection of the new customer. Regulators and consumers may
strongly question the fairness of a charge for service not actually being rendered. In addition, there is the problem of establishing a mechanism for forcing the property owner to pay the availability charge. For these reasons, the availability charge has had very limited implementation in the public-water sector.
E. System-Development Charges
Periodically, water utilities incur capital expenditures for system improvements. Regulators must decide which capital costs are more appropriately recovered by increased commodity rates and which capital costs are more appropriately recovered by fixed charges. If the capital investment is oriented toward serving demand growth via the addition of new customers rather than toward benefiting existing customers, it is inefficient to recover these capital costs from existing customers. An appropriate financing option is the front-end capital payment or capital contribution, a payment by new customers to recover the capital investment required to provide them service.35 The rationale for the front-end charge is to require new customers to finance system improvements that directly benefit them and are largely a result of demand growth caused by the new customers.
One form of front-end charge is the system-development charge. This is a one-time charge to new customers when they are connected to the water system. These charges are also known as system capacity charges, system buy-in charges, connection charges, or facilities charges. The system-development charge should be limited to recovering capital expenditures for new facilities required by the projected demands of new customers; the system-development charge is not appropriate for recovering operating costs. A system-development charge is necessary to ensure that rates for existing customers need not be increased to recover the costs of facilities constructed for the provision of service to new customers.
The system-development charge has several merits. First, this charge can preclude existing customers from having to subsidize the addition of new customers. Second, by requiring the customers who have caused the system growth to pay for that growth, the system- development charge preserves a common rate schedule for both existing (old) and new customers. Third, the system-development charge reduces the need for increases in water rates to accommodate system growth.
The system-development charge also has some problems. First, in relying on the charge to satisfy current revenue requirements, there is the potential for revenue instability, since these front-end charges are tied to system growth, and this growth will fluctuate depending upon both local and national economic
conditions. Second, system-development charges can be inefficient by having a noncost basis—simply being set equal to charges in adjacent communities.36 Third, the system-development charge is more controversial when used to recover the cost of new facilities jointly used by new and existing customers: it is more appropriate to limit the charge to recovering the cost of facilities constructed for the exclusive benefit of new customers. The system-development charge, in its varying forms, has been more widely implemented in the public-water sector than has the availability charge.
V. SOME REGULATORY ISSUES
Both industry and regulatory inertia characterize the public-water sector, particularly regarding costing and rate design. Important research developments in water demand and costing have generally not been translated into pricing reform. Admittedly, some pricing innovation has occurred. However, the move toward efficient costing and pricing has been slow. Part of this inertia can be attributed to the competitively sheltered status of the public-water sector.
A. The Deregulation of Water Utilities
Many economists view rate regulation as necessary and in the public interest when a firm provides an essential service under natural monopoly conditions. Public-water supply is considered an essential service, and water utilities are considered as natural monopolies: for a specific geographical area, water service typically can be provided more efficiently by one supplier, as opposed to multiple suppliers.
As a result, the appropriate scope of rate regulation emerges as a paramount issue.35 For example, what is the appropriate extent of regulatory protection for customers (sometimes referred to as captive) having relatively price-inelastic demands In determining the appropriate extent of rate regulation, the benefits of regulation, such as minimizing price discrimination and cross-subsidization, must be balanced against the economic costs of rate regulation, such as the resources expended by both regulatory agencies and by regulated firms.
Deregulation in water service has generally involved either exemption from certain state commission procedures or exemption from state commission jurisdiction. One exemption criterion has been ownership; many states have exempted publicly owned systems from state jurisdiction. Another exemption criterion has been size; numerous states have exempted small investor-owned systems from state jurisdiction.
In telecommunications and energy, deregulation has been driven by technological change combined with competitive forces.36 In contrast, deregulation in public-water supply in some cases has been motivated by a state commission wanting to reduce its regulatory workload and in other cases by the potential cost savings to the state commission. Though deregulation can reduce a state commission's regulatory burden, it may simply result in a shift in regulatory burden from state to local government, including municipalities and counties.
Local rate regulation is an alternative to state regulation and, at first glance, may offer certain advantages:37
⋅ local regulation may be more attuned than state regulation to the requirements of the local water system—better information by local regulators provides the potential for better regulation; and
⋅ local regulation may provide more opportunities for consumers and the public to have input into the operation of the local system.
Nevertheless, these advantages may be offset by certain disadvantages:
⋅ local regulation can increase costs since regulatory decentralization can involve a duplication of effort and staff (one study estimated that decentralization of water and sewer utility regulation in Wisconsin could result in a 40 percent increase in overall regulatory costs38);
⋅ local regulation can increase the potential for discriminatory rates, particularly for those customers located outside the local jurisdiction; and
⋅ local regulation can contribute to political rate manipulation as well as cross-subsidization across customer classes and across other municipal services. The potential for price discrimination and cross-subsidization was an important factor in the initial creation of state public utility commissions.
Since regulation of small water systems can involve costs (funds expended in regulation by both agencies and firms) exceeding the benefits of their regulation, deregulation by exemption may be warranted. In essence, for very small water systems, the cost of regulatory compliance can be a substantial burden. The cost of rate-case preparation may actually deter some utilities from seeking legitimate relief for increased operating expenses. Reducing the scope of rate regulation can mean cost savings to the small water systems. However, given that the typical state commission devotes only a relatively small share of its resources to water
rate regulation, the potential cost savings from deregulation by exemption may not be substantial.39 In addition, the potential benefits of implementing efficient rates can be substantial for small water utilities and thus can exceed the costs of state regulation.
Selecting the best form as well as the best level of water-rate regulation must be done in the context of the relative efficiency of state versus local regulation; the effects on service reliability and quality; and the potential for price discrimination and cross-subsidization within and across customer classes. It may be inefficient to shift regulatory responsibility from state commissions to local agencies with the latter's inadequate resources and lack of expertise in water-rate regulation. Thus, it is appropriate to examine alternatives to deregulation by exemption.40
B. Reforming the Regulatory Process
Most of these alternatives focus on enhancing the cost effectiveness of state commission regulation. In each of these alternatives, commission oversight of water utilities is not entirely eliminated.
A procedural alternative is the simplification of water-rate regulation in the areas of rate filings, proceedings, operational reporting, and financial reporting. Selective simplification focuses on reducing bureaucratic costs and the time devoted to rate regulation. This can result in substantial savings to the regulated water utility.
Determination of rates-of-return on investment for investor-owned utilities consumes substantial regulatory and utility resources. A simplified method is the determination of a generic rate of return for similar investor-owned water utilities. In addition, regulatory commissions could select an indexing method that ties the permitted rate of return to a specific financial variable. For example, the rate-of-return could be linked to a rate on a specified Treasury bill.
There are nontraditional alternatives to deregulation. The "safe-harbor" approach involves the use of triggering mechanisms by which certain regulatory functions are either applied or temporarily eliminated. For example, rate regulation may be triggered only if rates and/or rates-of-return fall outside specified values. The safe-harbor approach is similar to selective exemption; however, it is more flexible due to the use of the triggering mechanisms.
Incentive regulation offers the greatest potential for reducing the inefficiencies associated with water-rate regulation.41 Incentive regulation provides utilities with incentives to achieve specified performance standards in a more efficient
manner. Most incentive- regulation programs have occurred in either the energy or telecommunications sectors.43 In many cases, the incentives have been implemented in an environment of partial deregulation.
Incentive regulation can take many forms. However, each form generally incorporates a mechanism by which utilities are induced to increase efficiency via a system of rewards and penalties.43 One form is price-cap regulation.44 This type of incentive regulation generally involves agreements between commissions and utilities in which the latter agrees to provide certain basic services at stabilized rates (for a specific time period) in exchange for rate-of-return deregulation. The intent is to provide incentives to the utility to increase cost efficiency. Price-cap regulation, by unbundling rates from costs, provides an incentive to the utility to reduce costs and thus increase its rate-of-return, while at the same time providing temporary consumer price protection. Price-cap regulation is being applied in the United Kingdom to the water and wastewater sectors that were privatized in 1989.
An incentive form similar to price-cap regulation is cost indexing. Cost indexing generally involves rates being increased automatically on the basis of a specified cost index. For some state commissions including the California PUC, indexing involves allowing annual rate increases based on the Consumer Price Index. Cost indexing provides an efficiency incentive since utilities are encouraged to have actual costs increase less than indexed costs. If this occurs, the utility retains the cost savings. Conversely, if actual costs increase more than indexed costs, then the utility bears these excess costs without cost recovery. Cost indexing has been applied to the regulation of the recently privatized telephone industry in the United Kingdom.
Another form of incentive regulation is incentive rates-of-return. Under this form, the utility is permitted to earn a premium return on investment if it is deemed to be efficient by certain specified standards. Or, an inefficient utility is penalized by being constrained to earning a lower rate-of-return on investment. For example, if unit costs are below some predefined standard, the permitted return is set above a normal rate of return; if unit costs exceed the predefined standard, the permitted return is set below the normal rate of return. This form of incentive regulation has been applied in both the electricity and telecommunications sectors in the United States.45
A final type of incentive regulation is construction-cost incentive programs. For example, commissions may set a target cost that the utility is permitted to recover on new capacity. The utility has the incentive to examine alternative sources of capacity, including both new owned facilities and privatization. This
form of incentive regulation has been applied to construction of nuclear plants in several states.46
VI. POLICY RECOMMENDATIONS
Monopoly regulation, as exemplified by state and local regulation of public water firms, can create allocative or usage inefficiency flowing from poorly designed water rates, technical or cost inefficiency resulting from water utilities having little incentive to minimize provision costs, and regulatory inefficiency flowing from the unnecessary usage of regulatory resources. Several policies address these inefficiencies.
A. Integrate Incremental Costing into Rate Design
Regulators should integrate the average and marginal cost approaches in water-rate design. Average cost could be used in allocating revenue requirements to specific customer classes and services. That is, average, embedded cost would determine rate levels for individual classes and services. Marginal cost could be used for designing actual rate structures for individual classes and services.
For example, seasonal estimates of marginal operating cost (MOC) and marginal capacity cost (MCC) could be important standards in developing seasonal rate structures; zonal estimates of MOC and MCC could be important inputs in developing zonal rate structures. An alternative approach is to use average cost to develop the total revenue requirements of the water utility and then employ marginal cost as the basis for allocating costs to customer classes.
B. Enhance Efficiency Through Rate and Financing Innovations
Several financing and pricing initiatives can enhance efficiency in public-water provision. Each initiative can make public-water provision more efficient (with price and usage more closely reflecting the cost of providing additional water). The initiatives focus on the cost-causation standard, whereby consumers who cause certain costs should pay for those costs. The five pricing-related initiatives include:
⋅ Seasonal Pricing, which recognizes that the unit cost of water provision in peak- demand periods exceeds the unit cost of provision in off-peak periods;
⋅ Zonal Pricing, which recognizes that the unit cost of providing water service can vary substantially for customers at different locations within the utility service area;
⋅ Conservation Surcharges, which recognize that conservation is a means of avoiding expensive capacity expansion;
⋅ Availability Charges, which recognize that future (but presently unconnected) customers cause certain costs to be incurred, prior to their actually being provided water service; and
⋅ System-development Charges, which recognize that newly connected customers impose certain costs on the water system.
C. Apply Incentive Regulation
Incentive regulation provides utilities with incentives to operate more efficiently by weakening the incentive to inflate costs inherent in traditional rate regulation. Four forms of incentive regulation include:
⋅ Price caps, which work by allowing a utility to provide basic services at stabilized rates for a specific time period, in exchange for rate-of-return deregulation. Price-cap regulation provides an incentive to the investor-owned utility to reduce costs and thus increase its rate of return;
⋅ Cost indexing, which involves rates being increased automatically on the basis of a specified cost index. Cost indexing would provide an efficiency incentive in that utilities strive to have actual costs increase less than indexed costs, so as to retain the cost savings;
⋅ Incentive rates of return, which allow the investor-owned utility to earn a premium return on investment if it is deemed to be efficient by certain standards. Conversely, an inefficient water utility would be penalized by being constrained to earning a lower rate of return on investment; and
⋅ Construction-cost incentive programs, which involve regulators setting cost targets that the utility is permitted to recover on new capacity. The water utility would be provided the incentive to examine alternatives including both new publicly owned facilities as well as new privately owned facilities.
In addition, several incentive mechanisms, by eliminating the bias toward supply-side investment in public-water provision, would be compatible with
demand-side or conservation investment.47 One regulatory incentive is a revenue-adjustment mechanism that would preclude unanticipated changes in usage from affecting water utility earnings. Alternatively, fixed or capacity costs could be allocated to a service charge. Another incentive is equal regulatory treatment of supply-side and demand-side investment.48
A procedure closely related to incentive regulation is the pre-approval approach to rate regulation.49 The pre-approval concept is a mechanism for the recovery of capital expenditures. It involves a contract between the utility and the regulatory agency in which rate-making treatment for a specified capital expenditure is determined prior to actual construction. For example, a surcharge could be preset for implementation at the in-service date of the facility. By eliminating regulatory lag, the pre-approval approach provides an incentive for demand-side and water-quality investment.
D. Implement Selective Deregulation
Selective deregulation can save state regulatory resources while simultaneously reducing the regulatory burden on smaller water utilities. The minimum-exclusion or exemption size should be established on a jurisdiction-by-jurisdiction basis, employing the benchmark of regulatory costs versus regulatory benefits. Given the existence of the large number of very small water utilities, the exemptions may not only involve size thresholds but also may vary as to regulatory function. For example, rate regulation may be eliminated for some small water systems while still requiring financial and operating reports; for the very small systems, both rate regulation and reporting may be eliminated.
E. Implement Selective Regulation
State regulation should be extended to the larger publicly owned systems in those states where state regulation is presently restricted to investor-owned systems. This selective regulation would reduce the less-than-full-cost rate-making associated with local regulation of publicly owned water utilities as well as reduce the subsidization of local water rates.
The minimum exemption size for publicly owned water utilities should be established on a jurisdiction-by-jurisdiction basis, employing the benchmark of regulatory costs versus regulatory benefits. Again, the exemptions may involve both size thresholds and may vary as to regulatory function. There is only limited evidence that state regulation is an effective means of curbing the inefficiencies inherent in public ownership. However, reformed state regulation has potential for achieving this result.
VII. CONCLUSION
Each of these policy prescriptions involves certain implementation problems. Both state and local regulators must address these application problems prior to any experimentation with rate innovation. The historically slow adoption of water pricing and costing changes suggests that future progress, for both publicly owned and privately owned water utilities, is likely to face significant obstacles.
Because publicly owned utilities generally face less regulatory and financial constraints than investor-owned utilities, the former might appear to be the more immediate vehicle for water-rate innovation. Yet the very fact that publicly owned utilities face less stringent financial controls (from capital markets), are less likely to go bankrupt, and are more exposed to political interference, indicates that they are likely to have weaker incentives to innovate.
In contrast, while investor-owned water utilities may have stronger incentives to adopt efficient pricing and costing practices, they are also subject to more extensive rate regulation and face a greater need consistently to earn revenues that cover their full costs. As a result, investor-owned utilities have considerably less flexibility to adjust to the adverse financial effects that can result from rate innovation. For example, imposition of a penalty or conservation tariff may create destabilizing revenues and may seriously harm a company's financial position and hence, its ability to raise capital.
Recognition of these impediments to rate reform highlights the need to replace traditional "cost-of-service" rate regulation with some form of incentive regulation that gives water utilities both the freedom and the incentive to adopt more-efficient practices. Neither managers of publicly owned or privately owned water utilities are likely to search out and adopt new pricing and costing practices unless they, their consumers, and (in the case of investor-owned utilities) shareholders, are able to share in the savings generated.
In brief, regulatory policy will play a major role in determining the pace and direction of costing, rate, and financing innovations.
ABOUT THE AUTHOR
Patrick C. Mann is a Professor of Economics in the College of Business and Economics, West Virginia University, Morgantown, West Virginia; and an Institute Associate at the National Regulatory Research Institute, Ohio State University, Columbus, Ohio.
ACKNOWLEDGEMENTS
The author is indebted to Janice A. Beecher, David C. Campbell, Don M. Clark, Fred L. Curry, David Haarmeyer, Wendy L. Illingworth, T.G. McKitrick, David Russell, and Lynn Scarlett for their instructive comments on earlier drafts of this paper. The author is also indebted to Jason Mann for research assistance on several sections of the paper. All errors are the responsibility of the author. The views expressed in this paper are solely those of the author and do not represent those of either West Virginia University or the National Regulatory Research Institute.
ENDNOTES AND REFERENCES
1. Jerome W. Milliman, "Policy Horizons for Future Urban Water Supply," Land Economics, Vol. 39, May 1963, pp. 109-132.
2. Patrick C. Mann and Paul R. LeFrancois, "Trends in the Real Price of Water," American Water Works Association Journal, Vol. 75, September 1983, pp. 441-443.
3. David F. Russell and Christopher P.N. Woodcock, "What Will Water Rates be Like in the 1990s," American Water Works Association Journal, Vol. 84, September 1992, pp. 68-72.
4. Wayne B. Solley, Charles F. Merk, and Robert R. Pierce, Estimated Use of Water in the United States in 1985, Washington, D.C., United States Geological Survey, 1988, pp. 69-70.
5. James P. McFarland, John E. Cromwell, Elizabeth L. Tam, and David W. Schnare, "Assessment of the Total National Cost of Implementing the 1986 SDWA Amendments," Proceedings of the Seventh Biennial Regulatory Information
Conference, Columbus, Ohio, The National Regulatory Research Institute, 1990, pp. 281-301.
6. Rate Structures to Promote Conservation, New York, New York, Delaware River Basin Commission and the New York City Water Board, 1991, pp. xi-xii.
7. Frederick W. Immerman, Final Descriptive Summary 1986 Survey of Community Water Systems, Washington, D.C., Office of Drinking Water, United States Environmental Protection Agency, October 1987, pp. 1-97.
8. Janice A. Beecher and Patrick C. Mann, Deregulation and Regulatory Alternatives for Water Utilities, Columbus, Ohio, The National Regulatory Research Institute, February 1990, pp. 21-38.
9. Janice A. Beecher and Ann P. Laubach, 1989 Survey on State Commission Regulation of Water and Sewer Systems, Columbus, Ohio, The National Regulatory Research Institute, May 1989, pp. 1-59.
10. American Water Works Association, Revenue Requirements, Denver, Colorado, American Water Works Association, AWWA Manual M35, 1990, pp. 1-7.
11. Janice A. Beecher and Patrick C. Mann, Cost Allocation and Rate Design for Water Utilities, Columbus, Ohio, The National Regulatory Research Institute, 1990, pp. 35-62.
12. American Water Works Association, Water Rates, Denver, Colorado, American Water Works Association, AWWA Manual M1, Fourth Edition, 1991, pp. 9-31.
13. 1990 National Water and Wastewater Rate Survey, Charlotte, North Carolina, Ernst and Young, 1990, pp. 45-55.
14. Sue McClurg, "Urban Water Costs," Western Water, April 1992, pp. 4-11.
15. J. Robert Malko and Terrence B. Nicolai, "Using Accounting and Marginal Cost in Electricity Rate Design," Proceedings of the 1985 Rate Symposium on Problems of Regulated Industries, Columbia, Missouri, University of Missouri, 1985, pp. 168-182.
16. Patrick C. Mann and Donald L. Schlenger, "Marginal Cost and Seasonal Pricing of Water Service," American Water Works Association Journal, Vol. 74, January 1982, pp. 6-11.
17. Ralph Turvey, "Analyzing the Marginal Cost of Water Supply," Land Economics, Vol. 52, May 1976, pp. 158-168.
18. Patrick C. Mann, Robert J. Saunders, and Jeremy J. Warford, "A Note on Capital Indivisibility and the Definition of Marginal Cost," Water Resources Research, Vol. 16, June 1980, pp. 602-604.
19. Steve H. Hanke, "On the Marginal Cost of Water Supply," Water Engineering and Management, Vol. 120, February 1981, pp. 60-63.
20. William H. Melody, "Interservice Subsidy: Regulatory Standards and Applied Economics," Essays on Public Utility Regulation, Harry M. Trebing, editor, East Lansing, Michigan, Institute of Public Utilities, Michigan State University, 1971, pp. 167-210.
21. Jarir S. Dajani, "Cost Studies of Urban Public Services," Land Economics, Vol. 49, November 1973, pp. 479-483.
22. Robert M. Clark, "Cost and Pricing Relationships in Water Supply," Journal of Environmental Engineering Division - ASCE, Vol. 102, April 1976, pp. 361-373; "Water Supply Economics," Journal of Urban Planning and Development Division - ASCE, Vol. 102, August 1976, pp. 213-224; "Water Supply Regionalization: A Critical Evaluation," Journal of Water Resources Planning and Management Division-ASCE, Vol. 105, September 1979, pp. 89-100.
23. Robert M. Clark and Richard G. Stevie, "A Water Supply Cost Model Incorporating Cost Variables," Land Economics, Vol. 57, February 1981, pp. 18-32; "A Regional Water Supply Cost Model," Growth and Change, Vol. 12, July 1981, pp. 9-16.
24. George A. Raftelis, Water and Wastewater Finance and Pricing, Chelsea, Michigan, Lewis Publishers, 1989, pp. 3-7.
25. Steve H. Hanke, "A Method for Integrating Engineering and Economic Planning," American Water Works Association Journal, Vol. 71, September 1978, pp. 487-491.
26. Frank Gradilone, III and Mark R. Rothenberg, "Seasonal Rates—The Pros and Cons: A Case Study," Paper to be presented at the American Society of Civil Engineers Conference on Water Resources: Planning and Management 1993, Seattle, Washington, May 3-5, 1993.

27. Patrick C. Mann and Donald L. Schlenger, "Marginal Cost and Seasonal Pricing of Water Service," American Water Works Association Journal, Vol. 74, January 1982, pp. 6-11.
28. John D. Russell, "Seasonal and Time of Day Pricing," AWWA Seminar Proceedings: Water Rates: An Equitability Challenge, Denver, Colorado, American Water Works Association, 1983, pp. 90-96.
29. Donald L. Schlenger, "Developing Water Utility Cost Estimates Incorporating Spatial Factors," Proceedings of the Symposium on Costing for Water Supply, Thomas M. Walski, Editor, Washington, D.C., United States Corps of Army Engineers, 1983, pp. 40-55.
30. Patrick C. Mann and Don M. Clark, "Water Costing, Pricing and Conservation," Proceedings of the Eighth Biennial Regulatory Information Conference, Columbus, Ohio, The National Regulatory Research Institute, 1992.
31. Patrick C. Mann, Testimony as to the Rates and Charges of the Spring Valley Water Company, New York Public Service Commission Case No. 89-W-1151, Phase 2, 1991, pp. 27-41.
32. American Water Works Association, Water and Related Charges, Denver, Colorado, American Water Works Association, AWWA Manual M26, First Edition, 1986, pp. 1-4.
33. American Water Works Association, Water and Related Charges, Denver, Colorado, American Water Works Association, AWWA Manual M26, First Edition, 1986, pp. 12-20.
34. Drew S. Barden and Russell J. Stepp, "Computing Water System Development Charges," American Water Works Association Journal, Vol. 76, September 1984, pp. 42-46.
35. Paul F. Levy, "Problems Confronting State Commissions Under Deregulation," The Impact of Deregulation and Market Forces on Public Utilities: The Future Role of Regulation, Patrick C. Mann and Harry M. Trebing, editors, East Lansing, Michigan, The Institute of Public Utilities, Michigan State University, 1985, pp. 3-8.
36. Robert F. Keegan and Paul F. Levy, "Options for Modifying Rate Base Regulation," New Regulatory and Management Strategies in a Changing Market Environment, Harry M. Trebing and Patrick C. Mann, editors, East Lansing, Michigan, The Institute of Public Utilities, Michigan State University, 1987, pp. 3-21.
37. Janice A. Beecher and Patrick C. Mann, Deregulation and Regulatory Alternatives for Water Utilities, Columbus, Ohio, The National Regulatory Research Institute, February 1990, pp. 1-19.
38. Paul R. Lenz, Municipal Water and Sewer Utilities: Should Their Regulation be Decentralized, Madison, Wisconsin, The Wisconsin Public Service Commission, August 1986, pp. 1-32.
39. Raymond W. Lawton and Vivian Witkind Davis, Commission Regulation of Small Water Utilities: Some Issues and Solutions, Columbus, Ohio, The National Regulatory Research Institute, May 1983, pp. 9-29.
40. Janice A. Beecher and Patrick C. Mann, Deregulation and Regulatory Alternatives for Water Utilities, Columbus, Ohio, The National Regulatory Research Institute, February 1990, pp. 79-102.
41. Patrick C. Mann, "Incentive Regulation for Commission Regulated Water Utilities," Proceedings of the Seventh NARUC Biennial Regulatory Information Conference, Columbus, Ohio, The National Regulatory Research Institute, 1990, pp. 229-245.
42. Paul R. Joskow and Richard Schmalensee, "Incentive Regulation for Electric Utilities," Yale Journal on Regulation, Vol. 4, Fall 1986, pp. 1-49.
43. Robert F. Wilson, "The Role of Regulation in Increasing the Productivity of Utilities," Proceedings of the Fifth NARUC Biennial Regulatory Information Conference, Columbus, Ohio, The National Regulatory Research Institute, 1986, pp. 789-829.
44. Douglas N. Jones, A Perspective on Social Contract and Telecommunications Regulation, Columbus, Ohio, The National Regulatory Research Institute, June 1987, pp. 1-24.
45. Patrick C. Mann, "Incentive Regulation for Commission Regulated Water Utilities," Proceedings of the Seventh NARUC Biennial Regulatory Information Conference, Columbus, Ohio, The National Regulatory Research Institute, 1990, pp. 229-245.
46. Paul R. Joskow and Richard Schmalensee, "Incentive Regulation for Electric Utilities," Yale Journal on Regulation, Vol. 4, Fall 1986, pp. 1-49.
47. Stephen Weil, "Making Electric Efficiency Profitable," Public Utilities Fortnightly, Vol. 124, July 6, 1989, pp. 9-16.

48. Amy Vickers and Edward J. Markus, "Creating Economic Incentives for Conservation," American Water Works Association Journal, Vol. 84, October 1992, pp. 42-45.
49. Keith W. Bossung, "The Pre-Approval Approach to Ratemaking: The Massachusetts Experience," New England Water Works Association Journal, Vol. 105, September 1991, pp. 165-168.