Embed Size (px)
Citation preview
The Association between Air Pollution and Population Health Risk in China based on
Spatiotemporal analysis
An ZhangInstitute of Geographical Sciences and Natural Resources Research, Chinese Academy of ScienceCenter for Geographic Analysis, Harvard University
2019-03-28
Geography Colloquium The Center for Geographic Analysis, Harvard University

Curriculum Vitae
Email [email protected] [email protected]
http://orcid.org/0000-0002-9338-6250
Education Ph.D., GIS, Chinese Academy of Science, 2008.
M.A, Demography, Sun Yat-sen University, 2005. B.S, Geosciences, Fujian Normal University, 2003.
My main research interest is demography and public health study based on Geographical Information System. I am particularly focused on the study of dynamic population estimation model and public health spatiotemporal analysis. I am working with Prof. Peter Bol on the spatial and temporal analysis of China’s Census and physical geographical features during the visit to the CGA, Harvard.
Associate Professor , Institute of Geographical Sciences and Natural Resources Research, Chinese Academy of Science.Visiting Scholar, Center for Geographic Analysis, Harvard University
Ask
Acquire
ExploreAnalyze
Act
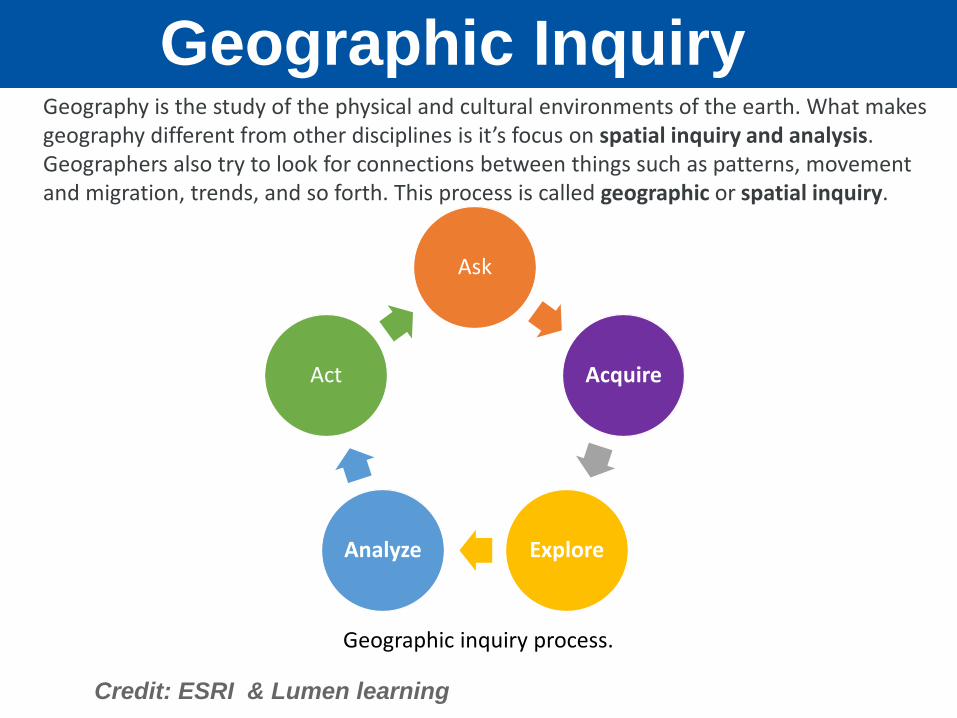
Geographic InquiryGeography is the study of the physical and cultural environments of the earth. What makes geography different from other disciplines is it’s focus on spatial inquiry and analysis. Geographers also try to look for connections between things such as patterns, movement and migration, trends, and so forth. This process is called geographic or spatial inquiry.
Geographic inquiry process.
Credit: ESRI & Lumen learning
Ask
Acquire
ExploreAnalyze
Act
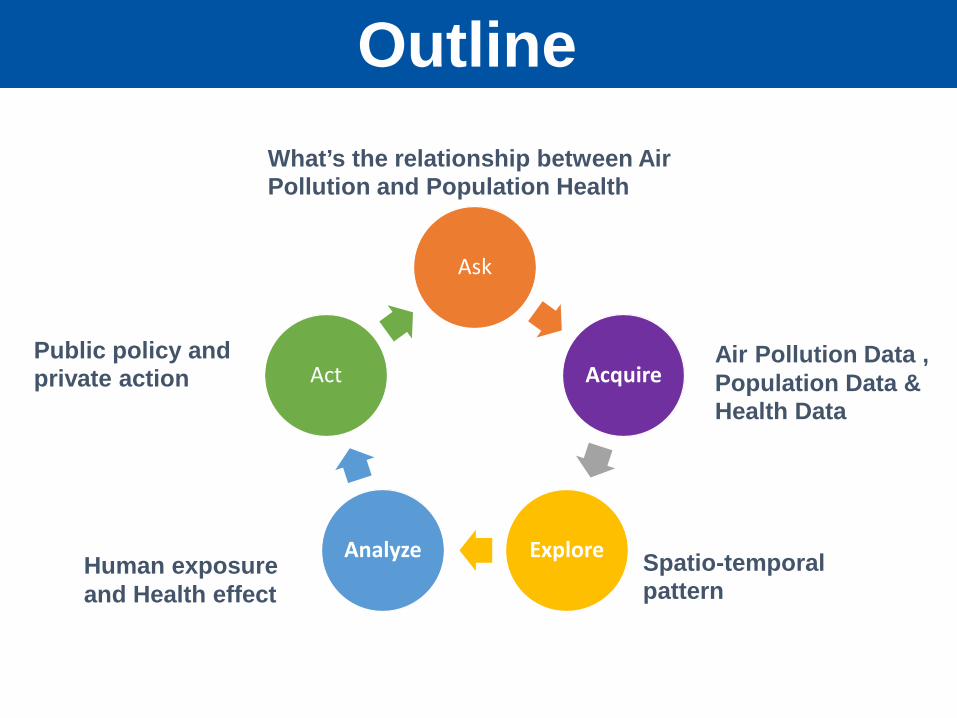
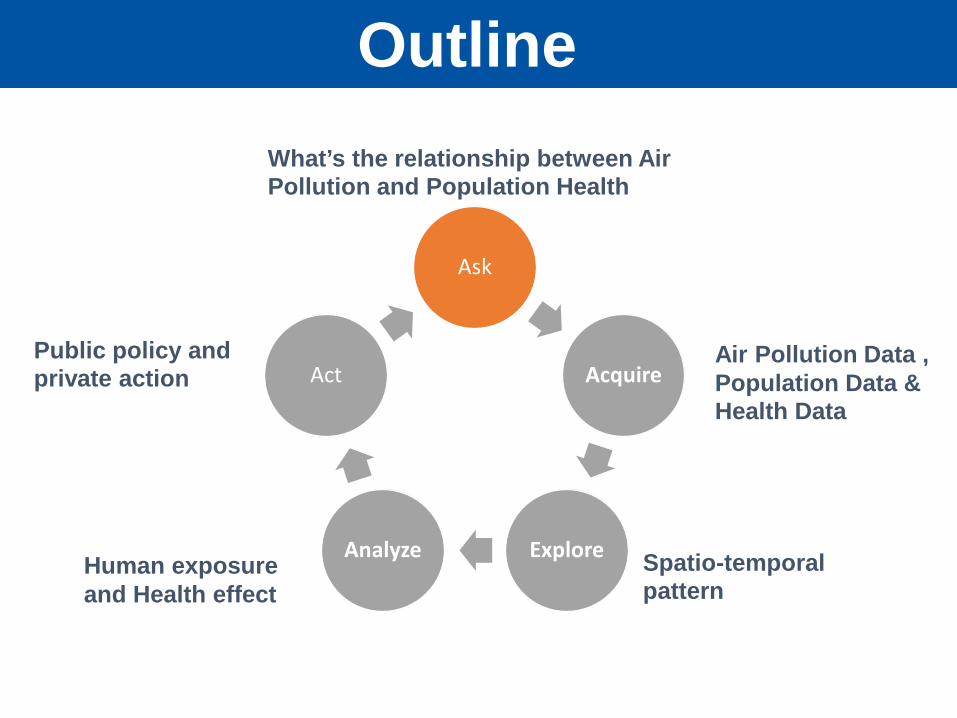
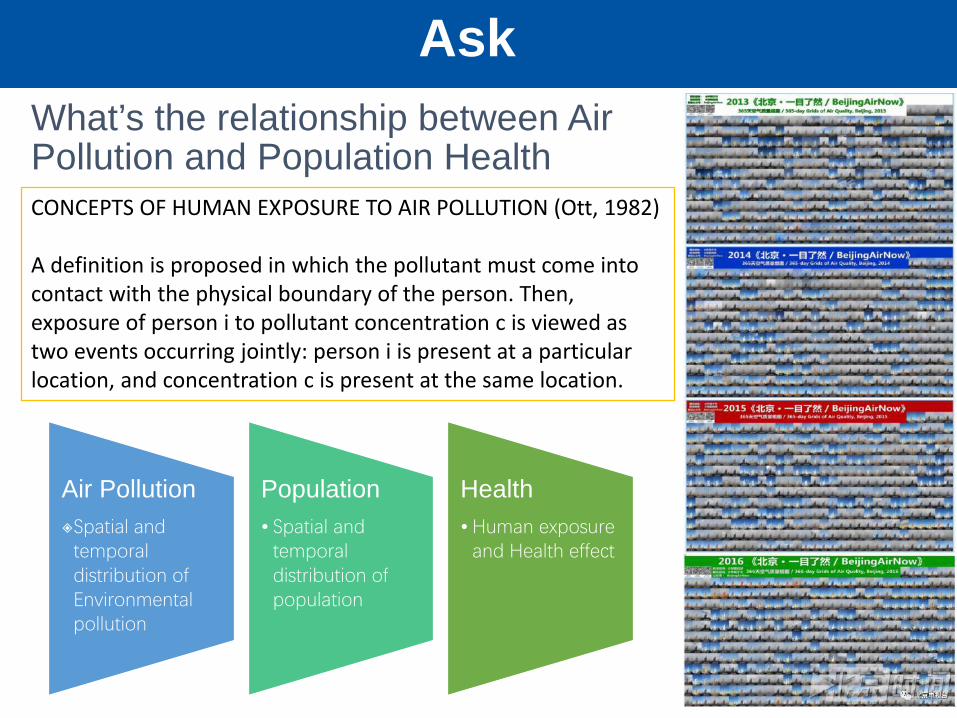
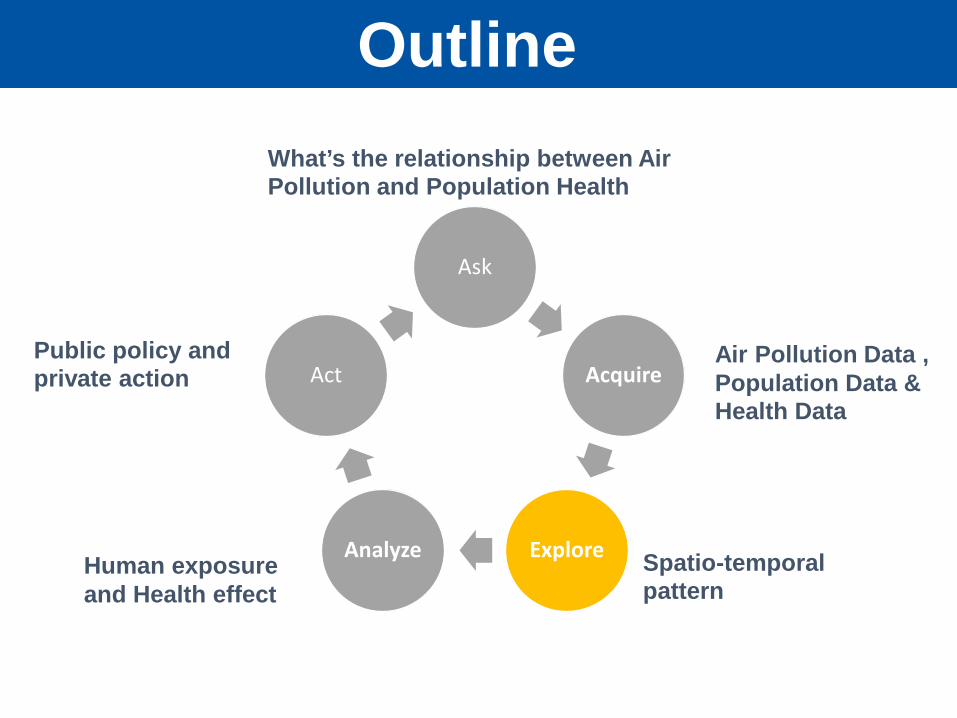
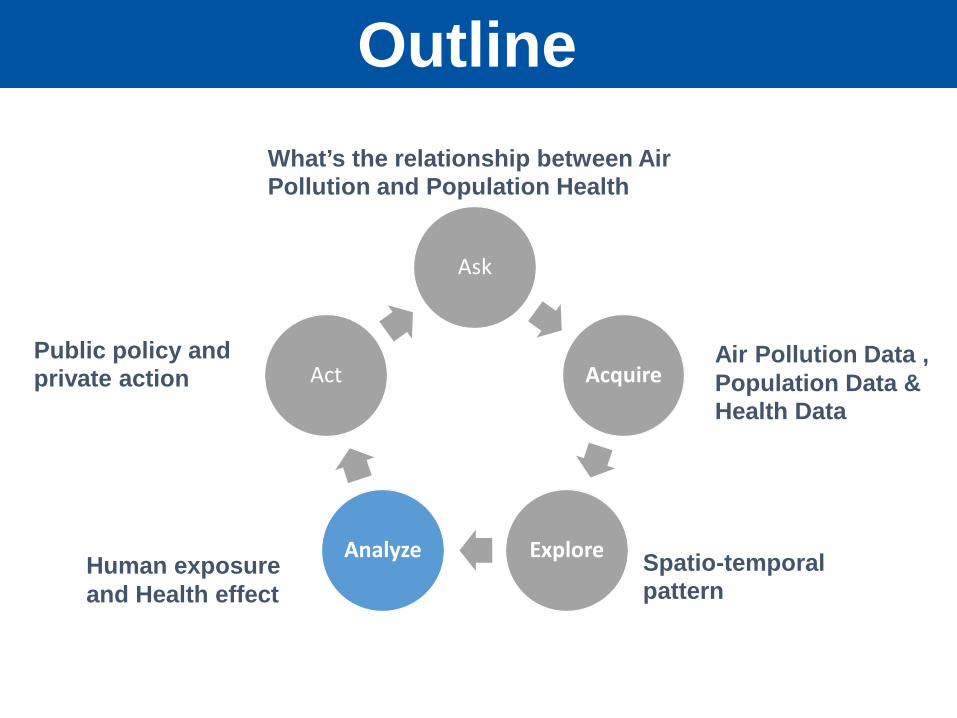
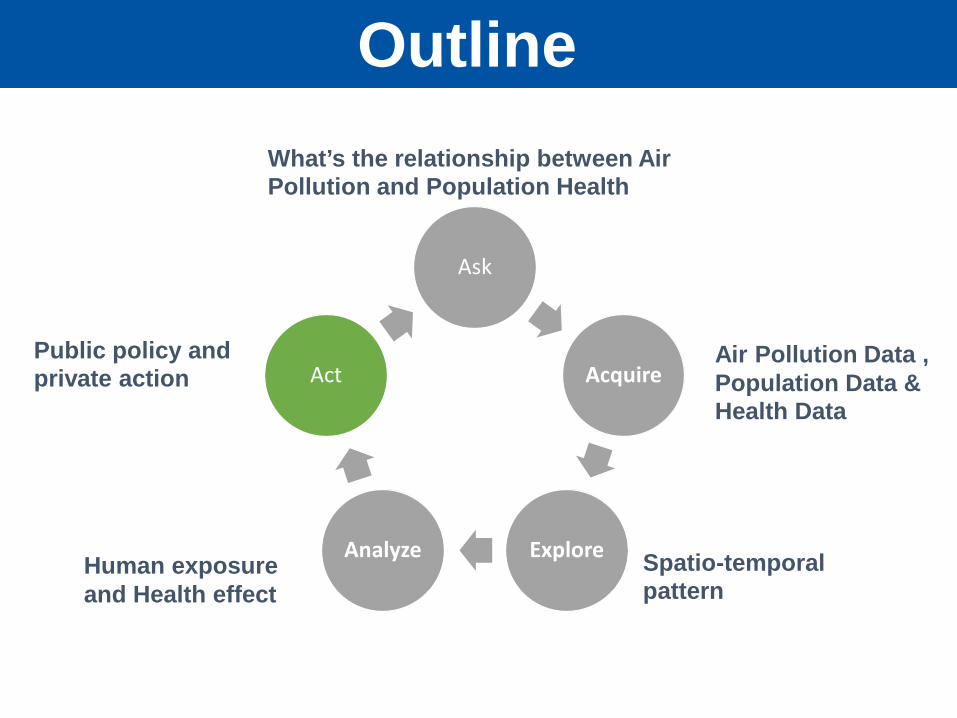
What’s the relationship between Air Pollution and Population Health
Outline
Air Pollution Data ,Population Data & Health Data
Spatio-temporal pattern
Human exposure and Health effect
Public policy and private action
Ask
Acquire
ExploreAnalyze
Act
What’s the relationship between Air Pollution and Population Health
Outline
Air Pollution Data ,Population Data & Health Data
Spatio-temporal pattern
Human exposure and Health effect
Public policy and private action
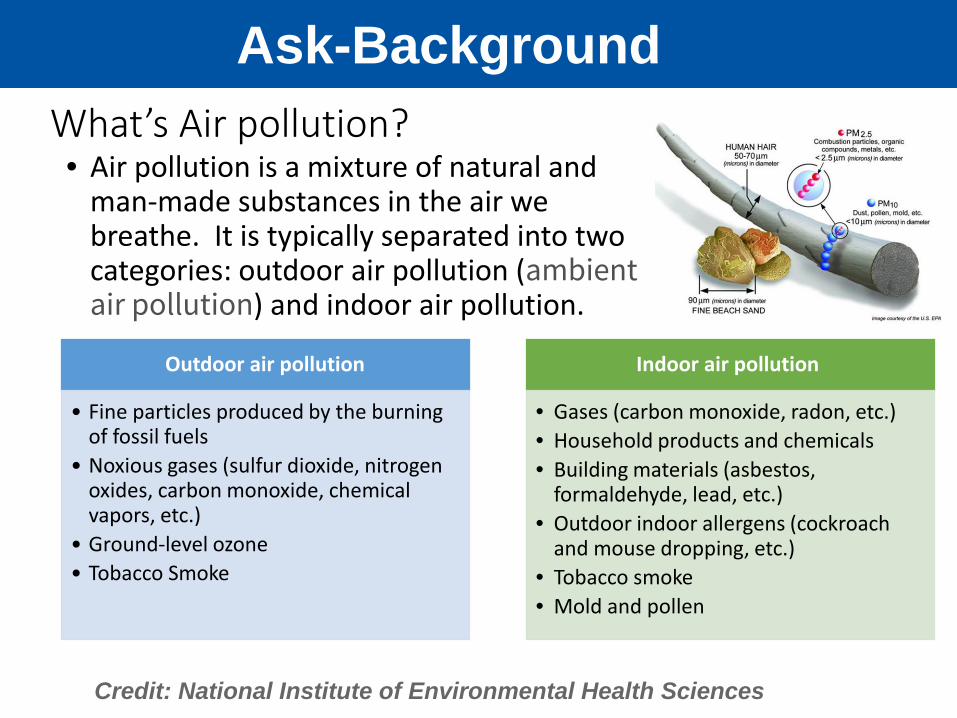
What’s Air pollution?• Air pollution is a mixture of natural and
man-made substances in the air we breathe. It is typically separated into two categories: outdoor air pollution (ambient air pollution) and indoor air pollution.
Outdoor air pollution
• Fine particles produced by the burning of fossil fuels
• Noxious gases (sulfur dioxide, nitrogen oxides, carbon monoxide, chemical vapors, etc.)
• Ground-level ozone • Tobacco Smoke
Indoor air pollution
• Gases (carbon monoxide, radon, etc.)• Household products and chemicals• Building materials (asbestos,
formaldehyde, lead, etc.)• Outdoor indoor allergens (cockroach
and mouse dropping, etc.)• Tobacco smoke• Mold and pollen
Credit: National Institute of Environmental Health Sciences
Ask-Background
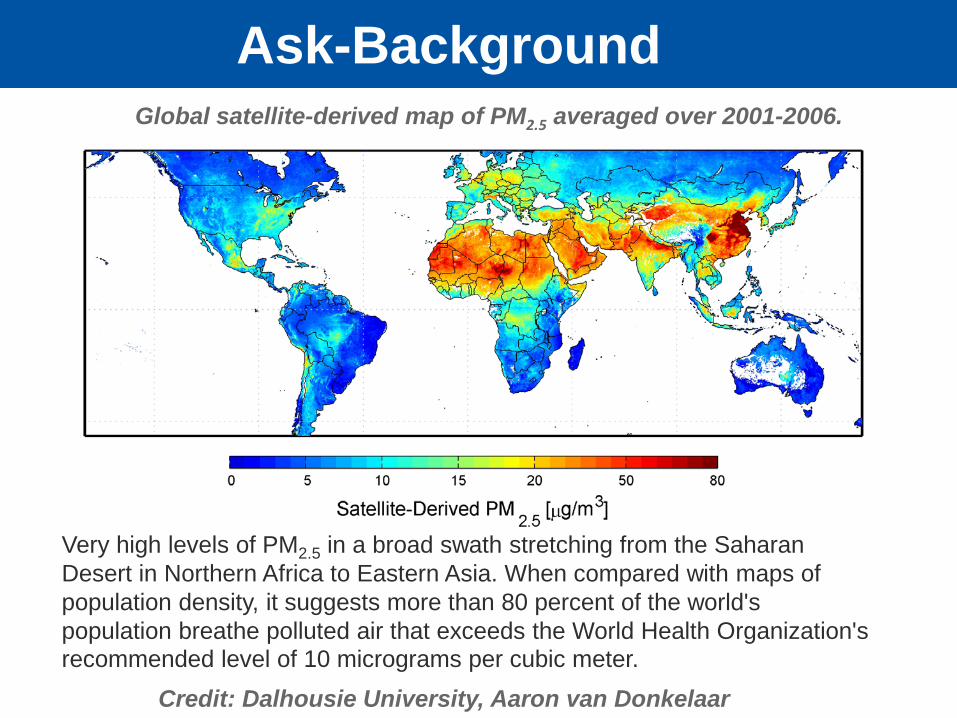
Global satellite-derived map of PM2.5 averaged over 2001-2006.
Credit: Dalhousie University, Aaron van Donkelaar
Ask-Background
Very high levels of PM2.5 in a broad swath stretching from the Saharan Desert in Northern Africa to Eastern Asia. When compared with maps of population density, it suggests more than 80 percent of the world's population breathe polluted air that exceeds the World Health Organization's recommended level of 10 micrograms per cubic meter.
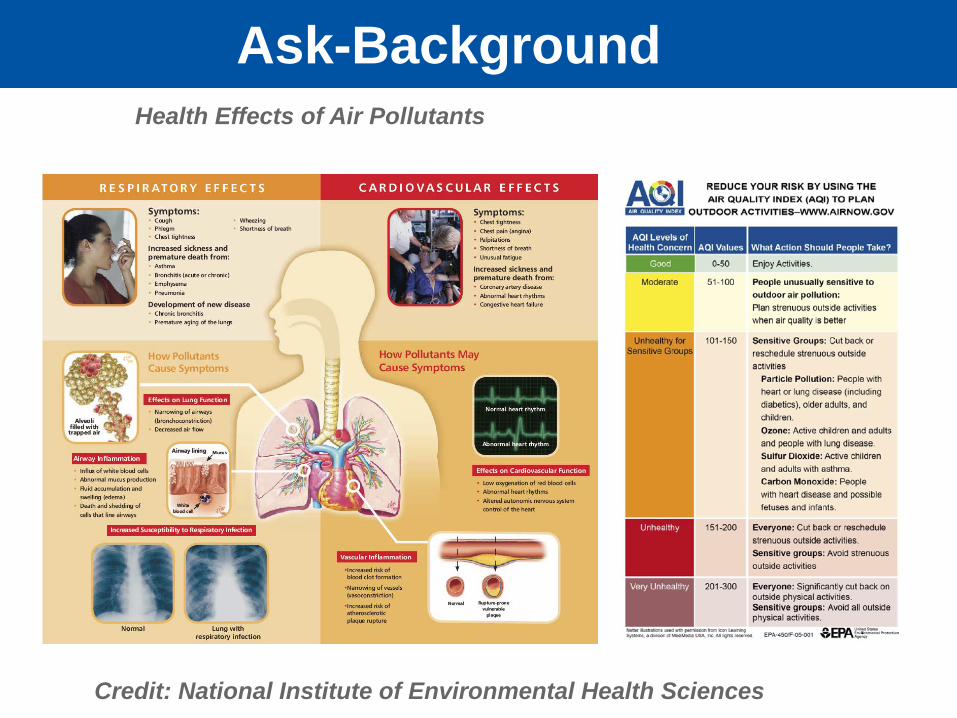
Health Effects of Air Pollutants
Ask-Background
Credit: National Institute of Environmental Health Sciences
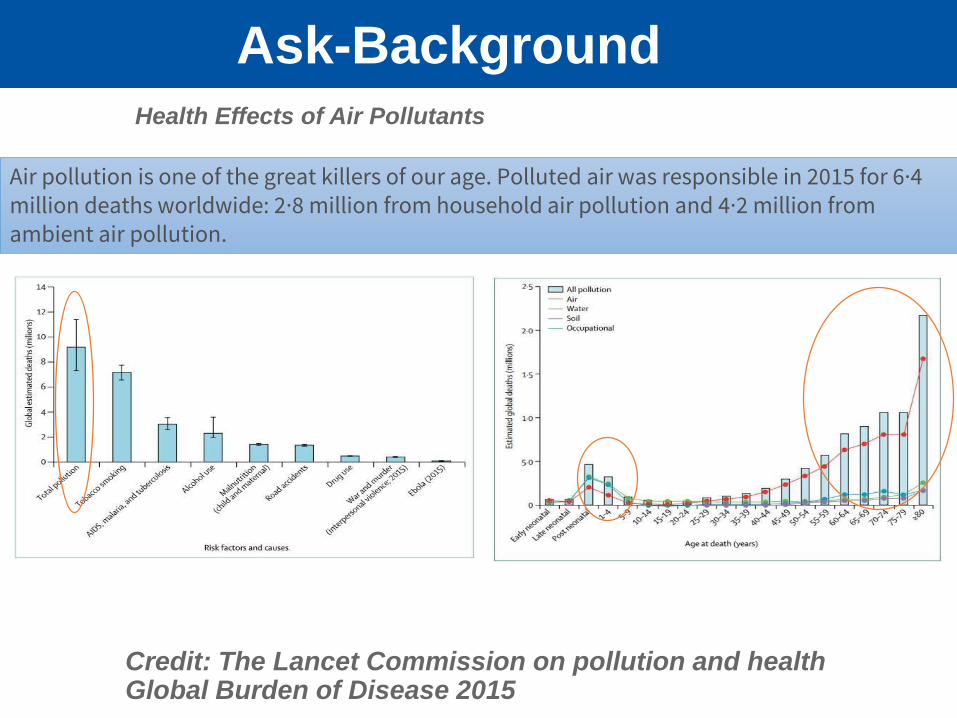
Air pollution is one of the great killers of our age. Polluted air was responsible in 2015 for 6·4 million deaths worldwide: 2·8 million from household air pollution and 4·2 million from ambient air pollution.
Credit: The Lancet Commission on pollution and healthGlobal Burden of Disease 2015
Ask-BackgroundHealth Effects of Air Pollutants
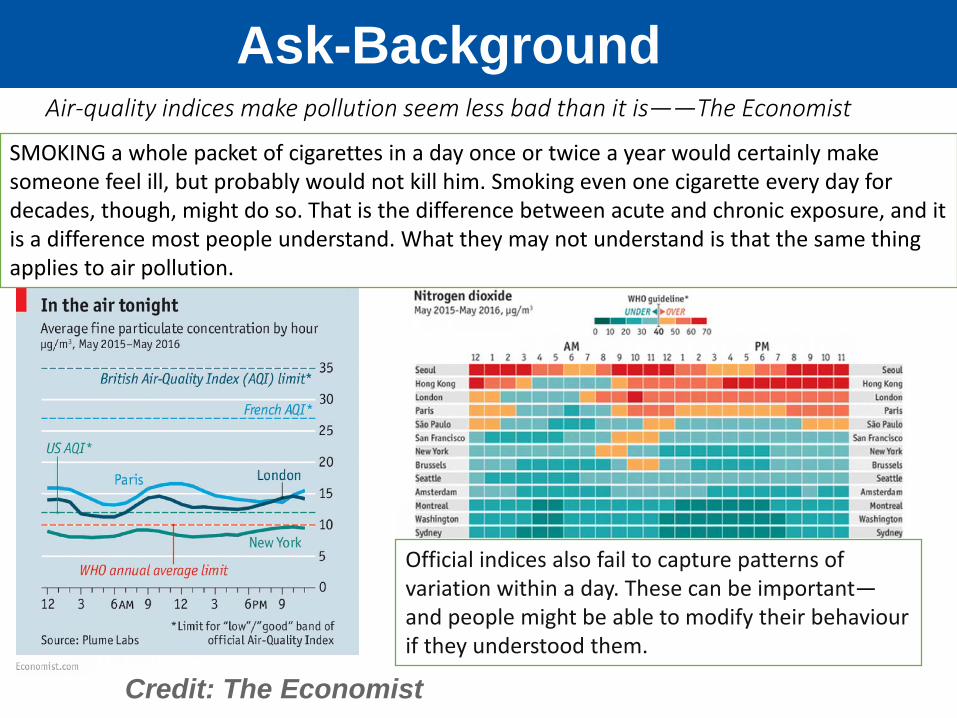
Air-quality indices make pollution seem less bad than it is——The Economist
Official indices also fail to capture patterns of variation within a day. These can be important—and people might be able to modify their behaviourif they understood them.
SMOKING a whole packet of cigarettes in a day once or twice a year would certainly make someone feel ill, but probably would not kill him. Smoking even one cigarette every day for decades, though, might do so. That is the difference between acute and chronic exposure, and it is a difference most people understand. What they may not understand is that the same thing applies to air pollution.
Ask-Background
Credit: The Economist
What’s the relationship between Air Pollution and Population Health
Ask
Air PollutionSpatial and
temporal distribution of Environmental pollution
Population• Spatial and
temporal distribution of population
Health • Human exposure
and Health effect
CONCEPTS OF HUMAN EXPOSURE TO AIR POLLUTION (Ott, 1982)
A definition is proposed in which the pollutant must come into contact with the physical boundary of the person. Then, exposure of person i to pollutant concentration c is viewed as two events occurring jointly: person i is present at a particular location, and concentration c is present at the same location.
Ask
Acquire
ExploreAnalyze
Act
What’s the relationship between Air Pollution and Population Health
Outline
Air Pollution Data ,Population Data & Health Data
Spatio-temporal pattern
Human exposure and Health effect
Public policy and private action
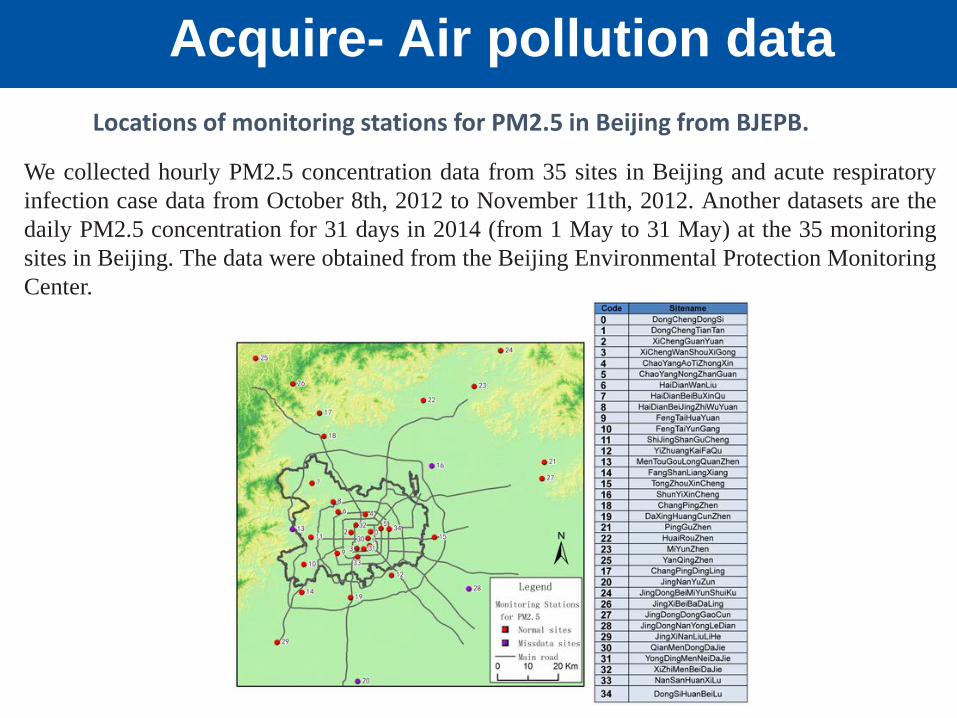
Locations of monitoring stations for PM2.5 in Beijing from BJEPB.
Acquire- Air pollution data
We collected hourly PM2.5 concentration data from 35 sites in Beijing and acute respiratoryinfection case data from October 8th, 2012 to November 11th, 2012. Another datasets are thedaily PM2.5 concentration for 31 days in 2014 (from 1 May to 31 May) at the 35 monitoringsites in Beijing. The data were obtained from the Beijing Environmental Protection MonitoringCenter.
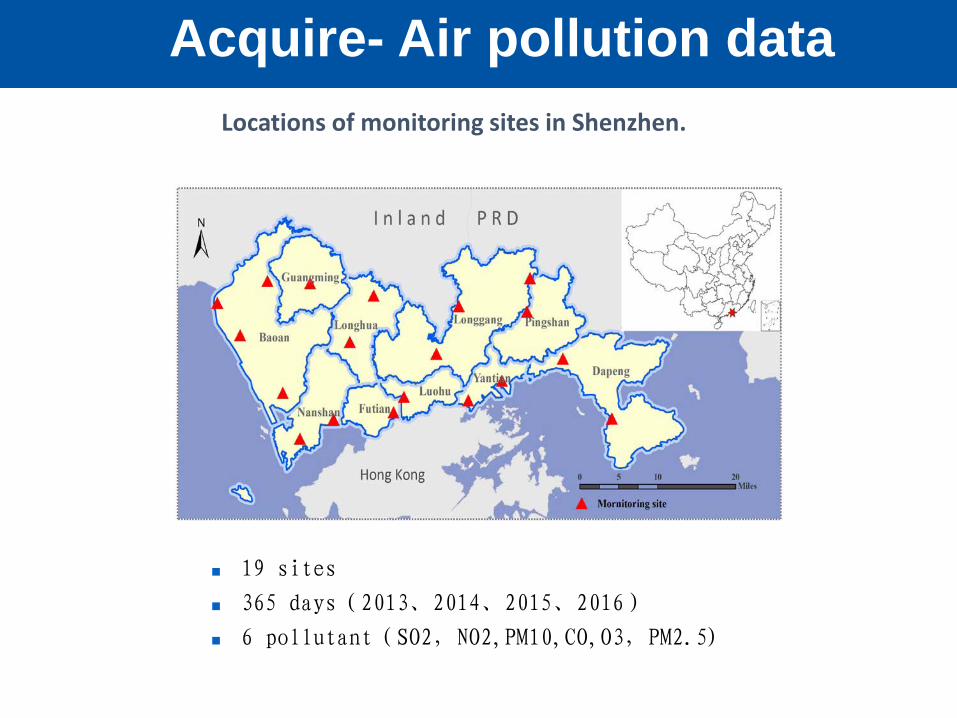
Locations of monitoring sites in Shenzhen.
Acquire- Air pollution data
19 sites
365 days(2013、2014、2015、2016)
6 pollutant(SO2,NO2,PM10,CO,O3,PM2.5)
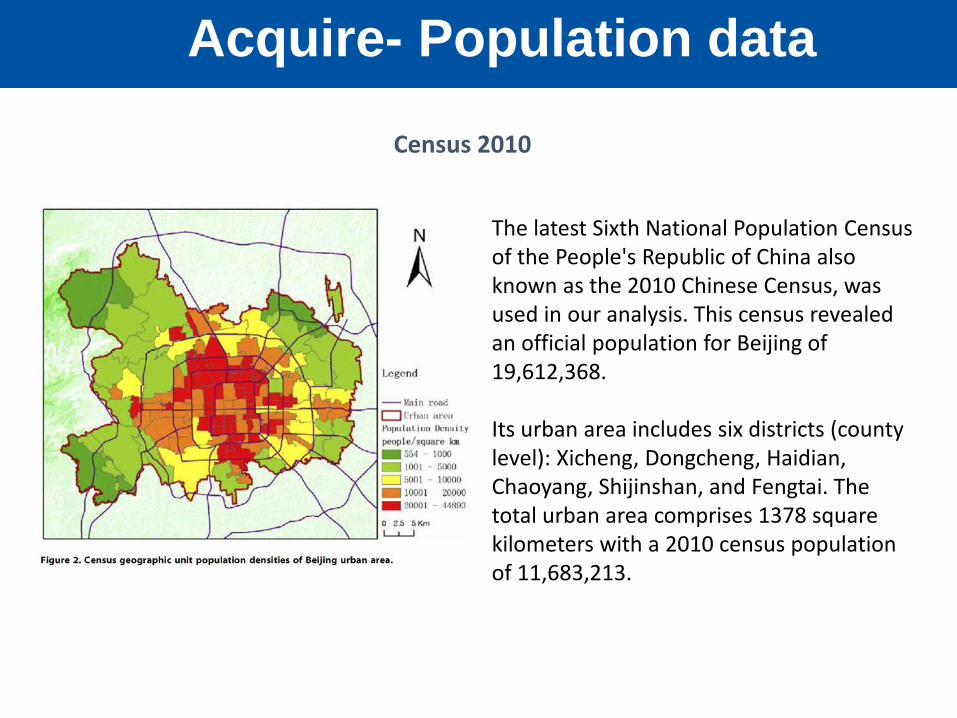
Acquire- Population data
Census 2010
The latest Sixth National Population Census of the People's Republic of China also known as the 2010 Chinese Census, was used in our analysis. This census revealed an official population for Beijing of 19,612,368.
Its urban area includes six districts (county level): Xicheng, Dongcheng, Haidian, Chaoyang, Shijinshan, and Fengtai. The total urban area comprises 1378 square kilometers with a 2010 census population of 11,683,213.
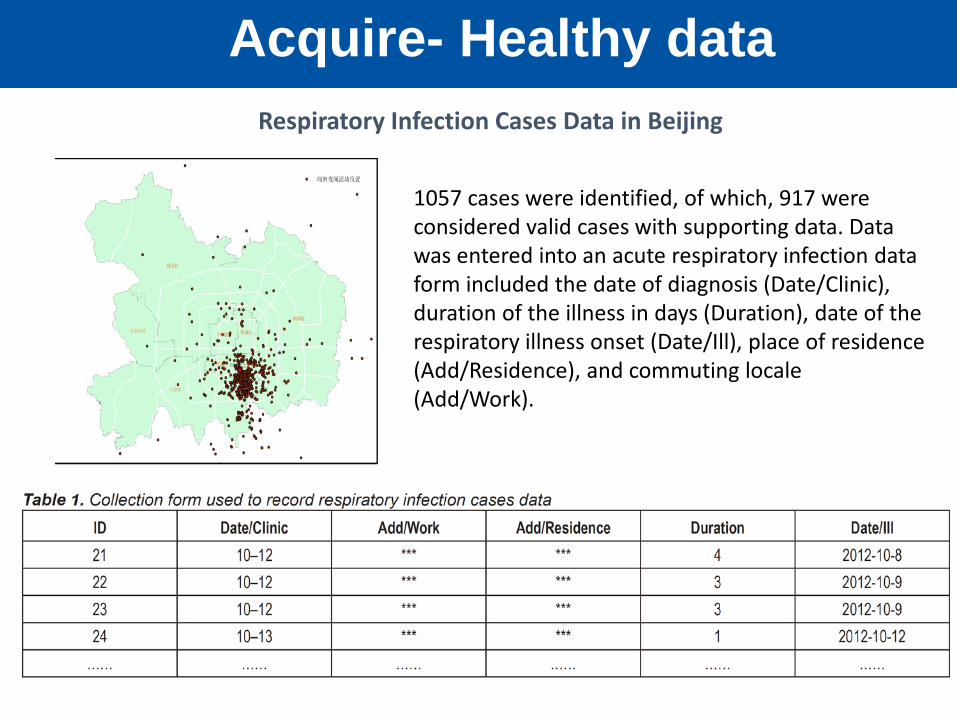
Acquire- Healthy dataRespiratory Infection Cases Data in Beijing
1057 cases were identified, of which, 917 were considered valid cases with supporting data. Data was entered into an acute respiratory infection data form included the date of diagnosis (Date/Clinic), duration of the illness in days (Duration), date of the respiratory illness onset (Date/Ill), place of residence (Add/Residence), and commuting locale (Add/Work).
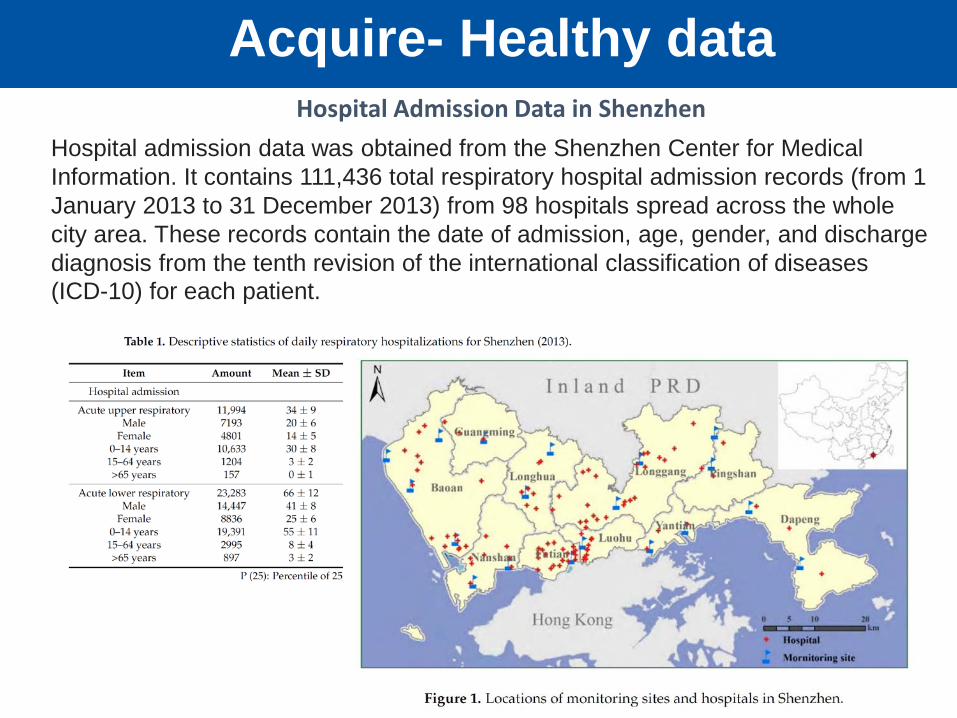
Acquire- Healthy dataHospital Admission Data in Shenzhen
Hospital admission data was obtained from the Shenzhen Center for Medical Information. It contains 111,436 total respiratory hospital admission records (from 1 January 2013 to 31 December 2013) from 98 hospitals spread across the whole city area. These records contain the date of admission, age, gender, and discharge diagnosis from the tenth revision of the international classification of diseases (ICD-10) for each patient.
Ask
Acquire
ExploreAnalyze
Act
What’s the relationship between Air Pollution and Population Health
Outline
Air Pollution Data ,Population Data & Health Data
Spatio-temporal pattern
Human exposure and Health effect
Public policy and private action
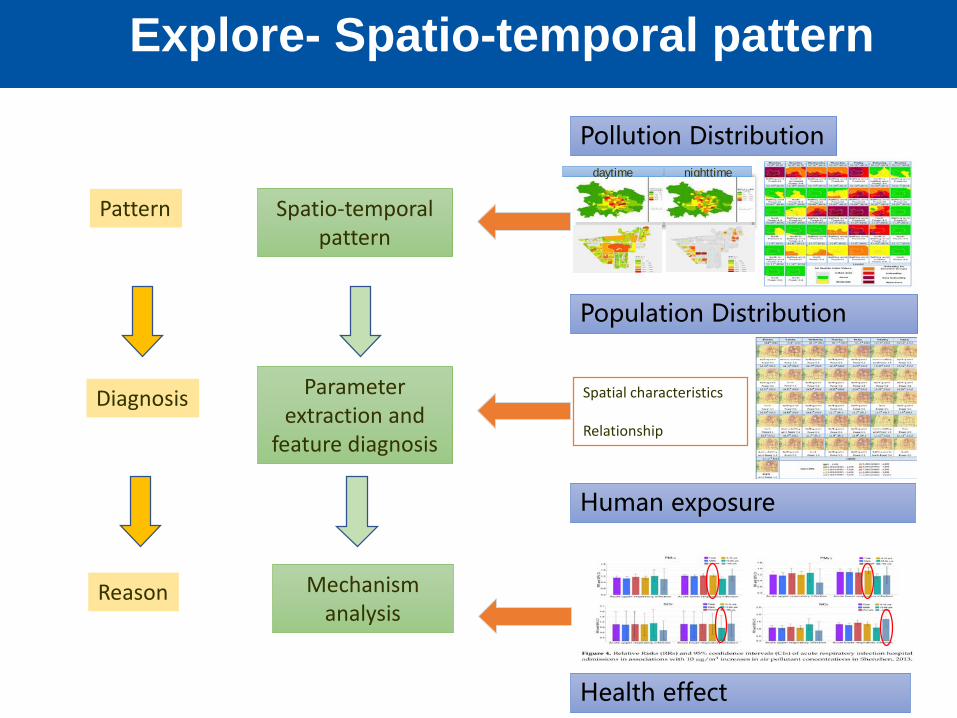
Explore- Spatio-temporal pattern
daytime nighttime
Pollution Distribution
Population Distribution
Human exposure
Health effect
Pattern
Diagnosis
Reason
Spatial characteristics
Relationship
Parameter extraction and
feature diagnosis
Mechanism analysis
Spatio-temporal pattern
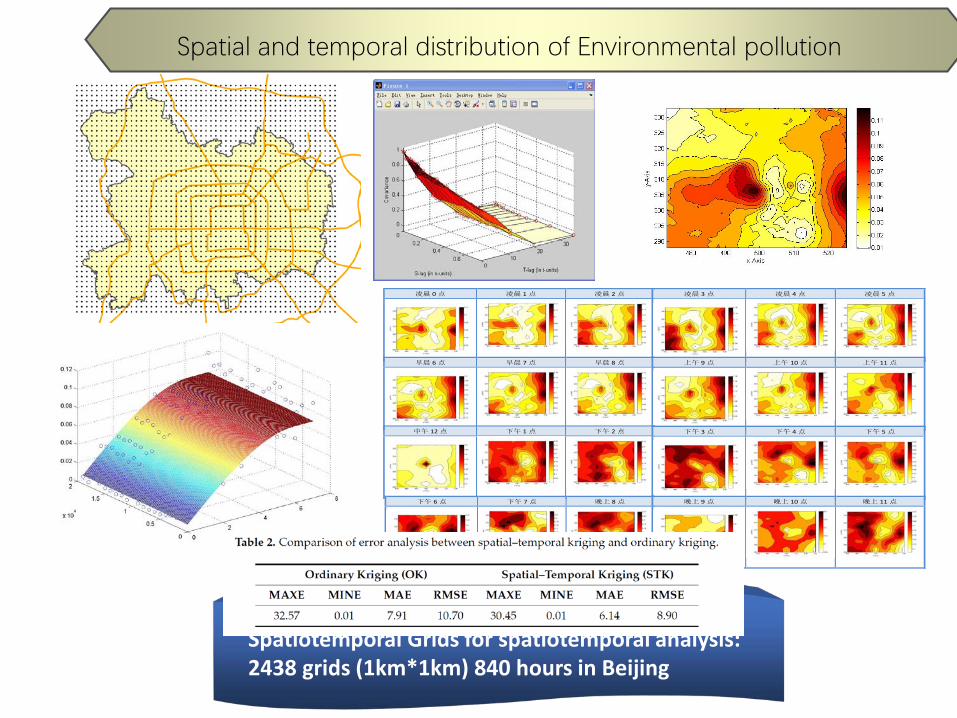
Spatiotemporal Grids for spatiotemporal analysis: 2438 grids (1km*1km) 840 hours in Beijing
Spatial and temporal distribution of Environmental pollution
凌晨 0 点 凌晨 1 点 凌晨 2 点
凌晨 3 点 凌晨 4 点 凌晨 5 点
早晨 6 点 早晨 7 点 早晨 8 点
上午 9 点 上午 10 点 上午 11 点
中午 12 点 下午 1 点 下午 2 点
下午 3 点 下午 4 点 下午 5 点
下午 6 点 下午 7 点 晚上 8 点
晚上 9 点 晚上 10 点 晚上 11 点
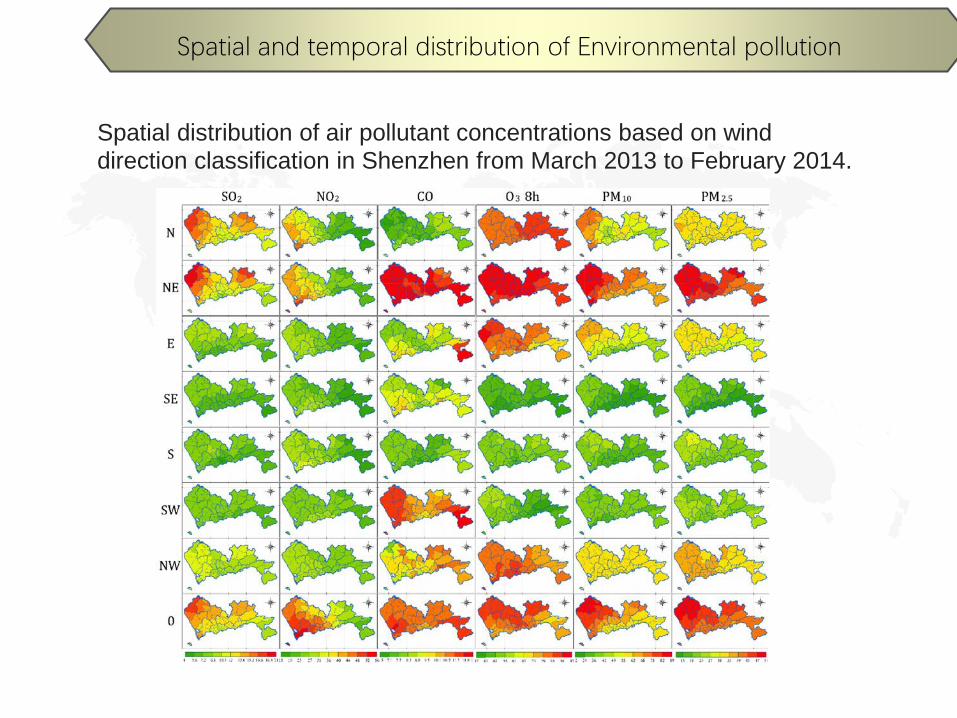
Spatial distribution of air pollutant concentrations based on wind direction classification in Shenzhen from March 2013 to February 2014.
Spatial and temporal distribution of Environmental pollution
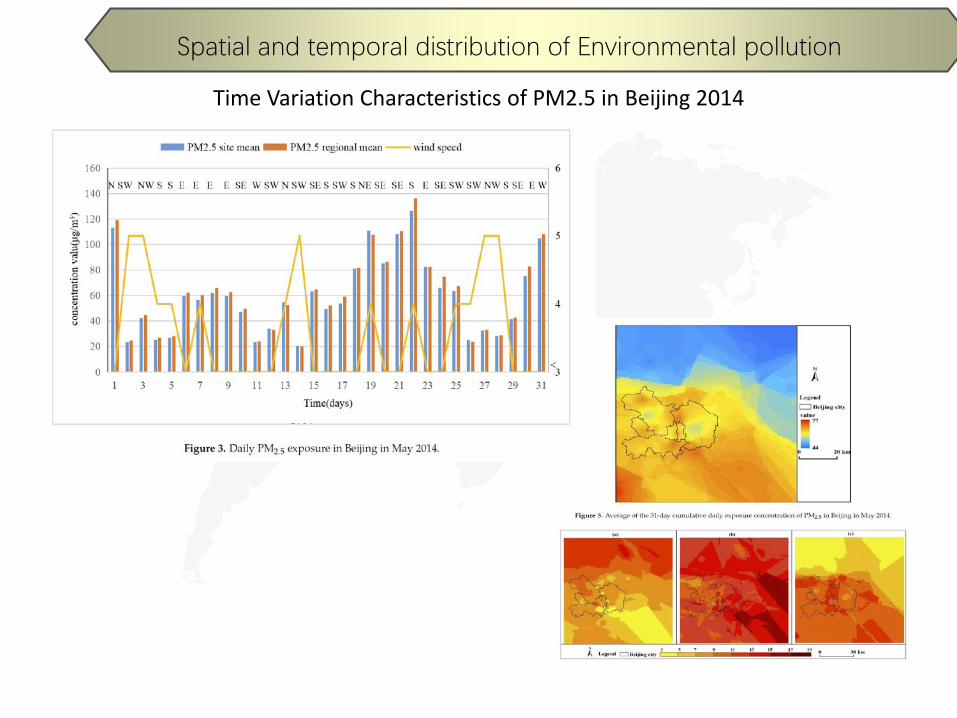
Time Variation Characteristics of PM2.5 in Beijing 2014
Spatial and temporal distribution of Environmental pollution
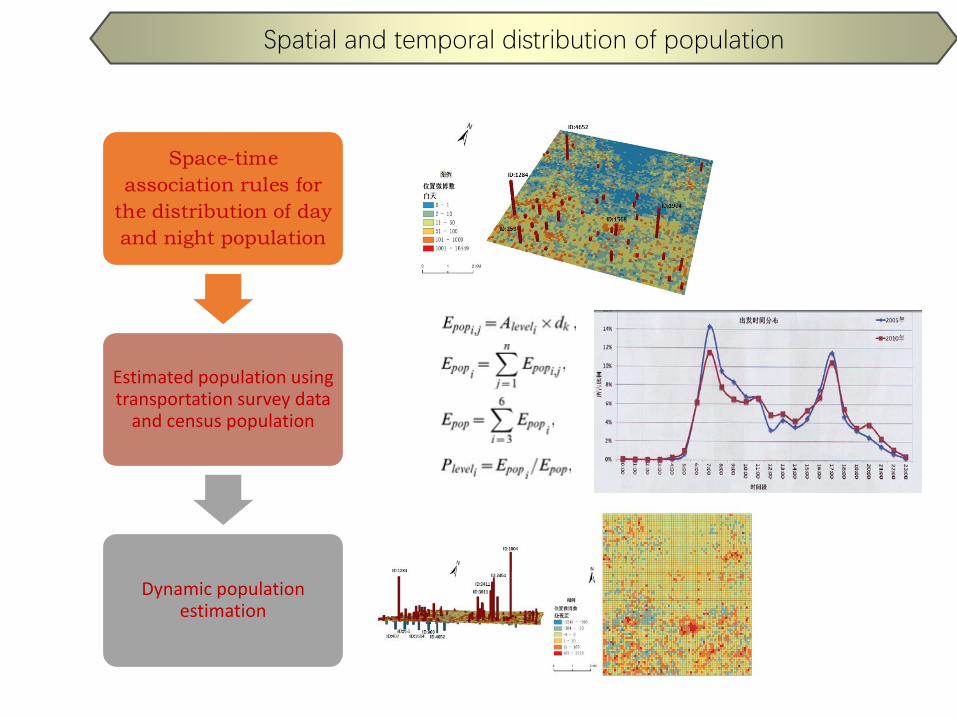
Space-time association rules for
the distribution of day and night population
Estimated population using transportation survey data
and census population
Dynamic population estimation
Spatial and temporal distribution of population
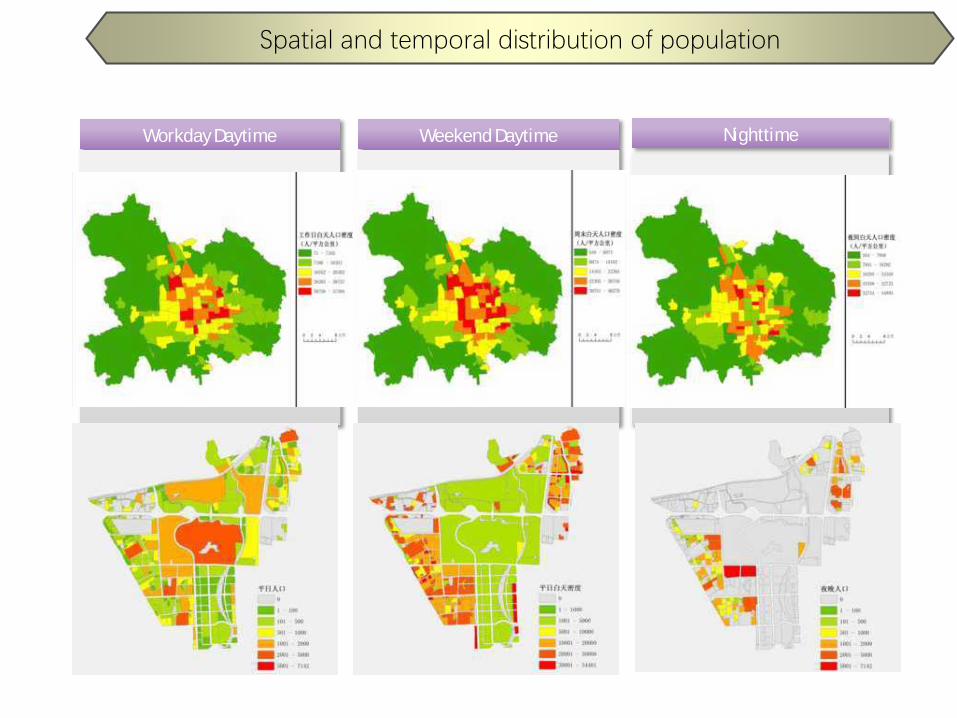
Weekend DaytimeWorkday Daytime Nighttime
Spatial and temporal distribution of population
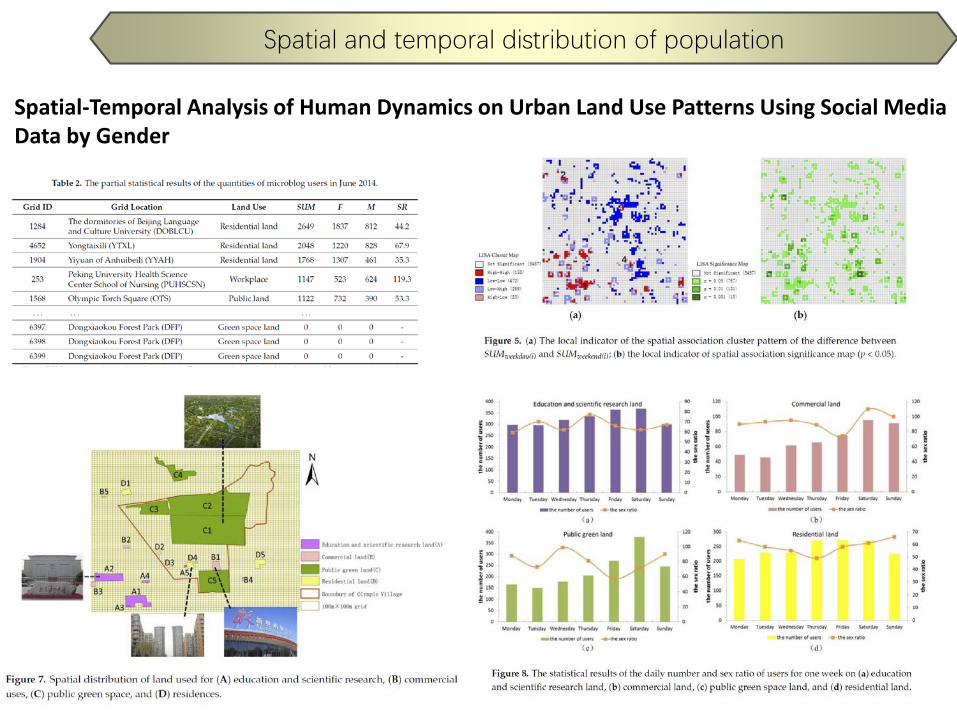
Spatial and temporal distribution of population
Spatial-Temporal Analysis of Human Dynamics on Urban Land Use Patterns Using Social Media Data by Gender
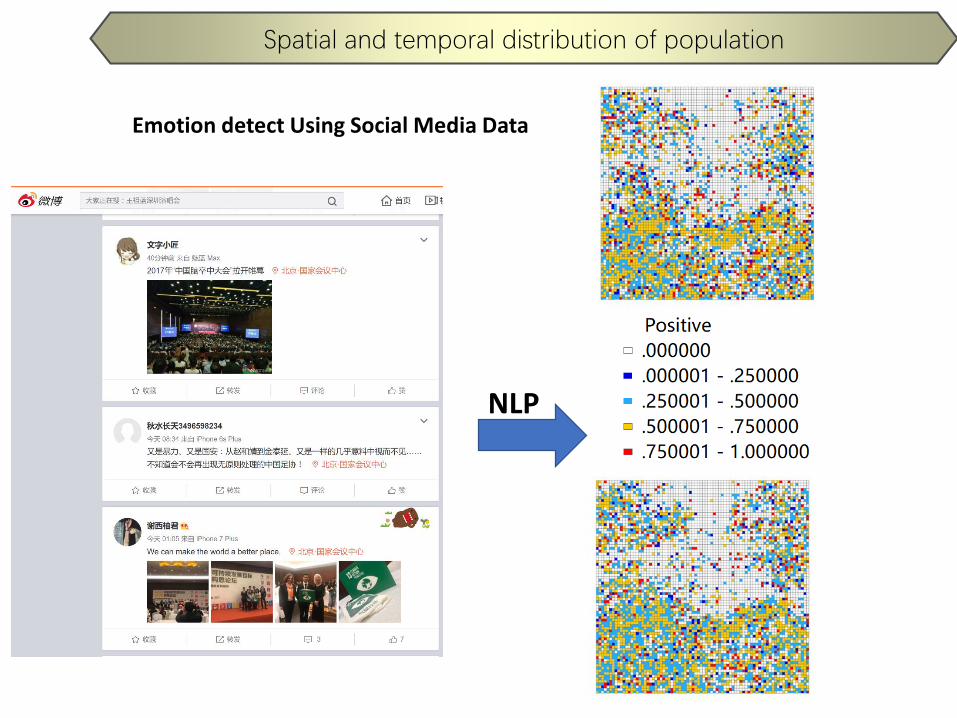
Spatial and temporal distribution of population
NLP
Emotion detect Using Social Media Data
Ask
Acquire
ExploreAnalyze
Act
What’s the relationship between Air Pollution and Population Health
Outline
Air Pollution Data ,Population Data & Health Data
Spatio-temporal pattern
Human exposure and Health effect
Public policy and private action
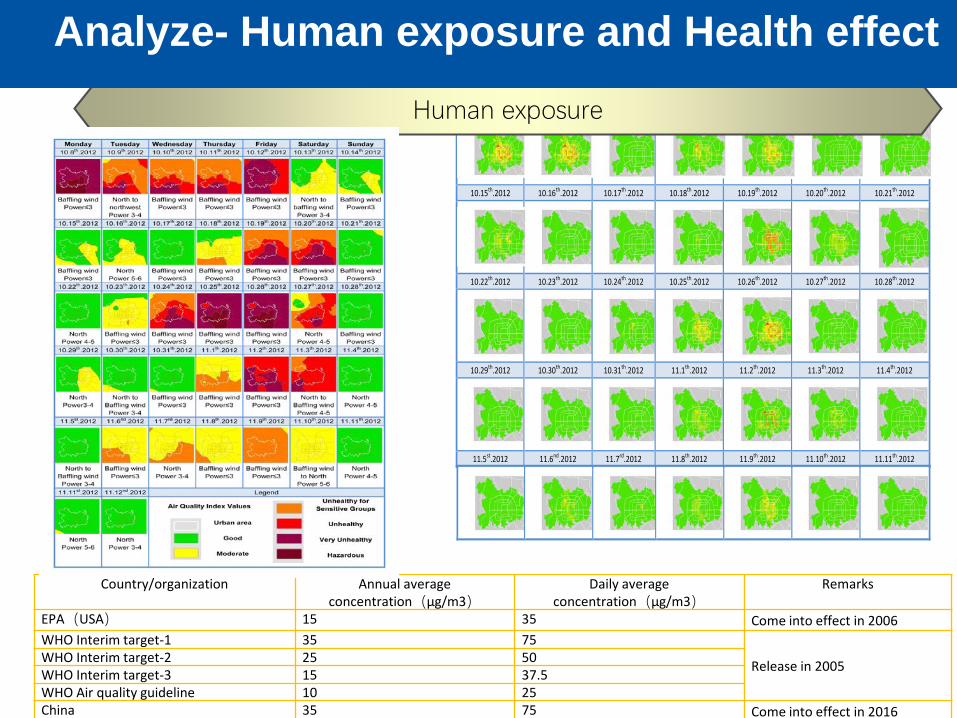
10.8th.2012 10.9th.2012 10.10th.2012 10.11th.2012 10.12th.2012 10.13th.2012 10.14th.2012
10.15th.2012 10.16th.2012 10.17th.2012 10.18th.2012 10.19th.2012 10.20th.2012 10.21th.2012
10.22th.2012 10.23th.2012 10.24th.2012 10.25th.2012 10.26th.2012 10.27th.2012 10.28th.2012
10.29th.2012 10.30th.2012 10.31th.2012 11.1th.2012 11.2th.2012 11.3th.2012 11.4th.2012
11.5st.2012 11.6nd.2012 11.7rd.2012 11.8th.2012 11.9th.2012 11.10th.2012 11.11th.2012
Human exposure
Country/organization Annual average concentration(μg/m3)
Daily average concentration(μg/m3)
Remarks
EPA(USA) 15 35 Come into effect in 2006WHO Interim target-1 35 75
Release in 2005WHO Interim target-2 25 50WHO Interim target-3 15 37.5WHO Air quality guideline 10 25China 35 75 Come into effect in 2016
Analyze- Human exposure and Health effect
Human exposure
Analyze- Human exposure and Health effect
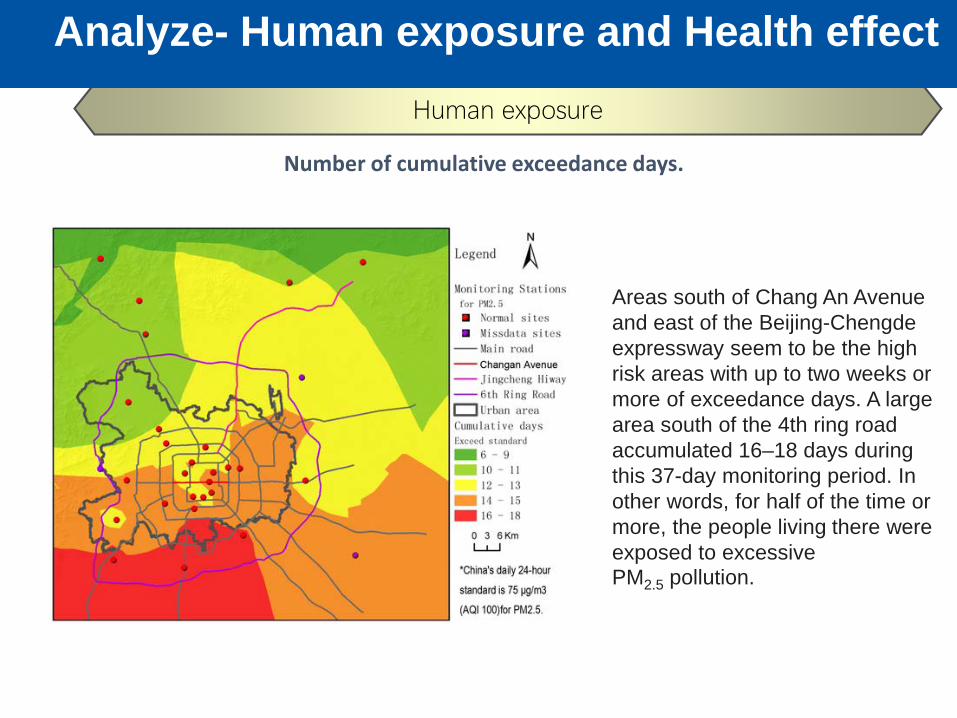
Number of cumulative exceedance days.
Areas south of Chang An Avenue and east of the Beijing-Chengde expressway seem to be the high risk areas with up to two weeks or more of exceedance days. A large area south of the 4th ring road accumulated 16–18 days during this 37-day monitoring period. In other words, for half of the time or more, the people living there were exposed to excessive PM2.5 pollution.
Human exposure
Analyze- Human exposure and Health effect
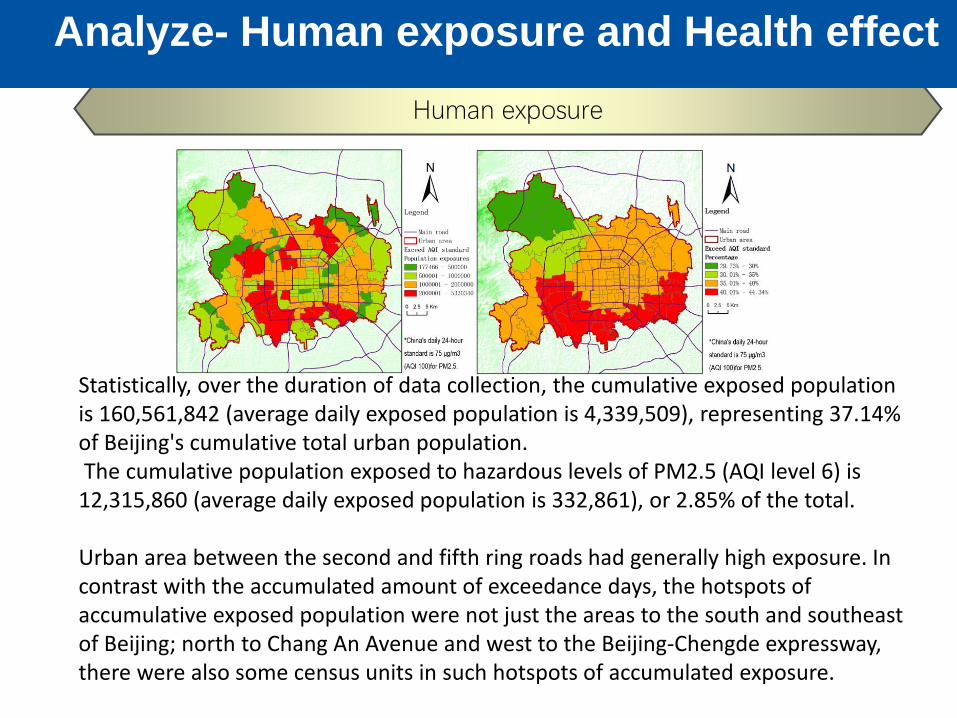
Statistically, over the duration of data collection, the cumulative exposed population is 160,561,842 (average daily exposed population is 4,339,509), representing 37.14% of Beijing's cumulative total urban population.The cumulative population exposed to hazardous levels of PM2.5 (AQI level 6) is
12,315,860 (average daily exposed population is 332,861), or 2.85% of the total.
Urban area between the second and fifth ring roads had generally high exposure. In contrast with the accumulated amount of exceedance days, the hotspots of accumulative exposed population were not just the areas to the south and southeast of Beijing; north to Chang An Avenue and west to the Beijing-Chengde expressway, there were also some census units in such hotspots of accumulated exposure.
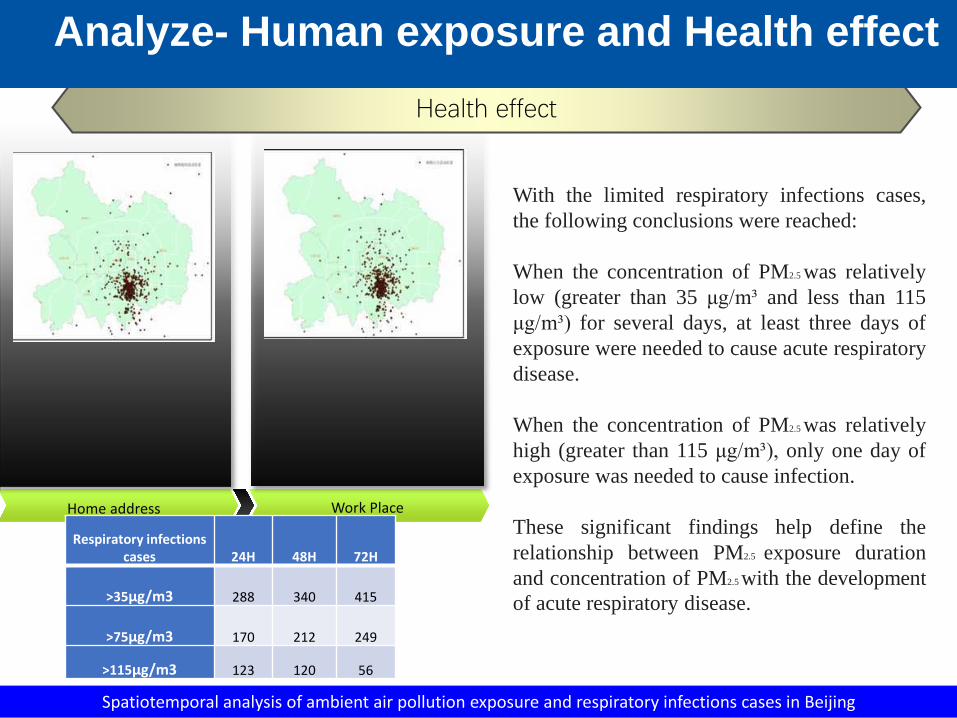
Home address Work Place address
Spatiotemporal analysis of ambient air pollution exposure and respiratory infections cases in Beijing
Respiratory infections cases 24H 48H 72H
>35μg/m3 288 340 415
>75μg/m3 170 212 249
>115μg/m3 123 120 56
Health effect
With the limited respiratory infections cases,the following conclusions were reached:
When the concentration of PM2.5 was relativelylow (greater than 35 μg/m³ and less than 115μg/m³) for several days, at least three days ofexposure were needed to cause acute respiratorydisease.
When the concentration of PM2.5 was relativelyhigh (greater than 115 μg/m³), only one day ofexposure was needed to cause infection.
These significant findings help define therelationship between PM2.5 exposure durationand concentration of PM2.5 with the developmentof acute respiratory disease.
Analyze- Human exposure and Health effect
Health effect
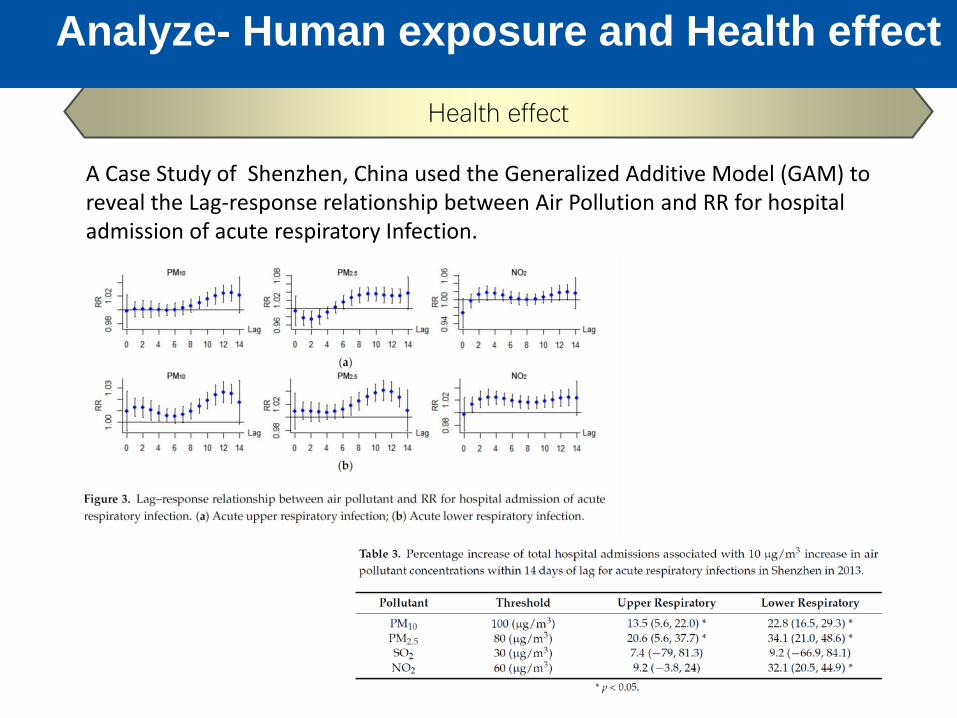
A Case Study of Shenzhen, China used the Generalized Additive Model (GAM) toreveal the Lag-response relationship between Air Pollution and RR for hospital admission of acute respiratory Infection.
Analyze- Human exposure and Health effect
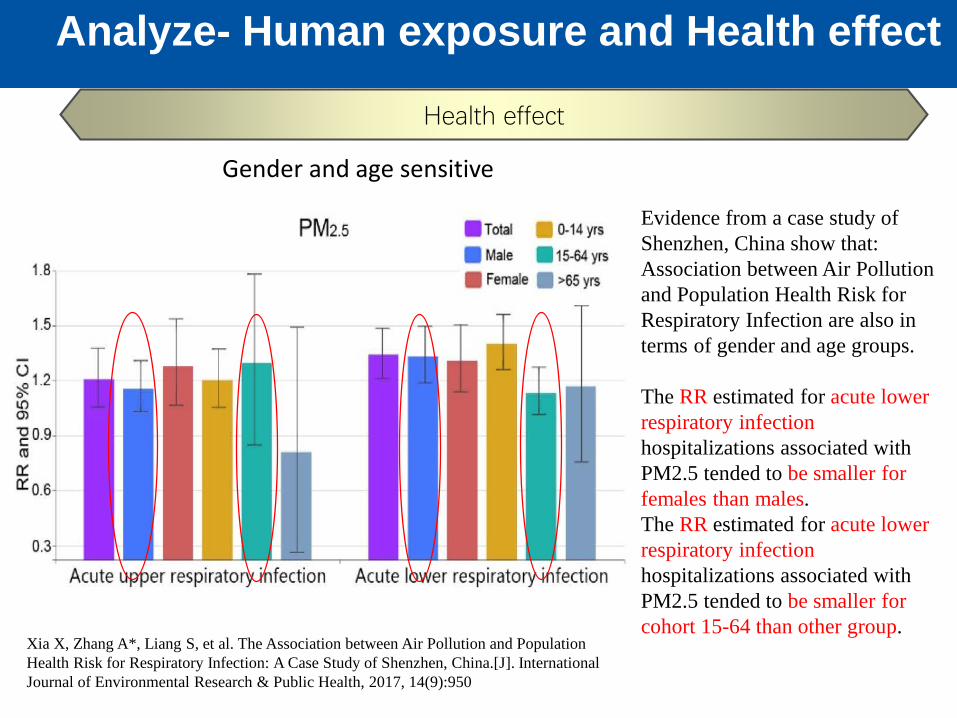
Evidence from a case study of Shenzhen, China show that: Association between Air Pollution and Population Health Risk for Respiratory Infection are also in terms of gender and age groups.
The RR estimated for acute lower respiratory infection hospitalizations associated with PM2.5 tended to be smaller for females than males.The RR estimated for acute lower respiratory infection hospitalizations associated with PM2.5 tended to be smaller for cohort 15-64 than other group.
Gender and age sensitive
Xia X, Zhang A*, Liang S, et al. The Association between Air Pollution and Population Health Risk for Respiratory Infection: A Case Study of Shenzhen, China.[J]. International Journal of Environmental Research & Public Health, 2017, 14(9):950
Health effect
Analyze- Human exposure and Health effect
Ask
Acquire
ExploreAnalyze
Act
What’s the relationship between Air Pollution and Population Health
Outline
Air Pollution Data ,Population Data & Health Data
Spatio-temporal pattern
Human exposure and Health effect
Public policy and private action
Act-Public policy and private action
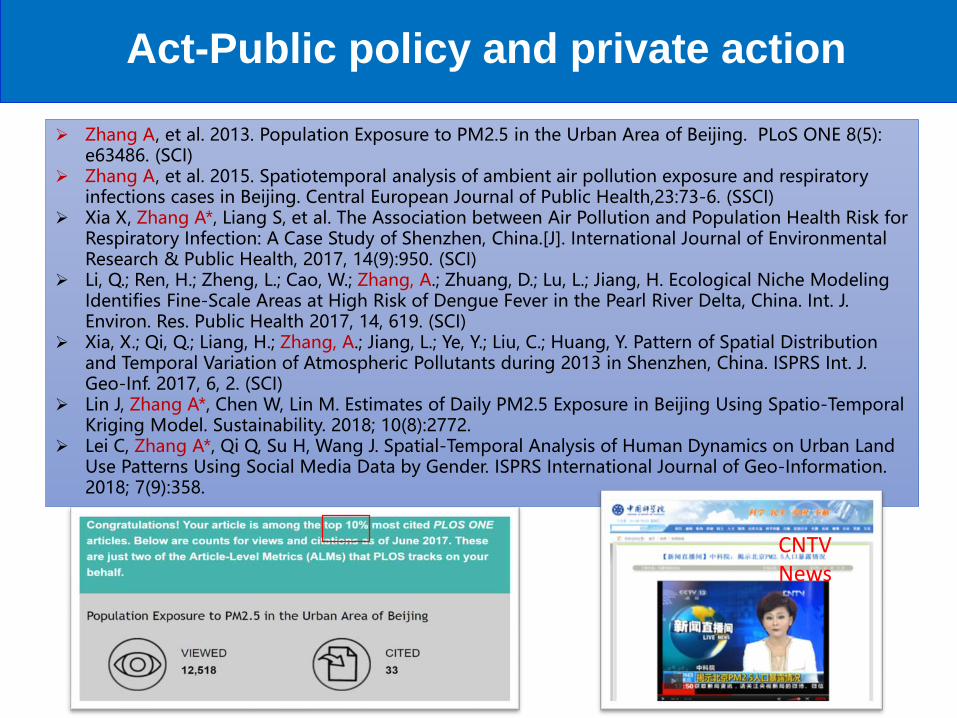
Zhang A, et al. 2013. Population Exposure to PM2.5 in the Urban Area of Beijing. PLoS ONE 8(5): e63486. (SCI)
Zhang A, et al. 2015. Spatiotemporal analysis of ambient air pollution exposure and respiratory infections cases in Beijing. Central European Journal of Public Health,23:73-6. (SSCI)
Xia X, Zhang A*, Liang S, et al. The Association between Air Pollution and Population Health Risk for Respiratory Infection: A Case Study of Shenzhen, China.[J]. International Journal of Environmental Research & Public Health, 2017, 14(9):950. (SCI)
Li, Q.; Ren, H.; Zheng, L.; Cao, W.; Zhang, A.; Zhuang, D.; Lu, L.; Jiang, H. Ecological Niche Modeling Identifies Fine-Scale Areas at High Risk of Dengue Fever in the Pearl River Delta, China. Int. J. Environ. Res. Public Health 2017, 14, 619. (SCI)
Xia, X.; Qi, Q.; Liang, H.; Zhang, A.; Jiang, L.; Ye, Y.; Liu, C.; Huang, Y. Pattern of Spatial Distribution and Temporal Variation of Atmospheric Pollutants during 2013 in Shenzhen, China. ISPRS Int. J. Geo-Inf. 2017, 6, 2. (SCI)
Lin J, Zhang A*, Chen W, Lin M. Estimates of Daily PM2.5 Exposure in Beijing Using Spatio-Temporal Kriging Model. Sustainability. 2018; 10(8):2772.
Lei C, Zhang A*, Qi Q, Su H, Wang J. Spatial-Temporal Analysis of Human Dynamics on Urban Land Use Patterns Using Social Media Data by Gender. ISPRS International Journal of Geo-Information. 2018; 7(9):358.
CNTVNews
Act-Public policy and private action
A recipe for air pollution?
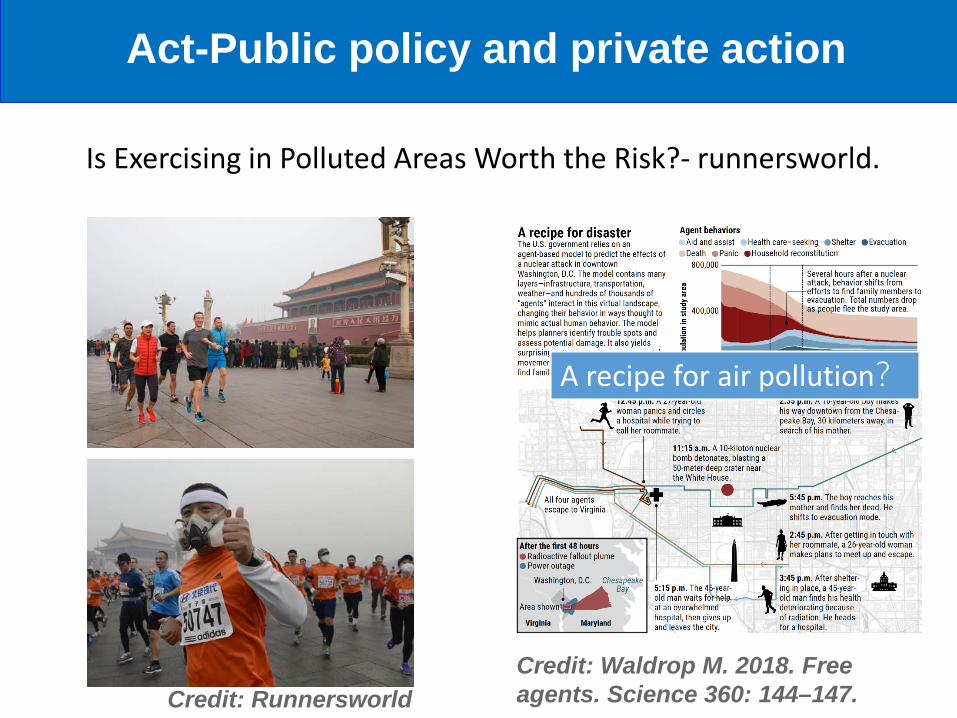
Is Exercising in Polluted Areas Worth the Risk?- runnersworld.
Credit: RunnersworldCredit: Waldrop M. 2018. Free agents. Science 360: 144–147.