Embed Size (px)
Citation preview
ORIGINAL ARTICLE
The assessment of treated wastewater quality and the effectsof mid-term irrigation on soil physical and chemical properties(case study: Bandargaz-treated wastewater)
Kami Kaboosi1
Received: 12 July 2015 / Accepted: 28 April 2016 / Published online: 10 May 2016
� The Author(s) 2016. This article is published with open access at Springerlink.com
Abstract This study was conducted to investigate the
characteristics of inflow and outflow wastewater of the
Bandargaz wastewater treatment plant on the basis of the
data collection of operation period and the samples taken
during the study. Also the effects of mid-term use of the
wastewater for irrigation (from 2005 to 2013) on soil
physical and chemical characteristics were studied. For
this purpose, 4 samples were taken from the inflow and
outflow wastewater and 25 quality parameters were mea-
sured. Also, the four soil samples from a depth of 0–30 cm
of two rice field irrigated with wastewater in the beginning
and middle of the planting season and two samples from
one adjacent rice field irrigated with fresh water were
collected and their chemical and physical characteristics
were determined. Average of electrical conductivity, total
dissolved solids, sodium adsorption ratio, chemical oxygen
demand and 5 days biochemical oxygen demand in treated
wastewater were 1.35 dS/m, 707 ppm, 0.93, 80 ppm and
40 ppm, respectively. Results showed that although some
restrictions exist about chlorine and bicarbonate, the
treated wastewater is suitable for irrigation based on
national and international standards and criteria. In com-
parison with fresh water, the mid-term use of wastewater
caused a little increase of soil salinity. However, it did not
lead to increase of soil salinity beyond rice salinity
threshold. Also, there were no restrictions on soil in the
aspect of salinity and sodium hazard on the basis of many
irrigated soil classifications. In comparison with fresh
water, the mid-term use of wastewater caused the increase
of total N, absorbable P and absorbable K in soil due
to high concentration of those elements in treated
wastewater.
Keywords Bandargaz � Irrigation � Soil � Treatment �Wastewater
Introduction
Today, due to the constraint in availability of the fresh-
water for irrigation, wastewater especially sewage water is
being used for irrigation of agriculture fields (Singh et al.
2012). Specially, in arid and semi-arid regions, irrigation
water shortage turns treated wastewater into an attractive
source of water for irrigated agriculture (Pescod 1992).
Hamilton et al. (2007) reported that globally around 20
million ha of land were irrigated with reclaimed wastew-
ater, and the amount would increase markedly during the
next few decades as water stress intensifies (after Chen
et al. 2013c). However, Chen et al. (2015a) reported in
spite of poor general public’s knowledge on water
resources, their awareness on reclaimed water reuse was
high. Moreover, some of the stakeholders had concerns
about the potential risks from reclaimed wastewater reuse.
Several studies have been done to investigate the pos-
sibility of using treated wastewater for irrigation. For
example, Torabian and Motallebi (2003) in addition to
evaluating the wastewater quality of EKBATAN treatment
plant presented the plan of wastewater reuse management.
Ghasemi and Danesh (2012) studied the wastewater sam-
ples from Mashhad treatment plant and stated that
according to Ayers and Westcot Guide (1985), wastewater
can be used for irrigation of agricultural land. Results of
Hasanli and Javan (2006) and Salehi et al. (2008) showed
& Kami Kaboosi
1 Department of Water Engineering, Gorgan Branch, Islamic
Azad University, Gorgan, Iran
123
Appl Water Sci (2017) 7:2385–2396
DOI 10.1007/s13201-016-0420-5
that the application of treated wastewater for irrigation of
green and afforestation species is possible.
As an irrigation water resource, reclaimed water from
sewage treatment plants can provide soils with the nutrients
and organic matter, ameliorating health conditions
(biodegradable organic matter and beneficial microorgan-
isms), soil biological activities and thus promote soil
quality and sustainability. However, reclaimed water also
contains nonessential toxic elements and most noticeably
salts, which may lead to soil salt levels intolerable to most
landscape plants or crops, especially in heavy soil (Chen
et al. 2013a, b, 2015b; Lyu and Chen 2016). Moreover, the
greatest health concern in using reclaimed wastewater for
irrigation is directed to pathogens (Chen et al. 2013a).
Wang et al. (2013) reported that concentration of some
aroma chemical components (HHCB and AHTN) can be
significantly increased in reclaimed wastewater-irrigated
soils, although it would take 243 and 666 years for their
accumulation in soils to reach the levels that harm the
ecosystem and soil biota such as germinating plants and
earthworms.
Assouline and Narkis (2011) stated that treated
wastewater application will differently affect different
zones in the soil profile, depending on irrigation manage-
ment parameters and plant uptake characteristics. Results
of Singh and Agrawal (2012) showed that wastewater
irrigation led to beneficial changes in physico-chemical and
biological properties of the soil. Generally, wastewater
application for irrigation will lead to the reduction of soil
porosity and consequently decrease in water retention
(Aiello et al. 2007), decrease of saturated hydraulic con-
ductivity (Aiello et al. 2007; Assouline and Narkis 2011),
reduction of soil infiltration rate (Rohani Shahraki et al.
2006; Assouline and Narkis 2011), increase the soil con-
tamination to heavy metals (Hoseinpoor et al. 2008; Singh
and Agrawal 2012; Chen et al. 2013c), increase of soil
salinity (Taghvaiian et al. 2008; Hoseinpoor et al. 2008;
Chen et al. 2013b; Lyu and Chen 2016), increase of soil
water retention (Taghvaiian et al. 2008), decrease of soil
bulk density (Rohani Shahraki et al. 2006), increasing risks
of nutrient imbalances and groundwater contamination of
nitrate with irrational managements of reclaimed water
(Candela et al. 2007) and increase of soil surface microbial
contamination and concentrations of some pathogens like
viruses and Giardia (Aiello et al. 2007; Levantesi et al.
2010). However, there is no consistency as reclaimed urban
wastewater impacts were dependent on the quality of
reclaimed water, irrigation rate and practices, irrigation
period, soil properties, influent water characteristics,
treatment process, crop characteristics and local climate
conditions (Pereira et al. 2012; Chen et al. 2015b).
Irrigation water scarcity in the summer season in Ban-
dargaz region, which coincides with the peak crop water
requirement period, result in farmers interest to use treated
wastewater as an unconventional water resource. Since a
few years, farmers in the Bandargaz region used the treated
wastewater for irrigation, this study was conducted to
investigate the characteristics of inflow and outflow
wastewater of the Bandargaz wastewater treatment plant
and the effects of mid-term use of the wastewater for
irrigation on soil physical and chemical characteristics.
Materials and methods
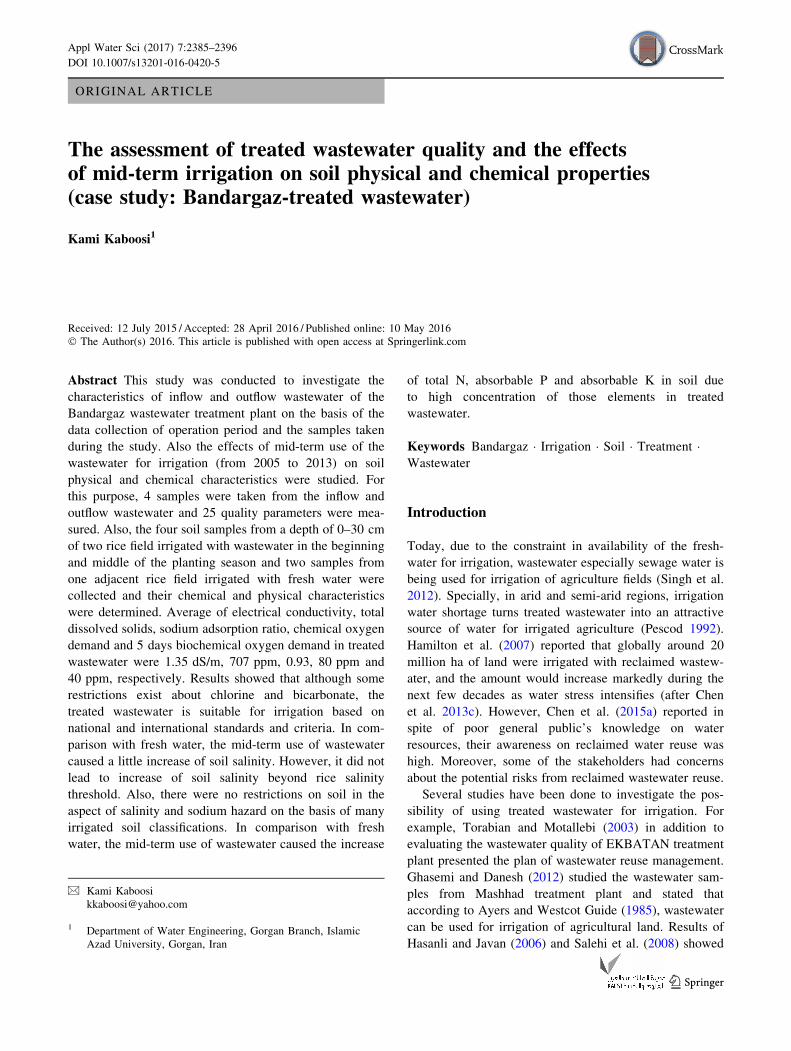
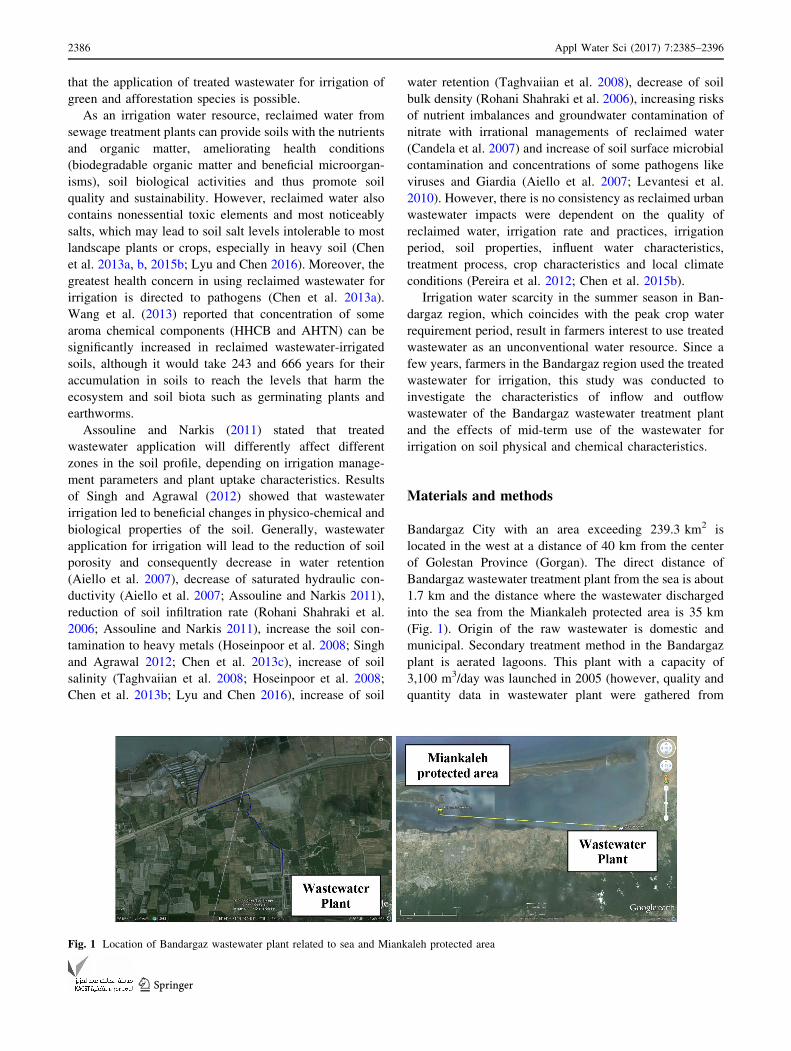
Bandargaz City with an area exceeding 239.3 km2 is
located in the west at a distance of 40 km from the center
of Golestan Province (Gorgan). The direct distance of
Bandargaz wastewater treatment plant from the sea is about
1.7 km and the distance where the wastewater discharged
into the sea from the Miankaleh protected area is 35 km
(Fig. 1). Origin of the raw wastewater is domestic and
municipal. Secondary treatment method in the Bandargaz
plant is aerated lagoons. This plant with a capacity of
3,100 m3/day was launched in 2005 (however, quality and
quantity data in wastewater plant were gathered from
Fig. 1 Location of Bandargaz wastewater plant related to sea and Miankaleh protected area
2386 Appl Water Sci (2017) 7:2385–2396
123
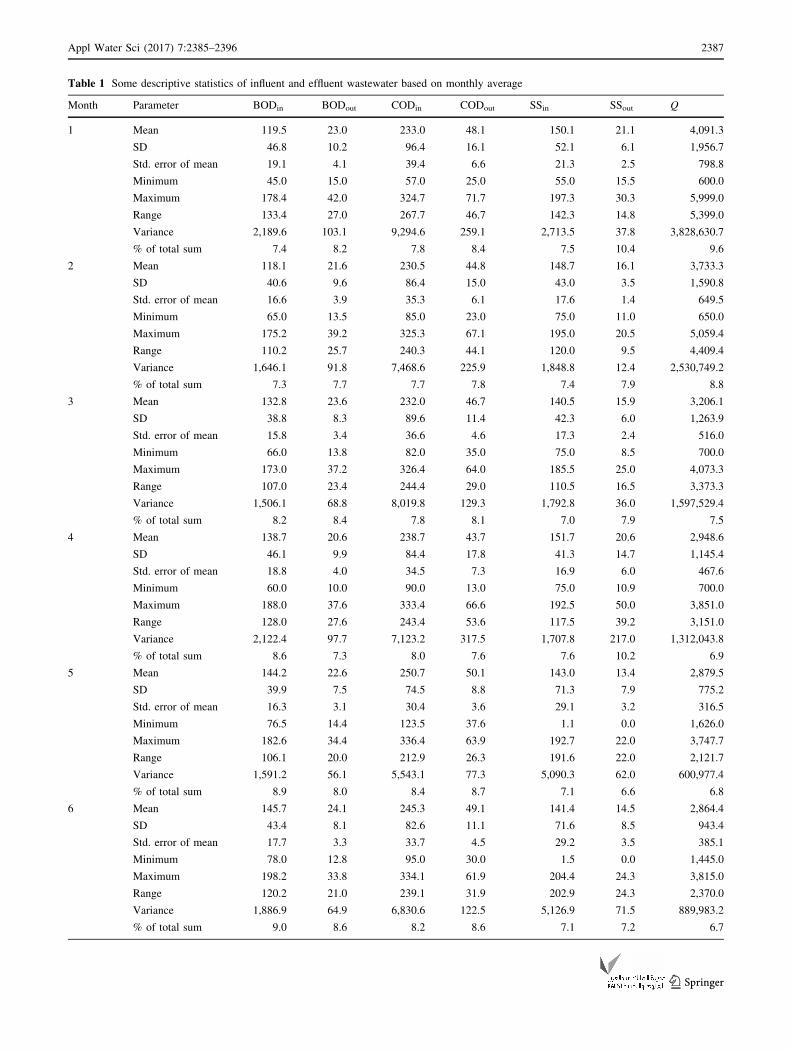
Table 1 Some descriptive statistics of influent and effluent wastewater based on monthly average
Month Parameter BODin BODout CODin CODout SSin SSout Q
1 Mean 119.5 23.0 233.0 48.1 150.1 21.1 4,091.3
SD 46.8 10.2 96.4 16.1 52.1 6.1 1,956.7
Std. error of mean 19.1 4.1 39.4 6.6 21.3 2.5 798.8
Minimum 45.0 15.0 57.0 25.0 55.0 15.5 600.0
Maximum 178.4 42.0 324.7 71.7 197.3 30.3 5,999.0
Range 133.4 27.0 267.7 46.7 142.3 14.8 5,399.0
Variance 2,189.6 103.1 9,294.6 259.1 2,713.5 37.8 3,828,630.7
% of total sum 7.4 8.2 7.8 8.4 7.5 10.4 9.6
2 Mean 118.1 21.6 230.5 44.8 148.7 16.1 3,733.3
SD 40.6 9.6 86.4 15.0 43.0 3.5 1,590.8
Std. error of mean 16.6 3.9 35.3 6.1 17.6 1.4 649.5
Minimum 65.0 13.5 85.0 23.0 75.0 11.0 650.0
Maximum 175.2 39.2 325.3 67.1 195.0 20.5 5,059.4
Range 110.2 25.7 240.3 44.1 120.0 9.5 4,409.4
Variance 1,646.1 91.8 7,468.6 225.9 1,848.8 12.4 2,530,749.2
% of total sum 7.3 7.7 7.7 7.8 7.4 7.9 8.8
3 Mean 132.8 23.6 232.0 46.7 140.5 15.9 3,206.1
SD 38.8 8.3 89.6 11.4 42.3 6.0 1,263.9
Std. error of mean 15.8 3.4 36.6 4.6 17.3 2.4 516.0
Minimum 66.0 13.8 82.0 35.0 75.0 8.5 700.0
Maximum 173.0 37.2 326.4 64.0 185.5 25.0 4,073.3
Range 107.0 23.4 244.4 29.0 110.5 16.5 3,373.3
Variance 1,506.1 68.8 8,019.8 129.3 1,792.8 36.0 1,597,529.4
% of total sum 8.2 8.4 7.8 8.1 7.0 7.9 7.5
4 Mean 138.7 20.6 238.7 43.7 151.7 20.6 2,948.6
SD 46.1 9.9 84.4 17.8 41.3 14.7 1,145.4
Std. error of mean 18.8 4.0 34.5 7.3 16.9 6.0 467.6
Minimum 60.0 10.0 90.0 13.0 75.0 10.9 700.0
Maximum 188.0 37.6 333.4 66.6 192.5 50.0 3,851.0
Range 128.0 27.6 243.4 53.6 117.5 39.2 3,151.0
Variance 2,122.4 97.7 7,123.2 317.5 1,707.8 217.0 1,312,043.8
% of total sum 8.6 7.3 8.0 7.6 7.6 10.2 6.9
5 Mean 144.2 22.6 250.7 50.1 143.0 13.4 2,879.5
SD 39.9 7.5 74.5 8.8 71.3 7.9 775.2
Std. error of mean 16.3 3.1 30.4 3.6 29.1 3.2 316.5
Minimum 76.5 14.4 123.5 37.6 1.1 0.0 1,626.0
Maximum 182.6 34.4 336.4 63.9 192.7 22.0 3,747.7
Range 106.1 20.0 212.9 26.3 191.6 22.0 2,121.7
Variance 1,591.2 56.1 5,543.1 77.3 5,090.3 62.0 600,977.4
% of total sum 8.9 8.0 8.4 8.7 7.1 6.6 6.8
6 Mean 145.7 24.1 245.3 49.1 141.4 14.5 2,864.4
SD 43.4 8.1 82.6 11.1 71.6 8.5 943.4
Std. error of mean 17.7 3.3 33.7 4.5 29.2 3.5 385.1
Minimum 78.0 12.8 95.0 30.0 1.5 0.0 1,445.0
Maximum 198.2 33.8 334.1 61.9 204.4 24.3 3,815.0
Range 120.2 21.0 239.1 31.9 202.9 24.3 2,370.0
Variance 1,886.9 64.9 6,830.6 122.5 5,126.9 71.5 889,983.2
% of total sum 9.0 8.6 8.2 8.6 7.1 7.2 6.7
Appl Water Sci (2017) 7:2385–2396 2387
123
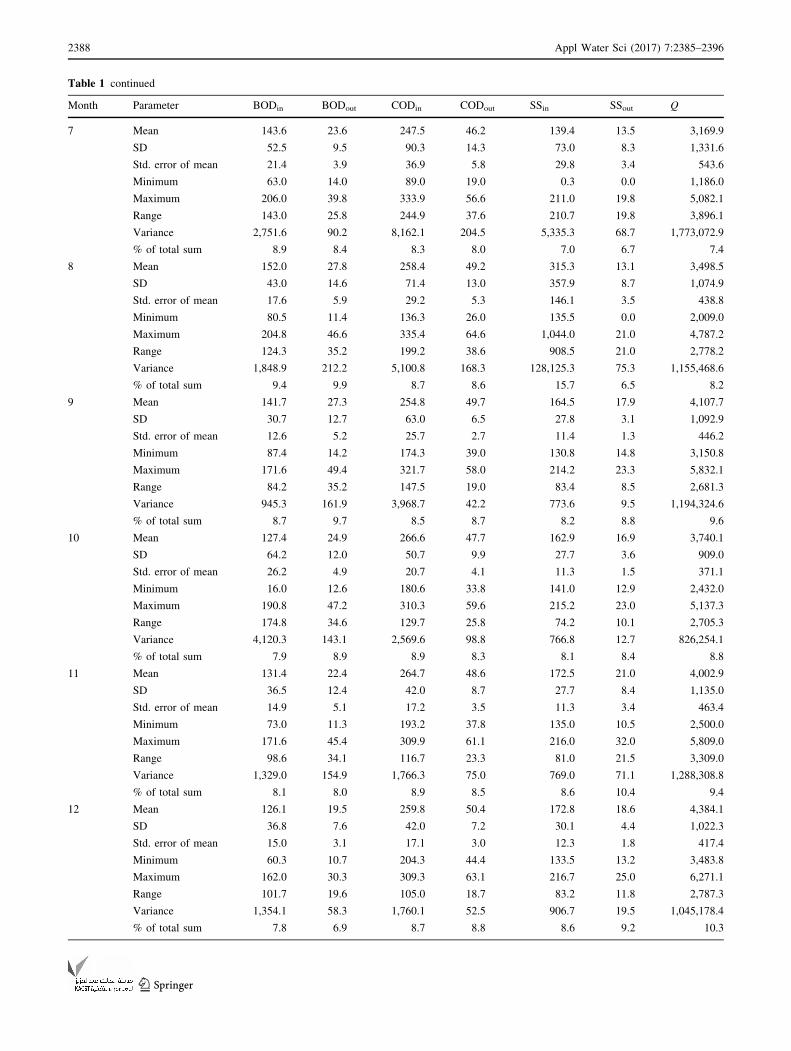
Table 1 continued
Month Parameter BODin BODout CODin CODout SSin SSout Q
7 Mean 143.6 23.6 247.5 46.2 139.4 13.5 3,169.9
SD 52.5 9.5 90.3 14.3 73.0 8.3 1,331.6
Std. error of mean 21.4 3.9 36.9 5.8 29.8 3.4 543.6
Minimum 63.0 14.0 89.0 19.0 0.3 0.0 1,186.0
Maximum 206.0 39.8 333.9 56.6 211.0 19.8 5,082.1
Range 143.0 25.8 244.9 37.6 210.7 19.8 3,896.1
Variance 2,751.6 90.2 8,162.1 204.5 5,335.3 68.7 1,773,072.9
% of total sum 8.9 8.4 8.3 8.0 7.0 6.7 7.4
8 Mean 152.0 27.8 258.4 49.2 315.3 13.1 3,498.5
SD 43.0 14.6 71.4 13.0 357.9 8.7 1,074.9
Std. error of mean 17.6 5.9 29.2 5.3 146.1 3.5 438.8
Minimum 80.5 11.4 136.3 26.0 135.5 0.0 2,009.0
Maximum 204.8 46.6 335.4 64.6 1,044.0 21.0 4,787.2
Range 124.3 35.2 199.2 38.6 908.5 21.0 2,778.2
Variance 1,848.9 212.2 5,100.8 168.3 128,125.3 75.3 1,155,468.6
% of total sum 9.4 9.9 8.7 8.6 15.7 6.5 8.2
9 Mean 141.7 27.3 254.8 49.7 164.5 17.9 4,107.7
SD 30.7 12.7 63.0 6.5 27.8 3.1 1,092.9
Std. error of mean 12.6 5.2 25.7 2.7 11.4 1.3 446.2
Minimum 87.4 14.2 174.3 39.0 130.8 14.8 3,150.8
Maximum 171.6 49.4 321.7 58.0 214.2 23.3 5,832.1
Range 84.2 35.2 147.5 19.0 83.4 8.5 2,681.3
Variance 945.3 161.9 3,968.7 42.2 773.6 9.5 1,194,324.6
% of total sum 8.7 9.7 8.5 8.7 8.2 8.8 9.6
10 Mean 127.4 24.9 266.6 47.7 162.9 16.9 3,740.1
SD 64.2 12.0 50.7 9.9 27.7 3.6 909.0
Std. error of mean 26.2 4.9 20.7 4.1 11.3 1.5 371.1
Minimum 16.0 12.6 180.6 33.8 141.0 12.9 2,432.0
Maximum 190.8 47.2 310.3 59.6 215.2 23.0 5,137.3
Range 174.8 34.6 129.7 25.8 74.2 10.1 2,705.3
Variance 4,120.3 143.1 2,569.6 98.8 766.8 12.7 826,254.1
% of total sum 7.9 8.9 8.9 8.3 8.1 8.4 8.8
11 Mean 131.4 22.4 264.7 48.6 172.5 21.0 4,002.9
SD 36.5 12.4 42.0 8.7 27.7 8.4 1,135.0
Std. error of mean 14.9 5.1 17.2 3.5 11.3 3.4 463.4
Minimum 73.0 11.3 193.2 37.8 135.0 10.5 2,500.0
Maximum 171.6 45.4 309.9 61.1 216.0 32.0 5,809.0
Range 98.6 34.1 116.7 23.3 81.0 21.5 3,309.0
Variance 1,329.0 154.9 1,766.3 75.0 769.0 71.1 1,288,308.8
% of total sum 8.1 8.0 8.9 8.5 8.6 10.4 9.4
12 Mean 126.1 19.5 259.8 50.4 172.8 18.6 4,384.1
SD 36.8 7.6 42.0 7.2 30.1 4.4 1,022.3
Std. error of mean 15.0 3.1 17.1 3.0 12.3 1.8 417.4
Minimum 60.3 10.7 204.3 44.4 133.5 13.2 3,483.8
Maximum 162.0 30.3 309.3 63.1 216.7 25.0 6,271.1
Range 101.7 19.6 105.0 18.7 83.2 11.8 2,787.3
Variance 1,354.1 58.3 1,760.1 52.5 906.7 19.5 1,045,178.4
% of total sum 7.8 6.9 8.7 8.8 8.6 9.2 10.3
2388 Appl Water Sci (2017) 7:2385–2396
123
2007). Wastewater using concrete pipe reached the natural
earth channels and then emptied into the sea (Fig. 1).
Within the last 9 years, farmers have removed the manhole
doors and pumped the treated wastewater to agricultural
lands.
In the study area, rice cultivation is dominant and irri-
gation season is approximately 2.5–3 months (mid-May–
mid-August) along with peak of irrigation water require-
ment within July. In other month of year, treated wastew-
ater is discharged to the sea.
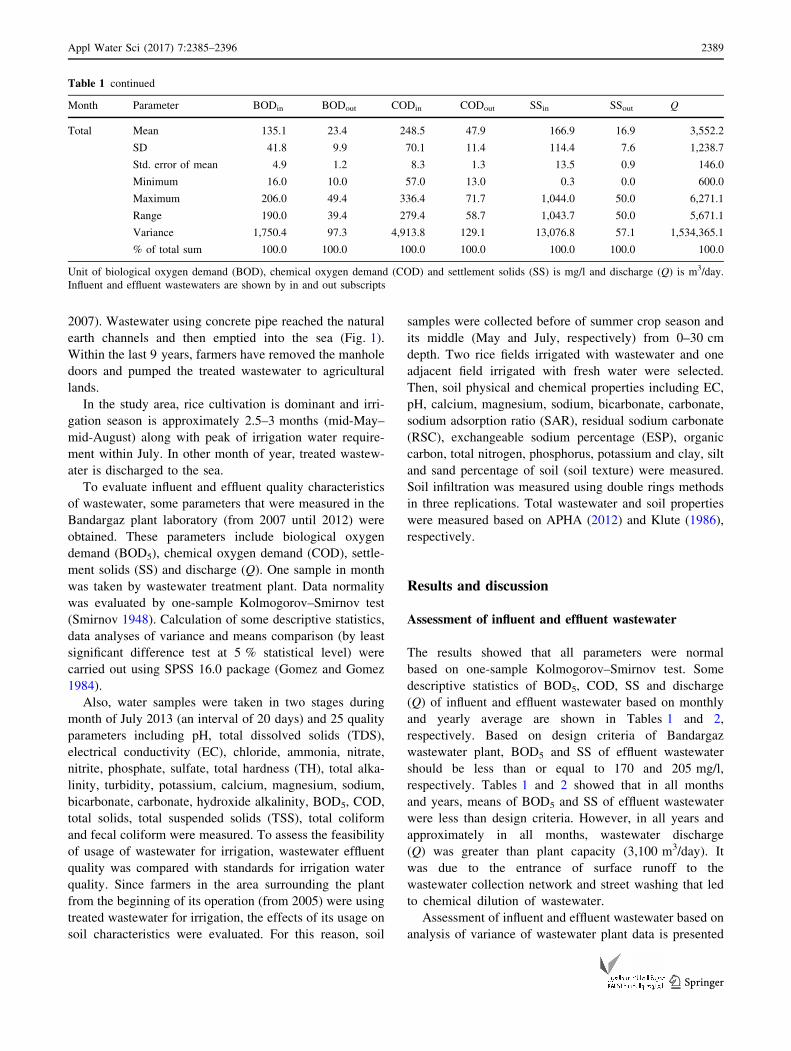
To evaluate influent and effluent quality characteristics
of wastewater, some parameters that were measured in the
Bandargaz plant laboratory (from 2007 until 2012) were
obtained. These parameters include biological oxygen
demand (BOD5), chemical oxygen demand (COD), settle-
ment solids (SS) and discharge (Q). One sample in month
was taken by wastewater treatment plant. Data normality
was evaluated by one-sample Kolmogorov–Smirnov test
(Smirnov 1948). Calculation of some descriptive statistics,
data analyses of variance and means comparison (by least
significant difference test at 5 % statistical level) were
carried out using SPSS 16.0 package (Gomez and Gomez
1984).
Also, water samples were taken in two stages during
month of July 2013 (an interval of 20 days) and 25 quality
parameters including pH, total dissolved solids (TDS),
electrical conductivity (EC), chloride, ammonia, nitrate,
nitrite, phosphate, sulfate, total hardness (TH), total alka-
linity, turbidity, potassium, calcium, magnesium, sodium,
bicarbonate, carbonate, hydroxide alkalinity, BOD5, COD,
total solids, total suspended solids (TSS), total coliform
and fecal coliform were measured. To assess the feasibility
of usage of wastewater for irrigation, wastewater effluent
quality was compared with standards for irrigation water
quality. Since farmers in the area surrounding the plant
from the beginning of its operation (from 2005) were using
treated wastewater for irrigation, the effects of its usage on
soil characteristics were evaluated. For this reason, soil
samples were collected before of summer crop season and
its middle (May and July, respectively) from 0–30 cm
depth. Two rice fields irrigated with wastewater and one
adjacent field irrigated with fresh water were selected.
Then, soil physical and chemical properties including EC,
pH, calcium, magnesium, sodium, bicarbonate, carbonate,
sodium adsorption ratio (SAR), residual sodium carbonate
(RSC), exchangeable sodium percentage (ESP), organic
carbon, total nitrogen, phosphorus, potassium and clay, silt
and sand percentage of soil (soil texture) were measured.
Soil infiltration was measured using double rings methods
in three replications. Total wastewater and soil properties
were measured based on APHA (2012) and Klute (1986),
respectively.
Results and discussion
Assessment of influent and effluent wastewater
The results showed that all parameters were normal
based on one-sample Kolmogorov–Smirnov test. Some
descriptive statistics of BOD5, COD, SS and discharge
(Q) of influent and effluent wastewater based on monthly
and yearly average are shown in Tables 1 and 2,
respectively. Based on design criteria of Bandargaz
wastewater plant, BOD5 and SS of effluent wastewater
should be less than or equal to 170 and 205 mg/l,
respectively. Tables 1 and 2 showed that in all months
and years, means of BOD5 and SS of effluent wastewater
were less than design criteria. However, in all years and
approximately in all months, wastewater discharge
(Q) was greater than plant capacity (3,100 m3/day). It
was due to the entrance of surface runoff to the
wastewater collection network and street washing that led
to chemical dilution of wastewater.
Assessment of influent and effluent wastewater based on
analysis of variance of wastewater plant data is presented
Table 1 continued
Month Parameter BODin BODout CODin CODout SSin SSout Q
Total Mean 135.1 23.4 248.5 47.9 166.9 16.9 3,552.2
SD 41.8 9.9 70.1 11.4 114.4 7.6 1,238.7
Std. error of mean 4.9 1.2 8.3 1.3 13.5 0.9 146.0
Minimum 16.0 10.0 57.0 13.0 0.3 0.0 600.0
Maximum 206.0 49.4 336.4 71.7 1,044.0 50.0 6,271.1
Range 190.0 39.4 279.4 58.7 1,043.7 50.0 5,671.1
Variance 1,750.4 97.3 4,913.8 129.1 13,076.8 57.1 1,534,365.1
% of total sum 100.0 100.0 100.0 100.0 100.0 100.0 100.0
Unit of biological oxygen demand (BOD), chemical oxygen demand (COD) and settlement solids (SS) is mg/l and discharge (Q) is m3/day.
Influent and effluent wastewaters are shown by in and out subscripts
Appl Water Sci (2017) 7:2385–2396 2389
123
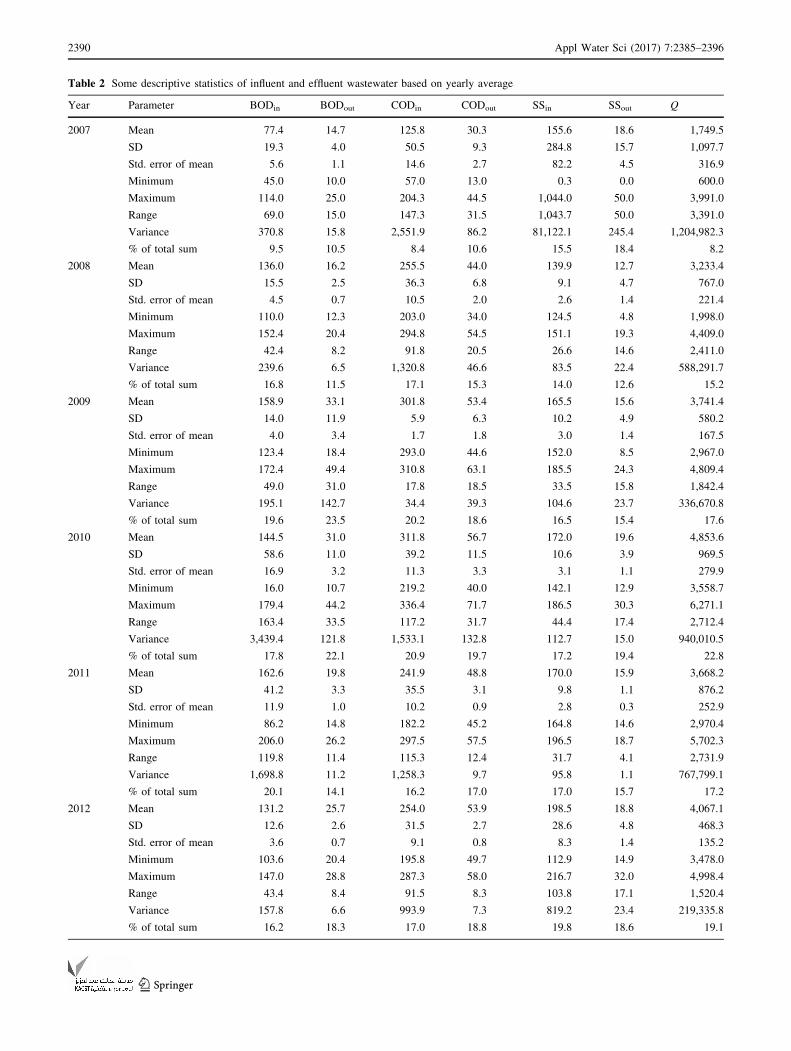
Table 2 Some descriptive statistics of influent and effluent wastewater based on yearly average
Year Parameter BODin BODout CODin CODout SSin SSout Q
2007 Mean 77.4 14.7 125.8 30.3 155.6 18.6 1,749.5
SD 19.3 4.0 50.5 9.3 284.8 15.7 1,097.7
Std. error of mean 5.6 1.1 14.6 2.7 82.2 4.5 316.9
Minimum 45.0 10.0 57.0 13.0 0.3 0.0 600.0
Maximum 114.0 25.0 204.3 44.5 1,044.0 50.0 3,991.0
Range 69.0 15.0 147.3 31.5 1,043.7 50.0 3,391.0
Variance 370.8 15.8 2,551.9 86.2 81,122.1 245.4 1,204,982.3
% of total sum 9.5 10.5 8.4 10.6 15.5 18.4 8.2
2008 Mean 136.0 16.2 255.5 44.0 139.9 12.7 3,233.4
SD 15.5 2.5 36.3 6.8 9.1 4.7 767.0
Std. error of mean 4.5 0.7 10.5 2.0 2.6 1.4 221.4
Minimum 110.0 12.3 203.0 34.0 124.5 4.8 1,998.0
Maximum 152.4 20.4 294.8 54.5 151.1 19.3 4,409.0
Range 42.4 8.2 91.8 20.5 26.6 14.6 2,411.0
Variance 239.6 6.5 1,320.8 46.6 83.5 22.4 588,291.7
% of total sum 16.8 11.5 17.1 15.3 14.0 12.6 15.2
2009 Mean 158.9 33.1 301.8 53.4 165.5 15.6 3,741.4
SD 14.0 11.9 5.9 6.3 10.2 4.9 580.2
Std. error of mean 4.0 3.4 1.7 1.8 3.0 1.4 167.5
Minimum 123.4 18.4 293.0 44.6 152.0 8.5 2,967.0
Maximum 172.4 49.4 310.8 63.1 185.5 24.3 4,809.4
Range 49.0 31.0 17.8 18.5 33.5 15.8 1,842.4
Variance 195.1 142.7 34.4 39.3 104.6 23.7 336,670.8
% of total sum 19.6 23.5 20.2 18.6 16.5 15.4 17.6
2010 Mean 144.5 31.0 311.8 56.7 172.0 19.6 4,853.6
SD 58.6 11.0 39.2 11.5 10.6 3.9 969.5
Std. error of mean 16.9 3.2 11.3 3.3 3.1 1.1 279.9
Minimum 16.0 10.7 219.2 40.0 142.1 12.9 3,558.7
Maximum 179.4 44.2 336.4 71.7 186.5 30.3 6,271.1
Range 163.4 33.5 117.2 31.7 44.4 17.4 2,712.4
Variance 3,439.4 121.8 1,533.1 132.8 112.7 15.0 940,010.5
% of total sum 17.8 22.1 20.9 19.7 17.2 19.4 22.8
2011 Mean 162.6 19.8 241.9 48.8 170.0 15.9 3,668.2
SD 41.2 3.3 35.5 3.1 9.8 1.1 876.2
Std. error of mean 11.9 1.0 10.2 0.9 2.8 0.3 252.9
Minimum 86.2 14.8 182.2 45.2 164.8 14.6 2,970.4
Maximum 206.0 26.2 297.5 57.5 196.5 18.7 5,702.3
Range 119.8 11.4 115.3 12.4 31.7 4.1 2,731.9
Variance 1,698.8 11.2 1,258.3 9.7 95.8 1.1 767,799.1
% of total sum 20.1 14.1 16.2 17.0 17.0 15.7 17.2
2012 Mean 131.2 25.7 254.0 53.9 198.5 18.8 4,067.1
SD 12.6 2.6 31.5 2.7 28.6 4.8 468.3
Std. error of mean 3.6 0.7 9.1 0.8 8.3 1.4 135.2
Minimum 103.6 20.4 195.8 49.7 112.9 14.9 3,478.0
Maximum 147.0 28.8 287.3 58.0 216.7 32.0 4,998.4
Range 43.4 8.4 91.5 8.3 103.8 17.1 1,520.4
Variance 157.8 6.6 993.9 7.3 819.2 23.4 219,335.8
% of total sum 16.2 18.3 17.0 18.8 19.8 18.6 19.1
2390 Appl Water Sci (2017) 7:2385–2396
123
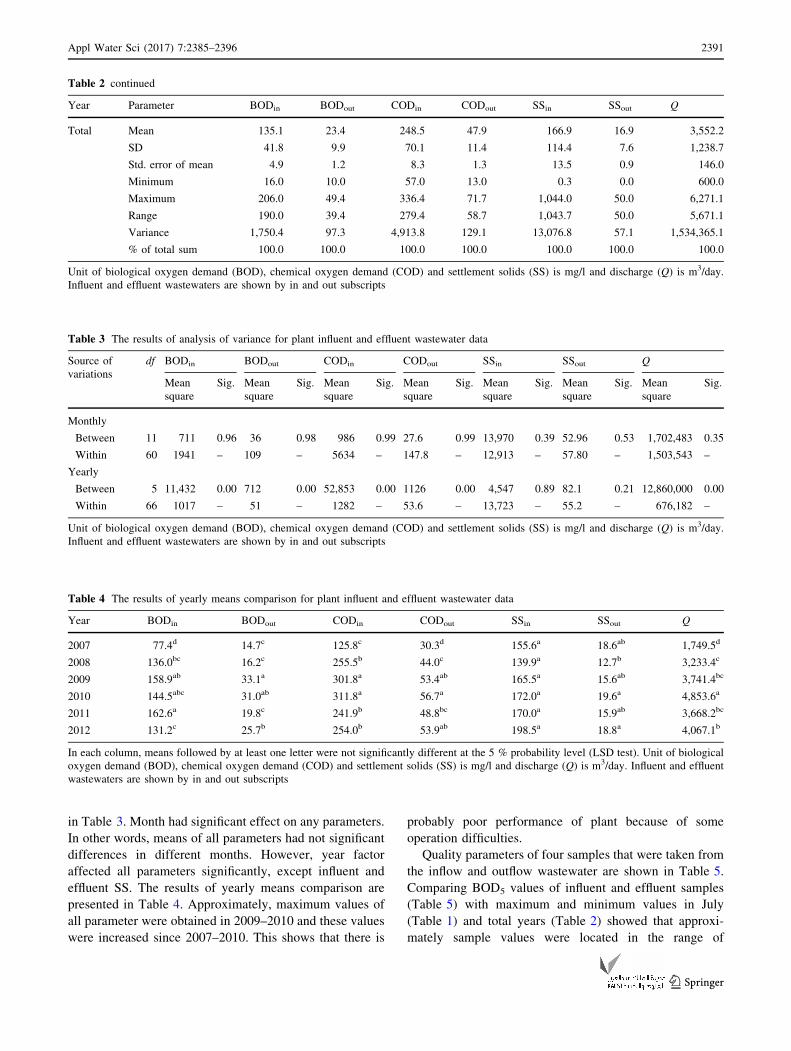
in Table 3. Month had significant effect on any parameters.
In other words, means of all parameters had not significant
differences in different months. However, year factor
affected all parameters significantly, except influent and
effluent SS. The results of yearly means comparison are
presented in Table 4. Approximately, maximum values of
all parameter were obtained in 2009–2010 and these values
were increased since 2007–2010. This shows that there is
probably poor performance of plant because of some
operation difficulties.
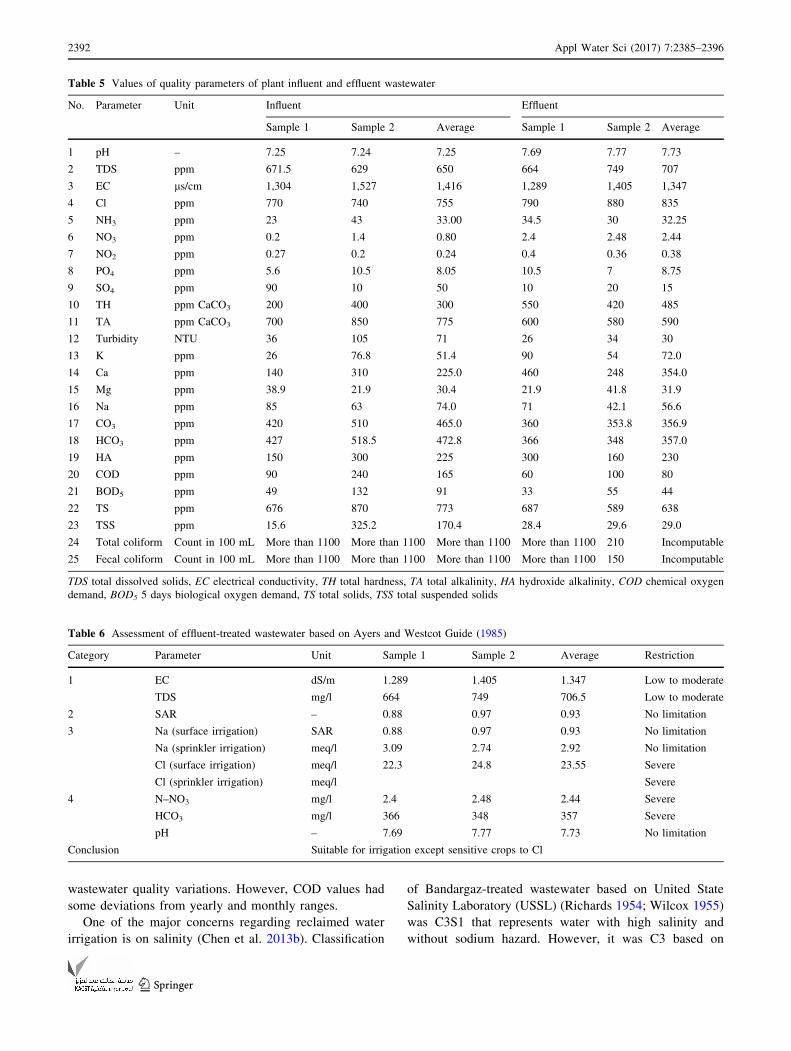
Quality parameters of four samples that were taken from
the inflow and outflow wastewater are shown in Table 5.
Comparing BOD5 values of influent and effluent samples
(Table 5) with maximum and minimum values in July
(Table 1) and total years (Table 2) showed that approxi-
mately sample values were located in the range of
Table 2 continued
Year Parameter BODin BODout CODin CODout SSin SSout Q
Total Mean 135.1 23.4 248.5 47.9 166.9 16.9 3,552.2
SD 41.8 9.9 70.1 11.4 114.4 7.6 1,238.7
Std. error of mean 4.9 1.2 8.3 1.3 13.5 0.9 146.0
Minimum 16.0 10.0 57.0 13.0 0.3 0.0 600.0
Maximum 206.0 49.4 336.4 71.7 1,044.0 50.0 6,271.1
Range 190.0 39.4 279.4 58.7 1,043.7 50.0 5,671.1
Variance 1,750.4 97.3 4,913.8 129.1 13,076.8 57.1 1,534,365.1
% of total sum 100.0 100.0 100.0 100.0 100.0 100.0 100.0
Unit of biological oxygen demand (BOD), chemical oxygen demand (COD) and settlement solids (SS) is mg/l and discharge (Q) is m3/day.
Influent and effluent wastewaters are shown by in and out subscripts
Table 3 The results of analysis of variance for plant influent and effluent wastewater data
Source of
variations
df BODin BODout CODin CODout SSin SSout Q
Mean
square
Sig. Mean
square
Sig. Mean
square
Sig. Mean
square
Sig. Mean
square
Sig. Mean
square
Sig. Mean
square
Sig.
Monthly
Between 11 711 0.96 36 0.98 986 0.99 27.6 0.99 13,970 0.39 52.96 0.53 1,702,483 0.35
Within 60 1941 – 109 – 5634 – 147.8 – 12,913 – 57.80 – 1,503,543 –
Yearly
Between 5 11,432 0.00 712 0.00 52,853 0.00 1126 0.00 4,547 0.89 82.1 0.21 12,860,000 0.00
Within 66 1017 – 51 – 1282 – 53.6 – 13,723 – 55.2 – 676,182 –
Unit of biological oxygen demand (BOD), chemical oxygen demand (COD) and settlement solids (SS) is mg/l and discharge (Q) is m3/day.
Influent and effluent wastewaters are shown by in and out subscripts
Table 4 The results of yearly means comparison for plant influent and effluent wastewater data
Year BODin BODout CODin CODout SSin SSout Q
2007 77.4d 14.7c 125.8c 30.3d 155.6a 18.6ab 1,749.5d
2008 136.0bc 16.2c 255.5b 44.0c 139.9a 12.7b 3,233.4c
2009 158.9ab 33.1a 301.8a 53.4ab 165.5a 15.6ab 3,741.4bc
2010 144.5abc 31.0ab 311.8a 56.7a 172.0a 19.6a 4,853.6a
2011 162.6a 19.8c 241.9b 48.8bc 170.0a 15.9ab 3,668.2bc
2012 131.2c 25.7b 254.0b 53.9ab 198.5a 18.8a 4,067.1b
In each column, means followed by at least one letter were not significantly different at the 5 % probability level (LSD test). Unit of biological
oxygen demand (BOD), chemical oxygen demand (COD) and settlement solids (SS) is mg/l and discharge (Q) is m3/day. Influent and effluent
wastewaters are shown by in and out subscripts
Appl Water Sci (2017) 7:2385–2396 2391
123
wastewater quality variations. However, COD values had
some deviations from yearly and monthly ranges.
One of the major concerns regarding reclaimed water
irrigation is on salinity (Chen et al. 2013b). Classification
of Bandargaz-treated wastewater based on United State
Salinity Laboratory (USSL) (Richards 1954; Wilcox 1955)
was C3S1 that represents water with high salinity and
without sodium hazard. However, it was C3 based on
Table 5 Values of quality parameters of plant influent and effluent wastewater
No. Parameter Unit Influent Effluent
Sample 1 Sample 2 Average Sample 1 Sample 2 Average
1 pH – 7.25 7.24 7.25 7.69 7.77 7.73
2 TDS ppm 671.5 629 650 664 749 707
3 EC ls/cm 1,304 1,527 1,416 1,289 1,405 1,347
4 Cl ppm 770 740 755 790 880 835
5 NH3 ppm 23 43 33.00 34.5 30 32.25
6 NO3 ppm 0.2 1.4 0.80 2.4 2.48 2.44
7 NO2 ppm 0.27 0.2 0.24 0.4 0.36 0.38
8 PO4 ppm 5.6 10.5 8.05 10.5 7 8.75
9 SO4 ppm 90 10 50 10 20 15
10 TH ppm CaCO3 200 400 300 550 420 485
11 TA ppm CaCO3 700 850 775 600 580 590
12 Turbidity NTU 36 105 71 26 34 30
13 K ppm 26 76.8 51.4 90 54 72.0
14 Ca ppm 140 310 225.0 460 248 354.0
15 Mg ppm 38.9 21.9 30.4 21.9 41.8 31.9
16 Na ppm 85 63 74.0 71 42.1 56.6
17 CO3 ppm 420 510 465.0 360 353.8 356.9
18 HCO3 ppm 427 518.5 472.8 366 348 357.0
19 HA ppm 150 300 225 300 160 230
20 COD ppm 90 240 165 60 100 80
21 BOD5 ppm 49 132 91 33 55 44
22 TS ppm 676 870 773 687 589 638
23 TSS ppm 15.6 325.2 170.4 28.4 29.6 29.0
24 Total coliform Count in 100 mL More than 1100 More than 1100 More than 1100 More than 1100 210 Incomputable
25 Fecal coliform Count in 100 mL More than 1100 More than 1100 More than 1100 More than 1100 150 Incomputable
TDS total dissolved solids, EC electrical conductivity, TH total hardness, TA total alkalinity, HA hydroxide alkalinity, COD chemical oxygen
demand, BOD5 5 days biological oxygen demand, TS total solids, TSS total suspended solids
Table 6 Assessment of effluent-treated wastewater based on Ayers and Westcot Guide (1985)
Category Parameter Unit Sample 1 Sample 2 Average Restriction
1 EC dS/m 1.289 1.405 1.347 Low to moderate
TDS mg/l 664 749 706.5 Low to moderate
2 SAR – 0.88 0.97 0.93 No limitation
3 Na (surface irrigation) SAR 0.88 0.97 0.93 No limitation
Na (sprinkler irrigation) meq/l 3.09 2.74 2.92 No limitation
Cl (surface irrigation) meq/l 22.3 24.8 23.55 Severe
Cl (sprinkler irrigation) meq/l Severe
4 N–NO3 mg/l 2.4 2.48 2.44 Severe
HCO3 mg/l 366 348 357 Severe
pH – 7.69 7.77 7.73 No limitation
Conclusion Suitable for irrigation except sensitive crops to Cl
2392 Appl Water Sci (2017) 7:2385–2396
123
Richards (1954) that is suitable for salt-tolerant crop. The
results showed that based on Ayers and Westcot Guide
(1985), Bandargaz-treated wastewater is suitable for irri-
gation except for chlorine sensitive crops (Table 6).
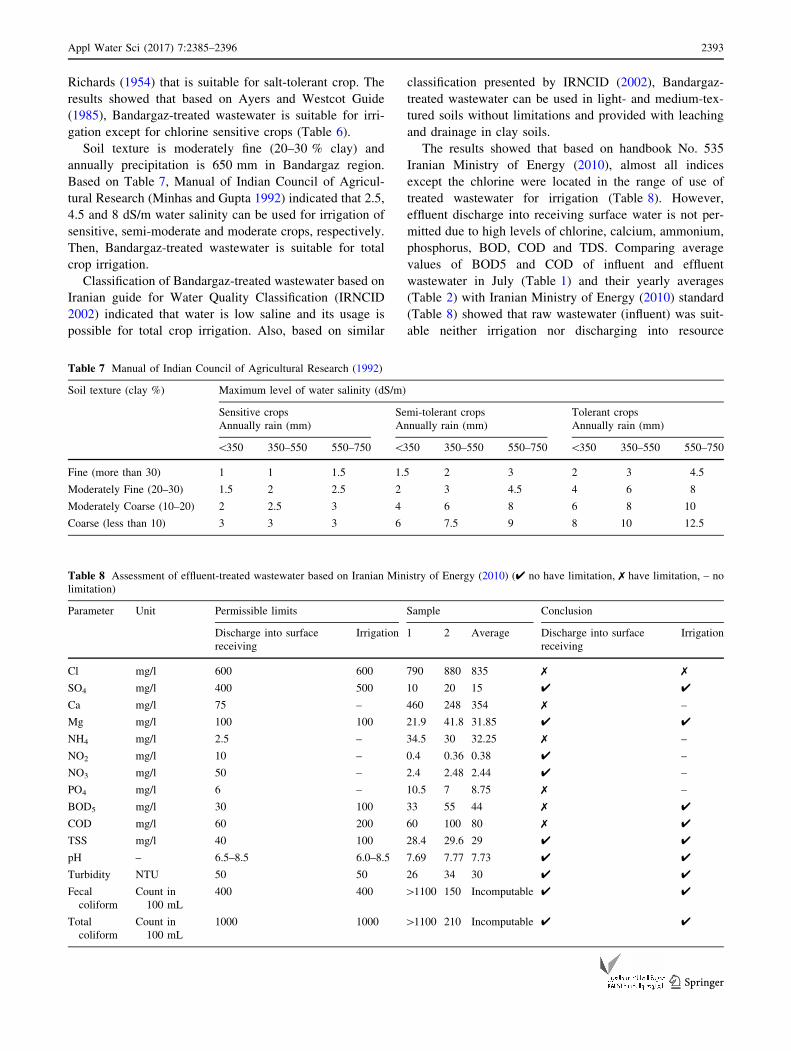
Soil texture is moderately fine (20–30 % clay) and
annually precipitation is 650 mm in Bandargaz region.
Based on Table 7, Manual of Indian Council of Agricul-
tural Research (Minhas and Gupta 1992) indicated that 2.5,
4.5 and 8 dS/m water salinity can be used for irrigation of
sensitive, semi-moderate and moderate crops, respectively.
Then, Bandargaz-treated wastewater is suitable for total
crop irrigation.
Classification of Bandargaz-treated wastewater based on
Iranian guide for Water Quality Classification (IRNCID
2002) indicated that water is low saline and its usage is
possible for total crop irrigation. Also, based on similar
classification presented by IRNCID (2002), Bandargaz-
treated wastewater can be used in light- and medium-tex-
tured soils without limitations and provided with leaching
and drainage in clay soils.
The results showed that based on handbook No. 535
Iranian Ministry of Energy (2010), almost all indices
except the chlorine were located in the range of use of
treated wastewater for irrigation (Table 8). However,
effluent discharge into receiving surface water is not per-
mitted due to high levels of chlorine, calcium, ammonium,
phosphorus, BOD, COD and TDS. Comparing average
values of BOD5 and COD of influent and effluent
wastewater in July (Table 1) and their yearly averages
(Table 2) with Iranian Ministry of Energy (2010) standard
(Table 8) showed that raw wastewater (influent) was suit-
able neither irrigation nor discharging into resource
Table 7 Manual of Indian Council of Agricultural Research (1992)
Soil texture (clay %) Maximum level of water salinity (dS/m)
Sensitive crops
Annually rain (mm)
Semi-tolerant crops
Annually rain (mm)
Tolerant crops
Annually rain (mm)
\350 350–550 550–750 \350 350–550 550–750 \350 350–550 550–750
Fine (more than 30) 1 1 1.5 1.5 2 3 2 3 4.5
Moderately Fine (20–30) 1.5 2 2.5 2 3 4.5 4 6 8
Moderately Coarse (10–20) 2 2.5 3 4 6 8 6 8 10
Coarse (less than 10) 3 3 3 6 7.5 9 8 10 12.5
Table 8 Assessment of effluent-treated wastewater based on Iranian Ministry of Energy (2010) (4 no have limitation, 7 have limitation, – no
limitation)
Parameter Unit Permissible limits Sample Conclusion
Discharge into surface
receiving
Irrigation 1 2 Average Discharge into surface
receiving
Irrigation
Cl mg/l 600 600 790 880 835 7 7
SO4 mg/l 400 500 10 20 15 4 4
Ca mg/l 75 – 460 248 354 7 –
Mg mg/l 100 100 21.9 41.8 31.85 4 4
NH4 mg/l 2.5 – 34.5 30 32.25 7 –
NO2 mg/l 10 – 0.4 0.36 0.38 4 –
NO3 mg/l 50 – 2.4 2.48 2.44 4 –
PO4 mg/l 6 – 10.5 7 8.75 7 –
BOD5 mg/l 30 100 33 55 44 7 4
COD mg/l 60 200 60 100 80 7 4
TSS mg/l 40 100 28.4 29.6 29 4 4
pH – 6.5–8.5 6.0–8.5 7.69 7.77 7.73 4 4
Turbidity NTU 50 50 26 34 30 4 4
Fecal
coliform
Count in
100 mL
400 400 [1100 150 Incomputable 4 4
Total
coliform
Count in
100 mL
1000 1000 [1100 210 Incomputable 4 4
Appl Water Sci (2017) 7:2385–2396 2393
123
receiving surface water. However, based on Tables 1 and
2, effluent wastewater was suitable for irrigation purposes
and discharging into surface water receiving resources.
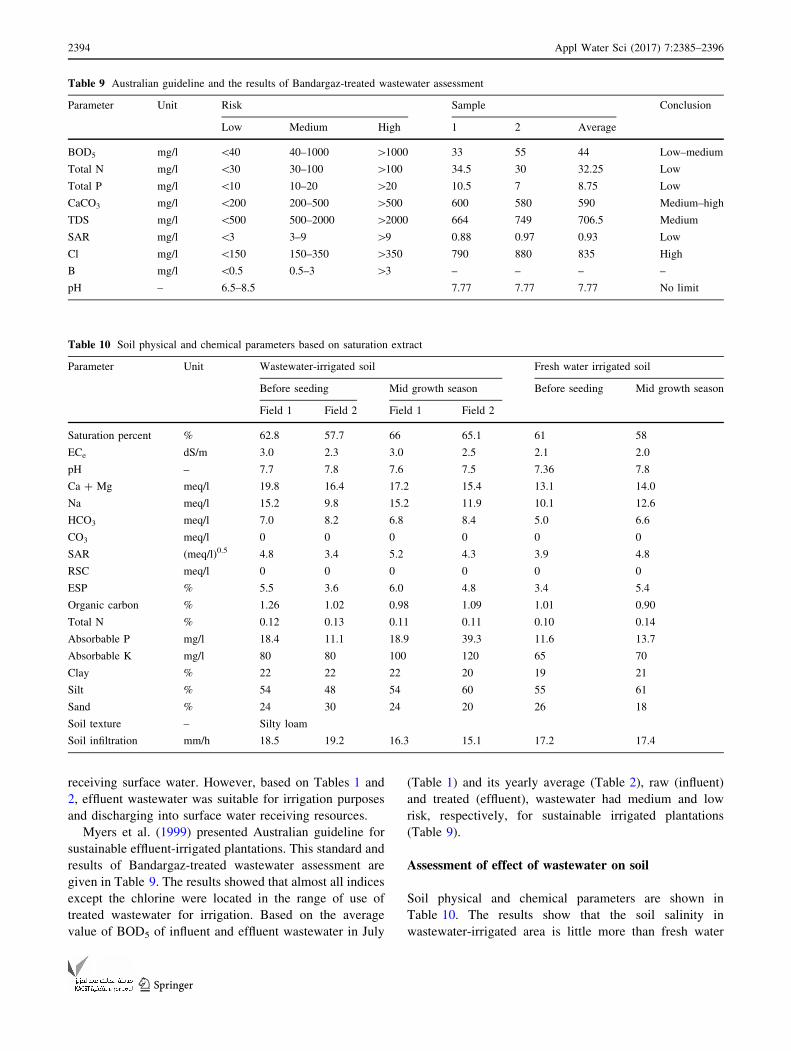
Myers et al. (1999) presented Australian guideline for
sustainable effluent-irrigated plantations. This standard and
results of Bandargaz-treated wastewater assessment are
given in Table 9. The results showed that almost all indices
except the chlorine were located in the range of use of
treated wastewater for irrigation. Based on the average
value of BOD5 of influent and effluent wastewater in July
(Table 1) and its yearly average (Table 2), raw (influent)
and treated (effluent), wastewater had medium and low
risk, respectively, for sustainable irrigated plantations
(Table 9).
Assessment of effect of wastewater on soil
Soil physical and chemical parameters are shown in
Table 10. The results show that the soil salinity in
wastewater-irrigated area is little more than fresh water
Table 9 Australian guideline and the results of Bandargaz-treated wastewater assessment
Parameter Unit Risk Sample Conclusion
Low Medium High 1 2 Average
BOD5 mg/l \40 40–1000 [1000 33 55 44 Low–medium
Total N mg/l \30 30–100 [100 34.5 30 32.25 Low
Total P mg/l \10 10–20 [20 10.5 7 8.75 Low
CaCO3 mg/l \200 200–500 [500 600 580 590 Medium–high
TDS mg/l \500 500–2000 [2000 664 749 706.5 Medium
SAR mg/l \3 3–9 [9 0.88 0.97 0.93 Low
Cl mg/l \150 150–350 [350 790 880 835 High
B mg/l \0.5 0.5–3 [3 – – – –
pH – 6.5–8.5 7.77 7.77 7.77 No limit
Table 10 Soil physical and chemical parameters based on saturation extract
Parameter Unit Wastewater-irrigated soil Fresh water irrigated soil
Before seeding Mid growth season Before seeding Mid growth season
Field 1 Field 2 Field 1 Field 2
Saturation percent % 62.8 57.7 66 65.1 61 58
ECe dS/m 3.0 2.3 3.0 2.5 2.1 2.0
pH – 7.7 7.8 7.6 7.5 7.36 7.8
Ca ? Mg meq/l 19.8 16.4 17.2 15.4 13.1 14.0
Na meq/l 15.2 9.8 15.2 11.9 10.1 12.6
HCO3 meq/l 7.0 8.2 6.8 8.4 5.0 6.6
CO3 meq/l 0 0 0 0 0 0
SAR (meq/l)0.5 4.8 3.4 5.2 4.3 3.9 4.8
RSC meq/l 0 0 0 0 0 0
ESP % 5.5 3.6 6.0 4.8 3.4 5.4
Organic carbon % 1.26 1.02 0.98 1.09 1.01 0.90
Total N % 0.12 0.13 0.11 0.11 0.10 0.14
Absorbable P mg/l 18.4 11.1 18.9 39.3 11.6 13.7
Absorbable K mg/l 80 80 100 120 65 70
Clay % 22 22 22 20 19 21
Silt % 54 48 54 60 55 61
Sand % 24 30 24 20 26 18
Soil texture – Silty loam
Soil infiltration mm/h 18.5 19.2 16.3 15.1 17.2 17.4
2394 Appl Water Sci (2017) 7:2385–2396
123
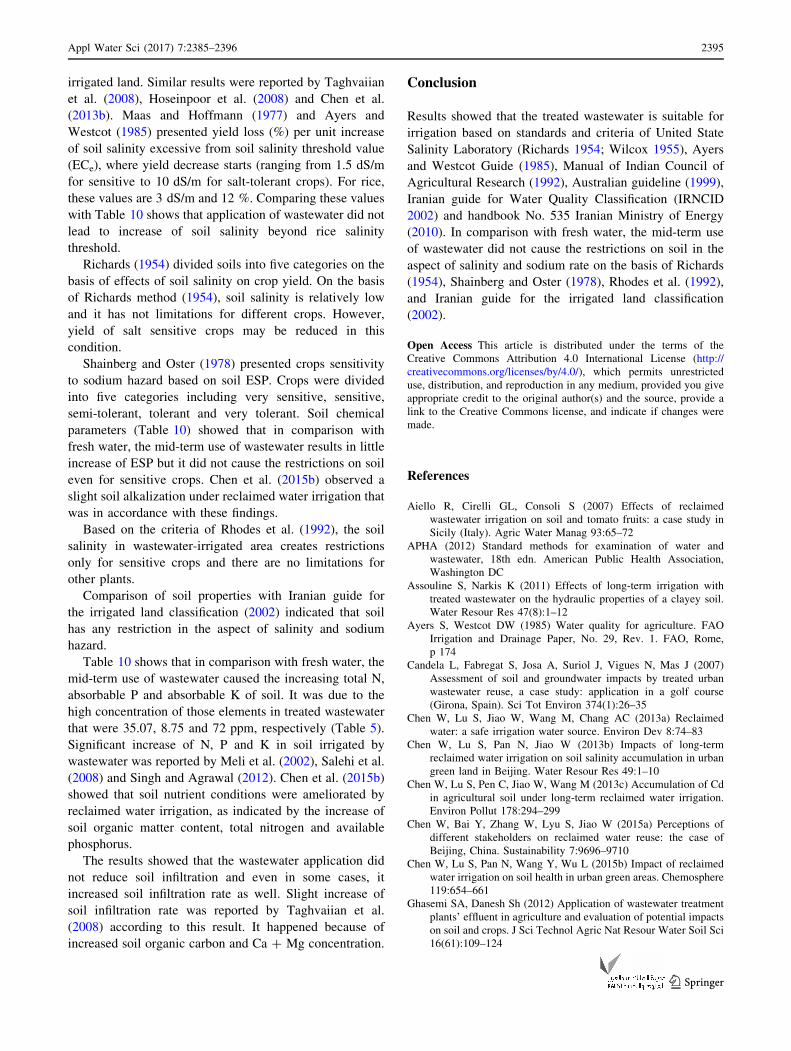
irrigated land. Similar results were reported by Taghvaiian
et al. (2008), Hoseinpoor et al. (2008) and Chen et al.
(2013b). Maas and Hoffmann (1977) and Ayers and
Westcot (1985) presented yield loss (%) per unit increase
of soil salinity excessive from soil salinity threshold value
(ECe), where yield decrease starts (ranging from 1.5 dS/m
for sensitive to 10 dS/m for salt-tolerant crops). For rice,
these values are 3 dS/m and 12 %. Comparing these values
with Table 10 shows that application of wastewater did not
lead to increase of soil salinity beyond rice salinity
threshold.
Richards (1954) divided soils into five categories on the
basis of effects of soil salinity on crop yield. On the basis
of Richards method (1954), soil salinity is relatively low
and it has not limitations for different crops. However,
yield of salt sensitive crops may be reduced in this
condition.
Shainberg and Oster (1978) presented crops sensitivity
to sodium hazard based on soil ESP. Crops were divided
into five categories including very sensitive, sensitive,
semi-tolerant, tolerant and very tolerant. Soil chemical
parameters (Table 10) showed that in comparison with
fresh water, the mid-term use of wastewater results in little
increase of ESP but it did not cause the restrictions on soil
even for sensitive crops. Chen et al. (2015b) observed a
slight soil alkalization under reclaimed water irrigation that
was in accordance with these findings.
Based on the criteria of Rhodes et al. (1992), the soil
salinity in wastewater-irrigated area creates restrictions
only for sensitive crops and there are no limitations for
other plants.
Comparison of soil properties with Iranian guide for
the irrigated land classification (2002) indicated that soil
has any restriction in the aspect of salinity and sodium
hazard.
Table 10 shows that in comparison with fresh water, the
mid-term use of wastewater caused the increasing total N,
absorbable P and absorbable K of soil. It was due to the
high concentration of those elements in treated wastewater
that were 35.07, 8.75 and 72 ppm, respectively (Table 5).
Significant increase of N, P and K in soil irrigated by
wastewater was reported by Meli et al. (2002), Salehi et al.
(2008) and Singh and Agrawal (2012). Chen et al. (2015b)
showed that soil nutrient conditions were ameliorated by
reclaimed water irrigation, as indicated by the increase of
soil organic matter content, total nitrogen and available
phosphorus.
The results showed that the wastewater application did
not reduce soil infiltration and even in some cases, it
increased soil infiltration rate as well. Slight increase of
soil infiltration rate was reported by Taghvaiian et al.
(2008) according to this result. It happened because of
increased soil organic carbon and Ca ? Mg concentration.
Conclusion
Results showed that the treated wastewater is suitable for
irrigation based on standards and criteria of United State
Salinity Laboratory (Richards 1954; Wilcox 1955), Ayers
and Westcot Guide (1985), Manual of Indian Council of
Agricultural Research (1992), Australian guideline (1999),
Iranian guide for Water Quality Classification (IRNCID
2002) and handbook No. 535 Iranian Ministry of Energy
(2010). In comparison with fresh water, the mid-term use
of wastewater did not cause the restrictions on soil in the
aspect of salinity and sodium rate on the basis of Richards
(1954), Shainberg and Oster (1978), Rhodes et al. (1992),
and Iranian guide for the irrigated land classification
(2002).
Open Access This article is distributed under the terms of the
Creative Commons Attribution 4.0 International License (http://
creativecommons.org/licenses/by/4.0/), which permits unrestricted
use, distribution, and reproduction in any medium, provided you give
appropriate credit to the original author(s) and the source, provide a
link to the Creative Commons license, and indicate if changes were
made.
References
Aiello R, Cirelli GL, Consoli S (2007) Effects of reclaimed
wastewater irrigation on soil and tomato fruits: a case study in
Sicily (Italy). Agric Water Manag 93:65–72
APHA (2012) Standard methods for examination of water and
wastewater, 18th edn. American Public Health Association,
Washington DC
Assouline S, Narkis K (2011) Effects of long-term irrigation with
treated wastewater on the hydraulic properties of a clayey soil.
Water Resour Res 47(8):1–12
Ayers S, Westcot DW (1985) Water quality for agriculture. FAO
Irrigation and Drainage Paper, No. 29, Rev. 1. FAO, Rome,
p 174
Candela L, Fabregat S, Josa A, Suriol J, Vigues N, Mas J (2007)
Assessment of soil and groundwater impacts by treated urban
wastewater reuse, a case study: application in a golf course
(Girona, Spain). Sci Tot Environ 374(1):26–35
Chen W, Lu S, Jiao W, Wang M, Chang AC (2013a) Reclaimed
water: a safe irrigation water source. Environ Dev 8:74–83
Chen W, Lu S, Pan N, Jiao W (2013b) Impacts of long-term
reclaimed water irrigation on soil salinity accumulation in urban
green land in Beijing. Water Resour Res 49:1–10
Chen W, Lu S, Pen C, Jiao W, Wang M (2013c) Accumulation of Cd
in agricultural soil under long-term reclaimed water irrigation.
Environ Pollut 178:294–299
Chen W, Bai Y, Zhang W, Lyu S, Jiao W (2015a) Perceptions of
different stakeholders on reclaimed water reuse: the case of
Beijing, China. Sustainability 7:9696–9710
Chen W, Lu S, Pan N, Wang Y, Wu L (2015b) Impact of reclaimed
water irrigation on soil health in urban green areas. Chemosphere
119:654–661
Ghasemi SA, Danesh Sh (2012) Application of wastewater treatment
plants’ effluent in agriculture and evaluation of potential impacts
on soil and crops. J Sci Technol Agric Nat Resour Water Soil Sci
16(61):109–124
Appl Water Sci (2017) 7:2385–2396 2395
123
Gomez KA, Gomez AA (1984) Statistical procedures for agricultural
research. Wiley, New York, p 680
Hamilton AJ, Stagnitti F, Xiong XZ, Kreidl SL, Benke KK, Maher P
(2007) Wastewater irrigation: the state of play. Vadose Zone J
6:823–840
Hasanli AM, Javan M (2006) The evaluating of municipal effluent in
irrigation of green species (case study: Marvdasht sewage
treatment plant). J Environ Stud 31(38):23–30
Hoseinpoor A, Haghnia GhH, Alizadeh A, Fotovat A (2008) Effect of
irrigation with raw and treated wastewaters on some chemical
characteristic of soil in different depth under continuously and
intermittent flood conditions. Iran J Irrig Drain 1(2):73–85
Iranian Ministry of Energy (2010) Environmental criteria of treated
waste water and return flow reuse. Handbook No. 535, p 135
IRNCID (2002) Saline water utilization in sustainable agriculture.
Iranian National Committee on Irrigation and Drainage (IRN-
CID), No. 69, p 235
Klute A (1986) Methods of soil analysis, part 1: physical and
mineralogical methods, 2nd edn. American Society of Agron-
omy and Soil Science Society of America, Madison
Levantesi C, La Mantia R, Masciopinto C, Bockelmann U, Ayuso-
Gabella MN, Salgot M, Tandoi V, Van Houtte E, Wintgens T,
Grohmann E (2010) Quantification of pathogenic microorgan-
isms and microbial indicators in three wastewater reclamation
and managed aquifer recharge facilities in Europe. Sci Tot
Environ 408:4923–4930
Lyu S, Chen W (2016) Soil quality assessment of urban green space
under long-term reclaimed water irrigation. Environ Sci Pollut
Res 23(5):4639–4649
Maas EV, Hoffmann GJ (1977) Crop salt tolerance. In: Tanji KK (ed)
Agricultural salinity assessment and management manual.
ASCE, New York, pp 262–304
Meli S, Porto M, Belligno A, Bufo SA, Mazzatura A, Scopa A (2002)
Influence of irrigation with lagooned urban wastewater on
chemical and microbiological soil parameters in a citrus orchard
under Mediterranean condition. Sci Tot Environ 285(1–3):69–77
Minhas PS, Gupta RK (1992) Quality of irrigation water: assessment
and management. Indian Council of Agricultural Research,
Publication Section, New Delhi, p 123
Myers BJ, Bond WJ, Benyon RG, Falkiner RA, Polglase PJ,
Smith CJ, Snow VO, Theiveyanathan S (1999) Sustainable
effluent-irrigated plantations: an Australian guideline (1999). An
Australian Guideline CSIRO Forestry and Forest Products,
Melbourne
Pereira BFF, He ZL, Stoffella PJ, Montes CR, Melfi AJ, Baligar VC
(2012) Nutrients and nonessential elements in soil after 11 years
of wastewater irrigation. J Environ Qual 41:920–927
Pescod MB (1992) Wastewater treatment and use in agriculture. FAO
Irrigation and Drainage Paper, No. 47, p 113
Rhodes JD, Kandiah A, Mashali AM (1992) The use of saline water
for crop production, water conservation and environmental
production. FAO Irrigation and Drainage Paper No. 48. FAO,
Rome, p 153
Richards LA (1954) Diagnosis and improvement of saline and alkali
soils. USDA handbook 60, p 160
Rohani Shahraki F, Mahdavi R, Rezaee M (2006) Effect of irrigation
with wastewater on certain soil physical and chemical properties.
J Water Wastewater 16(1):23–29
Salehi A, Tabari M, Mohammadi J, Aliarb A (2008) Effect of
irrigation with municipal effluent on soil and growth of Pinus
eldarica Medw. trees. Iran J For Poplar Res 16(2):186–196
Shainberg I, Oster JD (1978) Quality of irrigation water. In:
International Irrigation Information Center Publication 2, Bet
Dagan, Israel. Pergamon Press, New York, NY, p 65
Singh A, Agrawal M (2012) Effects of waste water irrigation on
physical and biochemical characteristics of soil and metal
partitioning in Beta vulgaris L. Agric Res 1(4):379–391
Singh PK, Deshbhratar PB, Ramteke DS (2012) Effects of sewage
wastewater irrigation on soil properties, crop yield and environ-
ment. Agric Water Manag 103:100–104
Smirnov N (1948) Table for estimating the goodness of fit of
empirical distributions. Ann Math Stat 19(2):279–281. doi:10.
1214/aoms/1177730256
Taghvaiian S, Alizadeh A, Danesh S (2008) The effects of wastewater
usage as irrigation water on soil physical and some chemical
properties. Iran Irrig Drain J 1(1):49–60
Torabian A, Motallebi M (2003) Management plan for treated
wastewater reuse (case study: Ekbatan Town). J Environ Stud
32:56–62
Wang M, Peng C, Chen W, Markert B (2013) Ecological Risks of
Polycyclic musk in Soils Irrigated with Reclaimed Municipal
Wastewater. Ecotoxicol Environ Saf 97:242–247
Wilcox LV (1955) Classification and use of irrigation waters. US
Department of Agriculture, Arc 969, Washington DC
2396 Appl Water Sci (2017) 7:2385–2396
123