Embed Size (px)
Citation preview
1
Evaluation of Three Different Selective Media for Enumeration of Clostridium perfringens
in Untreated and Treated Wastewater
A.J. Karon
A Technical report submitted to the faculty of the University of North Carolina at Chapel Hill in
partial fulfillment of the requirements for the degree of Masters of Science in Public Health in
the Environmental Science and Engineering department
Chapel Hill
2016
Approved by:
Mark Sobsey, PhD
Jill Stewart, PhD
Lisa Casanova, PhD

2
ABSTRACT
A.J. Karon: Evaluation of Three Different Selective Media for Enumeration of Clostridium
perfringens in Untreated and Treated Wastewater
(Under the direction of Mark Sobsey)
Current and emerging legislation in North Carolina and other regions calls for the
enumeration of Clostridium perfringens as a surrogate indicator for protozoan parasites in
various types of waters. Past studies that have evaluated selective media for the detection of this
bacterium have provided limited, conflicting, and inconclusive results. In this study membrane
filtration was used to enumerate C. perfringens as culturable spores or total culturable cells in 19
samples of untreated and 25 samples of partially treated wastewaters on three candidate media,
Tryptose Sulfite Cycloserine Agar (TSC), CP ChromoSelect Agar (CCP), and membrane
Clostridium perfringens Agar (m-CP) in parallel, and the results were compared. Presumptive
isolates from each agar were further subjected to phenotypic confirmation tests for acid
phosphatase production and stormy fermentation to determine the performance of each agar. The
CCP agar was determined to have the highest enumerative capacity of total C. perfringens cells
when compared to both TSC agar and m-CP agar (p-value < 0.05), but there was no significant
difference in its ability to detect spores when compared to TSC agar (p-value >0.05). The overall
specificity of CCP agar as determined by agreement of results from both confirmation tests was
0.81, while the specificity of TSC agar was only 0.28. Based on its performance, ease of
preparation and use and consistency of colony characteristics, CCP agar is recommended as the
preferred medium for C. perfringens enumeration in wastewater.

3
Table of Contents LIST OF TABLES .............................................................................................................................................. 3
LIST OF FIGURES ............................................................................................................................................ 6
INTRODUCTION ............................................................................................................................................. 4
OBJECTIVE ..................................................................................................................................................... 9
REVIEW OF THE LITERATURE ........................................................................................................................ 9
Clostridium perfringens ............................................................................................................................. 9
Clostridium perfringens Agar Media Comparison ................................................................................... 11
Phenotypic Confirmation Tests ............................................................................................................... 16
METHODS .................................................................................................................................................... 18
Sample Collection ................................................................................................................................... 18
Sample handling ...................................................................................................................................... 21
Clostridium perfringens Analysis Procedures ......................................................................................... 21
Membrane Filtration Method ................................................................................................................. 23
Acid-phosphatase Confirmation Method ............................................................................................... 26
Stormy Fermentation Method ................................................................................................................ 26
Clostridium perfringens Data Analysis Procedures ................................................................................. 27
RESULTS ...................................................................................................................................................... 29
DISCUSSION ................................................................................................................................................. 49
Limitations………………………………………………………………………………………………………………………………………….55
CONCLUSION ............................................................................................................................................. 556
Future Work .......................................................................................................................................... 567
APPENDIX 1: Raw Data Tables and Contingency Tables ........................................................................... 578
APPENDIX 2: Clostridium perfringens bench sheet ................................................................................... 656
REFERENCES .............................................................................................................................................. 734

4
LIST OF TABLES Table 1. Summary of Wastewater Treatment Processes and Sample Collection Scheme………20
Table 2. Number and type of samples analyzed by treatment plant……………………………..20
Table 3. Central tendency statistics and ranges for concentrations of presumptive C. perfringens
detected by TSC, CCP, and M-CP agars in pasteurized and unpasteurized samples of
untreated sewage and secondary treated effluent………………………………………………...37
Table 4. Results of Friedman test comparing the matched concentrations of total
C. perfringens and spores in secondary treated sewage effluent as detected by TSC, CCP,
and m-CP agars…………………………………………………………………………………..42
Table 5. Results of the Dunn Multiple Comparison post-test comparing the matched
concentrations of total C. perfringens and spores in secondary treated sewage effluent
as detected by TSC, CCP, and M-CP agars……………………………………………………...42
Table 6. Results of the Wilcoxon matched-pairs signed-ranks test comparing the
concentrations of total C. perfringens and spores in untreated sewage as detected by
TSC and CCP agars……………………………………………………………………………..43
Table 7. Summary of the number of presumptive isolates tested for acid phosphatase
production and stormy fermentation in iron milk from each agar type and sample type………..45
Table 8. Contingency Table with results from AP and SF Reactions of total combined
presumptive positive and negative C. perfringens colonies in pasteurized and
unpasteurized samples………………………………………………………………………...…45
Table 9. Sensitivities and specificities of each agar as determined by agreement of
presumptive isolates with phenotypic confirmation testing for acid phosphatase
production or stormy fermentation in untreated sewage and secondary treated effluent
samples………………………………………………………………………………………..…46
Table 10. Positive Predictive Values (PPV) and Negative Predictive Values (NPV) of
each agar as determined by agreement of presumptive isolates with phenotypic
confirmation testing for acid phosphatase production or stormy fermentation in
untreated sewage and secondary treated effluent samples..……………………………………..47
Table 11. Results of Wilcoxon-Mann-Whitney test to compare if distribution of
confirmation test results differ between untreated raw sewage and secondary
treated effluent…………………………………………………………………………………..48
Table 12. Results of McNemar’s test to compare the results of the phenotypic
confirmation tests of presumptive isolates from each agar medium for both
pasteurized and unpasteurized samples. ………………………………………………………..49
Table 13. Concentrations (CFU/100 mL) of total C. perfringens cells as detected
by TSC, CCP, and m-CP agars for each sample analyzed………………………………………57

5
Table 14. Concentrations (CFU/100 mL) of C. perfringens spores as detected by TSC, CCP,
and m-CP agars for each sample analyzed………………………………………………………59
Table 15: Contingency Table for AP and SF Reactions of TSC Presumptive Positive C.
perfringens Colonies of Unpasteurized Samples……………………………………………...…61
Table 16: Contingency Table for AP and SF Reactions of TSC Presumptive Negative C.
perfringens Colonies of Unpasteurized Samples……………………………………………...…61
Table 17: Contingency Table for AP and SF Reactions of CP ChromoSelect Presumptive
Positive C. perfringens Colonies of Unpasteurized Samples…………………………………....61
Table 18: Contingency Table for AP and SF Reactions of CP ChromoSelect Presumptive
Negative C. perfringens Colonies of Unpasteurized Samples…………………………………...61
Table 19: Contingency Table for AP and SF Reactions of m-CP Presumptive Positive C.
perfringens Colonies of Unpasteurized Samples……………………………………………..….62
Table 20: Contingency Table for AP and SF Reactions of m-CP Presumptive Negative C.
perfringens Colonies of Unpasteurized Samples…………………………………………...……62
Table 21: Contingency Table for AP and SF Reactions of TSC Presumptive Positive C.
perfringens Colonies of Pasteurized Samples……………………………………………………62
Table 22: Contingency Table for AP and SF Reactions of TSC Presumptive Negative C.
perfringens Colonies of Pasteurized Samples……………………………………………………62
Table 23: Contingency Table for AP and SF Reactions of CP Chromoselect Presumptive
Positive C. perfringens Colonies of Pasteurized Samples…………………………………….....63
Table 24: Contingency Table for AP and SF Reactions of CP Chromoselect Presumptive
Negative C. perfringens Colonies of Pasteurized Samples……………………………………...63
Table 25: Contingency Table for AP and SF Reactions of m-CP Presumptive Positive C.
perfringens Colonies of Pasteurized Samples……………………………………………………63
Table 26: Contingency Table for AP and SF Reactions of m-CP Presumptive Negative C.
perfringens Colonies of Pasteurized Samples……………………………………………………63
Table 27: Contingency Table for AP and SF Reactions of total combined presumptive
positive C. perfringens colonies in pasteurized and unpasteurized samples…………………….64
Table 28: Contingency Table for AP and SF Reactions of total combined presumptive
negative C. perfringens colonies in pasteurized and unpasteurized samples……………………64

6
LIST OF FIGURES Figure 1. Box and Whisker plot of the distribution of mean concentrations of C. perfringens in
secondary treated sewage samples for the TSC, CCP, and m-CP agars…………………………30
Figure 2. Box and Whisker plot of the distribution of mean concentrations of C. perfringens
spores in pasteurized secondary treated sewage samples for the TSC, CCP, and M-CP agars….31
Figure 3. Log concentrations of total C. perfringens in secondary treated sewage effluent by
sample week as detected by the TSC, CCP, and M-CP agars…………………………………...32
Figure 4. Log concentrations of C. perfringens spores in pasteurized secondary treated sewage
effluent by sample week as detected by the TSC, CCP, and M-CP agars……………………….32
Figure 5. Box and Whisker plot of the distribution of mean concentrations of C. perfringens in
untreated sewage samples for the TSC, CCP, and M-CP agars. ………………………………...34
Figure 6. Box and Whisker plot of the distribution of mean concentrations of C. perfringens
spores in pasteurized untreated sewage samples for the TSC, CCP, and M-CP agars…………..35
Figure 7. Log concentrations of total C. perfringens in untreated sewage by sample week as
detected by the TSC, CCP, and M-CP agars…………………………………………………….35
Figure 8. Log concentrations of C. perfringens spores in pasteurized untreated sewage by sample
week as detected by the TSC, CCP, and M-CP agars……………………………………………36
Figure 9. Average log10 concentrations of total C. perfringens with standard errors as detected by
the TSC, CCP, and m-CP agars in secondary treated effluent for each treatment plant from which
samples were analyzed…………………………………………………………………………...37
Figure 10. Average log10 concentrations of total C. perfringens with standard errors as detected
by the TSC, CCP, and m-CP agars in untreated sewage for each treatment plant from which
samples were analyzed…………………………………………………………………………...37
Figure 11. Average log10 concentrations of C. perfringens spores with standard errors as detected
by the TSC, CCP, and m-CP agars in pasteurized secondary treated sewage effluent for each
treatment plant from which samples were analyzed…………………………………………..…38
Figure 12. Average log10 concentrations of C. perfringens spores with standard errors as detected
by the TSC, CCP, and m-CP agars in pasteurized untreated sewage for each treatment plant from
which samples were analyzed……………………………………………………………………38
Figure 13. Average log10 treatment reductions of total C. perfringens with standard errors as
detected by the TSC, CCP, and m-CP agars for each treatment plant from which samples were
analyzed………………………………………………………………………………………….40
Figure 14. Average log10 treatment reductions of C. perfringens spores with standard errors as
detected by the TSC, CCP, and m-CP agars for each treatment plant from which samples were
analyzed………………………………………………………………………………………….41
7
INTRODUCTION
As water scarcity becomes a more prevalent global issue in the face of climate change
and water source depletion, the need for alternative sources of water for drinking, industrial
purposes, and agriculture is becoming increasingly important. One type of alternative water
resource that is gaining interest world-wide, and especially in drought-prone areas, is treated
wastewater or reclaimed water. The state of North Carolina serves as one example of a state
looking to utilize reclaimed water to ensure a more sustainable future for its water resources
going forward. In 2011, North Carolina passed legislation revising the regulation of reclaimed
water that specified a new, higher quality reclaimed water with expanded allowable uses of such
reclaimed water for agricultural and industrial purposes (subchapter 02U – Reclaimed Water)
(NC DENR, 2011). Following this action, in 2014, the North Carolina legislature again expanded
the allowable uses for this reclaimed water to include mixing with source waters for potable
drinking water supplies at an approved ratio to then be further treated to produce drinking water
(Session Law 2014-113 Senate Bill 163).
The N.C. sponsored legislation enabling expansion of allowable uses for reclaimed water
also established specific quality guidelines for the higher quality reclaimed water, named type 2
reclaimed water, as the only category of reclaimed water that would be allowed for these
expanded uses (subchapter 02U – Reclaimed Water) (NC DENR, 2011). In order to meet the
criteria for Type 2 reclaimed water, these waters had to be treated by tertiary treatment and dual
disinfection (i.e., chlorine disinfection and UV disinfection or allowable substitutes), and have
more extensive quality testing than previously necessary for other treated wastewaters or type 1
reclaimed water. Included among these new quality tests was testing the type 2 tertiary treated
wastewater for Clostridium perfringens, a spore-forming bacterium that serves as a surrogate

8
indicator for protozoan parasite pathogens. For water to be considered type 2 grade, reclaimed
water treatment had to demonstrate a greater than 4 log10 reduction of C. perfringens from raw
sewage and have a geometric mean of no more than 5CFU/100 mL with a daily maximum of 25
CFU/100 mL of treated water (subchapter 02U – Reclaimed Water,NC DENR, 2011).
While these new regulations contained specifications in regard to the ultimate quality of
the water being created to satisfy the type 2 quality requirements, there was no mention of the
appropriate methods to be used for proper enumeration of C. perfringens in reclaimed water and
wastewater samples. Furthermore, US EPA methods and Standard Methods for the Examination
of Water and Wastewater do not provide or cite official documentation for the best or acceptable
methods for enumerating C. perfringens in treated wastewater samples such as those that will be
produced in North Carolina in the coming years. Several methods have been described by both
US EPA and Standard Methods for the Examination of Water and Wastewater for C. perfringens
enumeration in other types of waters such as surface waters and drinking waters, but the
performance of these methods has not been evaluated, adapted, performance-validated,
documented and certified for this specific application to reclaimed water. Additionally, new
methods for enumeration of C. perfringens in water samples continue to be developed, but there
has been either poor or little proper documentation of any methods being adequate or superior to
any of the others available. This leads to confusion and uncertainties about how to properly
measure C. perfringens in both treated wastewaters and other types of waters that urgently needs
to be clarified. Analytical methods that are documented to be accurate and effective are needed
to enable entities such as North Carolina state water utilities as well as other stakeholders world-
wide who wish to enumerate C. perfringens as an indicator for protozoan parasites in various
wastewaters, treated wastewaters and other waters.

9
OBJECTIVE
The purpose of this research was to measure the effectiveness of three different available
selective agars for enumeration of C. perfringens using membrane filtration to determine the best
methods for measuring this bacterium in wastewater and treated wastewater samples. These
agars would then be further validated by subjecting presumptive C. perfringens colony isolates
from them to several different confirmation tests to provide a more rigorous assessment of the
performance of the selective agars.
REVIEW OF THE LITERATURE
Clostridium perfringens
Clostridium perfringens is a Gram-positive, anaerobic, spore-forming, rod-shaped, non-
motile, sulfite-reducing bacterium that inhabits the intestinal tract tracts of humans and other
animals, is shed fecally and is present in raw sewage at concentrations of 10,000-100,000 CFU
per 100 mL (Fujioka 1985, Bisson and Cabelli 1980, Payment and Franco 1993; Sorenson 1989).
It is also found widespread in the environment, although its sources when present in the
environment are uncertain (Petit 1999). It is commonly found in the enteric tracts of humans and
animals and some strains or variants can be pathogenic under certain circumstances and cause
gastrointestinal illness (Petit 1999; McClane 1996). C. perfringens has been recognized as an
indicator of fecal contamination of water for over 100 years (Klein and Houston 1899).
Vegetative cells and spores have been found in varying proportions in sewage waters before and

10
after treatment, with vegetative cells found in higher proportions in untreated wastewater, but
spores found in higher proportions after heat or chlorine treatment (Bisson and Cabelli 1980). C.
perfringens was proposed as a possible fecal indicator for protozoan parasites such as Giardia
and Cryptosporidium in fecally contaminated water primarily because of its ability to produce
spores that survive for long periods of time in the environment and are relatively resistant to
disinfection processes like the cysts and oocysts of protozoan parasites (Klein and Houston 1899;
National Academy of Sciences, 2004; Payment and Franco, 1993; Bisson and Cabelli 1980).
Previous studies have also identified C. perfringens vegetative cells and/or spores in
concentrations statistically correlated to enteric viruses, Giardia cysts and Cryptosporidium
oocysts in surface water samples (Payment and Franco 1993, Ferguson et al. 1996). Studies have
further demonstrated that detection of no C. perfringens in surface waters had a positive
predictive values for absence of pathogens in the same waters (Rimhanen-finne et al. 2004). C.
perfringens spores have been detected in increased quantities in water after sewage overflow
events (Ferguson et al. 1996) and in soils after widespread flooding of animal agriculture areas
(Casteel et al., 2006). Though it is most frequently used as an indicator of protozoan parasites, in
some cases C. perfringens in surface water have had no correlation with the presence of
protozoan cysts or oocysts (Rimhanen-finne et al. 2004). However, there have been objections to
use of C. perfringens as a fecal indicator because of a historical lack of a reliable way to quantify
it as well as the persistence of spores in the environment (specifically in soil and sediment) that
may not correlate with the actual degree of fecal contamination in surface waters (Fujioka et al.
1985; Davies 1995; Cabelli 1978). Despite these concerns about its value and effectiveness as a
fecal indicator microorganism, C. perfringens in water and wastewater are now typically and

11
reliably detected and quantified by membrane filtration methods using specific plating media
following the success of the methods originally developed by Bisson and Cabelli (1980).
Clostridium perfringens Agar Media Comparison
Several previous studies have attempted to compare the best methods for detection of C.
perfringens in various settings including both food and various water sources. Three agars are
currently produced and widely available for use in a lab setting that claim to select for C.
perfringens from water samples. These agars are membrane Clostridium perfringens agar (m-
CP) produced by Oxoid and other commercial sources, Clostridium perfringens ChromoSelect
agar (CCP) produced by Fluka, and tryptose-sulphite-cycloserine agar (TSC) produced by EMD
Millipore and other commercial sources. In addition to using the direct count method of
membrane filtration, there is also a most probable number multiple fermentation tube method,
several pour-plate methods, and a pour tube method (Bisson and Cabelli 1979). These other
methods were not considered in this study for direct detection and quantification because they
were not as accessible or easy to use in the context of water testing labs in North Carolina.
Additionally, non-membrane filtration methods have been noted to suffer from deficiencies that
limit their use in detection from water and wastewater samples such as the need for sub-culturing
for confirmed identification, the increased difficulties in analyzing large volumes of water, the
somewhat reduced precision of most-probable-number methodologies compared to colony
counts, and unclear growth appearance or colony morphologies for definitive identification
(Bisson and Cabelli 1979). Selective methods for C. perfringens are all based on demonstrating
12
the known property of the bacteria for sulphite reduction that many Clostridia species share
(Bisson and Cabelli 1979).
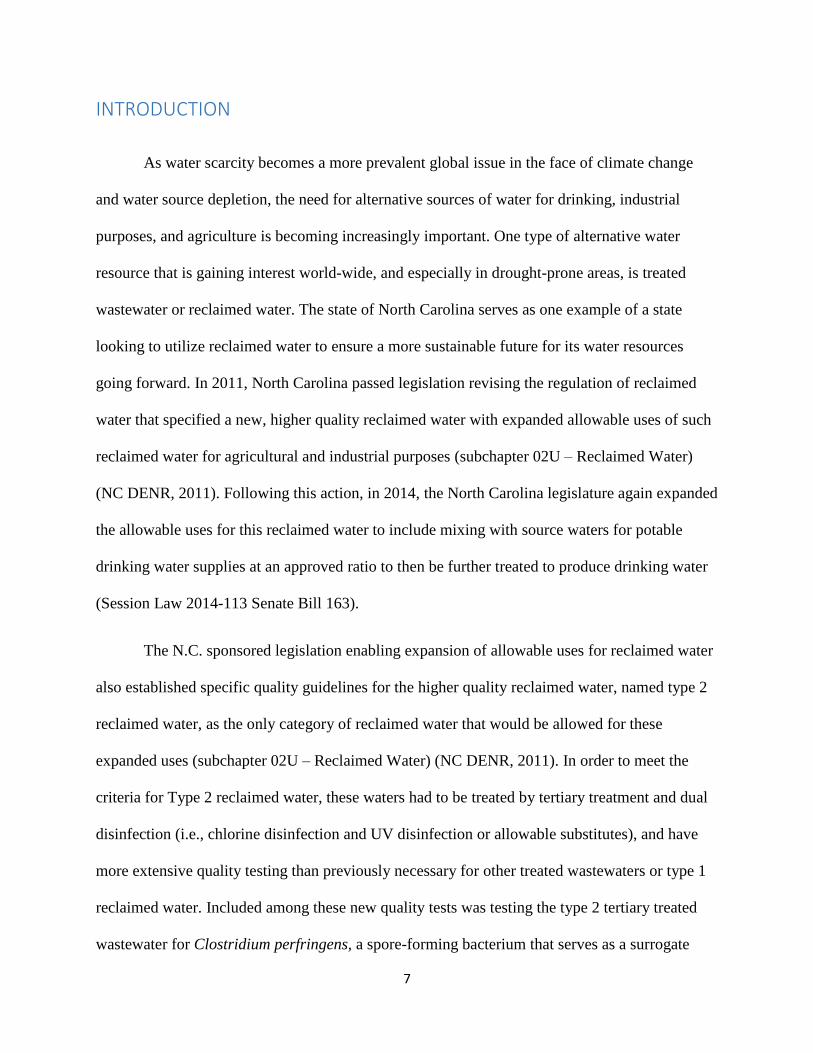
There are a few key differences that characterize each of the selective agars evaluated in
this study. The m-CP agar uses sucrose as a nutrient and requires supplemental additives:
indoxyl-β-D-glucoside, phenolphthalein diphosphate, polymyxin B and D-cycloserine. The agar
produces yellow/beige colonies that will turn pink after exposure to ammonia fumes. The TSC
agar uses sodium metabisulfite and ferric ammonium citrate to indicate sulfite reduction and D-
cycloserine antibiotic as a supplement that inhibits the growth of some other bacteria that could
cause interference. It produces black colonies with a yellow halo. The CCP agar uses ammonium
iron (III) citrate, a chromogenic mixture, L-cysteine hydrochloride, magnesium heptahydrate,
soy peptone, sucrose, tris buffer, tryptose, yeast extract and D-cycloserine as an antimicrobial
supplement. The colonies this agar grows will turn green in color after an hour of exposure to an
aerobic environment, following anaerobic incubation for colony growth (Manafi 2013).
Several culture methods exist for enumerating C. perfringens from food origins. Studies
have attempted to quantify and explain the differences among the various media that are used to
recover this bacterium from food samples. Of the three selective agars that are used for
membrane filtration, only TSC has been used to culture C. perfringens from food sources (Byrne
et al 2007, De Jong 2003, Hauschild & Hilsheimer 1973, Mead 1985). Food microbiology
studies have assessed TSC in comparison to SFP, OPSP, RCA, BHI, SCA, and DCA agars, in
addition to TYD-C, DRCM, PEM, and LS liquid media (Byrne et al 2007, De Jong 2003,
Hauschild & Hilsheimer 1973, Mead 1985). Although differing slightly in each experimental
setup, each study concluded that TSC was either most useful or equally useful to any of the other
methods and media for recovery and enumeration of C. perfringens bacteria (Byrne et al 2007,

13
De Jong 2003, Hauschild & Hilsheimer 1973, Mead 1985). Two of these studies differed in use
of TSC agar from working with water samples in that they used a pour plate or spread plate
method instead of membrane filtration (Hauschild and Hilsheimer 1973, De Jong 2003). There
were conflicting findings among the researchers as some found that TSC agar was limited in its
ability to allow C. perfringens to form spores, while others found that it was better for recovery
of spores (Byrne et al. 2007, Mead 1985). Another stated limitation of the TSC agar was that it
was found to be a hospitable growth medium for other Clostridia species and therefore
confirmatory testing would be required (Mead 1985).
In water samples, C. perfringens has been cultured using the TSC, m-CP, and CCP agars
that have been previously described. However, there have also been studies documenting the
culturing of these bacteria with a flourogenic TSC medium (TSCF), TSN, SPS, and WB agars
(Araujo 2004, Sartory 1985). The majority of these studies have been conducted on water bodies
used for drinking water, partially treated drinking water, or fully treated drinking water. One
study by Sartory (1985) compared TSC and m-CP agars for C. perfringens in partially treated
sewage and other low quality waters. Only one previous study has compared TSC, m-CP, and
CCP agars, but included a flourogenic substrate in the TSC agar and analyzed only waters used
for potable purposes both from the source and after treatment (Manafi et al. 2013). Results from
this study demonstrated that no statistically significant difference was found among the three
agars with respect to their abilities to enumerate presumptive C. perfringens colonies. Use of the
m-CP media was determined to be onerous for the purpose of identifying presumptive positive
colonies, while the TSC agar with fluorogenic substrate was difficult to count when high
contamination was present. The CCP agar was identified as both the most specific agar and the
least difficult to read when compared to the other two media.

14
Most studies comparing the available agars were concerned mainly with the m-CP and
TSC media. Bisson and Cabelli (1979) first developed the m-CP membrane filtration method. At
the time, TYI agar pour plates (using the Bonde pour tube method) were used for enumeration of
C. perfringens in water samples (Bisson and Cabelli 1979). Using the m-CP agar that they
developed, they were able to effectively select C. perfringens from the water samples using
membrane filtration and found counts on these plates to be 10-20% lower than by using the
traditional method, but with higher accuracy (93% confirmation of positives, 98% confirmation
of negatives) (Bisson and Cabelli 1979). They also noted a colony counting limit between 85 and
120 on the upper end and low precision when 20 or fewer colonies were observed. Finally, they
found that the agar was not as successful at culturing the bacteria if 24 hours or more time had
passed between the time the bacteria were added to the water sample and the time that the assay
was conducted (Bisson and Cabelli 1979).
Following the 1979 study, several other researchers have evaluated the m-CP agar that
Bisson and Cabelli developed as well as the TSC agar that had been developed earlier. Some of
the earlier work found TSC and m-CP to have comparable abilities to enumerate C. perfringens
when analyzing untreated, partially treated, and known highly polluted surface waters. Both
agars have been observed to have greater than 90% confirmation of presumptive positives with
few or no false-negative colonies (Sartory 1985). Additionally, it was noted that TSC was
significantly easier to use and a fraction of the price of m-CP agar (Sartory 1985).
Other researchers quantifying the difference between media for culturing C. perfringens
have analyzed drinking water or source water that would later be treated for drinking or in lab
engineered water samples. A 1998 study found the m-CP agar to be more selective than TSC for
recovery of vegetative cells in spiked samples, but that TSC had a higher capacity to culture both

15
vegetative cells and spores in these samples (Sartory 1998). These findings were in contrast to
previous findings from food based studies that found TSC a poor medium for culturing spores.
However, the findings in this study were later validated by Maheux et al. (2013) who found high
rates of confirmation of isolates previously cultured on m-CP agar from engineered waters with a
panel of known strains of C. perfringens and also natural C. perfringens present in sewage that
was added to test water.
In natural water sources for drinking and recreational use, TSC has been observed to have
greater success at accurately detecting the presence of C. perfringens in water samples that have
lower concentrations of the bacteria (Sartory, 1998; Manafi 2013). Researchers have also noted
various levels of success with TSC when confirming isolates, ranging from 68% to 87%
confirmation (Aurajo 2004; Sartory 1998). Further, researchers using TSC have had even
broader ranges of conflicting results when confirming presumptive negative colonies, ranging
from 100% confirmation of negatives to only 31.9% confirmation of negative colonies (Aurajo
2004; Sartory 1998). Only one study has evaluated this agar for its ability to detect both spores
and vegetative cells (Sartory 1998). Evaluation of m-CP in the same waters has had similar
mixed results in which some researchers have empirically found both low (<50%) and high
(>95%) confirmation rates of presumptive positive and presumptive negative colonies when
subjecting isolates to phenotypic biochemical testing (Burger et al. 1984; Sartory 1998; Maheux
2013; Armon and Payment 1987).. However, in several studies m-CP has been noted as a less
preferred agar to TSC (Sartory 1998; Araujo 2004; Manafi et al. 2013). M-CP agar has been
noted to have significantly lower enumerative capacity to TSC and observed to have high rates
of false-positivity and false-negativity for both spores and vegetative cells (Sartory 1998; Araujo
2004). Researchers have noted that positive m-CP colonies are also sometimes difficult to

16
identify based on the varying shades of pink observed after exposing colonies to potassium
hydroxide (Sartory 1998, Manafi et al. 2013).
Only one peer-reviewed study has evaluated CCP agar. Manafi et al. (2013) compared
the CCP, m-CP and TSC agar containing a fluorogenic substrate (TSCF) to detect spores from
drinking water samples and partially treated drinking water samples. They found C. perfringens
on CCP and the TSCF agars were easy to count and subculture. However, they found all three
agars comparable at quantifying the bacteria in their samples. However, they selected CCP as the
preferred agar because of its ease of preparation and use as well as the ease in identifying
positive colonies from the agar.
It is apparent that the studies conducted to this point have given an inadequate evaluation
of the best methods for detection of C. perfringens from wastewater and treated wastewater
samples via membrane filtration. The bulk of studies that have evaluated the agars of interest
have been related to drinking water and not wastewater. Additionally, results have been
conflicting and the error ranges for confirmation of presumptive positive colonies have varied
widely. According to most of the literature, TSC appears to be a preferred agar to m-CP, but very
little work has been conducted to evaluate the performance and identify the possible strengths
and weaknesses of the newer CCP medium. The review of the current literature validates the
need for more extensive work to be done evaluating which of these agars is most suitable for labs
wishing to enumerate C. perfringens to meet new quality standards regarding reclaimed or other
water sources.
Phenotypic Confirmation Tests

17
Phenotypic confirmation of C. perfringens is traditionally based on tests that demonstrate
its lack of motility, ability to reduce nitrate, ferment lactose, and cause liquefaction of gelatin
(Sartory 2006, Environment Agency UK, Eisgruber 2000). However, researchers have pointed
out that these processes are labor intensive and time consuming and the results of some of these
tests are at times unreliable (Cato et al. 1986; Barrow and Feltham 1993; Eisgruber 2000). These
traits can be tested for by inoculation into motility-nitrate medium (test for motility and nitrate
reduction) and lactose-gelatine medium (test for lactose fermentation and gelatine liquefaction)
(Eisgruber 2000). Another phenotypic confirmation test can be done by the reverse CAMP test
which uses streaking of presumptive C. perfringens isolates on sheep blood agar as described by
Hansen and Elliott (1980). A third confirmation test utilizes an iron milk based medium in which
C. perfringens produces stormy fermentation (Abeyta 1985; Erickson and Deibel 1978). Each of
these confirmation tests require incubation of at least 24 hours. The tests have also been
evaluated on previously isolated strains of C. perfringens and all have produced results
demonstrating different levels of sensitivity or specificity below 100% (Hauschild and
Hilsheimer 1974; Abeyta 1985; Eisgruber et al. 2000; Mead 1985; Hansen and Elliott 1980).
Nitrate-motility media has been found to exhibit sensitivity as low as 78% and iron-milk media
have been found to exhibit sensitivities as low as 71%, while the reverse CAMP test has
exhibited higher observed sensitivity of 94% or greater (Hauschild and Hilsheimer 1974; Mead
1985; Eisgruber et al. 2000; Hansen & Elliot 1980).
The time consuming nature and level of imprecision in these confirmation tests led to the
development of a new rapid phenotypic confirmation test that evaluated presumptive C.
perfringens for acid-phosphatase production. Developed by Ueno et al. (1970), this test exposes
presumptive colonies to a mixture of naphtyl phosphate disodium salt, Fast Blue B salt and

18
acetate buffer. Confirmation is based on an observed color change when a colony that produces
acid-phosphatase is exposed to the reagent. This reaction takes place in minutes and has been
validated multiple times as an acceptable alternative to other phenotypic confirmation tests based
on testing with previously confirmed C. perfringens strains (Ryzinska-paier et al. 2011; Ueno et
al. 1970; Wohlsen et al. 2006; Eisgruber 2000; Sartory 2006; Mead 1981). Several studies have
identified sensitivities for this test to be around 95%, particularly for isolates obtained from
cultures of environmental waters, indicating that the tests is usually very accurate for positive
identification of isolates (Eisgruber 2000; Mead 1981; Sartory 2006; Adcock and Saint 2001).
METHODS
Sample Collection
Treated and untreated wastewater effluents were collected at five wastewater
treatment/water reclamation plants located in central North Carolina. These facilities were: (A)
the Orange Water and Sewer Authority WWTP in Chapel Hill, (B) the Raleigh Neuse River
WWTP, (C) the North Durham Water Reclamation Facility, (D) the Holly Springs WWTP and
(E) the North Cary Water Reclamation Facility.
Initially, seven secondary treated sewage effluent samples were collected from two
wastewater treatment plants (A and B) before sand filtration, and analyzed for Clostridium
perfringens. These samples were collected between May and July of 2013. Many of the final
tertiary treated and dual disinfected effluent samples had no detectable C. perfringens in 100-mL
sample volumes, and therefore were below the detection limits of the methods of analysis.

19
Because the determination of the best methods for quantifying C. perfringens requires reliable
statistical analysis of data on quantifiable levels of the target microorganisms, samples
containing sufficient numbers of these target microbes are required. Consequently,
microbiological analysis was performed with samples collected from earlier stages in the water
reclamation process. It was found that clarified secondary effluent collected prior to sand
filtration and disinfection consistently yielded sufficient but not excessive concentrations of
Clostridium perfringens. These same treatment plant sample locations yielded sufficient
concentrations of Clostridium perfringens at all five wastewater treatment facilities for collected
samples that were partially treated samples as indicated above.
In the second stage of testing, in addition to the samples collected earlier in the treatment
process, raw sewage and final reclaimed water samples were also collected for analysis and are
included in this report. These samples were collected between August 2013 and August 2014.
During this time, 20 secondary treated effluent samples, 5 untreated sewage samples, and 10
final treated reclaimed water samples were analyzed. A third round of sampling for only
reclaimed water and untreated sewage took place between February 2015 and July 2015 in which
14 samples of both types were analyzed. Overall, 19 untreated sewage samples, 25 secondary
treated effluent samples, and 25 tertiary treated, dual disinfected reclaimed water samples were
analyzed. The summary of the samples is displayed in Table 2 and the sequence of sampling can
be found in Appendix 1 in Tables 12 and 13. It is important to note that not all of the reclaimed
water samples were treated by the identical physical, chemical and biological processes. These
differences are summarized in Table 1 below. This table does not include information on steps
prior to filtration and disinfection, as these steps were similar at each wastewater treatment plant

20
and included primary clarification (sedimentation), anaerobic digestion of separated wastewater
solids, aerobic biological treatment of primary effluent by some form of activated sludge
treatment process and secondary clarification after aerobic biological treatment. Each plant,
excepting plant C, uses both free chlorine and UV disinfection in the production of reclaimed
water. Only a single disinfection treatment by UV radiation was used at plant C
Table 1. Summary of Wastewater Treatment Processes and Sample Collection Scheme
Wastewater Treatment Plant Reclaimed Water Treatment Steps
after Primary and Secondary
Treatment
Samples Collected for
Microbial Analysis
A 1. Filtration (Sand Filter)
2. UV Disinfection
3. Chlorine Disinfection
Coliphages: Pre UV
Disinfection
Clostridium perfringens: Pre
Sand Filtration
B 1. Filtration (Sand Filter)
2. UV Disinfection
3. Chlorine Disinfection
Coliphages: Pre UV
Disinfection
Clostridium perfringens: Pre
Sand Filtration
C 1. Filtration (Sand Filter)
2. UV Disinfection
Coliphages: Pre UV
Disinfection
Clostridium perfringens: Pre
Sand Filtration
D 1. Filtration (Sand Filter)
2. UV Disinfection
3. Chlorine Disinfection
Coliphages: Pre UV
Disinfection
Clostridium perfringens: Pre
Sand Filtration
E 1. Filtration (Sand Filter)
2. UV Disinfection
3. Chlorine Disinfection
Coliphages: Pre UV
Disinfection
Clostridium perfringens: Pre
Sand Filtration

21
Table 2. Number and type of samples analyzed by treatment plant
Treatment Plant Untreated Raw
Sewage (Number of
Samples)
Secondary Treated
Effluent before Sand
Filtration (Number of
Samples)
Tertiary Treated
Reclaimed Water
(Number of Samples)
TOTALS
A 4 8 6 18
B 3 5 5 13
C 4 4 5 13
D 4 5 5 14
E 4 3 4 12
TOTALS 19 25 25 70
Sample handling
Treated and raw wastewater grab samples were collected from the appropriate WWTP
sampling points in sterile polypropylene bottles, and kept chilled in coolers with ice during
transport to Chapel Hill. Sampling points were the same as those used by the treatment plants in
order to allow for the utilities’ own analysis of water samples during the various stages of the
treatment process. The samples were stored at 4°C upon arrival at the laboratory. Clostridium
perfringens assays were performed on the day of or the day following sample collection.
Samples were collected and analyzed between 5/14/2013 and 04/06/2015.
Clostridium perfringens Analysis Procedures
Procedures for C. perfringens detection and enumeration were based on standard
membrane filter (MF) methods. These methods were originally developed for US EPA by
Cabelli and Bisson (1979). The methods used are attached to this report in the form of a
laboratory ‘bench sheet’ in Appendix 2 which is intended to be an easy-to-follow, step-by-step
protocol that laboratory analysts may use to perform the analyses. Following each assay, other
confirmatory analyses were done to identify false-positive and false negative presumptive C.

22
perfringens colonies obtained by initial membrane filter analysis. As many as five individual
presumptive positive and presumptive negative C. perfringens colonies from each of the three C.
perfringens agar media tested were selected from a given sample and purified by re-streaking
onto non-selective Columbia agar media to obtain isolated colonies. Purified colony isolates
were then subjected to a test for acid-phosphatase (AP) production as described by Sartory et al.
(2006). Later on, samples analyzed on this project were subjected to a second confirmatory test
of stormy fermentation (SF) in tubes of iron milk medium to score for sulfite-reducing
Clostridium species, the category to which C. perfringens belongs.
Prior to performing the membrane filtration (MF) method, the Acid-Phosphatase (AP)
test and the Stormy Fermentation (SF) test as later described, the various media and reagents
were prepared. The three agar media used for this investigation were Membrane Clostridium
perfringens (m-CP) agar, CP ChromoSelect Agar (CCP), and Tryptose Sulfite Cycloserine
(TSC) agar. TSC agar medium was obtained from EMD Chemicals Inc. TSC agar was prepared
by adding 3.9 grams of TSC agar base /100 mL of deionized water in a 500 mL bottle,
autoclaving for 15 minutes and cooling to keep molten. The m-CP agar base (from Oxoid
Microbiology Products) was prepared by adding 7.11g of agar base /100 mL of deionized water,
autoclaving for 15 minutes and cooling to keep molten. CP ChromoSelect agar base (from Fluka
Analytical) was prepared by adding 6.28 grams/100 mL deionized water, bringing to a boil on a
hot plate and then removing to cool and keep molten. After cooling, supplements were added to
the various molten agar media as follows. CP Chromoselect and TSC agars got 0.04 grams of D-
Cycloserine per 100 mL of molten agar medium base. The m-CP agar got 0.2 mL of sterile 4.5%
ferric chloride solution, 2 mL of sterile 0.5% phenolphthalein diphosphate solution, 0.8 mL of
sterile 0.76% Indoxyl-β-glucoside, and 0.4 mL of m-CP Selective Supplement, per 100 mL of

23
molten agar base medium. Supplemented media were dispensed in 5-mL volumes in 50 mm
diameter sterile, polystyrene Petri dishes and allowed to harden. Plates were stored at 4oC until
use.
In order to perform the various confirmation tests, the following reagents were required:
2% ferrous sulfate solution and canned evaporated milk for the iron milk medium, deionized
water, glacial acetic acid, sodium acetate (anhydrous), 1-naphtyl phosphate disodium salt, and
Fast Blue B Salt for the acid phosphatase test, as well as and Columbia agar base. Columbia agar
plates were prepared by adding 4.25 grams Columbia agar base per 100 mL deionized water in a
500 mL bottle, autoclaving for 15 minutes, dispensing into sterile polystyrene dishes and
allowing agar medium to harden. Iron milk medium for the SF test was prepared by combining
aseptically 12 oz. of canned evaporated milk, 50 mL of 2% ferrous sulfate solution, and 938 mL
of deionized water, mixing and then dispensing into glass culture tubes. Acid phosphatase
reagent was prepared as described by Ueno et al. (1970) and adapted by Mead et al. (1981) by
combining 20 mL acetate buffer, 0.4g of 1-naphtyl phosphate disodium salt and 0.8g of Fast
Blue B salt in a sterile, plastic 50 mL tube. The acetate buffer was made by combining 200 mL
of deionized water, 0.067 mL of glacial acetic acid and 0.068 grams of sodium acetate. Upon
combining the reagents for the acid-phosphatase solution, the solution was refrigerated for at
least 1 hour. The solution was then centrifuged at 3,500 rpm for 15 minutes at 4°C, and the
resulting supernatant was recovered and stored for later use.
Membrane Filtration Method
C. perfringens spores and total C. perfringens (spores plus vegetative cells) were detected
24
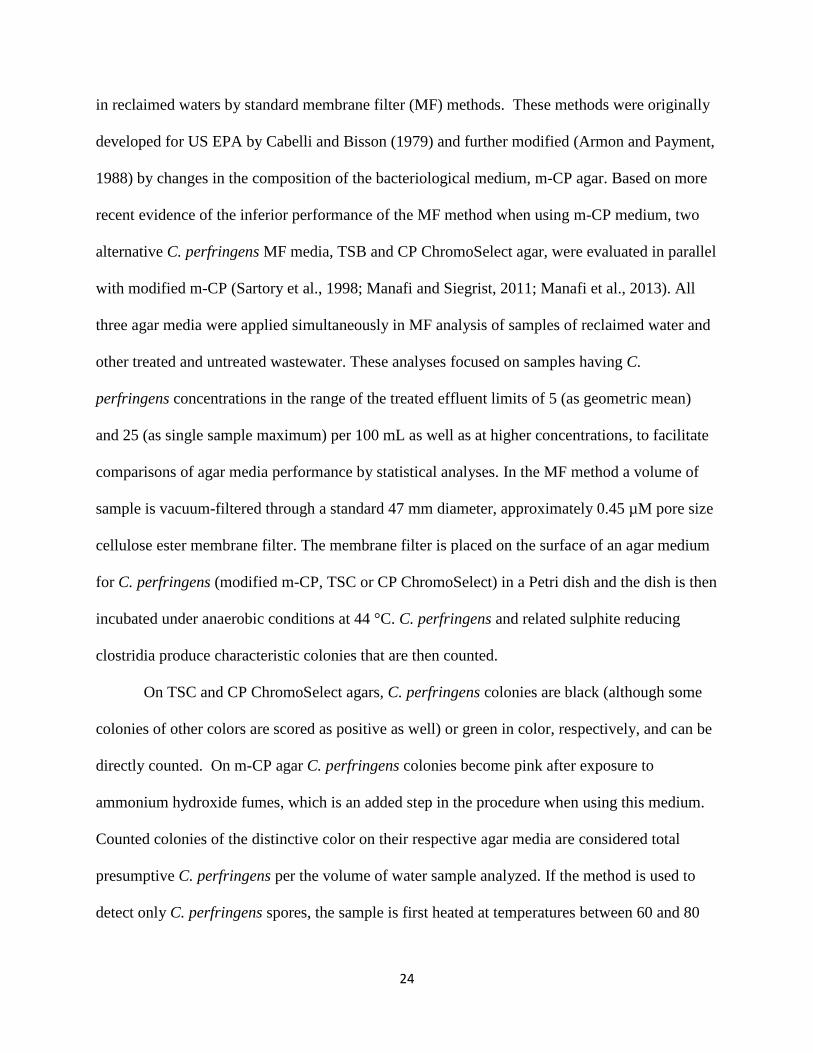
in reclaimed waters by standard membrane filter (MF) methods. These methods were originally
developed for US EPA by Cabelli and Bisson (1979) and further modified (Armon and Payment,
1988) by changes in the composition of the bacteriological medium, m-CP agar. Based on more
recent evidence of the inferior performance of the MF method when using m-CP medium, two
alternative C. perfringens MF media, TSB and CP ChromoSelect agar, were evaluated in parallel
with modified m-CP (Sartory et al., 1998; Manafi and Siegrist, 2011; Manafi et al., 2013). All
three agar media were applied simultaneously in MF analysis of samples of reclaimed water and
other treated and untreated wastewater. These analyses focused on samples having C.
perfringens concentrations in the range of the treated effluent limits of 5 (as geometric mean)
and 25 (as single sample maximum) per 100 mL as well as at higher concentrations, to facilitate
comparisons of agar media performance by statistical analyses. In the MF method a volume of
sample is vacuum-filtered through a standard 47 mm diameter, approximately 0.45 µM pore size
cellulose ester membrane filter. The membrane filter is placed on the surface of an agar medium
for C. perfringens (modified m-CP, TSC or CP ChromoSelect) in a Petri dish and the dish is then
incubated under anaerobic conditions at 44 °C. C. perfringens and related sulphite reducing
clostridia produce characteristic colonies that are then counted.
On TSC and CP ChromoSelect agars, C. perfringens colonies are black (although some
colonies of other colors are scored as positive as well) or green in color, respectively, and can be
directly counted. On m-CP agar C. perfringens colonies become pink after exposure to
ammonium hydroxide fumes, which is an added step in the procedure when using this medium.
Counted colonies of the distinctive color on their respective agar media are considered total
presumptive C. perfringens per the volume of water sample analyzed. If the method is used to
detect only C. perfringens spores, the sample is first heated at temperatures between 60 and 80

25
°C for 15 minutes prior to filtration in order to kill vegetative bacteria and provide colony counts
of only culturable spores. The numbers of C. perfringens colonies detected per unit volume of
test water or wastewater on the three different agar media were then compared to evaluate their
performance and to determine the absolute and relative abundance total C. perfringens (unheated
samples) and C. perfringens spores (pre-heated samples) on each agar medium (m-CP, TSC and
CP ChromoSelect).
Samples of reclaimed water, untreated wastewater, and secondary treated wastewater
before sand filtration from the five wastewater treatment plants indicated previously were
analyzed by membrane filtration using the three different agar media and were compared on the
basis of C. perfringens detected as spores only or spores plus vegetative cells. Using aliquots of 1
mL (mixed with phosphate buffer), 5 mL, 10 mL, 20 mL, or 100 mL per sample, depending on
the expected contamination level and sample type, the various samples were vacuum filtered
through a 0.45 μm pore size, 47 mm diameter cellulose ester membrane filters. Each sample
volume was plated in triplicate. Reclaimed water and raw sewage samples were filtered for only
one sample volume, while pre-sand filtered samples were filtered for either two or three different
volumes. If colony count results from a given membrane filter plate were above the detectable
limit, they were deemed too numerous to count and a value of 225 colonies was used in its place.
This colony count value was derived by multiplying by two by the average of the upper
detectable counting limit from plates in which one hundred or more colonies were counted. If a
set of triplicate membrane plates for a raw sewage sample plated on an individual agar medium
experienced no growth, a value of 0.5 colonies was assigned to one of the plates. Because raw
sewage samples had to be diluted to display countable colonies, a plate detecting no C.
perfringens would have underrepresented the ability of an agar medium to culture C. perfringens

26
in a sewage sample, where it is expected that these bacteria will always be present. Thus, the
value of 0.5 was assigned to provide a conservative estimate of how many C. perfringens
colonies would be detected by the agar medium in an undiluted sample.
Acid-phosphatase Confirmation Method
Upon counting colonies of plates for the three test agars, presumptive positive and
negative isolated colonies were then used for performing a confirmation test with Acid-
phosphatase reagent. The method used was that of Sartory et al. (2006), which was adapted from
Ueno et al. (1970) and Mead et al. (1981). Presumptive C. perfringens colonies from membrane
filters were streaked initially onto separate non-selective Columbia agar medium plates (as many
as five presumptive positive and five presumptive negative colonies per sample type, per agar
medium) with a sterile wooden applicator stick. These plates were then grown overnight
anaerobically in a 37°C incubator. On the following day, individual colonies from these plates
were then inoculated onto a sterile cotton pad with a sterile wooden applicator stick and a 0.1 mL
aliquot of Acid-phosphatase reagent was then pipetted onto the colony. If the mixture became a
purple color after about a minute, it was scored confirmed positive by the acid-phosphatase test.
If it did not become purple, it was scored confirmed negative by the AP test.
Stormy Fermentation Method
During the latter sampling periods of the investigation, isolates obtained from the test

27
agar media were further subjected to a secondary confirmation test for Stormy Fermentation in
Iron-milk medium tubes. The method for this was adapted from Abeyta et al. (1985). After the
acid-phosphatase tests, a second colony from each of the Columbia agar medium plates was
inoculated into a glass tube of ~9mL of iron-milk medium that was clearly marked to correspond
with the water sample and agar medium from which it originally came as well as its result from
the acid-phosphatase test. The inoculated tubes were then incubated for 24 hours in a 44°C
incubator and checked for stormy fermentation of the media. C. perfringens and other sulfite-
producing clostridia are positive for stormy fermentation. Results were recorded accordingly.
Clostridium perfringens Data Analysis Procedures
The data collected on C. perfringens concentration were analyzed initially using the
GraphPad Instat statistical package from GraphPad Software. All data were analyzed using
nonparametric tests, including the Friedman one-way analysis of variance test and the Dunn
Multiple Comparison Post-Test because the data were not normally distributed. These tests were
performed on direct count results obtained through membrane filtration on the three previously
described selective media. The analysis was conducted for both pasteurized and unpasteurized
samples (vegetative cells and spores and only spores) from diluted raw sewage, partially treated
sewage (before sand filtration) and tertiary treated reclaimed water. To compare the
concentrations of C. perfringens detected by TSC and CCP agars in raw sewage samples, a
Wilcoxon matched-pairs signed-ranks test was used. An alpha value of 0.05 (P <0.05), was used
to establish statistical significance. The data from these tests are displayed in Tables 4-6 below.
In addition to these statistical tests used to determine if the agar media differed significantly in

28
their ability to detect C. perfringens colonies, several descriptive figures were generated. Box
and whisker plots of C. perfringens concentrations per 100 mL were also used to demonstrate the
distributions of data and the differences between the three test agar media to detect C.
perfringens. These graphs were created in R.Studio (R Studio Team 2015).
In Microsoft Excel, plots were created displaying the sequential samples collected over
time as log10 concentrations of total cells and only spores (Figures 3, 4, 7, 8). Time intervals
between samples in these plots were not representative of actual time intervals. Bar charts of
arithmetic average log10 concentrations were constructed in Excel in order to demonstrate
difference in detection of presumptive C. perfringens total cells and spores by agar medium for
each of the treatment plants (Figures 9-12). Bar charts were also constructed to show
comparative log10 reductions of C. perfringens spores and total cells as detected by each of the
agars based on arithmetic averages of log10 concentrations measured from untreated sewage and
final reclaimed water analyzed from each of the treatment plants (Figures 13-14).
For analysis of the confirmation test results, data were analyzed in Microsoft Excel and
Stata 14 (StataCorp 2015). In Excel, the data were analyzed to determine the extent to which
each C. perfringens confirmation test result agreed with what the isolate was considered
presumptively (either C. perfringens positive of negative) when originally observed and the
colony isolated from its respective agar medium. Microsoft Excel was then used to generate
sensitivities, specificities, positive predictive values, and negative predictive values. The
confirmation tests were also compared against each other using McNemar’s test in Stata14
(StataCorp 2015) to determine if the results of the tests were significantly different from each
other.

29
RESULTS
The geometric mean of total C. perfringens concentrations in secondary treated effluent
as detected by the TSC, CCP, and m-CP media were 263 CFU/100 mL (SD: 147), 673 CFU/100
mL (SD:670), and 167 CFU/100 mL (SD: 263) respectively (Table 3). The median C.
perfringens values were 285 CFU/100 mL, 636 CFU/100 mL and 185 CFU/100 mL for each
respective agar (Table 3 and/or Figure 1). For the same secondary treated samples, the ranges of
C. perfringens concentrations on TSC agar were from 6 to 615 CFU/100 mL, on CCP agar from
161 to 2285 CFU/100mL, and on m-CP agar from 11 to 855 CFU/100 mL (Table 3 and/or Figure
1). TSC had the smallest range for detection of total C. perfringens cells in secondary treated
wastewater (Figure 1). CCP had the largest minimum and maximum detection of all agars, and
also had several observations that were outliers from the other samples (Figures 1 and 3). The
results for concentrations of total C. perfringens in unpasteurized samples of secondary treated
effluent as detected on the different agar media are summarized in Appendix 1 in Table 13 and
they are displayed in sequential samples collected over the sampling period as log10
concentrations in Figures 3 and 4 for total cells and spores, respectively. The intervals between
samples are not representative of actual time intervals as samples were not taken over uniform
time periods.
The results for C. perfringens spore concentrations in pasteurized secondary treated
sewage samples as detected on the three agar media tested are shown in Appendix 1 in Table 14.
In these pasteurized secondary treated sewage samples, the geometric mean and median
concentrations of C. perfringens spores for TSC, CCP, and m-CP agars were 176 (SD: 134) and
233 CFU/100 mL, 332 (SD: 441) and 267 CFU/100 mL, and 16 (SD: 48) and 21 CFU/100 mL
respectively (Table 3 and Figure 2). C. perfringens spore concentration of pasteurized secondary
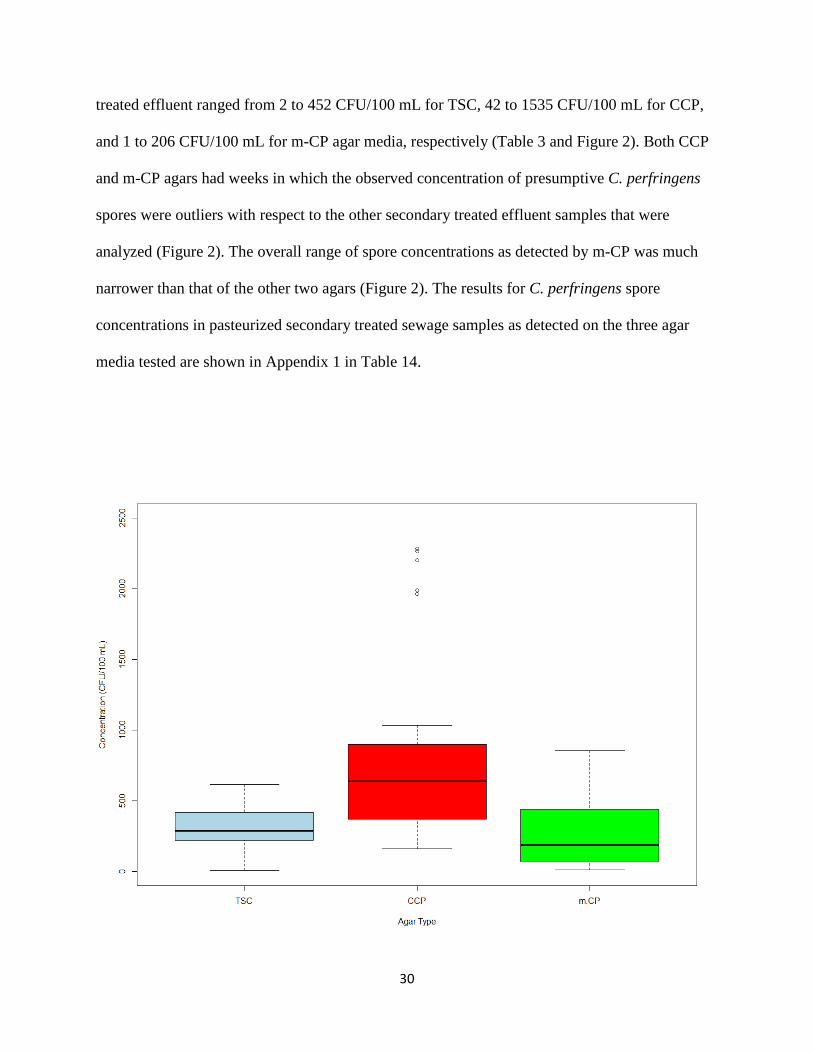
30
treated effluent ranged from 2 to 452 CFU/100 mL for TSC, 42 to 1535 CFU/100 mL for CCP,
and 1 to 206 CFU/100 mL for m-CP agar media, respectively (Table 3 and Figure 2). Both CCP
and m-CP agars had weeks in which the observed concentration of presumptive C. perfringens
spores were outliers with respect to the other secondary treated effluent samples that were
analyzed (Figure 2). The overall range of spore concentrations as detected by m-CP was much
narrower than that of the other two agars (Figure 2). The results for C. perfringens spore
concentrations in pasteurized secondary treated sewage samples as detected on the three agar
media tested are shown in Appendix 1 in Table 14.

31
Figure 1. Box and Whisker plot of the distribution of mean concentrations of C. perfringens in
secondary treated sewage samples for the TSC, CCP, and m-CP agars (n=25).
Figure 2. Box and Whisker plot of the distribution of mean concentrations of C. perfringens
spores in pasteurized secondary treated sewage samples for the TSC, CCP, and m-CP agars
(n=25).

32
Figure 3. Log concentrations of total C. perfringens in secondary treated sewage effluent by
sample week as detected by the TSC, CCP, and m-CP agars
Figure 4. Log concentrations of C. perfringens spores in pasteurized secondary treated sewage
effluent by sample week as detected by the TSC, CCP, and m-CP agars
0
0.5
1
1.5
2
2.5
3
3.5
4
0 5 10 15 20 25
Log
Co
nce
ntr
atio
n (
CFU
/10
0m
L)
Sample Week
TSC CCP m-CP
-0.5
0
0.5
1
1.5
2
2.5
3
3.5
0 5 10 15 20 25
Log
con
cen
trat
ion
(C
FU/1
00
mL)
Sample Week
TSCΔ CCPΔ m-CPΔ

33
After sampling and analyzing 11 untreated raw sewage samples, m-CP agar was
determined to have significantly lower detection capacity of both total cells and spores than the
other two agars. As a result, analysis of these samples with m-CP agar was halted (Figures 5-8).
In untreated sewage samples, the geometric average C. perfringens concentrations were 5.36*104
CFU/100 mL (SD: 4.91*104), 7.73*104 CFU/100 mL (SD: 7.71*104), and 1.54*104 CFU/100
mL (SD: 1.55*104) for TSC, CCP, and m-CP agars respectively (Table 3 and Figure 5). The
median C. perfringens concentrations as detected by each of the agars in the same untreated
sewage samples were 5.33*104 CFU/100 mL, 6.33*104 CFU/100 mL, and 1.67*104 CFU/100
mL for TSC, CCP, and m-CP agars, respectively (Figure 5 and Table 3). The ranges of total cell
concentrations of C. perfringens in these same sewage samples on TSC were from 1.2 *104 to
1.47 *105 CFU/100 mL, on CCP from 3.50*104 to 3.58*105 CFU/100 mL, and on m-CP from
5.56*103 to 5.97*104 CFU/100 mL. The distributions of total cell detection by TSC and CCP
were skewed upwards for untreated sewage samples (Figure 5). Similar to what was seen when
analyzing the secondary treated effluent, CCP agar had the highest maximum and minimum
concentration detected from the samples of the three media tested and the m-CP agar had the
narrowest range of detection of total cells in raw sewage (Figure 5). The results for total C.
perfringens concentrations in samples of untreated sewage as detected on the different agar
media are summarized in Appendix 1 in Table 13 and they are shown in sequential samples
collected over the sampling period as log10 concentrations in Figures 7 and 8 for total cells and
spores, respectively. The intervals between samples not representative of actual time intervals as
samples were not taken over uniform time periods.
In the pasteurized untreated sewage samples, the average and median concentrations of
spores on TSC, CCP, and m-CP agar media were 3.27*104 (SD: 3.19*104) and 4.3*104 CFU/100

34
mL, 3.87*104 (SD: 7.64*104) and 4.17*104 CFU/100 mL, and 4.73*103 (SD: 1.40*102) and
3.3*103 CFU/100 mL respectively (Table 3 and Figure 6). C. perfringens spore concentrations in
these samples of pasteurized untreated sewage ranged from 8.3*102 to 1.3*105 CFU/100 mL on
TSC, 1.7*103 to 3.2*105 CFU/100 mL on CCP, and 5.6*102 to 1.8*104 CFU/100 mL on m-CP,
respectively (Table 3). Both CCP and TSC agars had weeks in which the observed concentration
of presumptive C. perfringens spores were outliers with respect to the other untreated sewage
samples that were analyzed (Figure 6). Again, the overall range of spore concentrations as
detected by m-CP was much narrower than that of the other two agars (Figure 6). The
distribution of spore detection from pasteurized untreated raw sewage was skewed upward for
both the CCP and m-CP agars (Figure 6). The individual weekly results for C. perfringens spore
concentrations in pasteurized raw sewage samples as detected on the three agar media tested can
be found in Appendix 1 in Table 14.

35
Figure 5. Box and Whisker plot of the distribution of mean concentrations of C. perfringens in
untreated sewage samples for the TSC, CCP, and m-CP agars (n=19).
Figure 6. Box and Whisker plot of the distribution of mean concentrations of C. perfringens
spores in pasteurized untreated sewage samples for the TSC, CCP, and m-CP agars (n=19).
3
3.5
4
4.5
5
5.5
6
0 5 10 15
Log
Co
nce
ntr
atio
n (
CFU
/10
0m
L)
Sample Week
TSC CCP m-CP

36
Figure 7. Log concentrations of total C. perfringens in untreated sewage by sample week as
detected by the TSC, CCP, and m-CP agars (n=19)
Figure 8. Log concentrations of C. perfringens spores in pasteurized untreated sewage by sample
week as detected by the TSC, CCP, and m-CP agars (n=19)
For reclaimed water, no C. perfringens colonies were detected in the samples from the
four treatment plants with combined chlorine and UV disinfection. In three samples from
treatment plant C, with only UV disinfection of tertiary treated sewage, C. perfringens colonies
were detected on all three agar media, with TSC enumerating 40, 70, and 22 CFU/100 mL, CCP
enumerating 20, 40, and 46 CFU/100 mL, and m-CP enumerating 3, 10, and 39 CFU/100 mL,
respectively.
2
2.5
3
3.5
4
4.5
5
5.5
6
0 5 10 15
Log
con
cen
trat
ion
(C
FU/1
00
mL)
Sample Week
TSCΔ CCPΔ m-CPΔ

37
Table 3. Central tendency statistics and ranges for concentrations of presumptive C. perfringens
detected by TSC, CCP, and m-CP agars in pasteurized and unpasteurized samples of untreated
sewage and secondary treated effluent.
Central Tendency
Statistic and Range
Unpasteurized Untreated Sewage
(n=19)
Pasteurized Untreated Sewage
(n=19)
TSC CCP m-CP TSC CCP m-CP
Geometric Mean
(CFU/100 mL)
5.36E+04
7.73E+04
1.54E+04
3.27E+04 3.87E+04 4.73E+03
Median
(CFU/100 mL)
5.33E+04
6.33E+04
1.67E+04 4.33E+04 4.17E+04 3.33E+03
Minimum Value
(CFU/100 mL)
1.20E+04
3.50E+04
5.56E+03
8.33E+02 1.67E+03 5.56E+02
Maximum Value
(CFU/100 mL)
1.47E+05
3.58E+05
5.97E+04
1.27E+05 3.17E+05 1.83E+04
Unpasteurized Secondary Treated
Effluent (n=25)
Pasteurized Secondary Treated
Effluent (n=25)
TSC CCP m-CP TSC CCP m-CP
Geometric Mean
(CFU/100 mL) 263 673 167 176 332 16
Median
(CFU/100 mL) 285 636 185 233 267 21
Minimum Value
(CFU/100 mL) 6 161 11 2 42 1
Maximum Value
(CFU/100 mL) 615 2285 855 452 1535 206
Figures 9-12 depict the arithmetic average log10 concentrations and standard errors of C.
perfringens total cells in treated effluent and raw sewage and C. perfringens spores only in
treated effluent and raw sewage, respectively, as detected on each agar medium in samples from
in each treatment plant. According to figures 9 and 11, CCP agar has a higher arithmetic mean
of log10 concentrations of total cells and spores than that of TSC or m-CP in secondary treated
effluent in all treatment plants. The standard errors of CCP and TSC log10 arithmetic mean
concentrations also overlap for several of the treatment plants in both samples. According to
Figures 10 and 12, CCP agar and TSC agar have higher arithmetic mean of log10 concentrations
of total cells and spores than that of m-CP for all treatment plants, but the standard errors of CCP

38
and TSC for these concentrations by treatment plant frequently overlap with each other.
Figure 9. Average log10 concentrations of total C. perfringens with standard errors as detected by
the TSC, CCP, and m-CP agars in secondary treated effluent for each treatment plant from which
samples were analyzed (n=25)
Figure 10. Average log10 concentrations of total C. perfringens with standard errors as detected
by the TSC, CCP, and m-CP agars in untreated sewage for each treatment plant from which
samples were analyzed (n=19)
2.32.5 2.5
2.4 2.42.7
3.03.2
2.62.8
2.0
2.62.8
1.92.0
0
0.5
1
1.5
2
2.5
3
3.5
4
A B C D E
Ave
rage
Lo
g C
on
cen
trat
ion
(lo
g C
FU/1
00
mL)
Treatment Plant
TSC
CCP
m-CP
4.6 4.65.0
4.7 4.85.04.7
5.14.8 4.8
4.1 4.1
4.6
4.1 4.1
0
1
2
3
4
5
6
A B C D E
Ave
rage
Lo
g C
on
cen
trat
ion
(lo
g C
FU/1
00
mL)
Treatment Plant
TSC
CCP
m-CP

39
Figure 11. Average log10 concentrations of C. perfringens spores with standard errors as detected
by the TSC, CCP, and m-CP agars in pasteurized secondary treated sewage effluent for each
treatment plant from which samples were analyzed (n=25)
Figure 12. Average log10 concentrations of C. perfringens spores with standard errors as detected
by the TSC, CCP, and m-CP agars in pasteurized untreated sewage for each treatment plant from
which samples were analyzed (n=19)
2.0
2.52.6
2.12.32.4
2.8
3.0
2.22.4
1.0
1.61.8
0.91.0
0
0.5
1
1.5
2
2.5
3
3.5
A B C D E
Ave
rage
Lo
g C
on
cen
trat
ion
(lo
g C
FU/1
00
mL)
Treatment Plant
TSCΔ
CCPΔ
m-CPΔ
4.34.6 4.7
4.5 4.54.64.3
5.1
4.4 4.5
3.5
3.0
3.63.9
4.2
0
1
2
3
4
5
6
A B C D E
Ave
rage
Lo
g C
on
cen
trat
ion
(lo
g C
FU/1
00
mL)
Treatment Plant
TSCΔ
CCPΔ
m-CPΔ

40
To determine the log10 reductions of total C. perfringens cells and C. perfringens spores
at each treatment plant, the average log10 concentrations of the tertiary treated reclaimed water
(tertiary treated reclaimed water concentrations in Tables 13 and 14) were subtracted from the
average log10 concentrations of the untreated sewage. All treatment plants’ tertiary treatment
process included dual disinfection with UV and chlorine except for plant C which used single
disinfection with UV radiation. The average log10 reductions of total C. perfringens cells for each
of the treatment plants based on the CCP agar, which had the highest enumeration levels of C.
perfringens, were 4.60, 4.57, 4.02, 4.68, and 4.83 for treatment plants A, B, C, D, and E
respectively (Figure 13). Likewise, The average log10 reductions of C. perfringens spores for
each of the treatment plants based on the CCP agar, which had the highest enumeration levels of
C. perfringens, were 4.61, 4.33, 4.31, 4.36, and 4.49 for treatment plants A, B, C, D, and E
respectively (Figure 14).
4.6 4.6
4.0
4.7 4.85.04.7
4.2
4.8 4.8
4.1 4.1
3.6
4.1 4.1
0
1
2
3
4
5
6
A B C D E
Ave
rage
Lo
g C
on
cen
trat
ion
(lo
g C
FU/1
00
mL)
Treatment Plant
TSC
CCP
m-CP

41
Figure 13. Average log10 treatment reductions of total C. perfringens with standard errors as
detected by the TSC, CCP, and m-CP agars for each treatment plant from which samples were
analyzed
Figure 14. Average log10 treatment reductions of C. perfringens spores with standard errors as
detected by the TSC, CCP, and m-CP agars for each treatment plant from which samples were
analyzed
A Friedman nonparametric test was used to compare the concentrations of C. perfringens
total cells and only spores as detected by the TSC, CCP, and m-CP agars in secondary treated
wastewater (Tables 4 and 5) and raw wastewater (Table 6). The results from these statistical tests
suggested that statistically significant differences in concentrations of C. perfringens total cells
and spores were detected by the three agars. Following the Friedman test, a Dunn Multiple
Comparison post-test was performed to compare each of the agar pairs individually. In the
secondary treated sewage sample, the CCP agar was found to have a statistically significantly
greater capacity to enumerate total C. perfringens cells compared to the TSC and m-CP agar
(Table 5; p-value<.001). Both the CCP and TSC agar were found to have a statistically
significantly higher detection rate of C. perfringens spores than the m-CP agar (Table 5; p-value
4.34.6
3.7
4.5 4.54.64.3 4.3 4.4 4.5
3.5
3.0 3.1
3.94.2
0
1
2
3
4
5
6
A B C D E
Ave
rage
Lo
g C
on
cen
trat
ion
(lo
g C
FU/1
00
mL)
Treatment Plant
TSCΔ
CCPΔ
m-CPΔ

42
<0.001). However, there was no statistically significant difference between the TSC and CCP
agars for capacity to detect C. perfringens spores (Table 4; p-value >0.05).
Compared across the first 11 raw sewage samples, both the TSC and CCP agars were
found to detect significantly higher concentrations of spores and total cells of C. perfringens than
the m-CP agar. Following these statistical analyses of these samples, the next 8 untreated sewage
samples were analyzed only with the CCP and TSC agars and not the m-CP agar. Following the
sample analyses, a Wilcoxon matched pairs signed-rank test was performed to compare the
difference in C. perfringens spores and total cell concentrations in untreated sewage, detected by
the TSC and CCP agars. As shown by the results in Table 5, the CCP agar detected a statistically
significant higher concentration of total C. perfringens cells in raw sewage than did TSC agar (p
= 0.0015). However, there was no statistically significant difference between the two agars in C.
perfringens spore concentration detection in raw sewage (p = 0.2101).
Table 4. Results of Friedman test comparing the matched concentrations of total C. perfringens
and spores in secondary treated sewage effluent as detected by TSC, CCP, and m-CP agars
Sample type Friedman test p-value (p-value < 0.05 is significant)
20
treated sewage, no treatment <0.0001
20
treated sewage, pasteurized <0.0001
Table 5. Results of the Dunn Multiple Comparison post-test comparing the matched
concentrations of total C. perfringens and spores in secondary treated sewage effluent as detected
by TSC, CCP, and m-CP agars
Agar 1 Agar 2 Sample type Dunn Multiple Comparison p-value
(p-value < 0.05 is significant) (raw data)
Rank Sum Difference
(raw data)
TSC CCP 2
0
treated sewage <0.001 -30
TSC m-CP 2
0
treated sewage >0.05 9
CCP m-CP 2
0
treated sewage <0.001 39
TSC CCP 2
0
treated sewage Δ >0.05 -12
TSC m-CP 2
0
treated sewage Δ <0.001 30
CCP m-CP 2
0
treated sewage Δ <0.001 42

43
Δ-denotes pasteurization of sample at 65o C for 15 minutes
Table 6. Results of the Wilcoxon matched-pairs signed-ranks test comparing the concentrations
of total C. perfringens and spores in untreated sewage as detected by TSC and CCP agars
Agar 1 Agar 2 Sample type Wilcoxon matched-pairs
signed-ranks test p-value
Rank Sum Difference (raw data)
TSC CCP Raw Sewage 0.0015 -105
TSC CCP Raw Sewage Δ 0.2101 -63
Δ-denotes pasteurization of sample at 65o C for 15 minutes
Presumptive positive and negative C. perfringens colony isolates for pre-sand filtered
samples and untreated sewage samples were collected from each of the three test agar media for
both pasteurized and unpasteurized samples. A test for acid-phosphatase production (AP) was
performed on colony isolates from each of the agar media and the Stormy Fermentation (SF) test
in iron-milk media tubes was performed as well. In total, 533 presumptive isolates (275
presumptive positive colonies and 258 presumptive negative colonies) from pasteurized and
unpasteurized secondary treated effluent and 303 presumptive isolates (171 presumptive positive
colonies and 132 presumptive negative colonies) from pasteurized and unpasteurized untreated
sewage were subjected to both confirmation tests (Table 7). Table 7 contains the summary of the
number of presumptive positive and negative isolates tested by both confirmation tests for each
agar medium in the two types of samples, pasteurized and unpasteurized. Table 8 displays a
contingency table with the aggregate overall number of times that the two confirmation tests
agreed and disagreed with each other for both presumptive positive isolates and presumptive
negative isolates from all samples, both pasteurized and unpasteurized.
The results of the two C. perfringens confirmation tests had varying levels of agreement
among the agar media. Additionally, the results of the tests for acid-phosphatase production and
for stormy fermentation in iron-milk media differed from each other for many of the presumptive
isolates tested. Because of the differing results, specificities and sensitivities were generated
44
based on each individual confirmation test and an agreement between the two confirmation tests.
To evaluate the agar media on the basis of their selectivity, sensitivities, specificities, positive
predictive values (PPV) and negative predictive values (NPV) were calculated for each agar
medium based on the results of the two confirmation tests for both pasteurized and unpasteurized
raw sewage, secondary treated effluent, and total combined samples. All of the sensitivities and
specificities calculated under the different scenarios are displayed in Table 9. The overall
sensitivities of TSC, CCP, and m-CP agar media as determined by agreement of both
confirmation tests on presumptive positive and presumptive negative C. perfringens isolates
from both types of sewage samples were 0.81, 0.78, and 0.81 respectively. For the same agar
media, their overall specificities as determined by agreement of both confirmation tests on C.
perfringens isolates from both types of samples were 0.28, 0.81, and 0.97 respectively. The
sensitivities of the TSC, CCP, and m-CP agar media determined by the same method, but for
combined pasteurized samples were 0.79, 0.81, and 0.63 while the specificities were 0.23, 0.65,
and 0.98 respectively.
All PPV and NPV values calculated under the different scenarios are displayed in Table
10. The overall PPV of TSC, CCP, and m-CP agar media as determined by agreement of both
confirmation tests on presumptive positive and presumptive negative C. perfringens isolates
from both types of sewage samples were 0.53, 0.83, and 0.97 respectively. For the same agar
media, their overall NPVs as determined by agreement of both confirmation tests on C.
perfringens isolates from both types of samples were 0.59, 0.75, and 0.82 respectively. The PPVs
of the TSC, CCP, and m-CP agar media determined by the same method, but for combined
pasteurized samples were 0.53, 0.76, and 0.97 while the NPVs were 0.50, 0.72, and 0.74
respectively (Table 10)

45
Table 7. Summary of the number of presumptive isolates tested for acid phosphatase production
and stormy fermentation in iron milk from each agar type and sample type
Sample Number of Presumptive Isolates Tested
Agar Negative Positive Agar Negative Positive Agar Negative Positive
Secondary
Treated
Effluent
TSC 50 50 m-CP 39 47 CCP 46 50
TSCΔ 49 50 m-CPΔ 35 28 CCPΔ 39 50
Raw
Sewage
TSC 30 30 m-CP 22 30 CCP 21 30
TSCΔ 24 30 m-CPΔ 17 21 CCPΔ 18 30
(Δ-designates that the sample plates on this agar was pasteurized)
Table 8. Contingency Table with results from AP and SF Reactions of total combined
presumptive positive and negative C. perfringens colonies in pasteurized and unpasteurized
samples SF+ SF- Total
AP+ 436 58 494
AP- 85 257 342
Total 521 315 836

46
Table 9. Sensitivities and specificities of each agar as determined by agreement of presumptive
isolates with phenotypic confirmation testing for acid phosphatase production or stormy
fermentation in untreated sewage and secondary treated effluent samples
Agar Type and Sample Treatment
Acid Phosphatase TSC CCP m-CP TSC Δ CCPΔ m-CPΔ
Secondary Treated Effluent Sensitivity 0.86 0.86 0.87 0.86 0.90 0.82
Specificity 0.34 0.91 1.00 0.32 0.79 1.00
Raw Sewage Sensitivity 0.87 0.90 0.87 0.80 0.80 0.71
Specificity 0.37 0.77 0.86 0.46 0.89 1.00
Combined Secondary Treated Effluent and Sewage Sensitivity 0.86 0.88 0.87 0.84 0.86 0.78
Specificity 0.38 0.94 0.99 0.36 0.82 1.00
Stormy Fermentation
Secondary Treated Effluent Sensitivity 0.92 0.92 0.87 0.90 0.96 0.75
Specificity 0.32 0.81 0.98 0.38 0.74 1.00
Raw Sewage Sensitivity 0.93 0.77 0.93 0.87 0.83 0.86
Specificity 0.37 0.86 0.95 0.29 0.78 1.00
Combined Secondary Treated Effluent and Sewage Sensitivity 0.93 0.86 0.90 0.89 0.91 0.80
Specificity 0.34 0.82 0.97 0.35 0.75 1.00
Acid Phosphatase & Stormy Fermentation
Secondary Treated Effluent Sensitivity 0.82 0.82 0.81 0.84 0.90 0.68
Specificity 0.26 0.79 0.98 0.24 0.64 1.00
Raw Sewage Sensitivity 0.80 0.70 0.80 0.70 0.67 0.57
Specificity 0.30 0.86 0.95 0.21 0.67 0.94
Combined Secondary Treated Effluent and Sewage Sensitivity 0.81 0.78 0.81 0.79 0.81 0.63
Specificity 0.28 0.81 0.97 0.23 0.65 0.98
(Δ-designates that the sample plates on this agar was pasteurized)

47
Table 10. Positive Predictive Values (PPV) and Negative Predictive Values (NPV) of each agar
as determined by agreement of presumptive isolates with phenotypic confirmation testing for
acid phosphatase production or stormy fermentation in untreated sewage and secondary treated
effluent samples Agar Type and Sample Treatment
Acid Phosphatase TSC CCP m-CP TSC Δ CCPΔ m-CPΔ
Secondary Treated Effluent PPV 0.55 0.91 1.00 0.55 0.83 1.00
NPV 0.65 0.84 0.94 0.63 0.84 0.88
Raw Sewage PPV 0.59 1.00 0.96 0.60 0.87 0.92
NPV 0.69 0.86 0.84 0.28 0.67 0.73
Combined Secondary Treated Effluent and Sewage PPV 0.57 0.94 0.98 0.57 0.84 0.97
NPV 0.67 0.85 0.87 0.57 0.78 0.82
Stormy Fermentation
Secondary Treated Effluent PPV 0.55 0.82 0.97 0.58 0.80 1.00
NPV 0.76 0.90 0.89 0.63 0.93 0.83
Raw Sewage PPV 0.56 0.88 0.96 0.55 0.83 1.00
NPV 0.82 0.72 0.91 0.56 0.75 0.80
Combined Secondary Treated Effluent and Sewage PPV 0.55 0.84 0.97 0.62 0.81 1.00
NPV 0.79 0.83 0.89 0.61 0.87 0.82
Acid Phosphatase & Stormy Fermentation
Secondary Treated Effluent PPV 0.53 0.80 0.97 0.53 0.75 1.00
NPV 0.59 0.80 0.84 0.60 0.84 0.80
Raw Sewage PPV 0.53 0.88 0.96 0.53 0.77 0.92
NPV 0.60 0.67 0.78 0.36 0.55 0.64
Combined Secondary Treated Effluent and Sewage PPV 0.53 0.83 0.97 0.53 0.76 0.97
NPV 0.59 0.75 0.82 0.50 0.72 0.74
(Δ-designates that the sample plates on this agar was pasteurized)
In order to determine whether there were significant differences among the rates of C.
perfringens confirmation as determined by the confirmation test for acid-phosphatase production
and stormy fermentation in iron-milk medium, the results of the confirmation tests were entered
into contingency tables for each agar medium under the two different sample treatment types
(pasteurized and unpasteurized). The results of these statistical tests are found in Tables 11 and
12. The contingency tables for these tests can be found in Table 8 and Tables 15-28 in Appendix
1. Before creating the contingency tables, a Wilcoxon-Mann-Whitney test was performed to

48
determine if the distribution of confirmation test results differed between the untreated sewage
and secondary treated sewage samples. The test returned p-values of greater than 0.05 for both
comparisons between the samples with both confirmation tests, indicating no statistically
significant difference in confirmation test results between the two sample types (Table 11).
Therefore, the sum of confirmation test results from both samples was used when constructing
contingency tables for each of the agar media in order to increase sample size and thereby the
reliability of the following statistical tests.
Table 11. Results of Wilcoxon-Mann-Whitney test to compare if distribution of confirmation test
results differ between untreated raw sewage and secondary treated effluent.
Confirmation Test z-score p-value
Acid-Phosphatase -1.03 0.302
Stormy Fermentation -.569 0.570
The contingency tables were analyzed by McNemar’s test to determine if the results of
each C. perfringens confirmation test differed significantly. According to this statistical test, the
two confirmation tests had significant differences in results when looked at in total (p-value =
0.024) (Table 12). However, the confirmation tests showed no significant differences when the
results of exclusively presumptive negative isolates or the results of exclusively presumptive
positive isolates were input to a contingency table. When disaggregated by agar medium and
whether a sample was pasteurized, presumptive negative isolates from unpasteurized samples on
CCP agar appeared to elicit significantly different results from the two confirmation tests (p-
value = 0.011). No significant differences were found between the confirmation tests for any of
the other agar media.

49
Table 12. Results of McNemar’s test to compare the results of the phenotypic confirmation tests
of presumptive isolates from each agar medium for both pasteurized and unpasteurized samples.
Presumptive test result for each agar medium McNemar’s chi^2 value p-value
CCP- 6.40 0.011
CCP+ 0.06 0.808
CCPΔ- 0.29 0.59
CCPΔ+ 1.67 0.197
TSC- 0.69 0.405
TSC+ 1.92 0.166
TSCΔ- 0 1
TSCΔ+ 0.82 0.366
m-CP- 1 0.317
m-CP+ 0.25 0.80
m-CPΔ- 1 0.317
m-CPΔ+ 0 1
Combined presumptive positive 2.28 0.13
Combined presumptive negative 2.96 0.085
Total presumptive positives and negatives 5.10 0.024
(-: indicates presumptive negative isolates; +: indicates presumptive positive isolates; Δ:
indicates that isolates came from pasteurized samples)
DISCUSSION
The results from the statistical tests comparing the performance of the agar media in
quantifying C. perfringens by membrane filtration in raw and treated wastewater samples and the
confirmation tests applied to presumptive positive and presumptive negative colony isolates
demonstrate that there are significant differences among the agar media with respect to their
ability to detect presumptive C. perfringens total cells and spores. The results of this study
support previous findings that TSC is a superior agar to m-CP agar in its ability to detect and
quantify C. perfringens in different types of water and wastewater samples (Sartory
1985;Sartory, 1998; Manafi 2013). The results of this study also demonstrate that CCP agar is

50
able to enumerate total C. perfringens cells at higher levels than the two other agar media tested
in both types of wastewater samples analyzed, which has not been demonstrated in previous
studies. This study found CCP agar to produce higher detection of C. perfringens spores than m-
CP agar. C. perfringens spore detection by CCP agar also was comparable to TSC agar which is
similar to the findings of previous work comparing CCP agar and TSC agar with a fluorogenic
substrate (Manafi 2013).
While TSC and CCP agar may not have differed significantly in their ability to detect C.
perfringens spores, the results of the two confirmation tests for presumptive C. perfringens
colonies suggest that there may be differences in the reliability of these agar media to accurately
detect biochemically and phenotypically confirmed C. perfringens colonies and true negative
colonies. Assuming a conservative criterion of concordant results for both phenotypic
confirmation tests in true negativity or positivity, the sensitivity and specificity for TSC agar was
close to 80% and 25%, respectively, for total C. perfringens cells and only spores. The combined
sensitivity and specificity for CCP agar based on these same criteria was about 78% and 81%,
respectively, for total C. perfringens cells and about 81% and 65%, respectively, for C.
perfringens spores. In contrast, the m-CP agar medium, had high specificity above 95%, but
similar sensitivities of 81% for total C. perfringens cells and 63% for C. perfringens spores. The
finding of somewhat reduced sensitivity in C. perfringens detection for the TSC agar has been
noted previously (Araujo 2004; Sartory 1998). The high sensitivity of m-CP for C. perfringens
has also been previously observed, but the lower specificity of m-CP for C. perfringens detection
is in contrast to some previous findings (Bisson and Cabelli 1979). Overall, the values close to
80% specificity found for each of these agar media is in agreement with previous work that has
found varying degrees of specificity among these agar media (Araujo 2004; Sartory 1998).

51
However, this study is the first to recognize that these similar specificities (0.81 for
unpasteurized samples as determined by dual confirmation and 0.65 for pasteurized samples as
determined by dual confirmation) are also found for C. perfringens detection by CCP agar in raw
and treated wastewater, as they have been reported previously for other waters.
Although presumptive C. perfringens colony isolates were tested by phenotypic
confirmation, there were moderate levels of disagreement between the two phenotypic
confirmation tests, with 143 cases of discordant results between the confirmation tests of the 836
(17.1%) total isolates subjected to confirmation testing (Table 8). When looked at in the
aggregate, there was a significant difference between the results of the two phenotypic
confirmation tests according the McNemar’s tests (p-value = 0.024). While molecular
confirmation of these isolates was not done for this research, previous studies have found that the
phenotypic confirmation tests are not always accurate, although the test for acid-phosphatase
production has had higher levels of measured sensitivity than the test for stormy fermentation
(Hauschild and Hilsheimer 1974; Mead 1985; Eisgruber et al. 2000; Hansen and Elliott 1980).
These finding may explain why the two confirmation tests had varying levels of disagreement at
times. In order to better assess the accuracy of these phenotypic confirmation tests and the true
sensitivities and specificities of the test agar media, confirmation of the presumptive isolates
should be done by additional biochemical testing and through molecular analyses, such as
molecular characterization and identification by nucleic acid analysis and by protein targeted
mass spectrometry, such as MALDI-TOF MS using identity comparison to robust databases.
In addition to the quantitative results for C. perfringens enumeration and phenotypic
confirmation found in this study, there were also qualitative and user ease differences observed
among the three agar media. The m-CP agar was the most difficult to prepare, use and read

52
results for. Medium preparation required the use of multiple medium additives after autoclaving
the base medium and reading the results of the test required the exposure of plates with colonies
to ammonium hydroxide fumes in order to cause a color change in presumptive positive
colonies. This step had to be done under a hood to prevent the inhalation of fumes and after the
color change initially took place, the colonies would rapidly revert back to their initial coloring.
This made reading plates with high colony counts difficult to do. The TSC agar also presented
some difficulties for accurate C. perfringens colony enumeration. Presumptive positive colonies
for this agar are supposed to be black with a yellow halo, but there were often colonies that were
varying shades of gray with a yellow halo, which were difficult to identify as either positive or
negative. In accordance with the manufacturer’s instructions, these colonies were counted as
negative, but phenotypic confirmation testing suggested that these colonies were often likely to
be C. perfringens. Further, TSC frequently cultured high levels of presumptive negative colonies
that were yellow with no black or grey center, but these apparently negative colonies often tested
as positive by one or both of the phenotypic confirmation tests. This resulted in the TSC agar
having an unacceptably low sensitivity.
The CCP agar was generally the easiest to prepare and use, and gave reliable colony
differentiation of presumptive positive and presumptive negative colonies based on their color.
However, the process of reading results requires an additional 30-60 minutes after overnight
incubation of plates to allow for the color change of positive colonies to occur. Regardless, the
distinction between positive and negative colonies is very clear, as positives come in varying
shades of green, while negative colonies are distinctly gray, purple, or bright blue. Additionally,
the CCP agar is very easy to prepare as it is boiled and only requires a single supplement to
make.

53
Aside from the difference in ease of use, there are differences in cost to consider among
the agar media. The current list prices for these media on the Fisher Scientific website (04/25/16)
are as follows: TSC agar sells for $237/500 g, m-CP sells for $233/500 g, and CCP agar sells for
$393/250 g and is available from Sigma Aldrich. The considerable difference in price between
the CCP agar medium and the other two agar media is important for consideration especially for
labs with lower budgets, as they decide which medium and method is best to use.
There are also important qualitative aspects regarding the phenotypic confirmation tests
that affect their ease of use. Stormy fermentation in iron-milk tubes is very easy to use and there
is an easy distinction to observe between positive and negative tubes. The acid-phosphatase test
is easy to perform and rapid but was more difficult to interpret because a positive confirmation
by the test is based on a color change. The color change that occurs after exposing a presumptive
colony to a reagent occurs over a variable amount of time between one and five minutes.
However, after time passes, the color of the reagent eventually changes to brown regardless of
the result of the test. The brown color can be difficult to differentiate from the purple color in a
positively confirmed reaction. Thus, some of the disagreement between the two confirmation
tests may be explained through observer error in reading the confirmation tests. However, it is
also possible that some isolates positive by stormy fermentation are not all C. perfringens, as this
test can also detect other sulphite reducing Clostridium species besides C. perfringens.
Limitations
Although the conclusions of this research as stated above are supported by the analysis of
a large number of different wastewater samples, there are several limitations to this work. For
some agar media, an estimated concentration value was used to represent the result on an agar
medium plate that had either no growth or too numerous to count. These assigned values of

54
lower (no detection) and upper (TNTC) censored results may have overrepresented or
underrepresented the ability of the agar medium to detect and quantify C. perfringens in each
respective wastewater sample.
Another limitation is that no true or “gold standard” sensitivity or specificity was able to
be applied for each of the agar media as only phenotypic confirmation was used for presumptive
isolates and for which results were sometimes found to be conflicting. The use of a molecular
based confirmation analysis of presumptive C. perfringens isolates, such as MALDT-TOF MS or
PCR followed by nucleotide sequencing, would have provided a more definitive basis for
confirmation of true positives.
Human judgement subject to error limits the ability to correctly read the acid-phosphatase
test which relies on visualization of a color reaction by the human eye to verify that material
from a colony has turned purple when exposed to the reagent. However, differentiating between
purple as a positive and brown as a negative can sometimes be hard to visualize correctly. As a
result, some colonies could have been counted as testing acid phosphatase negative when they
were actually positive and vice-versa.
Furthermore, the assumption that stormy fermentation detects C. perfringens is
compromised by the fact that other sulfite-reducing clostridia species besides C. perfringens
produce this reaction. As a result, positivity from the stormy fermentation test does not assure
that the colony examined actually was C. perfringens and not another sulfite-reducing
clostridium.
Another limitation was encountered when attempting to extend these results to the use of
these media and methods in evaluation of tertiary treated reclaimed water. All samples treated
with UV and chlorine disinfection detected no C. perfringens in any of the samples. In the one

55
treatment plant without chlorination after UV irradiation, there were C. perfringens cells and
spores detected in three of the samples, However, this is not a large enough sample size to truly
compare the agar media against each other to evaluate their performance. Therefore, although it
is possible to say that differences exist among the agar media with respect to their ability to
detect C. perfringens in untreated wastewater and secondary treated wastewater, we cannot
document if this is also true for detection of C. perfringens in tertiary treated and dual disinfected
reclaimed water.
CONCLUSION
Though there are many factors to consider when deciding which agar medium is the best
for identifying and quantifying C. perfringens in wastewater and treated wastewater, the results
of these sets of experiments and analyses suggest that the CCP agar is the best option based on
its ease of use and ability to differentiate and detect colonies. Furthermore, the relatively high
confirmation rates of presumptive positive isolates as determined by the tests for acid-
phosphatase production and stormy fermentation in iron-milk media support the reliability of the
performance of this agar
However, the TSC agar may be a suitable alternative if the interested lab is looking only
at presence of spores in their water samples. This may frequently be the case as the spores are the
intended surrogate indicator for the presence of protozoan parasites in the water. Because no
statistically significant difference was found between the ability of TSC and CCP agars to detect
C. perfringens spores, it is likely that these two media can be used interchangeably for this

56
purpose. This could be useful for resource limited labs that may not be able to afford the more
expensive CCP medium. However, the extremely low specificity determined for the TSC agar
and the occasional occurrence of high counts of presumptive negative colonies suggests that
when it is possible, the CCP agar medium is still preferred for use to obtain the most accurate
level of C. perfringens spores concentrations.
Future Work
Several future topics should be investigated following the results of this research.
Molecular confirmation is recommended to compare to positive confirmation of presumptive
isolates by the two phenotypic confirmation tests used, acid phosphatase and stormy
fermentation. Additionally, the TSC agar with the fluorogenic substrate that provides a rapid
phenotypic phosphatase confirmation test should evaluated in untreated and treated sewage
samples to compare its performance and determine whether it could be a feasible alternative to
the CCP media and whether the specificity on this medium would be as low as its TSC
counterpart. More work should also be done to compare the efficacy of these direct count
methods for enumeration of C. perfringens with quantal most probable number methods such
stormy fermentation in iron-milk tubes in the context of wastewater and treated wastewater as
such studies have not previously been done.

57
Appendix 1: Raw Data Tables and Contingency Tables
Table 13. Concentrations (CFU/100 mL) of total C. perfringens cells as detected by TSC, CCP,
and m-CP agars for each sample analyzed
Date Sample Site Sample Type TSC CCP m-CP
5/16/2013 A Pre-sand filter 264 367 67
5/23/2013 A Pre-sand filter 615 458 67
5/28/2013 A Pre-sand filter 221 339 21
6/18/2013 A Pre-sand filter 264 367 67
6/25/2013 A Pre-sand filter 615 458 67
7/23/2013 B Pre-sand filter 521 824 439
7/30/2013 B Pre-sand filter 182 864 273
8/6/2013 C Pre-sand filter 285 900 855
8/20/2013 C Pre-sand filter 418 >2203* 561
8/27/2013 D Pre-sand filter 221 348 100
9/3/2013 D Pre-sand filter 473 >1961* 691
9/10/2013 E Pre-sand filter 261 636 39
9/24/2013 E Pre-sand filter 358 730 288
10/8/2013 A Pre-sand filter 539 579 185
5/13/2014 A Pre-sand filter 6 836 400
5/20/2014 B Pre-sand filter 279 >2264* 842
5/27/2014 D Pre-sand filter 144 161 11
6/3/2014 C Pre-sand filter 367 >1988* 375
7/1/2014 A Pre-sand filter 215 458 148
7/8/2014 B Pre-sand filter 360 673 258
7/15/2014 D Pre-sand filter 156 227 52
7/15/2014 E Pre-sand filter 198 598 115
7/22/2014 C Pre-sand filter 303 >2285* 718
8/5/2014 B Pre-sand filter 427 1033 500
8/12/2014 D Pre-sand filter 321 333 94
7/15/2014 D Raw Sewage 100000 133333 <16667**
7/15/2014 E Raw Sewage 133333 166667 <16667**
7/22/2014 C Raw Sewage 143333 173333 30000
8/5/2014 B Raw Sewage 53333 80000 26667
8/12/2014 D Raw Sewage 56667 60000 10000
2/09/2015 A Raw Sewage 46667 65556 6667
3/3/2015 B Raw Sewage 30000 41111 5556
3/17/2015 E Raw Sewage 56667 51111 10000
3/24/2015 D Raw Sewage 36667 63333 11667
3/31/2015 C Raw Sewage 28917 >84583* >59667*
4/6/2015 A Raw Sewage 12000 50167 20000
5/26/2015 A Raw Sewage 118333 358333 N/A
6/2/2015 E Raw Sewage 21667 35000 N/A
6/11/2015 C Raw Sewage 146667 146667 N/A

58
*denotes one or more plates was TNTC and a value of 225 was used to calculate CFU/100mL.
The value 225 is two times the highest detectable limit for any of the agar media
** denotes that no colonies grew on a sewage sample. Because sewage samples were diluted
several 10-fold, a value of 0.5 was used as a lower detection limit to calculate CFU/100mL of
any agar medium that detected 0 colonies for a sewage sample.
6/11/2015 B Raw Sewage 31667 43333 N/A
6/15/2015 A Raw Sewage 40000 61667 N/A
6/29/2015 D Raw Sewage 25000 48333 N/A
7/7/2015 E Raw Sewage 133333 46667 N/A
7/14/2015 C Raw Sewage 133333 98333 N/A
5/13/2014 A Reclaimed 0 0 0
5/20/2014 B Reclaimed 0 0 0
5/27/2014 D Reclaimed 0 0 0
6/3/2014 C Reclaimed 40 20 3
7/1/2014 A Reclaimed 0 0 0
7/8/2014 B Reclaimed 0 0 0
7/15/2014 D Reclaimed 0 0 0
7/15/2014 E Reclaimed 0 0 0
7/22/2014 C Reclaimed 70 40 10
8/5/2014 B Reclaimed 0 0 0
8/12/2014 D Reclaimed 0 0 0
2/09/2015 A Reclaimed 0 0 0
3/3/2015 B Reclaimed 0 0 0
3/17/2015 E Reclaimed 0 0 0
3/24/2015 D Reclaimed 0 0 0
3/31/2015 C Reclaimed 22 46 39
4/6/2015 A Reclaimed 0 0 0
5/26/2015 A Reclaimed 0 0 N/A
6/2/2015 E Reclaimed 0 0 N/A
6/11/2015 C Reclaimed 0 0 N/A
6/11/2015 B Reclaimed 0 0 N/A
6/15/2015 A Reclaimed 0 0 N/A
6/29/2015 D Reclaimed 0 0 N/A
7/7/2015 E Reclaimed 0 0 N/A
7/14/2015 C Reclaimed 0 0 N/A

59
Table 14. Concentrations (CFU/100 mL) of C. perfringens spores as detected by TSC, CCP, and
m-CP agars for each sample analyzed
Date Sample Site Sample Type TSCΔ CCPΔ m-CPΔ
5/16/2013 A Pre-sand 121 221 15
5/23/2013 A Pre-sand 312 267 9
5/28/2013 A Pre-sand 124 106 3
6/18/2013 A Pre-sand 121 221 15
6/25/2013 A Pre-sand 312 267 9
7/23/2013 B Pre-sand 452 521 48
7/30/2013 B Pre-sand 197 515 24
8/6/2013 C Pre-sand 391 515 85
8/20/2013 C Pre-sand 406 >1464* 79
8/27/2013 D Pre-sand 61 155 21
9/3/2013 D Pre-sand 406 467 206
9/10/2013 E Pre-sand 233 188 21
9/24/2013 E Pre-sand 418 497 27
10/8/2013 A Pre-sand 288 158 9
5/13/2014 A Pre-sand 2 994 24
5/20/2014 B Pre-sand 179 >1182* 24
5/27/2014 D Pre-sand 117 133 3
6/3/2014 C Pre-sand 313 >1535* 56
7/1/2014 A Pre-sand 165 198 4
7/8/2014 B Pre-sand 288 413 150
7/15/2014 D Pre-sand 50 42 1
7/15/2014 E Pre-sand 77 125 2
7/22/2014 C Pre-sand 391 >1318* 33
8/5/2014 B Pre-sand 418 688 27
8/12/2014 D Pre-sand 200 148 2
7/15/2014 D Raw Sewage <16667** 66667 <16667**
7/15/2014 E Raw Sewage 66667 <16667** <16667**
7/22/2014 C Raw Sewage 103333 100000 <1667**
8/5/2014 B Raw Sewage 66667 43333 <1667**
8/12/2014 D Raw Sewage 36667 <1667** <1667**
2/09/2015 A Raw Sewage 50000 65556 3333
3/3/2015 B Raw Sewage 27778 5556 556
3/17/2015 E Raw Sewage 55000 40000 16667
3/24/2015 D Raw Sewage 60000 65000 18333
3/31/2015 C Raw Sewage 14667 >100417* 10917
4/6/2015 A Raw Sewage 34667 38667 3333
5/26/2015 A Raw Sewage 73333 316667 N/A
6/2/2015 E Raw Sewage 8333 41667 N/A
6/11/2015 C Raw Sewage 126667 201667 N/A
6/11/2015 B Raw Sewage 36667 41667 N/A

60
6/15/2015 A Raw Sewage 833 3333 N/A
6/29/2015 D Raw Sewage 20000 36667 N/A
7/7/2015 E Raw Sewage 43333 31667 N/A
7/14/2015 C Raw Sewage 43333 115000 N/A
5/13/2014 A Reclaimed 0 3 0
5/20/2014 B Reclaimed 0 0 0
5/27/2014 D Reclaimed 0 0 0
6/3/2014 C Reclaimed 70 17 3
7/1/2014 A Reclaimed 0 0 0
7/8/2014 B Reclaimed 0 0 0
7/15/2014 D Reclaimed 0 0 0
7/15/2014 E Reclaimed 0 0 0
7/22/2014 C Reclaimed 83 10 3
8/5/2014 B Reclaimed 0 0 0
8/12/2014 D Reclaimed 0 0 0
2/09/2015 A Reclaimed 0 0 0
3/3/2015 B Reclaimed 0 0 0
3/17/2015 E Reclaimed 0 0 0
3/24/2015 D Reclaimed 0 0 0
3/31/2015 C Reclaimed 22 46 39
4/6/2015 A Reclaimed 0 0 0
5/26/2015 A Reclaimed 0 0 N/A
6/2/2015 E Reclaimed 0 0 N/A
6/11/2015 C Reclaimed 0 0 N/A
6/11/2015 B Reclaimed 0 0 N/A
6/15/2015 A Reclaimed 0 0 N/A
6/29/2015 D Reclaimed 0 0 N/A
7/7/2015 E Reclaimed 0 0 N/A
7/14/2015 C Reclaimed 0 0 N/A
*denotes that one or more plates was TNTC and a value of 225 was assigned to calculate
CFU/100mL. A value of 225 is two times the highest countable limit for any of the agar media
** denotes that no colonies grew on a sewage sample. Because sewage samples were diluted
several 10-fold, a value of 0.5 was used as a lower detection limit to calculate CFU/100 mL of
any agar medium that detected 0 colonies for a sewage sample.

61
Table 15: Contingency Table for AP and SF Reactions of TSC Presumptive Positive C.
perfringens Colonies of Unpasteurized Samples SF+ SF- Total
AP + 65 4 69
AP- 9 2 11
Total 74 6 80
Table 16: Contingency Table for AP and SF Reactions of TSC Presumptive Negative C.
perfringens Colonies of Unpasteurized Samples SF+ SF- Total
AP + 42 5 47
AP- 8 25 33
Total 50 30 80
Table 17: Contingency Table for AP and SF Reactions of CP ChromoSelect Presumptive
Positive C. perfringens Colonies of Unpasteurized Samples SF+ SF- Total
AP+ 62 9 70
AP- 8 2 20
Total 69 11 80
Table 18: Contingency Table for AP and SF Reactions of CP ChromoSelect Presumptive
Negative C. perfringens Colonies of Unpasteurized Samples SF+ SF- Total
AP+ 3 1 4
AP- 54 9 63
Total 55 12 67

62
Table 19: Contingency Table for AP and SF Reactions of m-CP Presumptive Positive C.
perfringens Colonies of Unpasteurized Samples SF+ SF- Total
AP+ 60 7 67
AP- 9 1 10
Total 69 8 77
Table 20: Contingency Table for AP and SF Reactions of m-CP Presumptive Negative C.
perfringens Colonies of Unpasteurized Samples SF+ SF- Total
AP+ 1 0 1
AP- 1 59 60
Total 2 59 61
Table 21: Contingency Table for AP and SF Reactions of TSC Presumptive Positive C.
perfringens Colonies of Pasteurized Samples SF+ SF- Total
AP+ 64 4 68
AP- 7 5 12
Total 71 9 80
Table 22: Contingency Table for AP and SF Reactions of TSC Presumptive Negative C.
perfringens Colonies of Pasteurized Samples SF+ SF- Total
AP+ 39 9 48
AP- 9 16 25
Total 48 25 73

63
Table 23: Contingency Table for AP and SF Reactions of CP ChromoSelect Presumptive
Positive C. perfringens Colonies of Pasteurized Samples SF+ SF- Total
AP+ 64 5 69
AP- 10 1 11
Total 74 6 80
Table 24: Contingency Table for AP and SF Reactions of CP ChromoSelect Presumptive
Negative C. perfringens Colonies of Pasteurized Samples SF+ SF- Total
AP+ 6 6 12
AP- 8 37 45
Total 14 43 57
Table 25: Contingency Table for AP and SF Reactions of m-CP Presumptive Positive C.
perfringens Colonies of Pasteurized Samples SF+ SF- Total
AP+ 31 7 38
AP- 7 4 11
Total 11 38 49
Table 26: Contingency Table for AP and SF Reactions of m-CP Presumptive Negative C.
perfringens Colonies of Pasteurized Samples
SF+ SF- Total
AP+ 0 1 1
AP- 0 51 51
Total 0 52 52

64
Table 27: Contingency Table for AP and SF Reactions of total combined presumptive positive C.
perfringens colonies in pasteurized and unpasteurized samples SF+ SF- Total
AP+ 345 36 381
AP- 50 15 65
Total 395 51 446
Table 28: Contingency Table for AP and SF Reactions of total combined presumptive negative
C. perfringens colonies in pasteurized and unpasteurized samples SF+ SF- Total
AP+ 91 22 113
AP- 35 242 277
Total 126 264 390

65
APPENDIX 2: Clostridium perfringens bench sheet
Clostridium perfringens Membrane Filtration Procedure
CP ChromoSelect, TSC and m-CP agars
Based on and adapted from US EPA Method 1103.1
(http://www.epa.gov/nerlcwww/documents/1103_1sp02.pdf)
The enumeration of Clostridium perfringens in water and wastewater by a simple membrane
filtration method was first described in 1979 by Bisson and Cabelli of US EPA. They reported
the development of a new medium called m-CP for use in enumerating C. perfringens in water
by membrane filtration. However, the use of m-CP agar has disadvantages, including the need to
expose the colonies to ammonia using ammonium hydroxide, which prevents subculturing the C.
perfringens colonies, and it is hazardous to handle. The red color of the C. perfringens colonies
also tends to fade after exposure to the ammonia, which also compromises confirmation. Recent
studies suggest that m-CP medium may not be as good as other media for C. perfringens
enumeration in water, such as the widely used Tryptose–Sulphite-Cycloserine (TSC) agar
medium. The enumeration of C. perfringens by ISO methods is based on the use TSC agar and
m-CP agar was rejected for use. However, TSC agar has been reported to give excessive and
variable blackening of the peripheral colonies on membranes, which makes colony counting at
lower dilutions difficult and leads to false positives. More recently, a chromogenic medium, CP
Chromo Select, has been developed to detect C. perfringens by membrane filtration. It gives
distinctive green colonies of C. perfringens and the agar is reported to be more reliable and
easier to handle than m-CP and TSC agars. The green color does not diffuse in the agar medium
and confirmation is not required since the green coloration is specific for C. perfringens.
General
Agar Detectable Bacteria Supplements
CP ChromoSelect C. perfringens D-cycloserine
TSC C. perfringens D-cycloserine
m-CP C. perfringens D-cycloserine, polymyxin B sulfate, ferric
chloride, phenolphthalein diphosphate,
Indoxyl-β-D-glucoside, m-CP Selective
Supplement
Day 1 Prepare agar plates for assay
Materials required:
● 60 mm petri dishes
● 500 mL media storage bottles
● 10 mL pipets

66
● TSC agar base
● CP ChromoSelect agar base
● m-CP agar base
● D-cycloserine
● Deionized water
● 4.5% ferric chloride
● 0.5% phenolphthalein diphosphate
● Indoxyl β-D-glucoside
● m-CP Selective Supplement
● Sterile H2O
Procedure:
TSC
○ Weigh out 3.9 g/100mL TSC agar base on weighboat and dispense into 500 mL media
storage bottle
○ Using a graduated cylinder, pour appropriate amount of water (i.e. 100 mL for 3.9g) into
storage bottle and shake or swirl until base is completely dissolved
○ Autoclave on liquids setting for 15 minutes
○ Remove bottle from autoclave and place in water bath to cool at ~50 C.
○ Once, cool enough to touch (~15 mins), add .04g/100 mL of D-cycloserine and swirl
until dissolved.
○ Under a hood or using aseptic technique at the bench, pipet 5 mL of agar into 60 mm
petri dishes
○ store upside down in plastic bag in cold room until use
○
CP ChromoSelect
○ Weigh out 6.28 g/100mL TSC agar base on weighboat and dispense into 500 mL media
storage bottle
○ Using a graduated cylinder, pour appropriate amount of water (i.e. 100 mL for 6.28g) into
storage bottle and shake or swirl until base is completely dissolved
○ Boil on hot plate and then place in water bath to cool at ~50 C.
○ Once, cool enough to touch (~5-10 mins), add 0.04g/100 mL of D-cycloserine and swirl
until dissolved.
○ Under a hood or with aseptic technique at the bench, pipet 5 mL of agar into 60 mm petri
dishes
o store upside down in plastic bag in cold room until use
o
m-CP
○ Weigh out 7.11 g/100mL m-CP agar base on weighboat and dispense into 500 mL media
storage bottle
○ Using a graduated cylinder, pour appropriate amount of water (i.e. 100 mL for 7.11 g)
into storage bottle and shake until base is completely dissolved
○ Autoclave on liquids setting for 15 minutes
○ Remove bottle from autoclave and place in water bath to cool at ~50 C.
○ Once cool enough to touch (~15 mins), add 200 μL 4.5% ferric chloride/100 mL agar, 2
mL .5% phenolphthalein diphosphate/100 mL agar, .8mL Indoxyl-β-D-glucoside/ 100mL agar,

67
and 0.4mL m-CP Selective Supplement/ 100mL agar
○ Under a hood or using aseptic technique at the bench, pipet 5 mL of agar into 60 mm
petri dishes
○ Store upside down in plastic bag in cold room until use
Day 2
If analyzing pasteurized sample, turn on water bath to 65 C
Membrane Filtration Assay
Materials Required:
● One sterile 300 mL magnetic filter funnel per sample
● One 1-L filtration flask with thick-walled vacuum tubing
● One pair flat-bladed forceps
● 100% ethanol
● Millipore HAWG047S6 filter membranes (or equivalent), sterile, 0.45 um pore size, 47
mm diameter, six per sample plus two negative controls
● 60 mm petri dishes, each containing 5 mL of agar medium, six per sample plus two
negative controls.
● phosphate-buffered saline (PBS) or Standard Methods phosphate buffer
● Anaerobic jar(s) with lid and clamp OR anaerobic bag
● Cello-Seal sealing grease (only necessary for jars)
● Anaerobic atmosphere - generating envelope(s)
● Dry Anaerobic Indicator Strip(s)
● Bunsen Burner
● Vacuum Source
● 44.5 C incubator
Pasteurization (optional):
● If pasteurizing, turn on water bath to 65 oC.
● Remove caps from bottles, dispense desired sample volumes into storage bottles of equal
size, ensuring equal volumes in each bottle used (i.e. 3 bottles of 100 mL or 1 bottle of 300 mL),
place caps back on bottles
● Dispense equivalent amount of sample or deionized water into another storage bottle of
equal size, cover bottle opening with aluminum foil
● Place the bottles in the water bath and insert thermometer through foil covered control
bottle
● Wait for control bottle to read 65o C and then let sit for 15 minutes, Remove samples
from water bath and place in a tub full of ice, samples are now ready to be used in membrane
filtration procedure, only C. perfringens spores will be detected in analysis
Procedure:
● Label the bottoms of prepared agar dishes with the sample designation and the volume to
be filtered.
● Place a sterile filter funnel into a filtration flask and connect the flask to a vacuum source.
● Place flat-bladed forceps into a small beaker with 100% ethanol so that the tips are
submerged.

68
● Sterilize forceps over Bunsen burner and allow for them to cool for several seconds, then
carefully use them to remove a filter membrane from packaging
● Remove upper reservoir from filter funnel and place the membrane on the base of the
filter funnel with forceps; replace the reservoir onto the base
● Pipet 10 mL of PBS (or Standard Methods phosphate buffer) onto membrane and filter
apparatus, open vacuum line until all PBS (or Standard Methods phosphate buffer) has run
through, remove membrane filter with sterile forceps and place onto one of the agar plates as a
control
● Replace a new membrane filter on the apparatus using the same technique as before
● Starting with most dilute sample, pipet or pour appropriate volume of water sample in the
reservoir, and open the vacuum line as before, Once the sample filtration is complete, rinse the
walls of the reservoir with 5 mL of sterile phosphate-buffered saline (or Standard Methods
phosphate buffer) to wash any residual sample through the filter. Shut off vacuum
● Using sterile forceps, slowly and carefully remove the membrane, and place it, gridded
side up, on the layer of agar in a labeled 60 mm petri dish. To avoid air pockets between the agar
and the membrane that can block nutrient flow through the membrane to the bacterial colonies
on the upper membrane surface, apply the membrane slowly in a rolling motion from one side of
the dish to the other. If air pockets are observed, the filter can be partially or completely re-
positioned using the forceps.
● Sterilize the forceps by dipping into absolute ethanol contained in a small beaker, then
exposing briefly to alighted Bunsen burner to set the ethanol alight. Allow to cool for several
seconds
● Repeat previous five steps until all replicate subsamples of all volumes of a single sample
have been filtered.
● Remove the filter base and reservoir and replace with another sterile filter funnel
assembly before proceeding with the next sample
● Prepare two negative control samples as described above immediately after installing the
first and last filter funnel assembly before the first and last samples are processed.
● Place the inverted petri dishes in an anaerobic jar or bag. If using jar, ensure the upper
rim of the jar is lightly coated with Cello-Seal to make a gas -tight seal, preventing atmospheric
oxygen from subsequently entering. Wet the blue tip of one dry anaerobic indicator strip with
deionized water, and place it on top of the piled petri dishes so that the blue tip of the strip is
exposed to the atmosphere on all sides, and is visible from the outside of the jar or bag. Open the
foil container of a GasPak Anaerobe Container System envelope, and slide down one side of the
jar or bag without disrupting the dishes. Promptly close the jar lid with a twisting motion to
spread Cello-Seal grease or seal the anaerobic bag. If using jar, place clamp over jar lid, and seal
firmly, but not so tight as to crack the lid.
● Place jar or bag with sample plates in 44.5 oC incubator overnight
Day 3
Read results of membrane filtration
● Confirm system incubated overnight anaerobically, previously blue tip of indicator strip
should appear white
● Count colonies on TSC agar plates. Presumptive positive colonies will be black and have
small yellow rings around them. Presumptive negative colonies will be yellow or yellow with

69
faint gray spot in them. Count colonies on each membrane and record counts.
● CP ChromoSelect agar - Open anaerobic jar or bag and remove GasPak, replace open jar
or bag into incubator for ~1 more hour, then count and record colonies on each membrane.
Presumptive positive colonies will be of greenish hue, presumptive negative colonies will be
other colors including purple, blue, turquoise, or mix of green and purple.
● m-CP agar – Pour ammonium hydroxide into a plastic or glass container. Expose plates
one at a time to ammonium hydroxide fumes for 30 seconds-1.5 minutes until colonies turn pink.
Colonies that turn pink when exposed are presumptive positive colonies. All other colonies are
presumptive negative. Count and record pink colonies.
Appendix 3. Composition and description of Clostridium perfringens culture
media
In this project three different growth media were evaluated for the detection of Clostridium
perfringens in reclaimed water by the membrane filter method. The three media have somewhat
different compositions and provide detection of C. perfringens colonies based on distinctive
colony color. In the case of one of the media, m-CP agar, there is an added step of treating the
colonies with ammonium hydroxide fumes to elicit a distinctive color change that is diagnostic
for C. perfringens. The compositions of the three different media are shown in the table below.
Component Tryptose Sulfite
Cycloserine Agar
CP ChromoSelect Agar Modified
m-CP Agar
Tryptose 15 20 30
Soy peptone 5 5 none
Yeast extract 5 15 20
Sucrose none 3 5
Magnesium sulfate + 7 H20 none 0.1 0.1
Ferric ammonium citrate 1 0.2 none
L-cysteine hydrochloride none 1 1
Sodium disulfite 1 none none
Tris buffer none 1.8 none
Chromogenic mixture none 1.73 none
Bromocresol purple none none 0.04
Agar
12
15
15 Total grams of components
per liter
39 62.8 71.1
Supplements (per liter)
D-cycloserine 0.4 0.4 0.4
Polymyxin B sulfate none none 0.025

70
Phenolphthalein
biphosphate, tetra sodium
salt
none none 0.1
Ferric chloride + 6H2O none none 0.09
Indoxyl-ß-D-glucoside none
none 0.06
Description of Ingredients in the Clostridium perfringens media
Nutrients
Tryptose and peptone are enzymatic digests of protein which contain high concentrations of
amino acids, trace elements and vitamins, all necessary for growth and replication of bacteria.
Peptone contains smaller peptide molecules, while tryptose contains more higher-weight
peptides.
Yeast extract is a water-soluble extract of autolyzed yeast cells which is processed in a way to
preserve B-complex vitamins. It also contains amino acids. Yeast extract is added to
bacteriological media to stimulate growth.
Sucrose is a sugar which can be anaerobically fermented by Clostridium perfringens, forming
acidic metabolic products which cause bromocresol purple to change to a yellow color. Many
other Clostridia species cannot ferment sucrose, so those colonies are not yellow. Sucrose is
included in m-CP agar to provide differentiation of (yellow) Clostridium perfringens colonies
from most other Clostridia species.
Salts
Magnesium sulfate is a component of CP ChromoSelect Agar and m-CP agar because it has been
found that the presence of magnesium ions enhances growth of C. perfringens.
Ferric ammonium citrate and ferric chloride are sources of iron, which is another enhancer of C.
perfringens growth. Ferric ammonium citrate plays a major role in TSC agar. C. perfringens
possesses sulfite reductase, an enzyme which reduces sodium disulfite, another component of
TSC agar, to sulfide. Iron ions combine with sulfide to produce black colonies, which are
counted as presumptive Clostridium perfringens colonies.
L-cysteine hydrochloride is a reducing agent which lowers the redox potential of the medium,
enhancing growth of anaerobic bacteria like Clostridium.
A Tris buffer is included in CP ChromoSelect agar to stabilize the pH of the medium, since C.
perfringens growth begins to be inhibited above pH 7.6.
Agar
Agar is a gelling agent derived from a polysaccharide of red algae. The standard concentration of

71
agar in microbiological media is 1.5% or 15 grams per liter.
Selective agents
D-cycloserine is a broad-spectrum antibiotic which inhibits the synthesis of bacterial cell walls.
It is effective against gram-negative bacteria, such as E. coli and other enteric bacteria.
Polymyxin B sulfate is another broad-spectrum antibiotic which is effective against many gram-
negative bacteria like Pseudomonas spp. and enteric bacteria, except for Proteus spp.. It binds to
and increases the permeability of bacterial cell membranes, causing uncontrolled water uptake
and cell death. Polymyxin B is used in combination with D-cycloserine in m-CP agar to inhibit a
wider range of non-clostridial bacteria. Two other selective conditions are utilized to inhibit non-
Clostridium bacteria. The agar dishes are incubated in an anaerobic atmosphere and at an
elevated temperature (44.5°C).
Chromogenic indicators
The composition of the CP ChromoSelect chromogenic mixture is a trade secret, described as
containing “enzyme substrates, inhibitors and different promoters to protect injured cells, to
improve recovery rate and to enhance growth.” Clostridium perfringens colonies grown
anaerobically on CP Chromoselect Agar for 24 hours at 44°C will be green in color, before
and/or after aerobic incubation at 44° for an additional hour.
Bromocresol Purple is a pH indicator molecule which is yellow below pH 5.2 and purple above
pH 6.8. It is used in m-CP agar to indicate sucrose fermentation by Clostridium perfringens,
which form yellow colonies.
Clostridium perfringens lacks an enzyme, ß-D-glucosidase, possessed by other Clostridia
species. Bacteria that do possess this enzyme can hydrolyze the colorless substrate indoxyl-ß-D-
glucoside, yielding indigo blue. Phenolphthalein is another pH indicator, being colorless below
pH 8.2, and dark pink or fuchsia above pH 10.0. Phenolphthalein biphosphate is incorporated
into m-CP agar to act as a substrate for the enzyme acid phosphatase, which is possessed by C.
perfringens, but not by certain other Clostridia species. When yellow presumptive C. perfringens
colonies are exposed to ammonium hydroxide fumes following overnight incubation, cell
colonies possessing the acid phosphatase enzyme will cleave the phosphate ions from
phenolphthalein, allowing that molecule to turn pink in the presence of the highly alkaline
ammonia fumes. This reaction confirms that those colonies which turned from yellow to pink are
C. perfringens. Colonies which remain yellow are other Clostridia species.
To summarize, Clostridium perfringens colonies grown on m-CP agar, and exposed to ammonia
fumes if yellow, have the following appearances due to the various combined color reactions:
Sucrose fermentation
+ Glucoside hydrolysis Acid phosphatase activity
C. perfringens positive = yellow + negative = still yellow positive = pink-red
Other
Clostridia positive = yellow + negative = still yellow negative = still yellow

72
Or positive = yellow + positive = blue/green Not done
Or negative = colorless + positive = purple Not done

73
REFERENCES
Abeyta, C., Michalovskis, A., & Wekell, M. (1985). Differentiation of Clostridium perfringens
from Related Clostridia in Iron Milk Medium. Journal of Food Protection, 48(2), 130–134.
Anon. (2004) The Microbiology of Drinking Water 2004 – Part 6 – Methods for the Isolation
and Enumeration of Sulphite- Reducing Clostridia and Clostridium perfringens by
membrane filtration. Methods for the Examination of Water and Associated Materials.
Nottingham: Standing Committee of Analysts, The Environment Agency. Available at:
http:// www.environment-agency.gov.uk/science/commercial/ 1075004/399393/401849
(accessed 9 February 2006).
Barrow, G.I. and Feltham, R.K.A. (ed.) (1993) Cowan and Steel’s Manual for the Identification
of Medical Bacteria, 3rd edn. Cambridge: Cambridge University Press.
Burger, J.S., Nupen, E.M., G. W. O. K. (1984). Evaluation of four growth media for membrane
filtration counting of Clostridium perfringens in water. Water SA, 10, 185–188.
Cabelli, V.J. (1978) Obligate anaerobic bacterial indicators. In Indicators of Viruses in Water
and Food (ed. G. Berg), pp. 171–200, Ann Arbor Science, Ann Arbor, MI.
Casteel MJ, Sobsey MD, Mueller JP. 2006. Fecal contamination of agricultural soils before and
after hurricane-associated flooding in North Carolina. J Environ Sci Health A Tox Hazard
Subst Environ Eng.. 41(2):173-84.
Cato, E.P., George, W.L. and Finegold, S.M. (1986) Genus Clostridium Prazmowski 1880. In
Bergey’s Manual of Sys- tematic Bacteriology, Vol. 2 eds Sneath, P.H.A., Mair, N.S., Sharpe,
M.E. and Holt, J.G. pp. 1141–1200. Baltimore, MD: Williams and Wilkins.
Hansent, M. V, & Elliott, L. P. (1980). New Presumptive Identification Test for Clostridium
perfringens : Reverse CAMP Test L _, 12(4), 617–619.
Hauschild, A. H. W., & Hilsheimer, R. (1974). Evaluation and Modifications of Media for
Enumeration of Clostridium perfringens Evaluation and Modifications of Media for
Enumeration of Clostridium perfringens, 27(1).
Klein, E. and Houston, A.C. (1899) Further report on bacteriological evidence of recent and
therefore dangerous sewage pollution of elsewise potable waters. In Supp. 28th Ann. Rept.
of the Local Government Board Containing the Report of the Medical Officer for 1898–
1899, London City Council, London.

74
Maheux, A. F., Bérubé, E., Boudreau, D. K., Villéger, R., Cantin, P., Boissinot, M., … Bergeron,
M. G. (2013). Abilities of the m-CP Agar method and CRENAME alpha toxin-specific real-
time PCR assay to detect Clostridium perfringens spores in drinking water. Applied and
Environmental Microbiology, 79(24), 7654–61. http://doi.org/10.1128/AEM.02791-13
Manafi, M., Waldherr, K., & Kundi, M. (2013). Evaluation of CP Chromo Select Agar for the
enumeration of Clostridium perfringens from water. International Journal of Food
Microbiology, 167(1), 92–5. http://doi.org/10.1016/j.ijfoodmicro.2013.06.012
McClane, B. A. (1996). An overview of Clostridium perfringens enterotoxin. Toxicon, 34(11-
12), 1335–1343. http://doi.org/10.1016/S0041-0101(96)00101-8
Mead, G. C. (1985). Selective and differential media for Clostridium perfringens. International
Journal of Food Microbiology, 2(1-2), 89–98. http://doi.org/10.1016/0168-1605(85)90061-
3
Mead, G. C., Páez de León, L., & Adams, B. W. (1981). A study of rapid and simplified
confirmatory tests for Clostridium perfringens. The Journal of Applied Bacteriology, 51(2),
355–61. Retrieved from http://www.ncbi.nlm.nih.gov/pubmed/6271721
Payment, P. (1999). Poor efficacy of residual chlorine disinfectant in drinking water to inactivate
waterborne.
Payment, P., & Franco, E. (1993). Clostridium perfringens and somatic coliphages as indicators
of the efficiency of drinking water treatment for viruses and protozoan cysts. Applied and
Environmental Microbiology, 59(8), 2418–24. Retrieved from
http://www.pubmedcentral.nih.gov/articlerender.fcgi?artid=182300&tool=pmcentrez&rend
ertype=abstract
Petit, L., Gibert, M., & Popoff, M. R. (1999). Clostridium perfringens: toxinotype and genotype.
Trends in Microbiology, 7(3), 104–110. http://doi.org/10.1016/S0966-842X(98)01430-9
Rimhanen-finne, R., Maunula, L., Bonsdorff, C. Von, Torvela, N., Heikinheimo, A., & Ha, M.
(2004). and Indicator Organisms in Surface Water in Southwestern, 70(1), 87–95.
http://doi.org/10.1128/AEM.70.1.87
RStudio Team (2015). RStudio: Integrated Development for R. RStudio, Inc., Boston, MA URL http://www.rstudio.com/
Ryzinska-Paier, G., Sommer, R., Haider, J. M., Knetsch, S., Frick, C., Kirschner, a K. T., &
Farnleitner, a H. (2011). Acid phosphatase test proves superior to standard phenotypic
identification procedure for Clostridium perfringens strains isolated from water. Journal of
Microbiological Methods, 87(2), 189–94. http://doi.org/10.1016/j.mimet.2011.08.006
Ryzinska-paier, G., Sommer, R., Haider, J. M., Knetsch, S., Frick, C., Kirschner, A. K. T., &
Farnleitner, A. H. (2011). Acid phosphatase test proves superior to standard phenotypic

75
identi fi cation procedure for Clostridium perfringens strains isolated from water. Journal of
Microbiological Methods, 87(2), 189–194. http://doi.org/10.1016/j.mimet.2011.08.006
Sartory, D. P. (1986). Membrane filtration enumeration of faecal clostridia and clostridium
perfringens in water. Water Research, 20(10), 1255–1260. http://doi.org/10.1016/0043-
1354(86)90155-7
Sartory, D. P., Field, M., Curbishley, S. M., & Pritchard, a M. (1998). Evaluation of two media
for the membrane filtration enumeration of Clostridium perfringens from water. Letters in
Applied Microbiology, 27(6), 323–7. Retrieved from
http://www.ncbi.nlm.nih.gov/pubmed/9871349
Sartory, D. P., Waldock, R., Davies, C. E., & Field, a M. (2006). Evaluation of acid phosphatase
as a confirmation test for Clostridium perfringens isolated from water. Letters in Applied
Microbiology, 42(4), 418–24. http://doi.org/10.1111/j.1472-765X.2006.01867.x
Savichtcheva, O., & Okabe, S. (2006). Alternative indicators of fecal pollution: relations with
pathogens and conventional indicators, current methodologies for direct pathogen
monitoring and future application perspectives. Water Research, 40(13), 2463–76.
http://doi.org/10.1016/j.watres.2006.04.040
Sorensen, D.L., Eberl, S.G. and Diksa, R.A. (1989) Clostridium perfringens as a point source
indicator in non-point-polluted streams. Wat. Res. 23, 191–197.
St. John, W., Matches, J. R., & Wekell, M. M. (1982). Use of Iron Milk Medium for
Enumeration of Clostridium perfringens. Journal of Association of Official Analytical
Chemists, 65(5), 1129–133.
StataCorp. 2015. Stata Statistical Software: Release 14. College Station, TX: StataCorp LP.
Ueno, K. (1970). Acid Phosphatase in Clostridium perfringens. Japanese Journal of
Microbiology, 14(2), 171–173.
Wohlsen, T., Bayliss, J., Gray, B., Bates, J., & Katouli, M. (2006). Evaluation of an alternative
method for the enumeration and confirmation of Clostridium perfringens from treated and
untreated sewages, 42, 438–444. http://doi.org/10.1111/j.1472-765X.2006.01912.x
Burger, J.S., Nupen, E.M., G. W. O. K. (1984). Evaluation of four growth media for membrane
filtration counting of Clostridium perfringens in water. Water SA, 10, 185–188.