Embed Size (px)
Citation preview
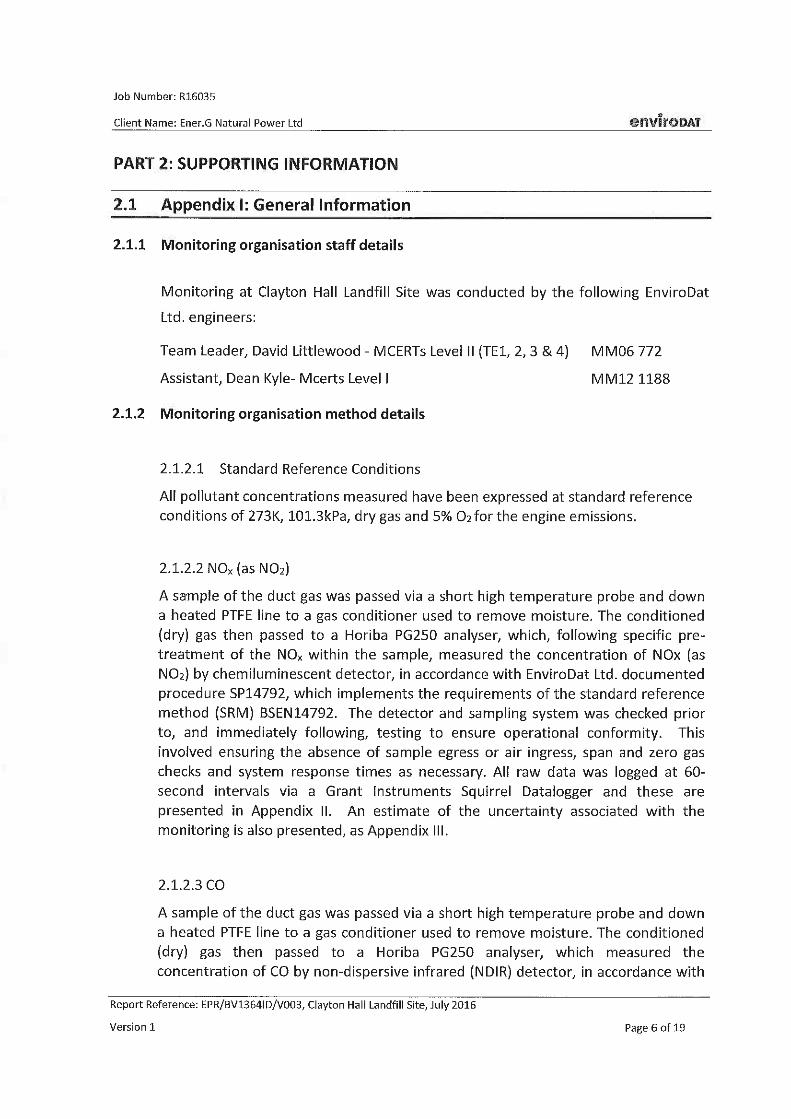
THE ARLEY CONSULTING COMPANY LIMITED
Chorleian House49-51 St Thomas’s Road
Chorley, Lancashire, PR7 1JE
Tel: 01257 278300Fax: 01257 268063Email: [email protected]
Report No 08469/152
January 2017
ANNUALENVIRONMENTAL MONITORING
&PERFORMANCE REVIEW
(2016)
for the
AREA REGULATED BYENVIRONMENTAL PERMIT No BV1364
atCLAYTON HALL LANDFILL SITE
CHORLEY, LANCASHIRE
Prepared for
QUERCIA LIMITEDAspinall House
Walker RoadWalker Office Park
GuideBlackburnBB1 2QE
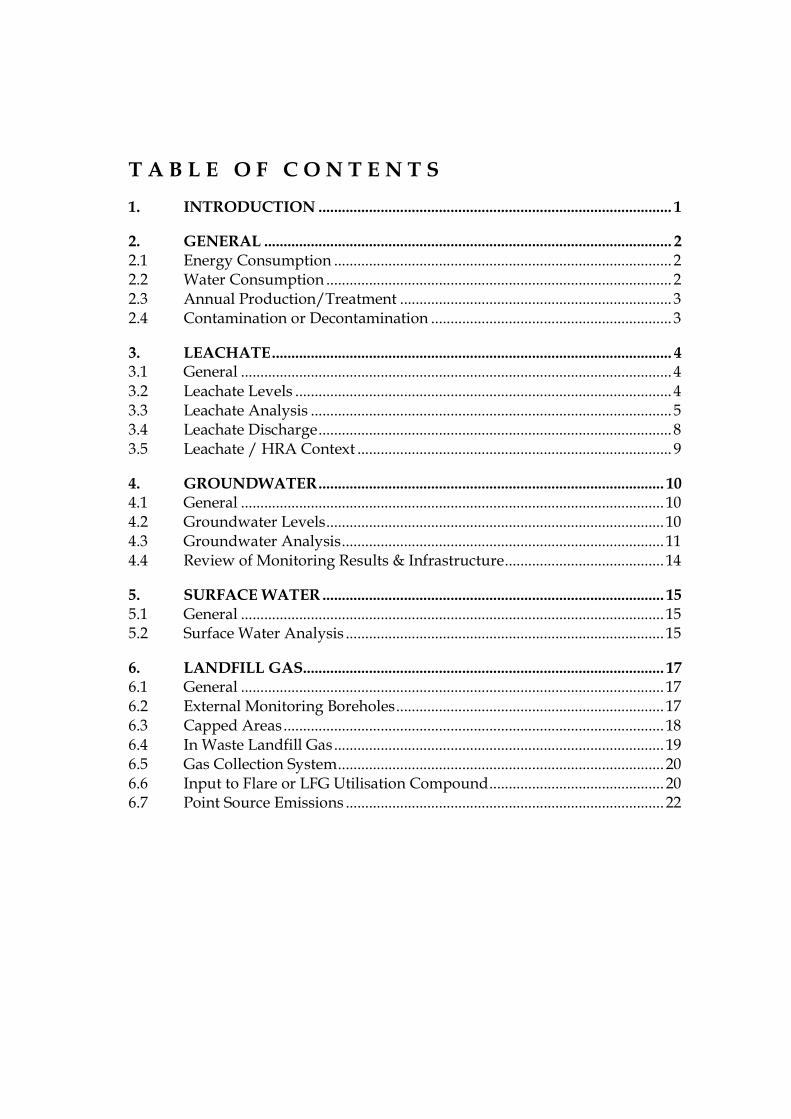
T A B L E O F C O N T E N T S
1. INTRODUCTION ........................................................................................... 1
2. GENERAL ......................................................................................................... 22.1 Energy Consumption ....................................................................................... 22.2 Water Consumption ......................................................................................... 22.3 Annual Production/Treatment ...................................................................... 32.4 Contamination or Decontamination .............................................................. 3
3. LEACHATE....................................................................................................... 43.1 General ............................................................................................................... 4
3.2 Leachate Levels ................................................................................................. 43.3 Leachate Analysis ............................................................................................. 53.4 Leachate Discharge........................................................................................... 83.5 Leachate / HRA Context ................................................................................. 9
4. GROUNDWATER......................................................................................... 104.1 General ............................................................................................................. 104.2 Groundwater Levels....................................................................................... 104.3 Groundwater Analysis................................................................................... 114.4 Review of Monitoring Results & Infrastructure......................................... 14
5. SURFACE WATER ........................................................................................ 155.1 General ............................................................................................................. 155.2 Surface Water Analysis .................................................................................. 15
6. LANDFILL GAS............................................................................................. 176.1 General ............................................................................................................. 176.2 External Monitoring Boreholes..................................................................... 176.3 Capped Areas.................................................................................................. 186.4 In Waste Landfill Gas..................................................................................... 196.5 Gas Collection System.................................................................................... 206.6 Input to Flare or LFG Utilisation Compound............................................. 206.7 Point Source Emissions .................................................................................. 22
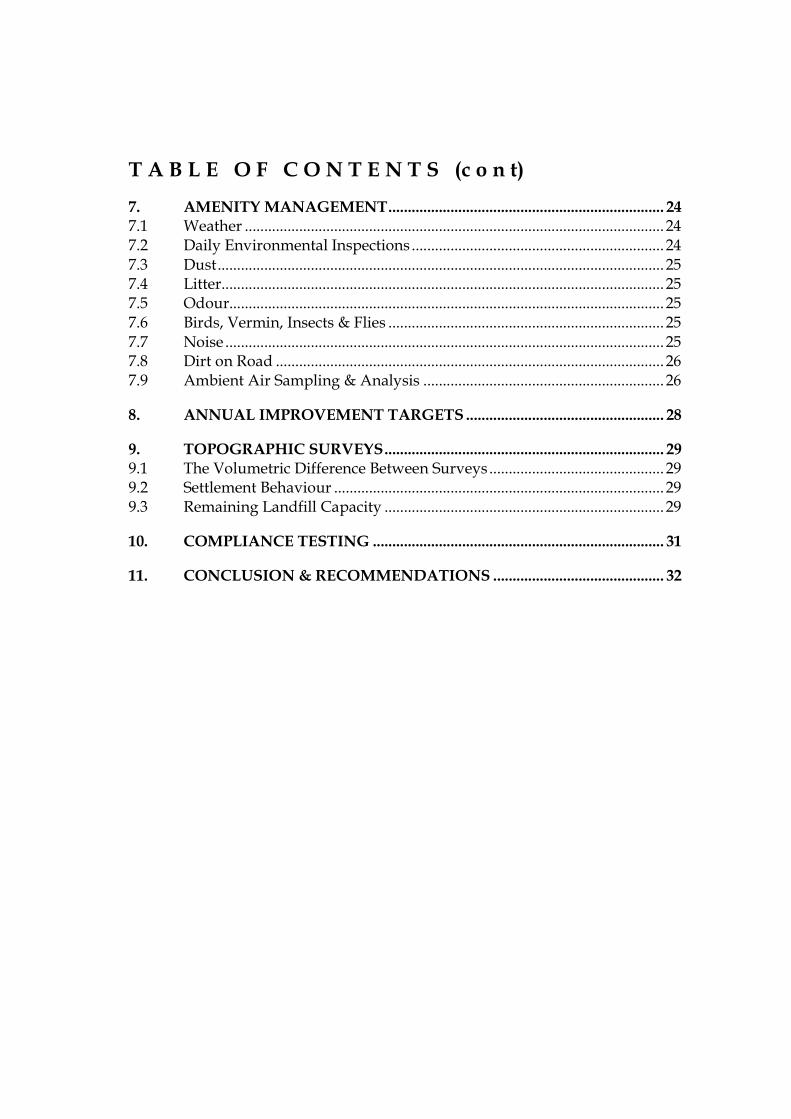
T A B L E O F C O N T E N T S (c o n t)
7. AMENITY MANAGEMENT....................................................................... 247.1 Weather ............................................................................................................ 247.2 Daily Environmental Inspections ................................................................. 24
7.3 Dust................................................................................................................... 257.4 Litter.................................................................................................................. 257.5 Odour................................................................................................................ 257.6 Birds, Vermin, Insects & Flies ....................................................................... 25
7.7 Noise ................................................................................................................. 257.8 Dirt on Road .................................................................................................... 267.9 Ambient Air Sampling & Analysis .............................................................. 26
8. ANNUAL IMPROVEMENT TARGETS ................................................... 28
9. TOPOGRAPHIC SURVEYS........................................................................ 299.1 The Volumetric Difference Between Surveys ............................................. 299.2 Settlement Behaviour ..................................................................................... 299.3 Remaining Landfill Capacity ........................................................................ 29
10. COMPLIANCE TESTING ........................................................................... 31
11. CONCLUSION & RECOMMENDATIONS ............................................ 32
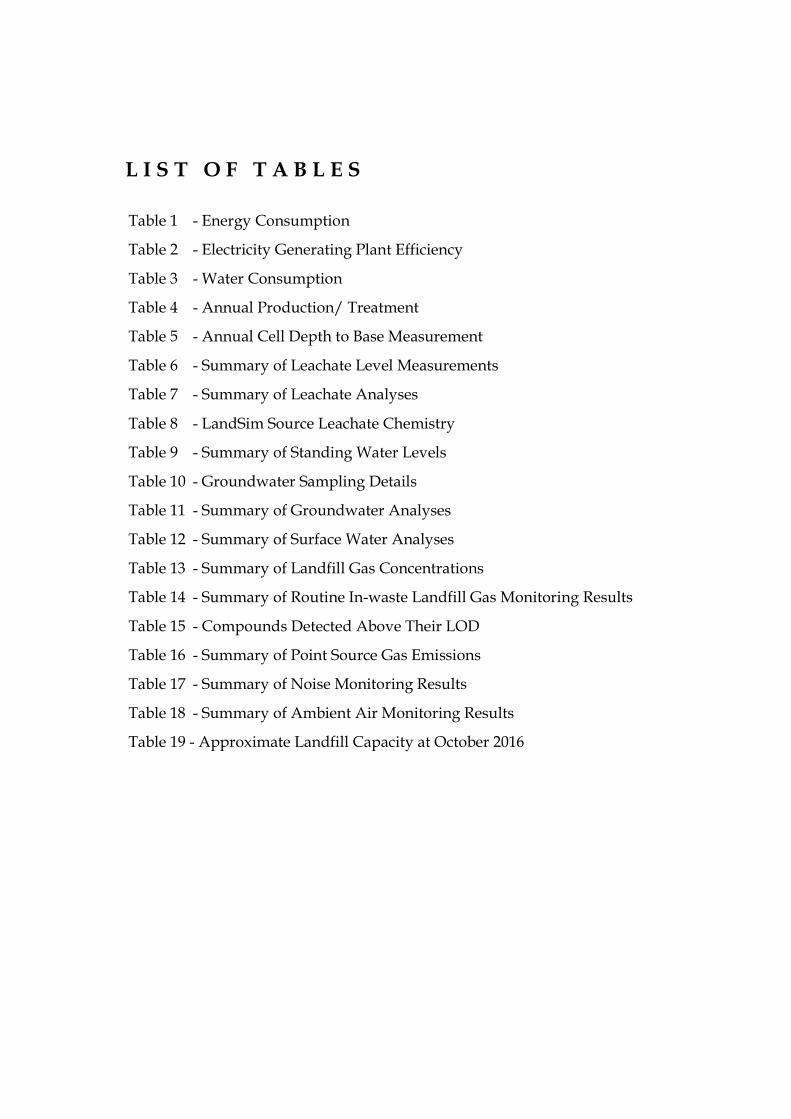
L I S T O F T A B L E S
Table 1 - Energy Consumption
Table 2 - Electricity Generating Plant Efficiency
Table 3 - Water Consumption
Table 4 - Annual Production/ Treatment
Table 5 - Annual Cell Depth to Base Measurement
Table 6 - Summary of Leachate Level Measurements
Table 7 - Summary of Leachate Analyses
Table 8 - LandSim Source Leachate Chemistry
Table 9 - Summary of Standing Water Levels
Table 10 - Groundwater Sampling Details
Table 11 - Summary of Groundwater Analyses
Table 12 - Summary of Surface Water Analyses
Table 13 - Summary of Landfill Gas Concentrations
Table 14 - Summary of Routine In-waste Landfill Gas Monitoring Results
Table 15 - Compounds Detected Above Their LOD
Table 16 - Summary of Point Source Gas Emissions
Table 17 - Summary of Noise Monitoring Results
Table 18 - Summary of Ambient Air Monitoring Results
Table 19 - Approximate Landfill Capacity at October 2016

L I S T O F A P P E N D I C E S
Appendix A - Energy Consumption
Appendix B - Cell 3C – Flux Box Test Results
Appendix C - Gas Monitoring & Balancing
Appendix D - Trace Gas Analysis
Appendix E - Point Source Emissions
Appendix F - Ambient Air Analyses
Appendix G - Objectives & Targets
Appendix H - Drawings
L I S T O F D R A W I N G S
Drawing No SSL:7561W:500 - Topographical Survey
Report No 08469/152 – January 2017Clayton Hall Landfill Site: Annual Performance Review (2016)
Page 1 The Arley Consulting Company Limited
1. INTRODUCTION
1.1 The Arley Consulting Company Limited (TACCL) has been commissioned byQuercia Limited to prepare the annual performance review report for ClaytonHall Landfill Site, Chorley, Lancashire which is regulated by EnvironmentalPermit No BV1364ID.
1.2 The report is required to comply with Condition No 4.2.2 of the permitvariation for the site (Environmental Permit No BV1364ID/V006) which cameinto effect from 13 February 2015. These conditions require that ‘a report orreports on the performance of the activities over the previous year shall besubmitted to the Agency by 31 January (or other date agreed in writing by theAgency) each year. The report(s) shall include … a review of the results ofthe monitoring and assessment carried out in accordance with this permitagainst relevant assumptions, parameters and results in the risk assessmentssubmitted in the application; ’
1.3 The routine environmental monitoring data is reported separately; refer tothe following reports submitted to the EA:
(i) TACCL Report No 08469/141, April 2016, Quarterly EnvironmentalMonitoring Report (January - March 2016) for the Area Regulated byEnvironmental Permit No BV1364
(ii) TACCL Report No 08469/143, August 2016, Quarterly EnvironmentalMonitoring Report (April - June 2016) for the Area Regulated byEnvironmental Permit No BV1364
(iii) TACCL Report No 08469/45, October 2016, Quarterly EnvironmentalMonitoring Report (July - September 2016) for the Area Regulated byEnvironmental Permit No BV1364
(iv) TACCL Report No 08469/150, January 2017, Quarterly EnvironmentalMonitoring Report (October - December 2016) for the Area Regulated byEnvironmental Permit No BV1364
1.4 The EA has agreed to an extension of the deadline for the submission of theannual performance review for 2016 until 10 February 2017.
Report No 08469/152 – January 2017Clayton Hall Landfill Site: Annual Performance Review (2016)
Page 2 The Arley Consulting Company Limited
2. GENERAL
2.1 Energy Consumption
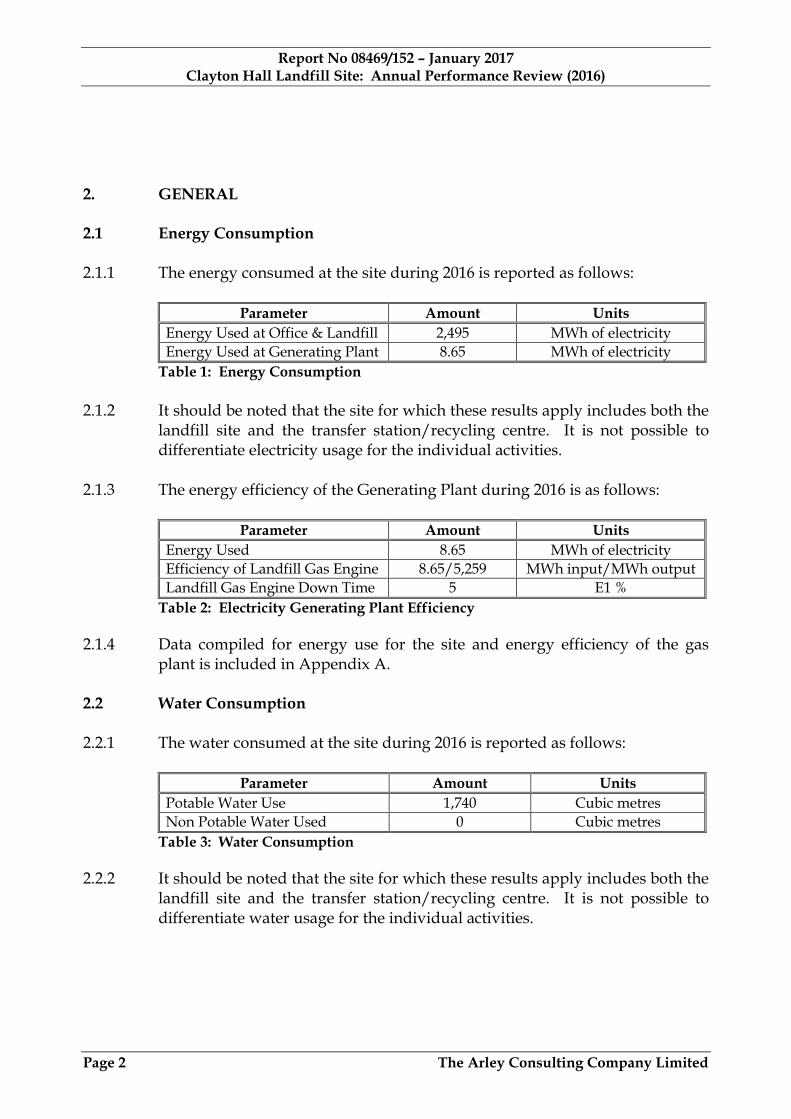
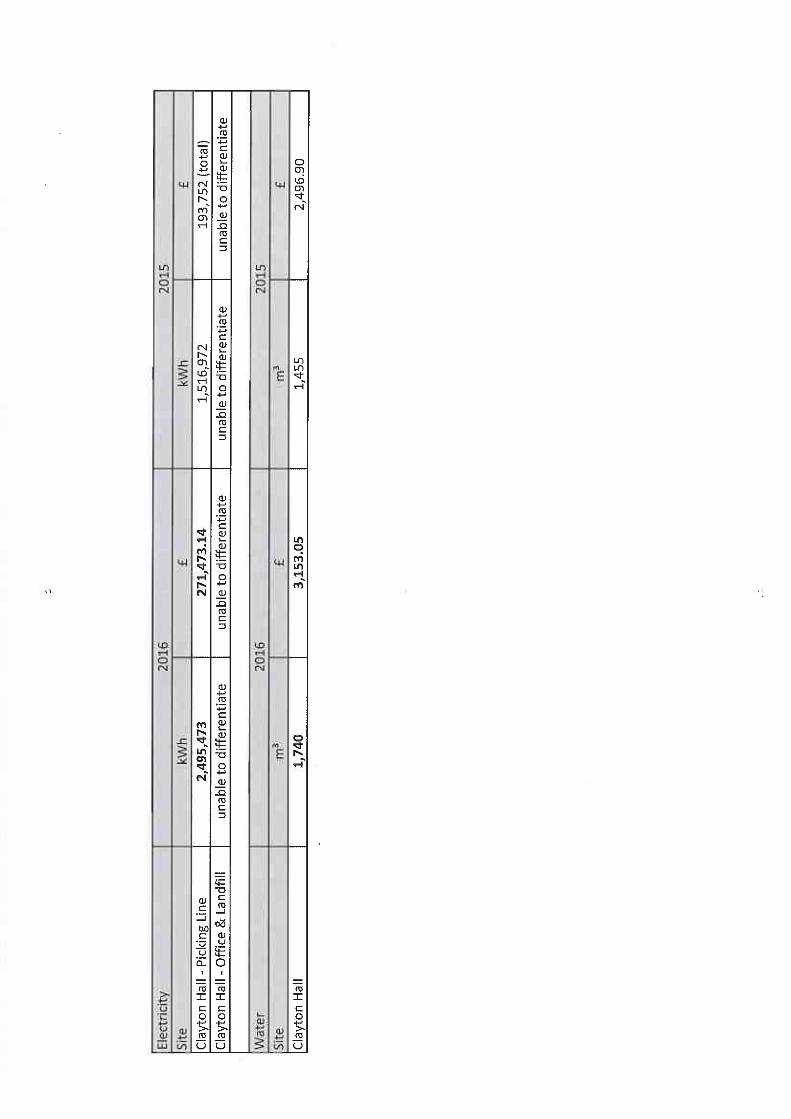
2.1.1 The energy consumed at the site during 2016 is reported as follows:
Parameter Amount Units
Energy Used at Office & Landfill 2,495 MWh of electricity
Energy Used at Generating Plant 8.65 MWh of electricity
Table 1: Energy Consumption
2.1.2 It should be noted that the site for which these results apply includes both thelandfill site and the transfer station/recycling centre. It is not possible todifferentiate electricity usage for the individual activities.
2.1.3 The energy efficiency of the Generating Plant during 2016 is as follows:
Parameter Amount Units
Energy Used 8.65 MWh of electricity
Efficiency of Landfill Gas Engine 8.65/5,259 MWh input/MWh output
Landfill Gas Engine Down Time 5 E1 %
Table 2: Electricity Generating Plant Efficiency
2.1.4 Data compiled for energy use for the site and energy efficiency of the gasplant is included in Appendix A.
2.2 Water Consumption
2.2.1 The water consumed at the site during 2016 is reported as follows:
Parameter Amount Units
Potable Water Use 1,740 Cubic metres
Non Potable Water Used 0 Cubic metres
Table 3: Water Consumption
2.2.2 It should be noted that the site for which these results apply includes both thelandfill site and the transfer station/recycling centre. It is not possible todifferentiate water usage for the individual activities.
Report No 08469/152 – January 2017Clayton Hall Landfill Site: Annual Performance Review (2016)
Page 3 The Arley Consulting Company Limited
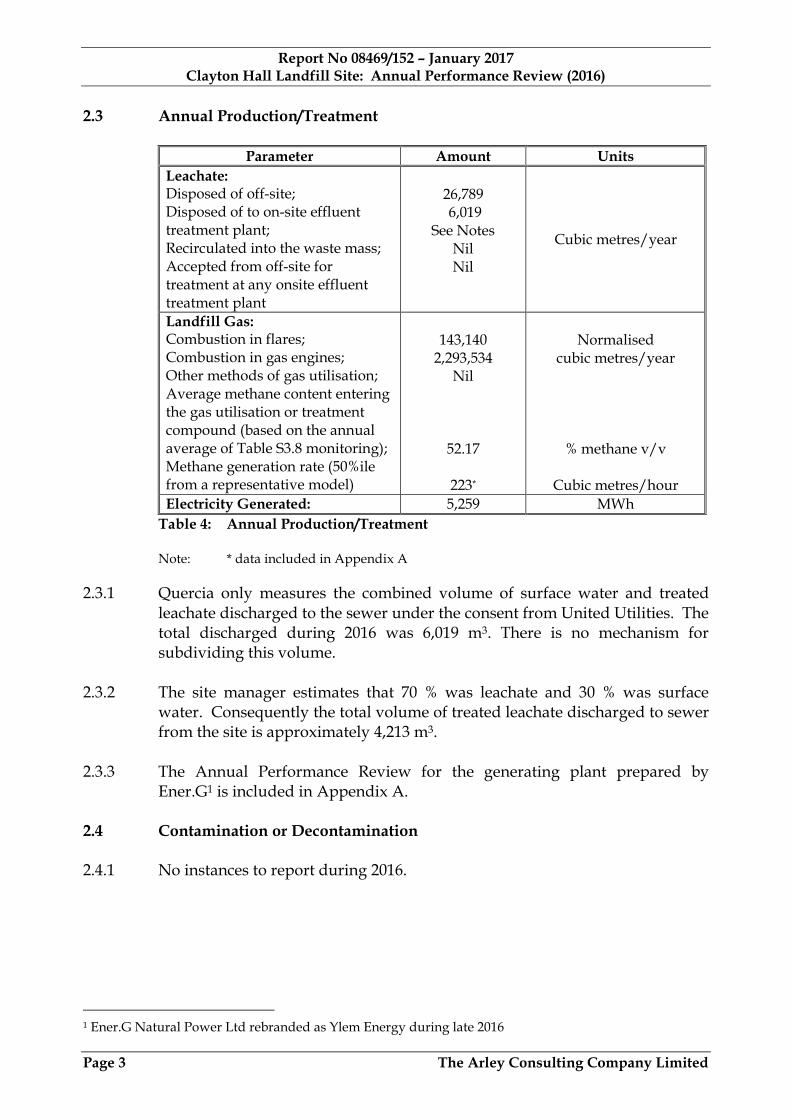
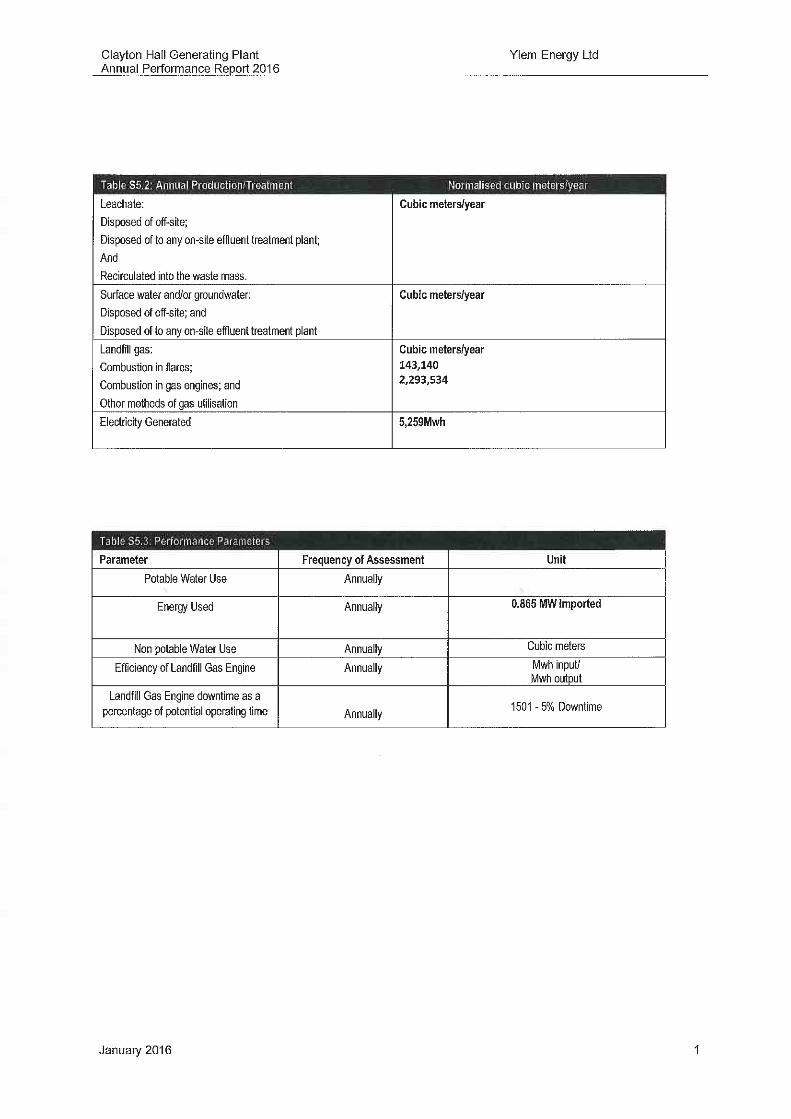
2.3 Annual Production/Treatment
Parameter Amount Units
Leachate:Disposed of off-site;Disposed of to on-site effluenttreatment plant;Recirculated into the waste mass;Accepted from off-site fortreatment at any onsite effluenttreatment plant
26,7896,019
See NotesNilNil
Cubic metres/year
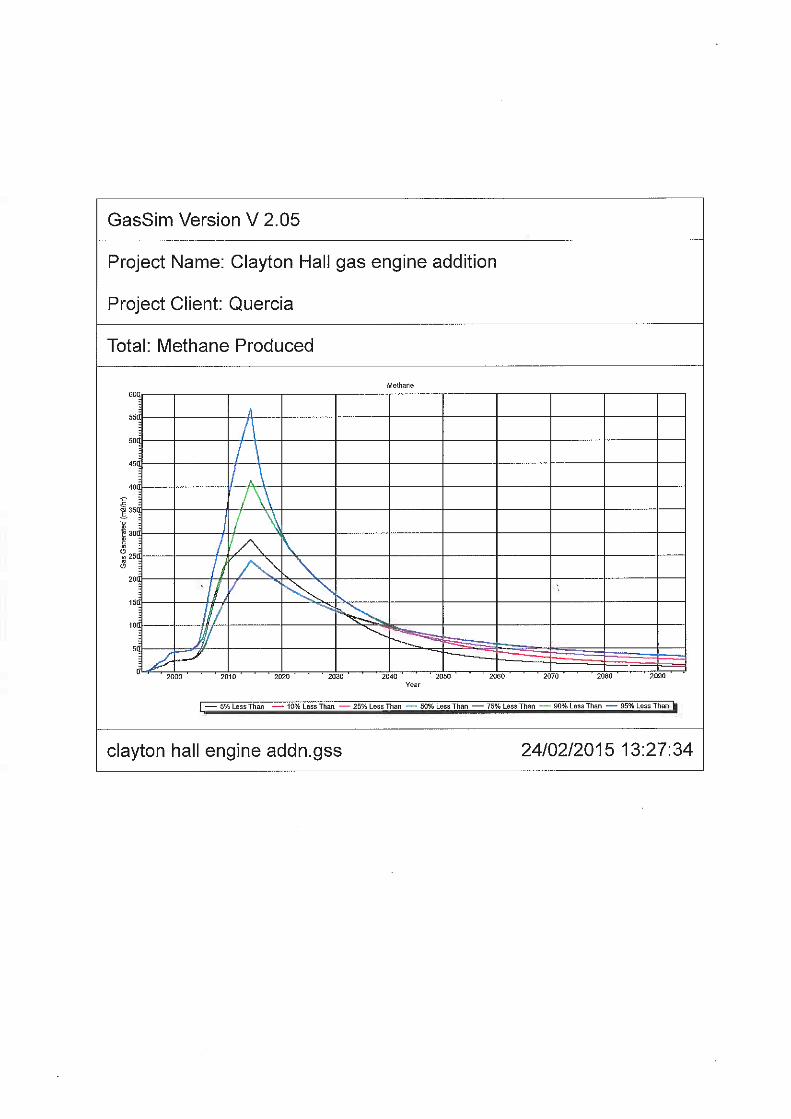
Landfill Gas:Combustion in flares;Combustion in gas engines;Other methods of gas utilisation;Average methane content enteringthe gas utilisation or treatmentcompound (based on the annualaverage of Table S3.8 monitoring);Methane generation rate (50%ilefrom a representative model)
143,1402,293,534
Nil
52.17
223*
Normalisedcubic metres/year
% methane v/v
Cubic metres/hour
Electricity Generated: 5,259 MWh
Table 4: Annual Production/Treatment
Note: * data included in Appendix A
2.3.1 Quercia only measures the combined volume of surface water and treatedleachate discharged to the sewer under the consent from United Utilities. Thetotal discharged during 2016 was 6,019 m3. There is no mechanism forsubdividing this volume.
2.3.2 The site manager estimates that 70 % was leachate and 30 % was surfacewater. Consequently the total volume of treated leachate discharged to sewerfrom the site is approximately 4,213 m3.
2.3.3 The Annual Performance Review for the generating plant prepared byEner.G1 is included in Appendix A.
2.4 Contamination or Decontamination
2.4.1 No instances to report during 2016.
1 Ener.G Natural Power Ltd rebranded as Ylem Energy during late 2016
Report No 08469/152 – January 2017Clayton Hall Landfill Site: Annual Performance Review (2016)
Page 4 The Arley Consulting Company Limited
3. LEACHATE
3.1 General
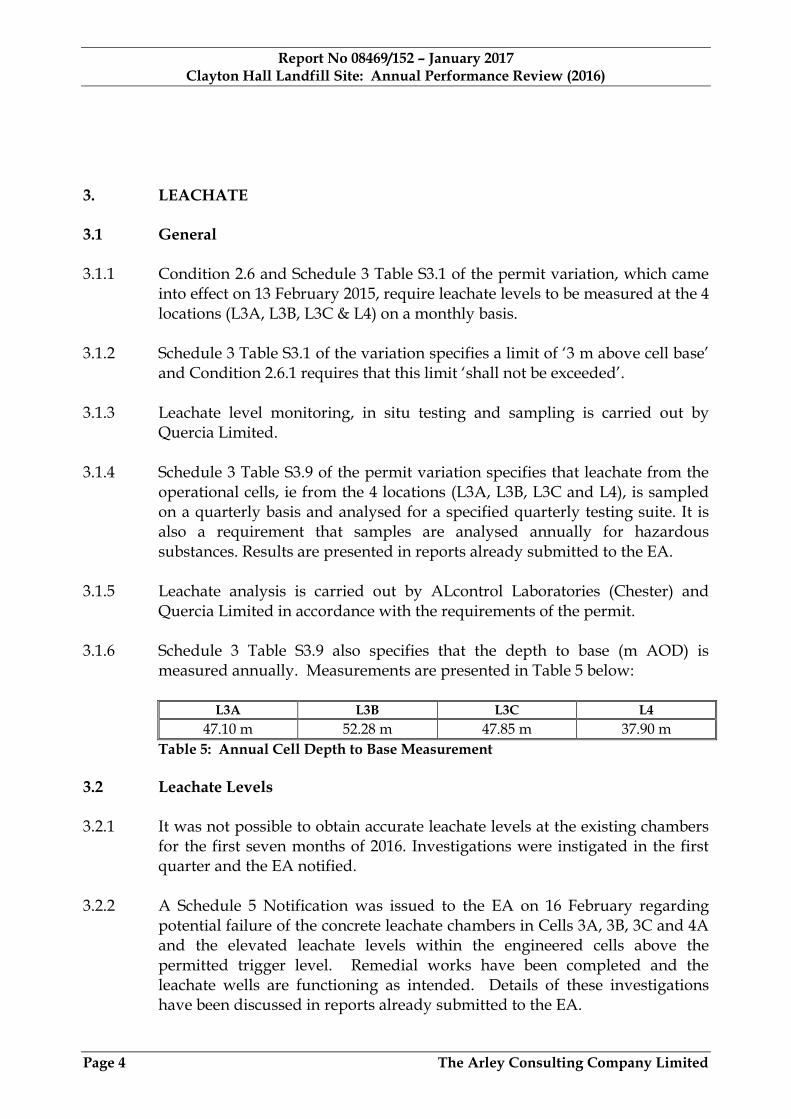
3.1.1 Condition 2.6 and Schedule 3 Table S3.1 of the permit variation, which cameinto effect on 13 February 2015, require leachate levels to be measured at the 4locations (L3A, L3B, L3C & L4) on a monthly basis.
3.1.2 Schedule 3 Table S3.1 of the variation specifies a limit of ‘3 m above cell base’and Condition 2.6.1 requires that this limit ‘shall not be exceeded’.
3.1.3 Leachate level monitoring, in situ testing and sampling is carried out byQuercia Limited.
3.1.4 Schedule 3 Table S3.9 of the permit variation specifies that leachate from theoperational cells, ie from the 4 locations (L3A, L3B, L3C and L4), is sampledon a quarterly basis and analysed for a specified quarterly testing suite. It isalso a requirement that samples are analysed annually for hazardoussubstances. Results are presented in reports already submitted to the EA.
3.1.5 Leachate analysis is carried out by ALcontrol Laboratories (Chester) andQuercia Limited in accordance with the requirements of the permit.
3.1.6 Schedule 3 Table S3.9 also specifies that the depth to base (m AOD) ismeasured annually. Measurements are presented in Table 5 below:
L3A L3B L3C L4
47.10 m 52.28 m 47.85 m 37.90 m
Table 5: Annual Cell Depth to Base Measurement
3.2 Leachate Levels
3.2.1 It was not possible to obtain accurate leachate levels at the existing chambersfor the first seven months of 2016. Investigations were instigated in the firstquarter and the EA notified.
3.2.2 A Schedule 5 Notification was issued to the EA on 16 February regardingpotential failure of the concrete leachate chambers in Cells 3A, 3B, 3C and 4Aand the elevated leachate levels within the engineered cells above thepermitted trigger level. Remedial works have been completed and theleachate wells are functioning as intended. Details of these investigationshave been discussed in reports already submitted to the EA.
Report No 08469/152 – January 2017Clayton Hall Landfill Site: Annual Performance Review (2016)
Page 5 The Arley Consulting Company Limited
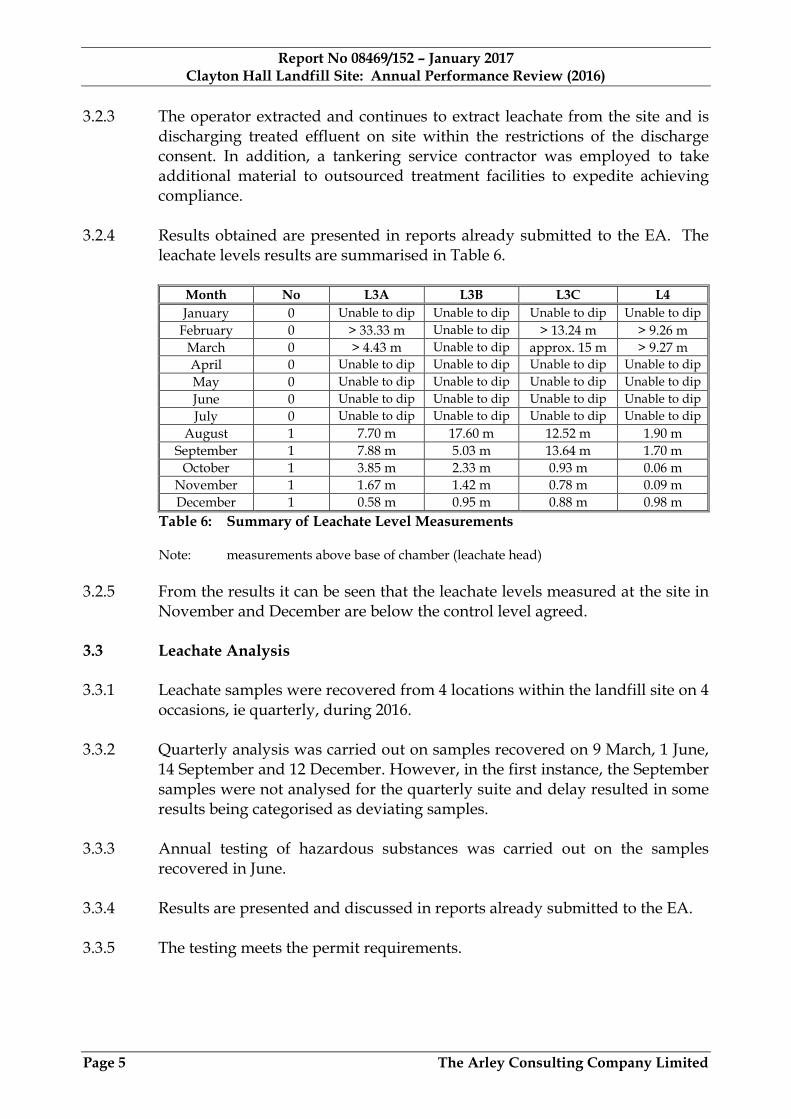
3.2.3 The operator extracted and continues to extract leachate from the site and isdischarging treated effluent on site within the restrictions of the dischargeconsent. In addition, a tankering service contractor was employed to takeadditional material to outsourced treatment facilities to expedite achievingcompliance.
3.2.4 Results obtained are presented in reports already submitted to the EA. Theleachate levels results are summarised in Table 6.
Month No L3A L3B L3C L4
January 0 Unable to dip Unable to dip Unable to dip Unable to dip
February 0 > 33.33 m Unable to dip > 13.24 m > 9.26 m
March 0 > 4.43 m Unable to dip approx. 15 m > 9.27 m
April 0 Unable to dip Unable to dip Unable to dip Unable to dip
May 0 Unable to dip Unable to dip Unable to dip Unable to dip
June 0 Unable to dip Unable to dip Unable to dip Unable to dip
July 0 Unable to dip Unable to dip Unable to dip Unable to dip
August 1 7.70 m 17.60 m 12.52 m 1.90 m
September 1 7.88 m 5.03 m 13.64 m 1.70 m
October 1 3.85 m 2.33 m 0.93 m 0.06 m
November 1 1.67 m 1.42 m 0.78 m 0.09 m
December 1 0.58 m 0.95 m 0.88 m 0.98 m
Table 6: Summary of Leachate Level Measurements
Note: measurements above base of chamber (leachate head)
3.2.5 From the results it can be seen that the leachate levels measured at the site inNovember and December are below the control level agreed.
3.3 Leachate Analysis
3.3.1 Leachate samples were recovered from 4 locations within the landfill site on 4occasions, ie quarterly, during 2016.
3.3.2 Quarterly analysis was carried out on samples recovered on 9 March, 1 June,14 September and 12 December. However, in the first instance, the Septembersamples were not analysed for the quarterly suite and delay resulted in someresults being categorised as deviating samples.
3.3.3 Annual testing of hazardous substances was carried out on the samplesrecovered in June.
3.3.4 Results are presented and discussed in reports already submitted to the EA.
3.3.5 The testing meets the permit requirements.
Report No 08469/152 – January 2017Clayton Hall Landfill Site: Annual Performance Review (2016)
Page 6 The Arley Consulting Company Limited
3.3.6 Although not a requirement of the permit variation, leachate temperature hasbeen measured using a Carey Scientific Limited portable probe, thecalibration certificate for which is held on site. Measurements were made on12 occasions (monthly) during 2016. Temperature measurements arepresented in reports already submitted to the EA.
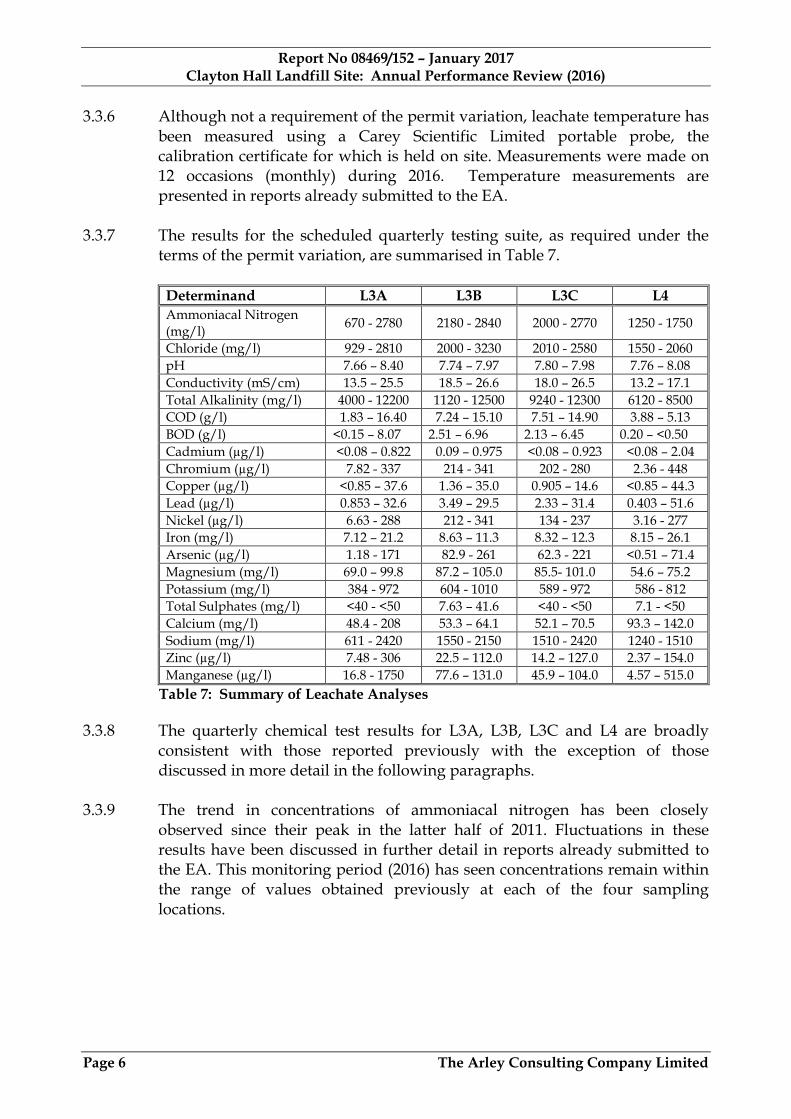
3.3.7 The results for the scheduled quarterly testing suite, as required under theterms of the permit variation, are summarised in Table 7.
Determinand L3A L3B L3C L4
Ammoniacal Nitrogen
(mg/l)670 - 2780 2180 - 2840 2000 - 2770 1250 - 1750
Chloride (mg/l) 929 - 2810 2000 - 3230 2010 - 2580 1550 - 2060
pH 7.66 – 8.40 7.74 – 7.97 7.80 – 7.98 7.76 – 8.08
Conductivity (mS/cm) 13.5 – 25.5 18.5 – 26.6 18.0 – 26.5 13.2 – 17.1
Total Alkalinity (mg/l) 4000 - 12200 1120 - 12500 9240 - 12300 6120 - 8500
COD (g/l) 1.83 – 16.40 7.24 – 15.10 7.51 – 14.90 3.88 – 5.13
BOD (g/l) <0.15 – 8.07 2.51 – 6.96 2.13 – 6.45 0.20 – <0.50
Cadmium (µg/l) <0.08 – 0.822 0.09 – 0.975 <0.08 – 0.923 <0.08 – 2.04
Chromium (µg/l) 7.82 - 337 214 - 341 202 - 280 2.36 - 448
Copper (µg/l) <0.85 – 37.6 1.36 – 35.0 0.905 – 14.6 <0.85 – 44.3
Lead (µg/l) 0.853 – 32.6 3.49 – 29.5 2.33 – 31.4 0.403 – 51.6
Nickel (µg/l) 6.63 - 288 212 - 341 134 - 237 3.16 - 277
Iron (mg/l) 7.12 – 21.2 8.63 – 11.3 8.32 – 12.3 8.15 – 26.1
Arsenic (µg/l) 1.18 - 171 82.9 - 261 62.3 - 221 <0.51 – 71.4
Magnesium (mg/l) 69.0 – 99.8 87.2 – 105.0 85.5- 101.0 54.6 – 75.2
Potassium (mg/l) 384 - 972 604 - 1010 589 - 972 586 - 812
Total Sulphates (mg/l) <40 - <50 7.63 – 41.6 <40 - <50 7.1 - <50
Calcium (mg/l) 48.4 - 208 53.3 – 64.1 52.1 – 70.5 93.3 – 142.0
Sodium (mg/l) 611 - 2420 1550 - 2150 1510 - 2420 1240 - 1510
Zinc (µg/l) 7.48 - 306 22.5 – 112.0 14.2 – 127.0 2.37 – 154.0
Manganese (µg/l) 16.8 - 1750 77.6 – 131.0 45.9 – 104.0 4.57 – 515.0
Table 7: Summary of Leachate Analyses
3.3.8 The quarterly chemical test results for L3A, L3B, L3C and L4 are broadlyconsistent with those reported previously with the exception of thosediscussed in more detail in the following paragraphs.
3.3.9 The trend in concentrations of ammoniacal nitrogen has been closelyobserved since their peak in the latter half of 2011. Fluctuations in theseresults have been discussed in further detail in reports already submitted tothe EA. This monitoring period (2016) has seen concentrations remain withinthe range of values obtained previously at each of the four samplinglocations.
Report No 08469/152 – January 2017Clayton Hall Landfill Site: Annual Performance Review (2016)
Page 7 The Arley Consulting Company Limited
3.3.10 Dissolved cadmium was measured at concentrations of 2.04, 0.83, <LOD, and0.317 µg/l in the samples retrieved from L4 at the quarterly monitoring visitsin 2016. The concentration of 2.04 µg/l measured in March is higher than theprevious maximum of 1.33 µg/l obtained in May 2015 where previously thisdeterminand has been measured below 1µg/l at this location.
3.3.11 Dissolved iron was measured at a marginally higher concentration thanpreviously recorded at L4 in December.
3.3.12 These results are discussed in the quarterly monitoring reports alreadysubmitted to the EA.
3.3.13 Annual testing of hazardous substances was carried out on the samplesrecovered in June. Results, summarised in the following paragraphs, arepresented in Report No 08469/143 which has already been submitted to theEA.
3.3.14 In general, the results for the testing of leachate for List 1 and List 2substances are below their limits of detection. Additional comments arepresented in the following paragraphs.
3.3.15 Dissolved mercury was measured below the LOD at all four locations L3A,L3B, L3C and L4.
3.3.16 Concentrations of total detected monohydric phenols were measured at 6.4,9.65, 8.98 and 0.59 mg/l at L3A, L3B, L3C and L4, respectively.
3.3.17 Concentrations of total cyanide were 0.076, 0.088, 0.088, and 0.094 mg/l atL3A, L3B, L3C and L4, respectively. Free cyanide was measured below theLOD in samples from all four locations.
3.3.18 TPH concentrations were measured at 43.6, 53.5, 50.0 and 25.1 mg/l at L3A,L3B, L3C and L4, respectively. Similar concentrations (65.6, 61.9, 67.3, 22.1mg/l, respectively) were obtained for this determinand in samples taken inMarch.
3.3.19 All organotins were measured below their LOD apart from dibutyl tin at allfour locations L3A, L3B, L3C and L4.
3.3.20 All pesticides were measured below their LOD.
Report No 08469/152 – January 2017Clayton Hall Landfill Site: Annual Performance Review (2016)
Page 8 The Arley Consulting Company Limited
3.3.21 A number of semi volatile organic compounds were identified above theirLOD at one or more of sampling locations L3A, L3B, L3C and L4. Theseinclude:
benzene acetic acid benzene carboxylic acidbenzene propanoic acid ethyl hexanoic acidtrimethyl hexanoic acid butyl benzene sulfonamidebis-methylethylidene phenol benzothiazolonemethylethyl phenol tert-butyl phenoltri-isopropyl phosphatedi-tert-butylhydroxyphenyl propionic acid
3.3.22 A number of phenols in the semi volatile organic suite were measured abovethe LOD in one or more samples from L3A, L3B, L3C and L4: 2-methylphenol, 4-methylphenol, 2-chlorophenol and phenol.
3.3.23 All phthalates were measured below the limit of detection apart from bis (2-ethylhexyl) phthalate at L3A, L3B & L3C.
3.3.24 Volatile organic compounds measured above the LOD in one or more of theleachate samples include:
benzene toluenechlorobenzene ethylbenzeneo,m,p–xylenes isopropyl benzene1,2,4-trimethyl benzene 4-isopropyl toluene1,3,5-trimethyl benzene naphthalene
3.3.25 These compounds are typical of landfill leachate from mixed non hazardouswastes.
3.4 Leachate Discharge
3.4.1 There is no specific permit requirement and no sampling or analysis has beenundertaken by the operator during 2016.
3.4.2 Leachate discharge is monitored monthly by United Utilities who have raisedno concerns regarding its chemical composition.
Report No 08469/152 – January 2017Clayton Hall Landfill Site: Annual Performance Review (2016)
Page 9 The Arley Consulting Company Limited
3.5 Leachate / HRA Context
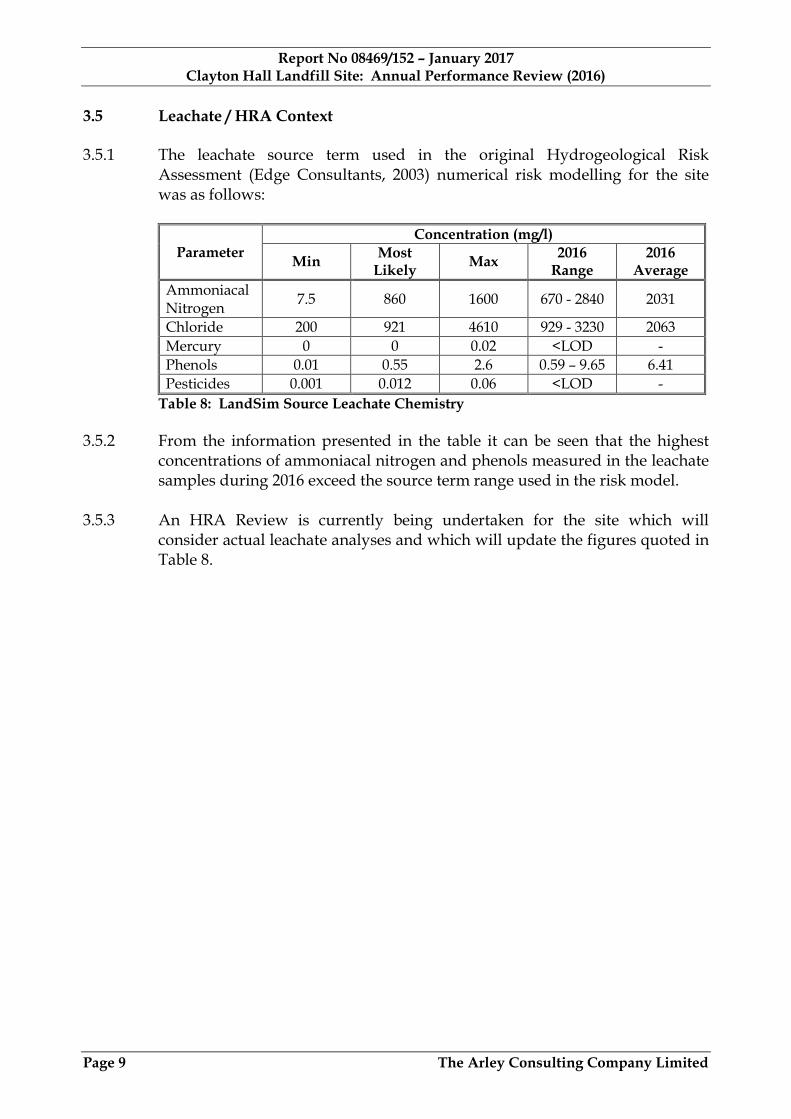
3.5.1 The leachate source term used in the original Hydrogeological RiskAssessment (Edge Consultants, 2003) numerical risk modelling for the sitewas as follows:
ParameterConcentration (mg/l)
MinMost
LikelyMax
2016Range
2016Average
AmmoniacalNitrogen
7.5 860 1600 670 - 2840 2031
Chloride 200 921 4610 929 - 3230 2063
Mercury 0 0 0.02 <LOD -
Phenols 0.01 0.55 2.6 0.59 – 9.65 6.41
Pesticides 0.001 0.012 0.06 <LOD -
Table 8: LandSim Source Leachate Chemistry
3.5.2 From the information presented in the table it can be seen that the highestconcentrations of ammoniacal nitrogen and phenols measured in the leachatesamples during 2016 exceed the source term range used in the risk model.
3.5.3 An HRA Review is currently being undertaken for the site which willconsider actual leachate analyses and which will update the figures quoted inTable 8.
Report No 08469/152 – January 2017Clayton Hall Landfill Site: Annual Performance Review (2016)
Page 10 The Arley Consulting Company Limited
4. GROUNDWATER
4.1 General
4.1.1 Groundwater monitoring requirements are set out in Schedule 3 Tables S3.4and S3.7 of the EP variation and consolidation documentEPR/BV13641D/V006, dated 13/02/2015.
4.1.2 The permit variation requires groundwater levels to be measured quarterly at9 locations: Borehole Nos 102, 103A, 106S, 106A, BH3, 111, 113, 118A & 124.Borehole locations are illustrated on Drawing No 08469/15B which isincluded in Appendix K of reports already submitted to the EA.
4.1.3 Similarly, groundwater samples are required to be collected on a monthlybasis at 5 of these locations: Borehole Nos BH3, 111, 113, 118A & 124, and on aquarterly basis from the remaining 4 locations: Borehole Nos 102, 103A, 106S& 106D.
4.1.4 Groundwater level monitoring, in situ testing and sampling is carried out byQuercia Limited. Groundwater samples were collected on the followingdates:
Quarter 1 Quarter 2 Quarter 3 Quarter 421 January 12 April 12 July 10 October16 February 13 May 19 August 14 November9 March 1 & 13 June 14 September 12 December
4.1.5 Groundwater analysis is carried out by ALcontrol Laboratories (Chester) inaccordance with the requirements of the environmental permit.
4.2 Groundwater Levels
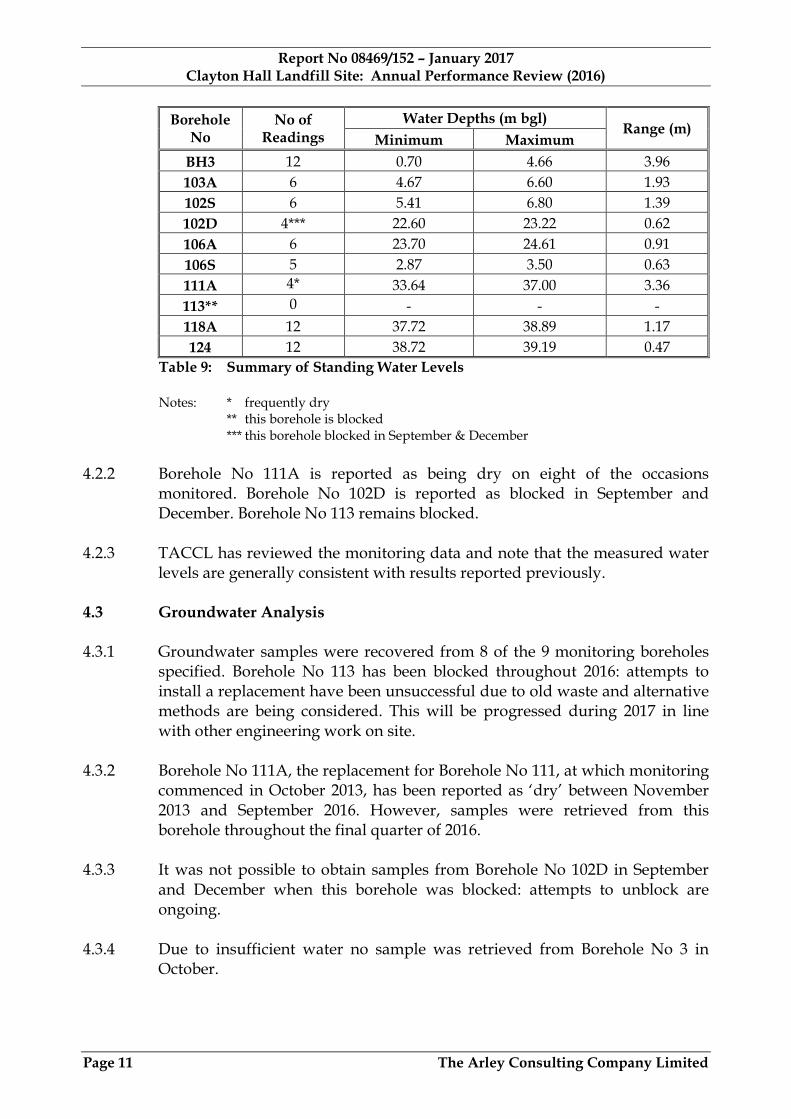
4.2.1 Groundwater levels have been measured on a number of occasions at thegroundwater monitoring boreholes during 2016. The results are presented inreports already submitted to the EA. The results for 2016 are alsosummarised in Table 9.
Report No 08469/152 – January 2017Clayton Hall Landfill Site: Annual Performance Review (2016)
Page 11 The Arley Consulting Company Limited
BoreholeNo
No ofReadings
Water Depths (m bgl)Range (m)
Minimum Maximum
BH3 12 0.70 4.66 3.96
103A 6 4.67 6.60 1.93
102S 6 5.41 6.80 1.39
102D 4*** 22.60 23.22 0.62
106A 6 23.70 24.61 0.91
106S 5 2.87 3.50 0.63
111A 4* 33.64 37.00 3.36
113** 0 - - -
118A 12 37.72 38.89 1.17
124 12 38.72 39.19 0.47
Table 9: Summary of Standing Water Levels
Notes: * frequently dry** this borehole is blocked
*** this borehole blocked in September & December
4.2.2 Borehole No 111A is reported as being dry on eight of the occasionsmonitored. Borehole No 102D is reported as blocked in September andDecember. Borehole No 113 remains blocked.
4.2.3 TACCL has reviewed the monitoring data and note that the measured waterlevels are generally consistent with results reported previously.
4.3 Groundwater Analysis
4.3.1 Groundwater samples were recovered from 8 of the 9 monitoring boreholesspecified. Borehole No 113 has been blocked throughout 2016: attempts toinstall a replacement have been unsuccessful due to old waste and alternativemethods are being considered. This will be progressed during 2017 in linewith other engineering work on site.
4.3.2 Borehole No 111A, the replacement for Borehole No 111, at which monitoringcommenced in October 2013, has been reported as ‘dry’ between November2013 and September 2016. However, samples were retrieved from thisborehole throughout the final quarter of 2016.
4.3.3 It was not possible to obtain samples from Borehole No 102D in Septemberand December when this borehole was blocked: attempts to unblock areongoing.
4.3.4 Due to insufficient water no sample was retrieved from Borehole No 3 inOctober.
Report No 08469/152 – January 2017Clayton Hall Landfill Site: Annual Performance Review (2016)
Page 12 The Arley Consulting Company Limited
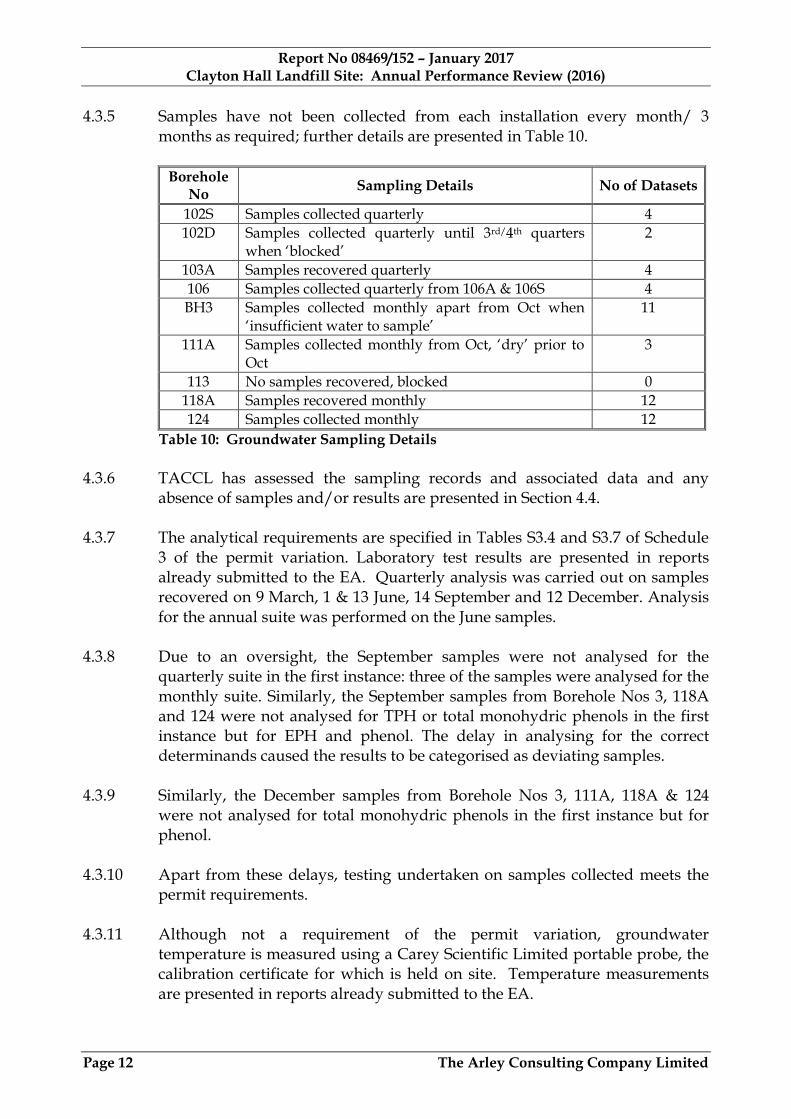
4.3.5 Samples have not been collected from each installation every month/ 3months as required; further details are presented in Table 10.
BoreholeNo
Sampling Details No of Datasets
102S Samples collected quarterly 4
102D Samples collected quarterly until 3rd/4th quarterswhen ‘blocked’
2
103A Samples recovered quarterly 4
106 Samples collected quarterly from 106A & 106S 4
BH3 Samples collected monthly apart from Oct when‘insufficient water to sample’
11
111A Samples collected monthly from Oct, ‘dry’ prior toOct
3
113 No samples recovered, blocked 0
118A Samples recovered monthly 12
124 Samples collected monthly 12
Table 10: Groundwater Sampling Details
4.3.6 TACCL has assessed the sampling records and associated data and anyabsence of samples and/or results are presented in Section 4.4.
4.3.7 The analytical requirements are specified in Tables S3.4 and S3.7 of Schedule3 of the permit variation. Laboratory test results are presented in reportsalready submitted to the EA. Quarterly analysis was carried out on samplesrecovered on 9 March, 1 & 13 June, 14 September and 12 December. Analysisfor the annual suite was performed on the June samples.
4.3.8 Due to an oversight, the September samples were not analysed for thequarterly suite in the first instance: three of the samples were analysed for themonthly suite. Similarly, the September samples from Borehole Nos 3, 118Aand 124 were not analysed for TPH or total monohydric phenols in the firstinstance but for EPH and phenol. The delay in analysing for the correctdeterminands caused the results to be categorised as deviating samples.
4.3.9 Similarly, the December samples from Borehole Nos 3, 111A, 118A & 124were not analysed for total monohydric phenols in the first instance but forphenol.
4.3.10 Apart from these delays, testing undertaken on samples collected meets thepermit requirements.
4.3.11 Although not a requirement of the permit variation, groundwatertemperature is measured using a Carey Scientific Limited portable probe, thecalibration certificate for which is held on site. Temperature measurementsare presented in reports already submitted to the EA.
Report No 08469/152 – January 2017Clayton Hall Landfill Site: Annual Performance Review (2016)
Page 13 The Arley Consulting Company Limited
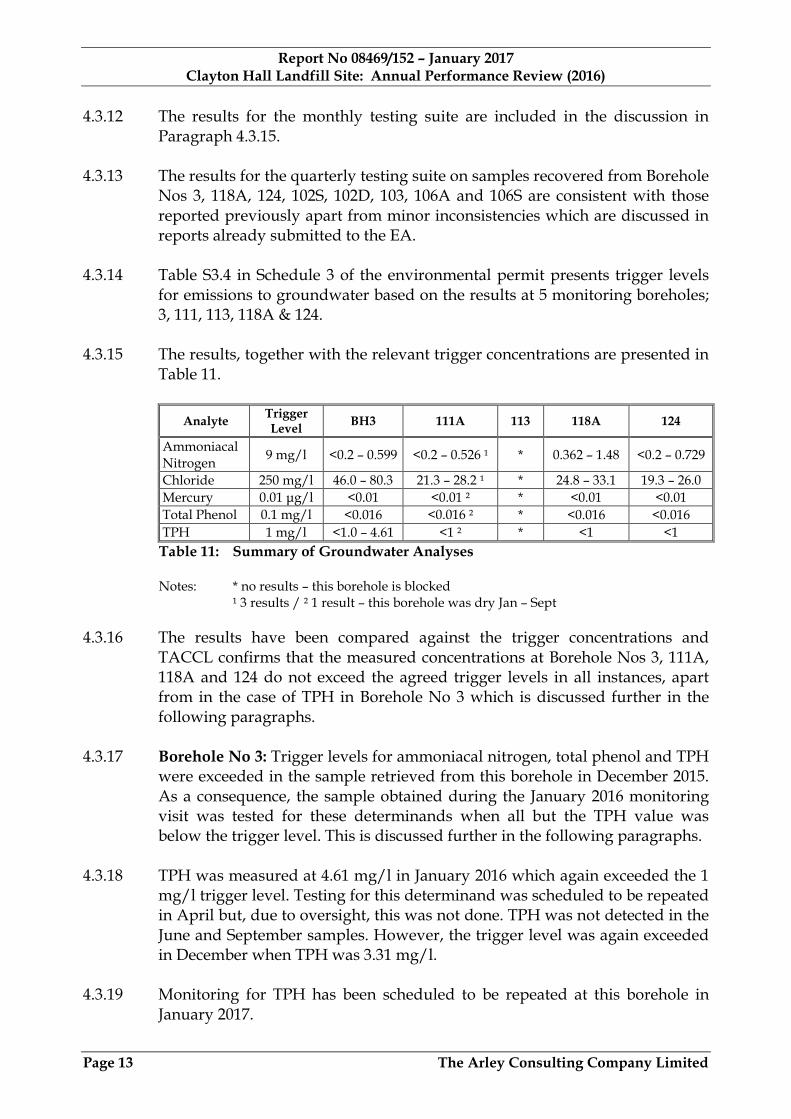
4.3.12 The results for the monthly testing suite are included in the discussion inParagraph 4.3.15.
4.3.13 The results for the quarterly testing suite on samples recovered from BoreholeNos 3, 118A, 124, 102S, 102D, 103, 106A and 106S are consistent with thosereported previously apart from minor inconsistencies which are discussed inreports already submitted to the EA.
4.3.14 Table S3.4 in Schedule 3 of the environmental permit presents trigger levelsfor emissions to groundwater based on the results at 5 monitoring boreholes;3, 111, 113, 118A & 124.
4.3.15 The results, together with the relevant trigger concentrations are presented inTable 11.
AnalyteTriggerLevel
BH3 111A 113 118A 124
Ammoniacal
Nitrogen9 mg/l <0.2 – 0.599 <0.2 – 0.526 ¹ * 0.362 – 1.48 <0.2 – 0.729
Chloride 250 mg/l 46.0 – 80.3 21.3 – 28.2 ¹ * 24.8 – 33.1 19.3 – 26.0
Mercury 0.01 μg/l <0.01 <0.01 ² * <0.01 <0.01
Total Phenol 0.1 mg/l <0.016 <0.016 ² * <0.016 <0.016
TPH 1 mg/l <1.0 – 4.61 <1 ² * <1 <1
Table 11: Summary of Groundwater Analyses
Notes: * no results – this borehole is blocked¹ 3 results / ² 1 result – this borehole was dry Jan – Sept
4.3.16 The results have been compared against the trigger concentrations andTACCL confirms that the measured concentrations at Borehole Nos 3, 111A,118A and 124 do not exceed the agreed trigger levels in all instances, apartfrom in the case of TPH in Borehole No 3 which is discussed further in thefollowing paragraphs.
4.3.17 Borehole No 3: Trigger levels for ammoniacal nitrogen, total phenol and TPHwere exceeded in the sample retrieved from this borehole in December 2015.As a consequence, the sample obtained during the January 2016 monitoringvisit was tested for these determinands when all but the TPH value wasbelow the trigger level. This is discussed further in the following paragraphs.
4.3.18 TPH was measured at 4.61 mg/l in January 2016 which again exceeded the 1mg/l trigger level. Testing for this determinand was scheduled to be repeatedin April but, due to oversight, this was not done. TPH was not detected in theJune and September samples. However, the trigger level was again exceededin December when TPH was 3.31 mg/l.
4.3.19 Monitoring for TPH has been scheduled to be repeated at this borehole inJanuary 2017.
Report No 08469/152 – January 2017Clayton Hall Landfill Site: Annual Performance Review (2016)
Page 14 The Arley Consulting Company Limited
4.3.20 It is a requirement of the permit variation that leachate is analysed annuallyfor TPH as part of the hazardous suite. There have been four measurementsof TPH concentration in samples from each of the four leachate chamberssince June 2015. These vary between 7.31 & 67.3 mg/l.
4.3.21 TACCL considers it unlikely that the source of TPH in the groundwatersample from Borehole No 3 is due to leachate leakage from the site asmeasured levels in the leachate are not considered significantly elevated.Moreover, all other parameters are below the trigger levels at Borehole No 3.
4.3.22 The HRA currently being carried out will include an assessment ofgroundwater chemistry and a review of trigger levels.
4.4 Review of Monitoring Results & Infrastructure
4.4.1 TACCL has reviewed the monitoring data recorded by the site operator andsummarise the findings as follows:
4.4.2 Borehole Nos 102S: Samples were obtained from this borehole throughoutthe monitoring period.
4.4.3 Borehole No 102D: Samples were obtained from this borehole during the firsttwo quarters after which this borehole was blocked.
4.4.4 Borehole No 103A: Samples were obtained from this borehole throughout2016.
4.4.5 Borehole BH3: Samples were obtained from this borehole throughout 2016apart from in October when there was insufficient to sample.
4.4.6 Borehole Nos 106S & 106A: Samples were obtained from these boreholesthroughout the monitoring period.
4.4.7 Borehole No 111A: It was not possible to recover samples during the firstthree quarters of 2016 as this borehole was dry.
4.4.8 Borehole No 113: Samples were unable to be recovered from this boreholewhich is blocked.
4.4.9 Borehole No 118A: Samples were obtained from this borehole throughoutthe monitoring period.
4.4.10 Borehole No 124: Samples were obtained from this borehole throughout themonitoring period.
Report No 08469/152 – January 2017Clayton Hall Landfill Site: Annual Performance Review (2016)
Page 15 The Arley Consulting Company Limited
5. SURFACE WATER
5.1 General
5.1.1 Surface water sampling and analytical requirements are set out in Schedule 3Table S3.10 of the EP variation.
5.1.2 The operator is required to collect surface water samples for routine chemicalanalysis from 4 locations as follows:
S1 River Lostock upstreamS2 River Lostock downstreamS3 Bryning Brook upstreamS4 Bryning Brook downstream
5.1.3 Sampling locations are illustrated on Drawing No 08469/16 which is includedin Appendix K of reports already submitted to the EA.
5.1.4 The specific analytical requirements are set out in Table S3.10 of theenvironmental permit; there are specific monthly testing suites.
5.1.5 Surface water sampling and in situ testing is carried out by Quercia Limited.Samples were collected on the following occasions:
Quarter 1 Quarter 2 Quarter 3 Quarter 421 January 12 April 14 July 10 October16 February 13 May 10 August 14 November9 March 1 June 14 September 12 December
5.1.6 Surface water analysis is carried out by ALcontrol Laboratories (Chester).
5.2 Surface Water Analysis
5.2.1 Surface water samples were recovered on 12 occasions from each of thesampling locations.
5.2.2 The samples have been analysed in accordance with the permit requirements.
5.2.3 Although not a requirement of the permit variation, surface watertemperature is measured using a Carey Scientific Limited portable probe, thecalibration certificate for which is held on site. Temperature measurementsare presented in reports already submitted to the EA.
Report No 08469/152 – January 2017Clayton Hall Landfill Site: Annual Performance Review (2016)
Page 16 The Arley Consulting Company Limited
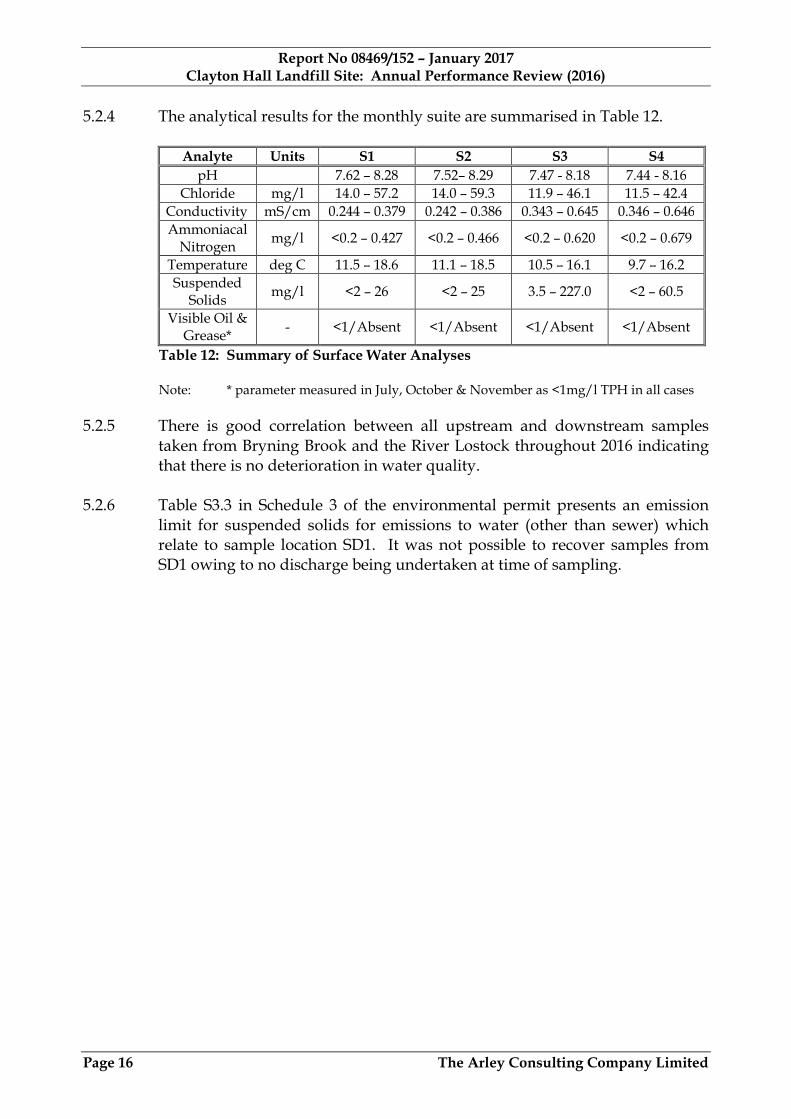
5.2.4 The analytical results for the monthly suite are summarised in Table 12.
Analyte Units S1 S2 S3 S4
pH 7.62 – 8.28 7.52– 8.29 7.47 - 8.18 7.44 - 8.16
Chloride mg/l 14.0 – 57.2 14.0 – 59.3 11.9 – 46.1 11.5 – 42.4
Conductivity mS/cm 0.244 – 0.379 0.242 – 0.386 0.343 – 0.645 0.346 – 0.646
AmmoniacalNitrogen
mg/l <0.2 – 0.427 <0.2 – 0.466 <0.2 – 0.620 <0.2 – 0.679
Temperature deg C 11.5 – 18.6 11.1 – 18.5 10.5 – 16.1 9.7 – 16.2
SuspendedSolids
mg/l <2 – 26 <2 – 25 3.5 – 227.0 <2 – 60.5
Visible Oil &Grease*
- <1/Absent <1/Absent <1/Absent <1/Absent
Table 12: Summary of Surface Water Analyses
Note: * parameter measured in July, October & November as <1mg/l TPH in all cases
5.2.5 There is good correlation between all upstream and downstream samples
taken from Bryning Brook and the River Lostock throughout 2016 indicatingthat there is no deterioration in water quality.
5.2.6 Table S3.3 in Schedule 3 of the environmental permit presents an emissionlimit for suspended solids for emissions to water (other than sewer) whichrelate to sample location SD1. It was not possible to recover samples fromSD1 owing to no discharge being undertaken at time of sampling.
Report No 08469/152 – January 2017Clayton Hall Landfill Site: Annual Performance Review (2016)
Page 17 The Arley Consulting Company Limited
6. LANDFILL GAS
6.1 General
6.1.1 Landfill gas monitoring requirements are specified in 3 Table S3.5 (externalmonitoring boreholes), Table S3.6 (capped surfaces) and Table S3.8 (othermonitoring requirements) of the environmental permit variation.
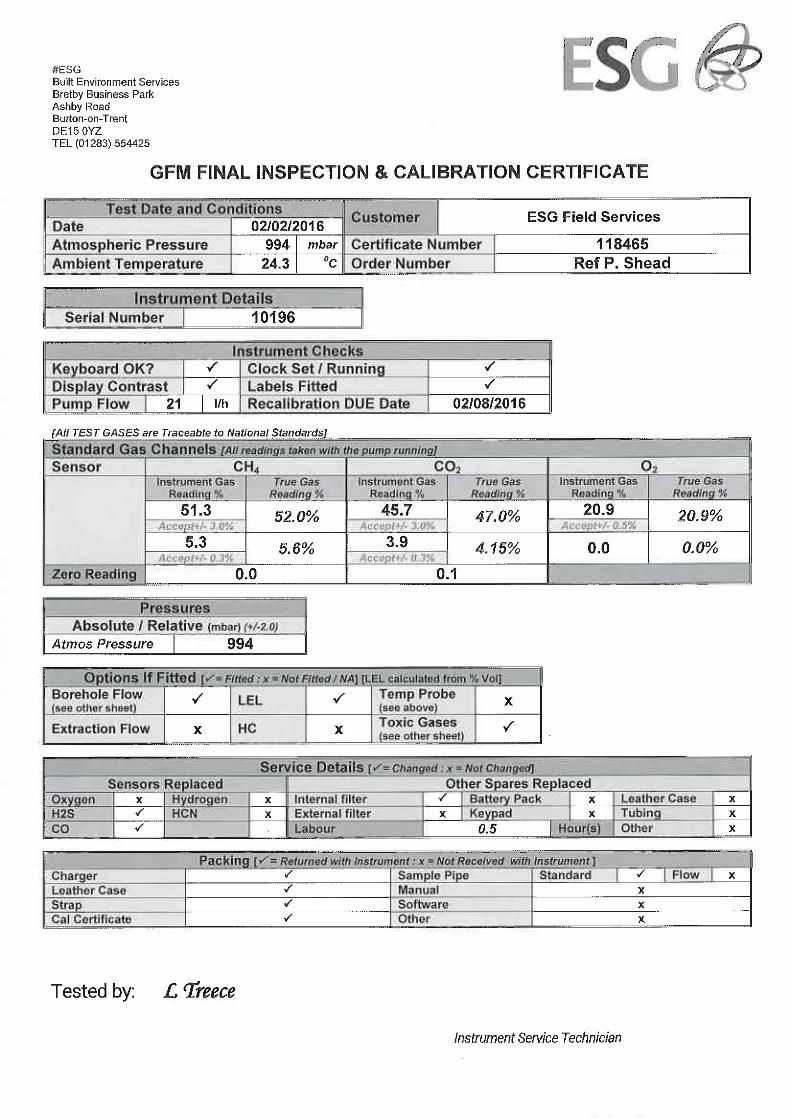
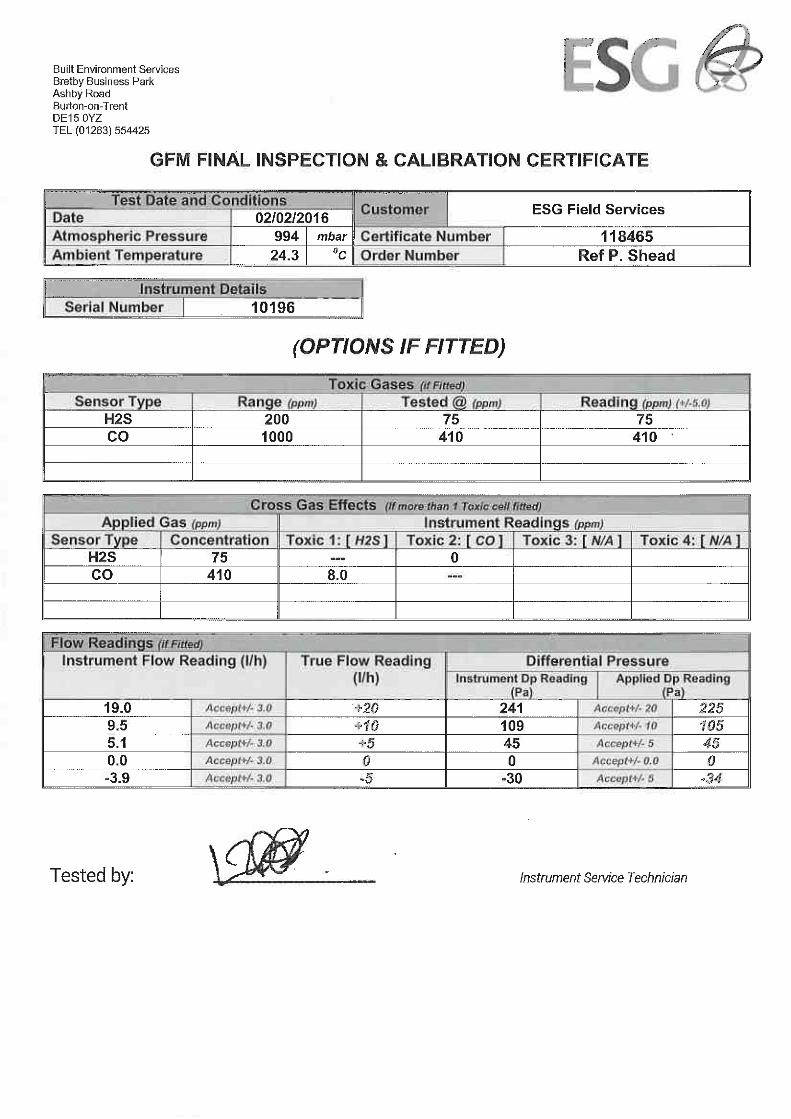
6.1.2 Landfill gas monitoring is carried out by Quercia Limited using aGeotechnical Instruments GA5000 portable gas meter, the calibrationcertificate for which is held on site. Gas concentrations were measured on thefollowing occasions:
Quarter 1 Quarter 2 Quarter 3 Quarter 429 January 20 April 19 July 25 October22 February 23 May 22 August 23 November22 March 21 June 27 September 30 December
6.1.3 Gas monitoring results are presented in reports already submitted to the EA.
6.1.4 Landfill gas monitoring points are illustrated on Drawing No 08469/17B.
6.2 External Monitoring Boreholes
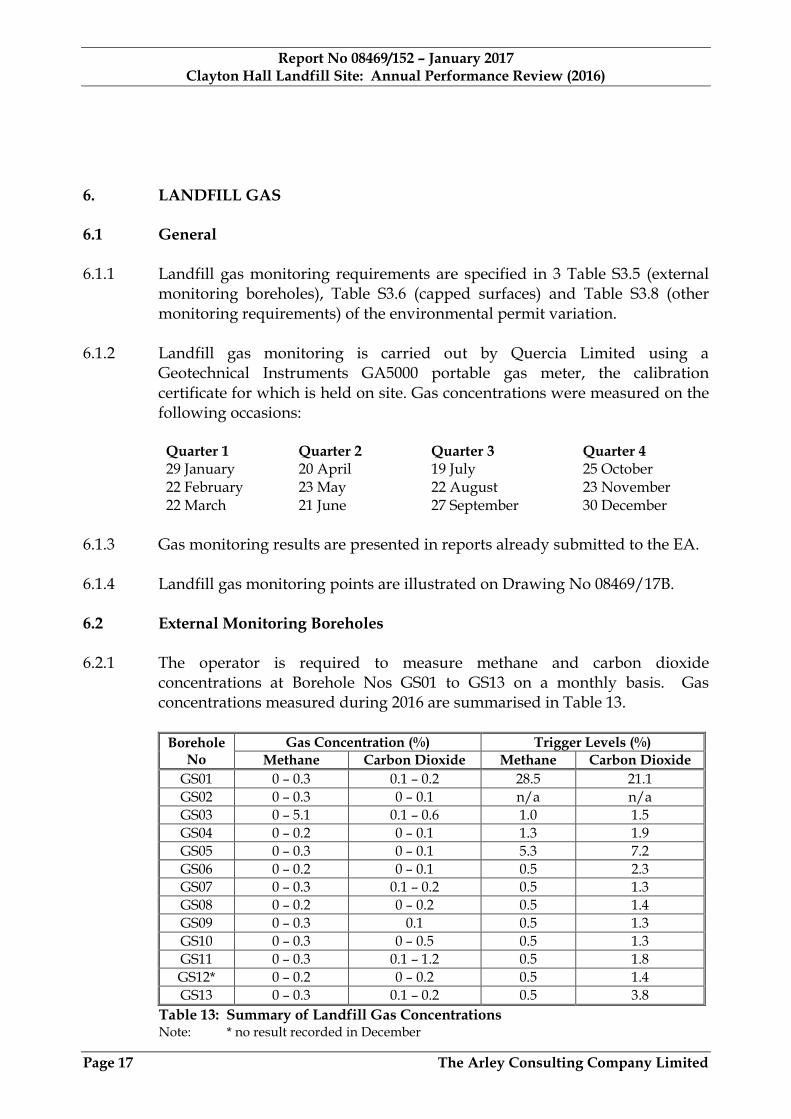
6.2.1 The operator is required to measure methane and carbon dioxideconcentrations at Borehole Nos GS01 to GS13 on a monthly basis. Gasconcentrations measured during 2016 are summarised in Table 13.
BoreholeNo
Gas Concentration (%) Trigger Levels (%)
Methane Carbon Dioxide Methane Carbon Dioxide
GS01 0 – 0.3 0.1 – 0.2 28.5 21.1
GS02 0 – 0.3 0 – 0.1 n/a n/a
GS03 0 – 5.1 0.1 – 0.6 1.0 1.5
GS04 0 – 0.2 0 – 0.1 1.3 1.9
GS05 0 – 0.3 0 – 0.1 5.3 7.2
GS06 0 – 0.2 0 – 0.1 0.5 2.3
GS07 0 – 0.3 0.1 – 0.2 0.5 1.3
GS08 0 – 0.2 0 – 0.2 0.5 1.4
GS09 0 – 0.3 0.1 0.5 1.3
GS10 0 – 0.3 0 – 0.5 0.5 1.3
GS11 0 – 0.3 0.1 – 1.2 0.5 1.8
GS12* 0 – 0.2 0 – 0.2 0.5 1.4
GS13 0 – 0.3 0.1 – 0.2 0.5 3.8
Table 13: Summary of Landfill Gas ConcentrationsNote: * no result recorded in December
Report No 08469/152 – January 2017Clayton Hall Landfill Site: Annual Performance Review (2016)
Page 18 The Arley Consulting Company Limited
6.2.2 Additional weekly monitoring results for Borehole No GS04 are presented inthe reports already submitted to the EA for the closed landfill areas.
6.2.3 In July 2012 borehole specific gas trigger levels were agreed with the EA. Theapproved trigger levels are presented on Quercia Table NWM098E Issue 3.
6.2.4 From the results summarised above it can be seen that all gas concentrationmeasurements are consistent with data reported previously and below thetrigger levels agreed apart from at Borehole No GS03. These exceedanceshave been discussed in Report Nos 08469/141 and 143 already submitted tothe EA and again briefly in the following paragraphs.
6.2.5 The 1.0/1.5% methane trigger levels were exceeded at Borehole No GS03 oneach of the monthly monitoring visits in the first quarter of 2016 for which aSchedule 5 Notification was submitted to the EA. Supplementary monitoringwas undertaken and gas flows assessed against permit surrender criteria.
6.2.6 In May, the 1.0% methane action level (although not the compliance level)was marginally exceeded. The corresponding gas flow was zero and nosupplementary monitoring was required.
6.2.7 It was concluded that, in all instances, the trigger level exceedances posedlow risk to nearby residential properties.
6.3 Capped Areas
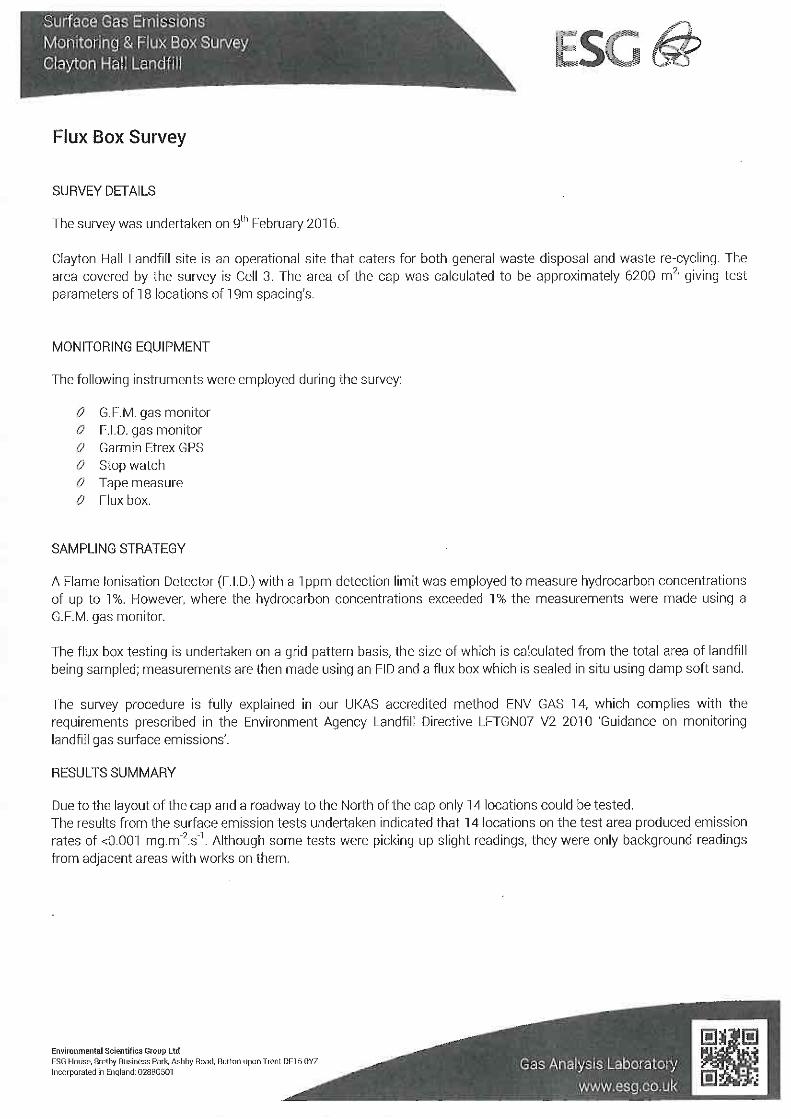
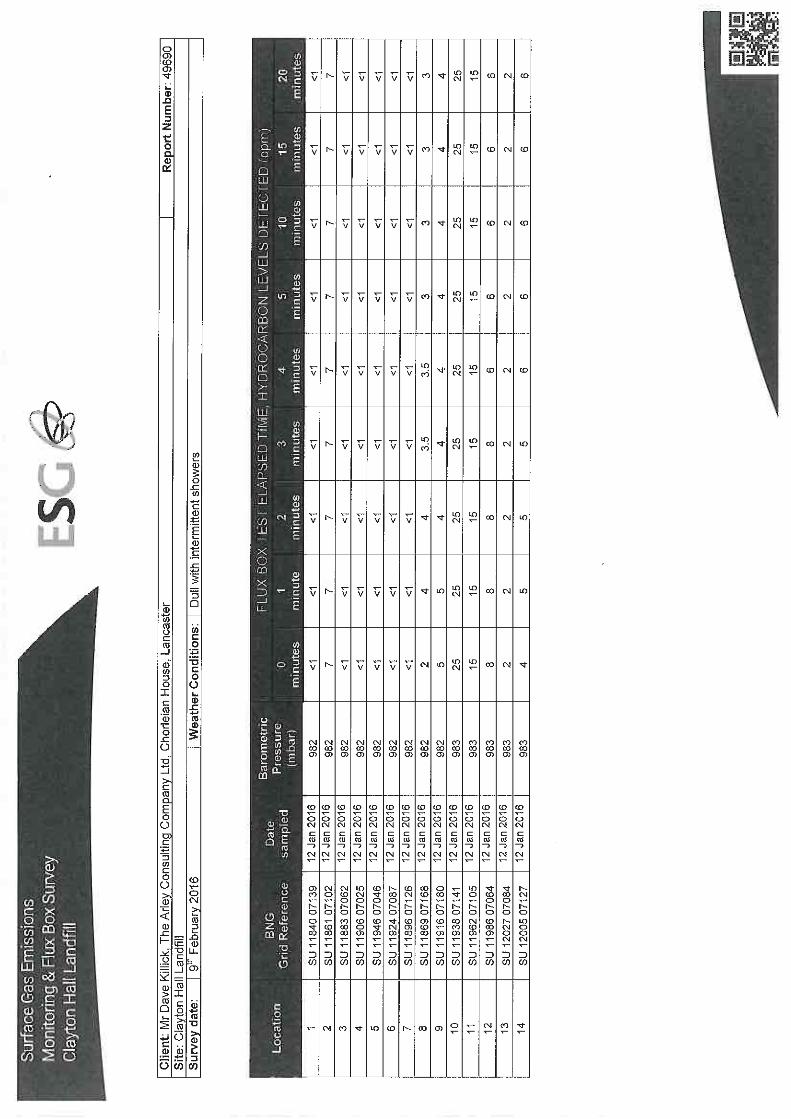
6.3.1 The operator is required to carry out annual monitoring of landfill gas fromcapped areas in accordance with Schedule 3 Table S3.6 of the environmentalpermit.
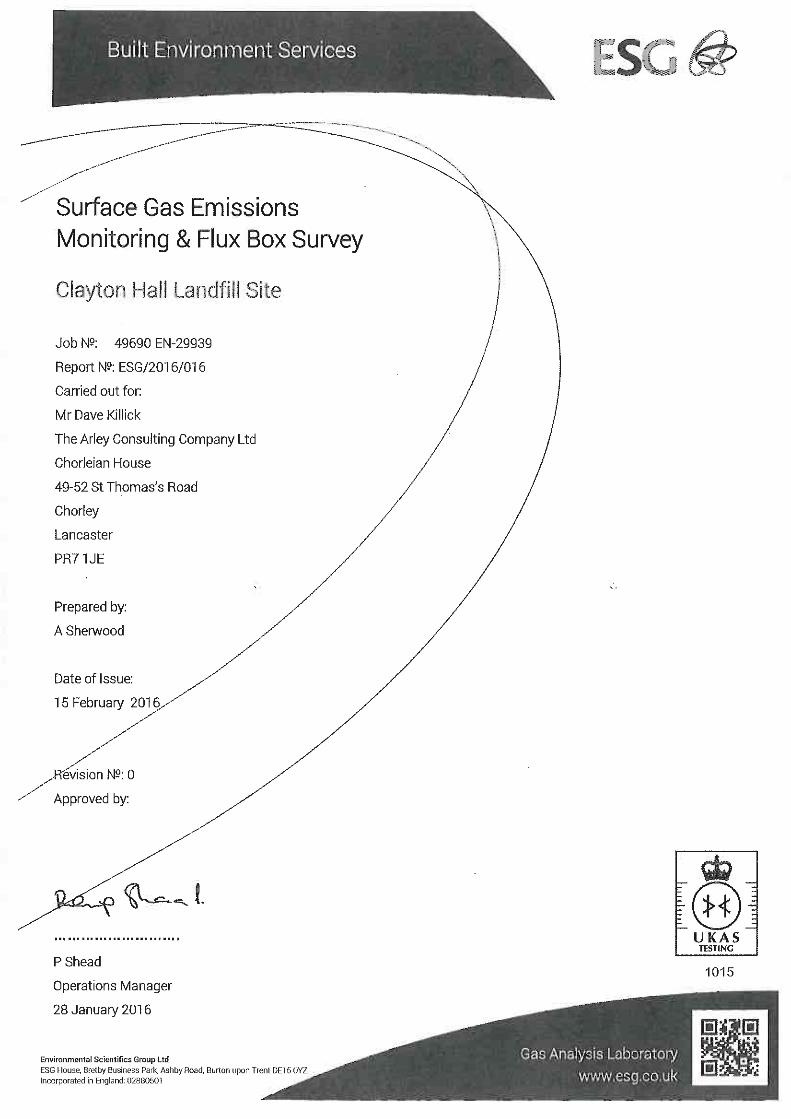
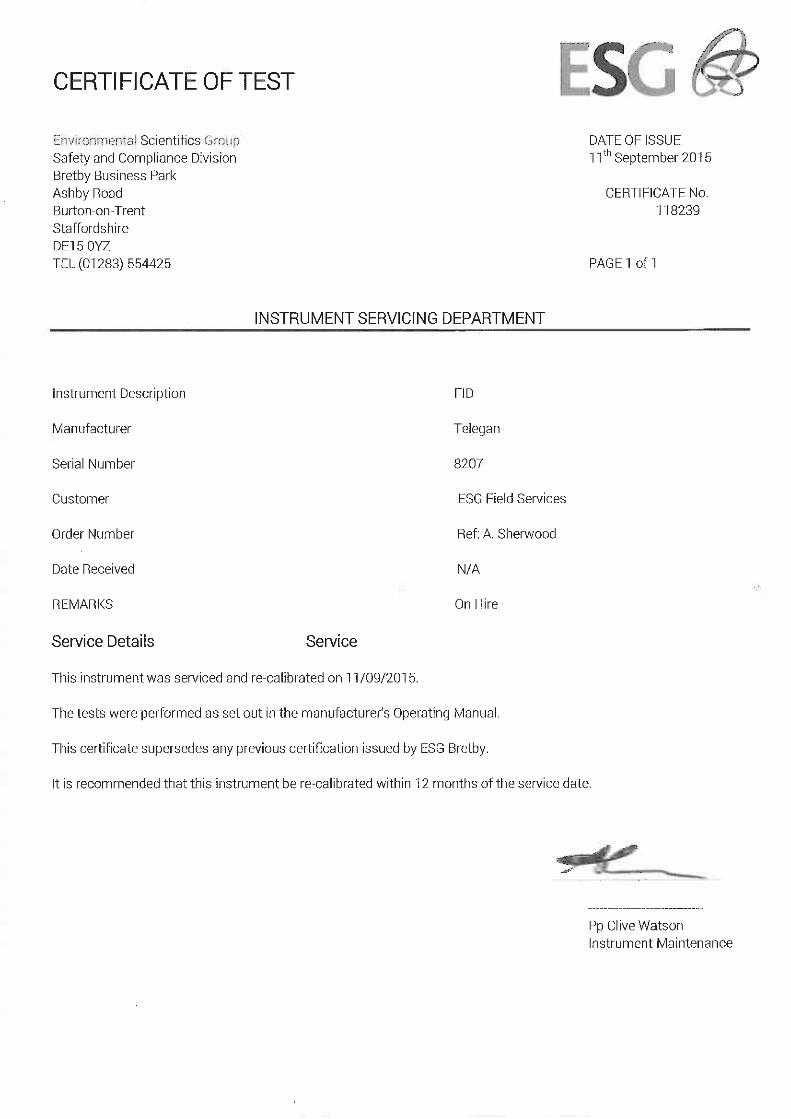
6.3.2 Testing has been undertaken by Environmental Scientifics Group LimitedBretby using a flux box and test methodology specified in the EA GuidanceDocument LFT GN07. Testing was carried out on 9 February 2016.
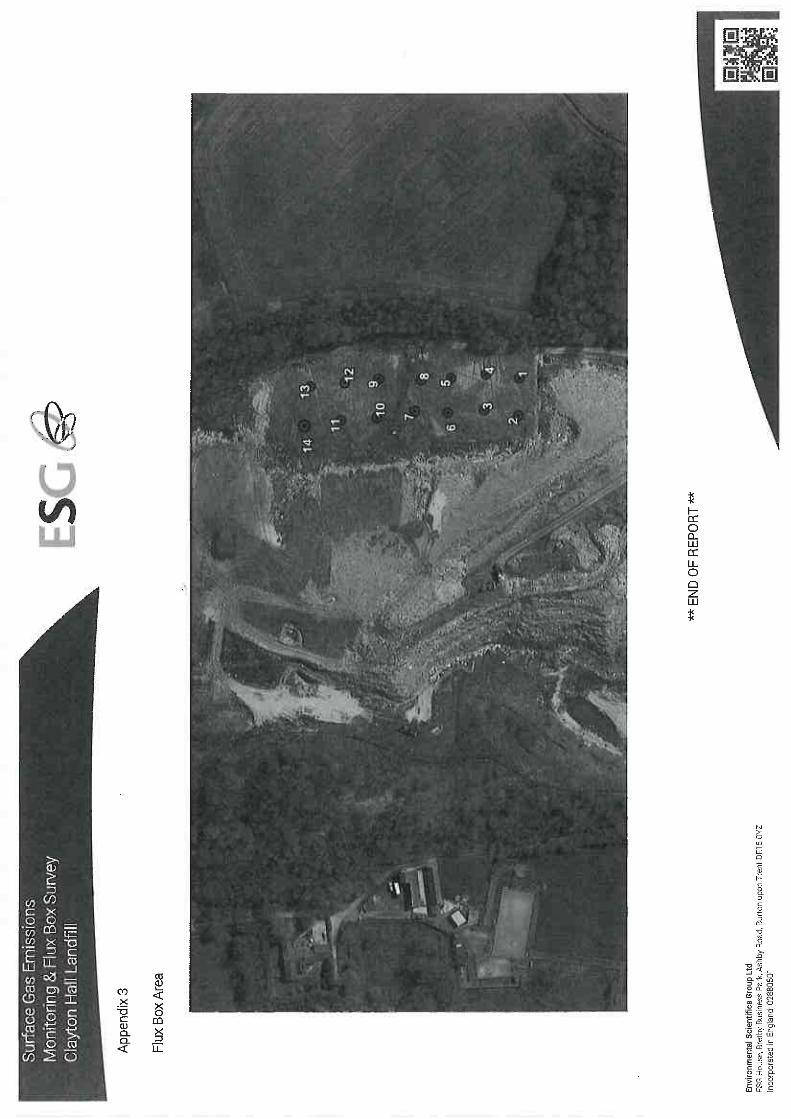
6.3.3 The flux box test results are presented in Appendix B.
6.3.4 Tests were carried out at twenty-one locations, 1 to 14, on the permanentlycapped area, Cell 3. The gas emissions measured using the flux box in Cell 3are less than 0.001 mg/m²/s at all fourteen test locations.
6.3.5 There are no trigger levels specified in the environmental permit variation forpermanently/temporarily capped zones.
Report No 08469/152 – January 2017Clayton Hall Landfill Site: Annual Performance Review (2016)
Page 19 The Arley Consulting Company Limited
6.4 In Waste Landfill Gas
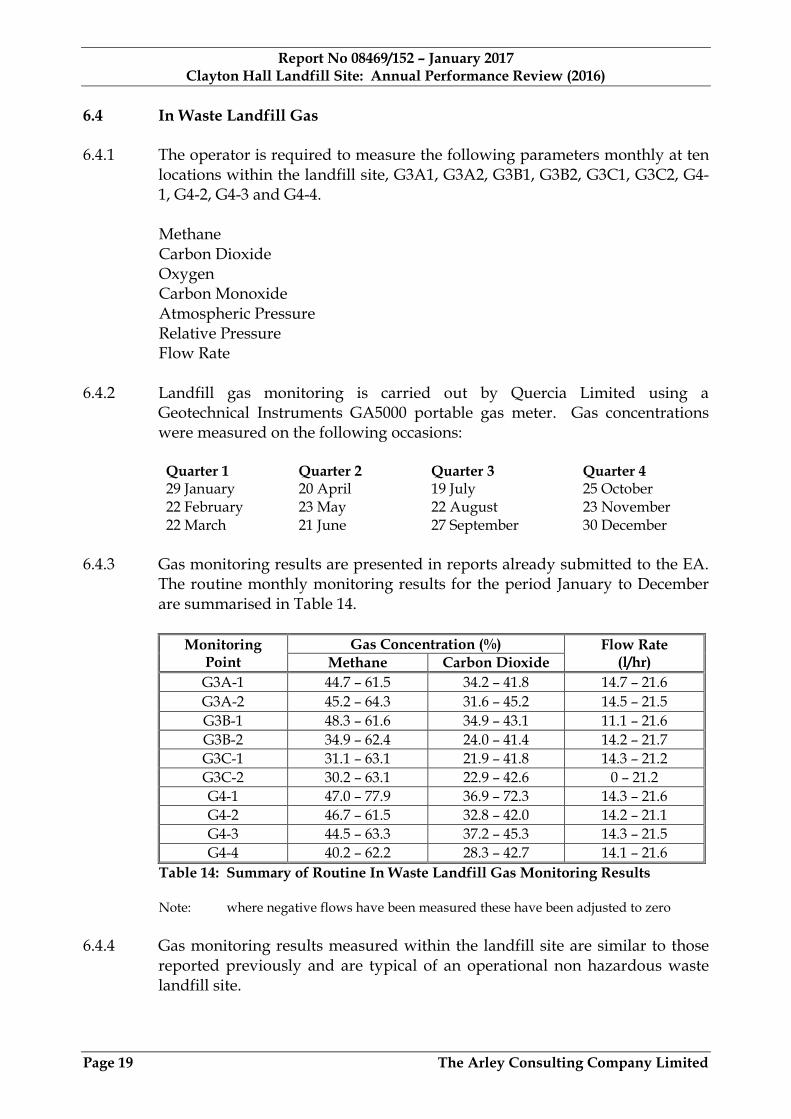
6.4.1 The operator is required to measure the following parameters monthly at tenlocations within the landfill site, G3A1, G3A2, G3B1, G3B2, G3C1, G3C2, G4-1, G4-2, G4-3 and G4-4.
MethaneCarbon DioxideOxygenCarbon MonoxideAtmospheric PressureRelative PressureFlow Rate
6.4.2 Landfill gas monitoring is carried out by Quercia Limited using aGeotechnical Instruments GA5000 portable gas meter. Gas concentrationswere measured on the following occasions:
Quarter 1 Quarter 2 Quarter 3 Quarter 429 January 20 April 19 July 25 October22 February 23 May 22 August 23 November22 March 21 June 27 September 30 December
6.4.3 Gas monitoring results are presented in reports already submitted to the EA.The routine monthly monitoring results for the period January to Decemberare summarised in Table 14.
MonitoringPoint
Gas Concentration (%) Flow Rate(l/hr)Methane Carbon Dioxide
G3A-1 44.7 – 61.5 34.2 – 41.8 14.7 – 21.6
G3A-2 45.2 – 64.3 31.6 – 45.2 14.5 – 21.5
G3B-1 48.3 – 61.6 34.9 – 43.1 11.1 – 21.6
G3B-2 34.9 – 62.4 24.0 – 41.4 14.2 – 21.7
G3C-1 31.1 – 63.1 21.9 – 41.8 14.3 – 21.2
G3C-2 30.2 – 63.1 22.9 – 42.6 0 – 21.2
G4-1 47.0 – 77.9 36.9 – 72.3 14.3 – 21.6
G4-2 46.7 – 61.5 32.8 – 42.0 14.2 – 21.1
G4-3 44.5 – 63.3 37.2 – 45.3 14.3 – 21.5
G4-4 40.2 – 62.2 28.3 – 42.7 14.1 – 21.6
Table 14: Summary of Routine In Waste Landfill Gas Monitoring Results
Note: where negative flows have been measured these have been adjusted to zero
6.4.4 Gas monitoring results measured within the landfill site are similar to thosereported previously and are typical of an operational non hazardous wastelandfill site.
Report No 08469/152 – January 2017Clayton Hall Landfill Site: Annual Performance Review (2016)
Page 20 The Arley Consulting Company Limited
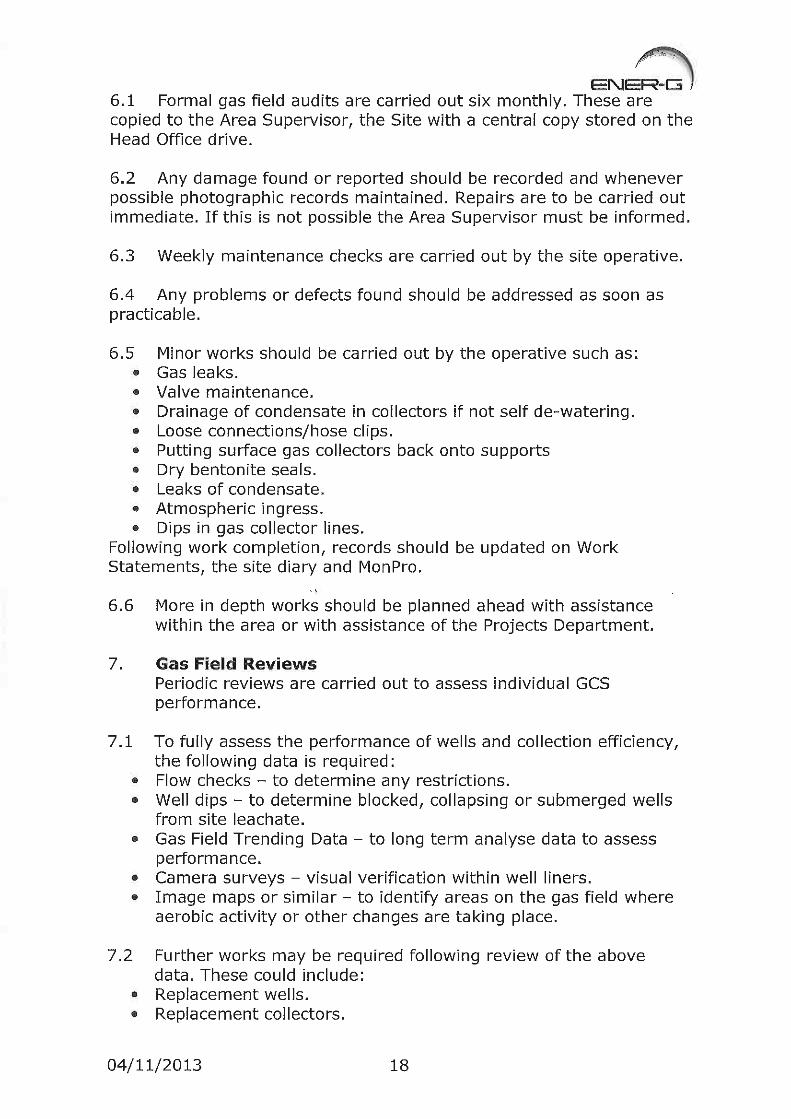
6.5 Gas Collection System
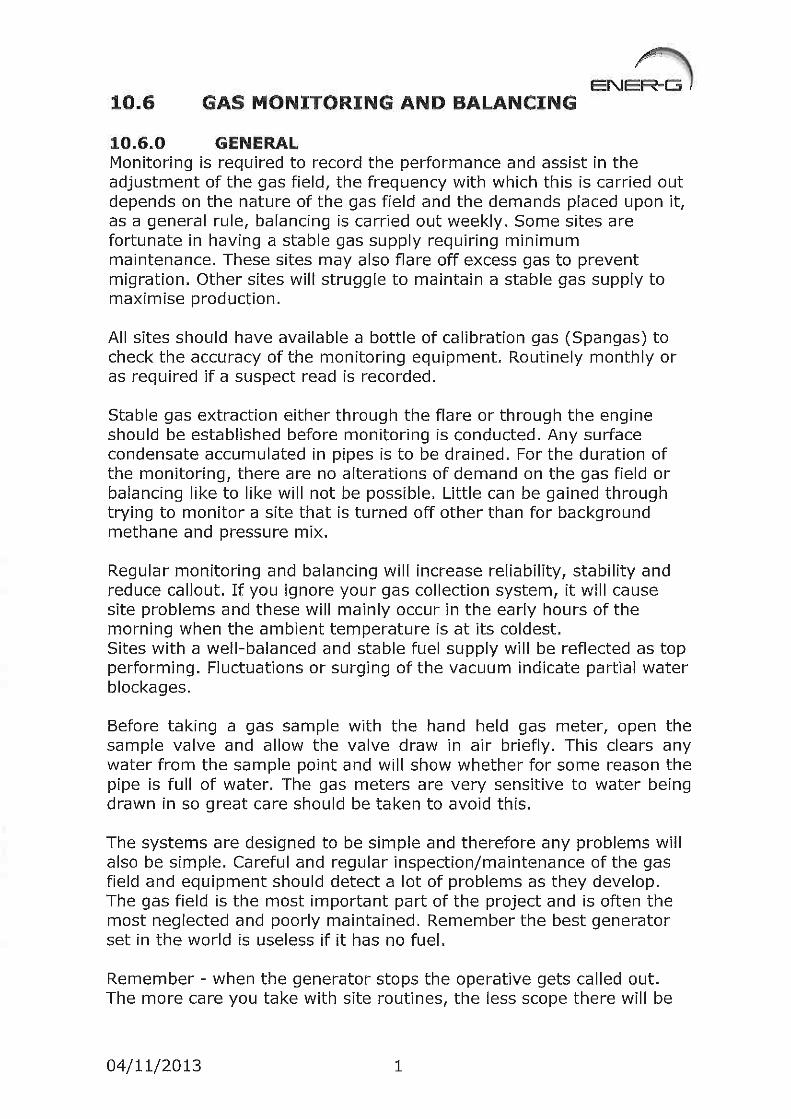
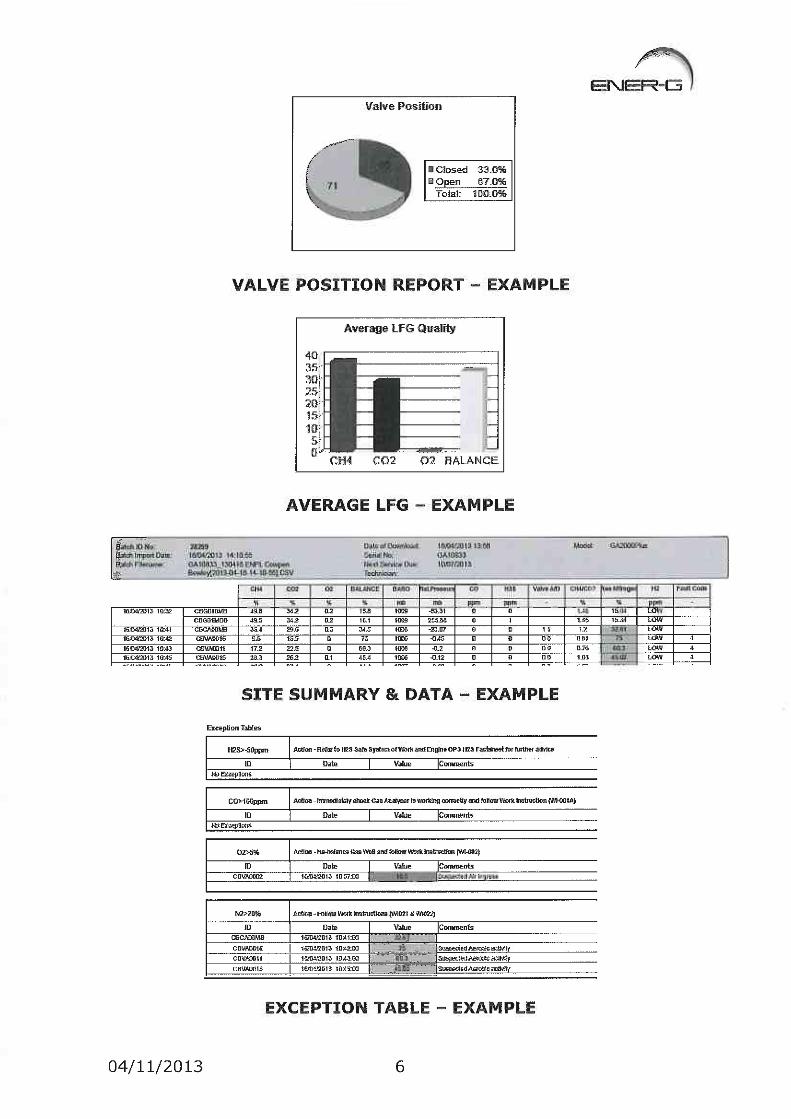
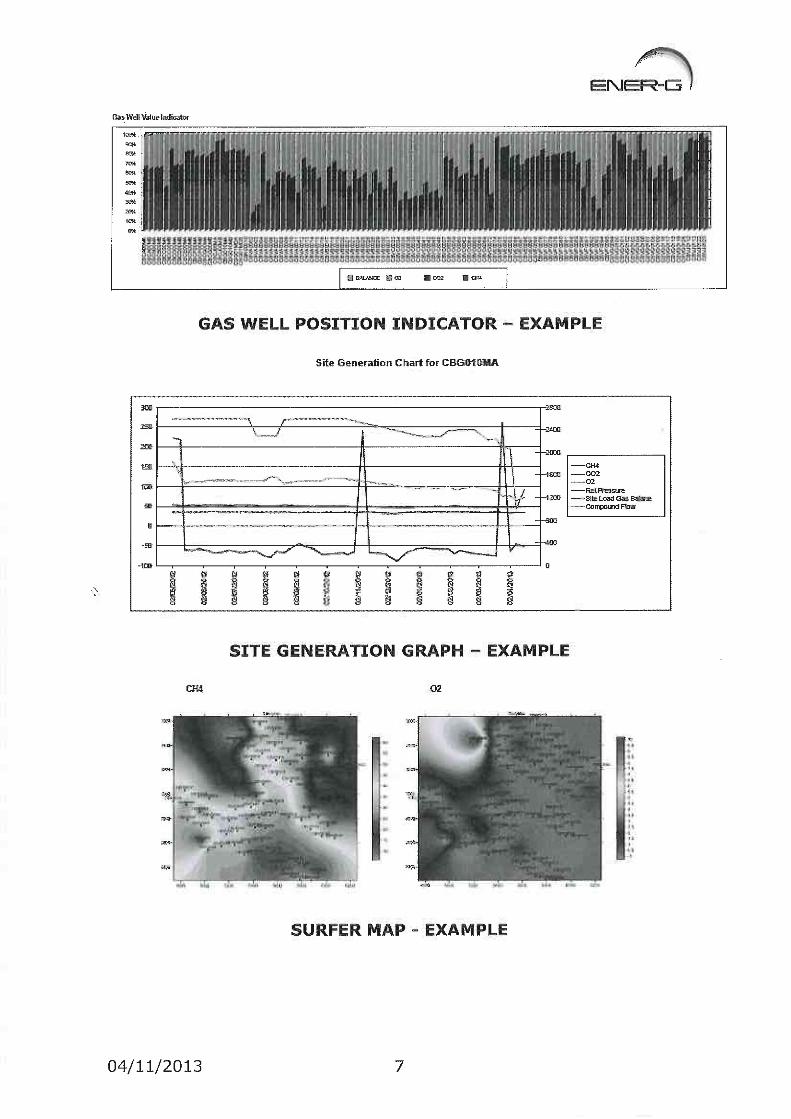
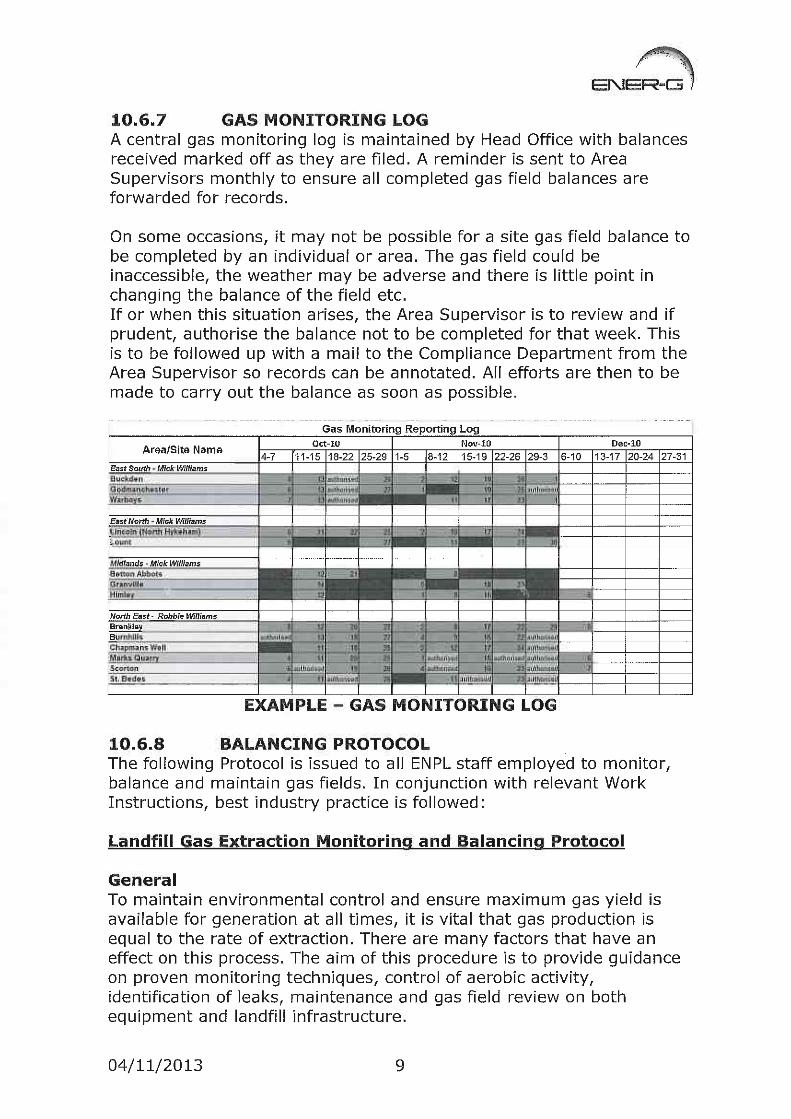
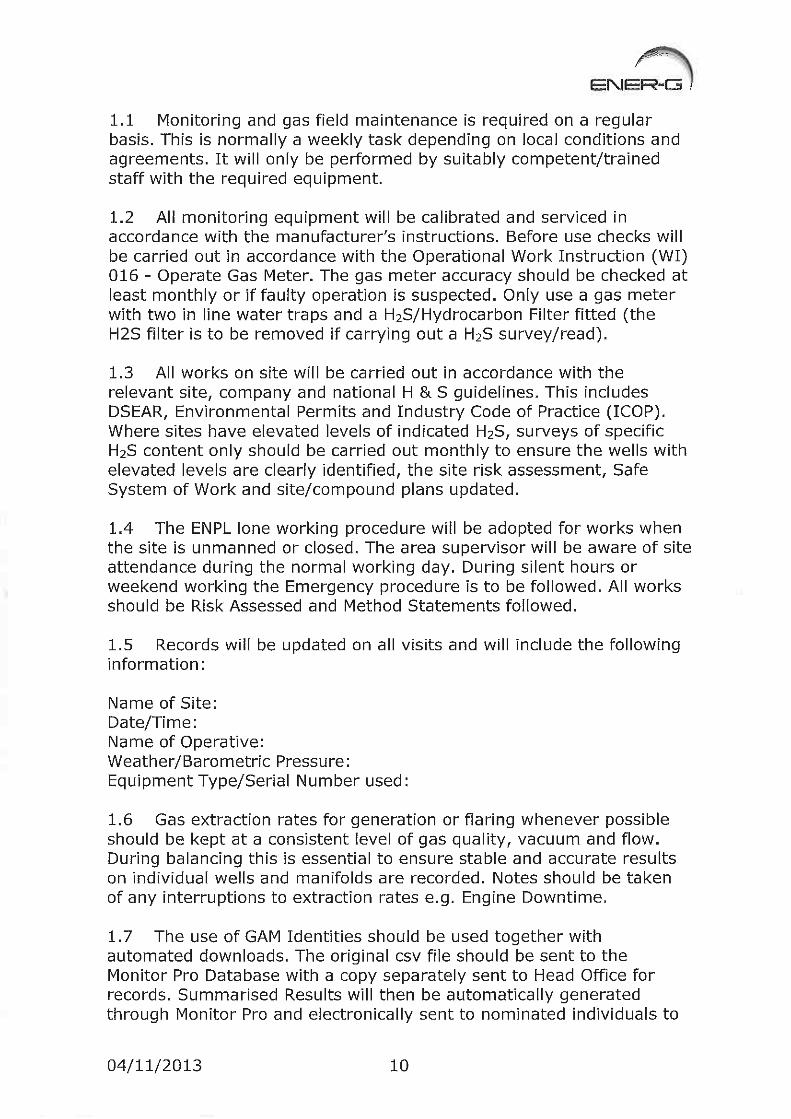
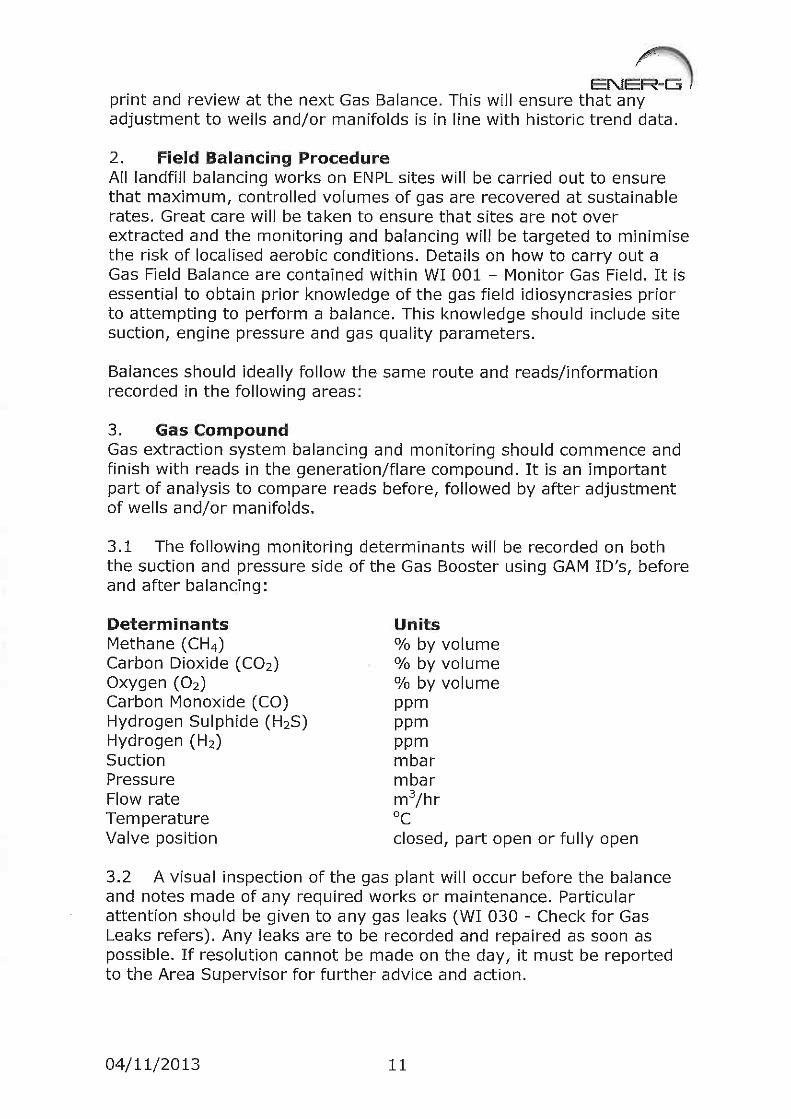
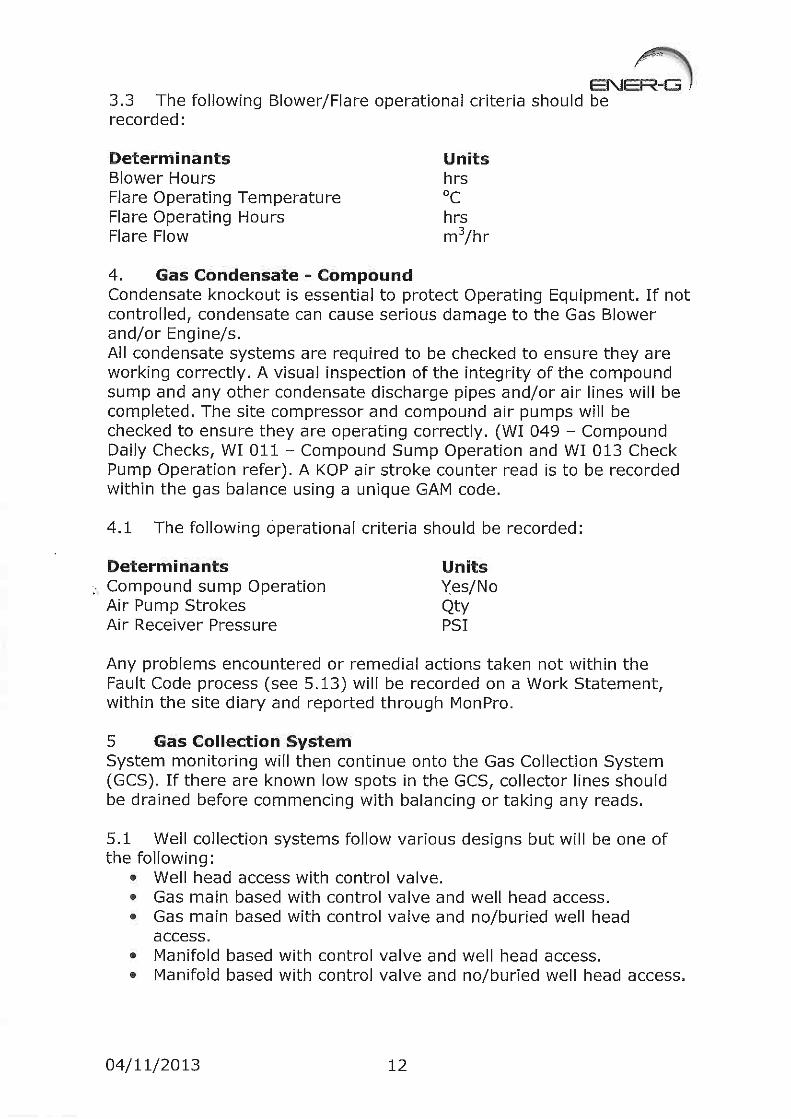
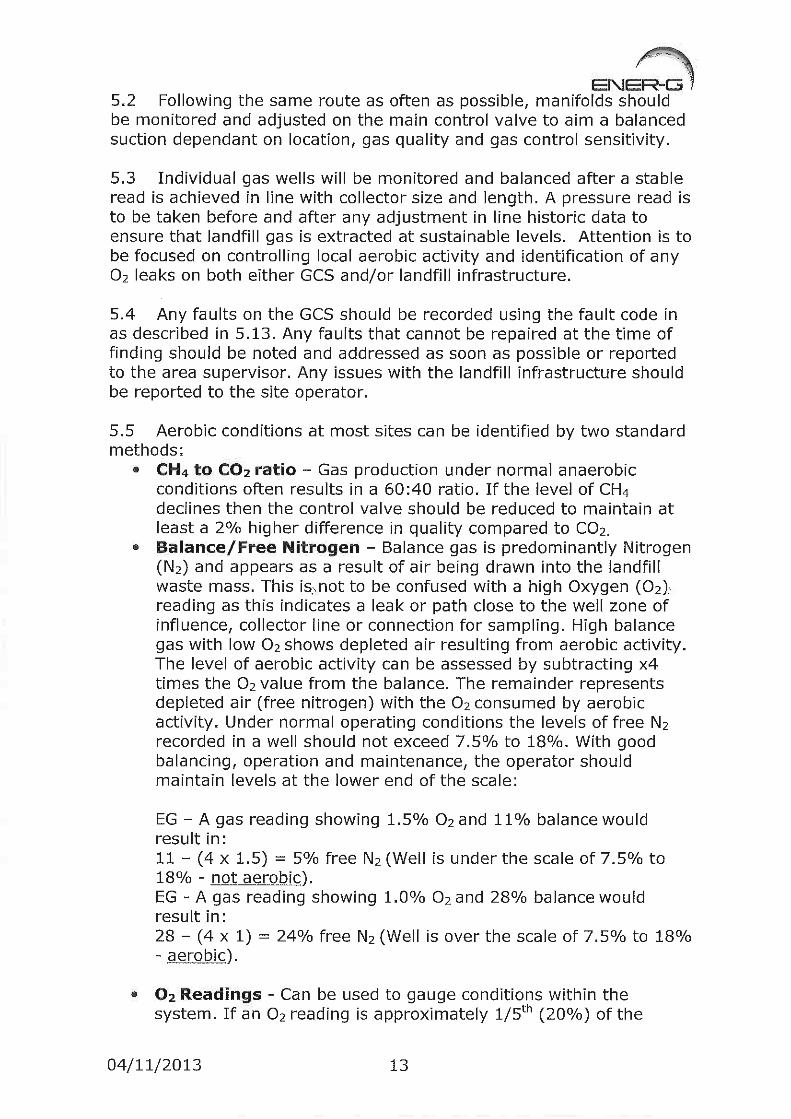
6.5.1 Management and monitoring of the gas collection system is undertaken byEner.G Natural Power Limited. Their document, ‘Gas Monitoring andBalancing’ is presented in Appendix C.
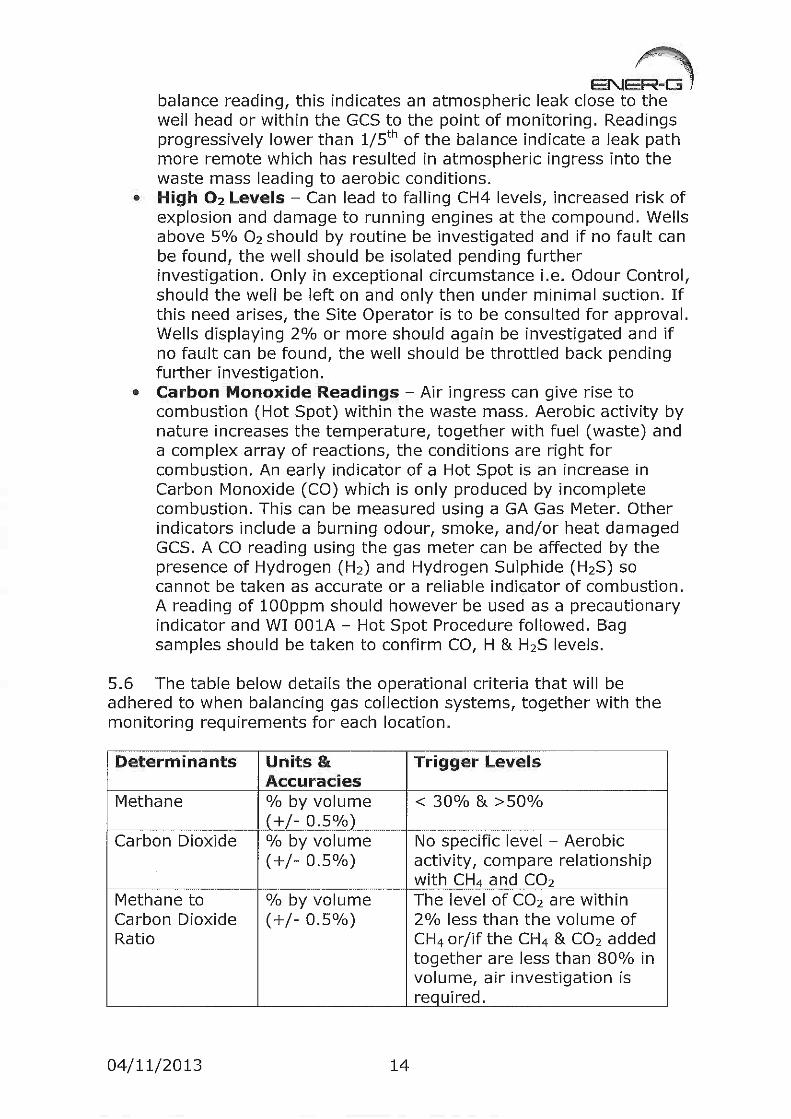
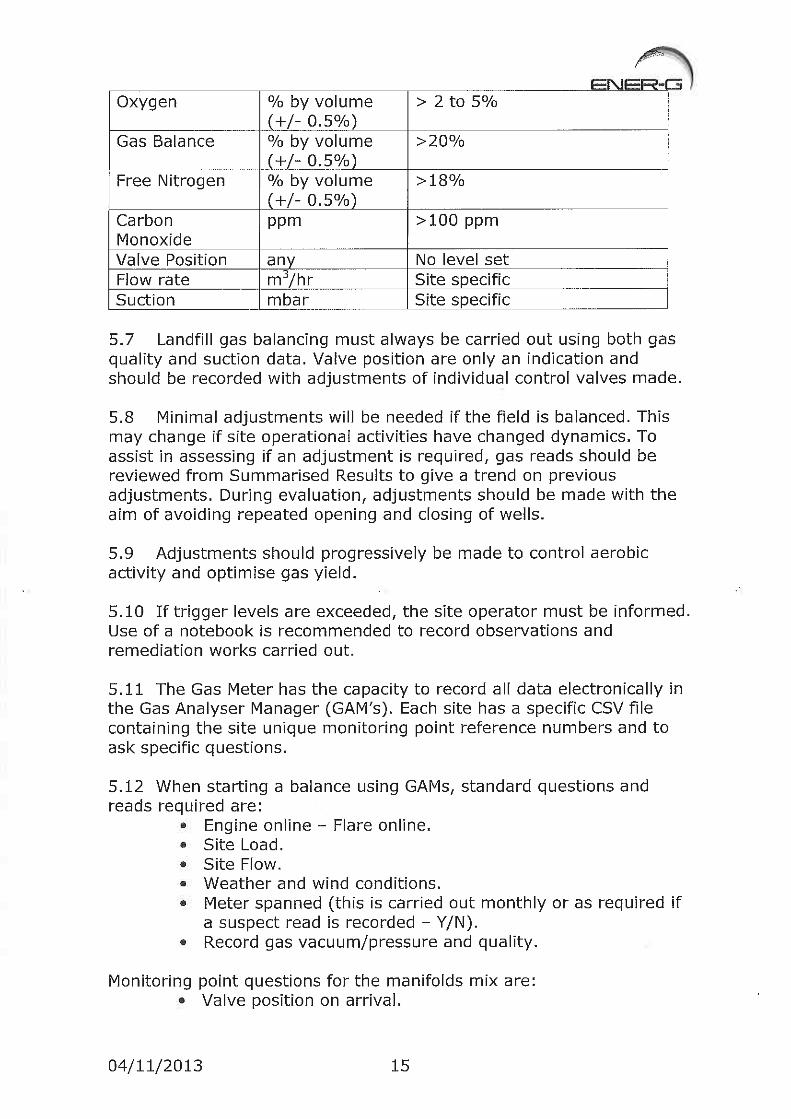
6.5.2 The monitoring requirements of the gas collection system at well controlvalve, manifolds and strategic points on the gas system are specified inSchedule 3 Table S3.8 of the permit variation. The concentrations of thefollowing are required to be measured monthly:
MethaneCarbon DioxideOxygenCarbon MonoxideAtmospheric PressureGas Flow Rate or Suction% Balance Gas
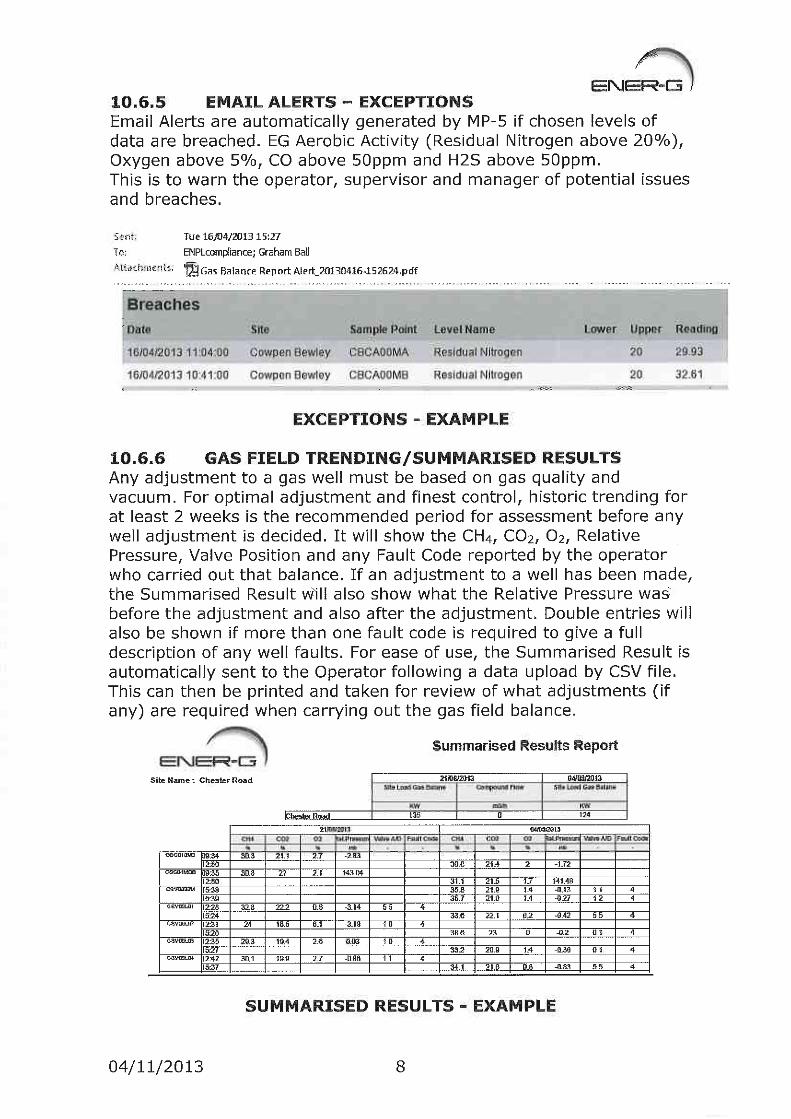
6.5.3 The permit variation specifies that where the oxygen concentration exceeds5% or the percentage balance gas is greater than 20% an assessment of airingress into the system shall be undertaken.
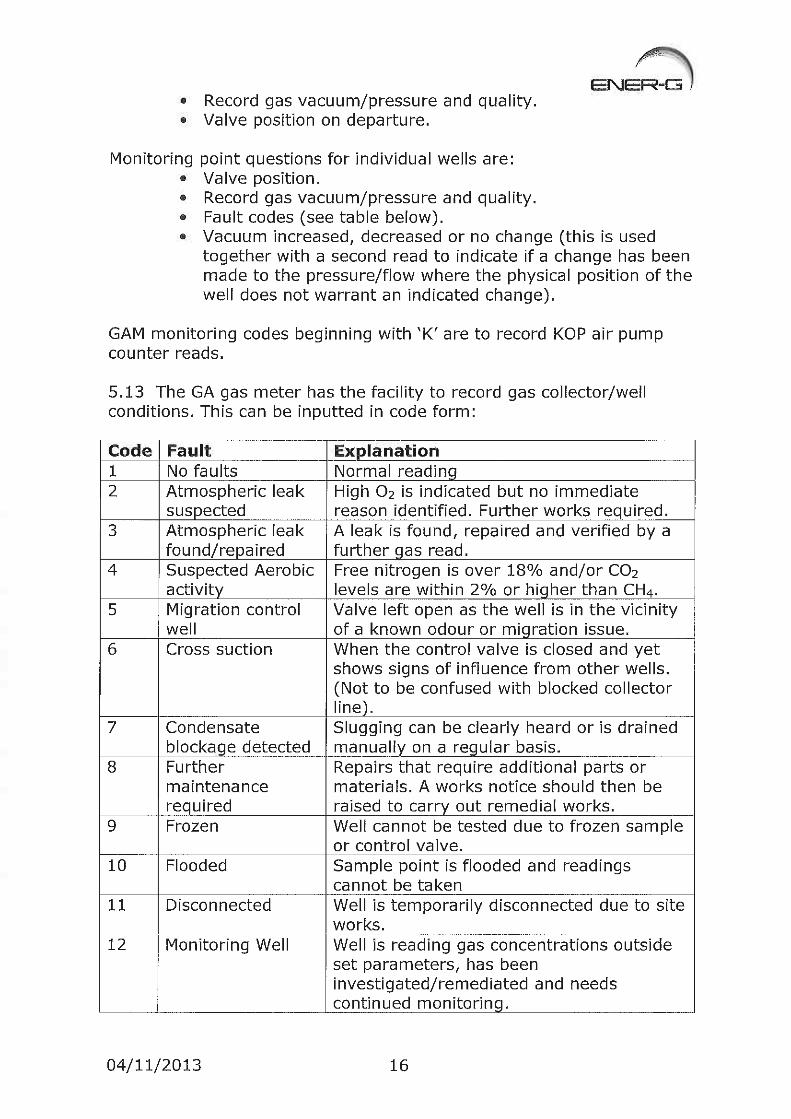
6.5.4 Should oxygen be measured above 5%, or if aerobic activity suspected, thenan investigation would be undertaken during the gas balance by Ener.G. Anyfaults and/or subsequent repairs would be recorded.
6.5.5 Furthermore, the permit variation specifies that where the concentration ofcarbon monoxide exceeds 100 ppm then further investigation shall beundertaken.
6.5.6 The concentration of the following parameter is also required to be measuredsix-monthly:
Hydrogen Sulphide
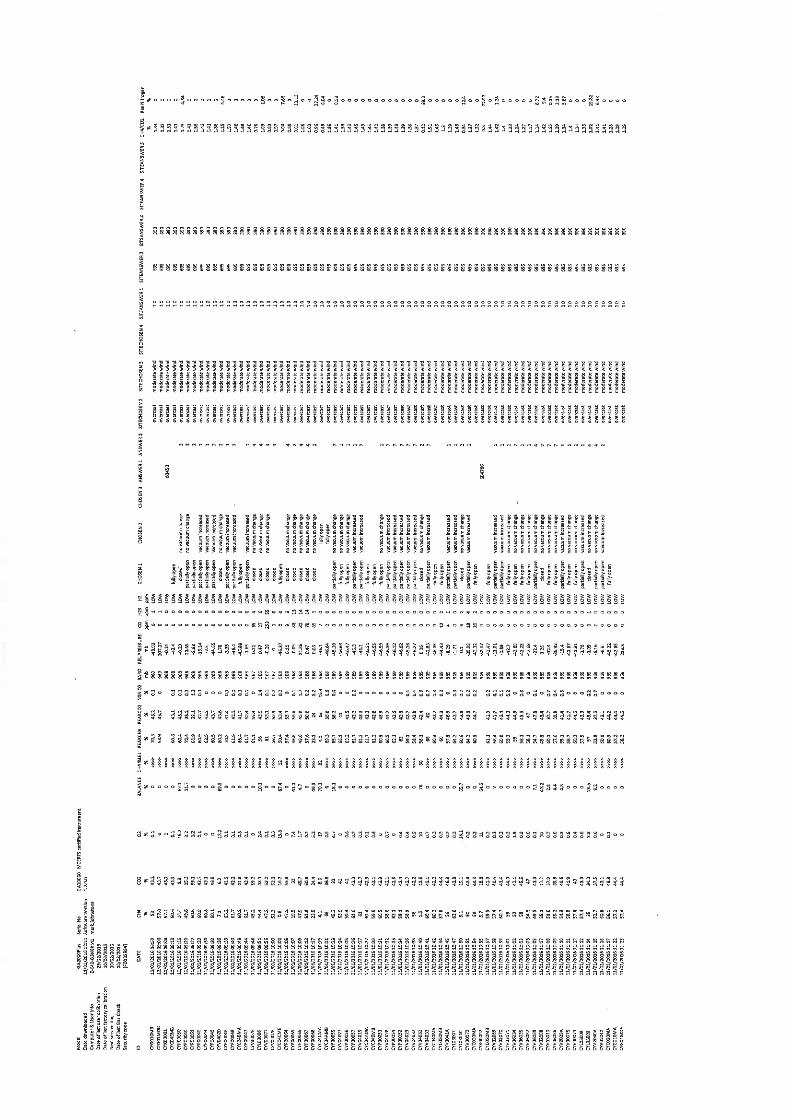
6.5.7 Composition of the landfill gas is monitored routinely by Ener.G. Gas balancesheets for 2016 have been supplied by Ener.G and are presented in AppendixC.
6.6 Input to Flare or LFG Utilisation Compound
6.6.1 Table S3.8 of the permit variation also specifies the requirement to measureweekly the concentrations of the following parameters in the landfill gasinput to the gas engine:
Report No 08469/152 – January 2017Clayton Hall Landfill Site: Annual Performance Review (2016)
Page 21 The Arley Consulting Company Limited
MethaneCarbon DioxideOxygenGas Flow Rate or Suction% Balance Gas
6.6.2 Where the oxygen concentration exceeds 5% or the percentage balance gas isgreater than 20% an assessment of air ingress into the system shall beundertaken.
6.6.3 Again, should oxygen be measured above 5%, or if aerobic activity suspected,then an investigation would be undertaken during the gas balance by Ener.G.Any faults and/or subsequent repairs would be recorded.
6.6.4 Gas balance sheets for 2016 have been supplied by Ener.G and are presentedin Appendix C.
6.6.5 It is also a requirement of Table S3.8 of the permit variation to measure tracegases in the landfill gas input to the gas engine.
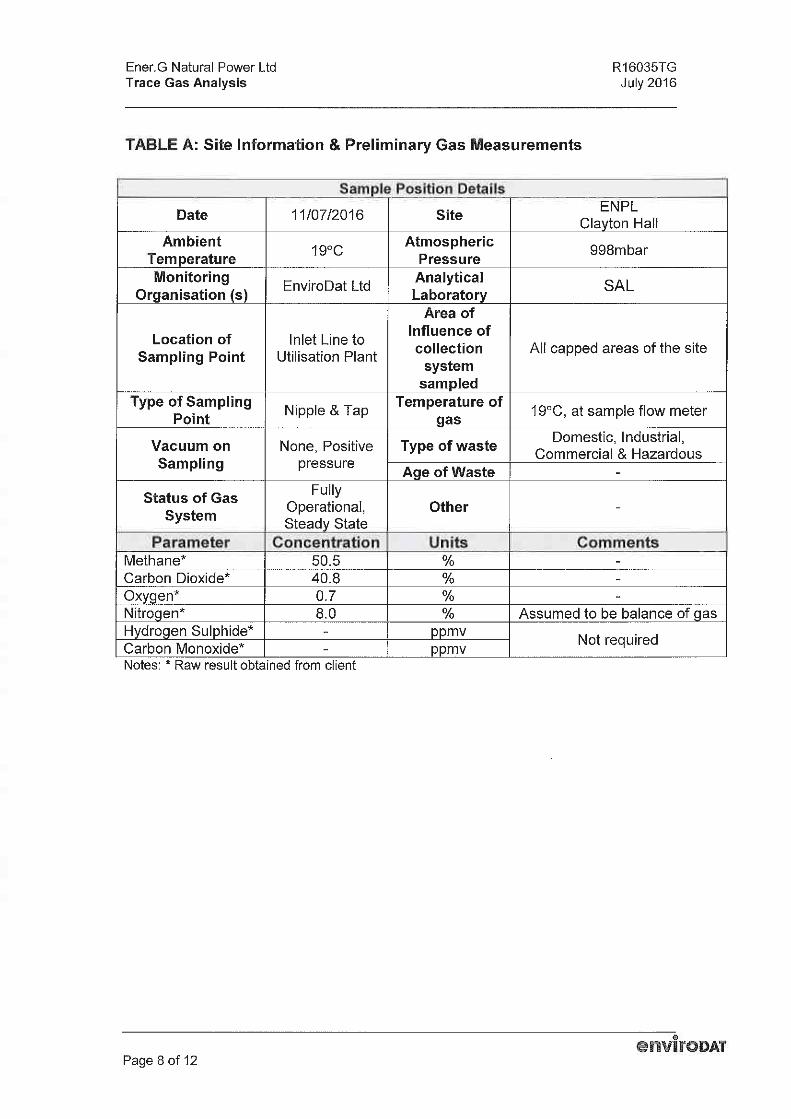
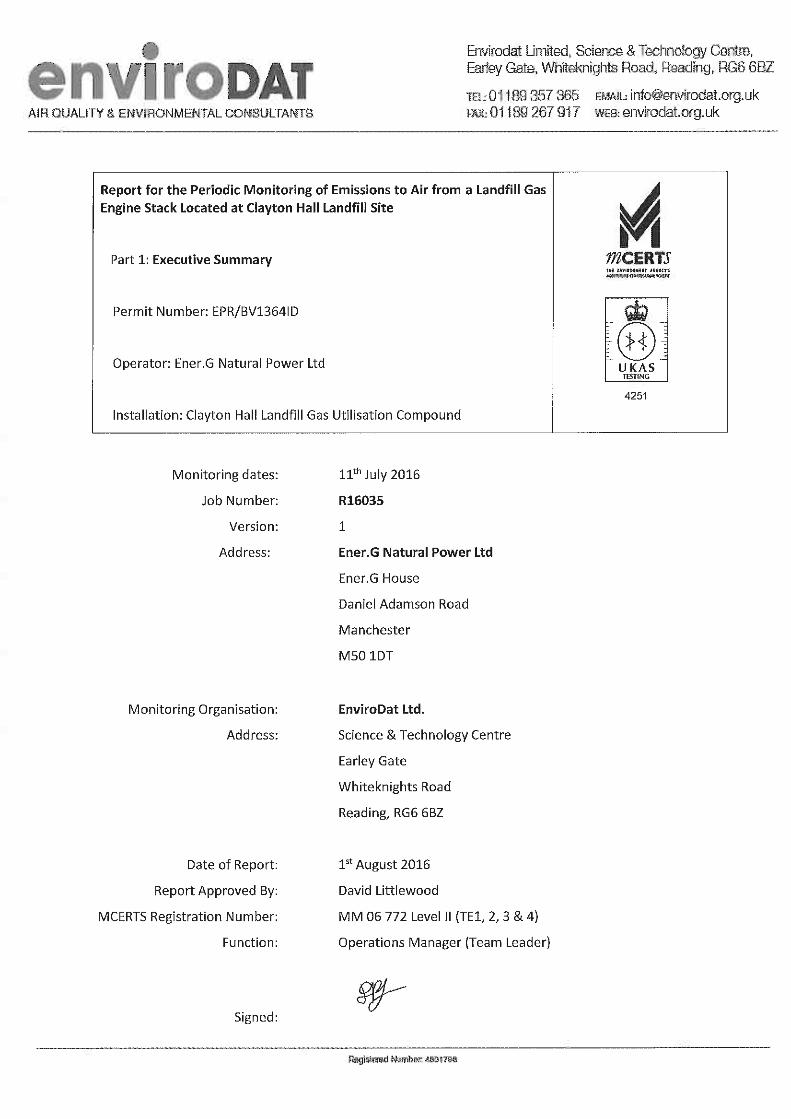
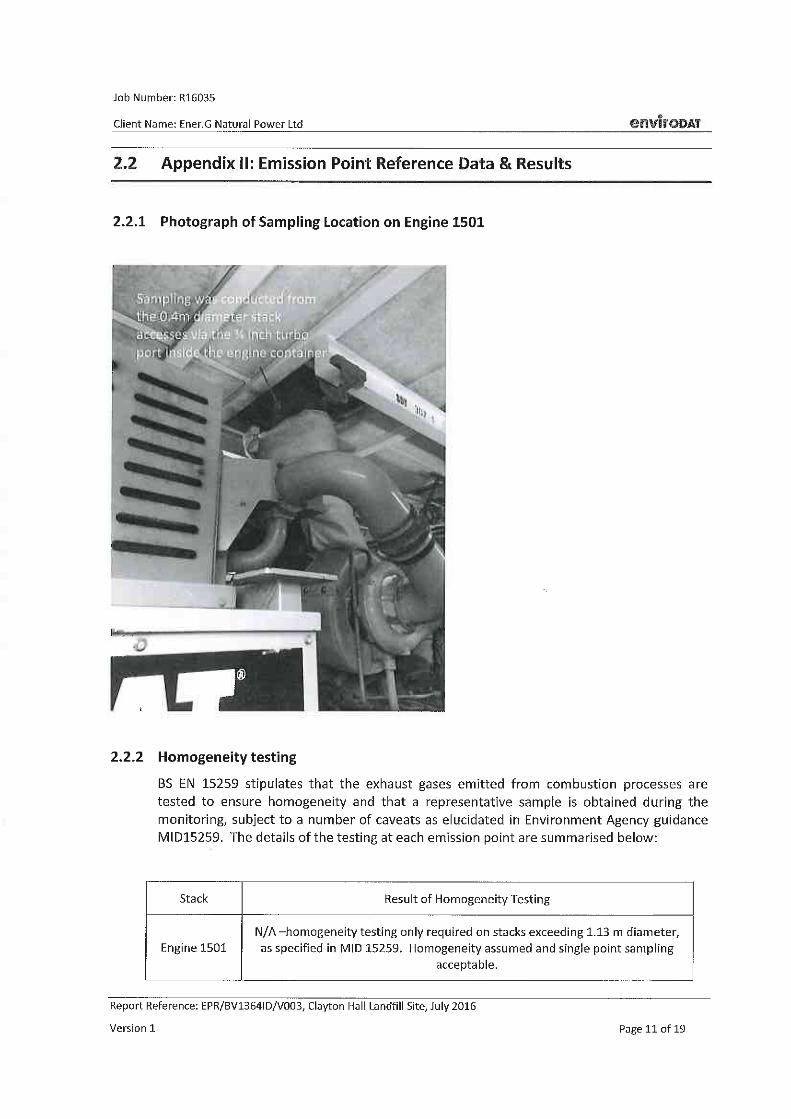
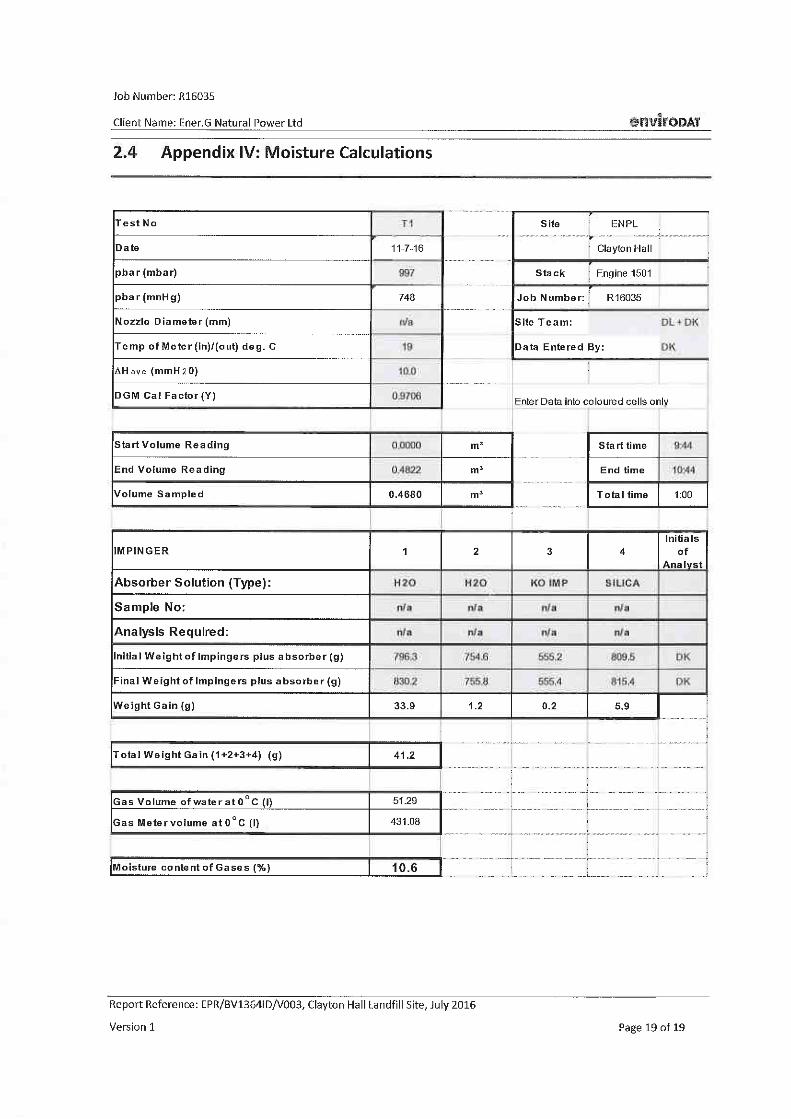
6.6.6 A sample of landfill gas from within the containment site has been collectedfor trace gas analysis. EnviroDat Limited collected a gas sample from the gasextraction system feed to the power generation unit on 11 July 2016 foranalysis.
6.6.7 The gas was first tested using field instruments and then a sample wascollected for analysis of trace gases in accordance with the EA guidance;laboratory testing was carried out by SAL Limited.
6.6.8 The field gas test results are as follows:
Methane 50.5 %Carbon Dioxide 40.8 %Oxygen 0.7 %Nitrogen 8.0 %
6.6.9 These results are consistent with the routine in waste gas monitoring resultsreported above.
Report No 08469/152 – January 2017Clayton Hall Landfill Site: Annual Performance Review (2016)
Page 22 The Arley Consulting Company Limited
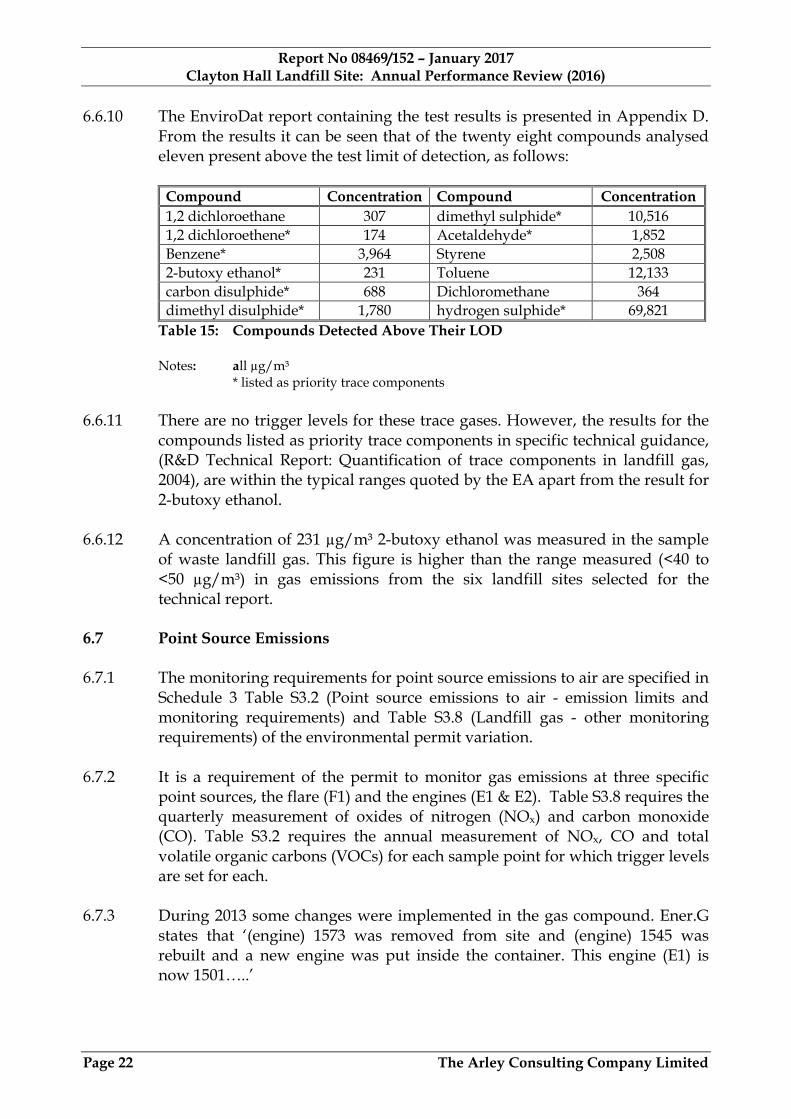
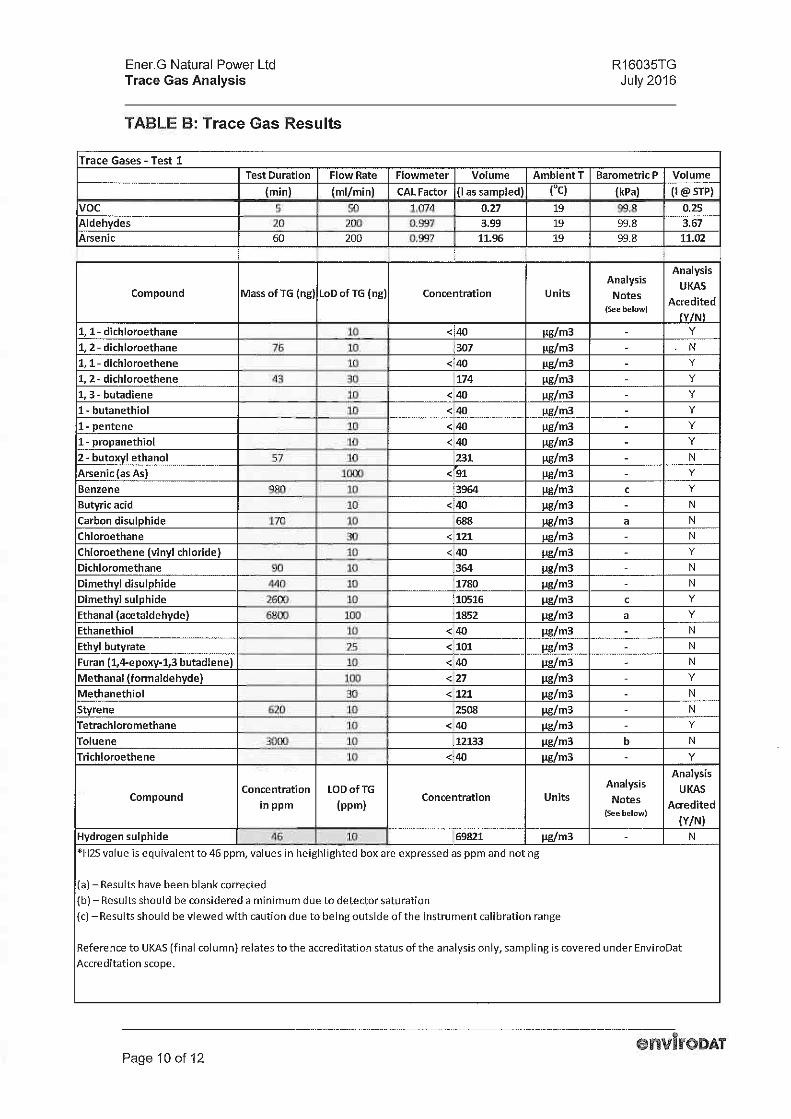
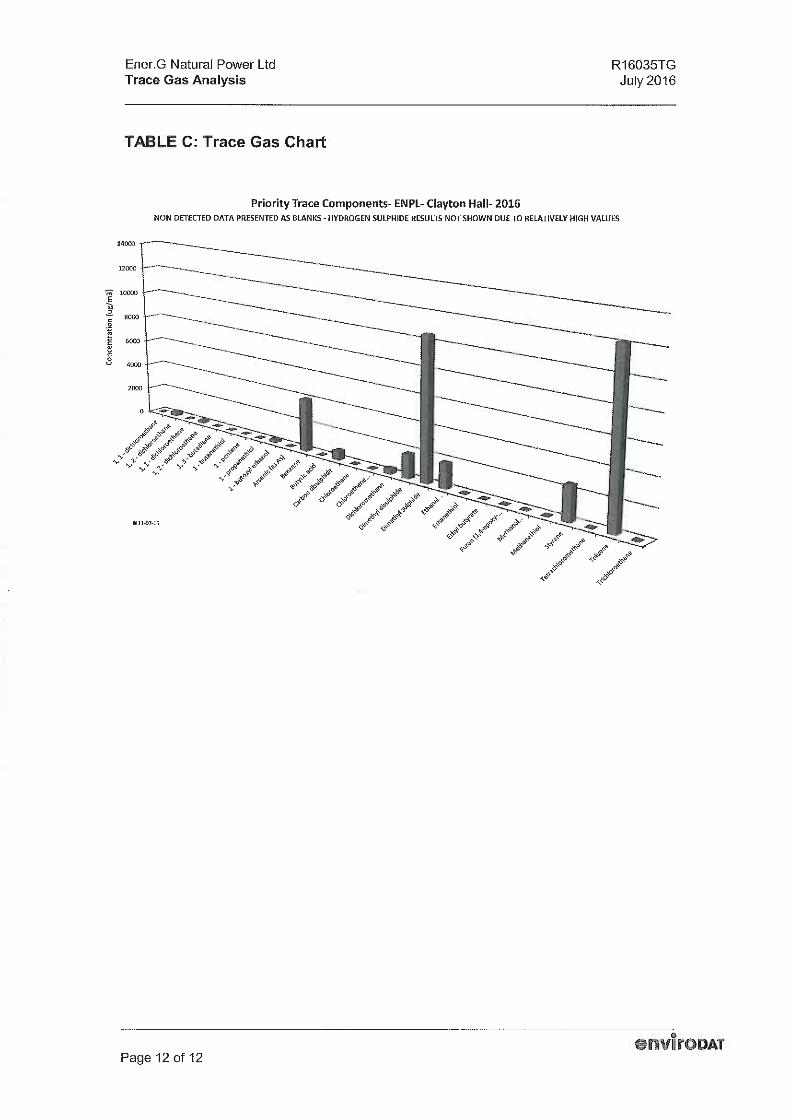
6.6.10 The EnviroDat report containing the test results is presented in Appendix D.From the results it can be seen that of the twenty eight compounds analysedeleven present above the test limit of detection, as follows:
Compound Concentration Compound Concentration
1,2 dichloroethane 307 dimethyl sulphide* 10,516
1,2 dichloroethene* 174 Acetaldehyde* 1,852
Benzene* 3,964 Styrene 2,508
2-butoxy ethanol* 231 Toluene 12,133
carbon disulphide* 688 Dichloromethane 364
dimethyl disulphide* 1,780 hydrogen sulphide* 69,821
Table 15: Compounds Detected Above Their LOD
Notes: all µg/m³
* listed as priority trace components
6.6.11 There are no trigger levels for these trace gases. However, the results for thecompounds listed as priority trace components in specific technical guidance,(R&D Technical Report: Quantification of trace components in landfill gas,2004), are within the typical ranges quoted by the EA apart from the result for2-butoxy ethanol.
6.6.12 A concentration of 231 µg/m³ 2-butoxy ethanol was measured in the sampleof waste landfill gas. This figure is higher than the range measured (<40 to<50 µg/m³) in gas emissions from the six landfill sites selected for thetechnical report.
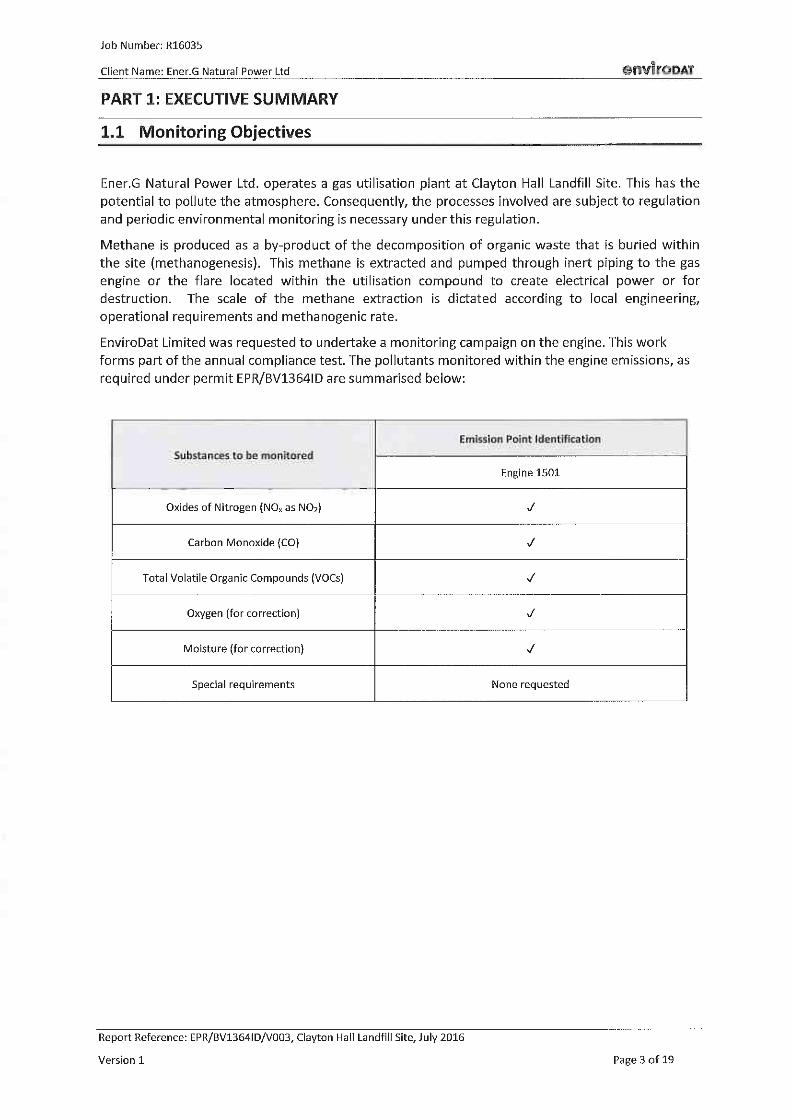
6.7 Point Source Emissions
6.7.1 The monitoring requirements for point source emissions to air are specified inSchedule 3 Table S3.2 (Point source emissions to air - emission limits andmonitoring requirements) and Table S3.8 (Landfill gas - other monitoringrequirements) of the environmental permit variation.
6.7.2 It is a requirement of the permit to monitor gas emissions at three specificpoint sources, the flare (F1) and the engines (E1 & E2). Table S3.8 requires thequarterly measurement of oxides of nitrogen (NOx) and carbon monoxide(CO). Table S3.2 requires the annual measurement of NOx, CO and totalvolatile organic carbons (VOCs) for each sample point for which trigger levelsare set for each.
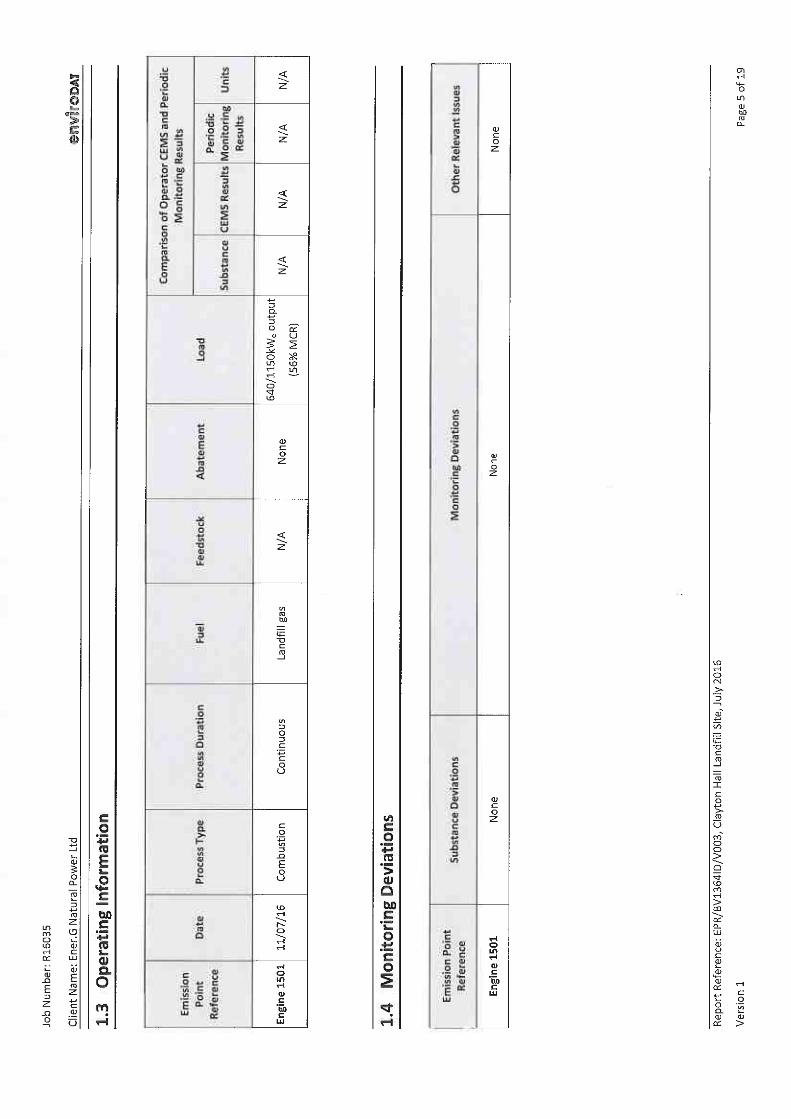
6.7.3 During 2013 some changes were implemented in the gas compound. Ener.Gstates that ‘(engine) 1573 was removed from site and (engine) 1545 wasrebuilt and a new engine was put inside the container. This engine (E1) isnow 1501…..’
Report No 08469/152 – January 2017Clayton Hall Landfill Site: Annual Performance Review (2016)
Page 23 The Arley Consulting Company Limited
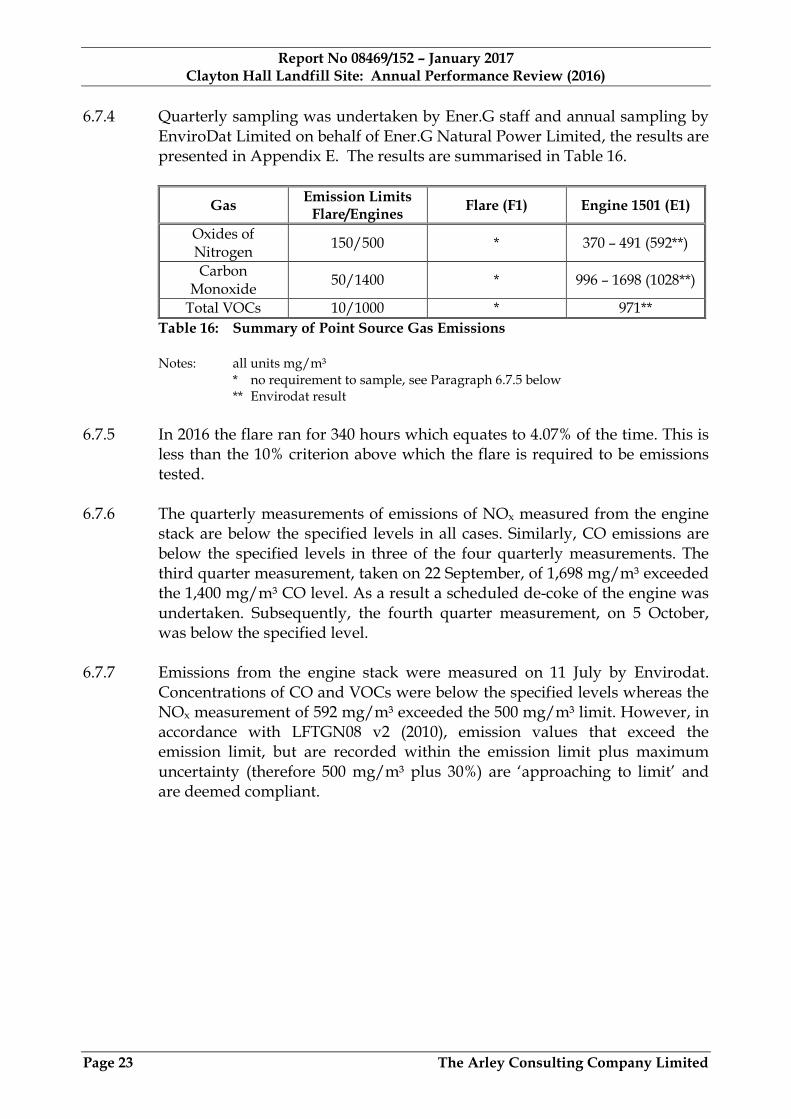
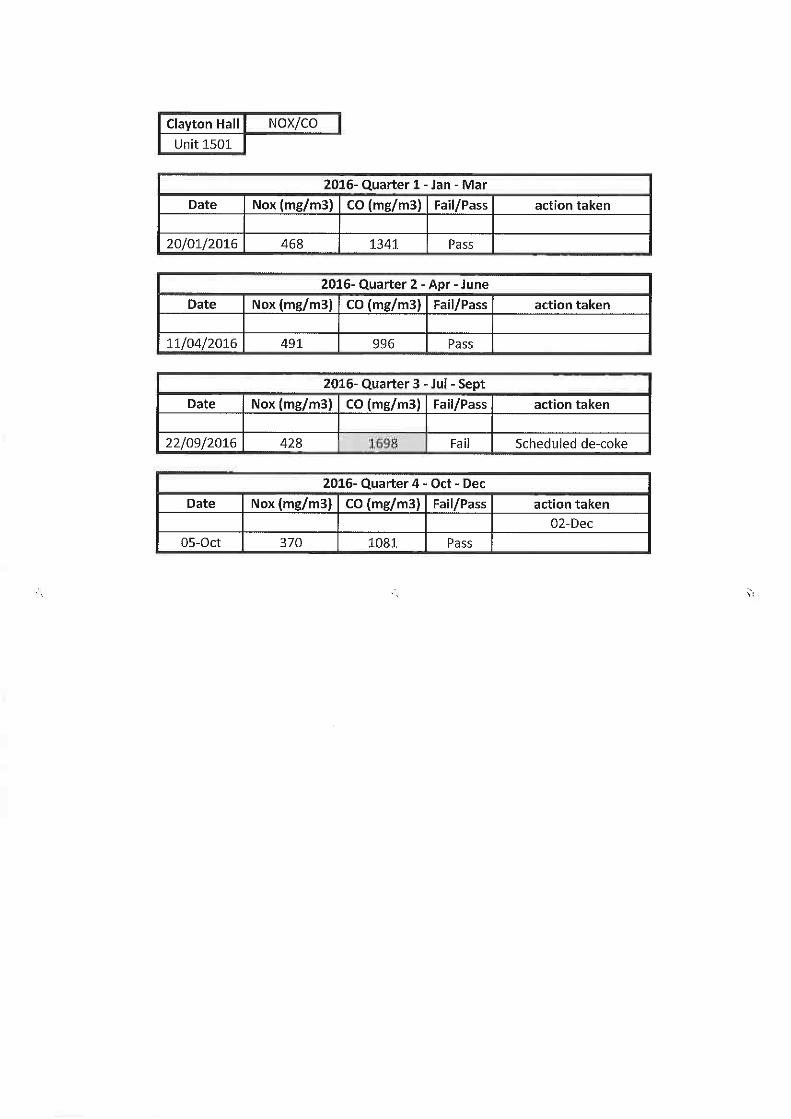
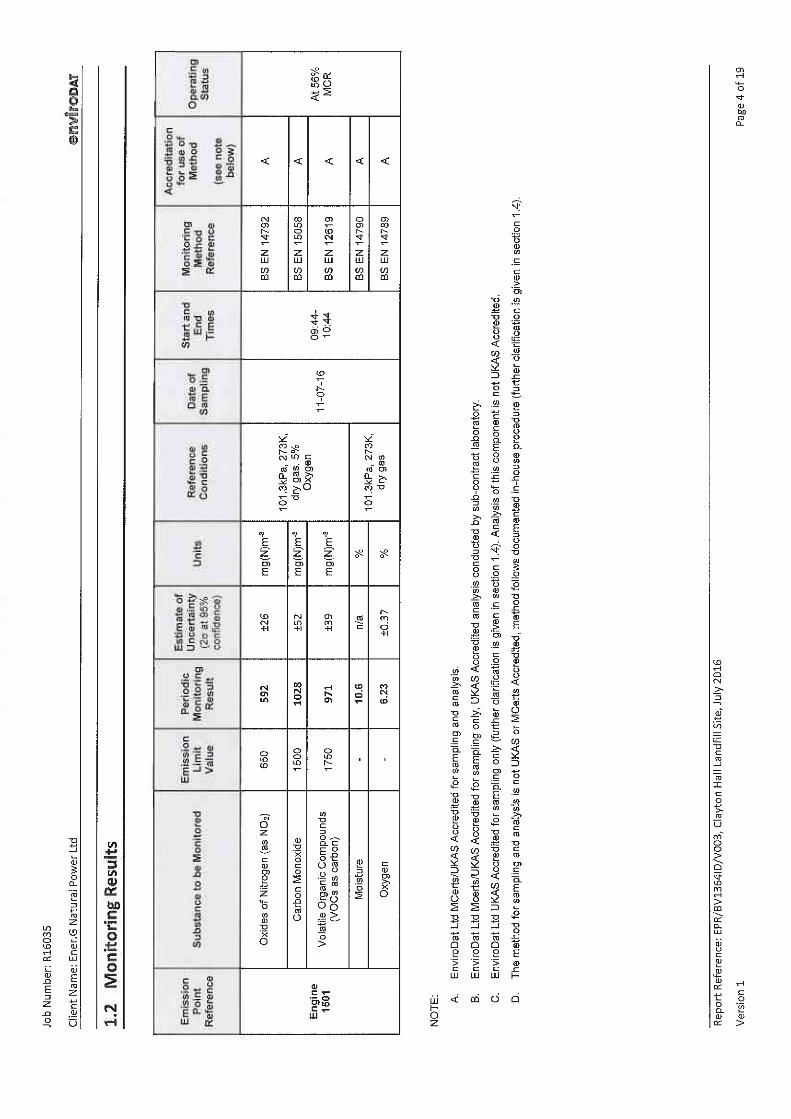
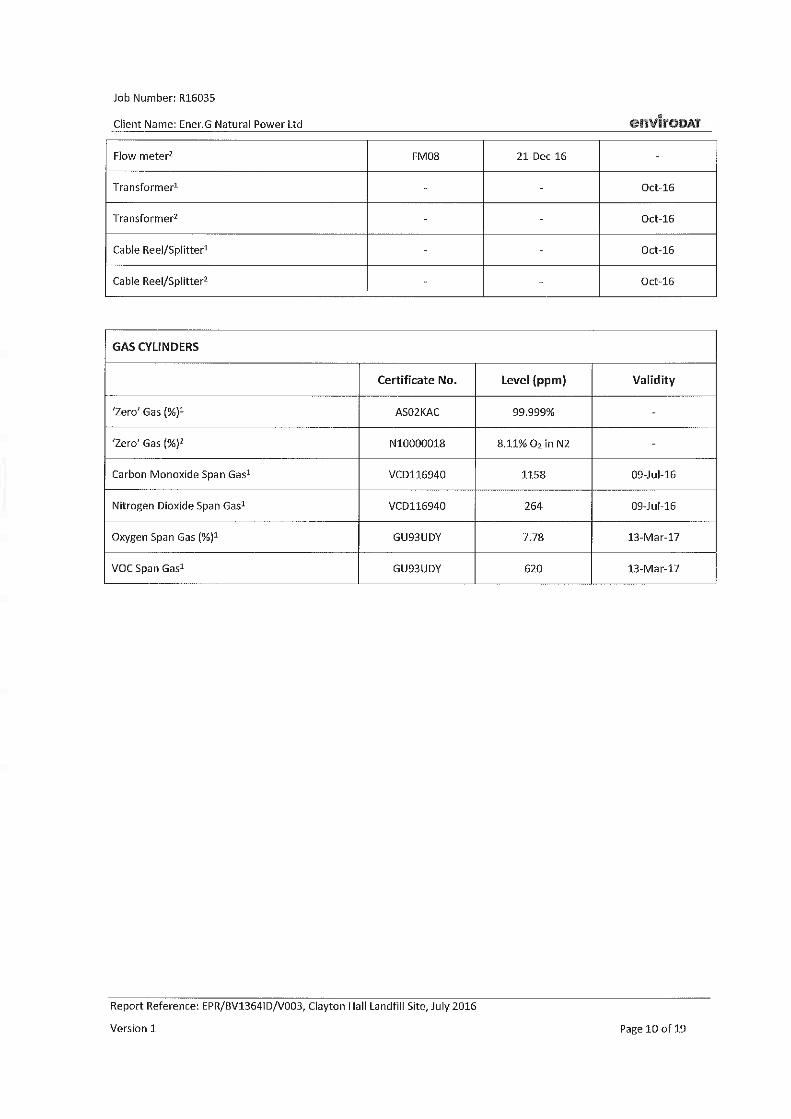
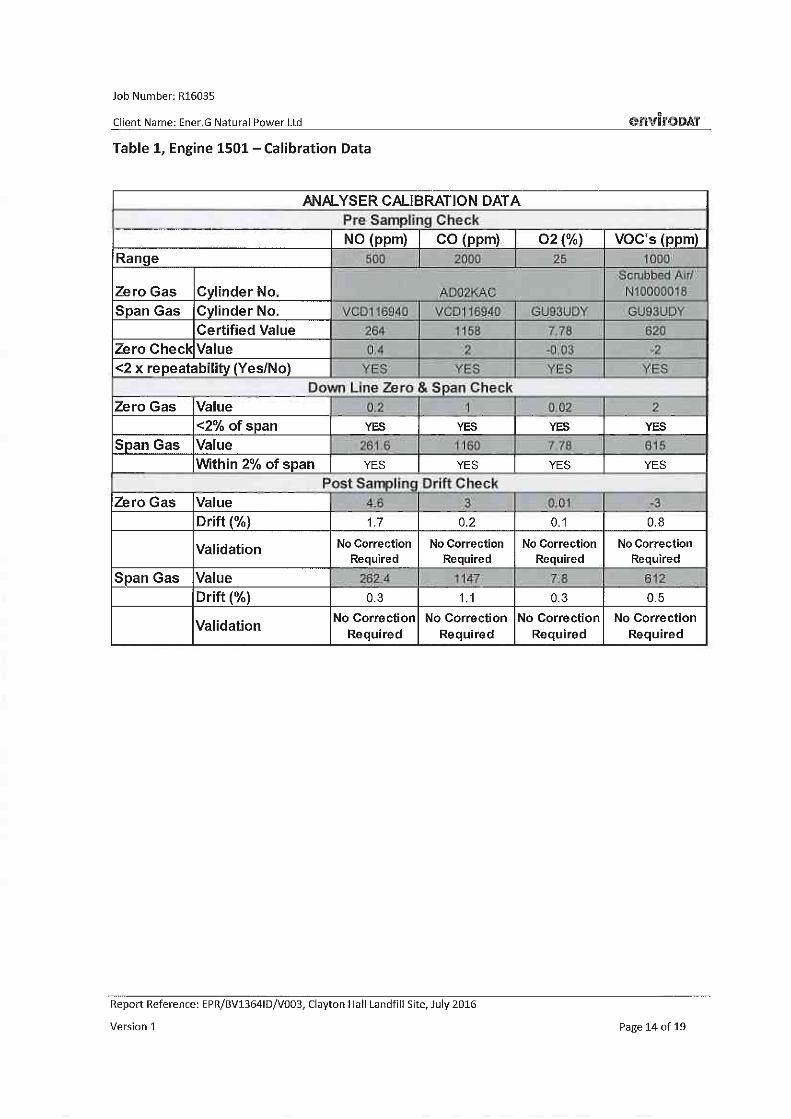
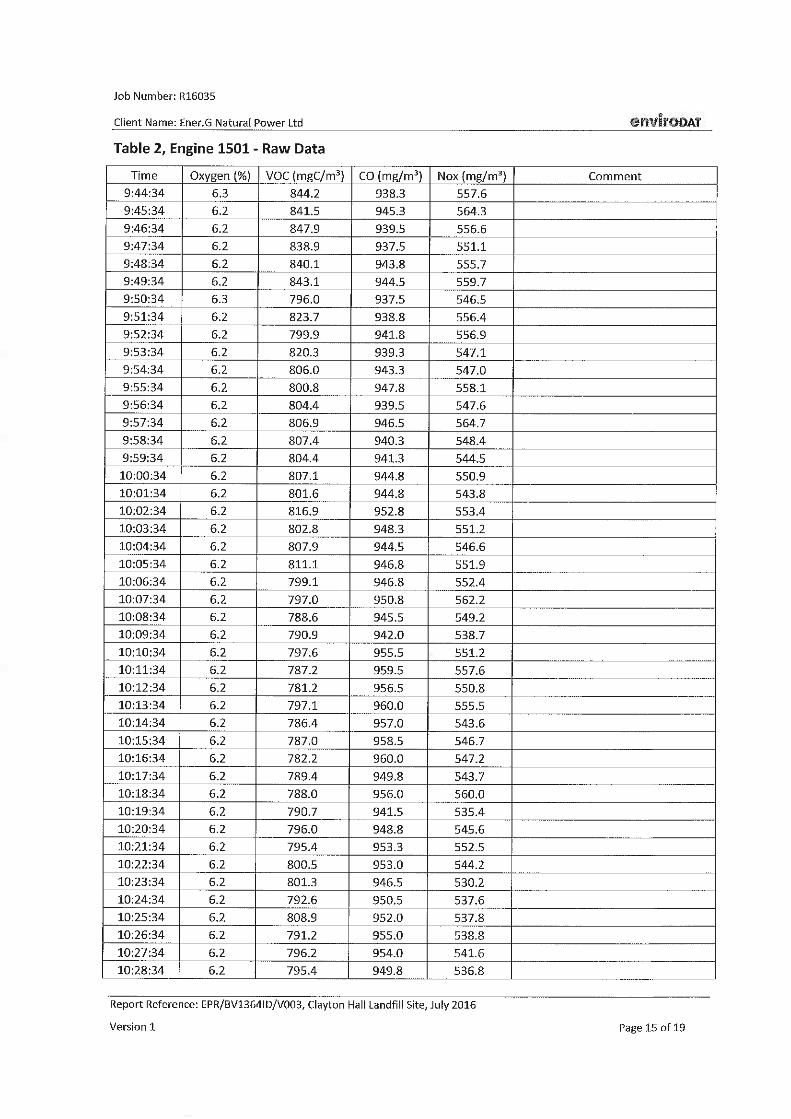
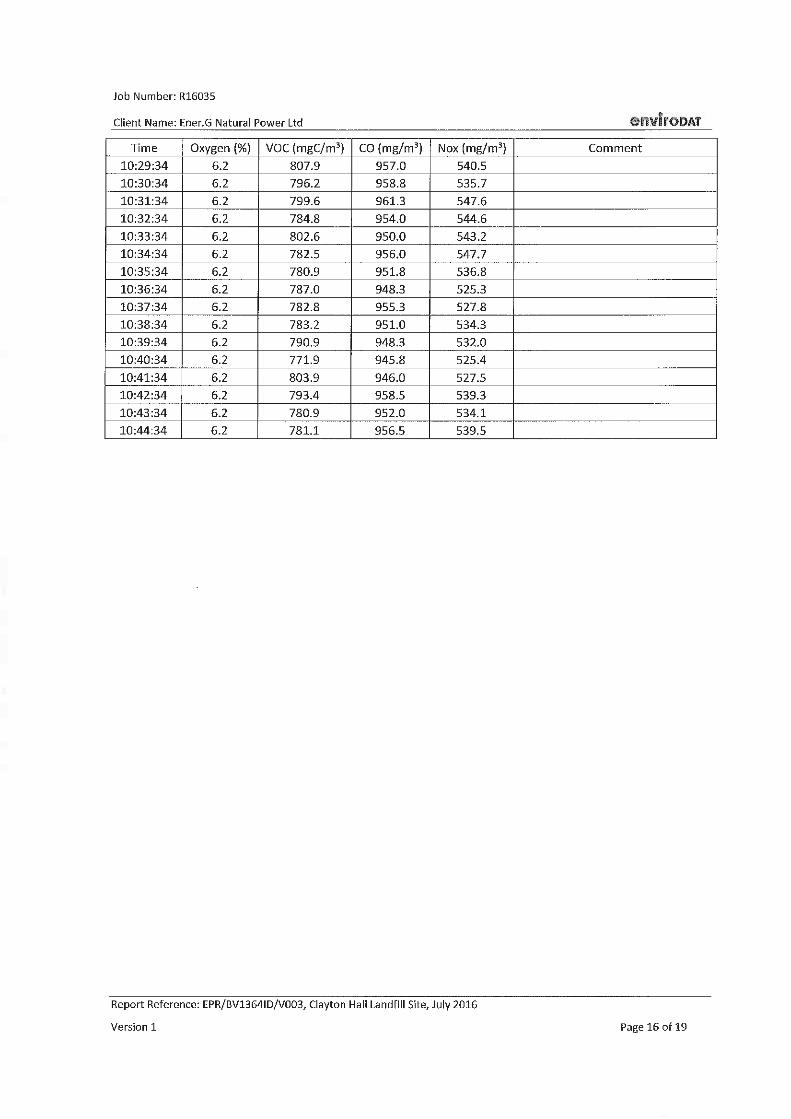
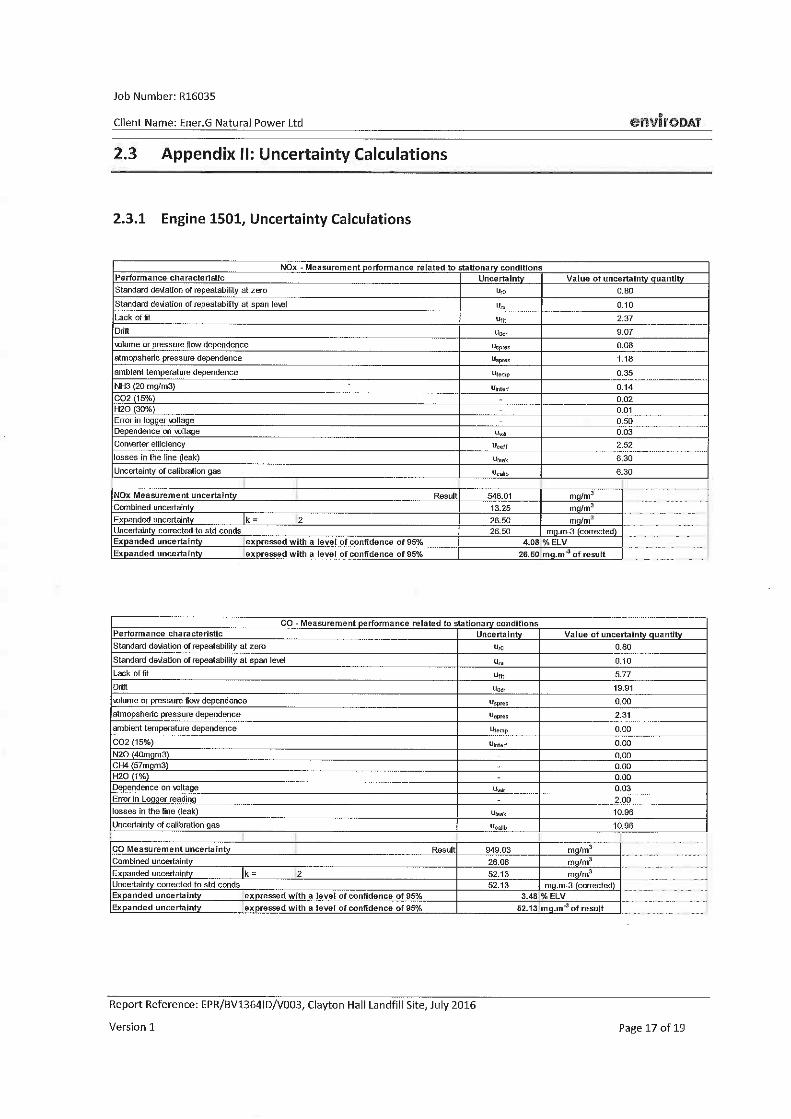
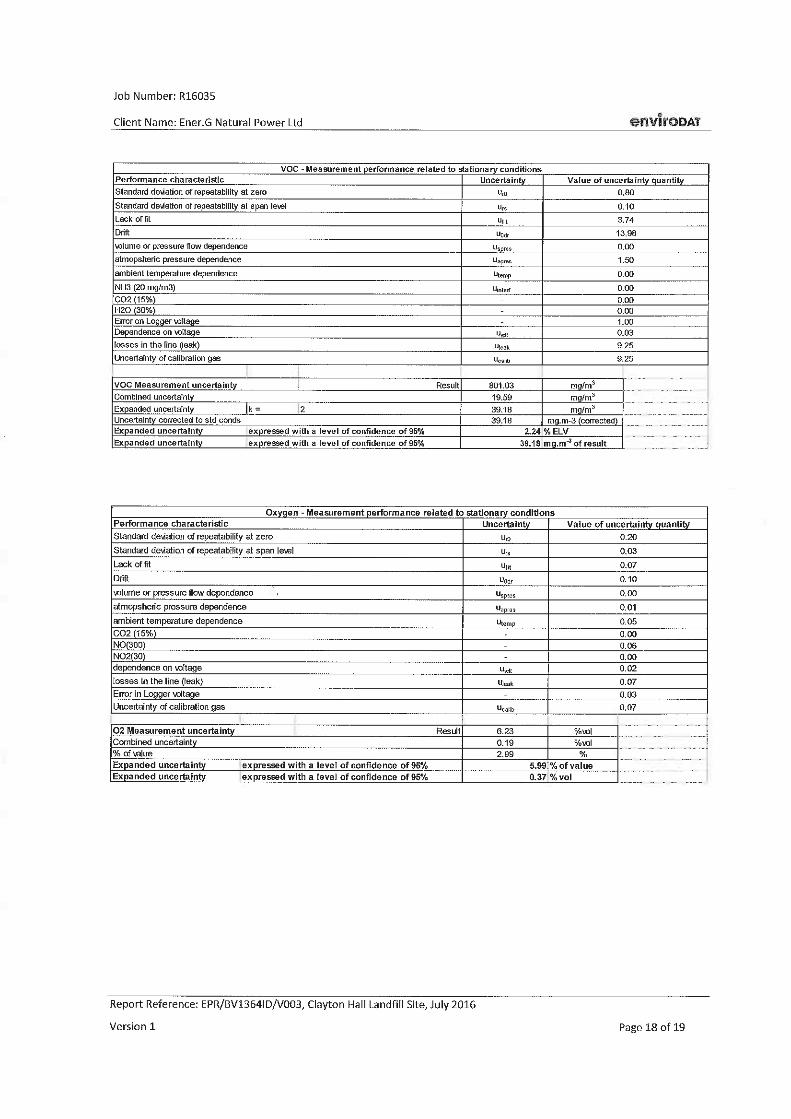
6.7.4 Quarterly sampling was undertaken by Ener.G staff and annual sampling byEnviroDat Limited on behalf of Ener.G Natural Power Limited, the results arepresented in Appendix E. The results are summarised in Table 16.
GasEmission Limits
Flare/EnginesFlare (F1) Engine 1501 (E1)
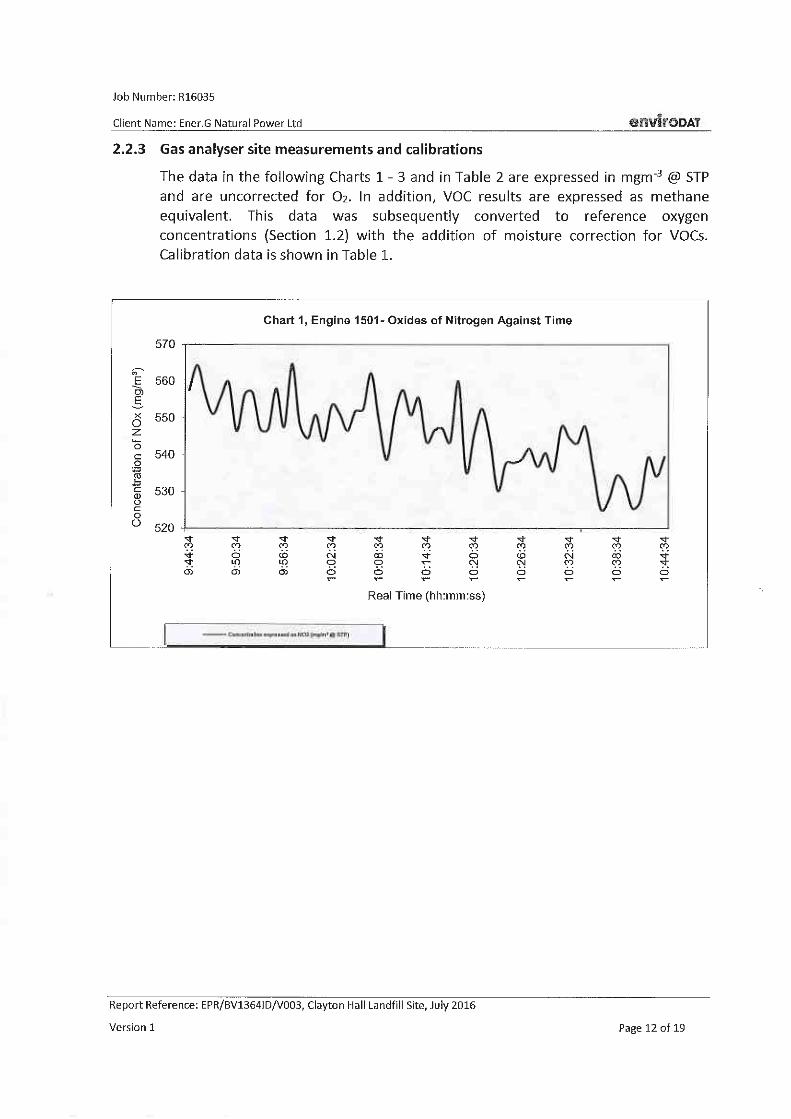
Oxides ofNitrogen
150/500 * 370 – 491 (592**)
CarbonMonoxide
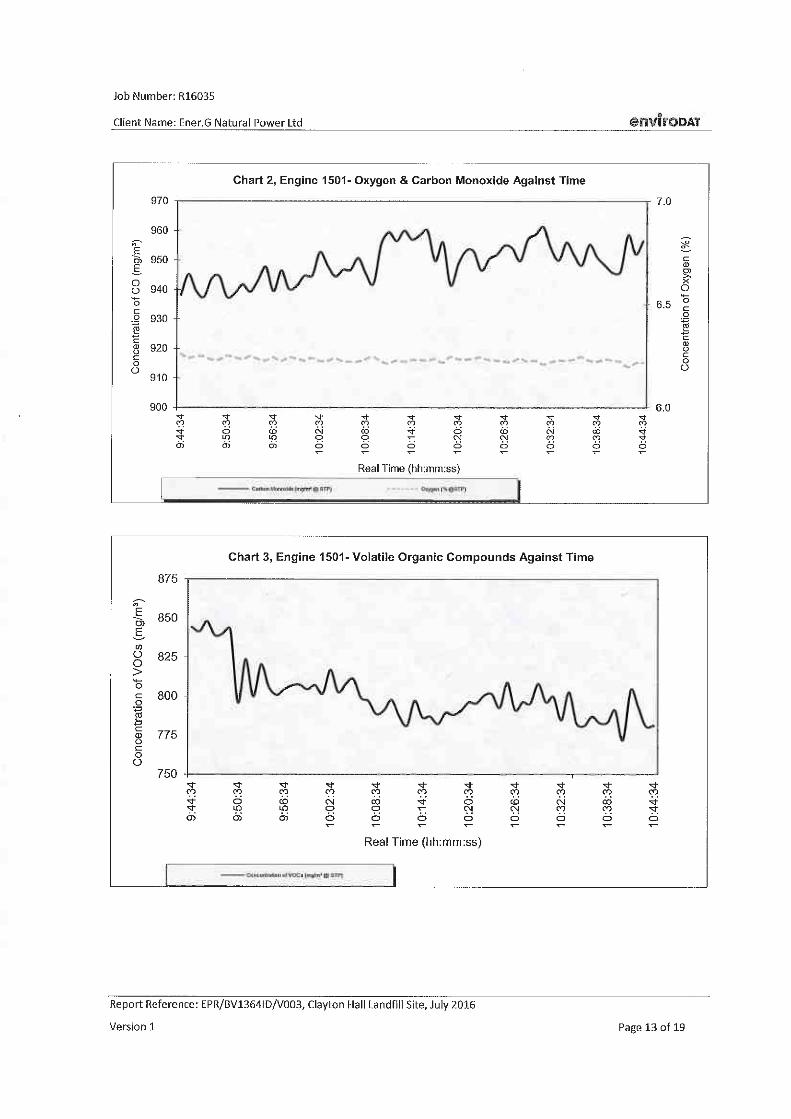
50/1400 * 996 – 1698 (1028**)
Total VOCs 10/1000 * 971**
Table 16: Summary of Point Source Gas Emissions
Notes: all units mg/m³
* no requirement to sample, see Paragraph 6.7.5 below** Envirodat result
6.7.5 In 2016 the flare ran for 340 hours which equates to 4.07% of the time. This isless than the 10% criterion above which the flare is required to be emissionstested.
6.7.6 The quarterly measurements of emissions of NOx measured from the enginestack are below the specified levels in all cases. Similarly, CO emissions arebelow the specified levels in three of the four quarterly measurements. Thethird quarter measurement, taken on 22 September, of 1,698 mg/m³ exceededthe 1,400 mg/m³ CO level. As a result a scheduled de-coke of the engine wasundertaken. Subsequently, the fourth quarter measurement, on 5 October,was below the specified level.
6.7.7 Emissions from the engine stack were measured on 11 July by Envirodat.Concentrations of CO and VOCs were below the specified levels whereas theNOx measurement of 592 mg/m³ exceeded the 500 mg/m³ limit. However, inaccordance with LFTGN08 v2 (2010), emission values that exceed theemission limit, but are recorded within the emission limit plus maximumuncertainty (therefore 500 mg/m³ plus 30%) are ‘approaching to limit’ andare deemed compliant.
Report No 08469/152 – January 2017Clayton Hall Landfill Site: Annual Performance Review (2016)
Page 24 The Arley Consulting Company Limited
7. AMENITY MANAGEMENT
7.1 Weather
7.1.1 There is a weather station at the site and the following information isrecorded daily:
• Temperature• Rainfall• Wind Speed• Wind Direction• Atmospheric Pressure
7.1.2 Weather records are presented in reports already submitted to the EA.
7.1.3 Service and calibration records are held on site.
7.1.4 The total rainfall measured for the year is 1332.6 mm.
7.2 Daily Environmental Inspections
7.2.1 Quercia undertakes daily inspections at eight specified locations (ReferencePoints N1 to N8). Owing to a changeover of staff at the site and oversight, nodaily environmental monitoring forms were completed for January andFebruary. Similarly, none were completed for the period between 14 July and31 July owing to management and staffing issues.
7.2.2 Quercia considers the following amenity issues at locations N1 to N6; locationN7 is assessed for litter and odour only; location N8 is assessed for odour andnoise only:
• Dust• Litter• Odour• Birds & Vermin• Flies & Insects• Noise
7.2.3 In addition Quercia also inspect locations N1 and N7 for dirt on the road.
Report No 08469/152 – January 2017Clayton Hall Landfill Site: Annual Performance Review (2016)
Page 25 The Arley Consulting Company Limited
7.2.4 The inspections proved conditions to be satisfactory at the specified locationsapart from on a small number of occasions when litter (fifteen instances),odour (twenty occasions), and noise (two dates) were considered to be anissue & corrective action was taken. The inspection records are presented inreports already submitted to the EA. Further details are presented in thefollowing sections.
7.3 Dust
7.3.1 No complaints relating to dust were received during 2016.
7.4 Litter
7.4.1 No complaints relating to litter were received during 2016.
7.5 Odour
7.5.1 There have been thirteen odour complaints during 2016, all occurring in thefirst quarter. These are discussed in TACCL Quarterly Monitoring Report No08469/141 (January – March 2016).
7.5.2 Each odour complaint received has instigated scrutiny of landfill operations,good working practice and weather conditions that may have beenresponsible for the complaint.
7.5.3 The complaints have been investigated and action taken where appropriate;details are presented in Appendix J of the relevant monitoring reports alreadysubmitted to the EA.
7.6 Birds, Vermin, Insects & Flies
7.6.1 No complaints were received during 2016.
7.7 Noise
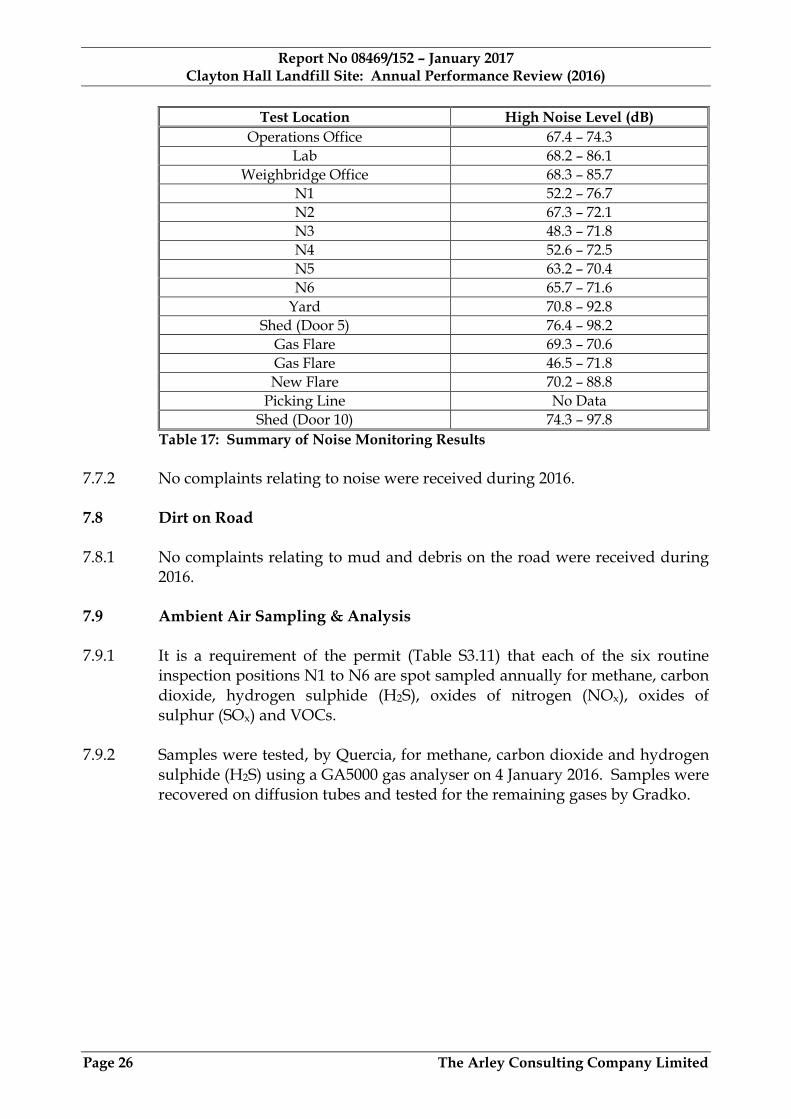
7.7.1 Noise monitoring is undertaken on a monthly basis and results are presentedin reports already submitted to the EA. No noise monitoring data is availablefor January & February owing to a changeover of staff at the site andoversight. The measured noise level at the test locations are summarised inTable 17.
Report No 08469/152 – January 2017Clayton Hall Landfill Site: Annual Performance Review (2016)
Page 26 The Arley Consulting Company Limited
Test Location High Noise Level (dB)
Operations Office 67.4 – 74.3
Lab 68.2 – 86.1
Weighbridge Office 68.3 – 85.7
N1 52.2 – 76.7
N2 67.3 – 72.1
N3 48.3 – 71.8
N4 52.6 – 72.5
N5 63.2 – 70.4
N6 65.7 – 71.6
Yard 70.8 – 92.8
Shed (Door 5) 76.4 – 98.2
Gas Flare 69.3 – 70.6
Gas Flare 46.5 – 71.8
New Flare 70.2 – 88.8
Picking Line No Data
Shed (Door 10) 74.3 – 97.8
Table 17: Summary of Noise Monitoring Results
7.7.2 No complaints relating to noise were received during 2016.
7.8 Dirt on Road
7.8.1 No complaints relating to mud and debris on the road were received during2016.
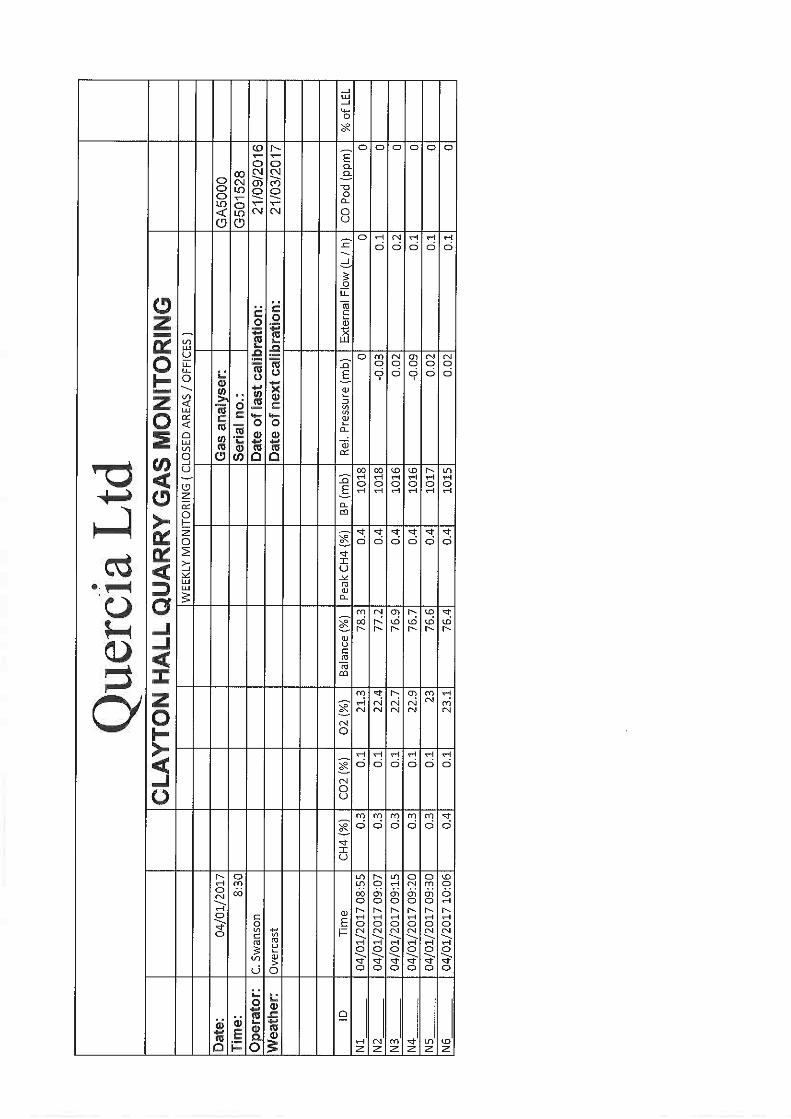
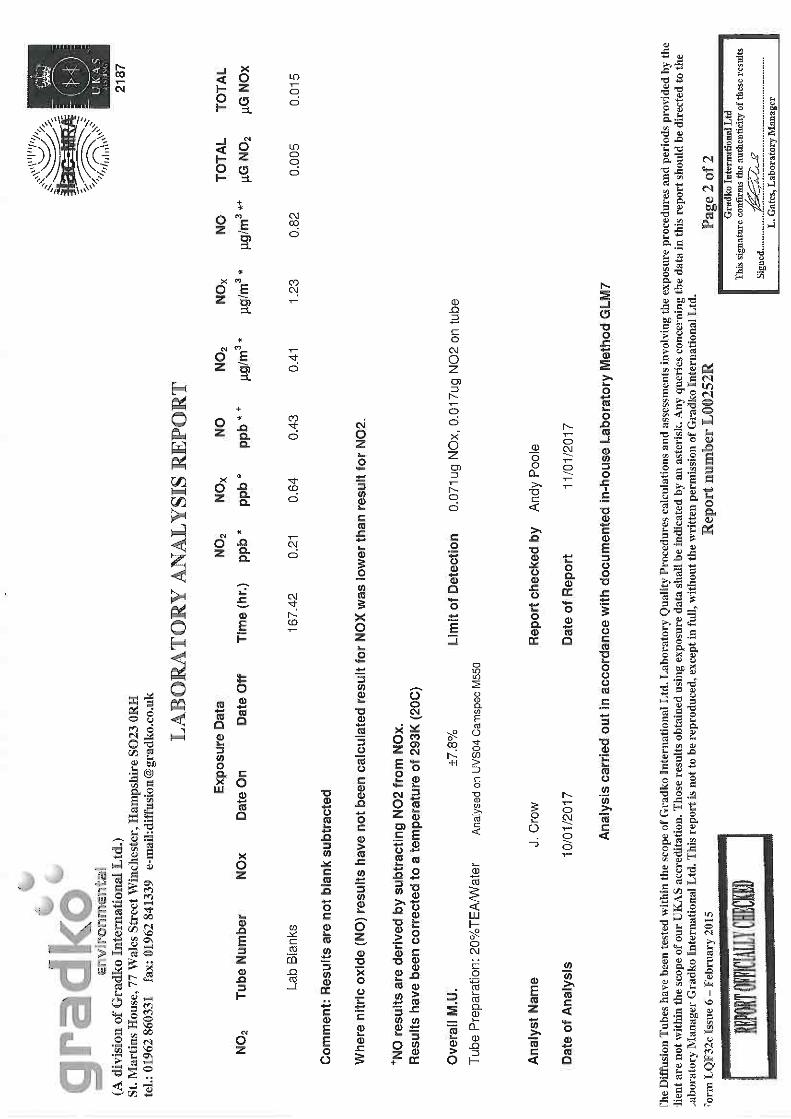
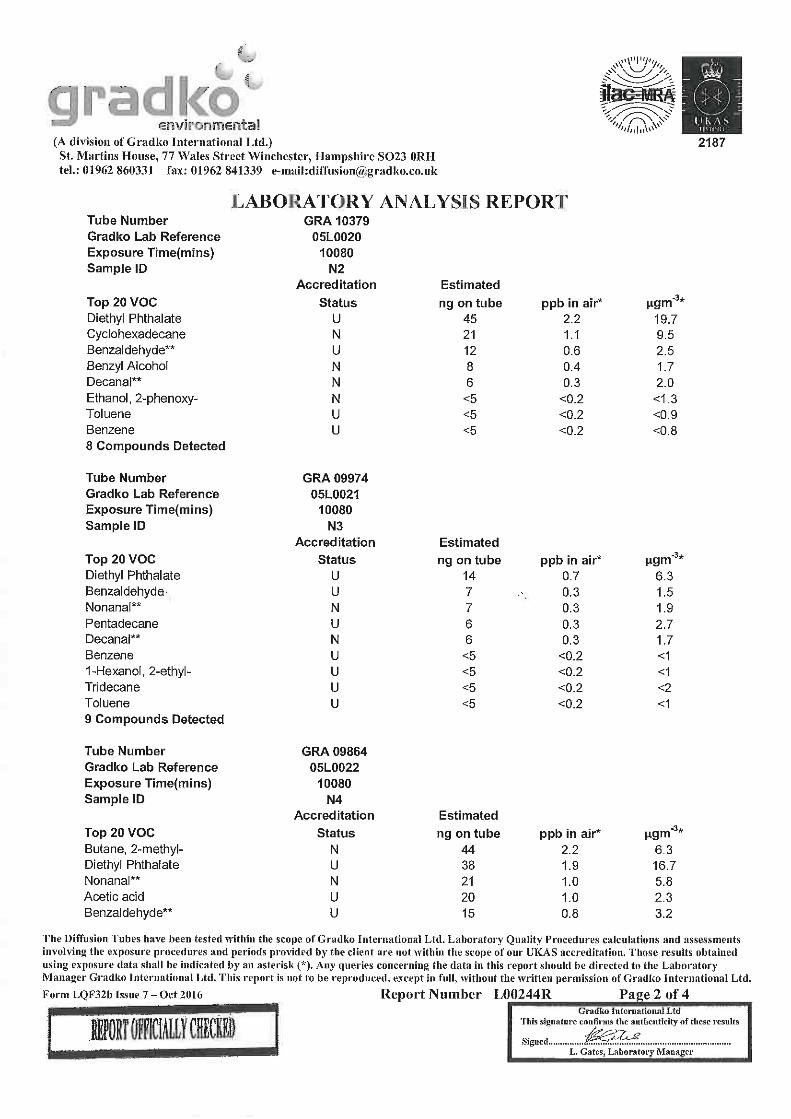
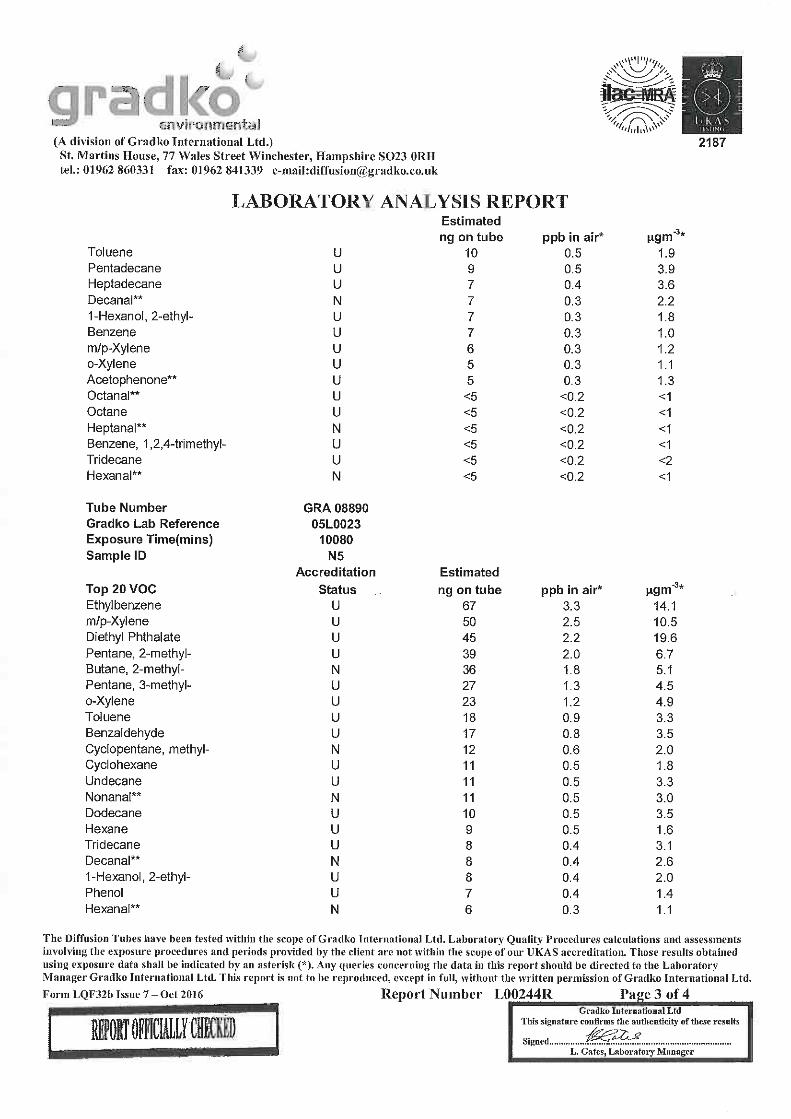
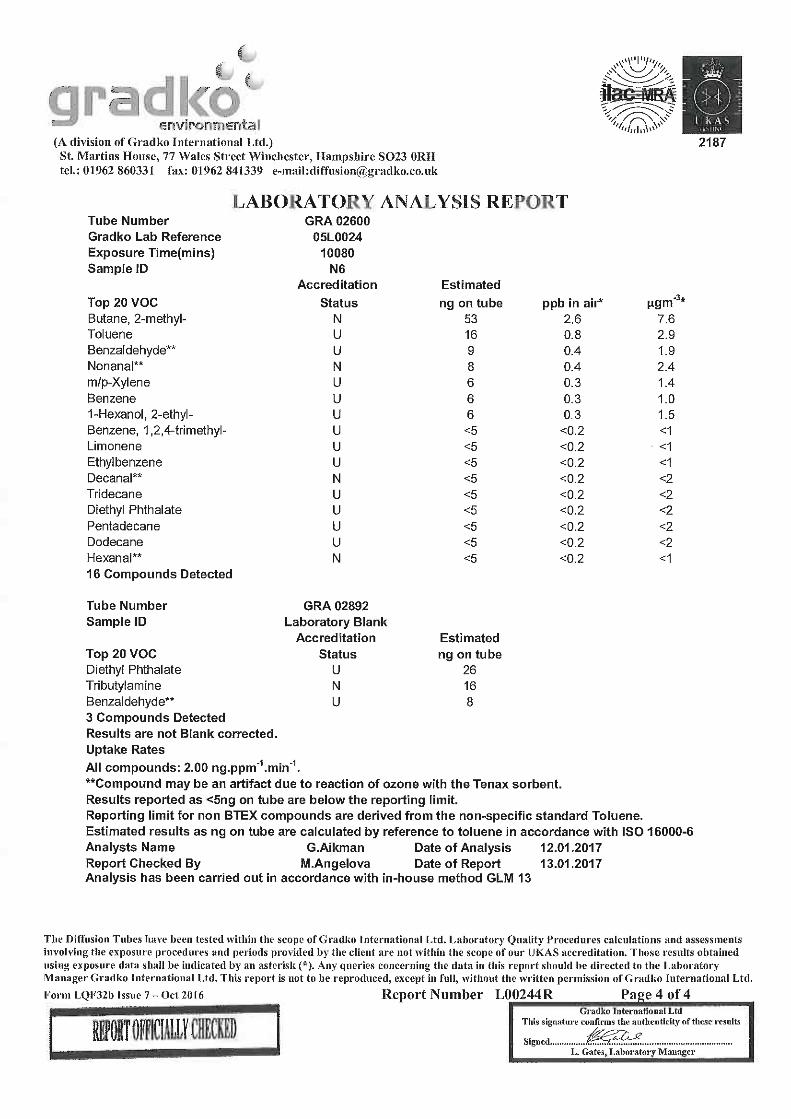
7.9 Ambient Air Sampling & Analysis
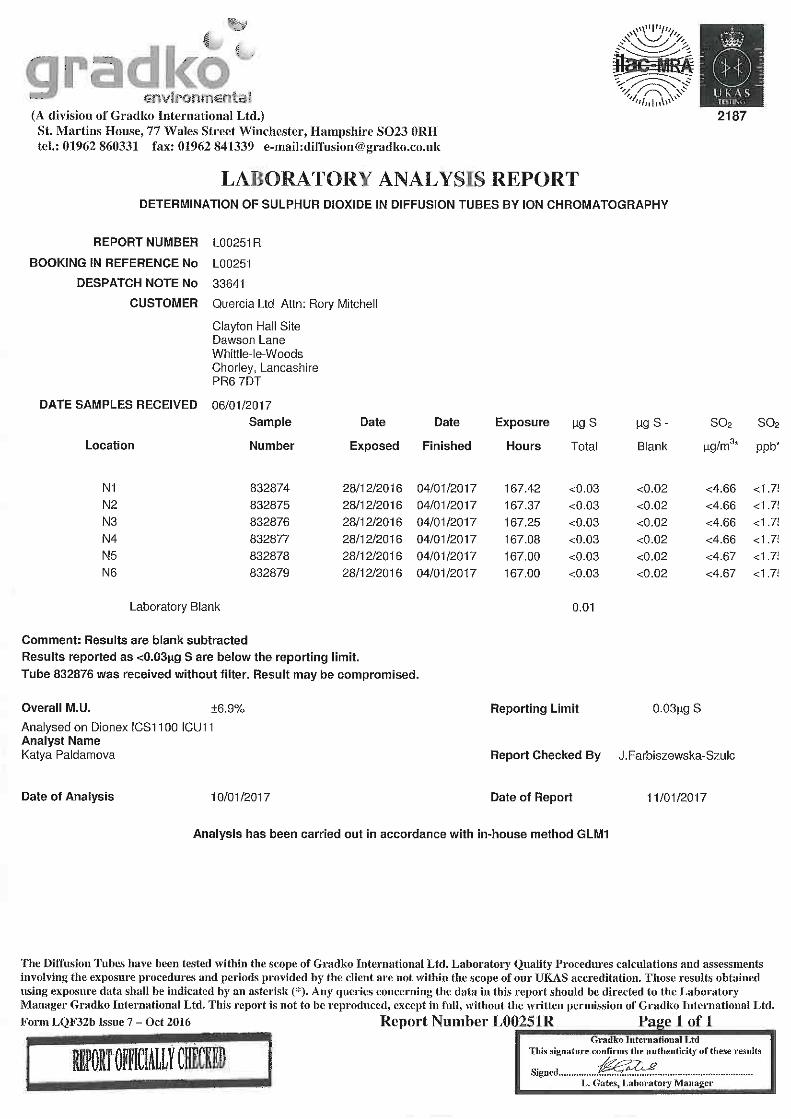
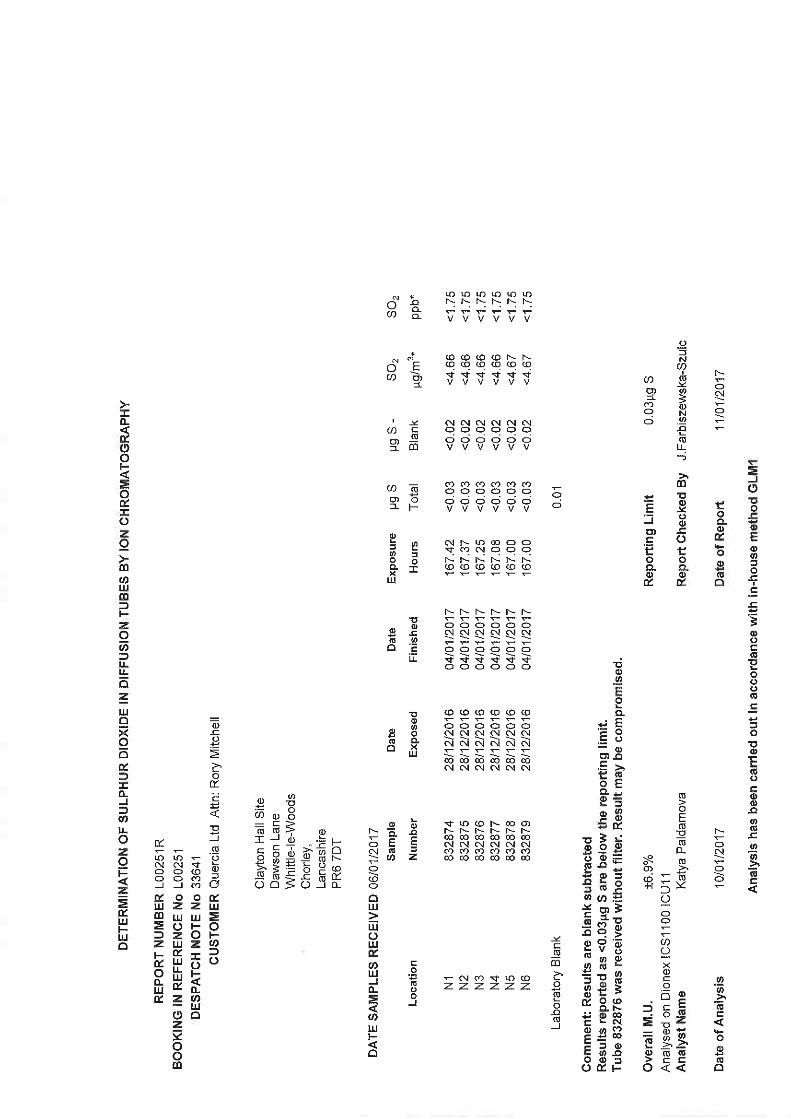
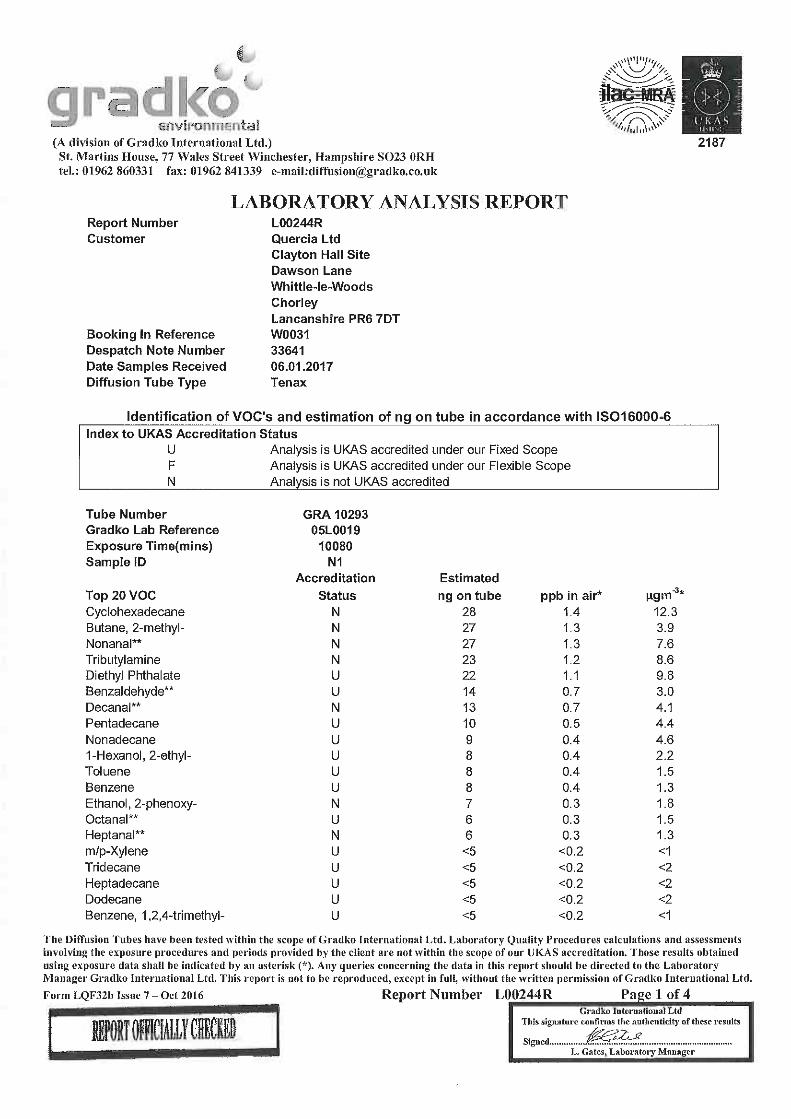
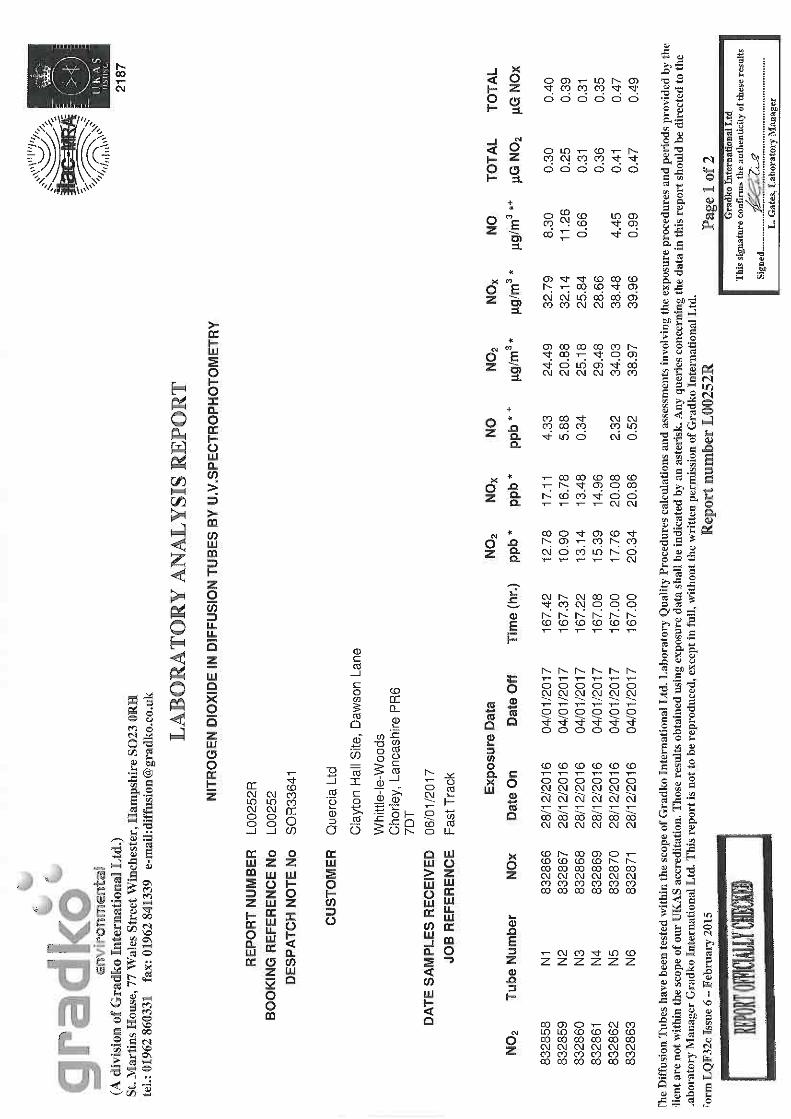
7.9.1 It is a requirement of the permit (Table S3.11) that each of the six routineinspection positions N1 to N6 are spot sampled annually for methane, carbondioxide, hydrogen sulphide (H2S), oxides of nitrogen (NOx), oxides ofsulphur (SOx) and VOCs.
7.9.2 Samples were tested, by Quercia, for methane, carbon dioxide and hydrogensulphide (H2S) using a GA5000 gas analyser on 4 January 2016. Samples wererecovered on diffusion tubes and tested for the remaining gases by Gradko.
Report No 08469/152 – January 2017Clayton Hall Landfill Site: Annual Performance Review (2016)
Page 27 The Arley Consulting Company Limited
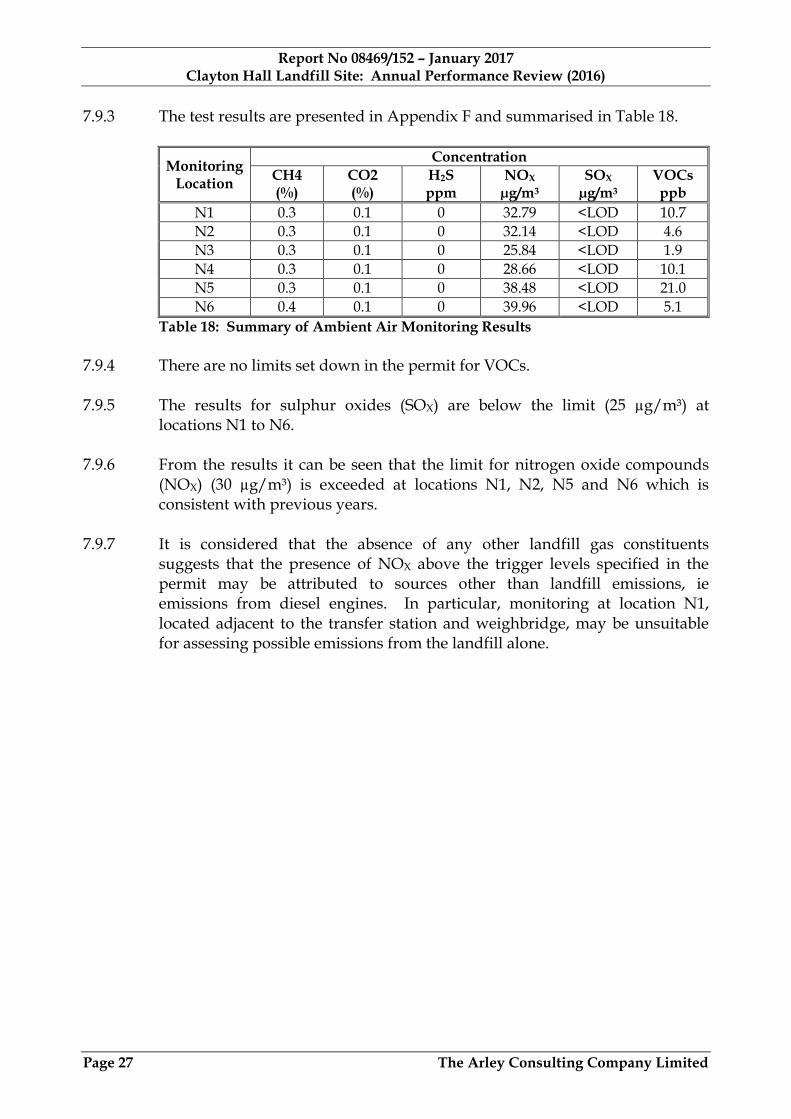
7.9.3 The test results are presented in Appendix F and summarised in Table 18.
MonitoringLocation
Concentration
CH4(%)
CO2(%)
H2Sppm
NOX
µg/m3
SOX
µg/m3
VOCsppb
N1 0.3 0.1 0 32.79 <LOD 10.7
N2 0.3 0.1 0 32.14 <LOD 4.6
N3 0.3 0.1 0 25.84 <LOD 1.9
N4 0.3 0.1 0 28.66 <LOD 10.1
N5 0.3 0.1 0 38.48 <LOD 21.0
N6 0.4 0.1 0 39.96 <LOD 5.1
Table 18: Summary of Ambient Air Monitoring Results
7.9.4 There are no limits set down in the permit for VOCs.
7.9.5 The results for sulphur oxides (SOX) are below the limit (25 µg/m³) atlocations N1 to N6.
7.9.6 From the results it can be seen that the limit for nitrogen oxide compounds(NOX) (30 µg/m³) is exceeded at locations N1, N2, N5 and N6 which isconsistent with previous years.
7.9.7 It is considered that the absence of any other landfill gas constituentssuggests that the presence of NOX above the trigger levels specified in thepermit may be attributed to sources other than landfill emissions, ieemissions from diesel engines. In particular, monitoring at location N1,located adjacent to the transfer station and weighbridge, may be unsuitablefor assessing possible emissions from the landfill alone.
Report No 08469/152 – January 2017Clayton Hall Landfill Site: Annual Performance Review (2016)
Page 28 The Arley Consulting Company Limited
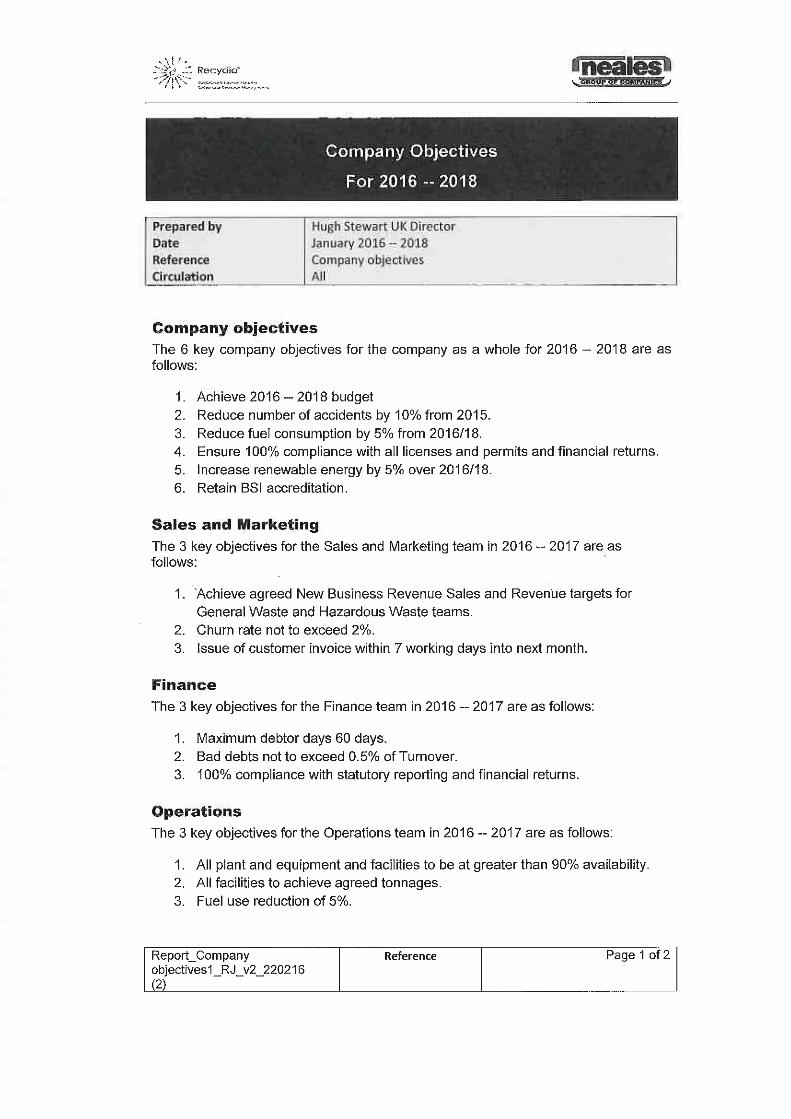
8. ANNUAL IMPROVEMENT TARGETS
8.1 Neales Waste Management sets objectives and targets for Quercia as part ofan integrated management system.
8.2 The company objectives for 2016 - 2018 are presented in Appendix G.
Report No 08469/152 – January 2017Clayton Hall Landfill Site: Annual Performance Review (2016)
Page 29 The Arley Consulting Company Limited
9. TOPOGRAPHIC SURVEYS
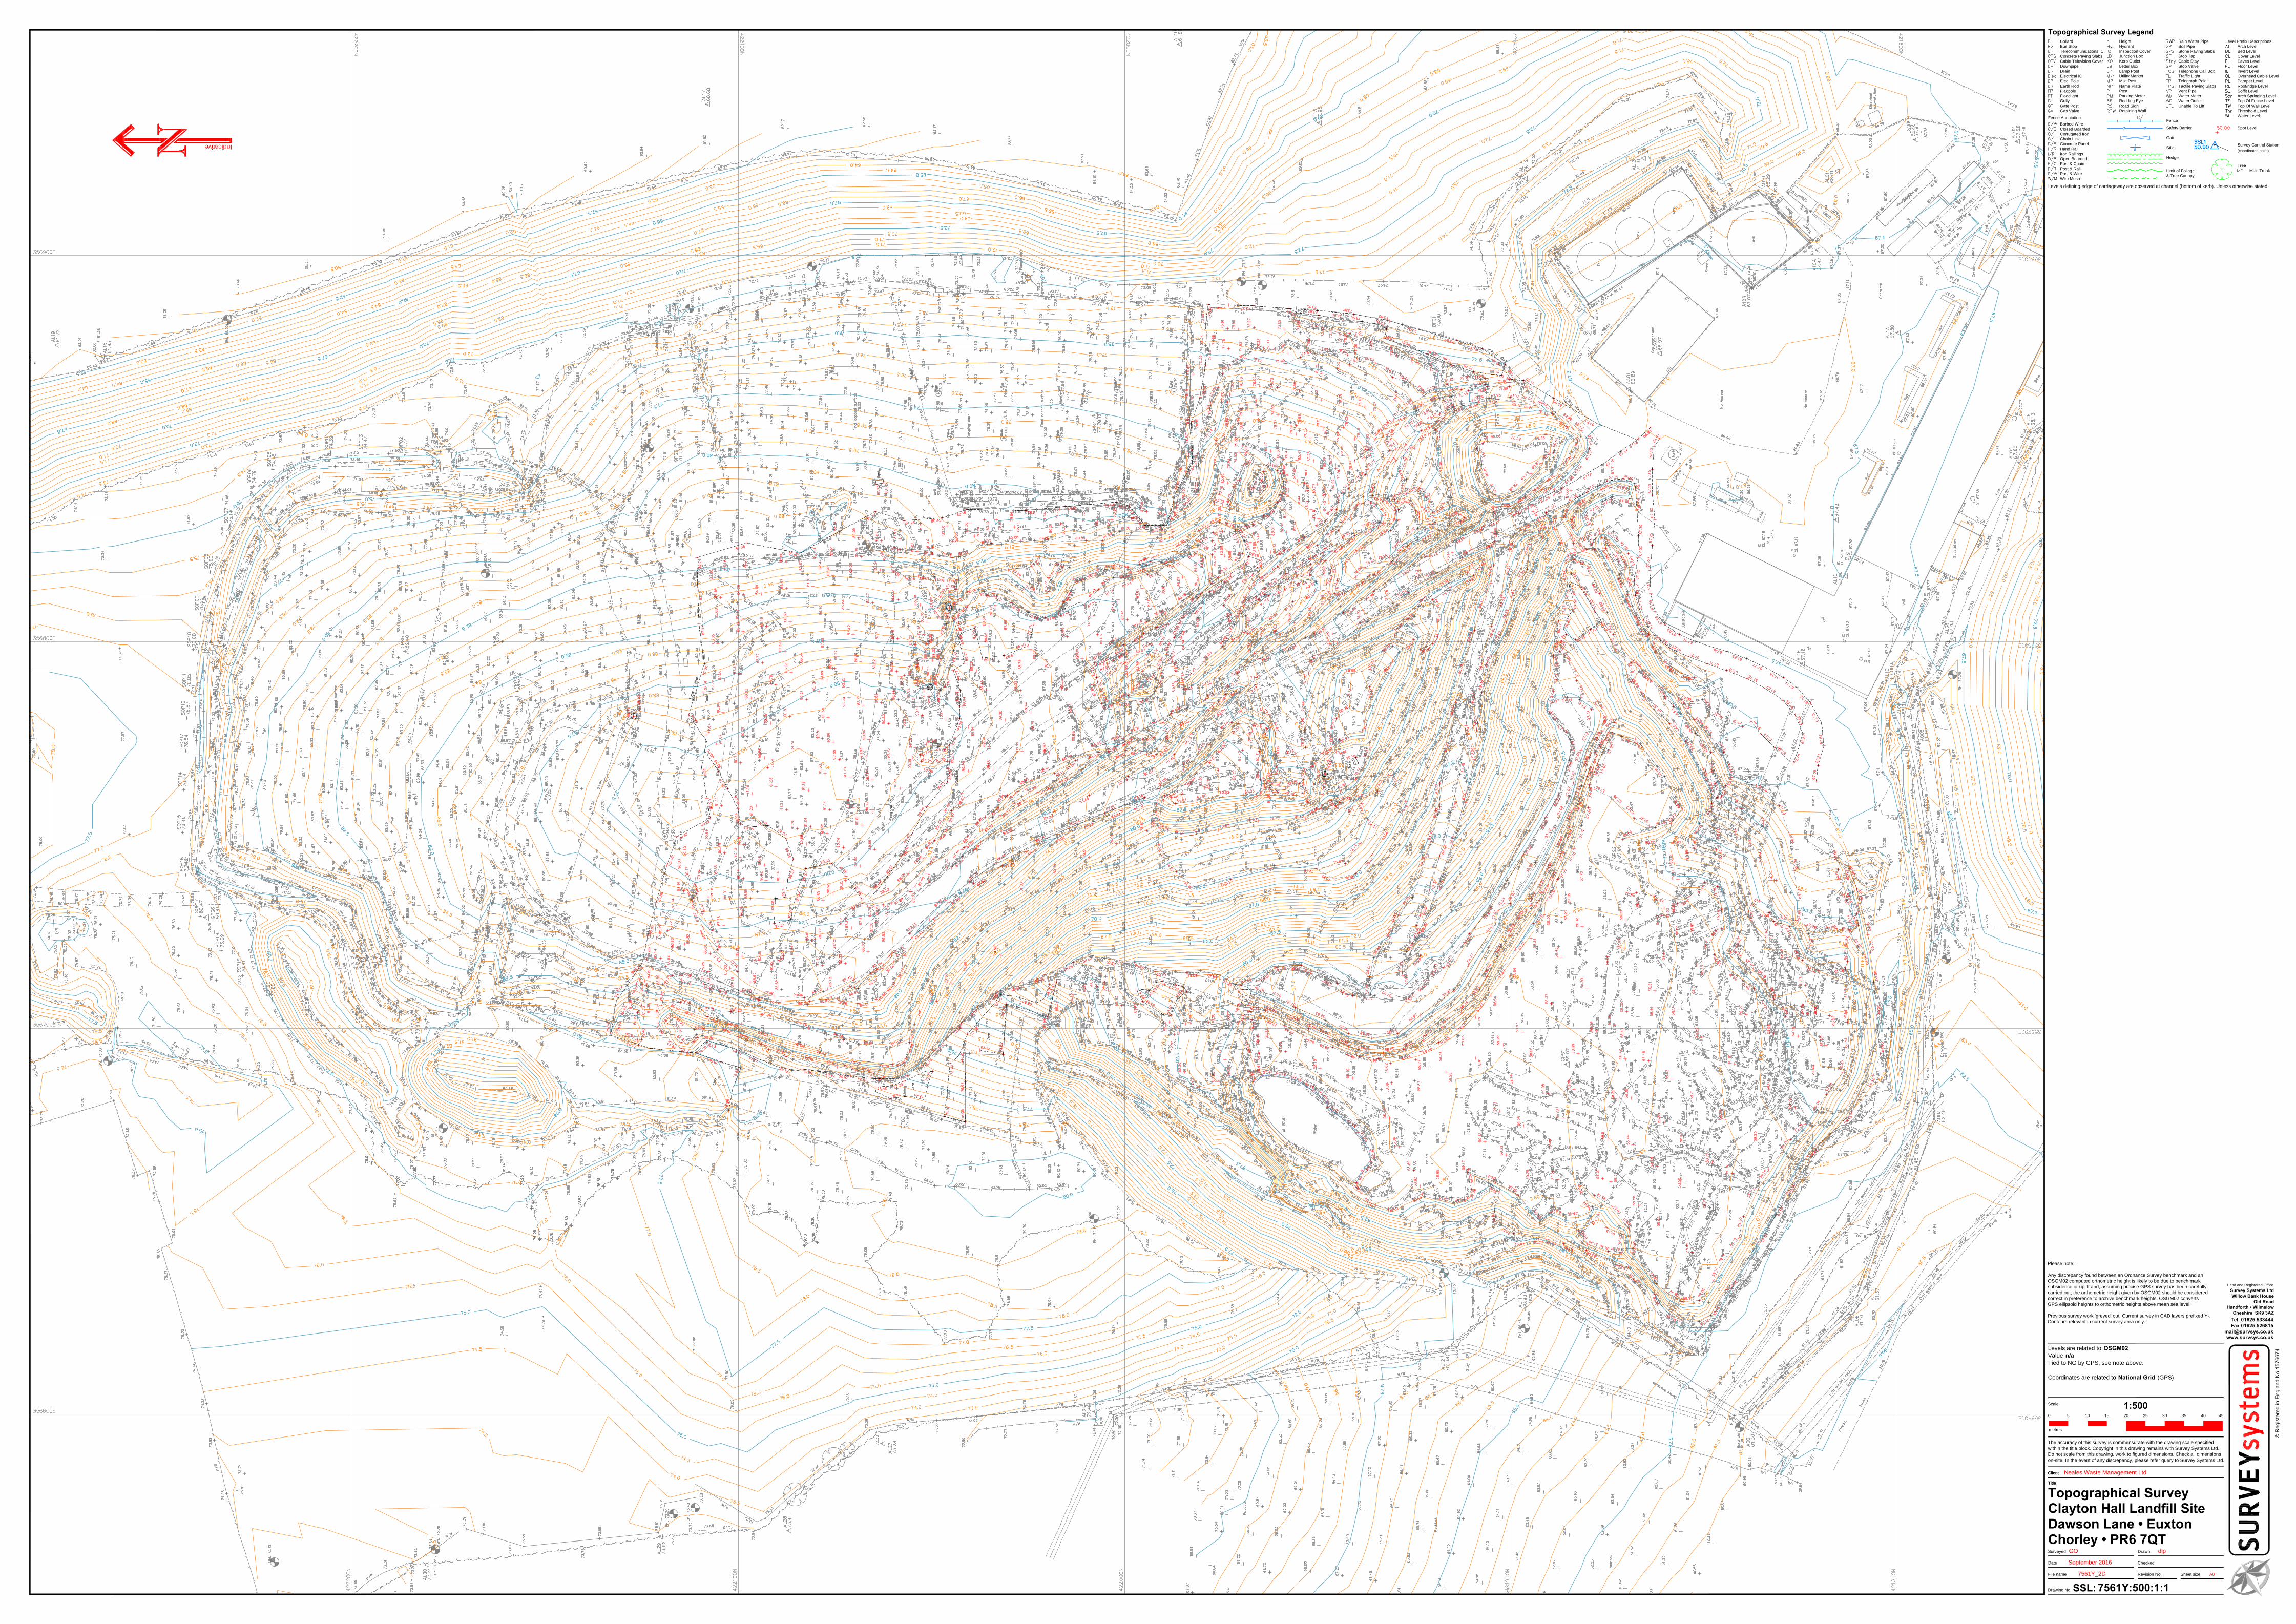
9.0.1 Permit condition no 3.5.3 requires an annual topographic survey of the site.
9.0.2 Survey Operations carried out a topographic survey of parts of the site inOctober 2016. A copy of the survey, Drawing No SSL:7561Y:500, is providedin Appendix H. Additional surveying was undertaken by Cheetham HillConstruction as part of the capping works.
9.1 The Volumetric Difference Between Surveys
9.1.1 TACCL has compared the 2016 surveys with the previous survey of the sitefrom December 2015. The results are inconclusive as a result of the extensivecapping and restoration works undertaken. These works have utilised soilsexcavated from the quarry (future cells 4B and 5).
9.1.2 Furthermore it is known that waste has been moved from Cell 3B to regradeareas which were capped in the Autumn.
9.2 Settlement Behaviour
9.2.1 Part of Cell 3C has been capped and there are now two sets of topographicsurvey data for this area.
9.2.2 A comparison of this data indicates that some settlement (in the order of upto 0.15 m) has been observed.
9.2.3 This area has not been fully restored and consequently the survey data mayalso reflect erosion and/or re-instatement of the cap protection layer.
9.2.4 A large area of the site was capped during 2016. There is only one set ofsurvey data for this area consequently an assessment of settlement cannot bemade.
9.3 Remaining Landfill Capacity
9.3.1 The October 2016 topographic survey was used to update the model for thesite assuming no significant changes to the levels outside the specific areasurveyed.
9.3.2 The remaining landfill capacity has been calculated by comparison of this sitesurvey and the pre-settlement landfill restoration model.
Report No 08469/152 – January 2017Clayton Hall Landfill Site: Annual Performance Review (2016)
Page 30 The Arley Consulting Company Limited
9.3.3 It should be noted that during 2016 planning permission was granted for anextension to the site and revised restoration levels. Whilst this does not havea material significance in terms of the permit requirement it does mean thatthe figures are not comparable with those reported in previous years.
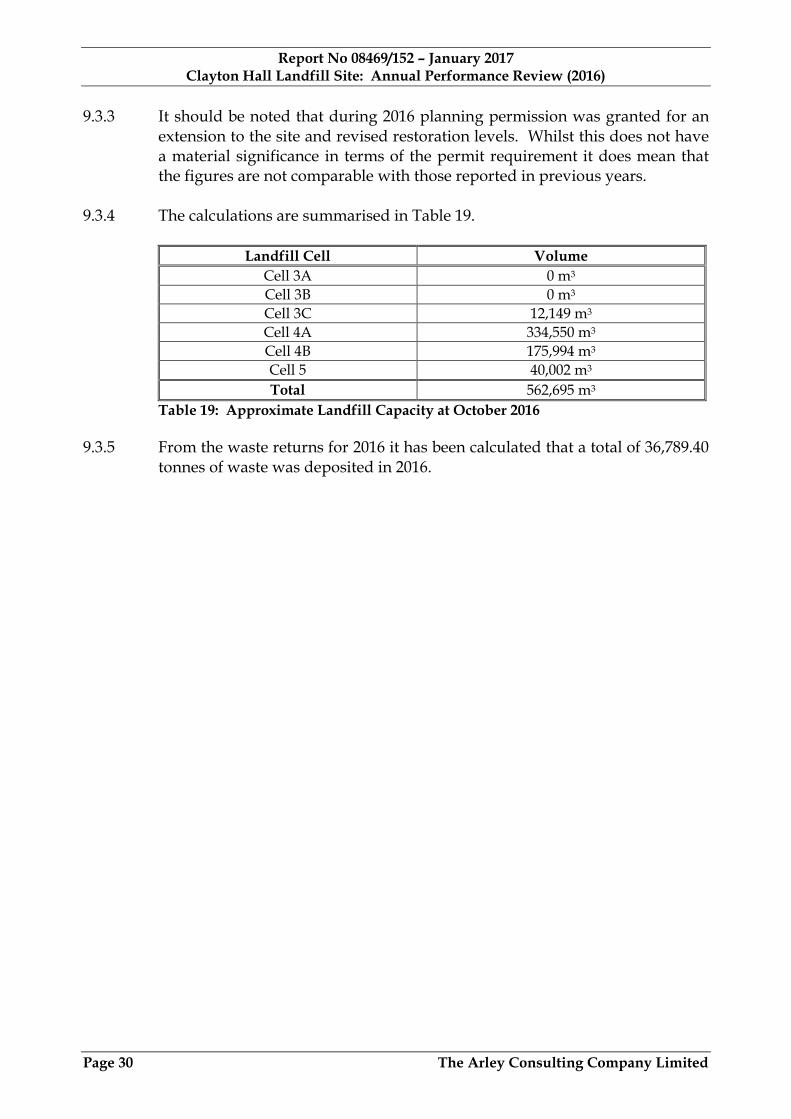
9.3.4 The calculations are summarised in Table 19.
Landfill Cell Volume
Cell 3A 0 m3
Cell 3B 0 m3
Cell 3C 12,149 m3
Cell 4A 334,550 m3
Cell 4B 175,994 m3
Cell 5 40,002 m3
Total 562,695 m3
Table 19: Approximate Landfill Capacity at October 2016
9.3.5 From the waste returns for 2016 it has been calculated that a total of 36,789.40tonnes of waste was deposited in 2016.
Report No 08469/152 – January 2017Clayton Hall Landfill Site: Annual Performance Review (2016)
Page 31 The Arley Consulting Company Limited
10. COMPLIANCE TESTING
10.1 No compliance testing has been carried out in 2016 that has not been reportedeither as part of routine monitoring reports or CQA validation submissions.
Report No 08469/152 – January 2017Clayton Hall Landfill Site: Annual Performance Review (2016)
Page 32 The Arley Consulting Company Limited
11. CONCLUSION & RECOMMENDATIONS
11.1 The Arley Consulting Company Limited (TACCL) has been commissioned byQuercia Limited to prepare a report for the annual environmental monitoringundertaken in the area regulated by Environmental Permit No BV1364 atClayton Hall Landfill Site, Chorley, Lancashire. A review of the landfillperformance is included.
11.2 The report is required to comply with the requirements of Schedules 3 and 4of the environmental permit.
11.3 This report covers the period January to December 2016.
11.4 Environmental monitoring has been undertaken at the site to comply with therelevant permit conditions.
11.5 The results presented in this report are consistent with those reportedpreviously and do not indicate significant emissions from the site or anyevidence of gas or leachate migration from the landfill site affecting thesurrounding environmental conditions.
Judith GreenBSc (Hons)
Martin LovelockBEng (Hons) CGeol FGS MCIWM AMIEMA
Senior Consultant Technical Director

Indicative
Safety Barrier
Limit of Foliage
Lamp Post
Utility Marker
Letter Box
Mile Post
Cable Stay
Retaining Wall
Rodding Eye
Stop Valve
Stop Tap
Parking Meter
Post
Name Plate
Telegraph Pole
Vent Pipe
Water Meter
Levels defining edge of carriageway are observed at channel (bottom of kerb). Unless otherwise stated.
Telephone Call Box
Traffic Light
Hydrant
Junction Box
Inspection Cover
Kerb Outlet
Bollard
Concrete Paving Slabs
Bus Stop
Telecommunications IC
Drain
Gully
Elec. Pole
Electrical IC
Flagpole
Floodlight
Gate Post
Earth Rod
Cable Television Cover
Gate
Hedge
Topographical Survey Legend
Threshold Level
Water Level
Top Of Fence Level
Spot Level
Level Prefix Descriptions
Bed Level
Arch Springing Level
Roof/ridge Level
Parapet Level
Soffit Level
Invert Level
Cover Level
Floor Level
Eaves Level
Water Outlet
Arch Level
Unable To Lift
Chain Link
Hand Rail
Concrete Panel
Tree
Stile
Closed Boarded
Corrugated Iron
Barbed Wire
Post & Rail
Wire Mesh
Post & Wire
Iron Railings
Post & Chain
Open Boarded
Survey Control Station
(coordinated point)
Tactile Paving Slabs
Fence Annotation
& Tree Canopy
Fence
Soil Pipe
Downpipe
Road Sign
Height
Gas Valve
Top Of Wall Level
Multi Trunk
Overhead Cable Level
Stone Paving Slabs
Rain Water Pipe
Revision No.File name
Drawing No.
Title
Client
SSL:
© Registered in England No.1576674
Willow Bank House
Old Road
Handforth • Wilmslow
Cheshire SK9 3AZ
Tel. 01625 533444
Fax 01625 526815
www.survsys.co.uk
Head and Registered Office
Survey Systems Ltd
Date
Surveyed
Title
Client
Checked
Drawn
The accuracy of this survey is commensurate with the drawing scale specified
within the title block. Copyright in this drawing remains with Survey Systems Ltd.
Do not scale from this drawing, work to figured dimensions. Check all dimensions
on-site. In the event of any discrepancy, please refer query to Survey Systems Ltd.
7561Y:500:1:1
Topographical Survey
Clayton Hall Landfill Site
Dawson Lane • Euxton
Chorley • PR6 7QT
Neales Waste Management Ltd
GO dlp
September 2016
7561Y_2D A0Sheet size
35
metres
0
1:500
105 15 2520 30 40 45
Scale
Levels are related to
Coordinates are related to
Value
OSGM02
n/a
Tied to NG by GPS, see note above.
National Grid (GPS)
Please note:
Any discrepancy found between an Ordnance Survey benchmark and an
OSGM02 computed orthometric height is likely to be due to bench mark
subsidence or uplift and, assuming precise GPS survey has been carefully
carried out, the orthometric height given by OSGM02 should be considered
correct in preference to archive benchmark heights. OSGM02 converts
GPS ellipsoid heights to orthometric heights above mean sea level.
Previous survey work 'greyed' out. Current survey in CAD layers prefixed Y-.
Contours relevant in current survey area only.

THE ARLEY CONSULTING COMPANY LIMITED
Chorleian House49-51 St Thomas’s Road
Chorley, Lancashire, PR7 1JE
Tel: 01257 278300Fax: 01257 268063Email: [email protected]