Embed Size (px)
Citation preview

15Archaeology of JSARN–124 site 3, central-western Arnhem Land: Determining the age of the so-called ‘Genyornis ’ painting
Bryce Barker, Lara Lamb, Jean-Jacques Delannoy, Bruno David, Robert Gunn, Emilie Chalmin, Géraldine Castets, Ken Aplin, Benjamin Sadier, Ian Moffat, Jerome Mialanes, Margaret Katherine, Jean-Michel Geneste and Stéphane Hoerlé
IntroductionIn 2011, Gunn et al. published the discovery in a remote part of the western Arnhem Land plateau of a rock painting that closely resembles the most recent reconstructions of an extinct megafaunal bird, the dromornithid Genyornis newtoni. Characteristics of the painting distinguish it from depictions of other bird species and support its identification as G. newtoni: a deep convex bill, unlike the shallow bill of an emu or cassowary; a globular cranium and relatively thick neck; indication of a crop (emus and cassowaries lack crops); non-pendulous posture of the wing (unlike the pendulous posture of emus); the proportions of the pelvic limb showing long tibiotarsi and stout tarsometatarsi; the short, broad toes that appear to terminate in blunt claws; and a dorsal profile paralleling that of reconstructed dromornithids and unlike an emu or any species of cassowary, in which the vertex of the back is more anterior. The several points of special resemblance between the painting and reconstructions of the extinct bird based on paleontological evidence led Gunn et al. (2011:10) to conclude, ‘on the basis of probability the painting is indeed a representation of Genyornis newtoni’.
This finding brings a conundrum. If the painting is indeed a contemporaneous depiction of G. newtoni, it becomes the oldest painting known in the world, for the bird is thought to have become extinct around 50,000 ± 5000 years ago (Miller et al. 1999; Roberts and Brook 2010; Roberts et al. 2001) or even earlier (see Grellet-Tinner et al. 2016). Or that timing for the extinction of Genyornis is wrong; or a relic population survived longer on the Arnhem Land plateau (e.g. Murray and Vickers-Rich 2004), perhaps until the Last Glacial Maximum (LGM), which commenced around 25,000 years ago. And, as Gunn et al. (2011) acknowledged, there are still other alternatives. The painting might be of a ‘mythological’ animal: either one rooted in ancient memory of G. newtoni, as has been suggested for the ‘mihirung’ of southern Australian Aboriginal peoples (Vickers-Rich 1987) – although in societies without writing, social memory

424 The Archaeology of Rock Art in Western Arnhem Land, Australia
terra australis 47
has not been found anywhere in the world to reliably extend in recognisable form over very long periods of time (cf. Bradley 2002) – or of a creature without a material counterpart that fortuitously resembled the fossil bird.
The painting occurs on a vertical rock wall under a shallow overhang. Could the motif really have survived there since Pleistocene times, whether 25,000 or 50,000 years ago? And the painting shows a speared bird, so it could be the first evidence for the hunting of extinct megafauna in Australia.
With these enigmas in mind, the Jawoyn Association asked us in 2010 to study the ‘Genyornis’ site, to investigate the age of the art and its archaeological and geomorphological context. Our major aims were to ask whether the painting dates, or theoretically could date, to the time of G. newtoni, or whether it must be more recent, and to uncover contextual ancient cultural information relating to the artworks and to occupation activities at the site in the past. Here, we present the results of these archaeological and geomorphological investigations along with a summary of the chemistry of the rock surface that houses the painting of the large bird thought by Gunn et al. (2011) to be of a Genyornis.
Genyornis newtoniGenyornis newtoni (henceforth, just Genyornis) was the last known member of the endemic and extinct Australian bird family Dromornithidae. Although they have long been considered to be ‘ratites’ with likely affinities to emus and cassowaries, recent studies of the cranium suggest that dromornithids are more closely related to ducks, geese and screamers (members of the Order Anseriformes); they may be related specifically to another Australian endemic, the magpie goose (Anseranas semipalmata) (Murray and Megirian 1998), so characteristic of Arnhem Land wetlands today. Whatever its affinities, the Dromornithidae is an ancient family that attained its highest diversity more than 10 million years ago. Since that time, various branches of the Dromornithidae petered out, with Genyornis alone known to have survived into the Pleistocene.
The final extinction of Genyornis, the last of the dromornithids, is generally treated as part of a late Pleistocene megafaunal extinction ‘event’, which saw the demise of numerous large Australian vertebrate species, including many large marsupials and some reptiles (Roberts and Brook 2010; Roberts et al. 2001). Only a select few, Genyornis among them, are confirmed as having survived long enough to have co-existed with humans following the colonisation of Australia around 65,000 years ago (Miller et al. 1999; Roberts et al. 2001). Yet, even for these, the nature of the human–megafauna interaction and the causes and consequences of the extinctions remain shrouded in uncertainty.
What exactly do we know about Genyornis? And what do we know about the time and cause of its extinction?
The anatomy of Genyornis is quite well known from discoveries of almost complete skeletons. These indicate a bird only slightly taller than a modern emu (Dromaius novehollandiae) but of a much stockier build – estimates of adult body weights range between 220 and 275 kg, compared with 40–50 kg for the emu (see Murray and Vickers-Rich 2004 for a fossil reconstruction of Genyornis newtoni). Such a bulky bird was long portrayed as slow moving, but recent studies of the limb skeleton suggest that it was capable of reaching speeds similar to those of the emu (Murray and Vickers-Rich 2004).

15. Archaeology of JSARN–124 site 3, central-western Arnhem Land 425
terra australis 47
Surviving fragments of the skull suggest a globular cranium with a short, heavily constructed beak (Murray and Megirian 1998). Although the massive beak has been interpreted by some as a sign of a carnivorous diet, other evidence, including gizzard stones in association with some skeletons, and the structure of the beak and feet all favour a herbivorous diet (Murray and Vickers-Rich 2004; Rich 1979).
Recent interpretations of both the distribution of Genyornis and of the timing of its extinction rest heavily on the attribution to this species (most likely erroneously, see below) of a distinctive and sometimes very abundant kind of fossil eggshell. This association was first made by Williams (1981), who distinguished two morphological kinds of eggshell from sites of late Pleistocene age in South Australia. Both kinds of eggshell were from eggs about the same size as those laid by the living emu (Dromaius novaehollandiae), but while some fragments had features consistent to those of modern emu, others showed differences in surface ornamentation and the arrangement of pores (Williams 1981). When eggshell of this ‘Genyornis’ type was mapped together with skeletal remains, the species appeared to be widely distributed across the Murray-Darling system of southeast Australia, the internally draining Lake Eyre and Lake Frome Basins of south-central Australia, and in the southwest corner of Western Australia. No skeletal remains or eggshell of the ‘Genyornis’ type has been reported from anywhere in northern Australia. However, it is worth noting that there are still relatively few Pleistocene fossil sites in this area and even fewer that have yielded remains of megafauna. The few sites that might have been expected to produce remains of Genyornis (but in each case have not) include the Quanbun site in the south Kimberley (Flannery 1984) and the alluvial terraces along the Leichhardt and Gregory rivers in the Gulf region of Queensland (Archer et al. 2006).
Eggshell, by virtue of its crystalline structure and organic content, is an ideal material for amino acid racimisation, radiometric dating and also for chemical analysis of dietary preferences. For these reasons, the ancient eggshell record from northern South Australia and surrounding regions was targeted for detailed studies by Miller and his co-researchers. Their studies showed that the two kinds of eggshell were deposited in the many sand dunes and beaches, more or less continuously from around 140,000 years ago until around 45,000–50,000 years ago, after which the Dromaius kind alone was deposited (Miller et al. 1999).
Miller et al. (2005) took their investigations one step further through dietary analysis of eggshell samples. The results indicated that the regional emu population had a less restricted dietary range than contemporaneous populations of the second, extinct species. Whereas the emu samples show highly variable chemical signatures that indicate a capacity to feed on a wide variety of plant foods including shrubs and trees as well as all kinds of grasses, the extinct species showed a narrower diet with a likely reliance on more nutritious grasses.
The study by Miller et al. (2005) was widely touted as compelling evidence for the regional (and even continental) extinction of Genyornis at 45,000–50,000 years ago, and the dietary analysis provided a plausible mechanism whereby the arrival of humans led to a change in the firing regime and changes in vegetation communities that caused the decline to extinction of a less adaptable species. Rare occurrences of burnt eggshell of the ‘Genyornis’ kind further indicated a brief period of regional overlap between humans and the extinct species and of predation (at least of nests) that might have hastened their decline (Magee and Miller 2007).
A new study by Grellet-Tinner et al. (2016) has seriously undermined this textbook example of how to study megafaunal extinction. By using a better preserved and more complete example of a ‘Genyornis’ egg, and consideration of both its size and micro-structure in comparison with eggshell attributed to other species of dromornithids from Oligo-Miocene fossil sites, the authors conclude that the second kind of eggshell studied by Williams (1981) and Miller et al. (1999, 2005) is not from Genyornis at all but from a different kind of bird, most likely a species of the
426 The Archaeology of Rock Art in Western Arnhem Land, Australia
terra australis 47
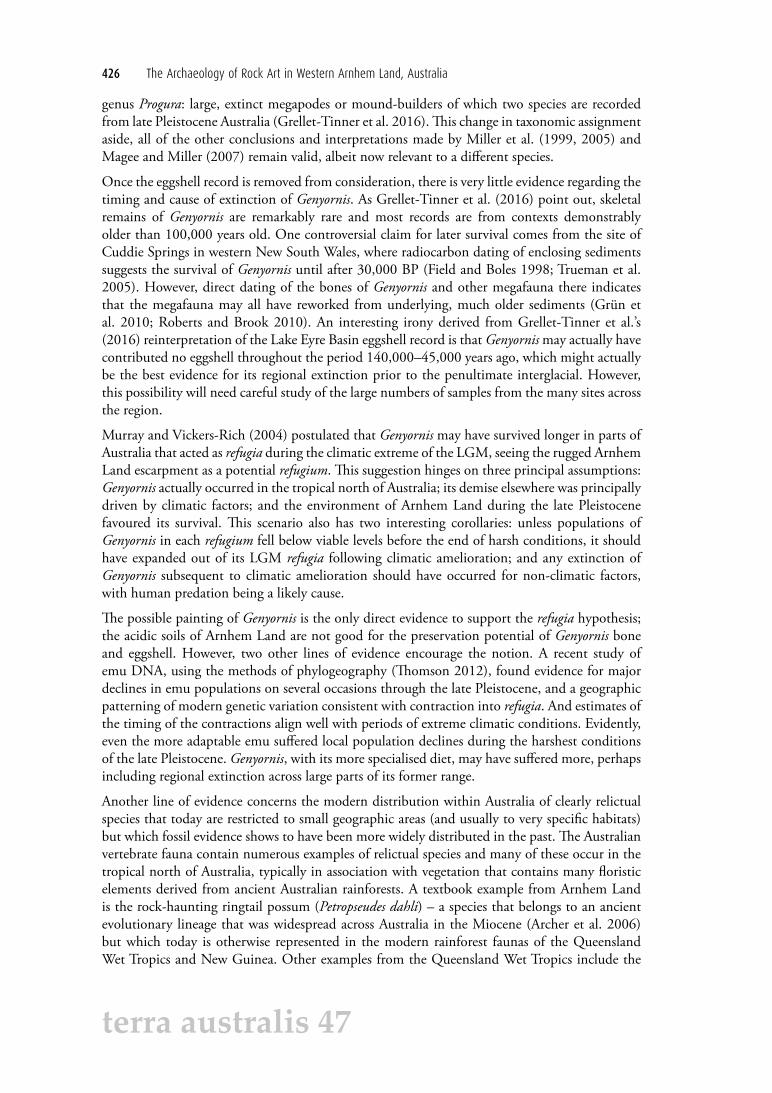
genus Progura: large, extinct megapodes or mound-builders of which two species are recorded from late Pleistocene Australia (Grellet-Tinner et al. 2016). This change in taxonomic assignment aside, all of the other conclusions and interpretations made by Miller et al. (1999, 2005) and Magee and Miller (2007) remain valid, albeit now relevant to a different species.
Once the eggshell record is removed from consideration, there is very little evidence regarding the timing and cause of extinction of Genyornis. As Grellet-Tinner et al. (2016) point out, skeletal remains of Genyornis are remarkably rare and most records are from contexts demonstrably older than 100,000 years old. One controversial claim for later survival comes from the site of Cuddie Springs in western New South Wales, where radiocarbon dating of enclosing sediments suggests the survival of Genyornis until after 30,000 BP (Field and Boles 1998; Trueman et al. 2005). However, direct dating of the bones of Genyornis and other megafauna there indicates that the megafauna may all have reworked from underlying, much older sediments (Grün et al. 2010; Roberts and Brook 2010). An interesting irony derived from Grellet-Tinner et al.’s (2016) reinterpretation of the Lake Eyre Basin eggshell record is that Genyornis may actually have contributed no eggshell throughout the period 140,000–45,000 years ago, which might actually be the best evidence for its regional extinction prior to the penultimate interglacial. However, this possibility will need careful study of the large numbers of samples from the many sites across the region.
Murray and Vickers-Rich (2004) postulated that Genyornis may have survived longer in parts of Australia that acted as refugia during the climatic extreme of the LGM, seeing the rugged Arnhem Land escarpment as a potential refugium. This suggestion hinges on three principal assumptions: Genyornis actually occurred in the tropical north of Australia; its demise elsewhere was principally driven by climatic factors; and the environment of Arnhem Land during the late Pleistocene favoured its survival. This scenario also has two interesting corollaries: unless populations of Genyornis in each refugium fell below viable levels before the end of harsh conditions, it should have expanded out of its LGM refugia following climatic amelioration; and any extinction of Genyornis subsequent to climatic amelioration should have occurred for non-climatic factors, with human predation being a likely cause.
The possible painting of Genyornis is the only direct evidence to support the refugia hypothesis; the acidic soils of Arnhem Land are not good for the preservation potential of Genyornis bone and eggshell. However, two other lines of evidence encourage the notion. A recent study of emu DNA, using the methods of phylogeography (Thomson 2012), found evidence for major declines in emu populations on several occasions through the late Pleistocene, and a geographic patterning of modern genetic variation consistent with contraction into refugia. And estimates of the timing of the contractions align well with periods of extreme climatic conditions. Evidently, even the more adaptable emu suffered local population declines during the harshest conditions of the late Pleistocene. Genyornis, with its more specialised diet, may have suffered more, perhaps including regional extinction across large parts of its former range.
Another line of evidence concerns the modern distribution within Australia of clearly relictual species that today are restricted to small geographic areas (and usually to very specific habitats) but which fossil evidence shows to have been more widely distributed in the past. The Australian vertebrate fauna contain numerous examples of relictual species and many of these occur in the tropical north of Australia, typically in association with vegetation that contains many floristic elements derived from ancient Australian rainforests. A textbook example from Arnhem Land is the rock-haunting ringtail possum (Petropseudes dahli) – a species that belongs to an ancient evolutionary lineage that was widespread across Australia in the Miocene (Archer et al. 2006) but which today is otherwise represented in the modern rainforest faunas of the Queensland Wet Tropics and New Guinea. Other examples from the Queensland Wet Tropics include the

15. Archaeology of JSARN–124 site 3, central-western Arnhem Land 427
terra australis 47
green ringtail possum (Pseudochirops archeri), the Herbert River ringtail possum (Pseudochirulus herbertensis), the musky rat kangaroo (Hypsiprymnodon moschatus) and the doubled-wattled cassowary (Casuarius casuarius). An example from the Kimberley region of northwest Australia is the scaly-tailed possum (Wyulda squamicauda), whose closest known relatives are fossil species from the Miocene of Queensland (Archer et al. 2006). Each of these species represents an example of local to regional survival of an evolutionary lineage for periods of many millennia to millions of years after the regional extinction of the same or related species in other parts of Australia. In each case, the key factor that most likely underpinned the survival was the greater environmental stability within these sheltered and moist habitats, compared with surrounding areas. However, a lack of human predation is undoubtedly also important within the period since human settlement of Australia, especially for any larger species.
JSARN–124 site 3The archaeological site thought by Gunn et al. (2011) to contain the painting of a Genyornis bird was given the survey identification number JSARN–124 site 3 by the Jawoyn Association. As one of the key aims of this chapter is to determine through archaeological, geomorphological and chemical evidence whether or not the painting can possibly be of a Genyornis bird, so as to not preconfigure the result we refer to the site with its original survey site number, JSARN–124 site 3, and to the previously called ‘Genyornis’ motif as ‘the large bird motif ’.
Geologically, the site is located on the Arnhem Land plateau at the contact zone of a low rise of Marlgowa Sandstone (of the Kombolgie Subgroup, Katherine River Group) that formed during the Protezoroic 1740–1780 million years ago, and a broad depression drained by a tributary of the upper reaches of the Katherine River (Figure 1.1). Within the overall depression, the bedrock is buried by a shallow layer of aeolian sands eroded from quartzitic sandstone benches.
At a broad, landscape scale, the contact zone between the low rise and the depression is today marked by a network of isolated rock stacks (Figure 15.1). These rock stacks represent the ancient edge of the low rise and are of uneven orientations, signalling their fragmentation through chemical and mechanical weathering and gravitational collapse (e.g. roof-fall). JSARN–124 site 3 is one of these rock stacks. The first people onto this landscape, between 65,000 and c. 50,000 years ago, entered a geological landscape that was very similar to the one visible today.
The JSARN–124 site 3 rock stack consists of superimposed quartzite strata measuring some 4.5 m thick × 11 m long × 7 m wide, sitting on and overhanging a narrow quartzite pedestal 2.5 m long × 6 m wide. The pedestal represented by rock strata D2–D1–D0 is narrower than the overlying, overhanging strata D3–D7 (see Figures 15.2 and 15.3). This is due to the pedestal having lower resistance to forces of erosion than the overlying strata. As a result of the narrowness of the pedestal, the overlying strata have tilted northward. This tilting, along with the collapse of large parts of the overhang, took place over a long, geological time frame sometime before the arrival of people in the landscape.

428 The Archaeology of Rock Art in Western Arnhem Land, Australia
terra australis 47
Figure 15.1 JSARN–124 site 3 (bottom right-hand rock stack), excavation of Squares B and D in progress.Source: Photograph by Jean-Jacques Delannoy.
Figure 15.2 Northern side of JSARN–124 site 3, showing collapsed overhang at ground level.Source: Photograph by Jean-Jacques Delannoy.

15. Archaeology of JSARN–124 site 3, central-western Arnhem Land 429
terra australis 47
Figure 15.3 Profile view and map of JSARN–124 site 3, showing the collapsed overhang and location of excavation squares.Source: Illustrations by Jean-Jacques Delannoy.

430 The Archaeology of Rock Art in Western Arnhem Land, Australia
terra australis 47
The large bird motif is located on the northern face of the site. This flat northern face is the scar left by the collapse of what had been a much deeper overhang than the current one. The boulders that are now at ground level immediately to the north of the shallow remnant overhang are the fallen sections of strata D4–D5–D6 that previously made up the ‘original’ overhang (see below for further details).
The rock artRock art is found on five panels (Panels A–E) around the quartzitic sandstone stack (see Figure 15.3). Each panel is described separately below.
Panel APanel A faces slightly east of north. It is 5 m long × 3 m high, and is today protected by a shallow, 1.5 m deep overhang. As noted above, previously the overhang was considerably larger than it is now, as indicated by massive rock collapse beyond the present dripline (Figure 15.4; see below). Parts of Panel A have been subject to water-wash, which accounts for the variability of colour and partial erasure of images on the eastern side of the panel.
Figure 15.4 Location of art Panel A.Source: Photograph by Robert Gunn.
Panel A contains 29 images in monochrome reds or yellows (Figures 15.5 and 15.6). It is dominated by a large painting of a bird (Image #5), 1.66 m long × 1.07 m high – the one that might show Genyornis. Gunn et al. (2011) provide a detailed description of the panel, although an extra motif (Image #29) has now been identified, and Image #14 is reclassified here as a large macropod whose hind quarters and tail have been destroyed by weathering.

15. Archaeology of JSARN–124 site 3, central-western Arnhem Land 431
terra australis 47
Figure 15.5 Panel A.Source: Photograph by Robert Gunn.
Figure 15.6 Photo-tracing of the Panel A images.Source: Digital tracing by Robert Gunn.
The large bird motif post-dates a series of hand stencils including the 3MF (for three middle fingers together, with the thumb and small finger to one side) type generally associated with Chaloupka’s Dynamic Figures style, which researchers provisionally think dates to around 10,000–12,000 years ago (Chippindale and Taçon 1998; Taçon and Brockwell 1995; but see Chaloupka 1993 who thought they may have been older; see Chapter 1). The large bird motif on Panel A overlies both hand stencil Image #19 and the 3MF hand stencil (Image #20), so it is younger (Table 15.1). In the initial recording, the large bird painting was thought to underlie at least four other images (Gunn et al. 2011), while the large, solid male figure (Image #6) was thought as overlying the large bird motif. We have since shown elsewhere that Image #6 underlies the large bird motif and is therefore older (Chalmin et al. 2017).

432 The Archaeology of Rock Art in Western Arnhem Land, Australia
terra australis 47
Table 15.1 Panel A: Simplified superimposition sequence involving the earliest and latest images (most recent image at top of table; earliest at bottom).
Image type Image # Technique Form Colour
Simple Design 15 Drawing Grid Red
Unknown 29 Painting Outline Yellow
Macropod 14 Painting Outline+infill Yellow
Spear 9 Painting Linear Red
Large bird motif 5 Painting Solid+outline+infill Reds (×3)
Large solid anthropomorph 6 Painting Solid Red
Hand stencils (including 3MF type) 18,19, 20 Stencil Hand stencils Red
Note that under microscopic examination of cross-sections of micro-samples, the stratification of paint layers confirms that the spear (Image #9) lies over the large solid anthropomorph (Image #6). Furthermore, the paint layer from the spear merges in cross-section with that of the large bird motif (Image #5), and so the two are therefore probably contemporaneous.
Source: Authors’ data.
Other recognisable images include a female macropod with joey, two flying-foxes, a unimarginal barbed spear, and two unidentified faunal taxa (a quadruped and a waterbird). As with the early suite of red hand stencils, the yellow images (Images #11, #12, #13, #14 and #29) appear to be a contemporaneous group.
The painting of the spear (Image #9) intersects the painting of ‘Genyornis’ (Image #5) in a composition that implies a deliberate association (Figure 15.7). One interpretation of this composition could be of a speared bird, although in Arnhem Land the vertical upwards orientation of the spear is unusual for so-called ‘hunting scenes’. However, the hunting theme is of particular interest because if the bird is indeed of Genyornis, and if the spear is contemporaneous with the Genyornis painting, then it would suggest that the bird was hunted.
The shape of the spear (Image #9) on the large bird motif corresponds with Chaloupka’s bokko spears, for which he does not offer an age but notes, ‘the stone country people such as the Badmardi clan claim it as their own’ (1993:148); that is, according to some recent oral traditions, it originated on the Arnhem Land plateau, although it was also then used on the low-lying plains. Lewis (1988) identified this spear type in all of his western Arnhem Land rock art phases, from the Boomerang, ‘Hooked Stick’, Broad Spearthrower to Long Spearthrower Periods. The shape of the spear cannot signal its antiquity.
Figure 15.7 Detail of the placement of the spear (Image #9), the large bird motif (Image #5) and the large anthropomorph (Image #6) paintings.Source: Photograph by Robert Gunn.

15. Archaeology of JSARN–124 site 3, central-western Arnhem Land 433
terra australis 47
The waterbird (Image #10) has a well-delineated but unpainted interior. Brandl (1972:27) sees such ‘empty’ interiors as a precursor to the development of X-ray features. Taçon suggests ‘the approximate upper age limit for the early x-ray period has been placed at 8000–6000 years BP’ (1989:119), but further notes, ‘in a sense, however, the upper age should remain open-ended as some aspect of ‘internalness’ has been found in earlier styles’ (Taçon 1989:119; see also Taçon 1992:203). Subsequently, Chaloupka tentatively suggested that this convention of hollow body began towards the beginning of his Estuarine Period, around 8000 years ago. None of these suggested ages are based on any direct dating of art (Chaloupka 1993:183–185). The large bird motif is also hollow-bodied: did this artistic convention begin long before the early Holocene, prior to the LGM (see Gunn et al. 2011)?
Panel BPanel B is on the rear wall of the alcove behind excavation Square A (Figures 15.8–15.10). The rock panel measures 2.3 × 0.7 m, but the irregular southern half is undecorated. Small areas of the panel have been damaged by exfoliation and the lower margin of the southern half has been extensively flaked.
The 12 images on the panel are all in monochrome red and very poorly preserved. The only recognisable images are of a solid macropod (Image #33), a goose-like bird (Image #31), a pair of macropod tracks (Image #40) and a cluster of drawn lines (Image #41). The macropod (66 cm long; height indeterminate) is the largest image on the panel. Image #33 is superimposed over Images #34, #35 and #37, but the sequential relationship of the other images cannot be determined due to their poor preservation.
Figure 15.8 Location of Panel B.Source: Photograph by Robert Gunn.

434 The Archaeology of Rock Art in Western Arnhem Land, Australia
terra australis 47
Figure 15.9 Panel B.Source: Photograph by Robert Gunn.
Figure 15.10 Photo-tracing of the Panel B images.Source: Digital tracing by Robert Gunn.
Panel COn a localised, vertical section of the wall directly above Square B are eight paintings that, on the basis of differences in form and preservation, can be seen to constitute three distinct groups (Figures 15.11–15.13):
• Two opposing birds (Images #45 and #46) and a bandicoot in red (Image #49).• Two lines and a small simple design, also in red (Images #42-#44).• Two white angular fragments that may have represented bird tracks but are now too fragmented
to determine the shapes of the original motifs (Images #47 and #48).
The bandicoot is the largest of the motifs at 47 cm long.

15. Archaeology of JSARN–124 site 3, central-western Arnhem Land 435
terra australis 47
Figure 15.11 Location of Panel C.Source: Photograph by Robert Gunn.
Figure 15.12 Panel C.Source: Photograph by Robert Gunn.
Figure 15.13 Photo-tracing of the Panel C images.Source: Digital tracing by Robert Gunn.

436 The Archaeology of Rock Art in Western Arnhem Land, Australia
terra australis 47
The type of bird represented by Images #45 and #46 is said, by Jawoyn people and also Aboriginal people in more northern parts of western Arnhem Land, to represent what are colloquially referred to as ‘bush hens’. Although not specifically identified to species during those discussions, the bush hen (Amaurornis olivaceus) is a type of rail that frequents swamp forests and is recorded from the region (Pizzey and Knight 1997:148). An alternative identification is the jirrirti (brown quail; Coturnix ypsilophora), a character of Jawoyn oral traditions that is represented in a similar manner to the bush hen (Wynjorroc et al. 2001:36). This form of bird depiction, as determined by the general shape of paintings, is one of the most commonly represented birds in the early art of the plateau, often shown in linear groups of six or more. The ‘empty’ body cavity in Image #45 is stylistically similar to that of the unidentified waterbird on Panel A (Image #10).
The bandicoot Image #49 is recognised by its short, straight tail, prominent testicles, short hind legs and two prominent macropod-like toes on the hind foot. Bandicoots are also common in early Jawoyn rock art on the plateau.
All of the images on this panel are badly weathered and, while the beak of the left bush hen/brown quail has been destroyed by exfoliation, water-wash has been responsible for most of the erasures elsewhere.
Studies at the nearby site of Nawarla Gabarnmang (Gunn et al. 2011) suggest that most images painted with white pigment are less than 400 years old. If the Nawarla Gabarnmang situation signals a broader pattern for Jawoyn Country, the two white images on Panel C at JSARN–124 site 3 (Images #47 and #48) would be of a similarly recent age.
Panel DA very weathered rock face, Panel D measures 2.0 × 0.6 m in size and contains six red paintings, all in very poor condition (Figures 15.14–15.16). It is possible that the panel was once decorated more extensively, but no traces of other images now remain. The panel is directly behind excavation Square D. Patterns of superimposition indicate that the surviving images were painted in three groups:
• An early group consisting of a single striped fragment of an originally larger image (Image #52).• A middle group of three linear images including a pair of back-to-back anthropomorphs
(Images #50 and #51).• A later group of an anthropomorph (Image #54) and a crooked line (Image #53).
Figure 15.14 Location of Panel D.Source: Photograph by Robert Gunn.

15. Archaeology of JSARN–124 site 3, central-western Arnhem Land 437
terra australis 47
Figure 15.15 Panel D.Source: Photograph by Robert Gunn.
Figure 15.16 Photo-tracing of the Panel D images.Source: Digital tracing by Robert Gunn.

438 The Archaeology of Rock Art in Western Arnhem Land, Australia
terra australis 47
Panel EPanel E is a small panel below and to the lower left of Panel A, at the same level above ground as Panel B. The panel is partially hidden by the rockfall from Panel A and is most readily photographed obliquely (Figure 15.17). The panel is approximately 2.0 m long × 0.8 m high; it contains five images in two layers of superimposition (Figures 15.18 and 15.19). The underlying image consists of a poorly preserved hand stencil (Image #57), while the overlying images consist of a macropod (Image #56), a goanna (Image #58) and a bandicoot (Image #60). The other image, Image #59, is a poorly preserved fragment of an originally larger outline image. The images are made at a similar scale to those on the smaller Panels B–D. The bandicoot (Image #60) on Panel E is similar in form and pose to the bandicoot on Panel D (Image #49). Their similarity of representation suggests that the two are probably contemporaneous. The hand stencil (Image #57) is in a similarly poor state of preservation as those on Panel A, and may thus be contemporaneous with them, as both sets of hand stencils occur as the earliest images on their respective panels.
Figure 15.17 Location of Panel E.Source: Photograph by Leigh Douglas.
Figure 15.18 Stitched photograph of Panel E.Source: Photograph by Leigh Douglas.

15. Archaeology of JSARN–124 site 3, central-western Arnhem Land 439
terra australis 47
Figure 15.19 Photo-tracing of the Panel E images.Source: Digital tracing by Robert Gunn.
Discussion of the artJSARN–124 site 3 contains one large and four smaller art panels with a total of 60 images painted or stencilled in monochrome red, yellow or white. Regionally, this is a medium-sized art site. Patterns of superimposition show the earliest images appear to be the hand stencils, including of the 3MF type, on Panels A and E, while the most recent artworks are likely to be the remnant white images on Panel C. If 3MF hand stencils are around 10,000–12,000 years old and the bird is Genyornis, then something seems amiss: either the 3MF type of stencil is much older than currently thought, or Genyornis survived long after the LGM.
Geochemical analysesTo determine if the large bird motif could have survived on a relatively exposed rock surface since late Pleistocene times, chemical analyses were carried out on the micro-stratigraphy (including on-wall pigments) at a number of rock art panels. Very small fragments of the rock surface were sampled, in each case with a new scalpel blade and stored in individual phials (Table 15.2; e.g. Figure 15.20). In the laboratory, the colour, size, shape and texture of each sample were recorded prior to undertaking more detailed chemical analyses. The individual samples from painted or stencilled surfaces were then compared with surface wall samples devoid of pigment and with bulk bedrock samples. Some of the samples were embedded in epoxy resin in order to examine micro-stratigraphic relationships between the underlying rock, paint layer(s) and surface crusts. Details of these analyses have been presented in Chalmin et al. (2017).
Table 15.2 Description of samples from JSARN–124 site 3.
Sample # Panel Image # Description Major compounds Minor and trace elements
GN1-1 A 5 1 compact and hard sample consisting of a thin layer of red above a white opaque matrix
SiO2, AlFePO
4, Fe
2O
3Na, Mg, S, K, Ca, Ti
GN1-2 A 9 2 hard samples, each consisting of: 1) a partial crust covering; above 2) a thin red layer; above 3) a translucent matrix
SiO2, AlFePO
4, Fe
2O
3Na, Mg, S, K, Ca, Ti

440 The Archaeology of Rock Art in Western Arnhem Land, Australia
terra australis 47
Sample # Panel Image # Description Major compounds Minor and trace elements
GN1-3 A 10 6 compact and hard samples, each consisting of a thin red layer above a hard white matrix
SiO2, AlFePO
4, Fe
2O
3, CaSO
4Na, Mg, K, Ti, V, Cr, Mn, Zn, Rb, Sr, Zr, Ba
GN1-4 A 6, 9 3 very hard samples, each consisting of a thin red layer above a white matrix
SiO2, AlFePO
4, Fe
2O
3, FeOOH Na, Mg, S, K, Cl,
Ca, Ti, V, Cr, Mn, Zn, Rb, Sr, Zr, Ba
GN1-5 A 1 2 very hard samples, each consisting of: 1) small grey concretions; above 2) a thin red layer; above 3) a white matrix
SiO2, aluminosilicate, Fe
2O
3Na, Mg, P, S, K, Cl, Ca, Ti, Mn, Zn, Sr, Zr, Ba
GN1-6 A 2 4 very hard samples, each consisting of: 1) an opaque crust layer; above 2) a thin red layer; above 3) a white matrix
SiO2, aluminosilicate, Fe
2O
3,
FeOOHNa, Mg, P, S, K, Ca, Ti, Mn, Sr, Zr, Ba
GN1-8 A 11 3 samples each consisting of a thin layer of yellow paint on the 2 faces of a small rock that originally protruded from the rock wall, with a white matrix inside
SiO2, AlFePO
4, Fe
2O
3, FeOOH Na, Mg, S, K, Ca
GN1-9 D 51 3 samples consisting of a thin red layer above a white, translucent matrix
SiO2, AlFePO
4, CaSO
4, K clay Na, Mg, Ti
GN1-11 A 5, 9 4 samples consisting of thin scattered red areas above a translucent matrix with large quartz crystals
SiO2, AlFePO
4, Fe
2O
3, CaSO
4Na, Mg, K, Cl, Ti, Mn, Zn, Sr, Ce, La, Zr, Ba
GN1-16 C 49 2 hard samples each consisting of a thin red layer above a porous white matrix
SiO2, MgCO
3, AlFePO
4, Fe
2O
3,
K clayNa, S, Ti, Mn
GN1-17 E 58 2 samples consisting of a thin red layer above a translucent matrix with large quartz crystals
SiO2, AlFePO
4, Fe
2O
3Na, S, K, Ca, Ti
GN1-19 A 20 1 sample consisting of a very thin translucent layer of red above a translucent matrix
SiO2, BaSO
4, AlFePO
4 Mg, Cl, K, Ca
Source: Author’s data.
Figure 15.20 Panel D, Image #51: The position of sample GN1-9 is marked by the tip of the scalpel blade.Source: Photograph by Elisa Boche.
Analytical methodsScanning electron microscopy with energy-dispersive X-ray spectroscopy (SEM-EDX) was carried out with a LEO Stereoscan 440 SEM with SEM-FEG (ZEISS-Ultra+ from the Institut Néel in Grenoble, France) in high-vacuum mode at 20 kV, both instruments equipped with a Brucker SDD X-FLASH 4030 EDX for chemical analyses. Raman spectra were obtained with a laser at 514 cm-1 using a Jobin-Yvon-Horiba T640000 equipped with a microscope with three lenses (×10, ×50 and ×100 magnification) from Institut Néel. Major, minor and trace elements were quantified by particle induced X-ray emission (PIXE) analysis on the external microbeam of a 3MV tandem accelerator. The X-ray diffraction (XRD) computed tomography experiment was performed at the Institut Néel (Cersoy et al. 2015).

15. Archaeology of JSARN–124 site 3, central-western Arnhem Land 441
terra australis 47
The samples obtained from Panels A, C, D and E exhibit comparable micro-stratigraphies under optical magnification. In each case, these consist of 1) an underlying large white opaque or translucent matrix, superimposed by 2) a thin red or yellow layer of paint pigment (e.g. Figures 15.21 and 15.22). Three samples (GN1-2, GN1-5 and GN1-6) each exhibit an additional outer (surface) crust layer that entirely or partially covers and protects the paint layer.
The cross-section of sample GN1-4, originating from the intersection of Images #6 and #9, reveals a succession of 1) an underlying white matrix, covered by 2) a discontinuous yellowish layer, superimposed by 3) a layer of light red, itself superimposed by 4) a thin layer of dark red of similar thickness to the light red layer below it.
Figure 15.21 Four samples (together comprising GN1-11) from the intersection of the spear painting (Image #9) and large bird motif (Image #5).Source: Photograph by Emilie Chalmin.
Figure 15.22 Cross-sections from Panel A.A: Sample GN1-2, from the spear painting (Image #9) associated with the large bird motif. B: Sample GN1-4, from the anthropomorph (Image #6) and spear (Image #9).
Source: Photographs by Géraldine Castets.
The underlying rock matrixIn each sample, the relatively thick white rock matrix that underlies the layer of paint is mainly opaque and can include more or less large translucent crystals of quartz 100–500 μm long. The presence of quartz is confirmed by the chemical composition of the crystals (SiO2) and by their structure as revealed by both Raman micro-spectroscopy and XRD. The nature of the white opaque matrix is more difficult to identify due to its weak crystallinity. SEM-EDX chemical mapping across several cross-sections reveals an extensive matrix containing mainly Al, P and

442 The Archaeology of Rock Art in Western Arnhem Land, Australia
terra australis 47
K, with minor Na and Mg, in which are found small crystals of SiO2 (<50 μm long), TiO2 (c. 10 μm long) and CaSO4 (c. 10 μm long) (Figure 15.23). Tiny inclusions are also observed in this large matrix, including zircon (ZrSiO4), barium sulphate (BaSO4), compounds of Sr and, less commonly, Ce and La (only observed for sample GN1-11). All these associated chemistries are consistent with the composition of the quartzite bedrock.
Both the bedrock and the white matrix contain all of the above elements and compounds, but these occur in higher concentrations within the white matrix than in the bedrock. These higher concentrations are a result of the dissolution and redeposition of bedrock chemistries into the white matrix (Chalmin et al. 2017; Wray 2013). The white matrix is also composed of high proportions of alumino-potassic-phosphate, a compound that is not present in the bedrock. The alumino-potassic-phosphate is here identified as leucophosphite (K(Fe, Al)2(PO4)2(OH)(H20)), with a small percentage of Fe substituting for Al, as determined by XRD-computed tomography on sample GN1-3 (Chalmin et al. 2015, 2017). The presence of leucophosphite in the white matrix enhances adherence of the overlying red paint onto the white matrix.
Figure 15.23 SEM-EDX (ZEISS-Ultra+, 30 kV) chemical mapping across the cross-section of sample GN1-11.Source: Photographs by Emilie Chalmin.
Raman analyses on a number of samples reveal both chemical and structural evidence of gypsum (CaSO42H2O). The gypsum is confirmed for samples GN1-3, GN1-4, GN1-5, GN1-6, GN1-8 and GN1-11; all are from Panel A. Additionally, even if this gypsum compound is not clearly identified for the samples coming from the two macropods (GN1-1, GN1-2), the presence of both elements Ca and S is consistent with its presence. Gypsum sometimes occurs as small crystals embedded within the white matrix (e.g. in sample GN1-11), and sometimes as a homogeneous sublayer between the white matrix and the overlying pigment layer (e.g. in sample GN1-3).
Optical microscopy reveals that black particles a few microns long are embedded in the white matrix of almost all samples. Raman analysis indicates that these are black soot, probably from landscape fires (cf. Gunn 2011).
The paint layersThe colour intensity of the paint layer relates closely to the thickness of the layer and thus to the quantity of paint. The chemical mapping as observed by the SEM-EDX in back-scattered electron (BSE) mode further confirms this close correlation between the intensity of red colouring (highlighting the red paint layer) and the incidence of iron in sample cross-sections. The spatial patterning of element distributions across sample cross-sections allows for an enhanced characterisation of the micro-stratigraphy of individual samples as well as a better determination of the thickness of each layer. The thickness of the paint layer varies from 3 μm to 360 μm between samples. The thickest paint layers occur in samples where the paint layer is capped by

15. Archaeology of JSARN–124 site 3, central-western Arnhem Land 443
terra australis 47
a mineral crust that protects the paint from leaching away. In many samples, the paint layer is well preserved in the micro-pores or micro-fractures of the bedrock’s surface. Nevertheless, wherever a paint layer is found, it is particularly thin and it occurs close to the surface of the rock wall. The thinness of all the paint layers is largely explained by some degree of leaching of the rock wall surface. However, strong adhesion of paint matter on and in the rough rock surface has allowed for the preservation of paintings over considerable periods of time. In no sample did optical microscopy or chemical mapping reveal more than a single layer of paint in any of the cross-sections, except for sample GN1-4 that exhibits three layers of paint (see below). The chemical mapping carried out on the cross-sections confirms the absence of diffusion of pigment into the surrounding matrix, but rather suggests that paint layers on or near the rock surface exhibit considerable degrees of adherence and stability.
Raman micro-spectroscopy confirms the presence of essentially ‘pure’ iron oxides as the paint layers (but see below for associated trace elements observed independently): haematite (Fe2O3) for the red pigment and goethite (FeOOH) for the yellow (Figure 15.24).
Figure 15.24 Raman spectra obtained on samples GN1-2, GN1-3, GN1-6 and GN1-8, revealing the presence of haematite (H), goethite (G), quartz (Q) and gypsum (Gy).Source: Illustration by Emilie Chalmin.
444 The Archaeology of Rock Art in Western Arnhem Land, Australia
terra australis 47
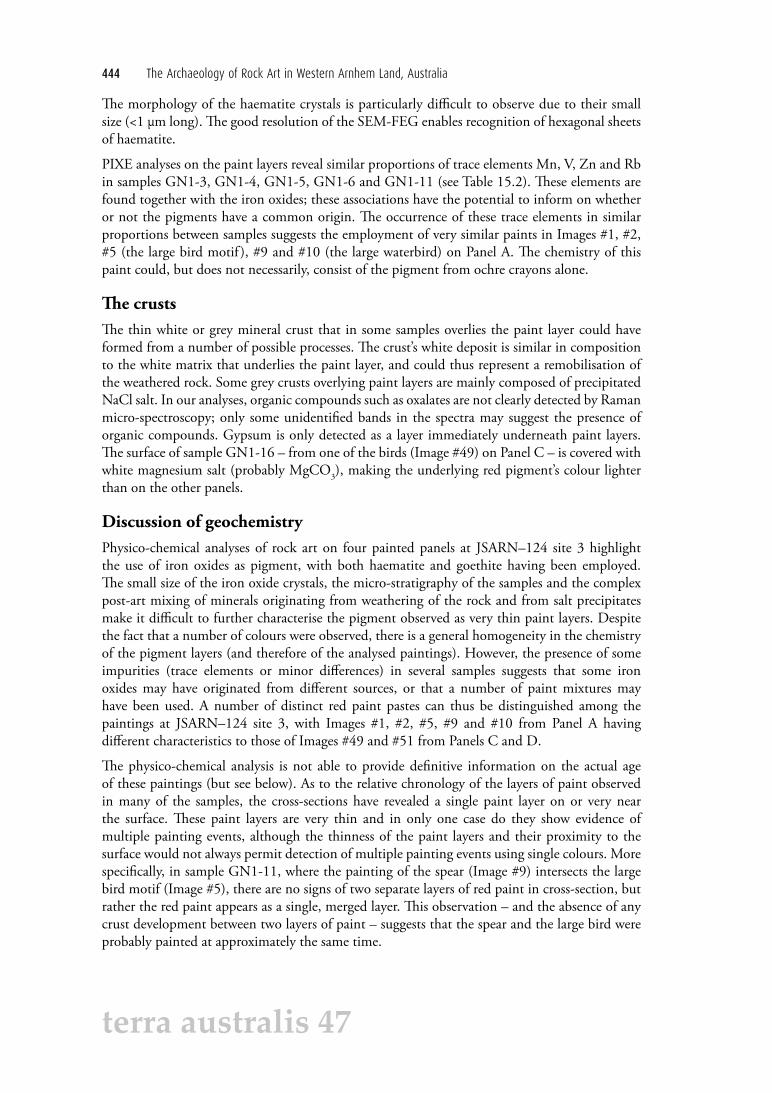
The morphology of the haematite crystals is particularly difficult to observe due to their small size (<1 μm long). The good resolution of the SEM-FEG enables recognition of hexagonal sheets of haematite.
PIXE analyses on the paint layers reveal similar proportions of trace elements Mn, V, Zn and Rb in samples GN1-3, GN1-4, GN1-5, GN1-6 and GN1-11 (see Table 15.2). These elements are found together with the iron oxides; these associations have the potential to inform on whether or not the pigments have a common origin. The occurrence of these trace elements in similar proportions between samples suggests the employment of very similar paints in Images #1, #2, #5 (the large bird motif ), #9 and #10 (the large waterbird) on Panel A. The chemistry of this paint could, but does not necessarily, consist of the pigment from ochre crayons alone.
The crustsThe thin white or grey mineral crust that in some samples overlies the paint layer could have formed from a number of possible processes. The crust’s white deposit is similar in composition to the white matrix that underlies the paint layer, and could thus represent a remobilisation of the weathered rock. Some grey crusts overlying paint layers are mainly composed of precipitated NaCl salt. In our analyses, organic compounds such as oxalates are not clearly detected by Raman micro-spectroscopy; only some unidentified bands in the spectra may suggest the presence of organic compounds. Gypsum is only detected as a layer immediately underneath paint layers. The surface of sample GN1-16 – from one of the birds (Image #49) on Panel C – is covered with white magnesium salt (probably MgCO3), making the underlying red pigment’s colour lighter than on the other panels.
Discussion of geochemistryPhysico-chemical analyses of rock art on four painted panels at JSARN–124 site 3 highlight the use of iron oxides as pigment, with both haematite and goethite having been employed. The small size of the iron oxide crystals, the micro-stratigraphy of the samples and the complex post-art mixing of minerals originating from weathering of the rock and from salt precipitates make it difficult to further characterise the pigment observed as very thin paint layers. Despite the fact that a number of colours were observed, there is a general homogeneity in the chemistry of the pigment layers (and therefore of the analysed paintings). However, the presence of some impurities (trace elements or minor differences) in several samples suggests that some iron oxides may have originated from different sources, or that a number of paint mixtures may have been used. A number of distinct red paint pastes can thus be distinguished among the paintings at JSARN–124 site 3, with Images #1, #2, #5, #9 and #10 from Panel A having different characteristics to those of Images #49 and #51 from Panels C and D.
The physico-chemical analysis is not able to provide definitive information on the actual age of these paintings (but see below). As to the relative chronology of the layers of paint observed in many of the samples, the cross-sections have revealed a single paint layer on or very near the surface. These paint layers are very thin and in only one case do they show evidence of multiple painting events, although the thinness of the paint layers and their proximity to the surface would not always permit detection of multiple painting events using single colours. More specifically, in sample GN1-11, where the painting of the spear (Image #9) intersects the large bird motif (Image #5), there are no signs of two separate layers of red paint in cross-section, but rather the red paint appears as a single, merged layer. This observation – and the absence of any crust development between two layers of paint – suggests that the spear and the large bird were probably painted at approximately the same time.

15. Archaeology of JSARN–124 site 3, central-western Arnhem Land 445
terra australis 47
In the only sample exhibiting evidence of multiple paint layers, sample GN1-4 from the intersection of the spear (Image #9) and the large anthropomorph (Image #6), a layer of dark red and a separate layer of light red indicate two different painting events. It is not possible from the cross-sections alone to determine which of the two layers relates to 1) the spear (Image #9) and 2) the anthropomorph (Image #6). However, the dark red of the spear visually corresponds in colour to the upper, dark-red layer, while the light red of the anthropomorph corresponds in colour to the underlying, light-red layer. We therefore conclude that the spear overlies the anthropomorph, which is consistent with the pattern of superimposition evident from the D-Stretch enhancement (see Figure 15.6).
We may even say a little more about the relative age of the spear and anthropomorph paintings by reference to the relative thickness of their paint layers (the dark- and light-red layers respectively). As noted above, across the site as a whole, those samples with a protective surface crust have a noticeably thicker underlying paint layer than those without a crust. Sample GN1-4 does not have a protective crust on its surface. However, the dark-red layer acts as a protective veneer over the light-red layer, by the fact that it overlies it. That the two red layers of sample GN1-4 are of similar thickness, and that the uppermost, dark-red layer is currently exposed to the elements (i.e. devoid of a protective crust), suggests that the underlying light-red layer was originally thicker than it is now, having been slowly removed by minor water-wash and other forms of weathering over time. That is, we suggest that the two layers of red pigment were not painted in a single artistic event, but rather that some reasonable amount of time elapsed between the two painting events.
The discontinuous yellow layer under both the red layers is diffuse, making it difficult to determine whether it is a layer of pigment in its own right (i.e. representing a yellow painting that is too faded, weathered away or covered by subsequent paintings to see on Panel A today) or the product of alteration of the white matrix through weathering. It is unlikely to represent the ‘bleeding’ of the overlying red layer in contact with the white matrix, because in all other cross-sections the pigment layers have relatively distinct boundaries when in contact with the white matrix, indicating great stability of the well-adhered pigment.
The presence of gypsum as a thin layer of crystalised salt below the pigment layers across the span of Panel A, as well as on Panels D and E, can be attributed to a period when salts were being leached out of the bedrock and re-deposited on the rock face through the prolonged condensation of water, prior to the making of the paintings. Prior to the artworks, the rock surface thus contained a thin, extensive but discontinuous crust of gypsum on its surface. This discontinuous crust layer induces a subsequent spalling effect, as observed locally on the present surface of Panel A (Doehne 2002; Hernanz et al. 2007). As previously documented at other rock art sites (Goodall et al. 2009; Hernanz et al. 2007), gypsum efflorescence tends to weaken the stability of rock surfaces. Elsewhere, in northeastern Australia, Goodall et al. (2009) have previously interpreted the presence of gypsum in stratified micro-layers over or under rock art as an indicator of dry climatic conditions, due to exposed gypsum’s solubility in water during wetter conditions.
Overall, these results cannot falsify the idea that the oldest paintings at JSARN–124 site 3, including the large bird motif itself and its associated spear painting, have a late Pleistocene antiquity. Rather, these analyses indicate that 1) the paintings were made after a dry phase (see below for a more refined interpretation); and 2) they theoretically could have survived on such a surface over a very long period of time. As far as the chemistry is concerned, whether they did or did not remains in question.
446 The Archaeology of Rock Art in Western Arnhem Land, Australia
terra australis 47
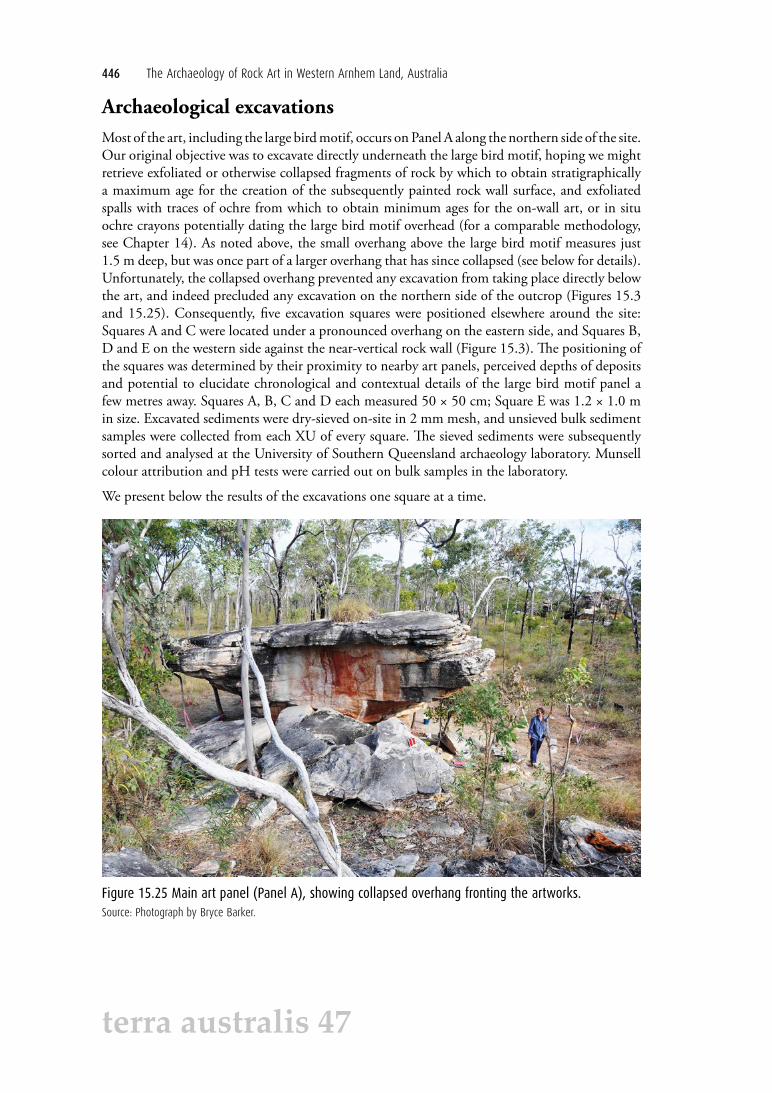
Archaeological excavationsMost of the art, including the large bird motif, occurs on Panel A along the northern side of the site. Our original objective was to excavate directly underneath the large bird motif, hoping we might retrieve exfoliated or otherwise collapsed fragments of rock by which to obtain stratigraphically a maximum age for the creation of the subsequently painted rock wall surface, and exfoliated spalls with traces of ochre from which to obtain minimum ages for the on-wall art, or in situ ochre crayons potentially dating the large bird motif overhead (for a comparable methodology, see Chapter 14). As noted above, the small overhang above the large bird motif measures just 1.5 m deep, but was once part of a larger overhang that has since collapsed (see below for details). Unfortunately, the collapsed overhang prevented any excavation from taking place directly below the art, and indeed precluded any excavation on the northern side of the outcrop (Figures 15.3 and 15.25). Consequently, five excavation squares were positioned elsewhere around the site: Squares A and C were located under a pronounced overhang on the eastern side, and Squares B, D and E on the western side against the near-vertical rock wall (Figure 15.3). The positioning of the squares was determined by their proximity to nearby art panels, perceived depths of deposits and potential to elucidate chronological and contextual details of the large bird motif panel a few metres away. Squares A, B, C and D each measured 50 × 50 cm; Square E was 1.2 × 1.0 m in size. Excavated sediments were dry-sieved on-site in 2 mm mesh, and unsieved bulk sediment samples were collected from each XU of every square. The sieved sediments were subsequently sorted and analysed at the University of Southern Queensland archaeology laboratory. Munsell colour attribution and pH tests were carried out on bulk samples in the laboratory.
We present below the results of the excavations one square at a time.
Figure 15.25 Main art panel (Panel A), showing collapsed overhang fronting the artworks.Source: Photograph by Bryce Barker.
15. Archaeology of JSARN–124 site 3, central-western Arnhem Land 447
terra australis 47
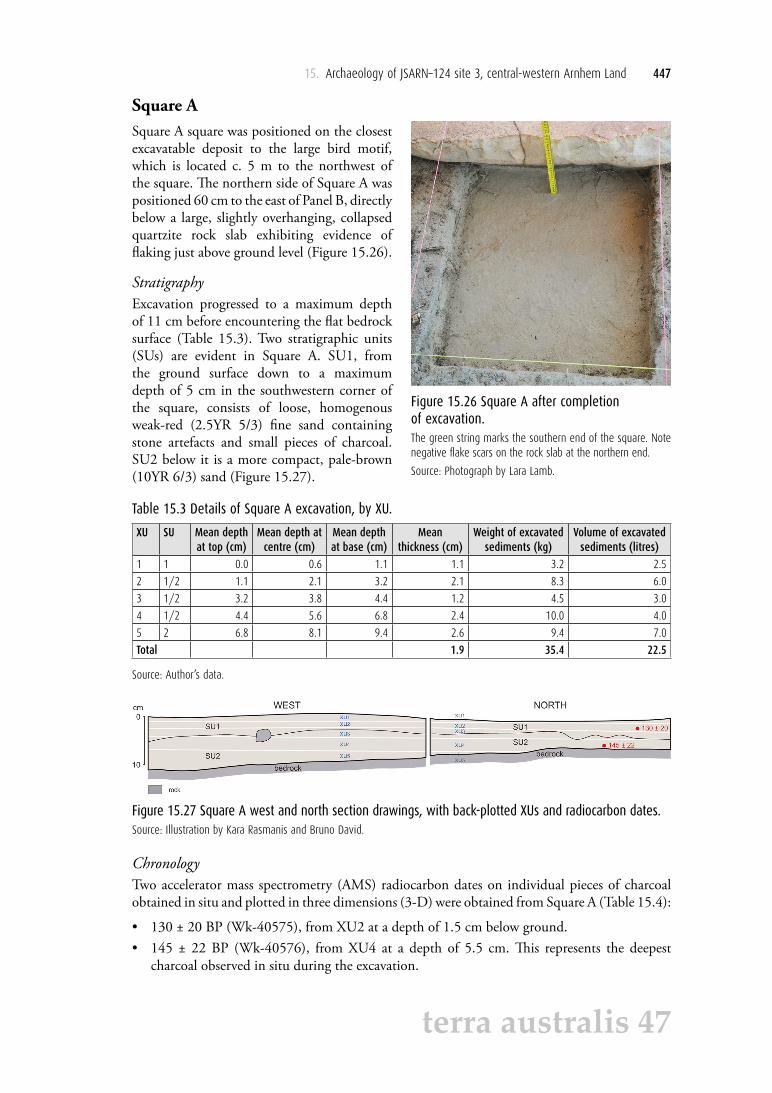
Square ASquare A square was positioned on the closest excavatable deposit to the large bird motif, which is located c. 5 m to the northwest of the square. The northern side of Square A was positioned 60 cm to the east of Panel B, directly below a large, slightly overhanging, collapsed quartzite rock slab exhibiting evidence of flaking just above ground level (Figure 15.26).
StratigraphyExcavation progressed to a maximum depth of 11 cm before encountering the flat bedrock surface (Table 15.3). Two stratigraphic units (SUs) are evident in Square A. SU1, from the ground surface down to a maximum depth of 5 cm in the southwestern corner of the square, consists of loose, homogenous weak-red (2.5YR 5/3) fine sand containing stone artefacts and small pieces of charcoal. SU2 below it is a more compact, pale-brown (10YR 6/3) sand (Figure 15.27).
Figure 15.26 Square A after completion of excavation. The green string marks the southern end of the square. Note negative flake scars on the rock slab at the northern end.
Source: Photograph by Lara Lamb.
Table 15.3 Details of Square A excavation, by XU.
XU SU Mean depth at top (cm)
Mean depth at centre (cm)
Mean depth at base (cm)
Mean thickness (cm)
Weight of excavated sediments (kg)
Volume of excavated sediments (litres)
1 1 0.0 0.6 1.1 1.1 3.2 2.5
2 1/2 1.1 2.1 3.2 2.1 8.3 6.0
3 1/2 3.2 3.8 4.4 1.2 4.5 3.0
4 1/2 4.4 5.6 6.8 2.4 10.0 4.0
5 2 6.8 8.1 9.4 2.6 9.4 7.0
Total 1.9 35.4 22.5
Source: Author’s data.
Figure 15.27 Square A west and north section drawings, with back-plotted XUs and radiocarbon dates.Source: Illustration by Kara Rasmanis and Bruno David.
ChronologyTwo accelerator mass spectrometry (AMS) radiocarbon dates on individual pieces of charcoal obtained in situ and plotted in three dimensions (3-D) were obtained from Square A (Table 15.4):
• 130 ± 20 BP (Wk-40575), from XU2 at a depth of 1.5 cm below ground. • 145 ± 22 BP (Wk-40576), from XU4 at a depth of 5.5 cm. This represents the deepest
charcoal observed in situ during the excavation.

448 The Archaeology of Rock Art in Western Arnhem Land, Australia
terra australis 47
Table 15.4 Radiocarbon determinations from Squares A–E.
XU SU Depth (cm)
Wk- laboratory code
% modern 14C age (years BP)
Calibrated age BP(68.3% probability)
Calibrated age BP(95.4% probability)
Median calibrated
age BP
Square A
2 1 1.5 40575 98.4 ± 0.2 130 ± 20 15–3571–117
132–145214–229251–267
11–4259–149
186–270
104
4 2 5.5 40576 98.2 ± 0.3 145 ± 22 10–3283–97
108–112137–150174–177185–224255–272
5–3765–118
124–152169–231243–281
138
Square B
4 2 8.1 40577 81.6 ± 0.2 1632 ± 20 1526–1555 1418–14611484–14891517–15691584–1598
1503
8 2 14.9 40578 82.2 ± 0.2 1575 ± 20 1415–14461452–14641478–15051514–1522
1411–1526 1468
10 2 19.9 40579 80.9 ± 0.2 1702 ± 20 1564–1618 1553–16291655–1692
1642
12 3 22.6 40580 75.6 ± 0.2 2248 ± 20 2184–21982202–22332305–2328
2159–22522300–2338
2276
14 3 26.2 40581 57.2 ± 0.1 4482 ± 20 5049–50695109–51245167–51985211–5276
5041–50925097–51435157–5286
5120
17 3 36.3 40582 33.1 ± 0.1 8882 ± 30 9921–99609987–10,043
10,055–10,09510,113–10,150
9901–10,171 10,036
19 3 40.4 32128 22.5 ± 0.1 11,983 ± 35 13,748–13,84813,908–13,933
13,739–13,976 13,857
Square C
3 2 6.8 40583 96.3 ± 0.2 303 ± 20 306–320379–427
302–333351–436
342
7 2 15.0 40584 92.5 ± 0.2 630 ± 20 561–573577–595634–652
556–607624–660
615
8 2 17.0 40585 73.8 ± 0.2 2444 ± 25 2380–23942403–24122423–24952597–2611 2638–2684
2380–23942403–2412
2398
Square D
4 2 4.0 40586 98.9 ± 0.2 89 ± 20 34–71116–133228–252
31–138223–256
180

15. Archaeology of JSARN–124 site 3, central-western Arnhem Land 449
terra australis 47
XU SU Depth (cm)
Wk- laboratory code
% modern 14C age (years BP)
Calibrated age BP(68.3% probability)
Calibrated age BP(95.4% probability)
Median calibrated
age BP
8 2 13.3 40587 94.5 ± 0.2 458 ± 20 504–517 498–527 512
11 2 20.9 40588 73.7 ± 0.2 2448 ± 20 2384–23882432–24972595–26122637–2687
2361–25392587–26162632–2699
2601
15 3 27.8 40589 73.6 ± 0.2 2459 ± 20 2461–25082529–25362590–26152634–2697
2379–24152420–2545
2417
20 3 31.3 40590 36.2 ± 0.1 8160 ± 27 9030–90949100–9121
9014–91389174–92079216–9245
9190
22 3 41.3 40591 40.5 ± 0.1 7254 ± 27 8014–80568091–81108118–81338138–8154
8008–8161 8084
Square E
4 1 5.9 50535 98.2 ± 0.3 149 ± 20 9–31138–151173–179182–223257–274
3–3571–117
132–153169–229251–282
142
5 1 6.4 40536 98.0 ± 0.2 164 ± 20 8–21144–151172–216267–278
0–3283–8991–97
108–112137–155166–224256–284
110
6 2 7.4 40537 98.1 ± 0.2 156 ± 20 9–24141–151173–220262–275
0–3374–114
136–153168–225254–283
144
7 2 10.1 40538 97.5 ± 0.2 207 ± 20 0–8151–172278–292
0–13147–188198–212269–300
193
9 2 15.2 40540 86.7 ± 0.2 1143 ± 20 987–10311048–1068
977–10881108–11431160–1172
1125
11 2 21.1 40541 85.5 ± 0.2 1256 ± 22 1180–11871204–1256
1092–11081129–11321147–11581173–1277
1139
12 2 23.8 40574 87.0 ± 0.2 1121 ± 20 982–10131020–10351044–1056
970–1063 1016
13 3 26.7 40542 56.7 ± 0.2 4551 ± 23 5084–51025139–51615283–5311
5061–51135118–51845218–52215269–5316
5201

450 The Archaeology of Rock Art in Western Arnhem Land, Australia
terra australis 47
XU SU Depth (cm)
Wk- laboratory code
% modern 14C age (years BP)
Calibrated age BP(68.3% probability)
Calibrated age BP(95.4% probability)
Median calibrated
age BP
13 3 26.4 40543 42.1 ± 0.1 6946 ± 27 7727–77987808–7823
7694–7839 7766
14 3 28.0 40544 31.4 ± 0.1 9314 ± 33 10,444–10,45010,495–10,573
10,412–10,59010,628–10,647
10,609
16 3 27.3 40546 31.8 ± 0.1 9205 ± 32 10,282–10,408 10,254–10,43710,457–10,488
10,447
18 3 29.6 40548 28.9 ± 0.1 9968 ± 35 11,272–11,40511,457–11,46511,564–11,593
11,264–11,50211,523–11,606
11,512
15 3 30.3 40545 11.9 ± 0.1 17,113 ± 83 20,520–20,759 20,407–20,905 20,656
All 14C ages are AMS on single pieces of charcoal. Calibrations undertaken using Calib 7.1 (IntCal13) (Reimer et al. 2013).
Source: Authors’ data.
Excavated materialsA total of 114.2 g of charcoal was excavated from Square A. Discard rates were broadly consistent throughout the shallow deposit (Table 15.5; Figure 15.28).
Table 15.5 Excavated materials retained in 2 mm mesh sieves from Square A, by XU.
XU Non-cultural sediments Charcoal Stone artefacts Other organics Insect larvae Land snail shell
g g # g g g g
1 3.8 2.3 1 0.6 96.5 0.1 0
2 6.2 53.5 11 13.9 37.0
3 7.6 17.2 12 6.6 14.2
4 47.8 36.7 12 6.1 12.2
5 88.7 22.5 17 7.7 8.5
Total 154.1 114.2 53 35.0 168.4 0.1 0
Source: Authors’ data.
Figure 15.28 Distribution of charcoal and stone artefacts by XU, Square A.Source: Illustration by Jerome Mialanes and Lara Lamb.
Square A contains 53 stone artefacts with a total weight of 35.0 g (Table 15.5; Figure 15.28). The assemblage is fairly homogenous in terms of mean weight and size (maximum dimensions), as well as length, width and thickness. The variable but small sample size by XU limits our conclusions (Figure 15.29).

15. Archaeology of JSARN–124 site 3, central-western Arnhem Land 451
terra australis 47
Figure 15.29 Mean maximum length and weight distribution of stone artefacts from Square A, by XU. Source: Illustration by Jerome Mialanes and Lara Lamb.
All artefacts are made of quartzite. These can be further sub-divided into two types, micro-crystalline (grain size <0.5 mm, present in all XUs) and fine-grained quartzite (0.5–1.0 mm grain size, present in XU4 and XU5 only; see Figure 15.30). A peak in the weight of micro-crystalline quartzite artefacts in XU2 is due to a single, relatively large artefact weighing 10.9 g.
Figure 15.30 Distribution of stone artefacts by raw material type for Square A, by XU. Source: Illustration by Jerome Mialanes and Lara Lamb.
Unipolar, freehand percussion (complete) flakes (47 per cent of all stone artefacts from Square A) dominate the stone artefact assemblage in all XUs, followed by flaked pieces (26 per cent) and broken ‘other’ (13 per cent), which is a category reserved for broken flakes that cannot be neatly categorised as proximal, distal, medial or lateral pieces (Table 15.6). A single retouched flake was recovered from XU2, produced on micro-crystalline quartzite of a similar Munsell colour (2.5Y 8/1) to the quartzite block that rests atop the northern end of the square. This flake is retouched along 100 per cent of its two lateral margins, which run roughly parallel to each other. The flake is 55.5 mm along its longest lateral margin and 22 mm wide; it also has two parallel dorsal ridges, all of which give the artefact the appearance of a ‘blade’. One heavily reduced bipolar core (rotated 90°) was recovered from XU3. It is 27 mm long (maximum dimension),

452 The Archaeology of Rock Art in Western Arnhem Land, Australia
terra australis 47
and was reduced by two visible platforms; it has 14 negative flake scars originating from both platforms combined. The dominant colours throughout the artefact assemblage are light- to brownish-grey (10YR 8/1 to 10YR 6/2) and light-grey to greyish-yellow (2.5Y 8/1 to 2.5Y 7/2). Less than 5 per cent of the total flaked stone artefacts are reddish-grey (10Y 4/4 to 10R 6/6) in colour; these could not have come from the core stone slab immediately adjacent to Square A.
Table 15.6 Distribution of fracture types among the stone artefacts, Square A, by XU.
XU Bipolar core
Broken flake (other)
Complete flake
Distal flake
Flaked piece
Proximal flake
Retouched flake
Right-split cone
Total
1 1 1
2 2 4 1 3 1 11
3 1 2 7 2 12
4 1 7 4 12
5 1 7 2 5 1 1 17
Total 1 7 25 3 14 1 1 1 53
Source: Authors’ data.
Square BThe eastern side of Square B was positioned directly against the rock outcrop, some 2 m adjacent to art Panel C. Square B was excavated down to a maximum depth of 96.3 cm, where bedrock was reached (Figure 15.31).
Figure 15.31 Square B after completion of excavation.Source: Photograph by Bryce Barker.

15. Archaeology of JSARN–124 site 3, central-western Arnhem Land 453
terra australis 47
StratigraphySediments in Square B consist of four SUs (Table 15.7). SU1 spans from ground surface to a maximum depth of 7 cm; it consists of loose, homogeneous weak-red sand (2.5YR 5/3). SU2 below it extends to a maximum depth of 32.7 cm below ground, and consists of slightly more compact pale-brown sand (10YR 6/3). SU3 goes down to a maximum depth of 45 cm, and consists of light yellowish-brown sand (10YR 6/4) with large, angular quartzitic sandstone blocks. SU4 consists of light yellowish-brown sand (10YR 6/4) with angular quartzitic sandstone blocks and small rounded pisoliths at its base (Figure 15.32).
Table 15.7 Details of Square B excavation, by XU.
XU SU Mean depth at top (cm)
Mean depth at centre (cm)
Mean depth at base (cm)
Mean thickness (cm)
Weight of excavated sediments (kg)
Volume of excavated sediments (litres)
1 1 0.0 0.4 0.7 0.7 3.0 1.0
2 1 0.7 1.7 2.6 1.9 6.0 4.0
3 1/2 2.6 3.7 4.8 2.2 6.0 5.5
4 1/2 4.8 6.1 7.4 2.6 9.6 6.5
5 1/2 7.4 8.2 9.0 1.6 5.0 3.5
6 2 9.0 10.0 11.1 2.1 6.4 4.5
7 2 11.1 12.1 13.2 2.1 7.4 5.0
8 2 13.2 14.5 15.9 2.7 9.6 7.5
9 2/3 15.9 17.2 18.5 2.6 7.4 6.5
10 2/3 18.5 19.4 20.4 1.9 6.5 4.0
11 2/3 20.4 21.1 21.8 1.4 3.6 2.0
12 2/3 21.8 22.6 23.5 1.7 7.2 3.0
13 2/3 23.5 24.1 24.7 1.2 5.1 2.0
14 2/3 24.7 25.6 26.5 1.8 7.3 3.5
15 2/3 26.5 27.7 29.0 2.5 8.8 5.5
16 3 29.0 29.9 30.9 1.9 8.6 5.0
17 3 30.9 33.0 35.2 4.3 9.6 6.0
18 3 35.2 36.6 38.1 2.9 9.3 6.0
19 3/4 38.1 39.9 41.7 3.6 8.6 4.0
20 3/4 41.7 42.7 43.8 2.1 6.8 4.0
21 3/4 43.8 44.4 45.0 1.2 7.1 4.0
22 4 45.0 45.8 46.7 1.7 2.4 1.0
23 4 46.7 46.9 47.2 0.5 0.8 0.5
24 4 47.2 48.4 49.7 2.5 16.9 3.0
25 4 49.7 50.3 50.9 1.2 3.8 2.0
26 4 50.9 51.7 52.6 1.7 3.5 2.0
27 4 52.6 53.6 54.7 2.1 5.0 2.0
28 4 54.7 55.8 56.9 2.2 12.6 5.0
29 4 56.9 57.2 57.6 0.7 3.8 1.5
30 4 57.6 58.6 59.6 2.0 5.2 3.0
31 4 59.6 59.9 60.3 0.7 6.8 3.5
32 4 60.3 61.7 63.2 2.9 7.7 4.0
33 4 63.2 63.8 64.5 1.3 4.5 3.0
34 4 64.5 64.8 65.1 0.6 2.0 1.5
35 4 65.1 65.8 66.5 1.4 3.2 2.0
36 4 66.5 67.1 67.7 1.2 9.8 6.0
37 4 67.7 69.2 70.7 3.0 7.6 4.0

454 The Archaeology of Rock Art in Western Arnhem Land, Australia
terra australis 47
XU SU Mean depth at top (cm)
Mean depth at centre (cm)
Mean depth at base (cm)
Mean thickness (cm)
Weight of excavated sediments (kg)
Volume of excavated sediments (litres)
38 4 70.7 71.6 72.5 1.8 8.1 4.0
39 4 72.5 73.9 75.3 2.8 8.2 5.0
40 4 75.3 76.3 77.4 2.1 7.2 4.0
41 4 77.4 3.6 81.0 3.6 10.7 5.5
42 4 81.0 82.9 84.8 3.7 8.6 5.0
43 4 84.8 86.1 87.5 2.7 6.6 4.0
44 4 87.5 88.7 89.9 2.4 6.4 4.0
45 4 89.9 91.7 93.5 3.6 7.2 4.0
Total 2.07 307.5 172.5
Source: Authors’ data.
NORTH
Square E Square B
xu44
SU1
SU2
SU3
SU4
0
10
cm
20
30
40
50
149 ± 20
207 ± 20
1121 ± 20
4551 ± 23 6946 ± 279314 ± 3317,113 ± 83
9205 ± 32
60
70
80
90
100
110
Roots
Excavation Units
Collapsed rocks below overhang
Exfoliated rocks
Pisoliths (product of bedrock alteration)
Bedrock©JJD 2015
xu1
xu2xu3xu4xu5xu6xu7
xu8
xu9xu10
xu11xu12xu13
xu14
xu15xu16
xu17
xu18
xu19
xu20xu21xu22
xu23 xu24xu25xu26
xu28
xu27
xu29xu30
xu31xu32xu33
xu34xu35xu36
xu38
xu39
xu37
xu40
xu41
xu42
xu43
xu45
1375 ± 20
1702 ± 20
4482 ± 20
xu1xu2 xu3xu4
xu5xu6
xu7xu9xu8
xu10
xu11xu12
xu13 xu14xu15xu16
xu17xu18xu19
xu20 xu21xu22xu23xu24
xu25
xu26
11,983 ± 35
Figure 15.32 Squares B+E north section drawing, with back-plotted XUs and radiocarbon dates.Source: Illustration by Kara Rasmanis, Bruno David and Jean-Jacques Delannoy.
ChronologySeven AMS radiocarbon dates on individual pieces of charcoal collected in situ were obtained from Square B (Table 15.4). Radiocarbon dates of 1632 ± 20 BP (Wk-40577) from 8.1 cm depth in XU4, 1575 ± 20 BP (Wk-40578) from 14.9 cm depth in XU8 and 1702 ± 20 BP (Wk-40579) from 19.9 cm depth in XU10 all calibrate to a similar age within the range 1411–1692 cal BP (see Table 15.4 for details). All three determinations are from SU2. Below these in SU3, four dates of 2248 ± 20 BP (Wk-40580) from 22.6 cm depth, 4482 ± 20 BP (Wk-40581) from 26.2 cm depth, 8882 ± 30 BP (Wk-40582), from 36.3 cm depth and 11,983 ± 35 BP (Wk-32128) from 40.4 cm depth are in correct chrono-stratigraphic order, indicating good stratigraphic integrity of deposits. No in situ charcoal was obtained from SU4.

15. Archaeology of JSARN–124 site 3, central-western Arnhem Land 455
terra australis 47
The Square B ages of 13,739–13,976 cal BP at 40.4 cm depth and 9901–10,171 cal BP at 36.3 cm depth, are separated by c. 3821 years over 4.1 cm vertical depth (= 0.11 cm of sediment build-up/100 years, taking the median calibrated ages). Those of 9901–10,171 cal BP at 36.3 cm depth and 5041–5286 cal BP at 26.2 cm depth, are separated by c. 4916 years over 10.1 cm vertical depth (= 0.21 cm/100 years). And those of 5041–5286 cal BP at 26.2 cm depth and 2159–2338 cal BP at 22.6 cm depth, are separated by c. 2844 years over 3.6 cm vertical depth (= 0.13 cm/100 years). These results suggest a fairly consistent pattern of sediment build-up from terminal Pleistocene times through much of the Holocene.
Excavated materialsA total of 441.9 g of charcoal was excavated from Square B (Table 15.8). The pattern of discard for charcoal shows four distinct phases (Figure 15.33):
• Phase 1 (SU4): From XU45 to XU22 in SU4 in the undated lower levels of the square, which are older than 13,739–13,976 cal BP, charcoal densities are low with a total weight of 2.8 g.
• Phase 2 (SU3): Charcoal densities increase markedly above XU21 at the SU4–SU3 interface, dating from c. 13,739–13,976 cal BP, to XU15 dating to c. 5041–5286 cal BP at the top of SU3. This period saw an average charcoal net deposition rate of 12.0 g/1000 years.
• Phase 3 (SU3-SU2 interface): From XU14 at the top of SU3 dating to c. 5041–5286 cal BP, to XU11 at the bottom of SU2 dating to c. 1553–1692 cal BP, there is a decrease to 7.2 g/1000 years in charcoal deposition rates, marking a hiatus or period of ephemeral occupation lasting c. 3500 years.
• Phase 4 (SU2): Charcoal deposition rates then increase gradually from XU12 dating to c. 2159–2338 cal BP, to XU10 dating to c. 1553–1692 cal BP in SU2. During that period, net charcoal deposition rates averaged 39.7 g/1000 years, and continued to increase to 1361.8 g/1000 years into XU4, dating to c. 1418–1598 cal BP (see Table 15.8 for raw data).
Table 15.8 Excavated materials retained in 2 mm mesh sieves from Square B, by XU.
XU Non-cultural sediments
Charcoal Stone artefacts Other organics
Insect larvae Land snail shell
g g # g g g g
1 28.9 9.0 53.0 0.4 0.1
2 30.0 7.0 4 0.8 2.2
3 26.3 3.7 10.4
4 20.2 7.9 7.7
5 26.0 9.9 9.4
6 33.1 25.0 1 0.09 5.0
7 112.2 99.9 8 0.01 7.5
8 309.7 98.0 8 0.3 7.6
9 132.9 30.5 9.1
10 114.0 16.8 15 0.01 9.5
11 30.2 5.6 6 0.2 3.0
12 29.0 5.2 11 1.38 2.2
13 30.7 5.8 2 9.7 0.9
14 146.0 8.6 15 3.8 2.0
15 276.0 14.2 17 25.4 4.1
16 1300.0 15.6 11 26.4 0.5
17 1144.0 21.8 22 62.6 0.9
18 818.0 30.0 39 44.9 2.0

456 The Archaeology of Rock Art in Western Arnhem Land, Australia
terra australis 47
XU Non-cultural sediments
Charcoal Stone artefacts Other organics
Insect larvae Land snail shell
g g # g g g g
19 573.0 15.1 16 11.7 0.6
20 995.0 5.0 19 35.1 4.9
21 894.0 3.4 17 42.1 5.8
22 437.0 0.8 10 83.7 1.3
23 233.8 0.4 6 2.0 1.2
24 248.7 0.1 4 0.9 1.1
25 911.0 0.6 11 47.8 0.1
26 1007.5 0.4 16 10.1 0.8
27 1300.0 0.1 10 8.6 1.3
28 4580.0 0.4 13 18.7 0.9
29 1421.0 0.05 7 1.6 <0.1
30 3512.0 0.1 <0.1
31 4438.7 0.3 1.0
32 3254.0 0.04 3 9.6 0.9
33 2982.0 0.06 1.4
34 1538.0 0.01 0.1
35 1649.7 0.03 5 30.3 0.1
36 2941.8 0.03 7 90.2 0.3
37 3841.4 0.02 3 60.2 0.6
38 3944.0 0.01 0.2
39 5439.5 0.01 2 7.9 0.2
40 4547.5 0.03 0.2
41 7306.6 0.5 0.1
42 4795.0 0.1
43 4681.3 0.08
44 4985.0 0.03
45 2344.3 0.01
Total 79,160.3 441.9 308 636.0 159.0 0.4 0.1
Source: Authors’ data.
Ochrous pisoliths. Two of the excavated pisoliths were analysed for their chemistry to determine whether or not such pisoliths could have been used to make some or all of the red artworks at the site. Both pisoliths are red (10R 4/6 to 2.5YR 4/8) in colour, as are many of the others found within the excavated sequence. No striations or other marks of use are evident under magnification.
For both pieces, SEM (at 20 kV with a LEO Stereoscan 440 SEM coupled by EDX) reveals a structure consisting of microscopic sheets of red pigment. These sheets vary in thickness from a few microns to c. 10 μm each. They mainly contain Fe as iron oxide mixed with 1:1 Al:Si ratios, as found in kaolinite clay.
PIXE analysis (3 MV microprobe, AGLAE Facility, Paris) indicates that the outer concretion coating the fragment from XU26 contains a higher content of SiO2 and TiO2 than internally. This outer coating is mainly composed of large quartz grains (>200 μm long). Minor elements of the inner parts of both samples include Mg, P, S, K. In both samples the low incidence of Ca, V and Mn is comparable to those measured in the painting samples from art Panel A (see Table 15.9).

15. Archaeology of JSARN–124 site 3, central-western Arnhem Land 457
terra australis 47
Figure 15.33 Distribution of charcoal and stone artefacts by XU, Square B.Source: Illustration by Jerome Mialanes and Lara Lamb.
Table 15.9 Quantitative composition of the two analysed pisoliths from XU21 and XU26 in Square B, as determined by PIXE analyses (in oxide weights).
Pisolith Major elements Minor elements (ppm) Trace elements (ppm)
XU21 Al2O
3: 24.4%
SiO2: 29.5%
Fe2O
3: 44.7%
MgO: 4130P
2O
5: 995
SO2: 609
TiO2: 3720
K2O: 1383
Cr2O
3: 9119
CaO: 199V
2O
3: 262
MnO2: 214
ZrO2: 93
XU26 Al2O
3: 17.7%
SiO2: 66.8%
TiO2: 1.1%
Fe2O
3: 13.0%
MgO: 2463P
2O
5: 2007
K2O: 2355
Cr2O
3: 3099
ZrO2: 3442
CaO: 253V
2O
3: 645
MnO2: 150
Source: Authors’ data.

458 The Archaeology of Rock Art in Western Arnhem Land, Australia
terra australis 47
The chemical composition of both analysed pisoliths is consistent with the chemistry of the red paint layers in samples GN1-5 and GN1-6 of Panel A (Images #1 and #2), GN1-16 of Panel C (Image #49) and GN1-9 of Panel D (Image #51). However, the chemistry of the clay-containing pisoliths is not consistent with that of the other on-wall paint samples, which do not show any evidence of the presence of clays. This suggests that local pisoliths could have been used to paint some of the red paintings analysed at the site, including but not limited to the two macropods on Panel A, but probably not all of the red paintings because, unlike the analysed local pisoliths, some are devoid of clays.
Stone artefacts. A total of 308 stone artefacts with a total weight of 636.0 g was excavated from Square B (Table 15.8; Figure 15.33). Eight raw material types are represented: fine-grained quartzite (41.6 per cent), micro-crystalline quartzite (39.3 per cent), sandstone (4.8 per cent), calcified quartzite (4.6 per cent), chert (3.6 per cent), coarse-grained quartzite (with 1.0–2.0 mm long grain size, 2.6 per cent), milky quartz (2.9 per cent) and silcrete (0.6 per cent).
Among the flaked stone artefacts, the frequency of fracture types is dominated by flaked pieces (60.7 per cent), followed by complete flakes (16.9 per cent), distal portions (8.4 per cent) and broken ‘other’ (7.5 per cent) (Table 15.10). Other fracture types represent <2 per cent of the assemblage. The single retouched flake in Square B comes from XU16. It consists of a piece of sandstone with one margin retouched along c. 50 per cent of its length. The assemblage also contains two unipolar cores, from XU36 (55 g) and XU37 (45 g), on sandstone and find-grained quartzite respectively. Their relatively large sizes contribute to the higher mean weights and maximum dimensions of these two XUs (Figure 15.34).
Table 15.10 Distribution of fracture types among the stone artefacts, Square B, by XU.
XU Bipolar core
Broken flake
(other)
Complete flake
Distal flake
Flaked piece
Left-split cone
Medial flake
Proximal flake
Retouched flake
Right-split cone
Unipolar core
Total
1
2 2 2 4
3
4
5
6 1 1
7 3 5 8
8 1 1 1 4 1 8
9
10 1 4 10 15
11 2 4 6
12 2 2 2 5 11
13 1 1 2
14 3 11 1 15
15 3 1 11 1 1 17
16 3 5 1 1 1 11
17 1 5 3 13 22
18 2 4 6 25 2 39
19 1 6 2 7 16
20 2 4 1 10 1 1 19
21 2 13 1 16
22 3 1 1 5 10
23 2 4 6

15. Archaeology of JSARN–124 site 3, central-western Arnhem Land 459
terra australis 47
XU Bipolar core
Broken flake
(other)
Complete flake
Distal flake
Flaked piece
Left-split cone
Medial flake
Proximal flake
Retouched flake
Right-split cone
Unipolar core
Total
24 1 1 2 4
25 3 2 1 5 11
26 1 3 12 16
27 2 6 2 10
28 2 1 10 13
29 2 5 7
30
31
32 1 2 3
33
34
35 1 4 5
36 6 1 7
37 1 1 1 3
38
39 1 1 2
Total 1 23 52 26 187 6 2 5 1 2 2 307
Source: Authors’ data.
The flaked stone assemblage exhibits very little cortex (3.2 per cent of artefacts). Coupled with the overall small size of the artefacts, the implications are late stage reduction sequences.
There are clear peaks in numbers and total weights of stone artefacts around XU14–XU21 and XU25–XU28 (Figure 15.33). These peaks are largely due to increased frequencies of the two principal raw material types, fine-grained and micro-crystalline quartzite (Figure 15.35). However, when calculated as deposition rates, there is little evidence of major variation through the sequence, with a minor decrease from 8.9 artefacts/1000 years to 6.7 artefacts/1000 years between 1503–1642 cal BP and 0–1503 cal BP.
Figure 15.34 Mean weight and maximum length of stone artefacts from Square B, by XU. Source: Illustration by Jerome Mialanes and Lara Lamb.
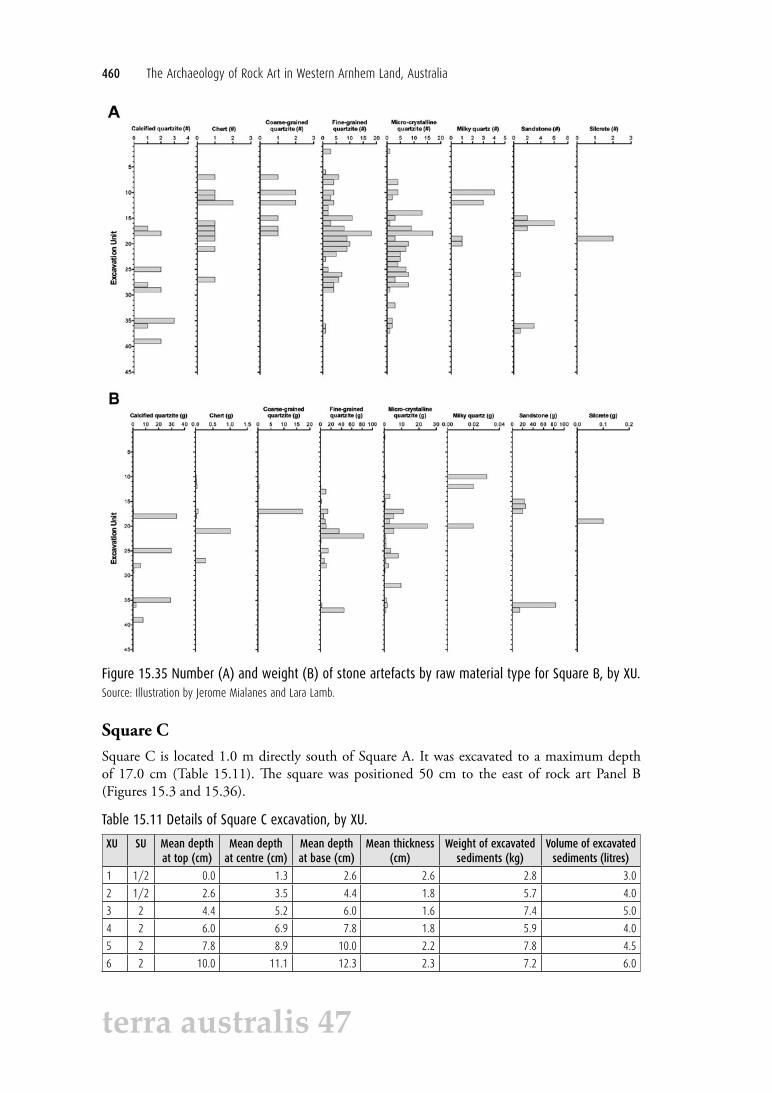
460 The Archaeology of Rock Art in Western Arnhem Land, Australia
terra australis 47
Figure 15.35 Number (A) and weight (B) of stone artefacts by raw material type for Square B, by XU.Source: Illustration by Jerome Mialanes and Lara Lamb.
Square CSquare C is located 1.0 m directly south of Square A. It was excavated to a maximum depth of 17.0 cm (Table 15.11). The square was positioned 50 cm to the east of rock art Panel B (Figures 15.3 and 15.36).
Table 15.11 Details of Square C excavation, by XU.
XU SU Mean depth at top (cm)
Mean depth at centre (cm)
Mean depth at base (cm)
Mean thickness (cm)
Weight of excavated sediments (kg)
Volume of excavated sediments (litres)
1 1/2 0.0 1.3 2.6 2.6 2.8 3.0
2 1/2 2.6 3.5 4.4 1.8 5.7 4.0
3 2 4.4 5.2 6.0 1.6 7.4 5.0
4 2 6.0 6.9 7.8 1.8 5.9 4.0
5 2 7.8 8.9 10.0 2.2 7.8 4.5
6 2 10.0 11.1 12.3 2.3 7.2 6.0

15. Archaeology of JSARN–124 site 3, central-western Arnhem Land 461
terra australis 47
XU SU Mean depth at top (cm)
Mean depth at centre (cm)
Mean depth at base (cm)
Mean thickness (cm)
Weight of excavated sediments (kg)
Volume of excavated sediments (litres)
7 2 12.3 13.5 14.7 2.4 9.8 6.0
8 2 14.7 15.8 17.0 2.3 9.8 7.0
Total 2.1 56.4 39.5
Source: Authors’ data.
Figure 15.36 Square C after completion of excavation.Green stringline (left-hand side of excavation) is on south side of square.
Source: Photograph by Lara Lamb.
StratigraphySquare C has two SUs. SU1 extends from the ground surface down to a maximum depth of 4 cm. It consists of loose weak-red (2.5YR 5/3) sand with considerable quantities of charcoal and recent plant matter (e.g. leaves, rootlets). SU2 below it extends down to bedrock. It consists of more compact pale-brown (10YR 6/3) sand (Figure 15.37).
Figure 15.37 Square C west and north section drawings, with back-plotted XUs and radiocarbon dates.Source: Illustration by Kara Rasmanis and Bruno David.

462 The Archaeology of Rock Art in Western Arnhem Land, Australia
terra australis 47
ChronologyThree AMS radiocarbon dates on individual pieces of charcoal were obtained from Square C:
• 303 ± 20 BP (Wk-40583) (calibrating to 302–436 cal BP), from 6.8 cm depth in XU3.• 630 ± 20 BP (Wk-40584) (calibrating to 556–660 cal BP), from 15.0 cm depth in XU7.• 2444 ± 25 BP (Wk-40585) (calibrating to 2380–2412 cal BP), from 17.0 cm depth in XU8.
All dates are from SU2 and are in good chrono-stratigraphic order (Table 15.4). The 2 cm vertical depth of sediment spanning c. 1783 years (based on the median calibrated ages) separating the XU8 calibrated age of 2380–2412 cal BP and the XU7 age of 556–660 cal BP indicates low net sedimentation rates prior to 556–660 cal BP.
Excavated materialsA total of 382.0 g of charcoal was excavated from Square C (Table 15.12; Figure 15.38). SU2 has average net deposition rates of 126.8 g/1000 years for charcoal, and 19.1 stone artefacts/1000 years.
Table 15.12 Excavated materials retained in 2 mm mesh sieves from Square C, by XU.
XU Non-cultural sediments Charcoal Stone artefacts Other organics Insect larvae Land snail shell
g g # g g g g
1 14.4 31.0 1 0.1 16.1 0.1
2 21.3 45.7 1 0.7 5.8 0.2
3 22.5 59.9 2 0.4 4.3
4 62.5 48.4 8 1.0 2.9
5 44.9 63.5 6 0.3 5.9
6 154.3 55.2 3 0.4 0.8
7 2012.2 45.6 14 2.3 0.9
8 800.7 31.7 13 208.7 1.2
Total 3132.8 382.0 48 214.1 37.9 0.1 0.2
Source: Authors’ data.
Figure 15.38 Distribution of charcoal and stone artefacts by XU, Square C.Source: Illustration by Jerome Mialanes and Lara Lamb.
A total of 48 flaked stone artefacts was recovered from Square C, with a combined weight of 214.1 g (Table 15.12; Figure 15.38). Seven raw material types are represented, dominated by fine-grained and micro-crystalline quartzite (41.7 per cent and 35.4 per cent respectively). This is followed by silcrete (8.3 per cent) and chert (6.3 per cent). Also represented are crystalline quartz, a chert/silcrete composite, silcrete and calcified quartzite each comprising less than 5 per cent of the assemblage (Figure 15.39).

15. Archaeology of JSARN–124 site 3, central-western Arnhem Land 463
terra australis 47
Figure 15.39 Number (A) and weight (B) of stone artefacts by raw material type for Square C, by XU. Source: Illustration by Jerome Mialanes and Lara Lamb.
Flaked pieces represent the highest proportion of the flaked artefacts (43.8 per cent), followed by complete flakes and distal portions (18.8 per cent each) and broken ‘other’ (6.3 per cent). The remaining fracture types all represent <5 per cent of the assemblage. There is a single unipolar core from XU8, made on fine-grained quartzite (Table 15.13). The core has two extant, adjacent platforms, with a combined three negative flake scars. Weighing 190 g and measuring 85 mm in maximum length, the core was far from exhausted when discarded. Given that quartzite is plentiful in this landscape, this is not remarkable. The large size of the core accounts for the major peak in mean weights of discarded artefacts in XU8, in what is otherwise a very sparse flaked stone artefact assemblage (Figure 15.40).

464 The Archaeology of Rock Art in Western Arnhem Land, Australia
terra australis 47
Table 15.13 Distribution of fracture types among the stone artefacts, Square C, by XU.
XU Bipolar complete
flake
Bipolar core
Broken flake
(other)
Complete flake
Distal flake
Flaked piece
Medial flake
Proximal flake
Unipolar core
Total
1 1 1
2 1 1
3 1 1 2
4 1 4 1 2 8
5 1 4 1 6
6 2 1 3
7 1 1 2 4 5 1 14
8 1 1 3 7 1 13
Total 1 1 3 9 9 21 1 2 1 48
Source: Authors’ data.
Figure 15.40 Mean weight of stone artefacts from Square C, by XU.Source: Illustration by Jerome Mialanes and Lara Lamb.
Square DSquare D is located on the northwestern side of the rock stack, 2.5 m north of Square B. The excavation square’s eastern wall directly abuts the outcrop’s rock wall at ground level. The square is positioned c. 3.0 m southwest of art Panel A that contains the large bird motif (Figures 15.3 and 15.41).
Figure 15.41 Square D, showing in situ termite nest at base of excavation.The string line is along the west side of the square.
Source: Photograph by Lara Lamb.

15. Archaeology of JSARN–124 site 3, central-western Arnhem Land 465
terra australis 47
StratigraphySquare D contains three SUs; excavation proceeded to a maximum depth of 59.4 cm (Table 15.14). SU1 spans from ground surface to a maximum depth of 8 cm. It consists of loose weak-red sand (2.5YR 5/3) that contains abundant plant matter (leaf litter, rootlets) and charcoal. SU2 below it extends to a maximum depth of 26 cm below ground; it is more compact pale-brown sand (10YR 6/3) with abundant charcoal and numerous stone artefacts. SU3 extends down to bedrock at 59.4 cm depth. It is light yellowish-brown sand (10YR 6/4), and contains large, angular quartzitic sandstone blocks. A large termite nest is present underground within SU3, spanning from 46 cm below surface down to bedrock. The termite nest is well delimited and abuts the rock wall in the northeastern corner of the square. The nest has a hard outer surface; it was left intact and not excavated (Figures 15.41 and 15.42).
Table 15.14 Details of Square D excavation, by XU.
XU SU Mean depth at top (cm)
Mean depth at centre (cm)
Mean depth at base (cm)
Mean thickness (cm)
Weight of excavated
sediments (kg)
Volume of excavated
sediments (litres)
1 1/2 0.0 0.3 0.6 0.6 0.8 0.7
2 1/2 0.6 1.4 2.2 1.6 4.0 2.8
3 1/2 2.2 2.8 3.5 1.3 4.0 4.0
4 1/2 3.5 4.4 5.3 1.8 5.6 5.0
5 1/2 5.3 6.3 7.3 2.0 6.5 5.0
6 1/2 7.3 8.2 9.2 1.9 6.1 5.0
7 2 9.2 10.0 10.8 1.6 5.1 4.5
8 2 10.8 11.8 12.8 2.0 6.8 6.0
9 2 12.8 14.2 15.7 2.9 7.8 6.0
10 2 15.7 17.0 18.3 2.6 8.2 6.0
11 2 18.3 19.5 20.8 2.5 7.3 3.0
12 2 20.8 21.5 22.3 1.5 5.8 3.0
13 2/3 22.3 23.0 23.7 1.4 4.8 3.5
14 2/3 23.7 24.5 25.3 1.6 5.2 3.0
15 3 25.3 26.4 27.5 2.2 6.9 1.5
16 3 27.5 28.1 28.8 1.3 5.9 3.0
17 3 28.8 29.5 30.3 1.5 5.4 3.0
18 3 30.3 31.0 31.7 1.4 5.2 3.0
19 3 31.7 32.4 33.2 1.5 6.3 2.0
20 3 33.2 34.0 34.8 1.6 7.2 4.0
21 3 34.8 36.4 38.0 3.2 6.4 4.0
22 3 38.0 38.9 39.9 1.9 5.4 4.0
23 3 39.9 40.5 41.1 1.2 6.1 3.0
24 3 41.1 42.4 43.8 2.7 7.0 4.5
25 3 43.8 45.2 46.7 2.9 6.4 4.0
26 3 46.7 48.5 50.4 3.7 13.7 6.7
27 3 50.4 51.3 52.2 1.8 6.0 3.0
28 3 52.2 54.8 57.5 5.3 9.3 6.0
Total 2.0 175.2 109.2
Source: Authors’ data.

466 The Archaeology of Rock Art in Western Arnhem Land, Australia
terra australis 47
Figure 15.42 Square D north section with back-plotted XUs and radiocarbon dates.Source: Illustration by Kara Rasmanis, Bruno David and Jean-Jacques Delannoy.
ChronologySix AMS radiocarbon dates were obtained on individual pieces of charcoal from Square D. Three of these come from SU2, and three come from SU3:
• SU2: Dates of 89 ± 20 BP (Wk-40586) (calibrating to 31–256 cal BP) from 4.0 cm depth in XU4; 458 ± 20 BP (Wk-40587) (calibrating to 498–527 cal BP) from 13.3 cm depth in XU8; and 2448 ± 20 BP (Wk-40588) (calibrating to 2361–2699 cal BP) from 20.9 cm depth in XU11, are in good chrono-stratigraphic order. The determination of 2448 ± 20 BP dates the base of SU2, as indicated also by a similar date (see below) for the very top of SU3.
• SU3: 2459 ± 20 BP (Wk-40589) (calibrating to 2379–2545 cal BP) from 27.8 cm depth in XU15; 8160 ± 27 BP (Wk-40590) (calibrating to 9014–9245 cal BP) from 31.3 cm depth in XU20; and 7254 ± 27 BP (Wk-40591) (calibrating to 8008–8161 cal BP) from 41.3 cm depth in XU22.
Given that the two lowermost SU3 dates are considerably older than the SU2 dates, the determination of 2459 ± 20 BP that is akin to the age of the base of SU2 was probably post-depositionally displaced downwards from the SU2–SU3 interface: there are only 3.8 cm of sediment between the base of SU2 and that radiocarbon date. There is also a slight inversion within SU3 between dates of 8160 ± 27 BP (31.3 cm depth in XU20) and 7254 ± 27 BP (41.3 cm depth in XU22). The younger of these two dates came from very close to the rock wall in the eastern section of the square. That rock wall is fully exposed to the elements, and fine sediments including charcoal particles may have post-depositionally moved slightly downward through factors such as wet-season rainwater action against the rock wall.

15. Archaeology of JSARN–124 site 3, central-western Arnhem Land 467
terra australis 47
The sequence of dates in Square D shows a similar pattern of slow sedimentation rates as seen in Square B a few metres to the south. In Square D, the calibrated age of 9014–9245 cal BP at 31.3 cm depth is separated from a calibrated age of 2379–2545 cal BP at 27.8 cm depth, representing a period of c. 6773 years (based on median calibrated ages) for just 3.5 cm of deposit at an average net sedimentation rate of 0.05 cm/100 years (see Table 15.4 for radiocarbon dates).
Excavated materialsA total of 260 g of charcoal was excavated from Square D. As with Square B nearby, beginning c. 2600 cal BP there is a major, seven-fold increase in net charcoal deposition rates through time from 10.2 g/1000 years in SU3 to 76.5 g/1000 years in SU2. In Square D, this increase in deposition rates is only apparent above XU12, representing the SU3–SU2 interface (Table 15.15; Figure 15.43).
Table 15.15 Excavated materials retained in 2 mm mesh sieves from Square D, by XU.
XU Non-cultural sediments
Charcoal Stone artefacts Other organics
Insect larvae Land snail shell
g g # g g g g
1 34.1 22.9 12.4 0.02 0.01
2 38.2 16.3 10.6
3 41.1 12.3 1 0.1 9.9 0.01
4 59.5 32.5 14.9
5 81.7 20.0 1 0.2 31.0
6 76.2 15.5 4 0.5 6.0
7 101.4 6.3 2 4.03 17.3
8 159.9 19.9 2 0.2 9.3
9 195.4 18.2 5 0.5 5.4
10 478.7 21.3 6 0.8 9.4
11 348.4 13.1 4 1.06 0.8
12 329.8 6.5 12 8.6 1.0
13 442.9 3.6 12 46.5 3.1
14 615.5 3.8 12 141.0 0.8
15 255.0 2.9 10 13.3 0.3
16 456.2 1.9 8 638.1 0.6
17 545.9 8.9 9 23.6 1.3
18 530.2 3.5 6 12.5 1.4
19 342.5 4.4 5 223.0 2.1
20 1124.9 5.9 14 205.0 2.4
21 1005.2 5.2 6 5.1 1.3
22 1213.0 9.6 6 21.1 2.4
23 1612.6 1.0 5 119.4 1.2
24 2018.3 0.8 3 26.5 2.2
25 1733.9 1.4 4 1.2 1.5
26 2632.9 0.7 2 1.7 0.8
27 2387.8 1.9 3.0
28 4006.3 0.2 3.2
Total 22,868.0 260.5 139 1494.8 155.6 0.03 0.01
Source: Authors’ data.

468 The Archaeology of Rock Art in Western Arnhem Land, Australia
terra australis 47
Figure 15.43 Distribution of charcoal and stone artefacts by XU, Square D.Source: Illustration by Jerome Mialanes and Lara Lamb.
A total of 139 flaked stone artefacts with a combined weight of 1494.8 g was excavated from Square D (Table 15.15; Figure 15.43). Four raw material types are represented (Figure 15.44): fine-grained quartzite (41.7 per cent), sandstone (29.5 per cent), micro-crystalline quartzite (25.2 per cent) and coarse-grained quartzite (3.6 per cent). The high proportion of sandstone artefacts distinguishes the assemblage from those of other squares. These sandstone artefacts have a mean weight of 26.2 g (and maximum of 499 g), adding considerably to the overall weight of the flaked stone artefacts.
Fracture types are dominated by flaked pieces (41.0 per cent), followed by complete flakes (33.1 per cent) and broken ‘other’ (10.8 per cent). Distal portions, left-split cones, medial and proximal portions, retouched flakes, unipolar cores and right-split cones each represent less than 5 per cent of the assemblage (Table 15.16). Each of the two retouched flakes was made on sandstone; they are both retouched on both the left and distal margins (along 21 per cent and 12 per cent of the length, respectively).

15. Archaeology of JSARN–124 site 3, central-western Arnhem Land 469
terra australis 47
Figure 15.44 Number (A) and weight (B) of stone artefacts by raw material type for Square D, by XU.Source: Illustration by Jerome Mialanes and Lara Lamb.
Table 15.16 Distribution of fracture types among the stone artefacts from Square D, by XU.
XU Broken flake
(other)
Complete flake
Distal flake
Flaked piece
Left-split cone
Medial flake
Proximal flake
Retouched flake
Right-split cone
Unipolar core
Total
1
2
3 1 1
4
5 1 1
6 2 1 1 4
7 1 1 2
8 2 2
9 3 1 1 5
10 3 1 1 1 6
11 1 1 1 1 4
12 9 1 2 12

470 The Archaeology of Rock Art in Western Arnhem Land, Australia
terra australis 47
XU Broken flake
(other)
Complete flake
Distal flake
Flaked piece
Left-split cone
Medial flake
Proximal flake
Retouched flake
Right-split cone
Unipolar core
Total
13 3 2 5 1 1 12
14 1 4 1 5 1 12
15 1 2 7 10
16 4 1 2 1 8
17 2 3 4 9
18 4 1 1 6
19 1 3 1 5
20 3 3 8 14
21 1 3 1 1 6
22 1 4 1 6
23 1 3 1 5
24 2 1 3
25 1 3 4
26 1 1 2
Total 15 46 6 57 2 2 5 2 1 3 139
Source: Authors’ data.
The distribution of raw materials through time reveals several patterns worthy of note. First, there are no exotic materials in Square D; both the sandstone and quartzite could have been sourced from the shelter itself. SU3 is characterised by a predominance of fine-grained quartzite and sandstone. SU2 marks a noticeable shift in use from these raw materials to micro-crystalline quartzite of a brown/reddish hue (10YR, 2.5YR and 5YR) (Figure 15.44). SU2 is also characterised by a decrease in stone artefact discard rates, from 17.3 artefacts/1000 years in SU3 to 9.6 artefacts/1000 years in SU2, and by a decrease in the mean weight and maximum length of artefacts (Figure 15.45). There appears to be a correlation between the prevalence of micro-crystalline quartzite and smaller, complete flakes in SU2, although the sample size is probably too small to draw definitive conclusions from these patterns.
Figure 15.45 Mean weight and maximum length of stone artefacts from Square D, by XU. Source: Illustration by Jerome Mialanes and Lara Lamb.

15. Archaeology of JSARN–124 site 3, central-western Arnhem Land 471
terra australis 47
Square ESquare E originally covered an area 1.0 × 1.0 m, but the square was extended by a further 20 cm along its northern edge in order to remove large unstable and unsupported rocks revealed during the excavation. Along its eastern edge, Square E is contiguous with Square B, and was thus positioned to continue excavating Square B to greater depth than would have otherwise been possible (Figure 15.46).
Figure 15.46 Square E after completion of excavation.Note the Square B pit on right-hand side abutting the larger excavation pit of Square E.
Source: Photograph by Bryce Barker.
Ground penetrating radarGround penetrating radar (GPR) investigations were undertaken to the southwest and south of the rock stack (Figure 15.47), including the area of Squares B+E, and are extended over Squares C and A by a single profile. GPR lines were collected in an approximately east–west orientation with a spacing of 0.5 m between profiles using a Mala X3M instrument with a 250 Mhz antenna. Acquisition settings include a sampling frequency of 10038 Mhz, a time window of 102 ns, 1024 samples, a trace interval of 0.02 m and four stacks. The data were processed using ReflexW software with a scheme of filters including move start time, subtract mean (dewow), energy decay, background remove, bandpass and running average applied sequentially (Goodman and Piro 2013). The results show that the bedrock morphology revealed by excavation, being of a relatively flat surface with some small pieces of rock present in the stratigraphy above it, is present extensively around the site. The sharp topographic depression revealed in the Square B excavation continues to the south and widens to approximately 2 m with gently sloping sides rather than the precipitous topography shown in excavation. This change in subsurface geomorphology coincides with the southern edge of the sandstone stack.

472 The Archaeology of Rock Art in Western Arnhem Land, Australia
terra australis 47
Figure 15.47 Ground penetrating radar work in progress in the area within and surrounding Square E, prior to excavation.Source: Photograph by Bryce Barker.
Stratigraphy in excavationExcavation in Square E reached a maximum depth of 48 cm, ceasing at a flat bedrock surface (Table 15.17). Square E contains four SUs. SU1 reaches a maximum depth of 14 cm; it consists of loose weak-red sand (2.5YR 5/3). SU2 extends to a maximum depth of 28 cm, consisting of slightly more compact pale-brown sand (10YR 6/3) incorporating some large, angular quartzitic sandstone rocks. SU3 is light yellowish-brown (10YR 6/4) in colour and of similar soft sediment consistency to SU2; it extends to a maximum depth of 43 cm. However, it is marked by a steep increase in the number of large angular sandstone rocks that originated from the rock outcrop above the square. SU4 extends down to bedrock. It consists of a similar light yellowish brown sand (10YR 6/4) to SU3 above it, but contains fewer large angular blocks and an abundance of small rounded pisoliths (Figures 15.32; see also Figure 15.31).
Table 15.17 Details of Square E excavation, by XU.
XU SU Mean depth at top (cm)
Mean depth at centre (cm)
Mean depth at base (cm)
Mean thickness (cm)
Weight of excavated sediments (kg)
1 1 0.0 0.8 1.6 1.6 8.0
2 1 1.6 1.9 2.3 0.7 19.9
3 1 2.3 2.9 3.5 1.2 24.6
4 1/2 3.5 8.9 5.4 1.9 24.2
5 1/2 5.4 6.5 7.6 2.2 29.2
6 1/2 7.6 8.5 9.4 1.8 29.6
7 1/2/3 9.4 10.6 11.9 2.5 31.3
8 1/2/3 11.9 12.8 13.7 1.8 27.4
9 2/3 13.7 15.2 16.7 3.0 25.3

15. Archaeology of JSARN–124 site 3, central-western Arnhem Land 473
terra australis 47
XU SU Mean depth at top (cm)
Mean depth at centre (cm)
Mean depth at base (cm)
Mean thickness (cm)
Weight of excavated sediments (kg)
10 2/3 16.7 18.2 19.7 3.0 26.4
11 2/3 19.7 20.5 21.4 1.7 22.7
12 2/3 21.4 22.2 23.0 1.6 26.0
13 2/3 23.0 24.1 25.3 2.3 27.0
14 2/3 25.3 26.0 26.8 1.5 18.2
15 2/3 26.8 28.0 29.3 2.5 19.3
16 3 29.3 29.9 30.5 1.2 34.4
17 3 30.5 31.4 32.4 1.9 23.2
18 3 32.4 33.3 34.2 1.8 20.1
19 3 34.2 34.5 34.9 0.7 25.7
20 3/4 34.9 36.2 37.6 2.7 21.1
21 3/4 37.6 38.3 39.1 1.5 35.2
22 3/4 39.1 40.2 41.3 2.2 32.0
23 3/4 41.3 41.6 42.0 0.7 19.4
24 3/4 42.0 42.6 43.2 1.2 25.8
25 4 43.2 43.8 44.5 1.3 24.0
26 4 44.5 44.7 45.0 0.5 11.4
27 4 45.0 45.4 45.8 0.8 6.9
28 4 45.8 45.8 45.9 0.1 1.0
29 4 45.9 56.5 47.1 1.2 3.4
Total 1.6 642.7
Source: Authors’ data.
ChronologyA total of 13 radiocarbon dates was obtained from Square E. Two came from SU1, five from SU2 and six from SU3 (Table 15.4). No in situ charcoal was encountered in SU4, and thus no radiocarbon dates were obtained from this lowermost horizon. The dates are in good chrono-stratigraphic order both within and between SUs:
• SU1: 149 ± 20 BP (Wk-50535) at 5.9 cm depth in XU4 and 164 ± 20 BP (Wk-40536) at 6.4 cm depth in XU5.
• SU2: All the dates from SU2 are late Holocene in age. The oldest is 1256 ± 22 BP (Wk-40541) (calibrating to 1092–1277 cal BP) from 21.1 cm depth.
• SU3: 4551 ± 23 BP (Wk-40542) (5061–5316 cal BP) from 26.7 cm depth; 6946 ± 27 BP (Wk-40543) (7694–7839 cal BP) from 26.4 cm depth; 9205 ± 32 BP (Wk-40546) (10,254–10,488 cal BP) from 27.3 cm depth; 9314 ± 33 BP (Wk-40544) (10,412–10,647 cal BP) from 28.0 cm depth; 9968 ± 35 BP (Wk-40548) (11,264–11,606 cal BP) from 29.6 cm depth; and 17,113 ± 83 BP (Wk-40545) (20,407–20,905 cal BP) from 30.3 cm depth.
Square E provides the earliest dated evidence for human use of the site, sometime within the calibrated age range 20,407–20,905 cal BP. However, this is a non-basal age, with a further 17 cm of sediment occurring below the level of this calibrated age. Extending a linear depth-age curve from the surface to the base of the square gives a broad-scale estimate of c. 34,860 years ago for the base of the excavation. However, the lower sediment rates in SU3 of just 3.9 cm every 12,890 years suggest that the base of the cultural sequence – located 15.1 ± 0.4 cm (the depth range representing the thickness of XU27, where the lowest stone artefact is found) below the lowermost calibrated age of 20,407–20,905 cal BP at 30.3 cm depth – is almost certainly much older.

474 The Archaeology of Rock Art in Western Arnhem Land, Australia
terra australis 47
Excavated materialsA total of 576 g of charcoal was excavated from Square E (Table 15.18, Figure 15.48). Charcoal densities are very low in SU3 and SU4, averaging 4.9 g/1000 years in SU3 compared with 384.4 g/1000 years in SU2. This represents a 78-fold increase between the two horizons. Stone artefact discard rates follow a similar pattern, with average deposition rates of 8.7 artefacts/1000 years in SU3 and 261.4 artefacts/1000 years in SU2, representing a 30-fold increase after c. 5061–5316 cal BP. The implication is that the two phases of stone artefact deposition rates, and charcoal densities, are related and the charcoal is probably indicative of landscape firing practices.
Table 15.18 Excavated materials retained in 2 mm mesh sieves from Square E, by XU.
XU Non-cultural sediments
Charcoal Stone artefacts Other organics
Insect larvae Land snail shell
g g # g g g g
1 177.8 9.2 2 0.2 89.4 0.2
2 364.0 31.6 12 2.0 29.2 0.1
3 792.0 33.0 15 4.2 11.1
4 666.6 31.1 11 2.6 7.1
5 908.4 52.9 35 5.9 10.2
6 977.3 62.3 20 5.3 8.3
7 1135.4 71.8 32 9.8 10.2
8 1014.9 55.1 30 37.6 6.3
9 2118.5 66.6 46 58.6 7.6
10 1372.5 37.0 19 154.6 4.5
11 1489.9 28.8 42 255.3 3.7
12 2143.5 21.2 46 636.9 4.1
13 3079.5 15.0 36 253.5 1.5
14 1973.2 11.5 18 132.7 1.0
15 3339.1 7.2 24 246.8 1.6
16 3218.3 8.7 22 387.0 1.2
17 4061.7 4.3 16 512.3 1.2
18 4163.4 5.0 20 1437.2 1.0
19 6609.3 2.7 11 804.4 2.4
20 5124.3 4.5 10 35.9 1.6
21 7628.5 7.4 11 508.0 1.4
22 9007.3 6.5 5 1390.9 1.8
23 5141.3 1.7 1 95.5 0.9
24 7707.4 1.0 4 4151.6 0.9
25 7947.3 0.3 5 3499.0 3.2
26 4673.1 0.1 2 0.8 0.6
27 2181.2 0.2 2 0.2 0.2
28 247.1 0.1 <0.1
29 1703.3 0.1 0.3
Total 90,966.1 576.9 497 14,628.8 215.5 0.2 0.1
Source: Authors’ data.
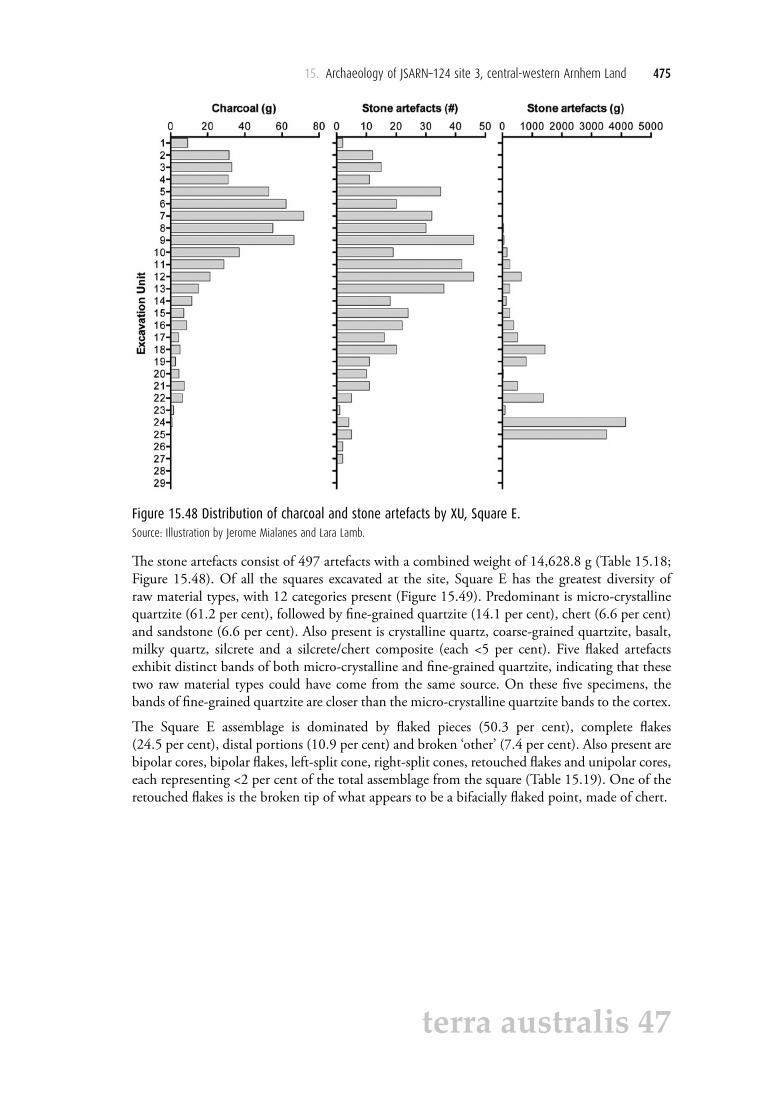
15. Archaeology of JSARN–124 site 3, central-western Arnhem Land 475
terra australis 47
Figure 15.48 Distribution of charcoal and stone artefacts by XU, Square E.Source: Illustration by Jerome Mialanes and Lara Lamb.
The stone artefacts consist of 497 artefacts with a combined weight of 14,628.8 g (Table 15.18; Figure 15.48). Of all the squares excavated at the site, Square E has the greatest diversity of raw material types, with 12 categories present (Figure 15.49). Predominant is micro-crystalline quartzite (61.2 per cent), followed by fine-grained quartzite (14.1 per cent), chert (6.6 per cent) and sandstone (6.6 per cent). Also present is crystalline quartz, coarse-grained quartzite, basalt, milky quartz, silcrete and a silcrete/chert composite (each <5 per cent). Five flaked artefacts exhibit distinct bands of both micro-crystalline and fine-grained quartzite, indicating that these two raw material types could have come from the same source. On these five specimens, the bands of fine-grained quartzite are closer than the micro-crystalline quartzite bands to the cortex.
The Square E assemblage is dominated by flaked pieces (50.3 per cent), complete flakes (24.5 per cent), distal portions (10.9 per cent) and broken ‘other’ (7.4 per cent). Also present are bipolar cores, bipolar flakes, left-split cone, right-split cones, retouched flakes and unipolar cores, each representing <2 per cent of the total assemblage from the square (Table 15.19). One of the retouched flakes is the broken tip of what appears to be a bifacially flaked point, made of chert.

476 The Archaeology of Rock Art in Western Arnhem Land, Australia
terra australis 47
Tabl
e 15
.19
Dist
ribut
ion
of fr
actu
re ty
pes
amon
g th
e st
one
arte
fact
s, S
quar
e E,
by
XU.
XUBi
pola
r co
mpl
ete
flake
Bipo
lar
core
Bipo
lar
dist
al fl
ake
Bipo
lar l
eft-
split
con
eBr
oken
flak
e (o
ther
)Co
mpl
ete
flake
Dist
al
flake
Flak
ed
piec
eLe
ft-sp
lit
cone
Med
ial
flake
Prox
imal
fla
keRe
touc
hed
flake
Righ
t-sp
lit c
one
Unip
olar
co
reTo
tal
12
13
26
24
12
31
54
41
15
44
16
11
51
107
141
134
61
85
41
120
71
29
512
11
132
81
26
515
130
99
104
211
146
101
24
110
119
1113
324
11
42
123
75
281
145
131
35
123
21
36
143
114
18
153
42
141
24
163
216
122
172
32
81
16
188
19
11
20
193
15
11
11
203
21
410
211
13
24
11
221
12
15
231
1
241
21
4
251
31
5
261
12
272
2
Tota
l1
12
137
122
5425
04
38
33
749
6
Sour
ce: A
utho
rs’ d
ata.

15. Archaeology of JSARN–124 site 3, central-western Arnhem Land 477
terra australis 47
The pattern of raw material distribution through time indicates a higher reliance on sandstone in SU3 than elsewhere. A 28-fold increase in average discard rates from SU3 (8.8 artefacts/1000 years) to SU2 (257 artefacts/1000 years) is largely due to an increased incidence of micro-crystalline quartzite, chert and coarse-grained quartzite in SU2. This suggests that the increase is not solely due to increasing use of local quartzites, but to exotic chert as well. Other raw material types are also introduced into SU2, including silcrete and milky quartz. In SU1, deposition rates average 107 artefacts/1000 years, with micro-crystalline quartzite remaining the predominant raw material type (Figure 15.49).
Figure 15.49 Distribution of stone artefacts by raw material type for Square E, by XU.Source: Illustration by Jerome Mialanes and Lara Lamb.
The distribution of fracture types reveals an important trend (Table 15.19). With the exception of a single bipolar core in SU3, all artefacts exhibiting the use of a bipolar or bifacial technique are found in SU2. This corresponds with a horizon of diminished use of sandstone and increased use of micro-crystalline quartzite and exotic materials including silcrete, chert and milky quartz. Also apparent is the reduced mean weight and maximum dimensions of artefacts from SU3 to SU2, corresponding with the diminished use of sandstone, a raw material type that typically produced the larger and heavier flaked stone artefacts in the assemblage (Figures 15.49 and 15.50).

478 The Archaeology of Rock Art in Western Arnhem Land, Australia
terra australis 47
Figure 15.50 Mean weight and maximum length of stone artefacts from Square E, by XU.Source: Illustration by Jerome Mialanes and Lara Lamb.
Working out the history of JSARN–124 site 3 through geomorphological reconstructionAn important, albeit underused, way of exploring the history of decorated rock surfaces is through geomorphology. We can thus begin to explore the history of JSARN–124 site 3’s paintings and hand stencils by seeing the rock stack as two articulating geological components: a geologically in situ base, rock strata D0 and D1; and a superimposing and partly overhanging cap, D3 to D8 (Figures 15.3, 15.51 and 15.52). The rock cap is inclined by the westward tilt of strata D3 to D8, a geologically ancient phenomenon long pre-dating any people in the landscape.
All of the artworks on Panels A–E are painted or stencilled on flat sections of the wall; the flatness of these vertical surfaces contrasts with the overall ruggedness of the profile of strata D0 to D8, each of which is variably resistant to erosion. Figure 15.51 demonstrates the rock stack’s contrasting surfaces. The south face, associated closely with the effects of erosion, has a very rugged profile, whereas the north face on which is found the large bird motif of Panel A is characterised by expansive smooth surfaces. These smooth surfaces were created by the collapse of the outer reaches of a considerably longer overhang than that present today (and thus the art on those surfaces must be more recent than the age of the final collapse(s) that created the surfaces). For the area of Panel A, this is evident by the massive boulder collapse that fronts the north face. The situation is similar for the other smooth surfaces that house art panels (Panels B–E). Each of those smooth surfaces was produced by the collapse of part of the rock wall or overhang, effectively representing the sheer planes of those collapses. Determining the antiquity of those collapses is the key to understanding the maximum possible ages of the paintings that today decorate these smooth wall surfaces. As all of the artworks present today could only have been made after those rock surfaces formed, so we aim to understand the maximum possible age of the artworks by understanding the age of those surfaces. From the onset, one of our major aims of research at JSARN–124 site 3 has thus been to determine the antiquity of wall and overhang collapses in those areas that contain artworks. We have done this by cross-examining surface geomorphological details with the evidence revealed by each of the five archaeological excavations (Squares A–E). A major tool in these investigations was a 3-D laser mapping of the site.

15. Archaeology of JSARN–124 site 3, central-western Arnhem Land 479
terra australis 47
Figure 15.51 South and north-northwest faces of the rock stack at JSARN–124 site 3, showing the contrasting textures of the rock surfaces. Rock art Panels A–D are shown on those surfaces. Source: Illustrations by Jean-Jacques Delannoy.
Figure 15.52 Excavation Squares B+E (western side) and Square C (eastern side), viewed from south side of the rock stack.Source: Illustration by Jean-Jacques Delannoy.

480 The Archaeology of Rock Art in Western Arnhem Land, Australia
terra australis 47
The spatial distribution of the excavation squares around the rock stack allows us to understand the changing configuration of much of the site before, during and after those periods when people were active at the site. We can do this fairly precisely for the eastern (Squares A and C) and western (Squares B+E and D) sides of the rock stack, with the evidence from those investigations allowing us to show conclusively an evolutionary schema for the site as a whole, including the north face that contains the large bird motif. The radiocarbon evidence from the excavations enables us to attribute a chronological framework for the major phases of wall and overhang collapse and, in doing so, for the artworks themselves.
Geomorphology of areas near the excavated squaresThe geomorphological analyses and reconstructions in part focus on Squares A and C on the eastern side of the site, and in part in the area of Squares B+E and D on the western side.
Geomorphology in area of Squares A and CSquares A and C are located on the eastern side of the rock stack (Figure 15.52), adjacent to the Panel B paintings on stratum D3. Both squares are protected from the elements by a c. 3 m wide strata D5–D8 overhang.
The base of Square A lies 9 cm below the present ground surface. The excavation square was positioned on the edge of an exposed rock slab with a smooth surface and flaked edge. This slab lies flat on sandy sediments under the strata D5–D8 overhang. The slab came from ceiling stratum D8. Its flat position on the ground and its flaked edges indicate that it had been moved and worked anthropically after detachment from the rock wall (Figure 15.53).
Figure 15.53 Location of Square A in relation to Panel B and the detached stratum D8 slab (outlined in white-dashed line) that was moved by people to its present position immediately to the north of Square A. Source: Illustration by Jean-Jacques Delannoy.
The base of Square C is at 17 cm depth. The square is located 1.0 m to the south of Square A. Despite the presence of minor clastic elements, like those of Square A the Square C sediments are exclusively composed of sand grains that under microscopic examination exhibit aeolian impact marks (i.e. they are aeolian sands).

15. Archaeology of JSARN–124 site 3, central-western Arnhem Land 481
terra australis 47
The solid rock base of both Squares A and C is hard, flat and slightly sloping southward. The 3° slope is similar to the dip of the rock stack’s pedestal strata D1 and D0, suggesting that the base of the two excavation squares represent the surface of the bedrock (rather than a buried collapsed ceiling slab). To determine this better, we used the site’s digital 3-D model to project the angle of the Square E bedrock base on the western side of the rock stack, towards Square C on its opposite, eastern side, revealing a common dip and perfect (continuous) alignment (Figure 15.54). Given that the base of Square E has been conclusively shown by excavation of the overlying sediments, extending to Square B and hence to the rock stack’s western wall, to represent the quartzitic bedrock (see the results of the archaeological excavations, above), the rocky base of Squares A and C can also be securely identified as bedrock.
Figure 15.54 The dotted horizontal white lines represent the level of the flat rock surfaces at the base of Squares C and E.Source: Illustration by Jean-Jacques Delannoy.
The Panel B artworks occur on the flat, vertical wall surface of strata D3 and D4. That surface was created when parts of a low overhang became detached from the back wall; the collapsed rocks from that detachment are now neither on nor in the ground. In this part of the site, the ground consists of a blanket of aeolian sands directly overlying bedrock. This absence of the fallen rocks requires explanation and remains largely unanswered. Whatever its causes, the collapse of strata D3–D4 is of a considerable antiquity that precedes the presence of people at the site.
Archaeological implications of the geomorphologyThe flat surface on which the Panel B artworks were made is thus also both very old and precedes human presence. The shallowness of the sand layer that blankets the bedrock in this part of the site can be explained by exposure to the dominant winds that, coming from the east-southeast, have a greater tendency to transport sand away from this part of the site than to deposit it here. It is difficult to estimate the sedimentation rates involved, as the deposited sands can be rapidly remobilised by wind to be redeposited further downwind on the western side of the rock stack in the vicinity of Squares B+E and D against the rock stack. The radiocarbon dates from Squares A and C are in correct chrono-stratigraphic order, indicating that the present sand sheet dates at least to the past 2444 ± 25 BP (2380–2412 cal BP) (Table 15.4).
The detached rock slab at the northern edge of Square A (see Figure 15.26) is not in its original position. It originated from the collapse of the upper part of the overhang nearby (stratum D8), but its current location away from its originating position, its flat, sub-horizontal positioning on aeolian sands and the presence of extensive flaking along its edge indicate that it was moved and worked
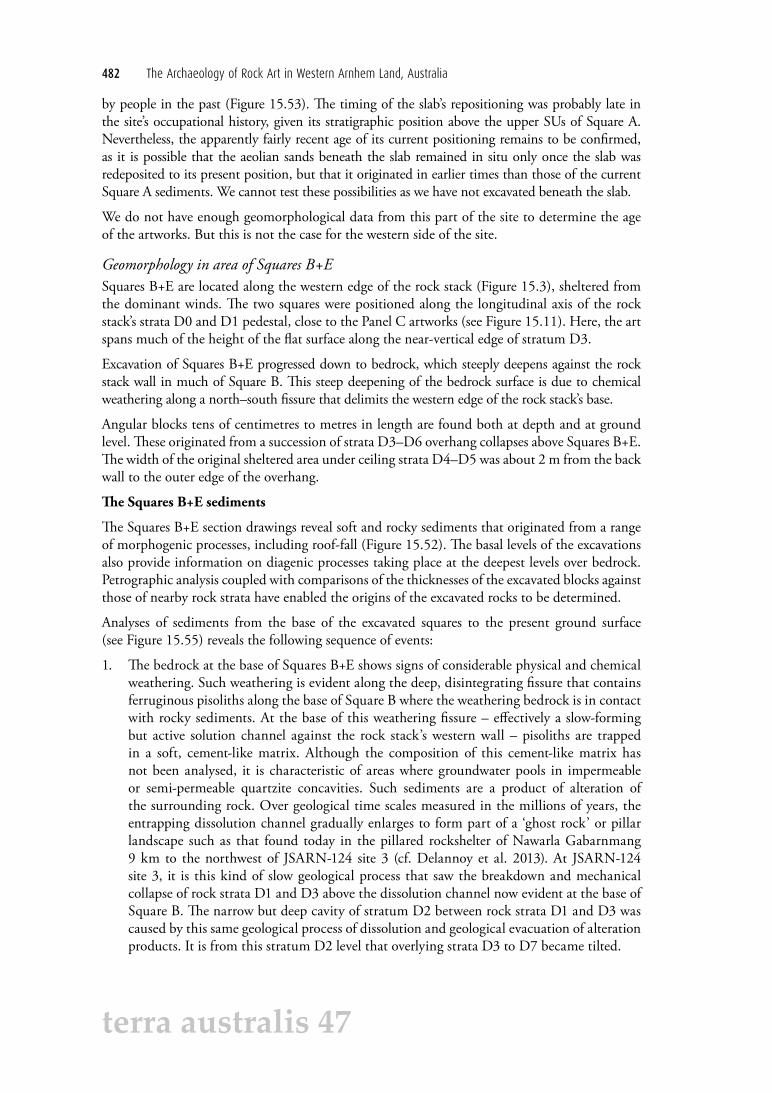
482 The Archaeology of Rock Art in Western Arnhem Land, Australia
terra australis 47
by people in the past (Figure 15.53). The timing of the slab’s repositioning was probably late in the site’s occupational history, given its stratigraphic position above the upper SUs of Square A. Nevertheless, the apparently fairly recent age of its current positioning remains to be confirmed, as it is possible that the aeolian sands beneath the slab remained in situ only once the slab was redeposited to its present position, but that it originated in earlier times than those of the current Square A sediments. We cannot test these possibilities as we have not excavated beneath the slab.
We do not have enough geomorphological data from this part of the site to determine the age of the artworks. But this is not the case for the western side of the site.
Geomorphology in area of Squares B+ESquares B+E are located along the western edge of the rock stack (Figure 15.3), sheltered from the dominant winds. The two squares were positioned along the longitudinal axis of the rock stack’s strata D0 and D1 pedestal, close to the Panel C artworks (see Figure 15.11). Here, the art spans much of the height of the flat surface along the near-vertical edge of stratum D3.
Excavation of Squares B+E progressed down to bedrock, which steeply deepens against the rock stack wall in much of Square B. This steep deepening of the bedrock surface is due to chemical weathering along a north–south fissure that delimits the western edge of the rock stack’s base.
Angular blocks tens of centimetres to metres in length are found both at depth and at ground level. These originated from a succession of strata D3–D6 overhang collapses above Squares B+E. The width of the original sheltered area under ceiling strata D4–D5 was about 2 m from the back wall to the outer edge of the overhang.
The Squares B+E sediments
The Squares B+E section drawings reveal soft and rocky sediments that originated from a range of morphogenic processes, including roof-fall (Figure 15.52). The basal levels of the excavations also provide information on diagenic processes taking place at the deepest levels over bedrock. Petrographic analysis coupled with comparisons of the thicknesses of the excavated blocks against those of nearby rock strata have enabled the origins of the excavated rocks to be determined.
Analyses of sediments from the base of the excavated squares to the present ground surface (see Figure 15.55) reveals the following sequence of events:
1. The bedrock at the base of Squares B+E shows signs of considerable physical and chemical weathering. Such weathering is evident along the deep, disintegrating fissure that contains ferruginous pisoliths along the base of Square B where the weathering bedrock is in contact with rocky sediments. At the base of this weathering fissure – effectively a slow-forming but active solution channel against the rock stack’s western wall – pisoliths are trapped in a soft, cement-like matrix. Although the composition of this cement-like matrix has not been analysed, it is characteristic of areas where groundwater pools in impermeable or semi-permeable quartzite concavities. Such sediments are a product of alteration of the surrounding rock. Over geological time scales measured in the millions of years, the entrapping dissolution channel gradually enlarges to form part of a ‘ghost rock’ or pillar landscape such as that found today in the pillared rockshelter of Nawarla Gabarnmang 9 km to the northwest of JSARN-124 site 3 (cf. Delannoy et al. 2013). At JSARN-124 site 3, it is this kind of slow geological process that saw the breakdown and mechanical collapse of rock strata D1 and D3 above the dissolution channel now evident at the base of Square B. The narrow but deep cavity of stratum D2 between rock strata D1 and D3 was caused by this same geological process of dissolution and geological evacuation of alteration products. It is from this stratum D2 level that overlying strata D3 to D7 became tilted.

15. Archaeology of JSARN–124 site 3, central-western Arnhem Land 483
terra australis 47
2. A horizon of pisoliths close to bedrock is capped by centimetre-size rock clasts that originated from breakdown of the overhanging rock ceiling. Today there is widespread millimetre- to centimetre-scale fragmentation of the rock both along the overhang and along the wall. The scale of this fragmentation can differ in different areas, depending on its causes (e.g. thermoclastic exfoliation, gravitational block collapse, weakening of bedding planes).
3. Above this horizon of small, fragmented rock clasts is a pile of large rocks and angular gravels. At least two depositional events can be differentiated through the buried rocks located in SU4 and SU3. The first is the collapse of the underlying, overhanging section of rock stratum D3. The collapsed, now-buried blocks follow the surface configuration of the bedrock, having become jammed in the dissolution channel; where the bedrock is more or less horizontally flat, the collapsed rock has piled up. This first (lowermost) deposit of collapsed rock is covered by a second aggregation of rocks that signals collapse of the remainder of overhanging stratum D3. How much time elapsed between these two rock-fall events is difficult to estimate with the available evidence. It is the sum of these two overhang collapses that resulted in the creation of the smooth vertical rock surface that now exhibits art Panel C. The paintings of Panel C cannot therefore have been done before completion of the D3 rock collapse (see below).
4. Overlying the stratum D3 rock collapse are soft sediments largely comprised of aeolian sands. Not as abundant in underlying levels, these aeolian sands now become dominant, covering the collapsed stratum D3 rocks. Lying horizontally flat within these aeolian sands are rock slabs fallen from a localised section of the overhanging stratum D4 ceiling. These collapsed slabs are covered by aeolian sands.
5. Above the present ground surface near and to the north of Squares B+E are large blocks of rock that have collapsed onto each other step-wise. These correspond to the collapse of the outer overhanging edges of rock strata D4–D5 and D6.
Figure 15.55 Evolution of the overhang above Squares B+E, showing the build up of sediments as evidenced from the north section of those two excavation squares.Source: Illustrations by Jean-Jacques Delannoy.
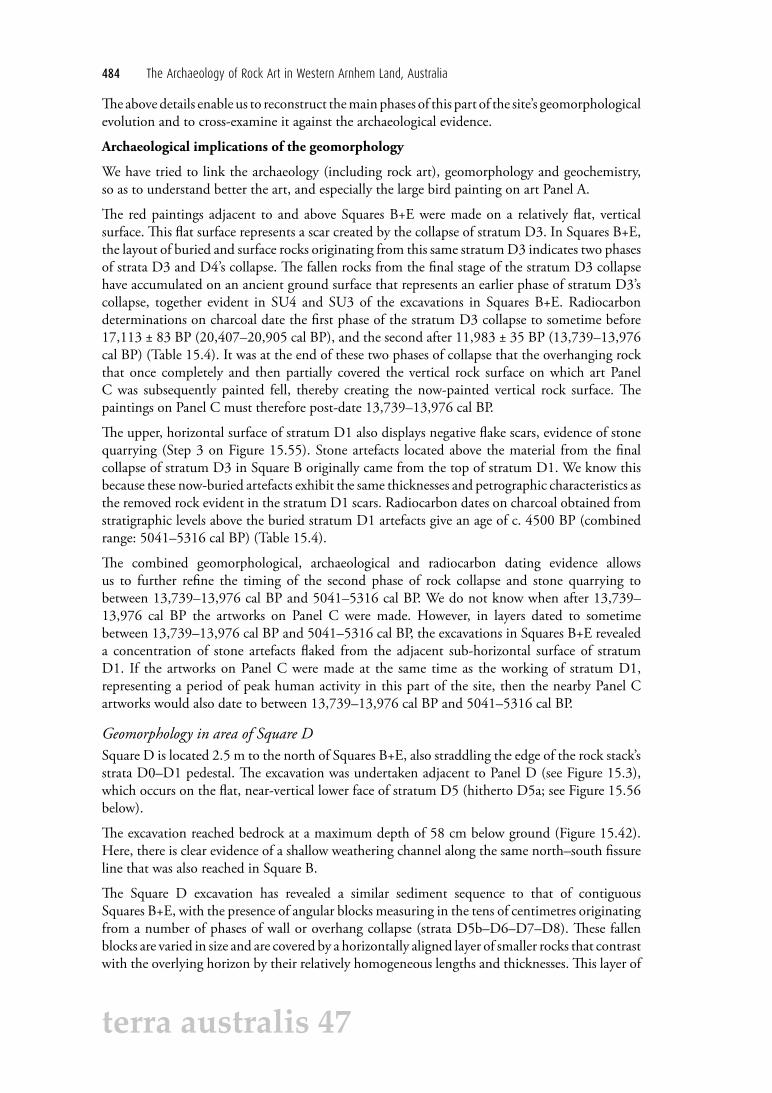
484 The Archaeology of Rock Art in Western Arnhem Land, Australia
terra australis 47
The above details enable us to reconstruct the main phases of this part of the site’s geomorphological evolution and to cross-examine it against the archaeological evidence.
Archaeological implications of the geomorphology
We have tried to link the archaeology (including rock art), geomorphology and geochemistry, so as to understand better the art, and especially the large bird painting on art Panel A.
The red paintings adjacent to and above Squares B+E were made on a relatively flat, vertical surface. This flat surface represents a scar created by the collapse of stratum D3. In Squares B+E, the layout of buried and surface rocks originating from this same stratum D3 indicates two phases of strata D3 and D4’s collapse. The fallen rocks from the final stage of the stratum D3 collapse have accumulated on an ancient ground surface that represents an earlier phase of stratum D3’s collapse, together evident in SU4 and SU3 of the excavations in Squares B+E. Radiocarbon determinations on charcoal date the first phase of the stratum D3 collapse to sometime before 17,113 ± 83 BP (20,407–20,905 cal BP), and the second after 11,983 ± 35 BP (13,739–13,976 cal BP) (Table 15.4). It was at the end of these two phases of collapse that the overhanging rock that once completely and then partially covered the vertical rock surface on which art Panel C was subsequently painted fell, thereby creating the now-painted vertical rock surface. The paintings on Panel C must therefore post-date 13,739–13,976 cal BP.
The upper, horizontal surface of stratum D1 also displays negative flake scars, evidence of stone quarrying (Step 3 on Figure 15.55). Stone artefacts located above the material from the final collapse of stratum D3 in Square B originally came from the top of stratum D1. We know this because these now-buried artefacts exhibit the same thicknesses and petrographic characteristics as the removed rock evident in the stratum D1 scars. Radiocarbon dates on charcoal obtained from stratigraphic levels above the buried stratum D1 artefacts give an age of c. 4500 BP (combined range: 5041–5316 cal BP) (Table 15.4).
The combined geomorphological, archaeological and radiocarbon dating evidence allows us to further refine the timing of the second phase of rock collapse and stone quarrying to between 13,739–13,976 cal BP and 5041–5316 cal BP. We do not know when after 13,739–13,976 cal BP the artworks on Panel C were made. However, in layers dated to sometime between 13,739–13,976 cal BP and 5041–5316 cal BP, the excavations in Squares B+E revealed a concentration of stone artefacts flaked from the adjacent sub-horizontal surface of stratum D1. If the artworks on Panel C were made at the same time as the working of stratum D1, representing a period of peak human activity in this part of the site, then the nearby Panel C artworks would also date to between 13,739–13,976 cal BP and 5041–5316 cal BP.
Geomorphology in area of Square DSquare D is located 2.5 m to the north of Squares B+E, also straddling the edge of the rock stack’s strata D0–D1 pedestal. The excavation was undertaken adjacent to Panel D (see Figure 15.3), which occurs on the flat, near-vertical lower face of stratum D5 (hitherto D5a; see Figure 15.56 below).
The excavation reached bedrock at a maximum depth of 58 cm below ground (Figure 15.42). Here, there is clear evidence of a shallow weathering channel along the same north–south fissure line that was also reached in Square B.
The Square D excavation has revealed a similar sediment sequence to that of contiguous Squares B+E, with the presence of angular blocks measuring in the tens of centimetres originating from a number of phases of wall or overhang collapse (strata D5b–D6–D7–D8). These fallen blocks are varied in size and are covered by a horizontally aligned layer of smaller rocks that contrast with the overlying horizon by their relatively homogeneous lengths and thicknesses. This layer of

15. Archaeology of JSARN–124 site 3, central-western Arnhem Land 485
terra australis 47
horizontal, homogeneous and relatively small rocks is superimposed by approximately 20 cm of sandy deposit exclusively composed of indented quartz grains indicative of impacts from wind transport.
Figure 15.56 Northwestern corner of the rock stack showing location of Square D relative to nearby collapsed blocks and ceiling of present overhang immediately overhead.Source: Illustrations by Jean-Jacques Delannoy.
The positioning of Square D away from the Panel C artworks is of interest, as it is located along the axis of the rock face that was formed by the collapse of strata D5–D6–D7, where the Panel A artworks are now found (including the large bird motif ) (Figure 15.56). On Figure 15.56A,

486 The Archaeology of Rock Art in Western Arnhem Land, Australia
terra australis 47
we show the position of Square D, together with its upward projection towards the overhang (on this figure, Panel A is on the left-hand side just around the corner of the overhang and of the upward projection of the left-hand corner of Square D, and therefore cannot be seen from this angle). On Figure 15.56B, the ceiling of the overhang is shown looking straight up from the position of Square D below. Here we can see that Square D is positioned directly under the detachment scar along which are found the artworks of Panel A. Given that the positioning of Square D allows us to simultaneously investigate the evolution of the rock in the area of Panels A and D, we undertook a detailed analysis of the morphogenesis of this part of the site, both in the field and through the digital 3-D model.
The Square D sediments: Archaeomorphological implications
The stratigraphic sequence for Square D (Figure 15.41) brings to light materials that originated from different morphogenic processes. As previously noted (cf. Squares B+E), the sequence of collapsed materials found on and in the ground, coupled with the extant layout of the rock stack’s strata, have enabled us to determine a suite of morphogenic stages for the area around Square D. The lithology and thickness of the fallen blocks revealed in the excavation and at ground level nearby permit us to reconstruct the origins of these blocks on the rock stack.
From the base of the Square D excavation to the ground surface, we identify the following sequence of events (Figures 15.41, 15.42 and 15.56–15.58):
1. The bedrock here carries traces of strong physical and chemical alteration. The evidence consists of the deepening of a fissure in, and the presence of ferruginous pisoliths on, the bedrock (alteration residues). These pisoliths are here held by a ‘cement’ (revealed at the base of the eastern edge of the excavation square, along the longitudinal axis of the rock stack’s pedestal at D0). This indurated cement is the product of a very old phase of alteration of the quartzite bedrock.
2. The hard bedrock surface and pisolith cement are superimposed by angular blocks that are lying at varied angles, moulding to the shape of the solution channel. Lithological analysis permits us to identify these angular blocks as originating from stratum D3a.
3. Above this mass of rock collapse are clastic materials of smaller size that cover the underlying ‘tumble’ of blocks: these smaller overlying rocks are similar in lithology, size and shape to the exfoliated rocks found at the base of Square E. The origin of these clasts may be linked to mechanical weakening and thermoclastic exfoliation. These clasts mould to the shape of the underlying surface configuration, filling in the solution channel.
4. Above this clastic layer, we find a new accumulation of blocks and angular rocks whose origin is the collapse of a new section of the overhang that once sheltered Square D. The collapsed blocks that now lie on the ground surface were digitally reattached onto strata D3b–D4 and D5, confirming their original positions (Figure 15.58). It is at the end of this phase of collapse that the flat, vertical rock surface, on which the Panel D artworks now lie, was formed.
5. Under this collapsed material (SU3b), we find the presence of angular blocks that are relatively homogeneous in length and that lie sub-horizontally. These blocks came from stratum D1. They testify to the anthropic flaking of the surface of stratum D1, as evidenced by percussion scars on the present stratum D1 surface (Figure 15.57).
6. The upper levels of the excavation reveal an aeolian quartz sand sheet that seals the underlying rocky layers.
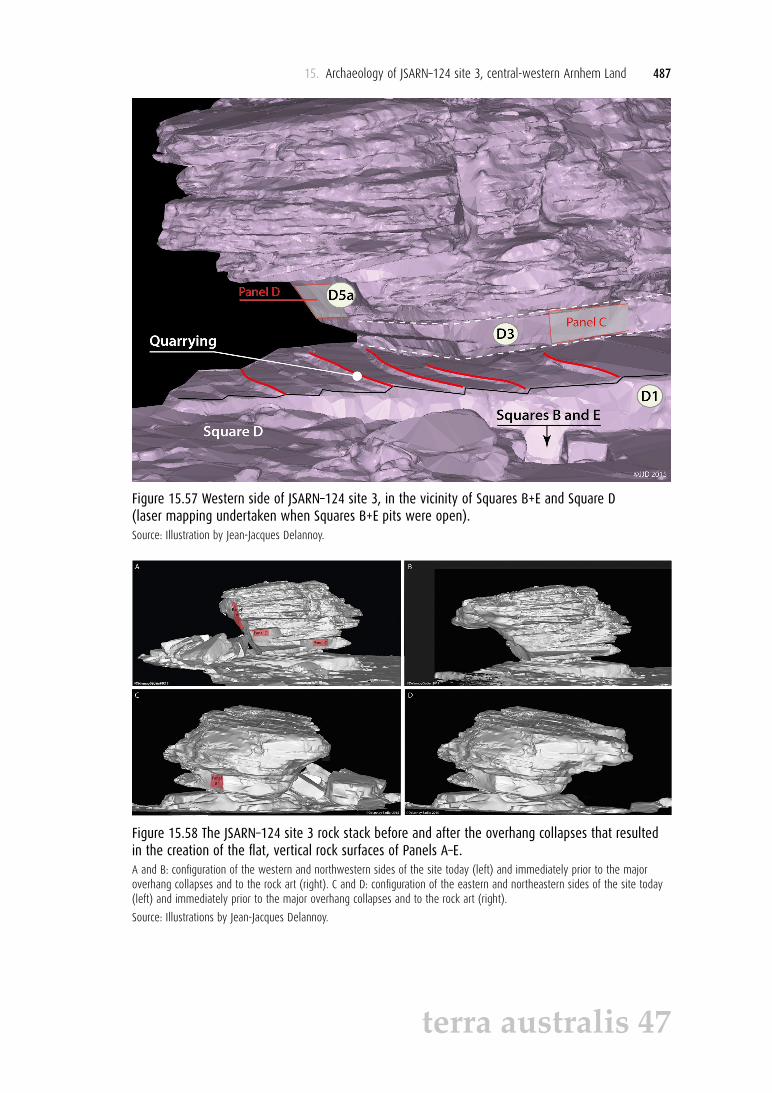
15. Archaeology of JSARN–124 site 3, central-western Arnhem Land 487
terra australis 47
Figure 15.57 Western side of JSARN–124 site 3, in the vicinity of Squares B+E and Square D (laser mapping undertaken when Squares B+E pits were open).Source: Illustration by Jean-Jacques Delannoy.
Figure 15.58 The JSARN–124 site 3 rock stack before and after the overhang collapses that resulted in the creation of the flat, vertical rock surfaces of Panels A–E.A and B: configuration of the western and northwestern sides of the site today (left) and immediately prior to the major overhang collapses and to the rock art (right). C and D: configuration of the eastern and northeastern sides of the site today (left) and immediately prior to the major overhang collapses and to the rock art (right).
Source: Illustrations by Jean-Jacques Delannoy.

488 The Archaeology of Rock Art in Western Arnhem Land, Australia
terra australis 47
The Square D stratigraphic sequence recalls those of Squares B+E. The red paintings above Square D (Panel D) were made on the smooth vertical surface formed by the collapse of the overhang that previously existed. That collapse concerned strata D3b–D4 and D5 and took place after 8160 ± 27 BP (9014–9245 cal BP), as indicated by the radiocarbon dates from XU19 under the fallen blocks. This timing from Square D is consistent with the second phase of collapse that has been identified in the Squares B+E excavations (dating to after 13,739–13,976 cal BP). Similarly, the horizon of anthropic artefacts originating from stratum D1 dates to a similar time frame to that of Square B, here dated to after 2459 ± 20 BP (2379–2545 cal BP) (Table 15.4).
The same sequence of events is apparent in the two excavation areas (Squares B+E, and Square D) on the western edge of the site. These same sequences allow us to highlight the existence of two major phases of rockfall, the rock debris from the first lying directly on the weathered bedrock and its alteration products (pisoliths). After these rockfall events, there is evidence of the human modification of the exposed, upper surface of stratum D1. This phase of quarrying may be contemporaneous with painting activity on nearby flat surfaces, although this is not certain. In both Squares B+E, and Square D, the overlying blanket of aeolian sands is dated from 2379–2545 cal BP continuing to today.
The sum of these observations permits us to construct a broad chronological canvas for the evolution of the site.
Discussion of the geomorphologyGeomorphological and archaeological investigations have revealed important dimensions relating to the physical evolution of JSARN-124 site 3, including the sequence and general age of major geological and anthropic events that gave shape to the site that we know today.
The presence of large fallen blocks at the base of the rock stack’s northern face did not allow us to undertake archaeological excavations immediately below Panel A. Nevertheless, the geomorphological evidence obtained from the full circumference of the site, coupled with archaeological and radiocarbon dating evidence obtained from Squares B+E, and especially Square D at the northwestern corner of the rock stack, have enabled the collapse of the old overhang on the north side to be broadly dated. It is only after this collapse that the northern rock face became exposed and thus available to paint on (see Figure 15.59 for a synthesis).
All of the five squares were excavated down to bedrock. These bedrock surfaces show points of strength and weakness in the rock stack’s structure: the base of Squares A, C and E have revealed the strongly resistant hard quartzite strata’s upper surfaces, while the base of Squares B and D have exposed fissure lines that have been widened and deepened by chemical alteration. The pisoliths present at contact with the bedrock represent mineral aggregates accumulated on the impermeable quartzite bedrock: these pisoliths are largely made up of iron oxides and clay, and are themselves sources of red ochre that could have been used to make red paintings and stencils at the site.
JSARN-124 site 3 used to have larger overhangs on its western and northern sides than it does today (Figure 15.58). The vertical rock surfaces that today house art Panels A, C, D and E did not exist then: these smooth rock surfaces were formed by the collapse of the overhangs. The rock debris revealed in Squares B+E and D, and at ground level on the northern edge of the rock stack, are the products of those overhang collapses. The only art surface that could have existed prior to these collapses is the one that houses art Panel B near Squares A and C under the eastern overhang. None of the blocks that collapsed from stratum D3 and that resulted in the creation of the vertical rock surface subsequently painted as Panel B is presently visible along the eastern edge of the site, nor under the overhang where Squares A and C were excavated. This means that here the stratum D3 vertical surface is ancient, and therefore the Panel B rock art could theoretically be very old (or young).

15. Archaeology of JSARN–124 site 3, central-western Arnhem Land 489
terra australis 47
Today
Asso
ciate
d w
ith a
rcha
eolo
gica
l dep
osits
Prec
edes
arc
haeo
logi
cal d
epos
its
Spatial Dimension
Tem
pora
l Dim
ensio
n
Archaeological implications
West Side North Side East Side
Geomorphological Evolution
Start of archaeo-geomorphological analysis: bottom of excavation squares (A, B, C, D, E): quartzitic bedrock
Chemical and mechanical alteration of bedrock: presence of pisoliths across the bedrock surface Pisoliths: potential source of ochre
Overhangs are larger on western and eastern sidesrelative to today (see Figure 15.58)
Overhang similar to today
1st phase of collapseoverhang collapse: D3a
evident in Squares B+E and D
No information
Flat vertical surface on east sideavailable for artworks (Panel B)
Thermoclastic exfoliation
2nd phase of collapse
- overhang collapse: D3b-D4-D5a
evident in Square D- �nal overhang collapse: D3
evident in Squares B+EFlat vertical surface on west side
available for artworks (Panel C)
Flat vertical surface on west sideavailable for artworks (Panel D)
Rockfalloverhang collapse: D5-D6-D7 articulating rockfall dominant
in Square D
Flat vertical surface on north sideavailable for artworks (Panel A)
Percussion scars on D1 surface;artefacts in Squares B+E and D
Anthropic modi�cationsRemoval of stone artefacts
Accumulation of aeolian sands
Stab
le o
verh
ang
abov
e Sq
uare
s A
and
C
Localised collapse of part of overhang (D8)
Rock slab moved and �akedalong its edges
Accumulation of aeolian sands
17,000 BP
4500 BP
11,000 BP
Area sheltered from wind(no aeolian sediments)
JJD©2015
Figure 15.59 Summary chronological schema for JSARN–124 site 3.Source: Illustration by Jean-Jacques Delannoy.
On the western side of the site, excavation Squares B+E, and Square D, have revealed two major phases of overhang collapse. The first pre-dates 17,113 ± 83 BP (20,407–20,905 cal BP) (Figure 15.59) and the second post-dates 11,983 ± 35 BP (13,739–13,976 cal BP). It is these two phases of collapse that caused the formation of the smooth, vertical rock surfaces on the western side of the site. The artworks on Panels C and D could only have been made after the second collapse dated to 13,739–13,976 cal BP.
The area immediately above Square D lies at the intersection of the northern and western margins of the rock stack, a corner of the site that witnessed interconnecting rock collapse (Figures 15.56 and 15.60). The most obvious and most important of these collapses is particularly evident on the north side of the site. Digital 3-D refitting of the large collapsed block transverse surfaces onto the remnant rock stack conclusively shows that these collapsed blocks came from rock strata that overhang Square D. The stratigraphic sequence of collapsed blocks also conclusively shows that the north face’s (strata D5b–D6–D7) ancient overhang collapsed at the same time as the second phase of collapse identified in both Square D and Squares B+E. That is, overhanging rock strata D5b–D6–D7 became detached from the rock stack in the area of art Panel A after 13,739–13,976 cal BP, at the end of the LGM. The artworks of Panel A must therefore be more recent than 13,739–13,976 cal BP. As they cannot be older than this, they cannot be contemporaneous with the bird Genyornis newtoni, unless G. newtoni survived the LGM into the Pleistocene–Holocene boundary. All evidence – zoological, paleontological, archaeological – from all parts of Australia currently argue against such a late survival.

490 The Archaeology of Rock Art in Western Arnhem Land, Australia
terra australis 47
Figure 15.60 Collapse of northwestern overhang, resulting in the shown extant smooth vertical rock faces of Panels A, D and E.Source: Illustration by Jean-Jacques Delannoy.
The rock mass from overhang collapse has greatest visibility at ground level on the northern side of the site, whereas it is buried along the western side. This spatial patterning is due to the variable quantities of collapsed material in different parts of the site. Along the western side, in the areas of Squares B+E, only stratum D3 became detached from the overhang. In the area above Square D, it is rock strata D3–D4 and D5a that fell, and here one part of that collapse is buried (as revealed by the excavation) while the rest lies exposed on the surface.
On the northern side of the site, it is the entire 2.7 m thickness of the overhang composed of strata D4–D5–D6–D7 that fell. Here the lower strata (D4 and D5a) are buried under the overlying strata (D5b–D6–D7) that are themselves visible on the surface as the tumble of blocks just beyond the northern edge of the rock stack. The paintings of Panel A were made by climbing onto those collapsed blocks.
The upper surface of the pedestal (stratum D1; Figure 15.57) has been quarried for stone. Here, evidence of stone flaking by percussion has resulted in the deposition of flaking debitage in the adjacent sediments of Squares B+E, and Square D. We suggest that as people quarried the upper stratum D1 surface, they further engaged with the site by removing collapsed blocks that must once have laid on top of the exposed stratum D1 surface but that are now absent. These cultural actions pre-date 4482 ± 20 BP (5041–5286 cal BP), a radiocarbon determination that came from sediments overlying the level with the stratum D1 artefacts.
The area surrounding the rock stack then became blanketed with aeolian sands. These sandy sediments are more pronounced along the western side of the site, where the rock stack’s wall acts as a protective screen from the wind; along the upwind southern and eastern sides, wind activity has prevented effective sedimentation. We note that minor overhang collapse is evident during the mid to late Holocene, as blocks are sometimes found buried amid the aeolian sediments

15. Archaeology of JSARN–124 site 3, central-western Arnhem Land 491
terra australis 47
of the upper sandy layer, and sometimes lie on the surface of the present ground surface. It is during this phase of sand accumulation that the flaked slab that originated from the collapse of the stratum D8 overhang was carried to its present location on top of aeolian sediments near Square A under the eastern overhang.
Conclusion: How old is the large bird painting?Six lines of evidence inform us about the age of the large bird motif at JSARN-124 site 3:
1. The large bird motif is superimposed by a very thin, redeposited layer, protecting it from weathering. Theoretically, the painting could thus be of considerable but indeterminate age.
2. The paint from the large bird motif lies immediately over a layer of gypsum. As gypsum tends to mineralise under dry conditions, this may show the large bird was painted after a dry phase. A dry phase during the LGM began to end c. 14,700 cal BP in northern Australia (Reeves et al. 2013; Simon Haberle pers. comm. 2015), so the large bird motif is likely to be of later date.
3. The large bird painting superimposes a 3MF hand stencil, currently thought to date to less than c. 10,000–12,000 years old, so it is of that age if the estimated age of 3MF hand stencils is correct.
4. A number of paintings on Panel A (Images #2, #5, #10, and possibly Images #1 and #14), Panel B (Images #30 and #31), Panel C (Image #49, and possibly #45 and #46) and Panel E (Images #56, #60, and possibly the degraded Image #58) are stylistically similar to each other, and would thus appear to be contemporaneous (within an archaeological time frame) (Figure 15.61). The large bird motif (Image #5) is one of these. What these paintings each have in common is an overlapping combination of the following features, although not all features are represented on all paintings: outlining without solid infilling; hollow body; longitudinal line along full or partial length of body; transverse lines that divide the body into separate sections (sometimes with the central section being further divided in half by the longitudinal line); and hind legs infilled with longitudinal irregular ‘stripes’. Taçon (1989, 1992) and Chaloupka (1993:183–185) have argued that the depiction of fauna with hollow bodies such as found on bird Image #45 dates to the beginning of the Estuarine period, around 8000 years ago. At JSARN-124 site 3, all of the above paintings from Panels A, C and E must have been done sometime after 13,739–13,976 cal BP, as the rock surfaces containing the whole of those panels formed sometime after that time. This conclusion is consistent with Taçon’s and Chaloupka’s chronologies.
5. Under microscopic examination of cross-sections of rock samples, the pigment making the large bird cannot be separated from that of the spear that intersects it, so the two motifs are probably contemporaneous. Probably it is a picture of a bird being hunted with a spear, rather than two separate images that chance to fall together.
In short, the smooth, flat vertical rock surfaces of art Panels A, C, D and E all formed between 13,739–13,976 cal BP and 5041–5286 cal BP. The large bird motif is on Panel A, so it cannot be older than 13,739–13,976 cal BP.

492 The Archaeology of Rock Art in Western Arnhem Land, Australia
terra australis 47
Figure 15.61 Zoomorphs painted with shared artistic conventions, or similar and apparently shared conventions, at JSARN–124 site 3.Source: Illustration by Robert Gunn and Bruno David.
The fact that the large bird motif at JSARN–124 site 3 can now be shown to be more recent than 13,739–13,976 cal BP highlights the tentative nature of a supposed widespread early phase of ‘large naturalistic paintings’ that precedes the LGM and that can purportedly readily be recognised by paintings such as the large bird motif across northern Australia–Southeast Asia (e.g. Taçon and Chippindale 2008:75; Taçon et al. 2014), as has sometimes been argued.
Last but not least, the large bird motif at JSARN-124 site 3 is superimposed over a 3MF hand stencil on Panel A. That 3MF hand stencil also cannot possibly be older than 13,739–13,976 cal BP, as the rock surface on which it occurs was only created at that time. As 3MF hand stencils are generally associated with Dynamic Figures across western Arnhem Land, if the example from JSARN–124 site 3 is contemporaneous with the other 3MF hand stencils of the region, and if such hand stencils are indeed contemporaneous with Dynamic Figures as argued by all rock art researchers who have researched the topic in Arnhem Land (e.g. Chaloupka 1993; Chippindale and Taçon 1998; Lewis 1988; Taçon and Brockwell 1995), then we can conclude that the age of Dynamic Figures began, or continued into, the period after 13,739–13,976 cal BP. In this context, it is important to emphasise Chaloupka’s (1993:110) observation that ‘the 3MF stencil is unique to the art of this period [Pre-Estuarine, to which Dynamic Figures belong]’. This inference is consistent with Chippindale and Taçon (1998) and Taçon and Brockwell’s (1995) views that Dynamic Figures date to around 10,000–12,000 years ago, contra Chaloupka’s (1993:89) preference for a somewhat greater antiquity estimated to approach nearer to 20,000 years ago (unless the style or set of related styles had a very long duration spanning some 10,000 years).

15. Archaeology of JSARN–124 site 3, central-western Arnhem Land 493
terra australis 47
AcknowledgementsWe thank Margaret Katherine and family, Wes Miller, Ray Whear and the Jawoyn Association Aboriginal Corporation for asking us to undertake this research. Thanks to Charlotte Armstrong, Brenna Barker-Lamb, Leigh Douglas, Daniel James (Monash University), David Lee, Jacqueline Matthews (University of Western Australia), Chris Urwin (Monash University) and Brit Wilson for helping with site recording and excavations, and Elisa Boche for Figure 15.20. We thank the Australian Research Council for Linkage grant LP110200927 and Discovery grants, QEII and Discovery Outstanding Research Award (DORA) Fellowships DP0877782 and DP130102514. We also thank AGLAE (Accélérateur Grand Louvre, Centre de Recherche et de Restauration des Musées de France (C2RMF), Paris) and Charisma for PIXE analysis, and the Rhône-Alpes region for financial support to undertake the chemistry analyses (CIBLE Project, 2012–2013). Thanks to Valérie Reita and Denis Testemale for undertaking the Raman micro-spectroscopy (Institut Néel); Quentin Lemasson and FIXLAB for the PIXE beam time at AGLAE in Paris; Kara Rasmanis (Monash University) for initial drafts of Figures 15.27, 15.32, 15.37 and 15.42, and Simon Haberle (The Australian National University) for advice on palaeo-environments.
ReferencesArcher, M., D.A. Arena, M. Bassarova, R.M.D. Beck, K. Black, W.E. Boles, P. Brewer, B.N. Cooke,
K. Crosby, A. Gillespie, H. Godthelp, S.J. Hand, B.P. Kear, J. Louys, A. Morrell, J. Muirhead, K.K. Roberts, J.D. Scanlon, K.J. Travouillon and S. Wroe 2006. Current status of species-level representation in faunas from selected fossil localities in the Riversleigh World Heritage Area, northwestern Queensland. Alcheringa 30, Supplement 1:1–17. doi.org/10.1080/ 03115510609506851
Bradley, R. 2002. The Past in Prehistoric Societies. Routledge, London.
Brandl, E.J. 1972. Thylacine designs in Arnhem Land rock paintings. Archaeology and Physical Anthropology in Oceania 7(1):24–30.
Cersoy, S., O. Leynaud, M. Alvarez-Murga, P. Martinetto, P. Bordet, N. Boudet, E. Chalmin, G. Castets and J.L. Hodeau 2015. Laboratory implementation of X-ray diffraction/scattering computed microtomography. Journal of Applied Crystallography 48:159–165. doi.org/10.1107/S1600576714027204
Chalmin, E., G. Castets, B. David, B. Barker, J.-J. Delannoy, L. Lamb, J.-M. Geneste, F. Soufi, S. Pairis, S. Hoerlé, E. Boche and M. Katherine 2015. Study of red pigments from the ‘Genyornis’ panel, Arnhem Land, Australia: What are the origins of the haematite? Anthropologica et Praehistorica 125/2014:1–22.
Chalmin, E., G. Castets, J.-J. Delannoy, B. David, B. Barker, L. Lamb, F. Soufi, S. Pairis, S. Cersoy, P. Martinetto, J.-M. Geneste, S. Hoerlé, T. Richards and R. Gunn 2017. Geochemical analysis of the painted panels at the ‘Genyornis’ rock art site, Arnhem Land, Australia. Quaternary International 430:60–80. doi.org/10.1016/j.quaint.2016.04.003
Chaloupka, G. 1993. Journey in Time: The World’s Longest Continuing Art Tradition. Reed, Chatswood.
Chippindale, C. and P.S.C. Taçon 1998. The many ways of dating Arnhem Land rock-art, north Australia. In C. Chippindale and P.S.C. Taçon (eds), The Archaeology of Rock-Art, pp. 90–111. Cambridge University Press, Cambridge.

494 The Archaeology of Rock Art in Western Arnhem Land, Australia
terra australis 47
Clifford-Gonzalez, D. B., D. R. Damrosch, J. Pryor and R. L. Thunen 1985. The third dimension in site structure: An experiment in trampling and vertical dispersal. American Antiquity 50:803–818. doi.org/10.2307/280169
Delannoy, J.-J., B. David, J.-M. Geneste, M. Katherine, B. Barker, R.L. Whear and R.G. Gunn 2013. The social construction of caves and rockshelters: Chauvet Cave (France) and Nawarla Gabarnmang (Australia). Antiquity 87:12–29. doi.org/10.1017/S0003598X00048596
Doehne, E. 2002. Salt weathering: A selective review. In S. Siegesmund, T. Weiss and A. Vollbrecht (eds), Natural Stone, Weathering Phenomena, Conservation Strategies and Case Studies, pp. 59–72. Geological Society Special Publication 205. The Geological Society, London. doi.org/10.1144/gsl.sp.2002.205.01.05
Field, J. and W. Boles 1998. Genyornis newtoni and Dromaius novaehollandiae at 30,000 b.p. from Cuddie Springs, southeastern Australia. Alcheringa 22:177–188. doi.org/10.1080/ 0311551 9808619199
Flannery, T.F. 1984. Re–examination of the Quanbun local fauna, a Late Cenozoic vertebrate fauna from Western Australia. Records of the Western Australian Museum 11:119–128.
Goodall, R.A., B. David, P. Kershaw and P.M. Fredericks 2009. Prehistoric hand stencils at Fern Cave, north Queensland (Australia): Environmental and chronological implications of Raman spectroscopy and FT-IR imaging results. Journal of Archaeological Science 36:2617–2624. doi.org/10.1016/j.jas.2009.07.007
Goodman, D. and S. Piro 2013. GPR Remote Sensing in Archaeology. Springer-Verlag, Berlin. doi.org/10.1007/978-3-642-31857-3
Grellet-Tinner, G., N.A. Spooner and T.H. Worthy 2016. Is the ‘Genyornis’ egg of a mihirung or another extinct bird from the Australian dreamtime? Quaternary Science Reviews 133:147–164. doi.org/ 10.1016/j.quascirev.2015.12.011
Grün, R., S. Eggins, M. Aubert, N. Spooner, A.W. Pike and W. Müller 2010. ESR and U-series analyses of faunal material from Cuddie Springs, NSW, Australia: Implications for the timing of the extinction of the Australian megafauna. Quaternary Science Reviews 29:596–610. doi.org/10.1016/j.quascirev.2009.11.004
Gunn, R. G. 2011. The impact of bushfires and fuel reduction burning on the preservation of shelter rock art. Rock art Research 28:53–69.
Gunn, R. G., L. C. Douglas and R. L. Whear 2011. What bird is that? Identifying a probable painting of Genyornis newtoni in western Arnhem Land. Australian Archaeology 73:1–12.
Hernanz, A., J. Gavira-Vallejo and J. Ruiz-Lopez 2007. Calcium oxalates and prehistoric paintings: The usefulness of these biomaterials. Journal of Optoelectronics and Advanced Materials 9:512–521.
Lewis, D. 1988. The Rock Paintings of Arnhem Land, Australia. BAR International Series 415. British Archaeological Reports, Oxford.
Magee, J.W. and G.H. Miller 2007. Timing and cause of Genyornis extinction and duration of human-Genyornis overlap in Australia. In M.L. Cupper and S.J. Gallagher (eds), Climate Change or Human Impact? Australia’s Megafaunal Extinction. Selwyn Symposium of the GSA Victoria Division, September 2007, Geological Society of Australia, Extended Abstracts No. 79, pp. 31–78.
Miller, G.H., J.W. Magee, B.J. Johnson, M.L. Fogel, N.A. Spooner, M.T. McCulloch and L.K. Aylffe 1999. Pleistocene extinction of Genyornis newtoni: Human impact on Australian megafauna. Science 283:205–208. doi.org/10.1126/science.283.5399.205

15. Archaeology of JSARN–124 site 3, central-western Arnhem Land 495
terra australis 47
Miller, G.H., M.L. Fogel, J.W. Magee, M.K. Gagan, S.J. Clarke and B.J. Johnson 2005. Ecosystem collapse in Pleistocene Australia and a human role in megafaunal extinction. Science 309:287–290. doi.org/10.1126/science.1111288
Murray, P.F. and D. Megirian 1998. The skull of dromornithid birds: Anatomical evidence for their relationship to Anseriformes (Dromornithidae, Anseriformes). Records of the South Australian Museum 31:51–97.
Murray, P.F. and P. Vickers-Rich 2004. Magnificent Mihirungs: The Colossal Flightless Birds of the Australian Dreamtime. Indiana University Press, Bloomington.
Pizzey, G. and F. Knight 1997. The Field Guide to the Birds of Australia. Harper Collins, Pymble.
Reeves, J.M., H.C. Bostock, L.K. Ayliffe, T.T. Barrows, P. DeDeckker, L.S. Devriendt, G.B. Dunbar, R.N. Drysdale, K.E. Fitzsimmons, M.K. Gagan, M.L. Griffiths, S.G. Haberle, J.D. Jansen, C. Krause, S. Lewis, H.V. McGregor, S.D. Mooney, P. Moss, G.C. Nanson, A. Purcell and S. van der Kaars 2013. Palaeoenvironmental change in tropical Australasia over the last 30,000 years – a synthesis by the OZ-INTIMATE group. Quaternary Science Reviews 74:97–114. doi.org/10.1016/j.quascirev.2012.11.027
Reimer, P.J., E. Bard, A. Bayliss, J.W. Beck, P.G. Blackwell, C. Bronk Ramsey, C.E. Buck, H. Cheng, R.L. Edwards, M. Friedrich, P.M. Grootes, T.P. Guilderson, H. Haflidason, I. Hajdas, C. Hatté, T.J. Heaton, D.L. Hoffmann, A.G. Hogg, K.A. Hughen, K.F. Kaiser, B. Kromer, S.W. Manning, M. Niu, R.W. Reimer, D.A. Richards, E.M. Scott, J.R. Southon, R.A. Staff, C.S.M. Turney and J. van der Plicht 2013. IntCal13 and Marine13 radiocarbon age calibration curves, 0–50 000 years cal BP. Radiocarbon 55(4):1869–1887. doi.org/10.2458/azu_js_rc.55.16947
Rich, P. 1979. The Dromornithidae, an extinct family of large ground birds endemic to Australia. Bulletin of the Bureau of Mineral Resources, Geology and Geophysics 184:1–190.
Roberts, R. G. and B. W. Brook 2010. And then there were none? Science 327:420–422. doi.org/ 10.1126/science.1185517
Roberts, R.G., T.F. Flannery, L.K. Ayliffe, H. Yoshida, J.M. Olley, G.J. Prideaux, G.M. Laslett, A. Baynes, M.A. Smith, R. Jones and B.L. Smith 2001. New ages for the last Australian megafauna: Continent-wide extinction about 46,000 years ago. Science 292:1888–1892. doi.org/10.1126/science.1060264
Taçon, P.S.C. 1989. From Rainbow Snakes to ‘X-Ray’ Fish: The Nature of the Recent Rock Painting Tradition of Western Arnhem Land, Australia. Unpublished PhD thesis. The Australian National University, Canberra.
Taçon, P.S.C. 1992. Somewhere over the rainbow: An ethnographic and archaeological analysis of recent rock paintings of western Arnhem Land, Australia. In J. McDonald and I.P. Haskovec (eds), State of the Art: Regional Rock Art Studies in Australia and Melanesia, pp. 202–215. Occasional AURA Publication 6. Australian Rock Art Research Association, Melbourne.
Taçon, P.S.C. and S. Brockwell 1995. Arnhem Land prehistory in landscape, stone and paint. Antiquity 69:676–695. doi.org/10.1017/S0003598X00082272
Taçon, P. S. C. and C. Chippindale 2008. Changing places: Ten thousand years of north Australian rock-art transformation. In D. Papagianni, H. Maschner and R. Layton (eds), Time and Change: Archaeological and Anthropological Perspectives on the Long-term in Hunter-gatherer Societies, pp.73–94. Oxbow Books, Oxford.

496 The Archaeology of Rock Art in Western Arnhem Land, Australia
terra australis 47
Taçon, P. S. C., N. H. Tan, S. O’Connor, X. Ji, L. Gang, D. Curnoe, D. Bulbeck, B. Hakim, I. Sumantri, H. Than, I. Sokrithy, S. Chia, K. Khun-Neayand and S. Kong 2014. Global implications of early surviving rock art of greater Southeast Asia. Antiquity 88:1050–1064. doi.org/10.1017/S0003598X00115315
Thomson, V.A. 2012. Ancient DNA in the Australian Context: Investigating Evolutionary and Ecological Responses to Environmental Change. Unpublished PhD thesis. University of Adelaide, Adelaide.
Trueman, C.N., J.H. Field, J. Dortch, B. Charles and S. Wroe 2005. Prolonged coexistence of humans and megafauna in Pleistocene Australia. Proceedings of the National Academy of Sciences of the United States of America 102:8381–8385. doi.org/10.1073/pnas.0408975102
Vickers-Rich, P. 1987. A giant bird of the Pleistocene: Genyornis newtoni. In S. Hand and M. Archer (eds), The Antipodean Ark: Creatures from Prehistoric Australia, pp. 48–50. Angus and Robertson, Sydney.
Williams, D.L.G. 1981. Genyornis eggshell (Dromornithidae; Aves) from the late Pleistocene of South Australia. Alcheringa 5:133–140. doi.org/10.1080/03115518108565426
Wray, R.A.L. 2013. Solutional weathering and karstic landscapes on quartz sandstones and quartzite. In J.F. Shroder (ed.), Treatise on Geomorphology, pp. 463–483. Academic Press, San Diego. doi.org/ 10.1016/B978-0-12-374739-6.00140-8
Wynjorroc, P., H. Long, P. Long, N. Avalon, M. Coleman, L. Ranch and S. Tidermann 2001. Plants, Animals and People: Ethnoecology of the Jawoyn people. Batchelor Press, Batchelor.

This text is taken from The Archaeology of Rock Art in Western Arnhem Land, Australia, edited by Bruno David, Paul Taçon, Jean-Jacques Delannoy and Jean-Michel Geneste,
published 2017 by ANU Press, The Australian National University, Canberra, Australia.
dx.doi.org/10.22459/TA47.11.2017.15