Embed Size (px)
Citation preview

The Applicability and Impact of Enterprise Resource Planning (ERP) Systems: Results from a Mixed Method
Study on Make-To-Order (MTO) Companies
Bulut Aslan*, Mark Stevenson, and Linda C. Hendry
Name: Dr Bulut Aslan Institution: Istanbul Bilgi University Address: Department of Industrial Engineering Kazim Karabekir Cad. No: 2
34060, Eyup, Istanbul Turkey
E-mail: [email protected] Tel: 00 90 212 3117440 Name: Dr Mark Stevenson Institution: Lancaster University Address: Department of Management Science Lancaster University Management School Lancaster University LA1 4YX U.K. Name: Professor Linda C Hendry Professor of Operations Management Institution: Lancaster University Address: Department of Management Science Lancaster University Management School Lancaster University LA1 4YX U.K. Keywords: Enterprise Resource Planning (ERP) systems; Make-To-Order (MTO); Mixed method
study; Survey; Case study.
* Corresponding Author: [email protected]

The Applicability and Impact of Enterprise Resource Planning (ERP) Systems: Results from a Mixed Method Study on Make-To-
Order (MTO) Companies
Abstract The effect of a Make-To-Order (MTO) production strategy on the applicability and impact of
Enterprise Resource Planning (ERP) systems is investigated through a mixed method approach
comprised of an exploratory and explanatory survey followed by three case studies. Data on Make-
To-Stock (MTS) companies is also collected as a basis for comparison. The exploratory data
demonstrates, for example, that MTO adopters of ERP found the system selection process more
difficult than MTS adopters. Meanwhile, a key reason why some MTO companies have not adopted
ERP is that it is perceived as unsuitable. The explanatory data is used to test a series of hypotheses on
the fit between decision support requirements, ERP functionality, and company performance. In
general, a poor fit between the decision support requirements of MTO companies and ERP
functionality is identified, although certain modules can lead to performance improvements – most
notably for Customer Enquiry Management (CEM). MTS companies make more use of planning tools
within ERP systems, and it is concluded that production strategy is an important contextual factor
affecting both applicability and impact. Follow-up cases with two MTO adopters and one MTO non-
adopter develop a deeper understanding of the survey results. For example, in one adoption case, a
system was rented to minimise the consequences of making a poor selection decision. Future research
could explore how more MTO-specific planning concepts can be embedded within ERP systems to
improve alignment.
Keywords: Enterprise Resource Planning (ERP) systems; Make-To-Order (MTO); Mixed method
study; Survey; Case study.
1

1. Introduction Many vendors of Enterprise Resource Planning (ERP) systems claim that their software is
universal − configurable to the needs of any business. Yet the academic literature suggests
that contextual factors, such as company size (e.g. Mabert et al., 2003; Muscatello et al.,
2003; Snider et al., 2009) and location or nationality (e.g. Olhager & Selldin, 2003; Morabito
et al., 2005; Argyropoulou et al., 2007), play important roles in the system selection and
adoption process. The production strategy of a company is also likely to be influential (Aslan
et al., 2012). For example, whether a company is a low-volume/high-variety Make-To-Order
(MTO) producer or a high-volume/low-variety Make-To-Stock (MTS) producer may have a
significant bearing on its internal decision making processes and, therefore, on any
functionality it requires from an ERP system. Although the applicability of ERP systems to
MTO companies has been questioned (e.g. Bertrand & Muntslag, 1993; Stevenson et al.,
2005; Aslan et al., 2012), the empirical research which investigates this is limited (e.g. Deep
et al., 2008). Deep et al. (2008) conducted a case study on the ERP selection process by a
MTO company and concluded that more research is required to assist firms in determining
the applicability of ERP. In addition, the impact of ERP on MTO company performance has
not been investigated. Hence, even for those companies that have adopted ERP, research is
needed to identify the extent to which adoption has had a positive impact on performance.
Most recently, Aslan et al. (2012) presented a literature review on the applicability of ERP
systems to MTO companies – this questioned the fit between ERP systems and MTO
company requirements before the authors outlined a future research agenda, including
gathering empirical evidence on the applicability and impact of ERP systems on MTO
companies.
We take a contingency-based approach (e.g. Drazin & van de Ven, 1985; Sousa and Voss,
2008) to investigate the effect of a MTO production strategy on the applicability and impact
of ERP systems through a mixed method study, consisting of an exploratory and explanatory
survey followed by three case studies. Thus, we provide empirical evidence which responds
to the research agenda outlined by Aslan et al. (2012). While our primary focus is on MTO
companies, we also include MTS firms in our survey frame as a basis for comparison.
Furthermore, we include both ERP adopters and non-adopters. Although non-adopters tell us
very little about the impact of ERP, they are important for understanding applicability.
Despite this, many previous studies have neglected non-adopters – for example, they
represented only 16% of respondents in Olhager & Selldin (2003), while Stratman (2001)
focused exclusively on ERP adopters.
2

We take a detailed and systematic approach to assessing the applicability and impact of
ERP systems by examining the fit between the decision support requirements of MTO
companies and specific ERP modules and add-ons, e.g. for Supply Chain Management
(SCM). In doing so, we also build on Bendoly & Jacobs’ (2004) study on the alignment of
ERP solutions with operational needs. The authors showed that overall company
performance/satisfaction becomes weaker if the operational strategy of a firm is misaligned
with its ERP adoption strategy, but they did not identify which modules within ERP solutions
show adequate fit with which operational needs. Moreover, the functionality of ERP systems
has continued to evolve since Bendoly & Jacobs’ (2004) study meaning it is important to take
an up-to-date view of the current fit between ERP functionality and company requirements.
In the next section of this paper – Section 2 – we seek to align decision support
requirements with the functionality of ERP systems by using the literature to identify the key
planning and control stages of relevance to MTO companies. For example, one planning and
control stage is the Customer Enquiry Management (CEM) stage where a due date (or lead
time) and price are quoted. This suggests certain decision support requirements, e.g. support
for due date setting. We also use the literature to identify key ERP modules and add-ons that
are potentially helpful. For example, decision making at the customer enquiry stage may be
aided by product configurator or CEM software. Section 3 builds a theoretical framework
based on three constructs – company decision support requirements, ERP functionality, and
company performance – and uses these to develop a set of hypotheses. The research method
is described in Section 4 before Section 5 presents the results of the survey, including the
results of testing the hypotheses to assess the applicability of ERP system functionality to
MTO companies and the impact of ERP systems on company performance. Three follow-up
case studies are then presented in Section 6 to dig deeper into the survey findings. Two of the
cases are MTO adopters of an ERP system, the other is a MTO non-adopter. Finally,
conclusions are drawn in Section 7, where the limitations of the study are also acknowledged
and future research directions suggested.
2. Literature Review Sections 2.1 to 2.5 below do the following: (i) define the five key planning stages of
relevance to MTO companies (see e.g. Stevenson et al., 2005; Land & Gaalman, 2009; Aslan
et al., 2012), thereby identifying the key decision support requirements of MTO companies;
and, (ii) link these requirements to the functionality of ERP systems and add-ons. This
approach is in accordance with the concept of fit (Drazin & van de Ven, 1985; Venkatraman,
1989), which is conceptualised in the contingency theory literature (e.g. Sousa & Voss, 3

2008). In addition, decision support requirements and ERP functionality for Customer
Relationship Management (CRM) and Supply Chain Management (SCM) tasks are outlined
in Section 2.6. Note that generic aspects like financial modules are ignored as we assume that
production strategy would not affect whether a firm is able to use or benefit from such
functionality. Finally, Section 2.7 provides an assessment of the literature and presents our
core research question. For a more comprehensive review of the literature on MTO
companies and ERP, see Aslan et al. (2012).
2.1 MTO Requirements and ERP Functionality for Customer Enquiry Management
The CEM stage is where a customer provides an invitation-to-tender for a particular product
to prospective suppliers, requiring the determination of a price and due date. This may
involve the estimation of lead times, the archiving and retrieval of product data, the
assessment of available design/production skills and facilities, the estimation of costs/profit
margins, and require effective coordination and communication between departments (e.g.
Hendry & Kingsman, 1993; Kingsman et al., 1996; Cakravastia & Nakamura, 2002; Zorzini
et al., 2008). This is a key planning stage for MTO companies as orders can vary greatly from
one to the next, hence standard or default lead times cannot be quoted (Kingsman & Hendry,
2002).
According to the literature, there are potentially four aspects of ERP functionality that are
relevant to the CEM stage. First, the CEM tools contained in many ERP systems have been
used by MTO companies for entering orders and automating certain transactions (Xiong et
al., 2006). In addition, Available-To-Promise (ATP) and Capable-To-Promise (CTP)
functionality may be used. ATP determines the amount of ‘uncommitted’ finished goods
inventory available, and CTP identifies slack capacity after available capacity has been
matched to committed orders (Ball et al., 2004). Finally, Product Lifecycle Management
(PLM) software combines estimating and product development with a product database to
enable a company to bring innovative products to market effectively (Møller, 2005). PLM
software has been shown to have promise for helping manufacturers of highly customised
products (Hicks & McGovern, 2009), but there remains doubt about how effective it can be
when enquiries/products are truly bespoke and lifecycles extremely short.
2.2 MTO Requirements and ERP Functionality at the Design & Engineering Stage
This stage is where detailed design & engineering planning takes place. It is of particular
relevance to Engineer-To-Order (ETO) companies – which we consider to be ‘extreme cases’
of a MTO strategy – yet little research has been conducted into this stage despite its impact
on the total lead time (Land & Gaalman, 2009). Wortmann (1995) highlighted an ability to 4
document aspects of product development throughout the order processing cycle as a key
feature required from an ETO-compliant system. In addition, Rudberg & Wikner (2004)
indicated that forecasting and order fulfilment mechanisms are needed when designing and
specifying products.
At this stage, both product configurator (or variant generator) and, again, PLM software
may be relevant. PLM software was briefly discussed above, hence the following focuses on
product configurator software. Product configurator software is described as combining well-
defined building blocks governed by rules and constraints into a product (Hvam et al., 2006).
Olsen & Sætre (2007) conducted an action research project to identify an appropriate ERP
system for a growing ETO company. A suitable system could not be found, with a key reason
being the degree of product customisation offered by the company at the design &
engineering stage. A vendor offered to provide product configurator software, but the
company developed its own in-house solution. In Deep et al.’s (2008) case study, product
configurator software was similarly judged as ineffective for the firm’s bespoke production
activities.
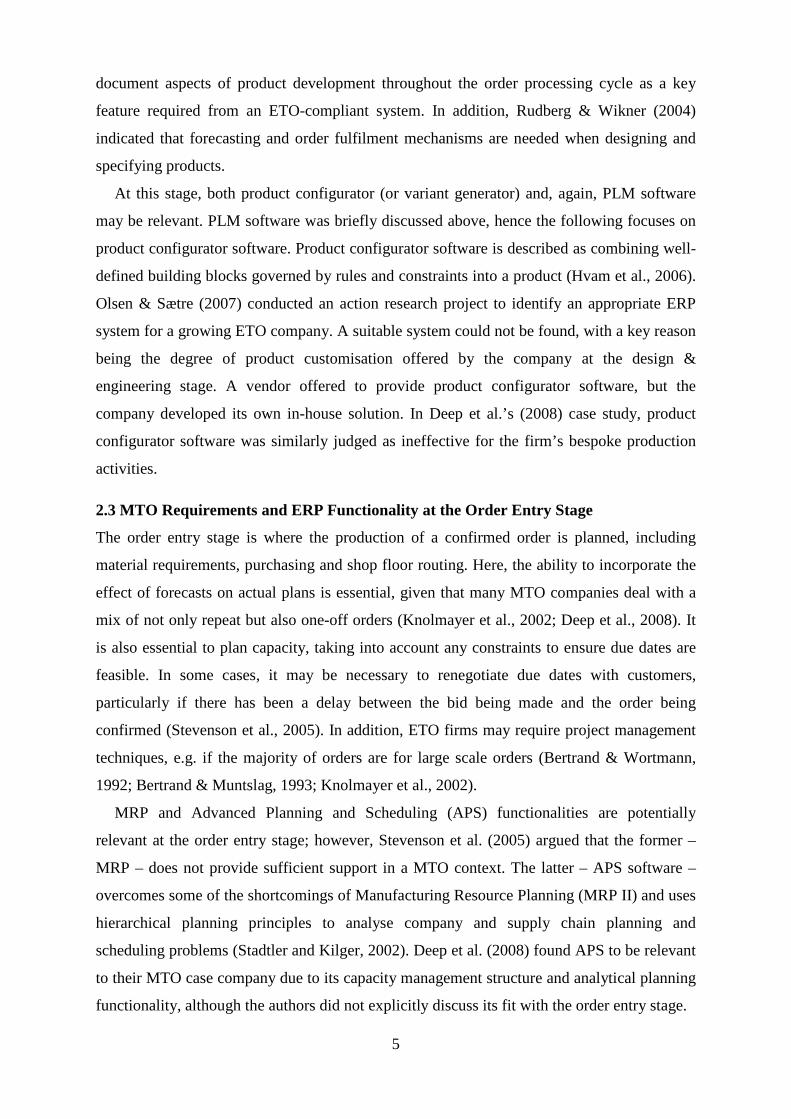
2.3 MTO Requirements and ERP Functionality at the Order Entry Stage
The order entry stage is where the production of a confirmed order is planned, including
material requirements, purchasing and shop floor routing. Here, the ability to incorporate the
effect of forecasts on actual plans is essential, given that many MTO companies deal with a
mix of not only repeat but also one-off orders (Knolmayer et al., 2002; Deep et al., 2008). It
is also essential to plan capacity, taking into account any constraints to ensure due dates are
feasible. In some cases, it may be necessary to renegotiate due dates with customers,
particularly if there has been a delay between the bid being made and the order being
confirmed (Stevenson et al., 2005). In addition, ETO firms may require project management
techniques, e.g. if the majority of orders are for large scale orders (Bertrand & Wortmann,
1992; Bertrand & Muntslag, 1993; Knolmayer et al., 2002).
MRP and Advanced Planning and Scheduling (APS) functionalities are potentially
relevant at the order entry stage; however, Stevenson et al. (2005) argued that the former –
MRP – does not provide sufficient support in a MTO context. The latter – APS software –
overcomes some of the shortcomings of Manufacturing Resource Planning (MRP II) and uses
hierarchical planning principles to analyse company and supply chain planning and
scheduling problems (Stadtler and Kilger, 2002). Deep et al. (2008) found APS to be relevant
to their MTO case company due to its capacity management structure and analytical planning
functionality, although the authors did not explicitly discuss its fit with the order entry stage.
5

2.4 MTO Requirements and ERP Functionality at the Order Release Stage
Order release is a decoupling phase at which a company decides when to start production, i.e.
when to release a job to the shop floor. Further planning and control may be needed here to
ensure sufficient capacity is available to allow jobs to be released in time to meet their due
dates. The need to control this stage was identified by Wight (1970) to avoid the ‘untimely’
release of jobs, which can result in a ‘vicious cycle’ of work-in-process accumulation known
as the lead time syndrome (Mather & Plossl, 1978). This stage has received far more
attention in the literature than the preceding stages (e.g. Wisner, 1995; Bergamaschi et al.,
1997).
Breithaupt et al. (2002) reported that the order release mechanism of load-oriented
manufacturing control (see Bechte, 1988) was previously included in the SAP R/2 system and
the systems of some domestic ERP vendors in Germany. However, to the best of our
knowledge, contemporary ERP systems do not contain this mechanism and no further
information on this is available in the literature. Hence, it remains unclear what functionality
is available to support order release. Such a decoupling stage may not be required in
standardised production environments – hence this planning and control stage may not be
explicitly addressed within the design of contemporary ERP systems.
2.5 MTO Requirements and ERP Functionality at the Shop Floor Dispatching Stage
At this stage, a detailed shop floor schedule is determined and jobs are sequenced on the shop
floor. This is a well-researched area for which many algorithms have been developed and
reviews published (e.g. Blackstone et al., 1982; Błażewicz et al., 1996). In MTO companies –
which often operate as job shops with high routing variability – detailed scheduling can be
complex as, for example, it can be difficult to predict the arrival times of jobs at particular
machines. Hence, some authors have argued that simple sequencing rules (e.g. first-in-first-
out) may be preferred with control left to highly skilled labour, particularly if the preceding
planning stages are appropriately executed (Kingsman, 2000).
It seems reasonable to assume that APS functionality is potentially relevant to MTO
companies for scheduling orders on the shop floor. However, from Kingsman’s (2000)
argument above it follows that dispatching may be the least important stage in the planning
and control hierarchy for MTO companies. Jonsson & Mattsson (2003) agreed with this, but
also suggested implementing a ‘dispatching list’ method, where advised priorities are given
to the shop floor. On planning for the use of capacity at the dispatching level, Tenhiälä (2011)
concluded that rough-cut methods – as featured in many ERP systems – can be used by
6
companies utilising job-shop environments (i.e. MTO and ETO companies). Moreover, MRP
functionality may also be relevant to shop floor dispatching (Aslan et al., 2012).
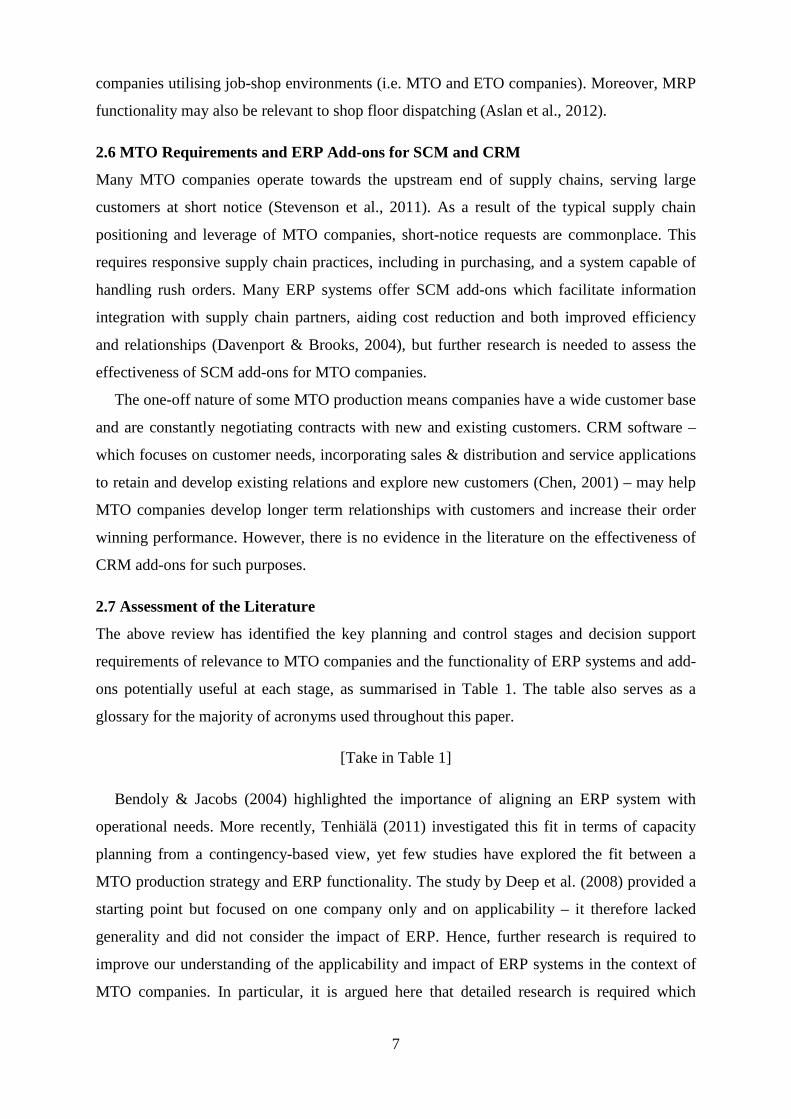
2.6 MTO Requirements and ERP Add-ons for SCM and CRM
Many MTO companies operate towards the upstream end of supply chains, serving large
customers at short notice (Stevenson et al., 2011). As a result of the typical supply chain
positioning and leverage of MTO companies, short-notice requests are commonplace. This
requires responsive supply chain practices, including in purchasing, and a system capable of
handling rush orders. Many ERP systems offer SCM add-ons which facilitate information
integration with supply chain partners, aiding cost reduction and both improved efficiency
and relationships (Davenport & Brooks, 2004), but further research is needed to assess the
effectiveness of SCM add-ons for MTO companies.
The one-off nature of some MTO production means companies have a wide customer base
and are constantly negotiating contracts with new and existing customers. CRM software –
which focuses on customer needs, incorporating sales & distribution and service applications
to retain and develop existing relations and explore new customers (Chen, 2001) – may help
MTO companies develop longer term relationships with customers and increase their order
winning performance. However, there is no evidence in the literature on the effectiveness of
CRM add-ons for such purposes.
2.7 Assessment of the Literature
The above review has identified the key planning and control stages and decision support
requirements of relevance to MTO companies and the functionality of ERP systems and add-
ons potentially useful at each stage, as summarised in Table 1. The table also serves as a
glossary for the majority of acronyms used throughout this paper.
[Take in Table 1]
Bendoly & Jacobs (2004) highlighted the importance of aligning an ERP system with
operational needs. More recently, Tenhiälä (2011) investigated this fit in terms of capacity
planning from a contingency-based view, yet few studies have explored the fit between a
MTO production strategy and ERP functionality. The study by Deep et al. (2008) provided a
starting point but focused on one company only and on applicability – it therefore lacked
generality and did not consider the impact of ERP. Hence, further research is required to
improve our understanding of the applicability and impact of ERP systems in the context of
MTO companies. In particular, it is argued here that detailed research is required which
7

investigates which modules within ERP solutions show adequate fit with which operational
needs.
In response, the research question driving the mixed method study described in the
remainder of this paper is as follows:
How does a MTO production strategy affect the applicability and impact of ERP
systems?
The following section presents a theoretical framework which is used to build hypotheses
to test the relationships between decision support requirements, the use of ERP and company
performance before Section 4 outlines the research method in full.
3. Theoretical Framework The theoretical framework links together three constructs: decision support requirements; the
functionality provided by ERP systems; and, company performance. The decision support
requirements relate to the needs of companies at the various planning stages (e.g. order
entry); the functionality of ERP systems relates to the various ERP modules and add-ons (e.g.
MRP and CRM); and, company performance explores the impact of using the software. The
literature review above identified company requirements and ERP functionality; similarly,
company performance is based on relevant metrics from the literature, e.g. due date
adherence, order winning performance, etc.
A general theoretical framework is illustrated in Figure 1, where the connections between
constructs relate to the hypotheses tested in this study. The figure shows that the fit between
requirements (1) and performance (3) is tested both directly and through the mediating effect
of system use (2); hence, both applicability and impact are evaluated. This type of three-
construct theoretical framework between characteristic, mediator and performance – also
known as a “mediational model” – has been used in similar studies in the operations
management literature (Bozarth & Edwards, 1997; Bozarth & McDermott, 1998; Choi &
Eboch 1998; Cao & Zhang, 2011). Going from Construct (1) through the use of Construct (2)
to Construct (3), that is from Ha to Hb, seems a logical way of testing the relationships among
company requirements, via the use of corresponding ERP functionality, and company
performance. Meanwhile, having significant support for a link between Construct (1) and
Construct (3), that is Hc, indicates indirect benefits from adopting any practices. Each
construct is multi-dimensional and each dimension consists of at least one variable. For
example, the first construct includes the dimension of decision support at the customer
enquiry stage, which includes variables such as support for pricing and due date setting. The
8

following subsection focuses specifically on the CEM stage to provide an example of how the
hypotheses have been constructed.
[Take in Figure 1]
3.1 Example Hypothesis Development: The Customer Enquiry Management Stage
The theoretical framework in the context of the CEM stage consists of: (1) CEM decision
support requirements (e.g. for due date setting and price determination); (2) the use of CEM-
relevant functionality (e.g. the CEM functionality of ERP), and; (3) CEM performance (e.g.
order winning performance). Using this framework, we seek to determine the extent to which
ERP systems and add-ons can satisfy the CEM decision support requirements of MTO
companies; and, the effect of ERP on company performance for CEM. As an example, the
hypotheses that follow are the relationships anticipated between the three constructs for the
CEM module of an ERP system:
H1a: The level of decision support requirements has a positive impact on the intensity of use
of ERP’s CEM functionality.
H1b: The intensity of use of ERP’s CEM functionality has a positive impact on performance
at the CEM stage.
H1c: The level of decision support requirements has a positive impact on performance at the
CEM stage.
The above hypothesis structure has been repeated to develop similar sets of hypotheses for
the other functionality identified in the literature review as potentially relevant at this stage
(i.e. ATP, CTP and PLM). Hence, a total of 12 hypotheses have been developed for the CEM
stage (i.e. 3 for CEM, 3 for ATP, 3 for CTP and 3 for PLM). In total, 39 hypotheses have
been developed across all the planning and control stages plus SCM and CRM (12 for CEM,
6 for design & engineering, 6 for order entry, 3 for order release, 6 for dispatching, 3 for
CRM and 3 for SCM). But insufficient data was obtained from the survey to test hypotheses
at the order release (3) and dispatching stages (6), hence these two stages are not investigated
further in this study and we concentrate on testing the remaining 30 hypotheses. The absence
of data may be due to the lack of support provided by ERP systems for order release and the
low level of importance attributed to shop floor dispatching in MTO companies, but further
research is required to confirm this.
The following section describes the research method adopted in this study. The full set of
30 hypotheses is given later in the results section (see Section 5.2, Table 11), together with an
indication as to whether they are supported or otherwise by the survey data. 9

4. Research Method A mixed method approach has been adopted, consisting of an exploratory and explanatory
survey followed by 3 case studies. Adopting a mixed method approach has recently been
advocated and encouraged in the operations management literature (e.g. Burgess et al., 2006;
Boyer & Swink, 2008; Taylor & Taylor, 2009). It provides methodological triangulation
(Denzin, 1970) and allows for the use of complementary strengths while compensating for
the weaknesses of individual approaches (Jick, 1979). Our mixed method approach obtains
the power and generality of a survey while overcoming the depth problem of surveys through
the richness of cases. Employing the case study method after the survey work provides a
means of examining the results in more depth and of validating the findings (Voss, 2009).
Section 4.1 below focuses on the design of the survey research, which is the primary method
used in this paper, before Section 4.2 briefly describes the case study research design.
4.1 Survey Research Design
Forza’s (2009) checklist of 37 attributes for a rigorous survey – which is a more detailed and
extended version of the 17 attributes contained in Malhotra & Grover’s (1998) earlier
framework – has been a major influence on our survey design. We have also paid close
attention to the approach adopted in the most relevant surveys from the ERP literature, e.g.
Mabert et al. (2000 and 2003) and Olhager & Selldin (2003). Note that no study has been
able to fulfil all 37 of Forza’s (2009) attributes, but giving them explicit consideration and
satisfying as many as possible is nonetheless important. Moreover, documenting them allows
the limitations of a study to be acknowledged. Table 2 summarises key attributes from
Forza’s (2009) checklist and briefly comments on how each has been accommodated or
addressed. Further detail is also provided in the following discussion on instrument
development, data collection, and data quality.
[Take in Table 2]
4.1.1 Instrument Development
The survey included exploratory questions to gain an overview of the respondents, their firms
and their (non-)adoption of ERP; and, explanatory questions to test the hypotheses. The
exploratory questions were based on those used in previous studies for similar purposes (e.g.
Mabert et al., 2000 and 2003; Stratman, 2001; Olhager & Selldin, 2003) and thus had been
pre-validated. These questions were split into four sections. The first two sections were fully
answerable by both adopters and non-adopters and by both MTO and MTS companies,
10

covering background information (e.g. company size, production process, etc) and decision
support requirements (based on a 7-point Likert scale, which reduces bias against extreme
responses more than 3 or 5-point scales: Dillman, 2007). Sections 3 and 4 were for adopters
only and measured the intensity of use of ERP functionality and performance, respectively –
again, largely based on 7-point Likert scales. Note that our core focus is on MTO companies,
but data on MTS companies was also collected as a basis for comparison.
As no existing instruments for the explanatory part were available, the questions had to be
developed and then validated through a content validity assessment and pilot study. Content
validity was assessed based on the opinions of ten experts (academics and practitioners) using
the manual sort technique (Nunnally & Bernstein, 1994; Rungtusanatham, 1998; Forza,
2009). This consisted of three rounds, involving 3, 4 and 3 expert judges, respectively who
were asked to sort randomised questions into relevant categories, with the number of correct
and incorrect matches assessed. Different experts were used in each round to avoid learning
effects. Validity measures applied included Cohen’s Kappa (κ) ratio (Cohen, 1960), Perreault
& Leigh’s (1989) reliability index (Ir) and the Proportional Reduction in Loss (PRL) measure
(e.g. Rust & Cooil, 1994). The measures were assessed after each round, with misunderstood
and superfluous questions either rewritten or discarded, whilst ensuring full coverage of the
construct (e.g. Venkatraman & Grant, 1986). The final value obtained for each measure was
well above that suggested in the literature (>0.7 for κ; >0.8 for Ir; and, >0.85 for PRL),
indicating readiness for a pilot study. A summary of the three rounds is provided in Table 3.
[Take in Table 3]
The number of items or questions was reduced from 127 to 89 and the number of variables
from 58 to 46; the number of constructs and dimensions were unchanged. The questionnaire
was long, but this procedure had reduced its length – and this was likely to improve the
response rate (Jobber, 1986; Dillman, 2007). A copy of the survey instrument is provided in
Appendix A.
For the pilot study, the survey was emailed to 37 managers enrolled on an executive
programme at the authors’ university; 19 managers completed the survey – greater than the
minimum of 15 recommended for a pilot by Forza (2009) – resulting in a response rate of
51.4%. As in Menor & Roth (2007), the pilot tested the ‘ready-to-send’ survey instrument.
This allowed us to experience handling the administrative procedure, to explore non-response
bias issues, and conduct preliminary data analysis. Only 4 responses were provided in the
first week, highlighting the importance of sending reminders. In addition, data analysis
identified some unusual responses, leading to a number of questions being further revised. 11

Four respondents provided contact details and were called to provide feedback. The
instrument was considered clear, although it was too long and so several questions were
removed. A monetary incentive (a prize draw for a shopping voucher) and an executive
summary of results had been offered and these were well-received, so also used in the full
scale survey. Finally, it was suggested that the full scale survey be sent via by both mail and
email (as described in the next subsection).
4.1.2 Full Scale Survey Data Collection
The survey was posted to 1,634 companies listed in a database purchased for this research.
The database of contacts does not indicate whether a company has implemented an ERP
system nor does it indicate the dominant production strategy; the only controllable strata are
company size, industry/sector and the role/position of the respondent. Several commercially
available company contact databases were considered at the start of this study and all were
found to provide only one potential respondent per organisation. All firms are in the UK. The
database contained email addresses for 1,088 of the 1,634 firms – these firms were also
emailed and invited to submit their responses online if they wished. The email addresses were
also used to send an advance notice and three follow-up reminders. However, some of the
email addresses were generic or non-personal (i.e. [email protected] or
[email protected]), reducing the effectiveness of this technique, while approximately 300
emails ‘bounced back’. This prompted us to check the reliability of the database. The
websites of 100 companies randomly sampled from the database were therefore visited and
the details of 38% were found to be inaccurate (e.g. incorrect address, company no longer
trading, etc). It is therefore reasonable to assume that around 38% of the questionnaires did
not reach their intended target, reducing the number of potential respondents to 1,013.
Overall, a total of 111 fully complete responses were received, giving a response rate of
10.96%. Such a response rate is not uncommon (Alreck & Settle, 1995), including in the ERP
literature, e.g. 9.6% in Mabert et al. (2000 and 2003) and 13.0% in Stratman (2001). For the
exploratory analysis, the responses increase to 126 (12.4%) as 15 respondents completed the
exploratory questions online but abandoned before completing the explanatory part. This is
well above the minimum of 52 responses advised by Forza (2009) for exploratory data
analysis.
In total, 60.3% of respondents had adopted, were implementing or intended to adopt ERP
(76 of 126 companies), while 47.6% of respondents were MTO companies (60 of 126
companies). All respondents were senior managers or directors, e.g. Managing Director
(29%), Director (20%), or Production/Manufacturing Director (9%). In addition, a wide range
12

of industrial sectors were represented, with the most common being: industrial machinery and
equipment (15%); automotives (14%); aerospace and defence (13%); computers and
electronics (9%); consumer goods (8%); chemicals (7%); raw materials (metals, woods and
plastics: 7%); ship building (6%); and, pharmaceuticals (6%). Characteristics of the
companies are summarised in Table 4, where the number of employees, turnover, production
strategy, and supply chain position are given. Note that we focus on a broad MTO vs. MTS
comparison, but clearly there are many other potential points on the production strategy
continuum. Thus, firms where an Assemble-To-Order (ATO) strategy is dominant are
included in the MTS category and firms where ETO is the dominant strategy are included in
the MTO category.
[Take in Table 4]
4.1.3 Assessing Non-Response Bias and the Measurement Quality of the Data
Non-response bias was checked by comparing first wave data with late returns, i.e.
respondents convinced to reply by reminder notices that would otherwise have been non-
respondents (e.g. Armstrong & Overton, 1977). This was done using a non-parametric chi-
squared test as some of the data violated normality assumptions. The tests were based on
responses to eight exploratory questions relating, e.g. to the number of employees, turnover,
production strategy, and ERP efforts (adoption/non-adoption). Table 5 shows that the results
for first wave and late returns do not differ significantly, since all asymptotic significance
values are above 0.05. Hence, there is no evidence of non-response bias in the data.
[Take in Table 5]
Finally, and before the results can be presented in Section 5, the measurement quality of
the relevant data must be evaluated (Biemer et al., 1991; Malhotra & Grover, 1998). This was
assessed based on five measures which confirmed the reliability and validity of the data:
1. Unidimensionality was checked (Stratman & Roth, 2002; Forza, 2009) to ensure
consistency between items grouped under the same construct, as suggested by Ahire et al.
(1996), Exploratory Factor Analysis (EFA) was used to gain a preliminary insight before
Confirmatory Factor Analysis (CFA) was applied for each dimension, with a benchmark
comparative goodness of fit index of 0.9 used to determine which items to drop (Bollen,
1989). The CFA test was then reapplied with a reduced model until adequate fit was
obtained.
2. Reliability procedures were applied to test the consistency of the results and the
repeatability of measurements (Carmines & Zeller, 1979). Cronbach’s alpha (Cronbach, 13

1951) reliability estimation was evaluated, with all variables above 0.6, most above 0.8
and some above 0.9. This indicated that a reliable set of variables had been used in the
instrument (Nunnally, 1978; Robinson et al., 1991). The Wers-Linn-Jöreskog (WLJ) and
Average Variance Extracted (AVE) tests of reliability also reported acceptable values.
3. Convergent validity (part of construct validity) was assessed according to the technique
presented in Krause et al. (2000) to determine the extent to which different approaches to
construct measurement yield the same results (Campbell & Fiske, 1959). Krause et al.’s
(2000) technique is based on the magnitude and sign of the factor loadings of items onto
their respective latent constructs in the CFA measurement models previously run in the
unidimensionality assessment. In addition, the Proportional Reduction in Loss (PRL)
technique was used. Both showed adequate fit between the model and data.
4. Discriminant validity using CFA assessed the degree to which measures of different
concepts were distinct (Bagozzi & Phillips, 1982). CFA of all possible pairs of latent
variables was produced twice, with the difference between the χ2 values of two results
tested for the significance of the statistic (constrained χ2 minus unconstrained χ2) for each
pair (Venkatraman, 1989). All differences were significant at p < .05 and 33 out of 42
were significant at p < .001, suggesting strong discriminant validity (Bagozzi et al., 1991).
5. Criterion-related validity was assessed using Structural Equation Modelling (SEM; see
Ahire et al., 1996) to measure how well variables representing various decision support
requirements related to measures of performance (Flynn et al., 1994). Only the
relationships amongst the inter-construct latent variables in the order entry model were
non-significant – hence, there may not be a direct relationship between decision support
requirements and performance at this stage.
4.2 Case Study Research Design
Three case studies were conducted to confirm and follow up on the findings of the survey.
All interviews were in MTO companies, as our primary focus was on understanding the
applicability and impact of ERP systems on MTO companies. Two were MTO adopters of
ERP; the third was a MTO non-adopter. The two MTO adopters are hereafter referred to as
MA1 and MA2 and the MTO non-adopter as MNA.
Survey respondents were invited to provide their contact details if they wished to
participate in follow up cases – MA1, MA2 and MNA were selected from this subset of
respondents. In total, 19 respondents had shown an interest in participating in case work and
14 of these were MTO companies. In addition, the case selection logic involved re-examining
the survey responses of candidate cases and deliberately choosing companies that had
14

provided ‘interesting’ answers or it appeared would be in a good position to help answer any
outstanding questions that we had after the survey data analysis. For example, we became
interested in why MTO companies found ERP system selection difficult, so we ensured that
at least one of the selected cases had indicated in their survey response that they found system
selection either very difficult or extremely difficult.
The interviews were semi-structured, supported by a case study protocol (Yin, 2009)
developed after the survey data analysis. The protocol included high-level open-ended
questions and more detailed specific questions to check the survey responses and dig deeper
into the “why” (Voss, 2009). As an example, the interview protocol prepared for a MTO non-
adopter is provided in Appendix B. Three interviews were conducted in MA1, with the
Managing Director, Manufacturing Manager, and IT Coordinator & Purchasing Manager; in
MA2, only the Operations & IT Director was interviewed; finally, in MNA, the Managing
Director was interviewed. All interviews were audio-recorded and fully transcribed; notes
were also taken during the interviews. Two researchers were present at the interviews with
MA1 and MNA and were able to compare their notes and interpretations of the interviewee
responses. Summaries of the interviews were returned to the interviewees for validation
(Miles & Huberman, 1994), with any vague or misinterpreted responses clarified. An
overview of the three companies is provided in Table 6 – we will return to the case study data
in Section 6 after presenting the survey results.
[Take in Table 6]
5. Survey Results Section 5.1 presents the exploratory results based on univariate and bivariate tests before
Section 5.2 presents the explanatory results based on multivariate tests. Statistical analysis
has been conducted – for the majority of data, parametric tests were appropriate, e.g. t-tests
and ANOVA; where test assumptions do not hold – non-parametric tests have been applied,
e.g. Mann-Whitney U, Chi-squared and Kolmogorov-Smirnov tests. A brief discussion of the
results then follows in Section 5.3 before Section 6 provides the case study evidence.
5.1 Exploratory Survey Results
Section 5.1.1 presents univariate analysis of the sample as a whole, detailing the percentage
of firms adopting ERP, the reasons behind adoption, the choice of vendor, and the use and
customisation of specific modules before the reasons behind non-adoption of ERP are
outlined. Section 5.1.2 then presents bivariate analysis, exploring the effects of production
strategy (MTO vs. MTS) on ERP adoption/non-adoption. 15

5.1.1 Univariate Analysis
Almost 51% of respondents indicated that their company had adopted an ERP system; a
further 8% were currently installing ERP and 2% planned to install ERP. Most adopters had
obtained their system from a single vendor (82%), in some cases with add-ons from the same
provider. The reasons why firms implemented an ERP system are given in Table 7, where the
mean score is based on respondents indicating their level of agreement with the importance of
factors on a Likert scale from 1 (strongly disagree) to 7 (strongly agree). The top three
reasons were to standardise processes, replace legacy systems and improve integration.
[Take in Table 7]
In total, 39 different vendors have provided ERP systems to the adopters, plus 3% of firms
have developed their own in-house system. The three most widely used systems are provided
by international vendors – SAP (18%), Microsoft (11%) and Sage (9%) – but many vendors
are UK/domestic providers. Interestingly, most of the firms that have implemented SAP are
medium or large-sized MTS companies. A wide range of modules are in use, with the most
popular being order entry (88%), purchasing and logistics (88%), sales & delivery (84%),
materials management (83%) and production planning (82%). Interestingly, the production
planning and sales & delivery modules were also amongst the modules that respondents had
to customise the most. The most frequently implemented add-ons included CRM (28%), APS
(26%) and SCM (21%) functionality. The least implemented add-ons were the PLM (13%)
and product configurator (14%) modules, which we had previously questioned in the context
of customised production (see Section 2).
Of the remaining respondents, approximately 37% were non-adopters with no plans to
install, while approximately 2% (2 firms) had used and abandoned an ERP system. One of
these firms had abandoned ERP because of: the costs of implementation, maintenance and
training; a lack of payback from implementation; and, a lack of in-house expertise on how to
use the system. Interestingly, a key reason why the other firm had abandoned ERP was
because – after beginning to implement and use the system – it became clear that the software
could not meet the needs of the company. Finally, the reasons why firms have not adopted
ERP are given in Table 8, where the most cited reason is that, again, it was thought that ERP
would not suit the needs of the company.
[Take in Table 8]
16

5.1.2 Bivariate Analysis
Correlation analysis, cross-tabulations and group-wise comparisons have been used to
explore links between the responses to individual exploratory questions from the survey. Of
most interest are any differences between: MTO adopters and MTS adopters; MTO adopters
and MTO non-adopters; and, MTO non-adopters and MTS non-adopters.
MTO Adopters vs. MTS Adopters
Using ANOVA, some significant differences are evident between MTO and MTS firms with
respect to the reasons to adopt an ERP system. In other words, what motivates MTO
companies to adopt ERP differs from what motivates MTS companies. Figure 2 shows the
mean response on a 7-point Likert scale for the reasons to adopt an ERP system. For
example, a significant difference was found between the responses for item 14e (adoption
linked to global activities or to support globalisation activities) – MTS firms have a
significantly higher mean and therefore see this as being a more important factor motivating
ERP adoption than MTO companies. While most firms in the sample were small or medium
sized, the few large firms were MTS companies and this may explain the result. Both MTO
and MTS firms link ERP adoption to generic issues like standardising business processes,
integration, and replacing legacy systems (14b, 14c, and 14d in particular) while the mean
response by MTO and MTS companies is also high for 14g – to improve production planning
effectiveness. Adoption is less influenced, for example, by e-commerce considerations (14f)
or customer pressure to adopt ERP (14j).
[Take in Figure 2]
There are also significant differences between MTO and MTS firms with respect to the
system selection process. On average, ERP adopters found it “difficult” (3) to identify the
most appropriate ERP system (based on a rating between 1-extremely difficult and 7-
extremely easy). But MTO companies found system selection more difficult on average than
MTS companies. As the production strategy of a firm shifts from standard towards bespoke
products, selecting an appropriate ERP system becomes increasingly difficult. Thus, there is
evidence that production strategy has a major bearing on the system selection process.
Comparisons have also been made between the modules and add-ons implemented by
MTO and MTS companies (see Figure 3 and Figure 4, respectively). The only significant
differences between the modules/add-ons adopted by MTO and MTS companies are with
respect to Quality Management and Computer Aided Design (CAD) systems. Quality
Management is not used by the majority of ERP adopters, but it is used much more by MTO
17

than MTS firms. CAD is the most frequently adopted add-on by MTO companies, and there
is a significant difference between the use of CAD systems by MTO and MTS firms
(p<0.01). The reason for ocular but non-significant differences is that the sample size
decreased for other add-ons as users tend to first decide to adopt ERP then later adopt add-
ons if necessary. The importance of a CAD system add-on was not, however, identified from
our literature review.
[Take in Figures 3 and 4]
MTO Adopters vs. MTO Non-adopters
The data on MTO adopters vs. non-adopters suggests that industry and company size
characteristics may affect a MTO company’s decision to adopt ERP. Many of the MTO
companies that have adopted ERP are in the automotives and aerospace & defence industries;
in contrast, raw material manufacturers and industrial machinery & equipment manufacturers
appear less likely to implement ERP. It is also noticeable that the MTO adopters tend to be
larger than the MTO non-adopters.
MTO Non-Adopters vs. MTS Non-Adopters
Using ANOVA, there was only one significant, but important, difference evident between
MTO and MTS firms with respect to the reasons not to adopt an ERP system – that “ERP
would not suit the needs of the company”. Overall, this was the most highly cited reason not
to adopt ERP but MTO non-adopters significantly agreed with this reason much more so than
MTS non-adopters (p = 0.0016 and 0.0031, which is less than 0.01 for t-tests assuming equal
or unequal variances).
5.2 Explanatory Survey Results
Structural Equation Modelling (SEM) has been used in accordance with Shah & Goldstein’s
(2006) guidelines to assess the fit between the data and the theoretical framework. Because
the sample size is relatively small, partial aggregation has been used as an approximation to
the full SEM model (Carter et al., 2008; Koufteros et al., 2009). The hypotheses developed
are in sets of three, thus the 30 hypotheses required 10 structural models. All 10 models were
solved using the maximum likelihood ratio method. A good fit between the predetermined
model and the data was identified for all but the two latent variables loading on decision
support requirements in the SCM model. Thus, the values of the path coefficients (loadings)
were statistically significant to use for all but the SCM model.
Table 9 summarises the results for the overall model fit (first four columns) and causal
path values together with their significance (remainder of the table). The three causal paths 18

are between Decision Support Requirements (DSR) and the use of ERP (USE); USE and
performance (PERF); and, DSR and PERF. Two of the models – Design & Engineering
through the use of PLM and the SCM model – do not show adequate fit with the data (p
values are less than 0.05; in fact, both are less than 0.01) and, therefore, cannot be used to test
their corresponding hypotheses. When model fit is assessed separately for MTO and MTS
companies, as shown in Table 10, most of the models using only the MTS data resulted in a
poor model fit. In contrast, the MTO data resulted in quite a good fit with all the models
except SCM. Therefore, the focus in what follows is largely on the complete data and on our
main interest – MTO companies only.
[Take in Tables 9 and 10]
Table 11 presents the full set of 30 hypotheses tested using the survey data and indicates
whether each is supported, not supported or if there is insufficient data/model fit to evaluate
the degree of support. The presentation of results is organised around the planning and
control stages for which sufficient data was obtained plus CRM and SCM.
[Take in Table 11]
5.2.1 Customer Enquiry Management (CEM) Stage
All three hypotheses on the use of an ERP system’s CEM functionality at the CEM stage are
supported for the data as a whole. As shown in Figure 5 (see also tables 9 and 11 for this and
the other hypotheses), high CEM decision support requirements lead to intensive use of the
system (R1 = 0.370) and improved performance (R3 = 0.691) at the CEM stage. In addition,
the use of CEM tools has a significant impact on improving performance at this stage (R2 =
0.374). In other words, when CEM decision support requirements are high, a company is able
to utilise the system for CEM purposes, and as a mediating effect this use also leads to
improved CEM performance. Similar significant results and impact values are obtained when
only the MTO data is used (see tables 10 and 11). In other words, the data fit and the
significance of the relationships in the model are valid and powerful when both complete data
and only the MTO data is used. This is not true for the MTS data for which model fit is
inadequate, showing that it is the MTO data that is the actual factor in this convergence.
Thus, when CEM decision support requirements are high, a MTO company is able to use the
CEM functionality of its ERP system to help and, as a mediating effect, this use leads to
improved CEM performance.
[Take in Figure 5]
19

There are also two significant relationships in the CEM-ATP model (see tables 9 and 11).
The model’s second and third hypotheses are supported such that both decision support
requirements and the use of ATP functionality have positive and significant impacts on
improved performance at the CEM stage. However, a significant link between the need for
decision support and the intensity of use of ATP functionality could not be established. The
MTO data on its own also has good model fit and two significant causal links amongst the
constructs (see tables 10 and 11). But this time, the second hypothesis which was supported
by the overall data set is not significant, while the first one is significant. In other words, the
CEM decision support requirements of MTO companies seem to have an impact on the use of
ATP functionality and on CEM performance.
The results for the two remaining CEM models (CTP and PLM) support only the third
hypothesis. Thus, in all four CEM models for the data as a whole and for the MTO data only,
the impact of decision support requirements on performance is supported. In other words,
when firms indicate high CEM decision support requirements, they get high CEM
performance without considering the mediating effect of the use of ERP tools.
5.2.2 Design & Engineering Stage
The results for the two design & engineering models (Product Configurator and PLM
software) support only the third hypothesis for the data as a whole. Thus, the usefulness of
this functionality could not be convincingly shown. Although the literature has reported
successful examples of product configurator usage (e.g. Forza & Salvador, 2002; Hvam et al.,
2006; Olsen & Saetre, 2007), especially in SMEs, to the best our knowledge PLM
functionality has not been subject to any relevant prior analysis. Hence, further research is
required with a larger sample to confirm or refute the claims regarding product configurator
software and to provide an initial contribution on PLM.
5.2.3 Order Entry Stage
At the order entry stage, the data as a whole demonstrates a significant relationship for both
the MRP and APS models between the intensity of use of the system and order entry
performance. This suggests that MRP and APS have a positive and significant impact on
planning performance. For the APS model, this is also true for both the MTO and MTS data
separately, but this is not the case for MRP. While there are two significant causal links in the
Order Entry-MRP model for the MTO data, only one of these is positive – the path from the
use construct to the performance construct (i.e. R2). The second significant link – from
decision support requirements to performance (i.e. R3) – is negative. In other words, the
estimation tells us that the use of MRP within a MTO company’s ERP system improves order 20

entry performance but that this is not supported by considering the level of decision support
requirements at the order entry stage. That is, the use of MRP does not behave as a
performance enhancing mediator from company requirements to customer satisfaction. If
high operational and tactical planning system support is needed, low planning performance is
observed in the short and medium term. Thus, there remains no evidence to refute the claim
that MRP is unsuitable for MTO companies (e.g. Stevenson et al., 2005). Therefore, an ERP
system, which stems from MRP and comprises it as the core planning module, can be helpful
to a MTO company when an alternative, robust (i.e. less sensitive to change) and capacity-
concerning mechanism is provided for its use at the order entry stage. Due to a lack of data
on order release and dispatching, the analysis now turns to CRM and SCM.
5.2.4 Customer Relationship Management (CRM)
Like the CEM-ERP model, the CRM model is fully supported for the data as a whole. In
other words, high CRM decision support requirements lead to intensive use of the CRM add-
on (R1 = 0.550) and improved CRM performance (R3 = 0.499). In addition, the use of CRM
has a significant impact on improved CRM performance (R2 = 0.344). In other words, when
CRM decision support requirements are high, a company is able to use its CRM system to
help and, as a mediating effect, this use leads to improved CRM performance. It is not
possible, however, to draw specific conclusions for MTO companies because so few firms
have implemented CRM.
5.2.5 Supply Chain Management (SCM)
The overall results for the SCM model are totally inconclusive. Few of the path coefficients
are significant, the model fit is inadequate, and none of the hypotheses are supported.
Interestingly, the MTS data actually fits the SCM model well, while the MTO data does not.
This suggests that MTS companies may benefit from a SCM add-on to their ERP system,
particularly those that are part of complex supply networks.
5.3 Brief Discussion of Survey Findings
Overall, it can be concluded that production strategy is an important contextual factor that
affects ERP adoption. It affects the level of difficulty in selecting an ERP system and the
impact of using certain modules or add-ons. At the CEM stage, all hypotheses were supported
for the CEM module of ERP – both for the data as a whole and for MTO companies
separately. But, at the design & engineering stage, no benefits were observed from the use of
either product configurator or PLM software. Meanwhile, an important negative link between
decision support requirements and performance was obtained for the use of MRP in MTO
21

companies, suggesting MRP is unsuitable for MTO companies. More specifically, when a
MTO company requires a high level of decision support at the order entry stage, it shows
poor planning performance. CRM is a key add-on for both MTO and MTS companies and
can lead to improved CRM performance – indeed, significant results were obtained between
CRM decision support requirements, the use of the CRM add-on and improved CRM
performance.
Some of the survey data warrants further investigation. For example, many adopters
indicated that they make only limited use of ERP – but it is unclear why. Similarly, many
non-adopters identified the unsuitability of available systems as the main reason for non-
adoption, but how they came to this conclusion is unclear. Hence, three follow-up case
studies have been conducted to further unpack: the reasons behind ERP adoption and non-
adoption by MTO companies; why MTO companies find system selection difficult; and, why
they do not appear to benefit from ERP planning tools, as described in the next section.
6. Case Study Findings The following subsections present a brief discussion of the cases organised around the
applicability, use, and impact of ERP. MA1 and MA2 – the two MTO adopters – contribute
to all three sections (6.1 to 6.3), while MNA – the MTO non-adopter – is important for
understanding applicability (Section 6.1).
6.1 Applicability of ERP: The Adoption and Non-Adoption of ERP by MTO Companies
Although MA1 and MA2 had adopted ERP, their survey responses indicated that they found
ERP selection either very difficult (MA1) or extremely difficult (MA2). MA1 is a small
company with a risk-averse Managing Director concerned about the impact of a failed
implementation. He explained that “getting the wrong system would be a business
threatening decision”. A lack of trust in the information provided by vendors was also a key
issue affecting the selection process. The Managing Director of MA1 argued that vendors can
mislead potential users, e.g. by directing them to the most positive of vetted reference sites.
He also explained that: “lots of vendors tell you things that they think you want to hear ... you
don’t know who to trust ... and there are lots of high-profile examples of companies buying
systems that don’t work for them”. However, the company’s existing software was no longer
maintainable and had to be replaced. Two years were spent searching for an appropriate
solution before opting for a rentable system. The Managing Director explained that they
chose to rent a system rather than to purchase one outright to reduce the impact of making a
poor selection decision. He agreed that system selection was difficult but, by renting the
22

software, he was able to minimise the consequences of making a poor system selection
decision. He also suggested that SMEs can lack the in-house expertise needed to implement
an ERP system but that selecting an external implementation partner is also difficult, i.e.
system selection is not the only problem. Meanwhile – and following its recent acquisition by
another company – MA2 had been ‘forced’ to implement a particular ERP system used across
the group. The earlier survey response referred to its extreme difficulty in selecting the
previous ERP system that was now being replaced. The Operations & IT Director listed high
software prices, a limited budget and few suitable vendors as the main reasons why system
selection had been difficult.
MNA had not implemented ERP because it was considered unsuitable for the company.
Interestingly, MNA is a low-volume, high-value project-dominated company where design &
engineering is key. The company uses separate specialist software solutions to manage the
various tasks at each planning and control stage. The Managing Director stated that he would
like to improve both capacity planning & control and visibility of its suppliers, but that no
ERP vendor “had walked through the door offering a solution”. He also claimed that no
single ERP system would be able to meet their needs.
The above supports the suggestion from the survey data that the selection process is
indeed difficult. Part of this difficulty is with a lack of communication and information
available to help make the right system selection decision, meaning implementing ERP is
either not explicitly considered or is a risky decision. Company size also plays a role, as
SMEs appear to be reluctant to adopt an expensive solution that is not conclusively suitable
to their needs. Neither point is about production strategy, but this is also relevant – the case
with the highest level of customisation and lowest volume was the one where ERP had not
been implemented.
6.2 Use of ERP: Why and How do MTO Companies Use ERP?
Although MA1 and MA2 have both implemented ERP, neither makes extensive use of the
software for detailed planning. Instead, they largely use their systems to standardise
processes, integrate operations, and provide greater information visibility – which are generic
functions relevant to any business. Overall, the most important feature of ERP in both cases
is providing visibility so users can continue to plan manually. In MA1, ERP provides real-
time data on the status of jobs progressing through the factory and on material inventories.
This helps managers to react before any overload occurs on machines and to anticipate
‘dangerously low’ inventory levels for critical raw materials. But MA1’s legacy system,
which was developed in-house, also provided a list of priority orders for the next few days,
23

akin to the idea of a list of key orders for release. Its new ERP system did not have this
functionality and so custom code had to be written.
When asked why the system was hardly used for detailed planning, the Managing Director
of MA1 explained that the firm “survives on being flexible” – he was sceptical that
standardised software could be used to directly support detailed planning and control
functions in a MTO company. As an example, he explained that ERP cannot automate
customer enquiries if products are made to customer specification. He stated that “We are not
Amazon – we can’t have an online catalogue of standard products”, i.e. from which a
customer can select a product, choose a delivery date and pay. The Managing Director did,
however, think that the process standardisation that results from using ERP can be of benefit
when quoting for new business – as it makes users go through the discipline of collecting all
the information relevant to providing a quotation. But, ultimately, the lead time and price of
each order involves interaction and negotiation in-house between manufacturing and sales
and externally with the customer. Thus, sales staff – and not software – is considered key to
the firm for supporting negotiations and building relationships with customers. The Managing
Director argued that: “you cannot rely on a system to do these things – people are more
important”. Nonetheless, the system does mean that sales staff can combine their experience
and understanding of the business with up-to-date information from the system. Similarly,
detailed functionality is not used in MA2. The Operations & IT Director confirmed that
“team leaders manually schedule all our orders” when they have been confirmed at the order
entry stage. Most processes are low-skilled, so planners can simply manually redistribute
people and capacity across work centres to reflect the current mix of orders. CEM tools are
not used either, but this time because lead times are typically dictated by the customer. The
Operations & IT Director explained that: “there are no negotiations on lead time – we have to
adjust capacity accordingly”.
From the above it follows that although MA1 and MA2 have implemented an ERP system,
its use arguably goes little beyond being an integrated database. There is no overwhelming
evidence from the two adopters that there is a strong alignment between the detailed
functionality of the software and the needs of MTO companies. Neither firm is using ERP in
a very sophisticated manner to provide direct and detailed decision support. This may be
because firms either cannot or do not want to use the software for these purposes, but it could
also be that firms are unaware of how to go about doing so. Thus, communication and
training on how to make more effective use of ERP may be necessary, while MTO-specific
functionality may also be required.
24

6.3 Performance Impact: What Impact does ERP have on MTO Companies?
The Managing Director of MA1 explained that he had not seen a dramatic improvement in
performance since implementing ERP, although on-time delivery had improved from 90 to
95%. This improvement is attributed to having better information on supplier performance
and a better ‘big picture understanding’ of the company, allowing it to take a more proactive
approach to situations that may otherwise affect the company’s ability to deliver to customers
on time. The Managing Director explained that: “the system provides a helicopter view of
what is going on in the business”. It is claimed that it is this transparency and the availability
of information that has brought about improvements and not the use of detailed functionality
to support specific planning and control tasks. Similarly, MA2 claims to have received hardly
any benefits from their system at the individual planning stages (e.g. order entry).
Overall, the interviews suggested that the two adopters have received some benefits from
ERP, but that these benefits are attributed to general aspects of ERP and not to the use of
detailed and specific functionality. Implementation does not appear to have led to dramatic
improvements in performance in either company.
7. Conclusion This paper adds to the available literature on how contingency factors affect the applicability
and impact of Enterprise Resource Planning (ERP) systems. While research has investigated
factors like company size (e.g. Mabert et al., 2003) and nationality (e.g. Olhager & Selldin,
2003), production strategy has been neglected (Aslan et al., 2012). Indeed, Aslan et al.’s
(2012) literature review and research agenda called for more empirical evidence on the
applicability and impact of ERP systems on MTO companies. The most relevant recent
contribution was by Deep et al. (2008), but the authors focused on one Make-To-Order
(MTO) company only and investigated applicability without assessing impact. This paper has
studied the effect of a MTO production strategy on the applicability and impact of ERP
systems through an exploratory and explanatory survey followed by three case studies. The
primary focus has been on MTO companies, but Make-To-Stock (MTS) companies have also
been surveyed as a basis for comparison.
Our research question was: How does a MTO production strategy affect the applicability
and impact of ERP systems? The exploratory part of the survey found, for example, that
production strategy does not affect the decision to adopt ERP – as both MTS and MTO
companies have implemented ERP – but does affect the difficulty of selecting an ERP
system. MTO companies found selection more difficult on average than MTS companies.
The most outstanding reason why some firms had not implemented ERP was that it would 25

not suit the needs of the company. MTO non-adopters in particular highlighted this issue,
suggesting a perceived or actual misalignment between MTO companies and ERP
functionality.
This lack of alignment is generally supported by the results of the explanatory part of the
survey in which a series of hypotheses were tested using a theoretical framework that
included three constructs: decisions support requirements, ERP functionality, and company
performance. This built on Bendoly & Jacobs’ (2004) paper by identifying which ERP
modules and add-ons show adequate fit with which operational needs. For example, the use
of the Customer Enquiry Management (CEM) functionality of ERP was linked to
improvements in CEM performance. This was true of the data as a whole and of the MTO
data separately. Customer Relationship Management (CRM) software was also found to be
an effective solution across the whole sample. But overall, for the data as a whole, only two
of the ten models were fully supported (CEM and CRM), seven were partially supported, and
the results for one model were inconclusive (SCM). All of the partially supported models
show a significant impact on performance, but mainly without demonstrating a link between
particular functionality and improved performance. In other words, companies using ERP
that have high decision support requirements performed well without intensively using
specific corresponding tools from their system. Thus, improvements may result from general
aspects of ERP like standardisation and integration or from the process of implementation –
which involves analysing and evaluating a company’s business processes in order to fit them
to, and configure, the system – rather than from the use of specific modules or add-ons.
The follow-up cases shed light on why system selection is so difficult, and why MTO
companies only partially use the functionality of ERP systems. Although two of the three
companies had implemented ERP, the software was used as a means of centralisation and
integration – with only high-level functionality used to get an overview of the status of
company resources and processes – rather than to directly inform or automate decision
making. All three companies were MTO SMEs, where an expensive implementation failure
could have proven fatal. Evidence from the cases suggested a lack of trust in vendors and
consultants, and a lack of confidence in the fit between ERP systems and the needs of MTO
companies. As a solution, one firm had chosen to rent an ERP system, arguing that this
provided a low-risk solution. Yet the company still had to commission some custom code to
improve the fit between the software and the business’ needs. The cases generally support the
suggestion from the survey data that there is a misalignment between ERP functionality and
the needs of MTO companies. Moreover, there appears to be a gap between the expertise
required to utilise the software and that found in small MTO companies in practice. 26

In conclusion, the most relevant solutions for MTO companies are the CEM and, to a
lesser extent, CRM tools. This supports the suggestion that production strategy does indeed
affect the use of ERP. MTO companies typically have to cope with high-variety, customised
and sometimes one-off production, meaning each order must be quoted for individually; and,
MTO companies often have to track and handle a wide range of customers, made up of both
one-off and repeat purchasers. These challenges – that are particular to MTO companies –
require support from CEM and CRM functionality. Similarly, the high variety, often one-off
nature of production may also explain why the effectiveness of product configurator and
production life cycle management software could not be demonstrated.
7.1 Practical Implications
The findings have implications for ERP vendors in terms of improving the fit between their
systems and company needs, and in terms of marketing their products and raising awareness
about the detailed functionality. For example, although there are elements of ERP systems
that do work well for some MTO companies, there are others that currently do not and there
are companies of the opinion that ERP is unsuitable for their needs. Thus, software
development and communication strategies should reflect these findings. While it is noted
that vendors may not wish to make information about detailed functionality available to their
rivals, it somehow needs to be communicated to potential users.
The findings are also of relevance to managers looking to identify an appropriate planning
solution. Although some MTO companies have been able to successfully implement and use
an ERP system, managers must note the importance of the system selection process and of
having the right skills available. One strategy for reducing risk may be to adopt an on-
demand solution where the software is rented or accessed as a service.
7.2 Limitations and Future Research Implications
Three limitations to the research described in this paper are acknowledged:
1. Although comparable with some previous studies and although we have considered non-
response bias, the survey response rate was only 10.96%. This is likely to have been
caused by a combination of factors, including survey length, the quality of the database of
contacts, and the high number of surveys executives receive. There is, however, a trade-off
here: a shorter survey may have increased our response rate but it would also have reduced
the depth of our data.
2. Although we focused on statistically significant results, closely related to the above is the
issue of the number of responses, which was only 111 for the explanatory part. This
limited the number of hypotheses we were able to test decisively. 27

3. Only one survey response per organisation was obtained; as a result, it is possible that the
data reflects the opinions, biases and areas of expertise of the individual respondents. It is
argued here that this effect is minimised because most firms were small or medium sized,
but multiple responses per organisation would add reliability to the results through
triangulation. Again, increasing the number of respondents per organisation would involve
a trade-off, e.g. with the response rate and number of responses.
Future research can build on this study, including by addressing the above limitations. For
example, the study could be replicated in the UK or in other countries using an abridged
version of the questionnaire. This may allow sufficient data for the order release and
dispatching stages to also be investigated. The theoretical framework tested in this paper
could also be revised or extended. Two options for this are suggested here. First, the decision
support requirements in our framework were taken from the MTO literature; the framework
could be revised to also reflect the MTS literature. And second, we constructed the
framework to investigate the links between ERP functionality and performance at a given
planning stage, but we did not look at knock-on effects between stages. Hence, the theoretical
framework could be extended to allow this to be tested. For example, it may be interesting to
look at whether using CEM functionality for setting lead times not only improves
performance at the CEM stage but also makes post-order acceptance decisions, such as order
release, easier or more effective. Finally, future research could involve conducting research
into how more MTO-specific planning concepts could be embedded within ERP systems to
improve the alignment between ERP systems and the needs of MTO companies.
References Ahire, S., Golhar, D. and Waller, M., 1996. Development and validation of TQM implementation constructs. Decision
Sciences, 27, 23-56.
Alreck, P.L. and Settle, R.B., 1995. The Survey Research Handbook, 2nd ed. New Jersey: Irwin Homewood.
Argyropoulou, M., Ioannou, G. and Prastacos, G.P., 2007. Enterprise resource planning implementation at Small and
Medium Sized Enterprises: an initial study of the Greek market. International Journal of Integrated Supply
Management, 3 (4), 406-425.
Armstrong, J. and Overton, T., 1977. Estimating nonresponse bias in mail surveys. Journal of Marketing Research, 14
(3), 396-402.
Aslan, B., Stevenson, M., and Hendry, L.C., 2012, Enterprise resource planning systems: An assessment of
applicability to make-to-order companies, Computers in Industry, 63, 7, 692-705.
Bagozzi, R.P. and Phillips, L.W., 1982. Representing and Testing Organizational Theories: A Holistic Construal.
Administrative Science Quarterly, 27(3),459-489.
Bagozzi, R., Yi, Y. and Phillips, L., 1991. Assessing construct validity in organizational research. Administrative
Science Quarterly, 36 (3).
28

Ball, M.O., Chen, C.Y. and Zhao, Z.Y., 2004. Available to Promise. Handbook of Quantitative Supply Chain
Analysis-Modeling in the e-Business Era. Kluwer Academic Publishers, 447-480.
Bechte, W., 1988. Theory and practice of load-oriented manufacturing control. International Journal of Production
Research, 26 (3), 375 - 395.
Bendoly, E. and Jacobs, F., 2004. ERP architectural/operational alignment for order processing performance.
International Journal of Operations & Production Management, 24 (1), 99-117.
Bergamaschi, D., Cigolini, R., Perona, M. and Portioli, A., 1997. Order review and release strategies in a job shop
environment: A review and a classification. International Journal of Production Research, 35 (2), 399-420.
Bertrand, J. and Wortmann, J., 1992. Information systems for production planning and control: developments in
perspective. Production Planning and Control, 3 (3), 280-289.
Bertrand, J.W.M. and Muntslag, D.R., 1993. Production control in engineer-to-order firms. International Journal of
Production Economics, 30 (31), 3–22.
Biemer, P., Groves, R., Lyberg, L., Mathiowetz, N. and Sudman, S. eds. 1991. Measurement errors in surveys, New
York: Wiley.
Blackstone, J.H., Phillips, D.T. and Hogg, G.L., 1982. A state-of-the-art survey of dispatching rules for manufacturing
job shop operations. International Journal of Production Research, 20 (1), 27 - 45.
Błażewicz, J., Domschke, W. and Pesch, E., 1996. The job shop scheduling problem: Conventional and new solution
techniques. European Journal of Operational Research, 93 (1), 1-33.
Bollen, K.A., 1989. Structural equations with latent variables New York: Wiley.
Boyer, K.K. and Swink, M.L., 2008. Empirical Elephants--Why Multiple Methods are Essential to Quality Research
in Operations and Supply Chain Management. Journal of Operations Management, 26 (3), 338-344.
Bozarth, C., and Edwards, S., 1997. The impact of market requirements focus and manufacturing characteristics focus
on plant performance. Journal of Operations Management, 15(3), 161–180.
Bozarth, C., and McDermott, C., 1998. Configurations in manufacturing strategy: a review and directions for future
research. Journal of Operations Management, 16(4), 427–439.
Breithaupt, J.-W., Land, M. and Nyhuis, P., 2002. The workload control concept: Theory and practical extensions of
Load Oriented Order Release. Production Planning & Control, 13 (7), 625-638.
Burgess, K., Singh, P. and Koroglu, R., 2006. Supply chain management: a structured literature review and
implications for future research. International Journal of Operations & Production Management, 26 (7), 703-29.
Cakravastia, A. and Nakamura, N., 2002. Model for negotiating the price and due date for a single order with multiple
suppliers in a make-to-order environment. International Journal of Production Research, 40 (14), 3425-3440.
Campbell, D.T. and Fiske, D.W., 1959. Convergent and discriminant validation by the multitrait-multimethod matrix.
Psychological Bulletin, 56 (2), 81-105.
Cao, M., and Zhang, Q., 2011. Supply chain collaboration: Impact on collaborative advantage and firm performance.
Journal of Operations Management, 29(3), 163–180.
Carmines, E.G. and Zeller, R.A., 1979. Reliability and validity assessment Beverly Hills: Sage Publications.
Carter, C.R., Sanders, N.R. and Dong, Y., 2008. Paradigms, revolutions, and tipping points: The need for using
multiple methodologies within the field of supply chain management. Journal of Operations Management, 26 (6),
693-696.
Chen, I.J., 2001. Planning for ERP systems: analysis and future trend. Business Process Management Journal, 7 (5),
374 - 386.
Choi, T. Y., and Eboch, K., 1998. The TQM Paradox: Relations among TQM practices, plant performance, and
customer satisfaction. Journal of Operations Management, 17(1), 59–75.
29

Cohen, J.A., 1960. A coefficient of agreement for nominal scales. Educational and Psychological Measurement, 20
(1), 37-46.
Cronbach, L., 1951. Coefficient alpha and the internal structure of tests. Psychometrika, 16 (3), 297-334.
Davenport, T.H. and Brooks, J.D., 2004. Enterprise systems and the supply chain. Journal of Enterprise Information
Management, 17 (1), 8-19.
Deep, A., Guttridge, P., Dani, S. and Burns, N., 2008. Investigating factors affecting ERP selection in made-to-order
SME sector. Journal of Manufacturing Technology Management, 19 (4), 430-466.
Denzin, N., 1970. Strategies of Multiple Triangulation. The research act in sociology. New York: McGraw-Hill, 291-
307.
Dillman, D.A., 2007. Mail and Internet surveys: The tailored design method, 2nd ed. New York: Wiley.
Drazin, R., and van de Ven, A.H., 1985, Alternative forms of fit in contingency theory, Administrative Science
Quarterly, 30 (4), 514-539.
Flynn, B.B., Schroeder, R.G. and Sakakibara, S., 1994. A framework for quality management research and an
associated measurement instrument. Journal of Operations Management, 11 (4), 339-366.
Forza, C., 2009. Surveys. In Karlsson, C. ed. Researching Operations Management. London: Routledge, 84-161.
Forza, C. and Salvador, F., 2002. Product configuration and inter-firm co-ordination: An innovative solution from a
small manufacturing enterprise. Computers in Industry, 49 (1), 37-46.
Hendry, L.C. and Kingsman, B.G., 1993. Customer Enquiry Management: Part of a Hierarchical System to Control
Lead Times in Make-to-Order Companies. The Journal of the Operational Research Society, 44 (1), 61-70.
Hicks, C. and McGovern, T., 2009. Product life cycle management in engineer-to-order industries. International
Journal of Technology Management, 48 (2), 153-167.
Hvam, L., Pape, S. and Nielsen, M.K., 2006. Improving the quotation process with product configuration. Computers
in Industry, 57 (7), 607-621.
Jick, T., 1979. Mixing qualitative and quantitative methods: Triangulation in action. Administrative science quarterly,
24 (4), 602-611.
Jobber, D., 1986. Improving response rates in industrial mail surveys. Industrial Marketing Management, 15 (3), 183-
195.
Jonsson, P. and Mattsson, S.A., 2003. The implications of fit between planning environments and manufacturing
planning and control methods. International Journal of Operations & Production Management, 23 (8), 872-900.
Kingsman, B.G., 2000. Modelling input-output workload control for dynamic capacity planning in production
planning systems. International Journal of Production Economics, 68 (1), 73-93.
Kingsman, B. and Hendry, L., 2002. The relative contributions of input and output controls on the performance of a
workload control system in Make-To-Order companies. Production Planning & Control, 13 (7), 579-590.
Kingsman, B., Hendry, L., Mercer, A. and de Souza, A., 1996. Responding to customer enquiries in make-to-order
companies Problems and solutions. International Journal of Production Economics, 46/47, 219-231.
Knolmayer, G., Mertens, P. and Zeier, A., 2002. Supply Chain Management Based on SAP Systems: Order
Management in Manufacturing Companies: Springer.
Koufteros, X., Babbar, S. and Kaighobadi, M., 2009. A paradigm for examining second-order factor models
employing structural equation modeling. International Journal of Production Economics, 120 (2), 633-652.
Krause, D.R., Scannell, T.V. and Calantone, R.J., 2000. A Structural Analysis of the Effectiveness of Buying Firms'
Strategies to Improve Supplier Performance. Decision Sciences, 31 (1), 33-55.
Land, M.J. and Gaalman, G.J.C., 2009. Production planning and control in SMEs: Time for change. Production
Planning & Control, 20 (7), 548 - 558.
30

Mabert, V.A., Soni, A. and Venkataramanan, M.A., 2000. Enterprise resource planning survey of US manufacturing
firms. Production and Inventory Management Journal, 41 (2), 52-58.
Mabert, V.A., Soni, A. and Venkataramanan, M.A., 2003. The impact of organization size on enterprise resource
planning (ERP) implementations in the US manufacturing sector. Omega, 31 (3), 235-246.
Malhotra, M.K. and Grover, V., 1998. An assessment of survey research in POM: from constructs to theory. Journal
of Operations Management, 16 (4), 407-425.
Mather, H. and Plossl, G., 1978. Priority fixation versus throughput planning. Production and Inventory Management,
19, 27-51.
Menor, L.J. and Roth, A.V., 2007. New service development competence in retail banking: Construct development
and measurement validation. Journal of Operations Management, 25 (4), 825-846.
Miles, M. and Huberman, A., 1994. Qualitative data analysis: An expanded sourcebook London: SAGE publications,
Inc.
Møller, C., 2005. ERP II: a conceptual framework for next-generation enterprise systems? Journal of Enterprise
Information Management, 18 (4), 483-497.
Morabito, V., Pace, S. and Previtali, P., 2005. ERP Marketing and Italian SMEs. European Management Journal, 23
(5), 590-598.
Muscatello, J.R., Small, M.H. and Chen, I.J., 2003. Implementing enterprise resource planning (ERP) systems in
small and midsize manufacturing firms. International Journal of Operations & Production Management, 23 (8),
850-871.
Nunnally, J.C., 1978. Psychometric Theory New York: McGraw-Hill.
Nunnally, J.C. and Bernstein, I.H., 1994. Psychometric Theory New York: McGraw-Hill.
Olhager, J. and Selldin, E., 2003. Enterprise resource planning survey of Swedish manufacturing firms. European
Journal of Operational Research, 146 (2), 365-373.
Olsen, K.A. and Sætre, P., 2007. IT for niche companies: is an ERP system the solution? Information Systems
Journal, 17 (1), 37-58.
Perreault, W.D. and Leigh, L.E., 1989. Reliability of nominal data based on qualitative judgements. Journal of
Marketing Research, 26 (2), 135-148.
Robinson, J., Shaver, P. and Wrightsman, L., 1991. Criteria for scale selection and evaluation. Measures of
personality and social psychological attitudes, 1, 1-16.
Rudberg, M. and Wikner, J., 2004. Mass customization in terms of the customer order decoupling point. Production
Planning & Control, 15 (4), 445-458.
Rungtusanatham, M., 1998. Let’s not overlook content validity. Decision Line, 29 (4), 10–13.
Rust, R.T. and Cooil, B., 1994. Reliability measures for qualitative data: Theory and implications. Journal of
Marketing Research, 31 (1), 1-14.
Shah, R. and Goldstein, S.M., 2006. Use of structural equation modeling in operations management research: Looking
back and forward. Journal of Operations Management, 24 (2), 148-169.
Snider, B., da Silveira, G.J.C. and Balakrishnan, J., 2009. ERP implementation at SMEs: analysis of five Canadian
cases. International Journal of Operations & Production Management, 29 (1), 4 - 29.
Sousa, R. and Voss, C.A., 2008. Contingency research in operations management practices. Journal of Operations
Management, 26 (6), 697-713.
Stadtler, H., 2002. Supply Chain Management - An Overview. In Stadtler, H. And Kilger, C. eds. Supply Chain
Management and Advanced Planning. 2nd ed. Berlin: Springer, 7–27.
31

Stevenson, M., Hendry, L.C. and Kingsman, B.G., 2005. A review of production planning and control: the
applicability of key concepts to the make-to-order industry. International Journal of Production Research, 43 (5),
869-898.
Stevenson, M., Huang, Y., Hendry, L.C., and Soepenberg, E., 2011, The theory and practice of workload control: A
research agenda and implementation strategy, International Journal of Production Economics, 131, 689-700.
Stratman, J.K., 2001. Information Integration for Supply Chain Management: An Empirical Investigation of ERP
Systems in Manufacturing. PhD Thesis. University of North Carolina.
Stratman, J.K. and Roth, A.V., 2002. Enterprise Resource Planning (ERP) Competence Constructs: Two-Stage Multi-
Item Scale Development and Validation. Decision Sciences, 33 (4), 601-628.
Taylor, A. and Taylor, M., 2009. Operations management research: contemporary themes, trends and potential future
directions. International Journal of Operations & Production Management, 29 (12), 1316-1340.
Tenhiälä, A., 2011. Contingency theory of capacity planning: The link between process types and planning methods.
Journal of Operations Management, 29 (1-2), 65-77.
Venkatraman, N., 1989. The Concept of Fit in Strategy Research: Toward Verbal and Statistical Correspondence. The
Academy of Management Review, 14 (3), 423-444.
Venkatraman, N. and Grant, J.H., 1986. Construct Measurement in Organizational Strategy Research: A Critique and
Proposal. The Academy of Management Review, 11 (1), 71-87.
Voss, C., 2009. Case Research in Operations Management. In Karlsson, C. ed. Researching Operations Management.
London: Routledge, 162-195.
Wight, O., 1970. Input/output control a real handle on lead time. Production and Inventory Management, 11 (3), 9-31.
Wisner, J.D., 1995. A review of the order release policy research. International Journal of Operations and Production
Management, 15 (6), 25-40.
Wortmann, H., 1995. Comparison of information systems for engineer-to-order and make-to-stock situations.
Computers in Industry, 26 (3), 261-271.
Xiong, M.H., Tor, S.B., Bhatnagar, R., Khoo, L.P. and Venkat, S., 2006. A DSS approach to managing customer
enquiries for SMEs at the customer enquiry stage. International Journal of Production Economics, 103 (1), 332-
346.
Yin, R.K., 2009. Case Study Research: Design and Methods, 4 ed. London: Sage Publications Inc.
Zorzini, M., Hendry, L., Stevenson, M. and Pozzetti, A., 2008. Customer Enquiry Management and Product
Customization: An Empirical Multi-Case Study Analysis in the Capital Goods Sector. International Journal of
Operations & Production Management, 28 (12), 1186-1218.
32

List of Figures Figures
Figure 1: General Theoretical Framework
Figure 2: Comparison of Reasons to Adopt an ERP System – MTO vs. MTS Companies
Figure 3: Comparison of Adopted ERP Modules – MTO vs. MTS Companies
Figure 4: Comparison of Adopted ERP Add-ons – MTO vs. MTS Companies
Figure 5: Results for the Theoretical Framework – CEM Functionality at the CEM Stage
33

Figure 1: General Theoretical Framework
A14a: to lower costs; A14b: to simplify & standardise business processes; A14c: to integrate operations, systems or data; A14d: replace legacy systems; A14e: adoption linked to global activities; A14f: to improve e-commerce activities; A14g: to improve production planning effectiveness; A14h: to support change/innovation; A14i: to keep up with the competition; A14j: adoption encouraged (or enforced) by key customers; A14k: other.
Figure 2: Comparison of Reasons to Adopt an ERP System – MTO vs. MTS Companies
1.00
2.00
3.00
4.00
5.00
6.00
7.00
A14a A14b A14c A14d A14e A14f A14g A14h A14i A14j A14k
Reasons to adopt an ERP system
MTO
MTS
1. Decision Support Requirements
2. Use of ERP functionality & add-ons
3. Improved
Performance
Ha
Hc
Hb
34

Figure 3: Comparison of Adopted ERP Modules – MTO vs. MTS Companies
Figure 4: Comparison of Adopted ERP Add-ons – MTO vs. MTS Companies
0%2%4%6%8%
10%12%14%
Modules Adopted
MTO
MTS
0%
5%
10%
15%
20%
25%
30%
CAD CRM APS SCM ProdConfig.
PLM Other
Add-ons Adopted
MTO
MTS
35

Figure 5: Results for the Theoretical Framework – CEM Functionality at the CEM Stage
Use of ERP
Decision Support
Performance
R1 = 0.370*
R3= 0.691***
R2 = 0.374***
ζ1 = 0.137
ζ2 = 0.809
USE = 0.370 (DSR) + ζ1 Error Variance = 0.137, R2 = 0.863
PERF = 0.691 (DSR) + 0.375 (USE) + ζ2 Error Variance = 0.809, R2 = 0.191
36
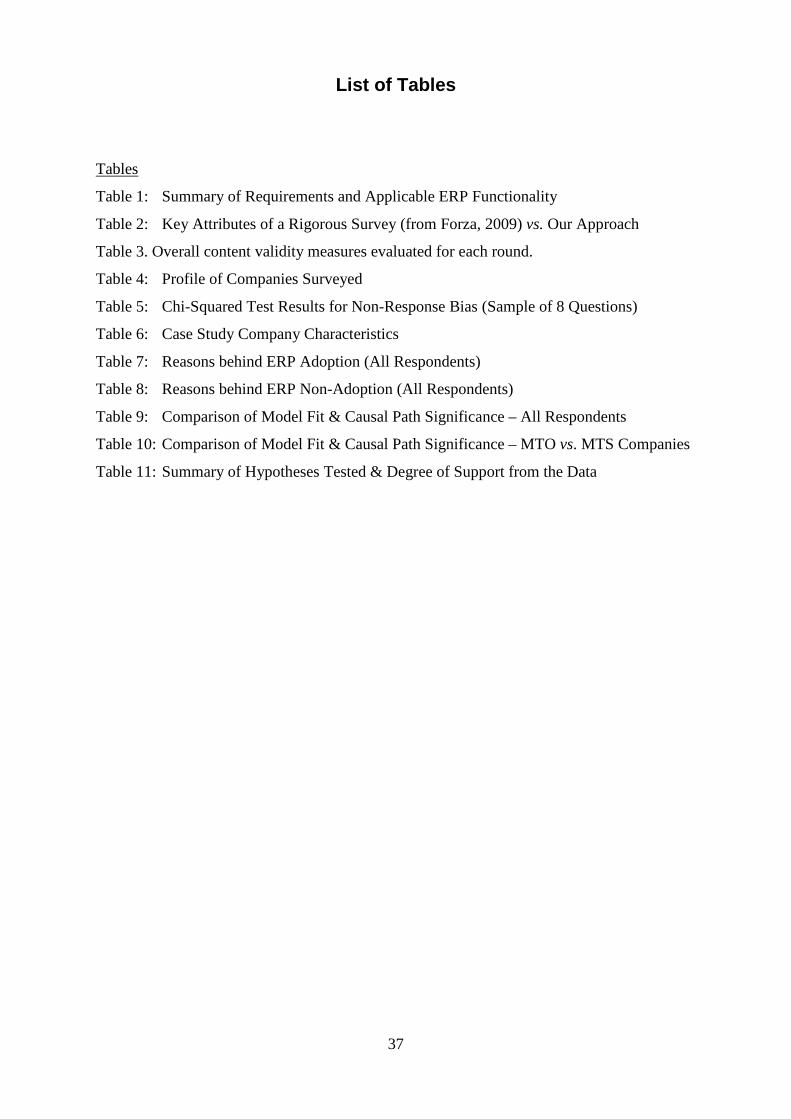
List of Tables
Tables
Table 1: Summary of Requirements and Applicable ERP Functionality
Table 2: Key Attributes of a Rigorous Survey (from Forza, 2009) vs. Our Approach
Table 3. Overall content validity measures evaluated for each round.
Table 4: Profile of Companies Surveyed
Table 5: Chi-Squared Test Results for Non-Response Bias (Sample of 8 Questions)
Table 6: Case Study Company Characteristics
Table 7: Reasons behind ERP Adoption (All Respondents)
Table 8: Reasons behind ERP Non-Adoption (All Respondents)
Table 9: Comparison of Model Fit & Causal Path Significance – All Respondents
Table 10: Comparison of Model Fit & Causal Path Significance – MTO vs. MTS Companies
Table 11: Summary of Hypotheses Tested & Degree of Support from the Data
37

Table 1: Summary of Requirements and Applicable ERP Functionalities and Add-ons
Requirements ERP Functionality Customer Enquiry Management (CEM, e.g. mechanisms for generating alternative due dates and prices)
Customer Enquiry Management (CEM) functionality of core ERP system Available-to-Promise (ATP) functionality of core ERP system Capable-to-Promise (CTP) functionality of core ERP system Product Lifecycle Management (PLM) add-on
Design and Engineering (D&E, e.g. to document the design and specification of products during the order processing cycle)
Product Configurator (PC) add-on Product Lifecycle Management (PLM) add-on
Order Entry (OE, e.g. for detailed capacity planning and possible due date renegotiations of confirmed orders)
Material Requirements Planning (MRP) functionality of core ERP system Advanced Planning and Scheduling (APS) add-on
Order Release (OR, e.g. to decide when to start production)
Order Release functionality of core ERP system, where available
Shop Floor Dispatching (e.g. for shop floor scheduling and sequencing in job shops)
Material Requirements Planning (MRP) functionality of core ERP system Advanced Planning and Scheduling (APS) add-on
Customer Relationship Management (CRM, e.g. to retain and develop customer relationships or cope with a changing customer base)
Customer Relationship Management (CRM) add-on
Supply Chain Management (SCM, e.g. for responsive rush order handling)
Supply Chain Management (SCM) add-on
38

Table 2: Key Attributes of a Rigorous Survey (from Forza, 2009) vs. Our Approach
‘Ideal’ Survey Attributes (Forza, 2009) Responses (Our Approach)
Prio
r Unit of analysis (UoA) clearly defined Company as the UoA when only one plant; where there are multiple plants, UoA refers to the plant at which the respondent is based.
Operational definitions clearly stated The constructs (decision support requirements, use of ERP functionality, and performance) and their dimensions were structured following a theoretical assessment. The variables were all defined and operationalized.
Def
inin
g sa
mpl
e
Sample frame defined and justified Sample composed of all UK manufacturers; no particular industry targeted. Random sampling used from the sample frame
Stratified random sampling was performed for industry, company size and respondent profile; ERP adoption and production strategy could not be assessed prior to survey response.
Minimum required sample size estimated Study suffices the number required (>52) for exploratory analysis for a sufficient power (>0.8). Number of responses large enough to allow first order structural modelling in the explanatory analysis.
Inst
rum
ent
Existing validated measures adapted Exploratory analysis comprised of existing pre-validated items, but the items in the explanatory part are particular to this research.
Need for objective & perceptual questions All variables have been perceptually measured. To reduce subjectivity, multi-item measurement was used where possible. Instrumentation consistently reflects UoA The instrument items are prepared for answering by high level managers to reflect the unit of analysis. Compatibility of scales for measuring Exploratory part has open-ended, rank, multiple-choice & Likert scales; explanatory part has only 7-point Likert scales.
Respondents chosen are appropriate High level managers are chosen to improve the likelihood of getting meaningful information and to decrease random or even bias error.
Multi-item variables used Multi-item variables were created in the questionnaire where appropriate due to the use of perceptual questions.
Dat
a
Satisfactory response rate Techniques for better response rates resulted in an adjusted response rate of over 10%. Non-response bias estimated No significant difference observed on comparing the characteristics of the respondents in the first and subsequent waves. Inconsistent and uncertain data cleaned Missing/uncertain/inconsistent responses were cleaned and marked accordingly. Necessity of any treatments of data Missing data (<3%) has been coded using SPSS in the exploratory, and using AMOS, in the exploratory parts.
Met
rics
qua
lity Content (or face) validity assessed Assessed by academics and practitioners using the manual sort method in 3 rounds which resulted in a high estimate.
Field-based pretesting of measures A pilot study was conducted in advance of the full-scale survey to improve measurement capability and wording. Reliability assessed Reliability estimated by measures, including Cronbach’s alpha; all measures indicated the instrument’s adequacy. Construct validity assessed Discriminant, convergent and criterion-related validities assessed; models refined and simplified accordingly. Confirmatory methods (e.g. Structural Equation Modelling & Principal FA) used
Structured Equation Modelling (SEM) technique applied in the explanatory part of the study. Principal Factor Analysis (PFA) also applied to help assess reliability and construct validity.
Anal
ysis
Appropriateness of tests for hypothesis testing
The suitability of univariate & bivariate tests (descriptive & group-wise comparisons), and multivariate tests found to be adequate.
Adequacy of tests for the available data Goodness of fit tests for explanatory part and t-test and one-way ANOVA for the exploratory part were found to be adequate. Test assumptions satisfied Non-parametric tests applied when parametric test assumptions violated (e.g. normality).
Inte
rp. Internal validity of findings The significance of causal links amongst the constructs has been interpreted for internal validity.
Acceptability of inferences While the acceptability of inferences is high in the exploratory findings, SEM of particular stages may need further evidence. Applicability to other populations Theoretical framework may be applicable to different realities, e.g. the manufacturing sector in countries other than the UK.

Table 3. Overall content validity measures evaluated for each round.
Round 1 (3 judges, 127 items)
Round 2 (4 judges, 102 items)
Round 3 (3 judges, 89 items)
The Percentage of agreement 75.3% 65.5% 76.0%
Cohen’s Kappa (κ) 0.74 0.64 0.75 Perreault & Leigh’s reliability index (Ir)
0.86 0.78 0.86
Proportional Reduction in Loss (PRL)
~0.97
(�̂� = 0.74)
~0.91
�̂� = 0.66)
~0.98
(�̂� = 0.76)
Table 4: Profile of Companies Surveyed
Number of Employees %
Annual Turnover % Production Strategy % Supply Chain
Position %
1-10 1 Turnover<£2m 14 MTO 47.6 OEM 44 11-50 37 £2m≤Turnover<£10m 41 Tier 1 19 51-250 40 £10m≤Turnover<£50m 22 MTS 52.4 Tier 2 25 251-500 17 £50m≤Turnover<£100m 18 Raw Mat. Supplier 7 501-1000 2 £100m≤Turnover<£250m 2
Total 100 Other 5
>1000 3 £250m≤Turnover 3 Total 100 Total 100 Total 100
1

Table 5: Chi-Squared Test Results for Non-Response Bias (Sample of 8 Questions)
Exploratory Survey Question Chi-Square
Degrees of Freedom
Asymptotic Significance
Number of Employees 5.48 5 .360 Sales Turnover 7.38 5 .194 Production Strategy 2.27 5 .811 Shop Floor Routing 4.85 4 .303 Supply Chain Position 4.32 4 .364 ERP Efforts 4.17 4 .383 Industrial Sector 8.25 10 .604 Adopted ERP Modules 7.32 10 .695
Table 6: Case Study Company Characteristics
Company Interviewees Description No. of Employees Turnover Product Range Notes on ERP Adoption
MTO ERP Adopter 1:
MA1
Managing Director; Manufacturing Manager; IT Coordinator & Purchasing Manager
Textile manufacturer, e.g. laundry and filtration products for woven and non-woven fabrics
24 £1.8m
Approx. 1,000 different products per year; 500 new products per year
Implemented a single commercial ERP system in 2007; previously using an in-house built legacy system that could no longer be maintained.
MTO ERP Adopter 2:
MA2
Operations & IT Director
Lighting specialist, e.g. LED and retail store lighting solutions
96 £13.5m
Approx. 30 product families; builds around 1,000 product variants; some repeat business
Longstanding user of an ERP solution, but the company has recently been bought out and is now implementing the single ERP solution used by the parent company.
MTO ERP Non-
Adopter: MNA
Managing Director
Capital goods firm, e.g. providing condition monitoring equipment to assess steel produced in casting machines
40 £17m
Largely one-off products; little repeatability; low-volume production
Uses a variety of software packages across the business; no integrated ERP solution is in use.
2

Table 7: Reasons behind ERP Adoption (All Respondents)
Reasons n Mean Std. Dev. Median Mode
To simplify and standardise business processes 70 5.77 1.12 6 6 To replace legacy systems (old hardware/software) 71 5.75 1.51 6 7 To integrate enterprise operations. systems, or data 70 5.44 1.33 6 6 To improve production planning effectiveness 70 5.41 1.6 6 7 To keep up with competitive forces in the industry 68 4.85 1.55 5 5 To cope with increased workload/business 52 4.62 1.71 5 5 To lower costs 70 4.46 1.63 4 4 To support change/innovation in the company 67 4.34 1.74 4 4 Linked to global activities (support glob.strategy) 69 3.23 2.03 3 1 To improve e-commerce activities 68 3.16 1.75 3 1 Adoption encouraged (or enforced) by key customers 67 2.43 1.49 2 1
Table 8: Reasons behind ERP Non-Adoption (All Respondents)
Reasons n Mean Std. Dev. Median Mode
ERP would not suit the needs of the company 37 5.84 1.66 7 7 Cost of the consultancy for selection, implementation, etc 33 4.76 2.05 5 7 Cost of the software solution itself 33 4.58 1.97 5 5 Risk of implementation failure 34 4.47 1.94 4 4 Current economic climate 34 4.38 2.2 5 7 Cost of the training for employees 33 4.27 1.86 5 5 Cost of the hardware upgrades required 33 4.24 1.94 4 4
3

Table 9: Comparison of Model Fit & Causal Path Significance – All Respondents
χ2 (df) p CFI RMSEA (1) DSR → Use (2) Use → Perf. (3) DSR → Perf. Est. S.E.a C.R.b Est. S.E.a C.R.b Est. S.E.a C.R.b
CEM 14.41 (12) 0.28 0.98 0.07 0.37* 0.17 2.42 -0.37*** 0.10 3.66 -0.69*** -0.14 -5.33 CEM-ATP 12.64 (12) 0.40 0.99 0.03 -0.02 0.27 0.10 -0.26** -0.06 -2.58 -0.83*** -0.14 -6.28 CEM-CTP 11.42 (12) 0.49 1.00 0.00 -0.14 0.26 0.89 -0.18 -0.07 -1.72 -0.82*** -0.15 -5.74 CEM-PLM 20.43 (12) 0.06 0.94 0.12 -0.02 0.21 -0.01 -0.05 -0.09 -0.48 -0.83*** -0.15 -5.91 D&E-PC 13.29 (12) 0.35 0.99 0.05 -0.15 0.26 0.92 -0.03 -0.11 -0.21 -0.42* -0.19 -2.40 D&E-PLM 26.86 (12) 0.01 0.86 0.16 -0.24 0.24 1.37 -0.11 -0.14 -0.57 -0.44* -0.21 -2.21 OE-MRP 14.52 (11) 0.21 0.98 0.08 -0.19 0.15 1.13 -0.69*** -0.33 -4.21 -0.16 -0.21 -1.38 OE-APS 11.81 (7) 0.11 0.96 0.14 -0.07 0.42 0.37 -0.62*** -0.12 -4.94 -0.11 -0.30 -0.77 CRM 3.87 (7) 0.80 1.00 0.00 -0.55*** 0.19 3.31 -0.34* -0.14 -2.38 -0.50** -0.19 -2.78 SCM 24.06 (11) 0.01 0.87 0.17 -0.63 1.46 1.33 -0.47 -0.33 -1.62 -0.42 -1.20 -1.22 a S.E. is an estimate of the standard error of the covariance. b C.R. is the critical ratio obtained by dividing the covariance estimate by its standard error. * Significant at 0.05 level (critical value = 1.96); ** significant at 0.01 level (critical value = 2.58); *** significant at 0.001 level (critical value = 3.29).
4

Table 10: Comparison of Model Fit & Causal Path Significance – MTO vs. MTS Companies
χ2 (df) p CFI RMSEA
(1) DSR → Use (2) Use → Perf. (3) DSR → Perf. Est. S.E.a C.R.b Est. S.E.a C.R.b Est. S.E.a C.R.b
CEM MTO 15.433 (12) 0.22 0.96 0.11 -0.54* 0.33 -2.55 -0.44** 0.16 -3.08 -0.59*** 0.31 -3.31 MTS 28.964 (12) 0.00 0.76 0.27 -0.24 0.19 -1.06 -0.08 0.21 -0.27 -0.85* 0.22 -2.48
CEM-ATP MTO 13.702 (12) 0.32 0.97 0.74 -0.56* 0.49 -2.35 -0.07 0.17 -0.32 -0.96** 0.47 -3.19 MTS 34.375 (12) 0.00 0.72 0.31 -0.24 0.44 -0.90 -0.28 0.08 -1.68 -0.92** 0.22 -3.22
CEM-CTP MTO 11.799 (12) 0.46 1.00 0.00 -0.57** 0.40 -2.70 -0.11 0.17 -0.52 -0.98*** 0.42 -3.52 MTS 25.325 (12) 0.01 0.80 0.24 -0.07 0.41 -0.28 -0.14 0.06 -0.88 -0.88*** 0.16 -3.85
CEM-PLM MTO 17.657 (12) 0.13 0.91 0.14 -0.29 0.47 -1.17 -0.31 0.16 -1.75 -0.99*** 0.45 -3.67 MTS 21.666 (12) 0.04 0.86 0.20 -0.19 0.26 -0.80 -0.34* 0.09 -2.55 -0.91*** 0.13 -4.96
D&E-PC MTO 19.801 (12) 0.07 0.91 0.16 -0.28 0.38 -1.26 -0.18 0.14 -0.95 -0.46 0.33 -1.73 MTS 7.548 (12) 0.82 1.00 0.00 -0.15 0.69 -0.82 -0.07 0.09 -0.81 -0.30 0.70 -1.67
D&E-PLM MTO 17.002 (12) 0.15 0.94 0.13 -0.31 0.37 -1.40 -0.24 0.19 -0.77 -0.23 0.34 -0.64 MTS 17.102 (12) 0.15 0.86 0.14 -0.29 0.57 -1.43 -0.07 0.13 -0.66 -0.37* 0.58 -1.99
OE- MRP MTO 12.529 (11) 0.33 0.99 0.07 -0.38 0.18 -1.61 -0.69*** 0.36 -3.52 -0.50*** 0.19 -3.63 MTS - - - - - - - - - - - - -
OE- APS MTO 5.514 (7) 0.60 1.00 0.00 -0.07 0.45 -0.24 -0.55** 0.20 -2.98 --0.17 0.36 -0.78 MTS 10.304 (7) 0.17 0.93 0.17 -0.18 0.99 -0.63 -0.82*** 0.14 -4.73 -0.12 0.62 -0.56
CRM MTO 8.297 (7) 0.31 0.98 0.10 -0.65* 0.39 -2.43 -0.30 0.25 -1.20 -0.61 0.47 -1.85 MTS 29.261 (7) 0.00 0.76 0.41 0.59 0.23 2.49 0.12 0.23 0.48 0.59* 0.25 2.22
a S.E. is an estimate of the standard error of the covariance. b C.R. is the critical ratio obtained by dividing the covariance estimate by its standard error. * Significant at the 0.05 level (critical value = 1.96); **significant at the 0.01 level (c.v. = 2.58); ***significant at the 0.001 level (c.v. = 3.29).
5

Table 11: Summary of Hypotheses Tested & Degree of Support from the Data
Model Hypotheses All Data MTO Data MTS Data
CEM
H1a: The level of decision support requirements has a positive impact on the intensity of use of ERP’s CEM functionality. H1b: The intensity of use of ERP’s CEM functionality has a positive impact on performance at the CEM stage. H1c: The level of decision support requirements has a positive impact on performance at the CEM stage.
Supported Supported Supported
Supported Supported Supported
Data misfit Data misfit Data misfit
CEM-ATP
H1d: The level of decision support requirements has a positive impact on the intensity of use of ERP’s ATP functionality. H1e: The intensity of use of ERP’s ATP functionality has a positive impact on performance at the CEM stage. H1f: The level of decision support requirements has a positive impact on performance at the CEM stage.
Not Supported Supported Supported
Supported Not Supported Supported
Data misfit Data misfit Data misfit
CEM-CTP
H1g: The level of decision support requirements has a positive impact on the intensity of use of ERP’s CTP functionality. H1h: The intensity of use of ERP’s CTP functionality has a positive impact on performance at the CEM stage. H1i: The level of decision support requirements has a positive impact on performance at the CEM stage.
Not Supported Not Supported Supported
Supported Not Supported Supported
Data misfit Data misfit Data misfit
CEM-PLM
H1j: The level of decision support requirements has a positive impact on the intensity of use of ERP’s PLM functionality. H1k: The intensity of use of ERP’s PLM functionality has a positive impact on performance at the CEM stage. H1l: The level of decision support requirements has a positive impact on performance at the CEM stage.
Not Supported Not Supported Supported
Not Supported Supported Supported
Data misfit Data misfit Data misfit
D&E-PC
H2a: The level of decision support requirements has a positive impact on the intensity of use of the product configurator add-on. H2b: The intensity of use of the product configurator add-on has a positive impact on performance at the design & engineering stage. H2c: The level of decision support requirements has a positive impact on performance at the design & engineering stage.
Not Supported Not Supported Supported
Not Supported Not Supported Not Supported
Not Supported Not Supported Not Supported
D&E-PLM
H2d: The level of decision support requirements has a positive impact on the intensity of use of the PLM add-on. H2e: The intensity of use of the PLM add-on has a positive impact on performance at the design & engineering stage. H2f: The level of decision support requirements has a positive impact on performance at the design &
Data misfit Data misfit Data misfit
Not Supported Not Supported Not
Not Supported Not Supported Supported
6

engineering stage. Supported
OE-MRP
H3a: The level of decision support requirements has a positive impact on the intensity of use of ERP’s MRP functionality. H3b: The intensity of use of ERP’s MRP functionality has a positive impact on performance at the order entry stage. H3c: The level of decision support requirements has a positive impact on performance at the order entry stage.
Not Supported Supported Not Supported
Not Supported Supported Supported(-)
Data misfit Data misfit Data misfit
OE-APS
H3d: The level of decision support requirements has a positive impact on the intensity of use of the APS add-on. H3e: The intensity of use of the APS add-on has a positive impact on performance at the order entry stage. H3f: The level of decision support requirements has a positive impact on performance at the order entry stage.
Not Supported Supported Not Supported
Not Supported Supported Not Supported
Not Supported Supported Not Supported
CRM
H4a: The level of decision support requirements has a positive impact on the intensity of use of the CRM add-on. H4b: The intensity of use of the CRM add-on has a positive impact on customer relationship management performance. H4c: The level of decision support requirements has a positive impact on managing customer relationships.
Supported Supported Supported
Supported Not Supported Not Supported
Data misfit Data misfit Data misfit
SCM
H5a: The level of decision support requirements has a positive impact on the intensity of use of the SCM add-on. H5b: The intensity of use of the SCM add-on has a positive impact on supply chain performance. H5c: The level of decision support requirements has a positive impact on supply chain performance.
Data misfit Data misfit Data misfit
Data misfit Data misfit Data misfit
Not Supported Supported Not Supported
7

Appendix A Survey of the Effectiveness of ERP Systems for UK Manufacturing This survey is part of an ongoing research project being conducted by the Supply Chain Management and Modelling research group at Lancaster University Management School. The research seeks to understand how effectively Enterprise Resource Planning (ERP) systems are able to meet the decision support requirements of manufacturing companies in the UK. We are interested in learning from the opinions of adopters and non-adopters of ERP systems.
Please answer all relevant questions. If you wish to comment on any question or qualify a response in any way, please use the comment box at the end of this questionnaire. Your comments may help us to better understand your responses. We guarantee that your individual responses will be kept strictly confidential. Only aggregated data will be reported. No names, identifiable company data or comments will appear in any reports that result from this study. If you would find it more convenient to complete this survey online, please go to http://erpuk.questionpro.com/.
This survey is divided into four sections (A to D) and should take 30 to 40 minutes to complete. All respondents who provide contact details will be entered into a PRIZE DRAW and receive a copy of the study's executive summary of results which you can use to evaluate your company’s decision making practices and use of information systems relative to others in your industry.
Thank you very much for participating in this research project.
Bulut Aslan, Dr Mark Stevenson & Prof. Linda Hendry
Department of Management Science Lancaster University Management School
LA1 4YX, Lancaster Phone: 0 1524 593450
Email: [email protected]
SECTION A: Background Information (& ERP Environment) This section focuses on background information about your company. For those companies that have implemented, are implementing or intend to implement an ERP system, there are also some questions about the implementation process in your company.
1. Your position in the company: ___________________
2. Number of employees: a. 1 - 10 people b. 11- 50 people c. 51 - 250 people d. More than 250 people
3. Sales turnover last year: a. Less than £2m b. At least £2m but less than £10m c. At least £10m but less than £50m d. At least £50m
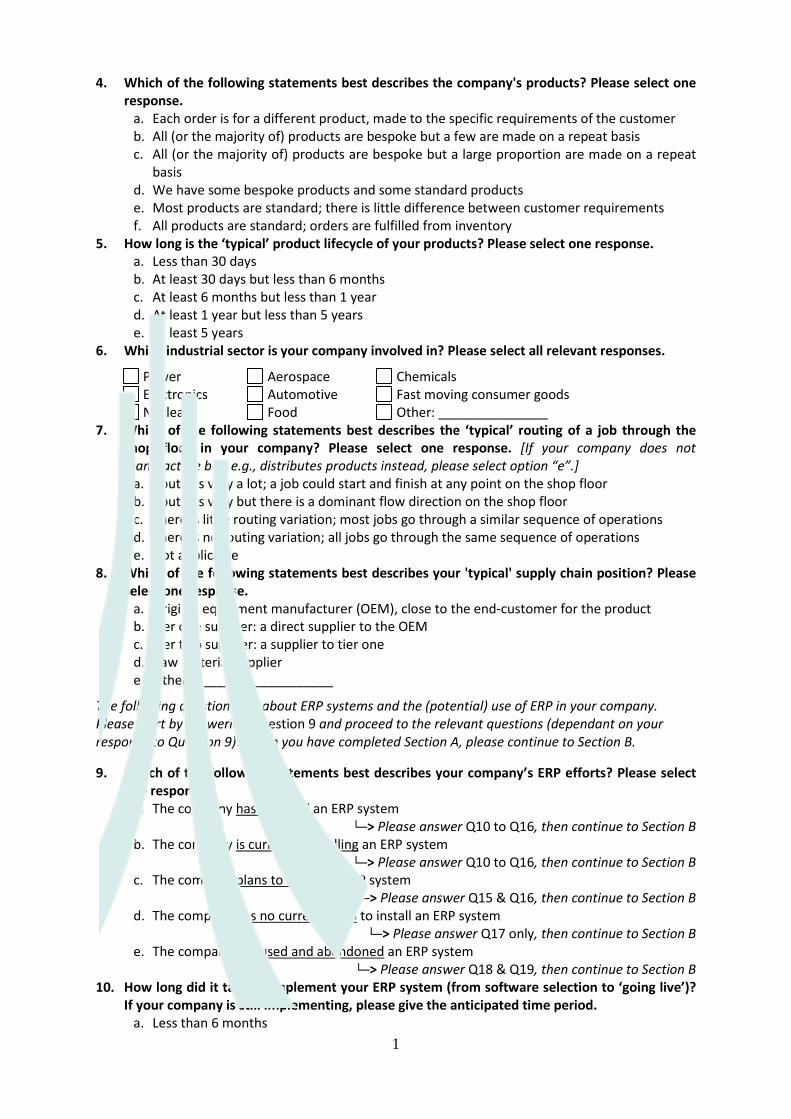
4. Which of the following statements best describes the company's products? Please select one response.
a. Each order is for a different product, made to the specific requirements of the customer b. All (or the majority of) products are bespoke but a few are made on a repeat basis c. All (or the majority of) products are bespoke but a large proportion are made on a repeat
basis d. We have some bespoke products and some standard products e. Most products are standard; there is little difference between customer requirements f. All products are standard; orders are fulfilled from inventory
5. How long is the ‘typical’ product lifecycle of your products? Please select one response. a. Less than 30 days b. At least 30 days but less than 6 months c. At least 6 months but less than 1 year d. At least 1 year but less than 5 years e. At least 5 years
6. Which industrial sector is your company involved in? Please select all relevant responses.
Power Aerospace Chemicals Electronics Automotive Fast moving consumer goods Nuclear Food Other: _______________
7. Which of the following statements best describes the ‘typical’ routing of a job through the shop floor in your company? Please select one response. [If your company does not manufacture but, e.g., distributes products instead, please select option “e”.]
a. Routings vary a lot; a job could start and finish at any point on the shop floor b. Routings vary but there is a dominant flow direction on the shop floor c. There is little routing variation; most jobs go through a similar sequence of operations d. There is no routing variation; all jobs go through the same sequence of operations e. Not applicable
8. Which of the following statements best describes your 'typical' supply chain position? Please select one response.
a. Original equipment manufacturer (OEM), close to the end-customer for the product b. Tier one supplier: a direct supplier to the OEM c. Tier two supplier: a supplier to tier one d. Raw material supplier e. Other: ___________________
The following questions are about ERP systems and the (potential) use of ERP in your company. Please start by answering Question 9 and proceed to the relevant questions (dependant on your response to Question 9). When you have completed Section A, please continue to Section B.
9. Which of the following statements best describes your company’s ERP efforts? Please select one response.
a. The company has installed an ERP system └─> Please answer Q10 to Q16, then continue to Section B
b. The company is currently installing an ERP system └─> Please answer Q10 to Q16, then continue to Section B
c. The company plans to install an ERP system └─> Please answer Q15 & Q16, then continue to Section B
d. The company has no current plans to install an ERP system └─> Please answer Q17 only, then continue to Section B
e. The company has used and abandoned an ERP system └─> Please answer Q18 & Q19, then continue to Section B
10. How long did it take to implement your ERP system (from software selection to ‘going live’)? If your company is still implementing, please give the anticipated time period.
a. Less than 6 months 1

b. At least 6 months but less than 1 year c. At least 1 year but less than 2 years d. At least 2 years but less than 4 years e. At least 4 years
11. Which of the following statements best describes your ERP installation? Please select one response.
a. Installation of a single ERP package (i.e., from a single ERP vendor) b. Single ERP package but with other bespoke software added on (e.g., built in-house) c. Best-of-breed installation using elements of several ERP packages (from several vendors) d. Several ERP packages but with other bespoke software added on (e.g., built in-house) e. In-house developed ERP system (bespoke, totally developed in-house) f. Other: _________________
12. Which of the following strategies best describes your approach to ERP implementation? Please put one tick in each column, indicating your initial plan and the approach actually taken.
Initial plan
Actual approach
a. Big bang (single ‘go live’ date for all modules) [ ] [ ] b. Mini big bang (single ‘go live’ date for a subset of modules) [ ] [ ] c. Phased-in by module (modules with different ‘go live’ dates) [ ] [ ] d. Phased-in by location (locations with different ‘go live’ dates) [ ] [ ] e. Phased-in by (other, please specify):_______________ [ ] [ ]
13. Which of the following business processes are currently supported by tools within your ERP system? Answering this question is a three stage process: first, select the processes supported by ERP modules; second, rank the modules selected in terms of their importance to your company; finally, indicate the required degree of module customisation, i.e., changes that had to be made to the code of the package.
1) Please tick the processes supported by your ERP system.
2) Please rank the importance of the modules selected to your company
3) Please indicate the degree of customisation.
None Minor Significant Major
Financial Accounting _____ ͏ ͏ ͏ ͏ Financial Control _____ ͏ ͏ ͏ ͏ Order Entry _____ ͏ ͏ ͏ ͏ E-commerce _____ ͏ ͏ ͏ ͏ Production Planning _____ ͏ ͏ ͏ ͏ Purchasing and Logistics _____ ͏ ͏ ͏ ͏ Materials Management _____ ͏ ͏ ͏ ͏ Quality Management _____ ͏ ͏ ͏ ͏ Sales and Delivery _____ ͏ ͏ ͏ ͏ HR Management _____ ͏ ͏ ͏ ͏ R&D Management _____ ͏ ͏ ͏ ͏ Other: ______________ _____ ͏ ͏ ͏ ͏
14. Which of the following add-ons are currently used alongside your ERP system? Answering this question is a three stage process: first, select the software added on to your ERP system; second, rank the software selected in terms of their importance to your company; finally, indicate the required degree of software customisation, i.e., changes that had to be made to the code of the package.
1) Please tick the software added on to your ERP system.
2) Please rank the importance of the add-ons selected to your company
3) Please indicate the degree of customisation.
None Minor Significant Major
2

Advanced Planning and Scheduling _____ ͏ ͏ ͏ ͏ Customer Relationship Management _____ ͏ ͏ ͏ ͏ Supply Chain Management _____ ͏ ͏ ͏ ͏ Product Lifecycle (or Data)
Management _____ ͏ ͏ ͏ ͏
Product Configurator _____ ͏ ͏ ͏ ͏ CAD System _____ ͏ ͏ ͏ ͏ Other: ______________ _____ ͏ ͏ ͏ ͏ Other: ______________ _____ ͏ ͏ ͏ ͏ Other: ______________ _____ ͏ ͏ ͏ ͏ Other: ______________ _____ ͏ ͏ ͏ ͏
15. Which vendor provided, or will provide, the ERP software for your company? Please select all relevant responses.
SAP Oracle SSA Global QAD Mfg/Pro Exel EFACS Intentia Movex Avanté (Epicor) MTMS (Made2Manage Systems) Other: _____________
16. What are the reasons why ERP was, or will be, adopted in the company? Please indicate your level of agreement from 1 (strongly disagree) to 7 (strongly agree) with each of the following reasons.
Strongly Disagree
Strongly Agree
a. To lower costs 1 2 3 4 5 6 7
b. To simplify and standardise business processes 1 2 3 4 5 6 7
c. To integrate enterprise operations. systems, or data 1 2 3 4 5 6 7
d. To replace legacy systems (old hardware/software) 1 2 3 4 5 6 7
e. Linked to global activities (support globalisation strategy) 1 2 3 4 5 6 7
f. To improve e-commerce (e-procurement & marketing) activities 1 2 3 4 5 6 7
g. To improve production planning effectiveness 1 2 3 4 5 6 7
h. To support change/innovation in the company 1 2 3 4 5 6 7
i. To keep up with competitive forces in the industry 1 2 3 4 5 6 7
j. Adoption encouraged (or enforced) by key customers 1 2 3 4 5 6 7
k. Other: _________________ 1 2 3 4 5 6 7
17. What are the reasons behind NOT adopting ERP in the near future? Please indicate your level of agreement from 1 (strongly disagree) to 7 (strongly agree) with each of the following reasons. Strongly
Disagree Strongly
Agree a. Cost of the software solution itself 1 2 3 4 5 6 7
b. Cost of the consultancy for selection, implementation, etc 1 2 3 4 5 6 7
c. Cost of the training for employees 1 2 3 4 5 6 7
d. Cost of the hardware upgrades required 1 2 3 4 5 6 7
e. Risk of implementation failure 1 2 3 4 5 6 7
f. ERP would not suit the needs of the company 1 2 3 4 5 6 7
g. Current economic climate 1 2 3 4 5 6 7
h. Other: _________________ 1 2 3 4 5 6 7
18. Approximately how long did your company use an ERP system before abandoning it? a. Less than 6 months b. At least 6 months but less than 1 year c. At least 1 year but less than 2 years d. At least 2 years but less than 4 years e. At least 4 years
3

19. What were the reasons why the ERP system was abandoned? Please indicate your level of agreement from 1 (strongly disagree) to 7 (strongly agree) with each of the following reasons. Strongly
Disagree Strongly
Agree a. Significant financial loss due to underestimating implementation costs 1 2 3 4 5 6 7 b. Insufficient payback after adoption 1 2 3 4 5 6 7 c. The system was unable to meet the needs of our business 1 2 3 4 5 6 7 d. High cost of maintenance and training 1 2 3 4 5 6 7 e. Lack of personnel capable of using the system 1 2 3 4 5 6 7 f. The system was gradually neglected over time 1 2 3 4 5 6 7 g. The system was too complex for our company’s organisational structure 1 2 3 4 5 6 7 h. The system failed to improve the effectiveness of our planning
processes 1 2 3 4 5 6 7
i. The system failed to improve the efficiency of our transactions 1 2 3 4 5 6 7 j. Other: _________________ 1 2 3 4 5 6 7
<End of Section A, Please continue to Section B>
SECTION B: Decision Support Requirements This section focuses on the decision support requirements of manufacturing companies. The first five groups of statements presented (B1 to B5) focus on the decision support requirements at critical planning stages in a manufacturing company, as illustrated in the figure below. The last two groups of statements (B6 and B7) focus on your company’s decision support requirements for customer relationship management and supply chain management respectively.
Please indicate your level of agreement with the statements by circling the relevant number from 1 (strongly disagree) to 7 (strongly agree). If a statement is not applicable to your company, please circle the “n/a” option.
B1. Customer Enquiry Stage Decision Support Requirements Strongly Disagree
Strongly Agree
We need to be aware of capacity and our use of manufacturing resources in order to set realistic due dates
1 2 3 4 5 6 7 n/a
We need to access historical data on similar previous orders when setting due dates 1 2 3 4 5 6 7 n/a We need to consider alternative due dates when negotiating with customers 1 2 3 4 5 6 7 n/a We need to be aware of the availability of subcontractors and suppliers when promising due dates to customers
1 2 3 4 5 6 7 n/a
We need to perform a detailed analysis of costs when responding to a request for quotation
1 2 3 4 5 6 7 n/a
We need to access data on previous similar orders when estimating costs and setting profit margins
1 2 3 4 5 6 7 n/a
Determining what price to quote is influenced by a wide range of factors, from our company’s desire to increase profitability to the status of our relationship with a customer
1 2 3 4 5 6 7 n/a
We require a high degree of coordination among departments when responding to customer enquiries
1 2 3 4 5 6 7 n/a
The sales and manufacturing departments have to communicate with each other when we are responding to quotations
1 2 3 4 5 6 7 n/a
4

There has to be a high degree of coordination between our company and our suppliers when we are responding to quotations
1 2 3 4 5 6 7 n/a
B2. Design and Engineering Decision Support Requirements We require access to an archive of product information on previous similar orders to support the design and engineering task for confirmed orders
1 2 3 4 5 6 7 n/a
Maintaining a record of historical product data is essential if our design and engineering department is to handle our most complicated products and components
1 2 3 4 5 6 7 n/a
We need a high level of coordination between departments to support design and engineering tasks
1 2 3 4 5 6 7 n/a
The design and engineering department must be coordinated with the sales and manufacturing departments, especially for customised or bespoke products
1 2 3 4 5 6 7 n/a
Design and engineering tasks require a high level of coordination between our company and our customers
1 2 3 4 5 6 7 n/a
To support the design and engineering process efficiently, we need systems that are compatible with those used by our customers and/or suppliers
1 2 3 4 5 6 7 n/a
We need systems that are able to accommodate frequent product design changes at any stage of the process
1 2 3 4 5 6 7 n/a
B3. Order Entry Stage Decision Support Requirements Strongly Disagree
Strongly Agree
If there is a long delay between making a quotation and it being confirmed by the customer, we must reconsider cost estimates and capacity availability
1 2 3 4 5 6 7 n/a
We require a planning system which does not rely on us entering complete product information (for planning or any other purposes)
1 2 3 4 5 6 7 n/a
When we are planning capacity for confirmed orders, we need to consider the potential effect of current unconfirmed tenders on capacity availability
1 2 3 4 5 6 7 n/a
When we are performing detailed planning, we require software support to enable us to employ finite loading (i.e., so that we only allocate work to a work centre that is below or equal to a set capacity limit)
1 2 3 4 5 6 7 n/a
Short-term capacity planning is important to us because our main capacity constraint (or bottleneck) changes over time
1 2 3 4 5 6 7 n/a
B4. Order Review and Release Decision Support Requirements
We have a decision point after planning but before manufacturing commences at which we determine which jobs to “release” (i.e., begin manufacturing)
1 2 3 4 5 6 7 n/a
We require software support to help us prioritise the release of planned orders onto the shop floor appropriately
1 2 3 4 5 6 7 n/a
B5. Shop Floor Sequencing Decision Support Requirements
Shop floor supervisors can easily cope with sequencing tasks on the shop floor without software support
1 2 3 4 5 6 7 n/a
We generally employ simple mechanisms for sequencing (e.g., first-in-first-out), either performed manually by our shop floor supervisor or through our software system
1 2 3 4 5 6 7 n/a
B6. CRM Decision Support Requirements
We require a database to help us manage our relationships with existing and potential customers
1 2 3 4 5 6 7 n/a
To maintain and develop our relationships with customers, we need to use several means of communication (e.g., direct face-to-face contact, email, telephone, etc)
1 2 3 4 5 6 7 n/a
We aim to entice first-time (or one-off) customers into longer and more robust relationships
1 2 3 4 5 6 7 n/a
One of our targets is to have more loyal customers and to build prolonged customer 1 2 3 4 5 6 7 n/a
5

relationships based on trust
B7. SCM Decision Support Requirements
Information sharing is essential for coordination between our company and our customers
1 2 3 4 5 6 7 n/a
It is very important that we are able to respond quickly to urgent orders from our customers
1 2 3 4 5 6 7 n/a
We require an effective communication platform so that we are in close contact with our customers and are able to manage any urgent (rush) orders
1 2 3 4 5 6 7 n/a
Procurement costs are a major part of our total product costs and are of high importance to us
1 2 3 4 5 6 7 n/a
We require software support to reduce the time and cost of procurement and the time involved when negotiating with suppliers
1 2 3 4 5 6 7 n/a
A software system that is compatible with external systems and/or platforms (e.g., of our customers and/or suppliers) would provide a significant advantage to our company
1 2 3 4 5 6 7 n/a
<End of Section B>
SECTION C: ERP Features and Extensions This section focuses on the functionality of ERP systems and extensions to ERP systems, e.g., for Advanced Planning and Scheduling (APS), and asks about the extent to which this functionality is used within your company. If your company uses an ERP system: please answer this section and then continue to Section D. If your company does not use an ERP system (including those that are currently installing ERP): the questionnaire finishes here - thank you once again for your valuable contribution to our research.
C1. Customer Enquiry Management via ERP Strongly Disagree
Strongly Agree
ERP integrates and coordinates several departments in our company to support customer enquiry management tasks
1 2 3 4 5 6 7 n/a
We use our ERP to automate the entering of order details at the customer enquiry stage 1 2 3 4 5 6 7 n/a We use our ERP system to store and retrieve historical data (e.g., on previous similar orders) to support due date and pricing estimations
1 2 3 4 5 6 7 n/a
We use the Available-to-Promise (ATP) functionality in our ERP system or in our Advanced Planning and Scheduling (APS) system when determining due dates
1 2 3 4 5 6 7 n/a
We use the Capable-to-Promise (CTP) functionality in our ERP system or in our APS system when determining due dates
1 2 3 4 5 6 7 n/a
We use Product Lifecycle Management (PLM) software (also known as “Product Data Management” (PDM) software) to support price estimations at the customer enquiry stage
1 2 3 4 5 6 7 n/a
C2. Design and Engineering via ERP We use a product configurator application (or “variant generator”) within our ERP system to support design and engineering tasks
1 2 3 4 5 6 7 n/a
We use PLM software to support design and engineering tasks 1 2 3 4 5 6 7 n/a
C3. Planning for Order Entry via ERP
We use the MRP functionality of our ERP system during production planning 1 2 3 4 5 6 7 n/a We use our ERP for mid-term and short-term planning tasks (e.g., to adapt capacity) 1 2 3 4 5 6 7 n/a We use an APS for mid-term and short-term planning tasks (e.g., to adapt capacity) 1 2 3 4 5 6 7 n/a
6

C4. Planning at the Order Review and Release Stage via ERP We use the functionality of our ERP system after planning but before manufacturing commences to determine which jobs to “release” (i.e., begin manufacturing)
1 2 3 4 5 6 7 n/a
We use the functionality of our APS system to determine which jobs to “release” (i.e., begin manufacturing)
1 2 3 4 5 6 7 n/a
C5. Planning at the Shop Floor Sequencing Stage via ERP We use the functionality of our core ERP system to support sequencing decisions on the shop floor
1 2 3 4 5 6 7 n/a
We use the functionality of our APS system to support sequencing decisions on the shop floor 1 2 3 4 5 6 7 n/a
C6. Developing Customer Relationships via CRM Software We use our Customer Relationship Management (CRM) software to help us improve relationships with existing customers
1 2 3 4 5 6 7 n/a
We use our CRM to assess potential and existing customers, e.g., profitability loyalty 1 2 3 4 5 6 7 n/a We use the analysis tools of our CRM system to support the development of strategies for improving our relationships with customers
1 2 3 4 5 6 7 n/a
C7. Supply Chain Management via ERP and SCM Systems Our ERP system provides the foundations for Supply Chain Management (SCM) software applications
1 2 3 4 5 6 7 n/a
We use SCM software applications to coordinate our supply chains 1 2 3 4 5 6 7 n/a
<End of Section C>
SECTION D: Performance Measurement This final section focuses on performance measurement and asks you to describe the effect that the implementation of an ERP system has had on your company.
D1. Improved Customer Enquiry Management Performance
Since we began to use an ERP system: Strongly Disagree
Strongly Agree
More realistic (achievable) due dates have been quoted (promised) to customers 1 2 3 4 5 6 7 n/a The time required to produce a quotation has been reduced 1 2 3 4 5 6 7 n/a Our on-time delivery performance has improved 1 2 3 4 5 6 7 n/a Our procedures at the customer enquiry stage have become more defined and standardised
1 2 3 4 5 6 7 n/a
The proportion of quotations that become firm orders has been improved 1 2 3 4 5 6 7 n/a The profitability of our products has increased (we have improved how we determine prices & due dates)
1 2 3 4 5 6 7 n/a
D2. Improved Design and Engineering Performance Through the use of our ERP system: We are better able to meet customer order specifications 1 2 3 4 5 6 7 n/a Our ability to satisfy customers when products are customised or bespoke has improved 1 2 3 4 5 6 7 n/a Product development activities are more efficiently performed (e.g., similarities between new and past orders is more easily detected, reducing duplicated effort)
1 2 3 4 5 6 7 n/a
We can automate previously time consuming and manual documentation tasks 1 2 3 4 5 6 7 n/a
D3. Improved Planning Performance Through the use of: The MRP module within our ERP system, we have improved our adherence to due dates 1 2 3 4 5 6 7 n/a Our ERP system, lead times have been shortened 1 2 3 4 5 6 7 n/a Our ERP system, we are able to be more proactive and anticipate unexpected scenarios 1 2 3 4 5 6 7 n/a
7
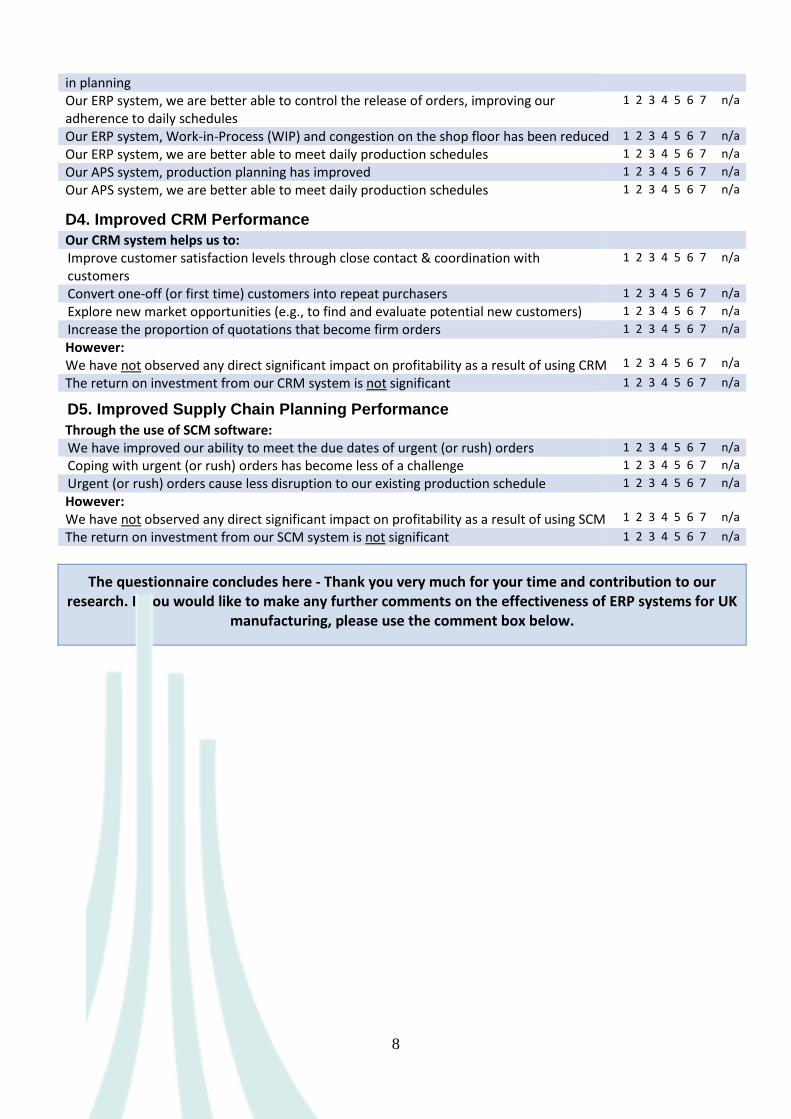
in planning Our ERP system, we are better able to control the release of orders, improving our adherence to daily schedules
1 2 3 4 5 6 7 n/a
Our ERP system, Work-in-Process (WIP) and congestion on the shop floor has been reduced 1 2 3 4 5 6 7 n/a Our ERP system, we are better able to meet daily production schedules 1 2 3 4 5 6 7 n/a Our APS system, production planning has improved 1 2 3 4 5 6 7 n/a Our APS system, we are better able to meet daily production schedules 1 2 3 4 5 6 7 n/a
D4. Improved CRM Performance Our CRM system helps us to: Improve customer satisfaction levels through close contact & coordination with customers
1 2 3 4 5 6 7 n/a
Convert one-off (or first time) customers into repeat purchasers 1 2 3 4 5 6 7 n/a Explore new market opportunities (e.g., to find and evaluate potential new customers) 1 2 3 4 5 6 7 n/a Increase the proportion of quotations that become firm orders 1 2 3 4 5 6 7 n/a However: We have not observed any direct significant impact on profitability as a result of using CRM
1 2 3 4 5 6 7 n/a
The return on investment from our CRM system is not significant 1 2 3 4 5 6 7 n/a
D5. Improved Supply Chain Planning Performance Through the use of SCM software: We have improved our ability to meet the due dates of urgent (or rush) orders 1 2 3 4 5 6 7 n/a Coping with urgent (or rush) orders has become less of a challenge 1 2 3 4 5 6 7 n/a Urgent (or rush) orders cause less disruption to our existing production schedule 1 2 3 4 5 6 7 n/a However: We have not observed any direct significant impact on profitability as a result of using SCM
1 2 3 4 5 6 7 n/a
The return on investment from our SCM system is not significant 1 2 3 4 5 6 7 n/a
The questionnaire concludes here - Thank you very much for your time and contribution to our research. If you would like to make any further comments on the effectiveness of ERP systems for UK
manufacturing, please use the comment box below.
8

Comments:
Contact Details (optional) Please provide your contact details below if you would like to be entered into a PRIZE DRAW and receive a copy of the study’s executive study. Furthermore, after the survey, we plan to continue the project by studying individual cases - if you are interested in participating in the second stage of the work, please indicate this below.
I would like to enter the prize draw and receive a copy of the study’s executive summary.
I would be interested in participating in the second stage of the research – the study of individual cases. Name : __________________________
Company : __________________________
Address : __________________________
__________________________
__________________________
9

Appendix B: Interview Protocol for non-adopter
Section 1: Background Information Basic Company Details • Can you confirm how many people work for the company? • What is the annual turnover of the company? • What industries is the company involved in? • Who are the company’s major customers? • Who are the company’s main competitors? Basic Job Information • Can you give some examples of typical products the company makes? • Are most products made from the same materials? Do you stock materials? • Are there any common components? • What proportion of orders are new, and what proportion are repeat jobs? • How much of production is make-to-stock? Section 2: “Why?” Questions on NON-ADOPTION • Why do you think that ERP is not suitable to your needs?
o What made you think that? Evaluation analysis results? Your insight? Experience of managers/directors with other systems in other firms?
• Have you considered using packages other than ERP? • If not using any software, how do you cope with managing the information flow, managing
project-based jobs or planning production in your company? Section 3: “How?” and “What?” Questions on DAY-to-DAY production Customer Enquiries • Please describe how you deal with requests for quotations (customer enquiries).
o How do you determine prices & set due dates? Due date:
o How do you generate alternative due dates when dealing with customer enquiries? o To what extent are you aware of the availability of subcontractors and suppliers when
promising due dates to customers? o Why do you think access to historical data is not that important on quoting due dates?
Cost: o How detailed is your analysis of costs when responding to a request for quotation?
Which tools do you use for this? o How do you maintain a good communication amongst departments when responding to
customer enquiries? • Have you considered using packages other than ERP for Customer Enquiry Management (CEM)
planning? o If yes, how did this enable you to cope with CEM planning? & What effects have these
had on performance? o If no, why not?
10

• Can you confirm what the strike rate (percentage of quotations converted into confirmed orders) of your company is?
• What functionality would help you improve your strike rate?
Design and Engineering [Reported quite high decision support requirements in the survey for the design & engineering of your products.] • Which software do you use for the design & engineering of your products? • How flexible is your design and engineering software for handling your product diversity? • How do you maintain the communication amongst departments to support design and
engineering tasks?
Production Planning (for you or your associated manufacturing companies) • How do you currently plan and schedule your production? [e.g., MS Excel, other]
o At which particular production planning stage has your current planning method been most effective?
• Have you considered using packages other than ERP for production planning? o If yes, how did this enable you to cope with planning? o If no, why not?
• Do you have a decision point after planning but before manufacturing commences at which you determine which jobs to “release” (i.e., begin manufacturing)?
o If yes, how do you deal with it? Do you get software support for this? o If no, do you think you may need such a decision point?
• Do you need complex tools to deal with shop floor sequencing?
Customer Relationship Management (CRM) & Supply Chain Management (SCM)
• Why do you not need a tool to help you manage your relationships with existing and potential customers? [CRM]
o Do you think CRM software would help you entice first-time or one-off customers into longer & more robust relationships? have more loyal customers and to build prolonged customer relationships based
on trust? o What do you currently do to ensure these kinds of relationships?
• How do you share information with your suppliers; and otherwise co-ordinate your activities with theirs? [SCM]
11


![ON THE GENERALIZED DRAZIN INVERSE AND GENERALIZED …nasport.pmf.ni.ac.rs/publikacije/7/ROSE1.pdf · The Drazin inverse is investigated in the matrix theory [2, 3, 17, 26, 27], in](https://img.pdfslide.us/doc/110x75/5f6460212813764a924bb37c/on-the-generalized-drazin-inverse-and-generalized-the-drazin-inverse-is-investigated.jpg)