Embed Size (px)
Citation preview
The APPLES Blossom: Abbott Preschool Program Longitudinal Effects Study
(APPLES) Preliminary Results through 2nd Grade
Interim Report
June, 2009
Ellen Frede, Ph.D. Kwanghee Jung, Ph.D.
W. Steven Barnett, Ph.D. Alexandra Figueras, M.S.
National Institute for Early Education Research
Graduate School of Education, Rutgers, The State University
The research reported in this document was conducted under a Memorandum of Agreement with the New Jersey Department of Education (NJ DOE) and with partial funding from The Pew Charitable Trusts. The conclusions are those of the authors and do not necessarily represent the views of the funding agencies.
1
Acknowledgements
The research reported in this document was conducted under a Memorandum of
Agreement with the New Jersey Department of Education (NJ DOE) and with partial
funding from The Pew Charitable Trusts. The conclusions are those of the authors and
do not necessarily represent the views of the NJ DOE or the Trusts.
The authors wish to acknowledge the support and assistance of Dr. Ellen Wolock
and Dr. Jacqueline Jones of the Division of Early Childhood Education, NJ DOE for
comments on an earlier draft. In addition, we thank the children, parents, teachers,
supervisors and administrators in New Jersey’s Abbott districts who have graciously
assisted us in this critical data collection and analysis. Without their assistance the
research could not have been conducted.
2
Introduction
This study investigates the persistence of educational effects of state funded
prekindergarten education for children at ages three and four in New Jersey’s Abbott
districts through second grade. The program providing that education was developed in
response to the landmark New Jersey Supreme Court school-funding case, Abbott v.
Burke. In the 1999-2000 school year, 3- and 4- year old children in the highest poverty
districts in the state began to enroll in a new high-quality preschool education program.
This program has been designed to prepare them to enter school with the knowledge and
skills necessary to meet the New Jersey Preschool Teaching and Learning Expectations:
Standards of Quality (NJ Department of Education, 2004b) and the Kindergarten New
Jersey Core Curriculum Content Standards (NJDOE, 2004a). Through a Department of
Education (DOE) and Department of Human Services (DHS) partnership, Abbott
preschool classrooms combine a DOE-funded six-hour, 180-day component with a DHS-
funded wrap-around program that provides daily before- and after-care and summer
programs. In total, the full-day, full-year program is available up to 10 hours per day,
245 days a year.
Enrollment in the Abbott preschool program has increased dramatically since its
inception in 1999. During the 2008-2009 school year, the tenth year of Abbott preschool
implementation, the 31 Abbott districts served over 43,000 3- and 4-year-old children in
preschool – about 80 percent of the population. The preschool program is delivered by a
mixed public-private delivery system overseen by the public schools. Private child care
providers and Head Start agencies contract with local boards of education to serve about
3
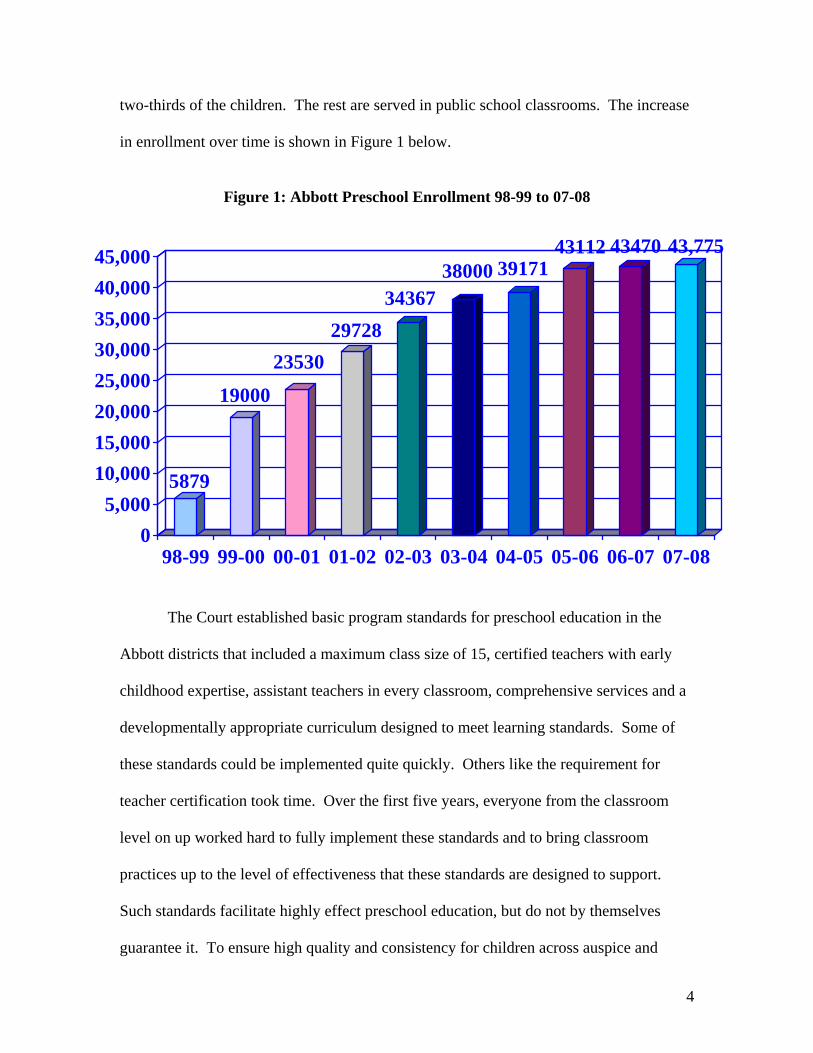
two-thirds of the children. The rest are served in public school classrooms. The increase
in enrollment over time is shown in Figure 1 below.
Figure 1: Abbott Preschool Enrollment 98-99 to 07-08
5879
19000
23530
29728
3436738000 39171
43112 43470 43,775
0
5,000
10,000
15,000
20,000
25,000
30,000
35,000
40,000
45,000
98-99 99-00 00-01 01-02 02-03 03-04 04-05 05-06 06-07 07-08
The Court established basic program standards for preschool education in the
Abbott districts that included a maximum class size of 15, certified teachers with early
childhood expertise, assistant teachers in every classroom, comprehensive services and a
developmentally appropriate curriculum designed to meet learning standards. Some of
these standards could be implemented quite quickly. Others like the requirement for
teacher certification took time. Over the first five years, everyone from the classroom
level on up worked hard to fully implement these standards and to bring classroom
practices up to the level of effectiveness that these standards are designed to support.
Such standards facilitate highly effect preschool education, but do not by themselves
guarantee it. To ensure high quality and consistency for children across auspice and
4
district and to assist administrators and staff who may have been inadequately prepared in
early childhood education, more detailed operational standards were developed (Abbott
Preschool Program Implementation Guidelines; Office of Early Childhood Education,
NJDOE, 2002, revised 2005). These standards were also designed to ensure that the
particular needs of children in each community were addressed. The Abbott preschool
program is not designed to be simply a “cookie cutter” approach that is identical in every
community.
Observation data on preschool classroom quality have been systematically
collected in the Abbott districts since the 1999-2000 school year. Results have been
reported periodically since (Barnett, Tarr, Lamy, & Frede, 2002; Frede et al, 2004; Lamy
et al, 2005). Classroom quality rose steadily each year and, by the 2004-2005 school
year, classroom quality scores had reached acceptable levels, and children were entering
kindergarten with language and literacy skills closer to the national average than in prior
years (Frede, et al, 2004; Lamy, et al, 2005). Therefore, this evaluation was launched to
more precisely estimate the learning gains from the Abbott prekindergarten program
including the extent to which gains persist into elementary school.
Classroom quality has continued to improve in the Abbott districts since 2004-05
due to local and state efforts. Figure 2 reports quality scores from the first year together
with scores from 2007-08 on one indicator, the ECERS-R. The ECERS-R is the most
widely used observational measure of preschool program practice and it correlates highly
with other measures that are commonly used (for more information on the ECERS-R and
other measured used to assess quality of the Abbott preschools see Frede et al., 2007). In
2007-08, the average Abbott classroom scored better than “good” (a score of 5) and most
5
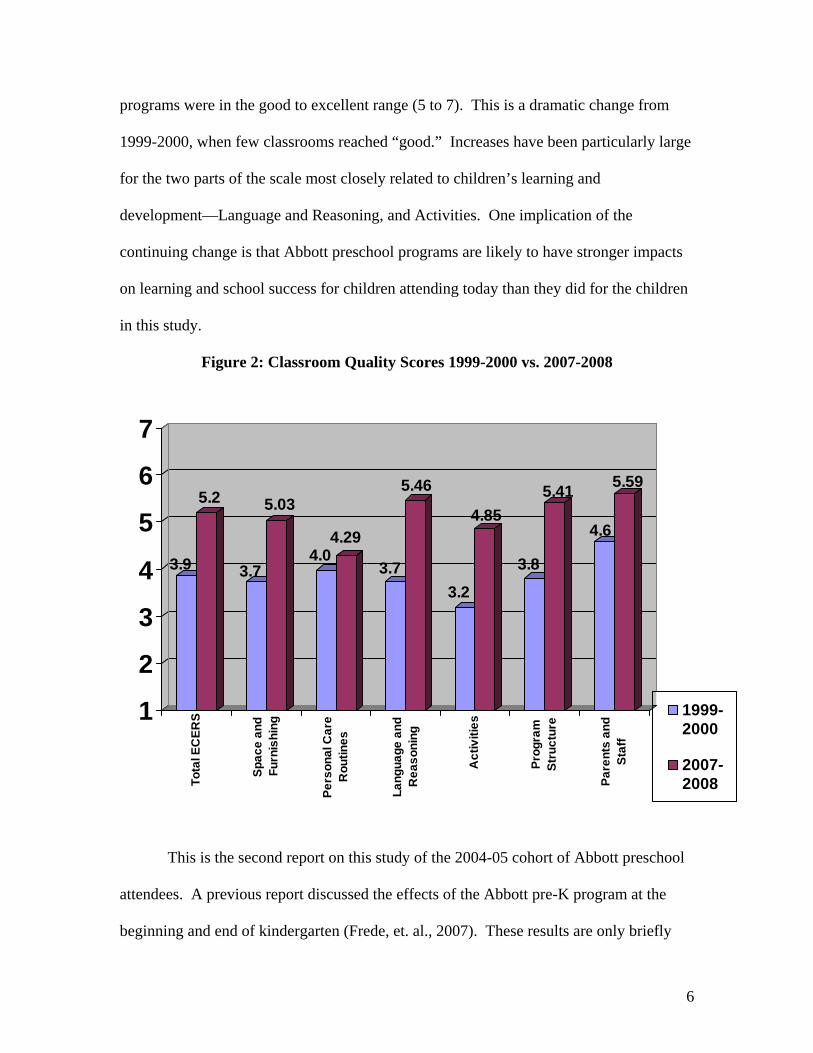
programs were in the good to excellent range (5 to 7). This is a dramatic change from
1999-2000, when few classrooms reached “good.” Increases have been particularly large
for the two parts of the scale most closely related to children’s learning and
development—Language and Reasoning, and Activities. One implication of the
continuing change is that Abbott preschool programs are likely to have stronger impacts
on learning and school success for children attending today than they did for the children
in this study.
Figure 2: Classroom Quality Scores 1999-2000 vs. 2007-2008
3.9
5.2
3.7
5.03
4.04.29
3.7
5.46
3.2
4.85
3.8
5.41
4.6
5.59
1
2
3
4
5
6
7
To
tal E
CE
RS
Sp
ac
e a
nd
Fu
rnis
hin
g
Pe
rso
na
l Ca
reR
ou
tin
es
La
ng
ua
ge
an
dR
ea
so
nin
g
Ac
tiv
itie
s
Pro
gra
mS
tru
ctu
re
Pa
ren
ts a
nd
Sta
ff
1999-2000
2007-2008
This is the second report on this study of the 2004-05 cohort of Abbott preschool
attendees. A previous report discussed the effects of the Abbott pre-K program at the
beginning and end of kindergarten (Frede, et. al., 2007). These results are only briefly
6
reviewed here to provide context for findings of the present report. For detailed
information on the methodology and findings the reader should consult the earlier report.
Previous Results
In the fall of 2005, we implemented a two-step research process to estimate the
long-term effects of attendance in an Abbott preschool classroom. The first step was to
implement a Regression Discontinuity Design (RDD) to estimate the effects of the
program on children’s abilities at kindergarten entry (Trochim, 1984). This approach
relies on the fact that eligibility for Abbott pre-K within a designated school district is
determined by date of birth alone. This assignment rule allows us to construct two
groups, one entering kindergarten that has already attended the program at age 4 and one
entering preschool that has not yet attended at age 4. These groups are unlikely to differ
with respect to measured or unmeasured child and family characteristics so that the RDD
minimizes the potential effects of selection bias which occurs when the effects of
differences between the two groups of children are confounded with program effects
(Cook, 2008).
The RDD approach can be viewed as similar to a randomized trial for children
near the age cutoff. The RDD creates groups that at the margin differ only in that some
were born a few days before the age cutoff and others a few days after the cutoff. When
these children are about to turn 5 years old the slightly younger children will enter the
preschool program and the slightly older children will enter kindergarten having already
attended the preschool program. By testing all of the children at that time, we obtain an
unbiased estimate of the preschool program’s effect under reasonable assumptions. Of
course, it is quite limiting to analyze data only for children with birthdays only a few
7
days on either side of the age cutoff. Alternatively, the RDD can be viewed as modeling
the relationship between an assignment variable (age) and measures of children’s
learning and development. The pre-cutoff sample is used to model the relationship prior
to treatment. The post-cutoff sample is used to model the relationship after the treatment.
This approach can be applied to wider age ranges around the cutoff. However, its validity
depends on correctly modeling the relationship.
Unfortunately, the RDD approach cannot provide an estimate of effects beyond
kindergarten entry. We employed a second design to obtain estimates beyond
kindergarten entry—comparing children who attended pre-K to a conventional no-
treatment comparison group identified at kindergarten entry. We then assessed the
accuracy of estimates obtained from this second approach at kindergarten entry by
comparing them to the RDD estimates. If the initial estimates from both analyses are
similar, then we can have confidence in the longitudinal results. To the extent that they
differ, we have an indication of the likely direction and magnitude of bias in the
longitudinal estimates.
For the second design we drew an additional comparison sample of kindergarten
children who did not attend the Abbott preschool program. We obtained a sample at
kindergarten entry of 1,038 children in 15 districts. Of these, 284 did not attend the
Abbott pre-K program, 451 attended for 1 year, and 303 attended for two years. As some
children attended Abbott preschool for one year at age 4 and others attended preschool
for two years at ages 3 and 4, we are able to separately estimate the effects of one year
and two years of preschool attendance using this second design. The study has limited
ability to adjust for any incidental differences between the groups or to assess their
8
comparability (except by way of the RDD). However, this is less of a problem than it
might be because the communities in our study are fairly homogeneous; all are larger,
low-income urban school districts in a single state. In addition, we have ensured that the
treatment and comparison samples are balanced with respect to district, and we control
for district in the analyses.
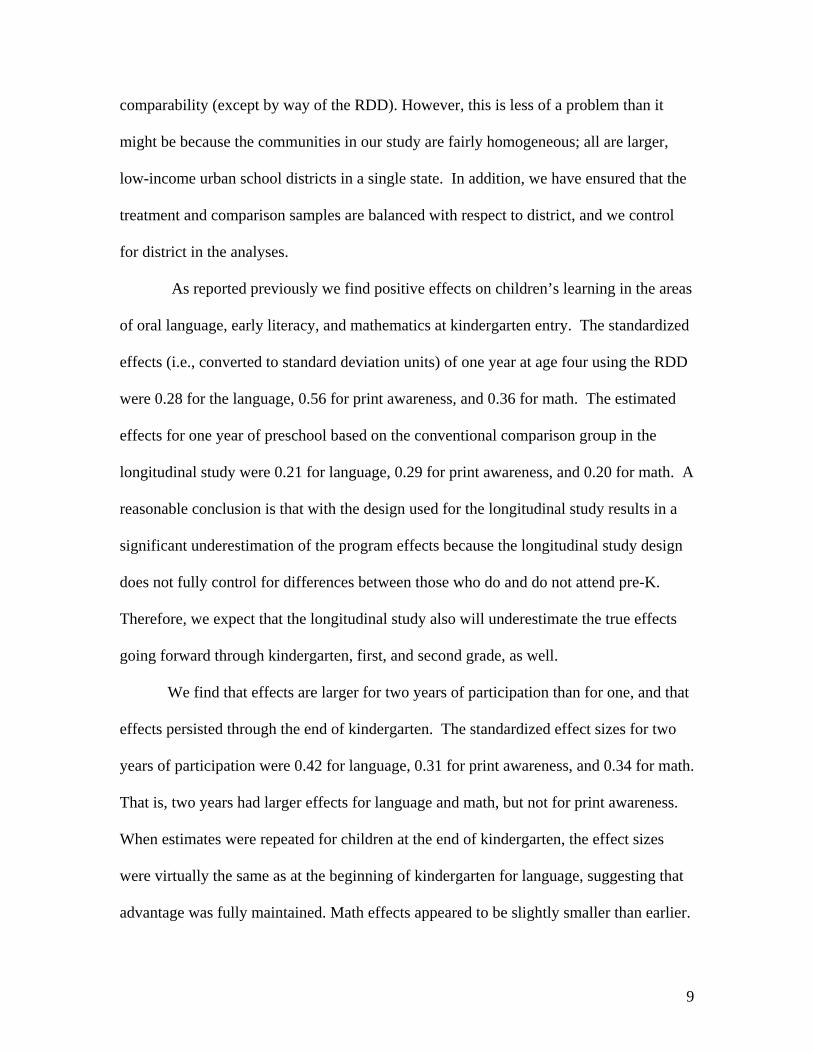
As reported previously we find positive effects on children’s learning in the areas
of oral language, early literacy, and mathematics at kindergarten entry. The standardized
effects (i.e., converted to standard deviation units) of one year at age four using the RDD
were 0.28 for the language, 0.56 for print awareness, and 0.36 for math. The estimated
effects for one year of preschool based on the conventional comparison group in the
longitudinal study were 0.21 for language, 0.29 for print awareness, and 0.20 for math. A
reasonable conclusion is that with the design used for the longitudinal study results in a
significant underestimation of the program effects because the longitudinal study design
does not fully control for differences between those who do and do not attend pre-K.
Therefore, we expect that the longitudinal study also will underestimate the true effects
going forward through kindergarten, first, and second grade, as well.
We find that effects are larger for two years of participation than for one, and that
effects persisted through the end of kindergarten. The standardized effect sizes for two
years of participation were 0.42 for language, 0.31 for print awareness, and 0.34 for math.
That is, two years had larger effects for language and math, but not for print awareness.
When estimates were repeated for children at the end of kindergarten, the effect sizes
were virtually the same as at the beginning of kindergarten for language, suggesting that
advantage was fully maintained. Math effects appeared to be slightly smaller than earlier.
9
The print awareness measure was no longer useful at the end of kindergarten as most
children have mastered the relevant knowledge and skills. It appears that these are
readily taught and mastered, which explains why two years seems to give little additional
benefit, as well.
Sample for Follow-up through Second Grade
Subsequent follow-ups of the sample have been conducted in the Spring of 2007
and 2008. Children would have been in first and second grade, respectively, if they were
had not been retained in grade at any point. Children were followed up and assessed
regardless of their actual grade level, and the 2007 data are referred to as “first grade”
and the 2008 data as “second grade” even though some of the children in each year’s data
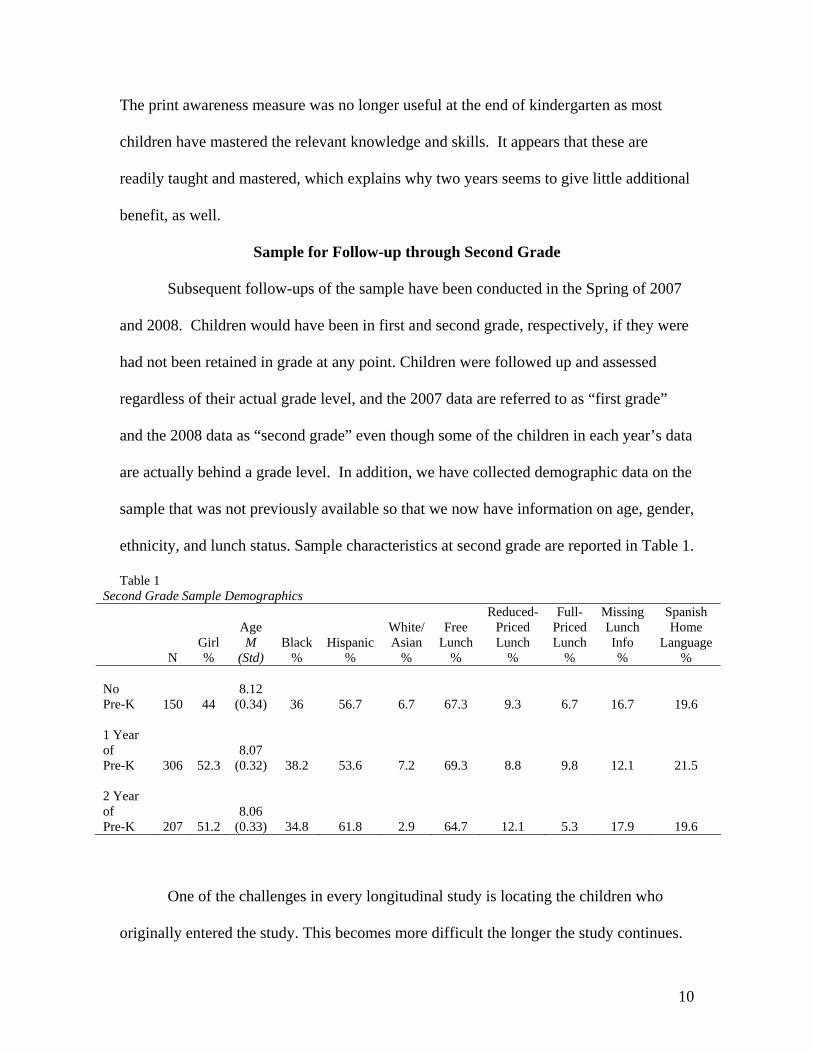
are actually behind a grade level. In addition, we have collected demographic data on the
sample that was not previously available so that we now have information on age, gender,
ethnicity, and lunch status. Sample characteristics at second grade are reported in Table 1.
Table 1 Second Grade Sample Demographics
N Girl %
Age M
(Std)
Black
% Hispanic
%
White/ Asian
%
Free Lunch
%
Reduced-Priced Lunch
%
Full-Priced Lunch
%
Missing Lunch Info %
Spanish Home
Language %
No Pre-K 150 44
8.12 (0.34) 36 56.7 6.7 67.3 9.3 6.7 16.7 19.6
1 Year of Pre-K 306 52.3
8.07 (0.32) 38.2 53.6 7.2 69.3 8.8 9.8 12.1 21.5
2 Year of Pre-K 207 51.2
8.06 (0.33) 34.8 61.8 2.9 64.7 12.1 5.3 17.9 19.6
One of the challenges in every longitudinal study is locating the children who
originally entered the study. This becomes more difficult the longer the study continues.
10

Children move outside their original districts or even out of the state, change their names
or how they report their names to the schools, and may decline to participate at a later
time. Loss of participants over time, or attrition, has two negative consequences. One is a
decrease in sample size, which reduces statistical power. The other is that attrition may
be nonrandom affecting the generalizability of the findings and potentially decreasing the
comparability of the treatment (Abbott Preschool) and comparison groups.
So far attrition has been moderate. In the original analyses at kindergarten entry
the number of children with valid test scores varied between 1,038 and 1,054 depending
on the measure. In 2009, we will follow-up by using data from the statewide assessment
in Grade 3, which may allow us to identify more children than in the previous year.
However, the Grade 3 assessment does not include children who were retained in grade,
which creates its own problem of non-random attrition. To address the problem we plan
to identify children who were behind in grade level (many have already been identified)
and we hope to administer the third grade test to them individually.
In order to assess the extent to which attrition is or is not random we have
conducted analyses on the initial test scores of the children at kindergarten entry. These
analyses investigate whether test scores differ between the initial sample and follow-up
sample and whether differences from the initial to follow-up sample vary by the number
of years of Abbott Pre-K. The results show no significant differences between the initial
sample and the existing sample at 1st or 2nd grade.
Measures Collected at First and Second Grade
Data collectors trained by NIEER assessed each child individually in the Spring
of 2007 and 2008. Measures administered at this time provide continuity with earlier
11
measures but accommodate the children’s developing abilities. The battery of child
assessments took an average of approximately 25 minutes per child and was administered
in the child’s school, in a room or quiet area appropriate for assessment.
Receptive Vocabulary. Children’s receptive vocabulary has been measured every
year since kindergarten entry using the Peabody Picture Vocabulary Test, 3rd Edition
(PPVT-III; Dunn & Dunn, 1997) and, for Spanish-speakers, the Test de Vocabulario en
Imagenes Peabody (TVIP; Dunn, Padilla, Lugo, & Dunn, 1986). The PPVT is predictive
of general cognitive abilities and is a direct measure of vocabulary size. The rank order of
item difficulties is highly correlated with the frequency with which words are used in
spoken and written language. The test is adaptive (to avoid floor and ceiling problems),
establishing a floor below which the child is assumed to know all the answers and a
ceiling above which the child is assumed to know none of the answers. Reliability is
good as judged by either split-half reliabilities or test-retest reliabilities. The TVIP is
appropriate for measuring growth in Spanish vocabulary for bilingual students and for
monolingual Spanish speakers.
All children in our sample were administered the PPVT, regardless of home
language, to get some sense of their receptive vocabulary ability in English. In
kindergarten all children who spoke some Spanish were also subsequently administered
the TVIP. The testing session was then continued, with the additional measures
administered in either English or Spanish, depending upon what the child's teacher
designated as his or her best testing language. In this follow-up, we have discontinued
Spanish-language testing as English is the language of instruction for all children and by
12
the end of kindergarten we found few children for whom Spanish was a stronger
language than English.
Mathematical Skills. Children’s early mathematical skills have been measured
each year with the Woodcock-Johnson Tests of Achievement, 3rd Edition (Woodcock,
McGrew, & Mather, 2001) Subtest 10 Applied Problems. For Spanish-speakers the
Bateria Woodcock-Munoz Pruebas de Aprovechamiento – Revisado (Woodcock &
Munoz, 1990) Prueba 25 Problemas Aplicados was used in kindergarten. Subtests of the
Woodcock-Johnson are reported to have good reliability. In this follow-up, we added
two more Woodcock-Johnson subtests to the assessment battery for first and second
grade: Subtest 5 Calculation and Subtest 6 Math Fluency. Subtests 5, 6, and 10 together
comprise the Broad Math Battery of the Woodcock-Johnson.
Literacy Skills. The literacy measures used in this study have been changed the
most over time. Initially, we measured print awareness in kindergarten using a subtest of
the Preschool Comprehensive Test of Phonological and Print Processing (Pre-CTOPPP;
Lonigan, Wagner, Torgeson, & Rashotte, 2002). However, the Pre-CTOPPP is not
appropriate for older children. Instead, in the first and second grade follow-up we used
subtests from the WJ-III (Woodcock et al., 2001) to measure early literacy skills. In the
first grade, Woodcock-Johnson Subtests for Letter-Word Identification, Word Attack,
and Sound Awareness (Rhyming, Deletion, and Substitution) were used. Subtests Letter-
Word Identification and Word Attack subtests comprise the Basic Reading Battery of the
Woodcock-Johnson. In the second grade, Woodcock-Johnson Subtests for Letter-Word
Identification, Reading Fluency and Passage Comprehension were used. Together these
provide a measure of Broad Reading. These literacy sections of the WJ-III are widely
13
used in research and are reported to have good psychometric properties. As with the other
measures, all children were assessed in English for this follow-up.
Follow-Up Analyses and Initial Findings: First and Second Grade
The effects of Abbott preschool program participation on children’s test scores at
the end of first and second grade were estimated using regression analysis. Effects on
grade repetition by entry to second grade were estimated using logit and probit analyses
as appropriate for a binary dependent variable. These analyses were conducted on the
longitudinal sample with independent variables for student ethnicity, free or reduced
lunch status, gender, age, and school district, as well as dummy variables indicating one
or two years attendance in an Abbott preschool program. Analyses were conducted on
raw scores. The Stata program was employed, and intra-cluster correlation is taken into
account through the estimation of cluster-robust standard errors. All of the first and
second grade analyses were conducted with no replacement of missing data, as all
procedures for replacing missing data create problems of their own. However, in a future
report we will present the results of analyses using multiple imputation procedures to
replace data. The estimated effect sizes (i.e., standardized in standard deviation units for
comparison purposes) at kindergarten entry and the end of kindergarten are reported
below in the text and in tables that report scores for each group: no preschool, one year of
preschool at age 4, and two years of preschool at ages 3 and 4.
Receptive Vocabulary. Oral language (as measured by the PPVT) forms not only
the basis of social communication, but reveals conceptual knowledge and is essential for
both reading and writing acquisition. At the end of kindergarten, one year of the Abbott
preschool program had an effect size of 0.18 (p<.05) and the two year effect size was
14
0.38 (p<.01). At the end of second grade the benefits of Abbott participation continued to
be significant with results of 0.22 (p<.05) for one year of attendance and 0.40 (p<.01) for
two years. Keeping in mind that comparison with the regression discontinuity results at
kindergarten entry indicated that the longitudinal study underestimates program effects,
these results are quite strong. As was true earlier, the estimated effects of two years of
participation are twice the size of those for one year of Abbott Pre-K. Table 2 displays
these results together with earlier results for comparison. These results suggest that there
has been no decline in the program’s effects in this domain since kindergarten entry.
Standard scores indicate that children are still somewhat below the national average in
this domain, despite the substantial gain from two years of Abbott pre-K.
Mathematics. All of the estimated effects in mathematics favored the Abbott
preschool attendees with two years having more impact than one. Math measures
included Applied Problems, Calculation, Math Fluency and Broad Math. The most
consistently observed difference was that Applied Problems scores were higher in first
grade—effect sizes of 0.18 (p<.05) for one year and 0.26 (p<.05) for two years—and in
second grade—effect sizes of 0.24 (p<.05) for one year and 0.44 (p<.01) for two years.
Estimated effects on Calculation at the end of second grade were small, but were
statistically significant (p<.05) in a one-tailed test for two years of Pre-K. Estimated
effects were small for Broad Math, but effects on standard scores were statistically
significant in one-tailed tests for one year and two years of Pre-K.
Estimated effects on Applied Problems from kindergarten entry through 2nd grade
are reported in Table 2. Although there is some variation in these over time, they suggest
little or no reduction in effects from kindergarten entry through the end of second grade,
15
and the effects are large enough to be meaningful. Two years of very consistently has a
much larger effect than one year of Abbott Pre-K participation, though not always
double. Comparison to the RDD results indicates that we substantially underestimate
effects on mathematics achievement, perhaps by so much that the true effects at the end
of second grade were about .40 for one year and .80 for two years. Standard scores
indicate that even children in the follow-up sample who did not attend Pre-K score at
about the national average in mathematics, even though behind those who attended the
program.
Reading. The instruments used to assess first grade literacy skills were letter-
word identification, word attack, sound awareness, and basic reading. Second grade
literacy skills were measured by letter-word identification, reading fluency, passage
comprehension and broad reading. Although differences in these literacy outcomes
tended to favor children who had attended Abbott prekindergarten programs, they
generally were small and statistically significant. Program effects are most apparent on
Passage Comprehension on which the former pre-K attendees scored higher with effect
sizes equal to 0.16 for one year and 0.20 for two years—both effects are statistically
significant at the .05 level using a one-tailed test. These can be seen in Table 2. Standard
scores indicate that children in the follow-up sample scored near the national average on
Broad Reading by the end of second grade regardless of pre-K attendance.
We note that literacy is the domain where the initial comparison of results from
the RDD and longitudinal designs indicated the most serious problem. The RDD result
for one year of Abbott Pre-K at kindergarten entry was nearly double (90 percent larger)
the result produced using the conventional comparison group. Therefore, literacy is the
16
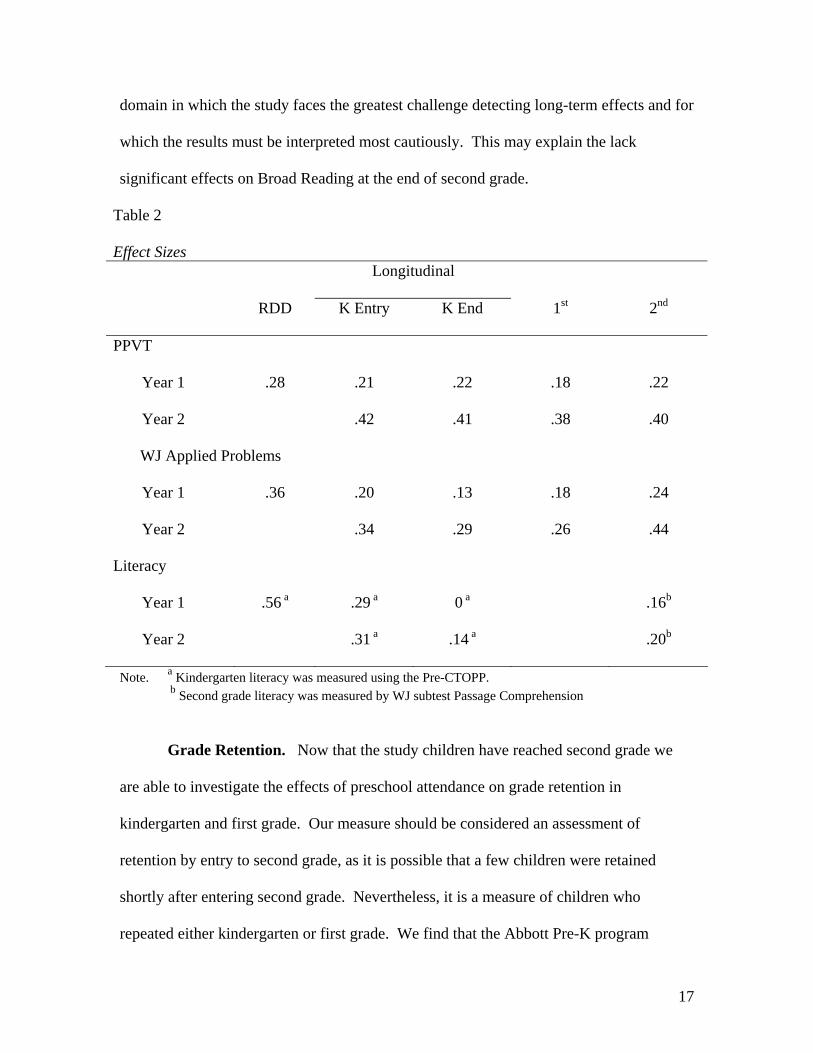
domain in which the study faces the greatest challenge detecting long-term effects and for
which the results must be interpreted most cautiously. This may explain the lack
significant effects on Broad Reading at the end of second grade.
Table 2
Effect Sizes Longitudinal
RDD K Entry K End 1st 2nd
PPVT
Year 1 .28 .21 .22 .18 .22
Year 2 .42 .41 .38 .40
WJ Applied Problems
Year 1 .36 .20 .13 .18 .24
Year 2 .34 .29 .26 .44
Literacy
Year 1 .56 a .29 a 0 a .16b
Year 2 .31 a .14 a .20b
Note. a Kindergarten literacy was measured using the Pre-CTOPP. b Second grade literacy was measured by WJ subtest Passage Comprehension
Grade Retention. Now that the study children have reached second grade we
are able to investigate the effects of preschool attendance on grade retention in
kindergarten and first grade. Our measure should be considered an assessment of
retention by entry to second grade, as it is possible that a few children were retained
shortly after entering second grade. Nevertheless, it is a measure of children who
repeated either kindergarten or first grade. We find that the Abbott Pre-K program
17
significantly reduced retention in first grade and kindergarten. Grade retention was
10.7% (16) for children who did not attend pre-K, 7.2% (22) for those who attended for
one year, and 5.3% (11) for those who attended two years. The effect on grade retention
of two years of Abbott pre-K is statistically significant (p<.05) and twice as large as the
effect of one year of Abbott pre-K.
Discussion
Considerable resources have been invested in the Abbott Preschool Program. It
has high program standards compared to many other state-funded pre-K programs and the
federal Head Start program (Barnett, Epstein, Friedman, Boyd, & Hustedt, 2008). It also
has a relatively high per pupil cost, which reflects those high standards as well as New
Jersey’s high cost of living. The program operates for a full school day, employs
licensed teachers paid on the same scale as public school teachers, has a maximum class
size of 15 with an assistant teacher assigned to each classroom, provides in-class supports
to classroom staff on curriculum and differentiating instruction and has dedicated staff to
work with parents and the community (Frede, 2005).
The effectiveness of any preschool program depends on how well it is
implemented, but quality of implementation is not always measured in program
evaluations. It is noteworthy that the Abbott pre-K program has been a work in progress.
At the time the children in this follow-up study attended the program, quality was better
than that in many other programs but not what it is today. The program has improved a
half point over all on the 7 point scale, from fair to good on average to good to excellent
on average since the children in this study attended Abbott Pre-K. When interpreting the
results of this report it should be acknowledged that, even if perfectly estimated, the
18
program’s effects reported here are smaller than we would expect for subsequent cohorts
of children in the Abbott districts.
Earlier studies found that the Abbott Preschool Program has beneficial effects on
children’s learning in the domains of language, literacy and math abilities skills at
kindergarten entry and exit (Frede et al., 2004; Lamy et al., 2005; Wong, Cook, Barnett,
& Jung, 2008). We find positive effects on children’s learning in those same domains
through the end of second grade. This studies’ effect sizes are reasonably large compared
to the estimated effects in other studies and are about the same size as reported by the
Chicago Child Parent Center study at the end of second grade (Reynolds et al.; 2007).
The estimated effects on grade retention are consistent the results other studies, taking
into consideration that only kindergarten and first grade are involved so far. However,
there are two discrepancies with other studies in the details.
Other studies of preschool programs for three- and four-year-olds have not tended
to find the same degree of persistence in PPVT scores. Our results, particularly those for
two years of Abbott Pre-K, are more similar to the results of the Abecedarian (Campbell
et al., 2002) and IHDP (McCarten, et al., 1997) studies where intervention began earlier
and was provided in full-day, year-round programs. Perhaps the intensity of the Abbott
program, which is offered for a full school day, and the provision of wrap-around child
care full-day, year-round contribute to the larger and more persistent effect on the PPVT
which measures language and conceptual knowledge (see also, Robin, Frede, & Barnett,
2006). The Abbott program also differs from many others in that it provides services to
all children in a community, raising the possibility of peer effects and that large scale
19
changes in the overall performance of classrooms in years after preschool may affect the
long-term results.
Other studies have found larger effects on literacy skills, though not always in the
first several years of primary school. For example, the effects of the Perry Preschool
program on reading achievement were not fully evident until middle school (though keep
in mind that study had a small sample; Schweinhart and Weikart, 1980). One
complicating factor is the intensive focus of Abbott schools on literacy in the early grades
(MacInnes, 2009). Possibly this focus has enabled the children who did not attend
preschool to catch up to their peers who did attend pre-K in basic literacy skills. We do
not know how much extra attention children who were falling behind may have received
as a result of these efforts. It remains to be seen whether the persistent language
advantage from preschool participation will become more evident in reading
comprehension in Grade Three where it is more thoroughly assessed than in second
grade. Children’s early print awareness and receptive vocabulary skills have been found
to predict later reading abilities in the early elementary grades (Snow, Burns, & Griffin,
1998). However, it should be noted that relative to national norms children in the study
are performing better on the reading measures than on the oral language (and conceptual
knowledge) measure at second grade.
Relatively little research compares the effects of one year versus two years of
preschool attendance. Some studies find little difference, while others have found
substantial gains from starting earlier (Barnett, 2008). From kindergarten through second
grade, children who attended the Abbott Preschool Program for two years at ages 3 and 4
out-performed children who attended for only one year at age 4. Two years of program
20
participation roughly doubles gains at second grade on most measures. The sole
exception is literacy and reading for which two years has appeared to be at best slightly
better. These results must be interpreted cautiously, as selection bias could also affect the
differences between estimated effects for one and two years of program participation.
Parents who know about and choose to send their children to preschool at age 3 may be
different in immeasurable ways from those who only send them at 4. For this comparison
we do not have the estimates from the more rigorous RDD to verify our results.
The evidence of downward bias in the longitudinal study estimates should be
taken into consideration when interpreting our results. The RDD study indicated that
there was substantial downward bias in estimates from our longitudinal study design and
that this was most severe for literacy and least severe for language. This bias may
explain why effects do not appear as sustained for literacy as for language through the
end of second grade. The downward bias in the estimated initial effects on literacy is
more than enough to have resulted in the lack of statistical significance even if true long-
term effects were in the neighborhood of 0.25 or 0.30. Such effects would be large
enough to be educationally meaningful. The estimated effects on passage comprehension
in second grade are suggestive that we may be missing literacy effects because of the
research design doesn’t correct well enough for initial differences between the Pre-K and
No-Pre-K groups that affect literacy development. An additional factor is that loss of
some of the sample over time reduces our ability to detect effects.
The effects found in this study are the first links in a chain of results that have
been found to produce long-term gains in school success and economic benefits in other
preschool education studies that have followed children into adulthood (Campbell et al.,
21
2002; Reynolds, Temple, Robertson, & Mann, 2002; Schweinhart et al., 2005). There is
a consistent picture in the study reported of gains in knowledge and skills accompanied
by increased school success as measured by grade retention. These gains in learning and
ability are large enough to be practically meaningful and are already beginning to result
in savings for taxpayers who do not have to pay for extra years of schooling. The results
of this study add to the considerable body of evidence indicating that quality preschool
education can make significant contributions to efforts to improve children’s learning and
development (Frede, 1998). This study extends the evidence that such effects can be
produced for today’s children on a large scale by public programs administered through
the public schools by demonstrating persistent and not just initial effects on children’s
cognitive abilities (Gormley, Gayer, Phillips, & Dawson, 2005).
22
References
Barnett, W.S., Epstein, D.J., Friedman, A.H., Boyd, J.S., & Hustedt, J.T. (2008). The
state of preschool 2008: State preschool yearbook. New Brunswick, NJ: National
Institute for Early Education Research.
Barnett, W. S., Jung, K., Lamy, C., Wong, V., Cook, T. (2007, March). Effects of five
state prekindergarten programs on early learning. Paper presented at the bi-
annual Society for Research in Child Development, Boston, MA.
Barnett, W.S., Lamy, C., & Jung, K. (2005). The Effects of State Prekindergarten
Programs on Young Children’s School Readiness in Five States. NIEER Policy
Report. New Brunswick, NJ: National Institute for Early Education Research.
Barnett, W. S., Tarr, J., Esposito Lamy, C., & Frede, E. (2002). Fragile Lives, Shattered
Dreams: A Report on Implementation of Preschool Education in New Jersey’s
Abbott Districts. Rutgers University, New Brunswick, NJ: CEER.
Campbell, F. A., Ramey, C. T., Pungello, E. P., Sparling, J., & Miller-Johnson, S. (2002).
Early childhood education: Young adult outcomes from the Abecedarian Project.
Applied Developmental Science, 6, 42-57.
Cook, T.D. (2008). Waiting for life to arrive: A history of the regression-discontinuity
design in psychology, statistics, and economics. Journal of Econometrics, 142
(2), 636-654.
Cook, T. D., & Campbell, D. T. (1979). Quasi experimentation: Design and analysis
issues for field settings. Boston, MA: Houghton Mifflin.
Dunn, L. M. & Dunn, L. M. (1997). Peabody Picture Vocabulary Test-Third Edition
(PPVT-3). Circle Pines, MN: AGS Publishing.
23
Dunn, Padilla, Lugo & Dunn, (1986). Test de Vocabulario en Imágenes Peabody (TVIP).
Circle Pines, MN: AGS Publishing.
Frede, E. (1998) A sociocultural analysis of the long-term benefits of preschool for
children in poverty. In Barnett, W.S. and Boocock, SS (Eds) Early Care and
Education: Lasting Effects for Children in Poverty. Buffalo, NY: SUNY Press.
Frede, E. (2005) Assessment in a continuous improvement cycle: New Jersey’s Abbott
preschool program, invited paper for the National Early Childhood Accountability
Task Force with support from the Pew Charitable Trusts, the Foundation for Child
Development and the Joyce Foundation. http://nieer.org/docs/?DocID=192
Frede, E., Lamy, C.E., & Boyd, J.S. (2005) Not Just Calendars and Counting Blocks:
Using the NAEYC/NCTM Joint Position Statement “Early Childhood
Mathematics: Promoting Good Beginnings” as a Basis for Measuring Classroom
Teaching Practices and Their Relationship to Child Outcome a paper presented at
the annual National Association for the Education of Young Children conference,
Washington, DC.
Frede, E, Lamy, C.E. with Seplocha, H., Strasser, J., Jambunathan, S., Juncker, J., &
Wolock, E. (2004). A rising tide: Classroom quality and language skills in the
Abbott Preschool Program: Year Two Preliminary Update of the Early Learning
Improvement Consortium. Trenton, NJ: New Jersey Department of Education.
www.nj.gov/njded/ece.
Frede, E., Weber, M., Hornbeck, A., Stevenson-Boyd, J., & Colon, A. (2005). Preschool
Classroom Mathematics Inventory. Available from the first author at
24
Gormley, W.T., Gayer, T., Phillips, D., & Dawson, B. (2005). The effects of universal
pre-k on cognitive development. Developmental Psychology, 41(6), 872-884.
Harms, T., Clifford, R., & Cryer, D. (2005). Early Childhood Environment Rating Scale
(ECERS-R), revised edition. New York, NY: Teacher College Press.
Lamy, C., Frede, E., & ELIC. (2005). Giant Steps for the Littlest Children: Progress in
the Sixth Year of the Abbott Preschool Program. Trenton, NJ: New Jersey
Department of Education. www.nj.gov/njded/ece
Lonigan, C., Wagner, R., Torgeson, J. & Rashotte, C. (2002). Preschool Comprehensive
Test of Phonological & Print Processing (Pre-CTOPPP). Tallahassee, FL: Florida
State University, Department of Psychology.
MacInnes, G. (2009) In plain sight: Simple, difficult lessons from New Jersey's expensive
effort to close the achievement gap. New York; Century Foundation Press.
McCarton, C. M., Brooks-Gunn, J., Wallace, I. F., Bauer, C. R., Bennett, F. C.,
Bernbaum, J. C., Broyles, R. S., Casey, P. H., McCormick, M. C., Scott, D. T.,
Tyson, J., Tonascia, J. and Meinert, C. L. (1997). Results at age 8 years of early
intervention for low-birth-weight premature infants. Journal of the American
Medical Association, 277, 126-132.
NJ DOE (2002b). New Jersey Preschool Teaching and Learning Expectations: Standards
of Quality. Trenton: author.
Reynolds, A.J., Temple, J.A., Ou, S., Robertson, D.L., Mersky, J.P, Topitzes, J.W., &
Niles, M.D. (2007). Effects of a school-based, early childhood intervention on
adult health and well-being: A 19 year follow-up of low-income families.
Archives of Pediatrics and Adolescent Medicine, 161(8), 730-739.
25
26
Robin, K., Frede, E. & Barnett, W.S. (2006) Is more better?: The effects of full-day vs.
half-day preschool on early school achievement.
http://nieer.org/docs/index.php?DocID=144
Schweinhart, L.J., Montie, J., Xiang, Z., Barnett, W.S., Belfield, C.R., & Nores, M.
(2005). Lifetime effects: The High/Scope Perry Preschool study through age 40
(Monographs of the High/Scope Educational Research Foundation, 14).
Ypsilanti, MI: High/Scope Educational Research Foundation.
Schwienhart, L.J. & Weikart, D.P. (1980) Young children grow-up: The effects of the
Perry Preschool Program on youths through age 15. Ypsilanti, MI: High/Scope
Educational Research Foundation.
Snow, C., Burns, M. S., & Griffin, P. (Eds.). (1998). Preventing reading difficulties in
young children. Washington, DC: National Academy Press.
Trochim, W. M. K. (1984). Research design for program evaluation: The regression-
discontinuity approach. Beverly Hills, CA: Sage Publications.
Wagner, R., Torgeson, J., & Rashotte, C. (1999). Comprehensive Test of Phonological
Processing (CTOPP). Austin, TX: Pro-Ed.
Wong, V. C., Cook, T. D., Barnett, W. S., & Jung, K. (2008). An effectiveness-based
evaluation of five state prekindergarten programs. Journal of Policy Analysis and
Management, 27(1), 122-154.
Woodcock, R. W. & Munoz, A. F. (1990). Bateria Woodcock-Munoz Pruebas de
Aprovechamiento – Revisados. Itasca, IL: Riverside Publishing.
Woodcock, R. W., McGrew, K. S. & Mather, N. (2001). Woodcock-Johnson Tests of
Achievement. Itasca, IL: Riverside Publishing.