Embed Size (px)
Citation preview
THE ANTIOXIDANT ACTIVITY OF THE EXTRACT OF PANGIUM EDULE REINW (KELUAK) SEED IN COOKED GROUND TURKEY
BY
PAULINA SUYANTO
THESIS
Submitted in partial fulfillment of the requirements for the degree of Master of Science in Food Science and Human Nutrition
in the Graduate College of the University of Illinois at Urbana-Champaign 2012
Urbana Illinois
Masterrsquos Committee
Associate Professor William E Artz
Professor Nicki J Engeseth
Professor Susan Brewer
ii
Abstract
The effect of Keluak (Pangium edule Reinw) seed extracts (K 200 and
400 ppm) along with synthetic antioxidant (BHT 200ppm) on the oxidative
stability of cooked ground turkey stored at 2˚C for 7 days for the first study and
15 days for the second study was examined The Keluak seed was extracted with
acetone water acetic acid (90 95 05 vvv) to obtain phenolic extracts and
added to the meat system The meat system included (ground turkey with 15 fat
content 2 salt (by weight) to induce lipid oxidation and 5 (by weight) water to
dissolve the salt Once the antioxidants were added to the meat the raw mixtures
were mixed by hand (wearing plastic gloves) for 5 minutes to ensure
homogeneity The raw mixtures were then formed into patties with diameter of
55 cm and thickness of 15 cm and cooked on an electric grill to reach internal
temperature of 74˚C Meat patties were then overwrapped in commercial plastic
wrap and placed over aluminum foil The progress of lipid oxidation in the first
study was assessed after 0 1 3 5 and 7 days using thiobarbituric acid reactive
substances (TBARS) conjugated dienes (CD) and odor sensory analysis A second
study was completed and TBARS CD and peroxide values (PV) were used to
determine the extent of lipid oxidation after 0 1 3 5 7 10 13 and 15 days of
refrigeration storage Based on TBARS and CD values both Keluak extract
concentrations (K200 and K400) significantly reduced lipid oxidation and
exhibited significant activity comparable to BHT at 200ppm
iii
Acknowledgement
I would especially like to thank you to the members of my committee Dr
Nicki Engeseth and Dr Susan Brewer and to my research advisor Dr William E
Artz for their committed guidance moral support and technical assistance in the
preparation of this thesis I would also extend my thanks to Dr Keith
Cadwallader and Dr Yongsoo Lee in facilitating my work with their laboratory
equipment and technical advice
I would like to thank the members of my research project Nathania Kwee
and Nauman Hayat for being able to share my ideas with them and for their time
to help me with the chemical assays
I would like to thank the participants of my odor sensory analysis project
Bethany Ching Ted Gipi Inthawoot In Iok Jarupat Nat Panadda Panchalee
Gizem Sindy Tito Taksawan Yaowapa and Wan Yuan for their time
contribution advice and patience during the odor sensory training and
evaluation
I would like to thank Dr Yaowapa Lorjaroenphon and Dr Vermont P Dia
for sharing their knowledge and advice for statistical analysis and chemical
analysis part of the experiment
I would like to thank my friends wherever you are
Most especially I would like to thank Mom and Dad as well as my brother
with their moral support financial support and love
iv
Table of Contents
Chapter 1 INTRODUCTION 1
11 General Introduction 1
12 References List 3
Chapter 2 REVIEW OF LITERATURE 4
21 Trend in Poultry Consumption 4
22 Lipid Oxidation 5
221 Overview 5 222 Mechanism of Lipid Oxidation 5 2221 Initiation 5 2222 Propagation 6 2223 Termination 6
23 Lipid Oxidation in Meat 7
231 Factors Affecting the Extent of Lipid Oxidative Stability in Meat 8 2311 Fatty Acid Composition of Meat 8 2312 Endogenous prooxidative and antioxidative constituents 9 2313 Meat Processing 9 2314 Non-meat Additives 10 232 Measurement of rancidity in meat 11 2321 Peroxide Value 12 2322 Conjugated Dienes 12 2323 Thiobarbituric Acid Reactive Substances (TBARS) 13 2324 Sensory Evaluation 14
24 Control of Oxidation Antioxidants 15
241 Type I - Also called the primary or free-radical chain stopper antioxidants 15 242 Type II- Secondary antioxidants or Free-radical production preventer 17 243 Type III- Control of Environment Factors 17
25 Keluak As A Natural Source of Antioxidant 18
251 Keluak ndash Introduction 18 252 Nutritional Profile of Keluak 20 253 Previous work on keluak 20
26 Figures 22
27 Tables 25
28 References 27
CHAPTER 3 MATERIALS AND METHODS 32
v
31 Keluak Antioxidant and Chemicals 32
311 Phenolic Extraction 32 312 Total Phenolics content 33
32 Sample Preparation 33
33 Thiobarbituric Acid Reactive Substances (TBARS) 34
34 Conjugated Dienes 35
35 Peroxide Value 35
36 pH value 36
37 Sensory Evaluation 36
38 Statistical Analysis 37
39 Tables 38
310 References 39
Chapter 4 RESULTS AND DISCUSSION 41
41 Phenolic Extraction Yield 41
42 Effect of Keluak Extract and storage time on TBARS values during refrigerated
storage of cooked ground turkey 41
43 Effect of Keluak Extract and Storage Time on Conjugated Diene Content during
Refrigerated Storage of Cooked Ground Turkey Meat 43
44 Effect of Keluak extract and storage time on peroxide value during refrigerated
storage of cooked ground turkey 44
4 5 Effect of Keluak Extract and storage time on Odor of Refrigerated Cooked Ground
Turkey 45
4 6 Effect of Keluak Extract and storage time on pH of Refrigerated Cooked Ground
Turkey 46
47 Figures 47
48 Tables 53
49 References 59
Chapter 5 CONCLUSION AND FUTURE WORK 61
1
Chapter 1 INTRODUCTION
11 General Introduction
Consumer demand for more convenient foods has been increasing rapidly
this includes the demand for precooked meat products Regardless of the major
benefit of consuming poultry meat cooked meat lipid oxidizes over time which
can cause off flavor and odor termed warmed over flavor (WOF) Lipid
hydroperoxides and their breakdown products are the major substances
responsible for the deterioration and undesired flavor in cooked meat products
during storage (1 2) Therefore suppression of lipid oxidation is essential to
improve the quality and stability of precooked meat products
Antioxidant addition has been an effective method to prevent oxidation in
meat products Several synthetic antioxidants including butylated
hydroxytoluene (BHT) butylated hydroxyanisol (BHA) tertiary-butylated
hydroxyquinone (TBHQ) and propyl gallate have been reported to inhibit lipid
oxidation(3 4) The recent increase in the use of natural ingredients has
challenged scientists to discover additional natural source antioxidants The
long-term safety and negative consumer perception of synthetic antioxidants
have been questioned and consumers are increasingly demanding additive-free
or natural sources Antioxidants from several natural sources including honey
(1) rosemary extracts (4) and grape seed extracts (5) were reported to be
effective Recent studies on other natural extracts reported their antioxidant
activity in meats basil and galangal extracts (6) and cocoa powder (7) to name a
few
The fermented seed of Pangium edule Reinw or Keluak possesses
potential antioxidant activity (11) Pangium edule Reinw is a tall tropical tree
that grows primarily in Micronesia including Indonesia Keluak is commonly
used as a spice for soup in some regions in Indonesia Previous studies had
shown that the Keluak extract has antioxidant activity Fardiaz and Romlah (11)
found that the addition of a Keluak seed extract to cooking oil lengthened the
oxidation induction period of the oil Andarwulan et al (8 9) reported that the
total phenolic content in the seeds increased with an increase in the duration of
2
fermentation although the antioxidant activity remained the same Chye and Sim
(10) reported that an acetone extract containing Keluak phenolics had substantial
antioxidant activity as measured by both DPPH radical scavenging and βndash
carotene bleaching assays Keluak seems to be a promising and novel natural
antioxidant source but additional investigations regarding its activity in food
products are needed
The increased consumer focus on natural food ingredients has led to the
search for additional natural sources of antioxidant for reducing oxidation in food
products Several studies on the phenolic constituents in numerous plant sources
have been conducted Keluak could be another possible economical and novel
source of natural antioxidants Even though several studies on the antioxidant
activity of Keluak seeds have been conducted (3- 7) its efficacy in meat products
has not yet been investigated It is important to explore the use of this plant
extract in the meat industry since traditionally it has been used as a spice
flavoring in meat dishes in Southeast Asia Therefore the objective of this
research was to determine the effectiveness of the phenolic extract of Keluak in
cooked ground turkey patties during refrigerated storage
3
12 References List
1 McKibben J Engeseth N Honey as a protective agent against lipid oxidation in ground turkey J Agric Food Chem 2002 50 592-595
2 Oxidation in Foods and Beverages and Antioxidant Applications Vol 2 Management in Different Industry Sectors Oxidation in Foods and Beverages and Antioxidant Applications Vol 2 Management in Different Industry Sectors 2010 200 1-528
3 Khalil A Mansour E Control of lipid oxidation in cooked and uncooked refrigerated carp fillets by antioxidant and packaging combinations J Agric Food Chem 1998 46 1158-1162
4 Yu L Scanlin L Wilson J Schmidt G Rosemary extracts as inhibitors of lipid oxidation and color change in cooked turkey products during refrigerated storage J Food Sci 2002 67 582-585
5 Rojas MC Brewer MS Effect of natural antioxidants on oxidative stability of cooked refrigerated beef and pork J Food Sci 2007 72 S282-S288
6 Juntachote T Berghofer E Siebenhandl S Bauer F The antioxidative properties of Holy basil and Galangal in cooked ground pork Meat Sci 2006 72 446-456
7 Hassan O Fan L The anti-oxidation potential of polyphenol extract from cocoa leaves on mechanically deboned chicken meat (MDCM) Lwt-Food Science and Technology 2005 38 315-321
8 Andarwulan N Fardiaz D Wattimena GA Shetty K Antioxidant activity associated with lipid and phenolic mobilization during seed germination of Pangium edule Reinw J Agric Food Chem 1999 47 3158-3163
9 Andarwulan N Fardiaz S Apriyantono A Hariyadi P Shetty K Mobilization of primary metabolites and phenolics during natural fermentation in seeds of Pangium edule Reinw Process Biochemistry 1999 35 197-204
10 Chye FY Sim KY Antioxidative and Antibacterial Activities of Pangium edule Seed Extracts International Journal of Pharmacology 2009 5 285-297
11 Fardiaz D Romlah S Antioxidant Activity of Picung (Pangium edule Reinw) Seed In Development of Food Science and Technology in ASEAN Proceedings of the 4th ASEAN Food Conference Feb 17-21 1992 ASEAN Jakarta Indonesia 1992
4
Chapter 2 REVIEW OF LITERATURE
21 Trend in Poultry Consumption
Consumption of poultry meat has increased in both developed and
developing countries (25) In the US per capita poultry meat consumption
increased from 79 pounds in 1990 to 954 pounds in 2000 and to just over 100
pounds in 2011 (26) Overall according to the National Chicken Council (6) per
capita consumption of red meat and poultry has not changed significantly but
when beef pork and poultry are examined separately red meat appears to be
losing market share to poultry Chicken and turkey were by far the most widely
consumed poultry species at approximately 822 and 164 pounds per person per
year respectively (26) According to Bilgili (27) it is predicted that poultry will
become the overall meat of choice by 2020
This continued growth and the competitive nature of the poultry industry
has been attributed to a variety of factors such as improvements in intensive
production and processing and development of a wide range of value-added
processed products that meet both direct consumer demand and the rapid
expansion of fast food outlets Poultry products are universally popular because
they are often not subject to cultural or religious constraints and the meat itself is
perceived as wholesome healthy and nutritious since it is relatively low in fat
and it has a more desirable unsaturated fatty acid composition than other meats
Most importantly high quality poultry products are available to many people at
affordable prices even though production costs vary widely around the world
(25) Precooked meat products have attained a high degree of consumer
acceptance because of the relative cost and ease of preparation (28)
Due to the increase in consumption the world production of poultry has
increased the past few decades The industry will remain responsive to consumer
demands both in the range and nature of the products developed although the
focus on quality will continue While the term ldquoqualityrdquo is defined according to
the consumerrsquos own perceptions goals and personal preferences however in
practicality product quality includes scientifically measurable characteristics of
color texture and flavor One main factor limiting the quality and acceptability of
5
meat and meat products is lipid oxidation a process that leads to deterioration of
quality characteristics such as color flavor texture nutritive value and safety
(25) Therefore the meat industry faces a challenge in developing strategies for
preventing lipid oxidation in meat and meat products
22 Lipid Oxidation
221 Overview
A wide variety of organic molecules are susceptible to chemical attack by
oxygen Lipid oxidation can occur in foods containing considerable amounts of
fat (particularly fats containing substantial percentages of unsaturated fatty
acids) including nuts milk and meat products (1) Oxidation of lipids is initiated
by irradiation including exposure to visible light by enzymes and metal catalysts
Heat and pressure will accelerate lipid oxidation (2) Quality attributes of foods
can be substantially affected by this process For instance negative aroma
changes in the food can result from volatile oxidation products the color can
darken as a result of condensation reactions between oxidation products and
proteins and lastly the texture can be modified by the oxidative induction of
protein crosslinks (1) Not unexpectedly the nutritive value and safety can also be
compromised
222 Mechanism of Lipid Oxidation
Lipid autoxidation is a free radical chain reaction that once the
peroxidation process is initiated it proceeds as a free-radical mediated chain
reaction that can be described in terms of initiation propagation and termination
processes (29)
2221 Initiation
R H R + H (1)
An initiator reacts with unsaturated lipids (RH) to form a lipid free radical
(R) (reaction 1) Unsaturated lipids (RH) are easily oxidized by one of several
reactive oxygen species (ROS) which include oxygen radicals and non-radical
derivatives of oxygen (29) such as O2 and OH Poly-unsaturated fatty acids
Initiator
6
(PUFA) are much more susceptible to oxidation than mono-unsaturated fatty
acid (MUFA) (46)
The initiation reaction can include transition metals (ie iron copper)
oxidants various hemolysis-prone substances or enzymes (1) This production of
free radicals can occur because of the direct thermal dissociation (thermolysis) of
hydroperoxides because of transition metal catalysis or exposure to light
(photolysis) with or without the intervention of photosensitizers (30) The
spontaneous abstraction of a hydrogen atom from an organic material by
molecular oxygen is an endothermic reaction which has a large activation energy
and although it might occur to a certain extent this stage is probably too slow to
be of practical importance Either the organic molecule or the oxygen should be
activated before the reaction could take place (1)
2222 Propagation
R + O2 ROO (2)
ROO + RH rarr ROOH + R (3)
An unsaturated lipid contains labile hydrogen(s) that can be abstracted
relatively easily This free radical (R) will react rapidly with molecular oxygen to
produce a peroxyl radical (ROO ) (reaction 2) The newly formed hydroperoxyl
radical can so forth abstract a hydrogen atom from an adjacent unsaturated fatty
acid (reaction 3) and the reaction goes on propagation cycles before termination
(29)
2223 Termination
ROO + ROO rarr non-radical products [ROOOOR] (4)
RO + R rarr ROR
R + R rarr RR
R + ROO rarr ROOR
Termination can occur by condensation of peroxy alkoxy andor alkyl
radicals Peroxy radicals at room temperature can combine to produce peroxy-
linked dimers (ROOR) Alkoxy and alkyl radicals at low oxygen pressure and
7
high temperatures can combine to produce ether-linked dimers (ROR) and
carbon-carbon linked dimers (RR) Alkyl radicals can combine with peroxy
radicals to generate peroxy-linked dimers (ROOR) (30-32)
Hydroperoxides the primary initial products of lipid oxidation can
breakdown as soon as they are formed The decomposition can be catalyzed by
transition metals particularly iron or copper or by elevated temperatures
gt100degC Hydroperoxide decomposition can involve several complex pathways
forming a wide variety of volatile and non-volatile secondary products such as
aldehydes ketones alcohols acids and hydrocarbons which can affect flavor
greatly Some of the volatile aldehydes can be extremely potent and can affect
flavor of food at concentrations less than 1 ppm (31) Another important
termination reaction involves an antioxidant (AH) (30) which will be discussed
later in the chapter
23 Lipid Oxidation in Meat
Meat can oxidize very rapidly post-mortem The rate and degree of lipid
oxidation are affected by factors that include meat composition fatty acid
content processing conditions and chemical additives in the meat products (3)
It is generally agreed that lipid oxidation in muscle foods begins immediately
after slaughter in the highly unsaturated phospholipids fraction in the subcellular
membranes (25) Botsoglou et al (25) added that in most cases fresh meat has an
acceptable stability with respect to oxidation but processing operations such as
freezing and thawing mechanical deboning mincing restructuring the addition
of salt and refrigeration can lead to increased oxidation due to the destruction of
cellular structure and functions
Cooked or pressure-treated meat and meat products can be more
susceptible to oxidation since endogenous antioxidant enzymes may denature
and lose their activities while iron-containing proteins may become a source of
catalytic iron
Poultry meat is particularly susceptible to lipid oxidation due to its high
content of polyunsaturated lipids pigments metal catalysts and various other
8
oxidizing agents (25) This implies that even low-fat poultry meat products are
susceptible to lipid oxidation since fat reduction primarily reflects a reduction in
triacylglycerides while the phospholipid fraction which is high in
polyunsaturated fat is much less affected (34) Another factor is that species
differences in susceptibility to lipid oxidation are largely determined by the level
of poly-unsaturated fatty acid (PUFA) present in meat Thus the extent of lipid
oxidation in cooked meat is directly related to the level of unsaturated fatty lipids
with susceptibility to oxidation decreasing in the order of chicken gt pork gt beef gt
lamb (4) Chicken has fewer tendencies to develop oxidized flavor than turkey
because the higher level of vitamin E in chicken fat retards oxidation Oxidation
proceeds faster in turkey thigh meat than in breast meat as the darker meat
contains more lipid and heme iron (17)
Hydroperoxides formed during lipid peroxidation undergo decomposition
to form secondary oxidation products Those secondary products include volatile
aldehydes ketones acids alcohols and hydrocarbon compounds Aldehydes (ie
hexanal) are one of the primary causes of rancid and stale flavors in precooked
meat products (3)
231 Factors Affecting the Extent of Lipid Oxidative Stability in Meat
There are factors that can affect lipid stability in meat and meat pr0ducts
such as fatty acid composition endogenous prooxidative or antioxidative
components meat processing operations and various additives
2311 Fatty Acid Composition of Meat
It is generally agreed that unsaturated fatty acids (UFA) are responsible
for lipid oxidation in meat Also as the concentration of polyunsaturated fatty
acids (PUFA) increases lipid oxidation increases in muscle foods (4) The amount
of UFA in muscle foods varies depending on the animal species genetic origin
diet sex age at which the animal is slaughtered type of muscle and processing
factors such as fat addition to ground meat (5)
Turkey meat showed low values for total lipid and cholesterol but
greater values than beef pork and lamb for its PUFA content The content of n3
9
fatty acids was the greatest in turkey among meats that included beef pork and
lamb The species is the major source of variation in fatty acid composition The
fatty acid composition of turkey meat is shown in Table 21 (50) Ruminant meats
contain a greater percentage of saturated fat compared with the meat of
monogastric animals (6)
2312 Endogenous prooxidative and antioxidative constituents
Endogenous prooxidative constituents in meat systems consist of iron-
containing proteins transition metals and endogenous enzymes The catalytic
effect of iron-containing protein on the oxidative deterioration of PUFA was first
described by Robinson (35) Since then heme catalyzed lipid oxidation has been
studied extensively and it has become a generally accepted phenomenon that
lipid oxidation is accelerated by heme compounds and transition metals in meat
systems
Lipoxygenase peroxidase and microsomal enzymes identified in various
animal tissues catalyze the reaction of PUFA oxidation with the formation of
unconjugated dienes (7) However enzymatic lipid oxidation catalysts are normal
components in blood and consequently are not a primary problem in most
muscle foods (8)
2313 Meat Processing
According to McMillin (33) quality of raw materials time postmortem
extent of heating and comminution or particle size reduction and the ingredients
added are processing factors that can influence the rate of lipid oxidation Even
though lipid oxidation varies among different animal species such species effects
have been inconsistent and may be due to differences in anatomical location
diet environmental temperature sex age phospholipid content body
composition and experimental conditions such as cooking temperature sample
handling and method for assessing lipid oxidation
Heating encourages the development of lipid oxidation by affecting the
distribution of the iron in the muscle food (9) During cooking a variety of
volatiles producing off-odors and flavors are generated as PUFA oxidize (10)
10
Heat quickly decomposes hydroperoxides produced resulting in the production
of desirable flavor in cooked products The shelf-life of meat products is usually
prolonged by frozen storage Under freezing conditions the rate of oxidation can
be reduced but not completely prevented (1)
Lipid oxidation in cooked meat is commonly referred to as warmed-over-
flavor (WOF) WOF often develops within 1-3 days of refrigerated storage and is
characterized by the loss of fresh cooked meat aroma and a simultaneous
increase in undesirable odors which are commonly described as ldquostalerdquo ldquowet
cardboardrdquo ldquopaintyrdquo ldquograssyrdquo or ldquorancidrdquo (11) The most important contributors
to the development of WOF are the secondary oxidative compounds such as
hexanal pentanal and 2 3- octanedione (12) According to Kerler and Grosch
(59) identified (E E)-2 4-decadienal butyric acid and furaneol as key
compounds in fresh boiled chicken aroma while hexenal butyric acid and 1-
octen-3-one were the main compounds in chicken reheated after 48 hours
storage at 4˚C
The tendency of precooked meat products to oxidize has led food
scientists processors and the industries to develop techniques that allow
extended shelf life of these products In addition to antioxidants the appropriate
packaging and proper storage conditions are useful techniques to achieve
extended storage times
2314 Non-meat Additives
Non-meat additives can be prooxidative or antioxidative agents The
addition of salt NaCl commonly used in meat products to add flavor and
functionality at 05-25 (4) is a prooxidant Salt has been shown to accelerate
oxidation in pork patties (13) by enhancing the activity of iron atoms which then
promotes iron-catalyzed oxidation and flavor deterioration (1) Transitions
metals other than iron (copper especially) supplied by the water from
processing equipment andor spices can also promote oxidation (36)
The use of antioxidants synthetic or natural has been used to prevent lipid
oxidation in meat products The addition of nitrites phosphates citric acid
phytic acid and EDTA has been reported to inhibit lipid oxidation in meat
11
products (10 14) In addition synthetic phenolic antioxidants such as butylated
hydroxytoluene (BHT) butylated hydroxyanisol (BHA) tertiary-butylated
hydroquinone (TBHQ) and propyl gallate has been widely used for more than 50
years to inhibit lipid oxidation in meat products (12)
Several water-soluble compounds including ascorbic acid uric acid
cysteine and glutathione are also known to scavenge radicals and delay oxidation
(37) In meat the functions of ascorbic acid include maintenance of cured color
and prevention of off-flavors (15) Ascorbic acid becomes a prooxidant in meat
products at concentrations greater than 300 mgkg (8)
In the last 30 years natural antioxidant use has increased Various plant
materials and extracts containing polyphenolic compounds have been proven to
be effective antioxidants in meat systems Rosemary and rosemary extracts at
concentrations between 002 to 003 are one of the many natural antioxidants
being studied (3 16-18)
232 Measurement of rancidity in meat
Hydroperoxides the primary products of lipid oxidation are colorless
tasteless and odorless It is the breakdown of these peroxides that produce a
complex mixture of low molecular weight volatile compounds including alkanes
alkenes aldehydes ketones alcohols esters and acids many with distinctive
odor and flavor characteristics (19 38) These compounds convey rancid
cardboard oxidized pungent and other off-flavors characteristic of oxidized meat
(39)
Since oxidative decomposition products are of great importance to product
acceptability and nutritional quality a wide variety of assays from subjective
analyses (ie sensory evaluation) to physical and chemical analyses of various
components have been developed to detect and quantify lipid oxidation in foods
However there is no single effective method to measure all the oxidative
products that are generated during lipid oxidation There is no good method
useful for all stages of oxidation An assay can only monitor only a few changes or
specific reactants when applied to a food system under specific conditions
Therefore a combination of assays would be required to monitor the extent of
12
lipid oxidation in most foods It is also common to apply methods that are based
on measuring one of more of the key primary or secondary oxidation products
2321 Peroxide Value
Since the primary product of lipid oxidation are hydroperoxides it is
proper to determine their concentration as one measure of oxidation The
peroxide value (PV) assay represents the total concentration of peroxides and
hydroperoxides present at a certain time in the food product However this test
is restricted by the chemical instability of these compounds after their
concentration reaches a maximum level they decay as a function of temperature
and the presence of other food components particularly transition metals such
as iron and copper (1)
In muscle tissue the lipid is extracted with a mixture of solvents without
decomposition of the hydroperoxides One of the most common extraction
methods was developed by Folch Lees and Stanley (20) Several methods to
determine the PV have been developed that include iodometric titration method
a ferric thiocyanate method and other colorimetric methods (21 40) PV can be
expressed in several units such as meq iodinekg fat (40) or as meq of
peroxidekg fat (45)
2322 Conjugated Dienes
Conjugated diene hydroperoxides (CDs) are one of the primary products of
the oxidation for linoleate (182) and PUFAs with 3 or more double bonds CDs
can be determined quantitatively by their absorbance at 232-234 nm (22) In
meat samples the CD are first extracted from homogenized sample with an
extracting solution such as 31 hexane isopropanol (23 24)
The greater the amount of PUFA in a fat the greater the potential rise in
the CD values However the CD values plateau at a certain concentration at
which the breakdown roughly equals the formation of new CDs At this point in
the oxidation process no additional changes can be measured by the CD assay
(41)
13
httpwwwchemistrydailycomchemistryDiene
2323 Thiobarbituric Acid Reactive Substances (TBARS)
An alternative approach to the determination of the extent of oxidation is
the measurement of selected secondary oxidation products In contrast to the PV
assay those assays are not limited to the early stages of oxidation and may reflect
the formation of volatile products such as carbonyl compounds which actually
contribute to the rancid and objectionable flavor The application of methods
based on this approach requires a detailed knowledge of the chemistry involved
and an understanding of the stability of the compounds assayed etc Among
these methods the thiobarbituric acid test (TBA) is one of the most common in
spite of criticisms of its reproducibility and reliability The test is based on the
color product resulting from the condensation of TBA with malonaldehyde which
is presumably generated in the oxidized fats However a large body of evidence
suggests that other food components can react with TBA to generate the same
chromophore and even the formation of malonaldehyde is dependent on the
composition of the initial lipid (1) For example other products of lipid oxidation
such as alka-2 4-dienals also react with TBA to form a red complex with the
same absorption maximum as the malonaldehyde-TBA complex shown in the
diagram below (42) For this reason Gray suggested that the TBA procedure
should be used to assess the extent of lipid oxidation in general rather than to
quantify malonaldehyde and the term thiobarbituric acid-reactive substances
(TBARS) is now commonly used in place of the TBA number or value (10)
The extent of lipid oxidation is reported as the TBA number or TBA
value and is expressed as milligrams of malonaldehyde equivalents per kilogram
of sample Malonaldehyde is a relatively minor lipid oxidation product formed
14
during the oxidation of polyunsaturated fatty acids and reacts with TBA to
produce a colored complex with an absorption maximum at 530-532 nm
Malonaldehyde has been reported to correlate well with sensory scores of
oxidized flavors in muscle foods (38) This assay is not recommended for
monitoring the extent of oxidation of food oils
httpmnh20wordpresscom20100719518
2324 Sensory Evaluation
A wide range of methods have been used to examine the effects of lipid
oxidation on the quality of stored turkey meat In addition to the chemical or
instrumental techniques sensory evaluation is very useful for assessing the
quality and stability of meat and meat products from lipid oxidation Most of
these analyses such as the PV TBARs CDs or gas chromatographic analysis of
specific volatiles can be correlated to sensory analysis but none of these chemical
or physical analyses can effectively replace the human nose taste buds and
sensory receptors (43)
According to Warner (43) sensory evaluation is a scientific discipline used
to evoke measure analyze and interpret reactions to food and material
characteristics as they are perceived by sense of sight smell taste touch and
hearing Although sensory evaluation can have a low reproducibility relative to
gas chromatography well-trained and experienced sensory panelists operating
under controlled conditions can provide accurate reliable data The American
Meat Science Association (44) has developed standard guidelines for sensory
analyses The AMSA recommendations include sample preparation cooking
methods and procedures facilities preparation and presentation of samples
15
trained sensory panels test forms consumer panels and instrumental
measurement of tenderness
24 Control of Oxidation Antioxidants
Antioxidants are substances that can delay the onset of lipid oxidation and
extend the induction period They must be added as early as possible in the
manufacturing process or to finished food products to be effective in reducing
lipid oxidation Antioxidants cannot reverse the oxidation of rancid food
products Moreover antioxidants are not effective in controlling hydrolytic
rancidity which is enzyme-catalyzed hydrolysis of fats Antioxidants can control
lipid peroxidation in six ways reducing localized O2 concentrations scavenging
species that initiate peroxidation quenching singlet O2 to prevent the formation
of peroxides binding free metal ions (chelating agent) into a form that will not
generate reactive species or decompose lipid peroxides to peroxyl or alkoxyl
radicals peroxide removal and chain breaking to prevent more hydrogen
abstraction from fatty acid side chains (46) There are three types of antioxidants
based on their mechanism (46 47)
241 Type I - Also called the primary or free-radical chain stopper antioxidants
Type I antioxidants inhibit the chain reaction by acting as hydrogen
donors or free-radical acceptors (AH) (46) Compounds in this category stop the
free radical chain reactions by converting the radicals into more stable products
(47) by reacting primarily with ROO and not with R radicals Basically the
mechanism is a competition between ldquothe inhibitor reactionrdquo (46)
ROO + AH ROOH + A
And ldquothe chain propagation reactionsrdquo
ROO + RH ROOH + R
The effectiveness of a primary antioxidant is dependent on several factors
such as activation energy rate constants oxidation-reduction potential ease of
antioxidant loss or destruction and solubility properties (46) Labuza pointed out
that another important characteristic of an efficient antioxidant is that the
16
resulting antioxidant free radical must not itself initiate new free radicals or be
rapidly oxidized by a chain reaction (46) Type I antioxidants are primarily
phenolic compounds such as butylated hydroxytoluene (BHT) and butylated
hydroxyanisole (BHA) (47) and tert-butylhydroquinone (TBHQ) commonly
present in foods These synthetic food additives are permitted to be used alone or
in combination However the antioxidant content of a food containing these
additives must not exceed 002 of the oil or fat content of the food according to
the Code of Federal Regulations (58)
Butylated Hydroxyanisole
Phenolic compounds synthetic or natural are excellent antioxidants since
they possess benzene rings containing hydroxyl groups and are relatively
reactive Phenols produce stable antioxidant radicals A that are sufficiently
unreactive to propagate the chain and compete with the lipid substrate (RH)
which is present at a much greater concentration (46)
A + ROO Non-radical products
A + A Non-radical products
Since synthetic antioxidants such as BHT and BHA have restrictions for
use in food due to their toxicological effects on several species and they are
suspected to be potential carcinogens (48) the search for natural and safe
antioxidants especially those of plant origin has greatly increased in recent
years
17
242 Type II- Secondary antioxidants or Free-radical production preventer
This category includes compounds that reduce the rate of chain initiation
by metal chelation oxygen scavenging or absorption of UV radiation (47) The
common chelating agents include ethylenediamine tetraacetic acid (EDTA) citric
acid and phosphates EDTA is used for chelation of many metals and it can be an
effective oxidation inhibitor in foods especially those with intermediate to high
moisture content but not in protein-type food such as meats which contain
substantial amounts of bound form of transition metals (46) In addition EDTA
does not protect food during heating because it is less stable at higher
temperatures therefore it is restricted to foods held or processed at cool
temperatures (49) Citric acid is especially useful in oils and intermediate
moisture foods (46) Ascorbic acid is commonly used as a food antioxidant due to
its oxygen scavenging and reducing properties (47) it is especially effective when
it is used in combination with iron chelators (46) Polyphosphates are more
effective chelators and antioxidants than monophosphates However their
antioxidant activity could be reduced or eliminated depending on the
components of the food (50)
Maillard reaction products can bind transition metals such as iron and
deactivate singlet oxygen Because of their dark color and low solubility they are
unsuitable for use in fats and oils but they may be used to improve the oxidative
stability of many foods (51)
Other preventive antioxidants include several enzymes such as catalase
(47) and glutathione peroxidase (37) which reduce the generation of free radicals
by decomposing hydrogen peroxide and hydroperoxides respectively
243 Type III- Control of Environment Factors
This category does not refer to compounds added to inhibit lipid oxidation
Rather this category refers to factors such as the reduction of the oxygen
content a decrease in temperature altering the moisture content (46) and
exclusion of light (47) As the temperature increases oxygen becomes less soluble
in lipids and water slightly influencing the rate The rate of oxidation increases
proportionally to the surface of the lipid exposed to air According to Labuza (46)
18
lipid oxidation can be reduced by altering the water activity which can alter the
catalytic activity of metal catalysts At an elevated water activity (awgt 055) the
rate of oxidation can increase possibly due to the increased mobilization of metal
catalysts
Antioxidant synergism has been observed between primary antioxidants
and between antioxidants with different modes of actions This synergistic effect
can substantially reduce the level of antioxidants needed in a food
25 Keluak As A Natural Source of Antioxidant
251 Keluak ndash Introduction
Pangium edule Reinw (Figure 21) is a tall tropical tree that grows mainly
in Micronesia Melanesia and Southeast Asia including Indonesia The
taxonomy of the tree is uncertain and it may also be classified in the
Flacourtiaceae or the Violale According to Abdullah (55) the tree requires many
years to mature and the seeds are therefore most frequently harvested from wild
trees as it is not economically feasible to cultivate the plant The size of a Pangi
tree is characterized as medium to large with large glossy heart-shaped leaves
that are conspicuously veined and long-stemmed The flowers are large and
greenish and the sexes are separate Flowering occurs from September to October
with seed shed likely to occur in December to January However there are
records of seed shed in April to May and July to September This tropical tree is
wild and not well cultivated (55)
The trees start fruiting when they are approximately 10 to 15 years old The
fruit is oval in shape and the size ranging from 12-30 cm (52) or about a size of a
large husked coconut brown and rough-surfaced (55) The tree produces a large
fruit that is poisonous because of the presence of cyanogenic glucosides (53)
Almost all parts of the plant are poisonous including its leaves barks and seed
(52) Although poisonous to humans the seeds of the tree are part of the natural
diet of the babirusa (Babyroussa babyrussa) (53) a pig-like animal native to the
region However the mature fruit is edible and the juice can be applied to sores
and cuts (55)
19
In Indonesia the seed kernel of this tree is edible after treatments
following the removal of the cyanogenic glucosides Keluak is fermented in a
specific way the seeds are harvested and placed in the field for 10 days The seeds
are then removed washed and boiled for 3 hours to remove the cyanide (54)
After cooling the seeds are buried (indoor) in ash banana leaves and earth for
40 days The seed turn from a creamy white color to dark brown or black (51)
The fermented seeds are cleaned and ready to be used as spices (54) image is
shown in Figure 22 In some countries according to Ma (56) after harvesting the
fruits are buried in the ground for ~100 days before the large seeds are removed
the rest of the plant is poisonous The charcoal-colored nuts are braised for one
hour so the soft flesh can be scooped out of the skin The taste is bitter buttery
and a bit like chocolate while the texture is a familiar one - think mashed
potatoes or roasted chestnuts (56)
Taxonomy of Keluak (55)
Kingdom Plantae
Division Magnoliophyta
Species Pedule
Family Acariaceae
Binomial name Pangium edule Reinw ex Blume
Authority Reinward
Synonym names football fruit kluwek Indonesia black nut kepayang
kluwek keluwek kluwak pangi paying picung penarassan seis
According to Andarwulan et al (54) the fermented seed product of this tree
depending upon the origin is called
Indonesian
o Keluak kluwak kluak kluwek keluwek or kloewak (Dutch spelling)
o Pucung or pucing (Sundanese)
o Rawan or rawon (adjective referring to food prepared with the seed of
this tree) (Figure 23)
Malay
o Kepayang
20
o Payang
Philipines
o Samaun-referring to the oil
o Pangi- referring to the tree
Keluak is commonly used as a spicy flavoring in soups in Java and South
Sulawesi several traditional dishes can be made with Keluak seeds including
ldquoRawonrdquo (Figure 23) and ldquoBlack nut with golden snapperrdquo (Figure 24) Keluak is
also a raw material for another product ldquokecap pangirdquo (ldquokecaprdquo is a soy sauce-like
product) and it has been used as a spice in Saparua Maluku Island in Indonesia
Another of the edible products is called ldquoDagerdquo which is a boiled seed after the
removal of kernels and water after soaking for 2-3 days Dage is utilized in West
java as a vegetable (54) In this document I will use the term ldquoKeluakrdquo and ldquopangi
to refer to the fermented seed that is commonly used as a spice
252 Nutritional Profile of Keluak
The nutrition fact of the Keluak seed is shown in Table 22 Generally
phenolic compounds are found in the seeds and other parts of the plant Most
seeds contain large amounts of polyunsaturated oils and phenolic antioxidants
are necessary to protect the polyunsaturated fatty acids in the oil against
autoxidation (50)
The pangi seed contains some secondary metabolites (Table 23) of the
cyanogen glycosides which include the cyanogen glycoside and various
alkaloids flavonoids steroids saponins tannins and quinine These metabolites
are present in both fresh and dried pangi seed (55)
253 Previous work on keluak
Previous research by Fardiaz and Romlah (57) on the fermented seed
indicated that the methanol extract of keluak possessed antioxidant activity
Fardiaz and Romlah found that the addition of Keluak seed extract to cooking oil
could lengthen the oxidation induction period of the oil Their findings are
summarized in the Table 24 and Figure 25
21
Recently Chye and Sim (52) used several different extraction methods on
Keluak seeds and examined the antioxidant activity of the extract Extracts of
Pangium edule Reinw seed were investigated for their antioxidative activity
using DPPH radical scavenging and β-carotene bleaching assays For the
extraction they used a mixture of acetone acetic acid water which yielded the
higher phenolic content of 2222 plusmn005 mg GAEg among the other methods of
extraction and showed the most potent antioxidative acivity in both DPPH radical
scavenging and β-carotene (Figures 26- 27) They found that significant
correlation was observed between the total phenolic content and its antioxidative
activity (r=0878) suggesting that the phenolics of the Keluak extract could be
potential sources of natural antioxidants (52)
22
26 Figures
Figure 21 Pangium Plant
httpwwwpngplantsorgPNGtreesTreeDescriptionsPangium_edule_Reinwhtml httptravelspotcoolstuffcomgourmet-adventureunusual-food5-lethal-
delicious-meals
Figure 22 Keluak Seed
Source Wayang Brand Kluwak Kupas PT Wira Aksara Jakarta Indonesia
Figure 23 A Dish Made With Keluak Seed- Black Beef Soup (Rawon)
httpwwwlestariwebcomresep-indonesiaEnglishRawonphp
23
Figure 24 A Dish made with Keluak Seed- Black Nut with Golden Snapper
httpdelightfultastebudscom20110501rawon-indonesian-beef-black-soup
Figure 25 The Effect of Kluwak Extract on Oxidation Induction Period of Palm Oil (57)
24
Figure 26 DPPH radical scavenging activity () of Keluak seed extracts at different
concentrations (52)
Phenolic (Ace) = phenolic extracted by acetone Phenolic (EtOAc) = Phenolic extracted by ethyl acetate FPA= Free phenolic acid GBPA= Glycoside-bound
phenolic acid Al= Alkaloid
Figure 27 Antioxidative Activity of Keluak Seed Extracts at 20 mgmL measured by β-
carotene bleaching method (52)
Phenolic (Ace) = phenolic extracted by acetone Phenolic (EtOAc) = Phenolic extracted by ethyl acetate FPA= Free phenolic acid GBPA= Glycoside-bound
phenolic acid Al= Alkaloid
25
27 Tables
Table 21 Fatty Acid Composition of Turkey Meat (50)
Table 22 Nutrition Fact of Keluak Seed
Per 100 grams (or 100 mL)
Energy 2428 kj
Protein 15 g
Fat (Total) 50 g
Carbohydrate (Total) 17 g
Sugar 4 g
Dietary Fiber 10 g
Sodium -
Potassium 680 mg
Calcium 0
Vitamin A 0
Vitamin C 0
Iron 0 Source Wayang Brand Kluwak Kupas PT Wira Aksara Jakarta Indonesia
26
Table 23 Anti- Nutritional Factors of Pangium Seed (55)
Anti- Nutritional Factors Dry wt Basis (microgg)
Arsenic NA
Cyanide 1834
Lead 18
Phytic acid NA
Tannin 046
Alkaloid NA
Table 24 The Antioxidative Activity of Kluwak Expressed as Protective Factor (57)
27
28 References
1 Kanner J Rosenthal I An Assessment of Lipid Oxidation in Foods - Technical Report Pure and Applied Chemistry 1992 64 1959-1964
2 Skibsted LH Understanding oxidation processes in foods Woodhead Publ Food Sci Technol Nutr 2011 199 3-35
3 Yu L Scanlin L Wilson J Schmidt G Rosemary extracts as inhibitors of lipid oxidation and color change in cooked turkey products during refrigerated storage J Food Sci 2002 67 582-585
4 Rhee K Anderson L Sams A Lipid oxidation potential of beef chicken and pork J Food Sci 1996 61 8-12
5 Hernandez P Navarro J Toldra F Lipid composition and lipolytic enzyme activities in porcine skeletal muscles with different oxidative pattern Meat Sci 1998 49 1-10
6 Karakok SG Ozogul Y Saler M Ozogul F Proximate Analysis Fatty Acid Profiles and Mineral Contents of Meats a Comparative Study Journal of Muscle Foods 2010 21 210-223
7 Chan K Decker E Endogenous Skeletal-Muscle Antioxidants Crit Rev Food Sci Nutr 1994 34 403-426
8 Decker E Xu Z Minimizing rancidity in muscle foods Food Technol 1998 52 54-59
9 Rojas MC Brewer MS Effect of natural antioxidants on oxidative stability of cooked refrigerated beef and pork J Food Sci 2007 72 S282-S288
10 Gray J Macdonald B Pearson A Morton I Role of Nitrite in Cured Meat Flavor - a Review J Food Prot 1981 44 302-8
11 Brewer M Vega J Detectable Odor Thresholds of Selected Lipid Oxidation Compounds in a Meat Model System J Food Sci 1995 60 592-595
12 St Angelo A Crippen K Dupuy H James C Chemical and Sensory Studies of Antioxidant-Treated Beef J Food Sci 1990 55 1501-1508
13 Buckley D Gray J Asghar A Price J Crackel R Booren A Pearson A Miller E Effects of Dietary Antioxidants and Oxidized Oil on Membranal Lipid Stability and Pork Product Quality J Food Sci 1989 54 1193-1197
14 Guntensperger B Escher F Oxidative Changes of Heat-Sterilized Meat in Trays J Food Sci 1994 59 689-692
28
15 Bauernfeind JC Antioxidant function of L-ascorbic acid in food technology International journal for vitamin and nutrition researchSupplement = Internationale Zeitschrift fur Vitamin- und ErnahrungsforschungSupplement 1985 27 307-333
16 Georgantelis D Blekas G Katikou P Ambrosiadis I Fletouris DJ Effect of rosemary extract chitosan and alpha-tocopherol on lipid oxidation and colour stability during frozen storage of beef burgers Meat Sci 2007 75 256-264
17 Botsoglou NA Govaris A Giannenas I Botsoglou E Papageorgiou G The incorporation of dehydrated rosemary leaves in the rations of turkeys and their impact on the oxidative stability of the produced raw and cooked meat Int J Food Sci Nutr 2007 58 312-320
18 Karpinska-Tymoszczyk M Effect of the addition of ground rosemary on the quality and shelf-life of turkey meatballs during refrigerated storage Br Poult Sci 2008 49 742-750
19 Drumm T Spanier A Changes in the Content of Lipid Autoxidation and Sulfur-Containing-Compounds in Cooked Beef during Storage J Agric Food Chem 1991 39 336-343
20 Folch J Lees M Stanley GHS A Simple Method For The Isolation And Purification Of Total Lipides From Animal Tissues Journal of Biological Chemistry 1957 226 497-509
21 Grau A Codony R Rafecas M Barroeta A Guardiola F Lipid hydroperoxide determination in dark chicken meat through a ferrous oxidation-xylenol orange method J Agric Food Chem 2000 48 4136-4143
22 Dobarganes M Velasco J Analysis of lipid hydroperoxides European Journal of Lipid Science and Technology 2002 104 420-428
23 Juntachote T Berghofer E Siebenhandl S Bauer F The antioxidative properties of Holy basil and Galangal in cooked ground pork Meat Sci 2006 72 446-456
24 Lee M Choi J Choi Y Han D Kim H Shim S Chung H Kim C The antioxidative properties of mustard leaf (Brassica juncea) kimchi extracts on refrigerated raw ground pork meat against lipid oxidation Meat Sci 2010 84 498-504
25 Botsoglou N and Botsoglou E Oxidation in Foods and Beverages and Antioxidant Applications Vol 2 Management in Different Industry Sectors In Decker EA Elias RJ and McClements D J (eds) Oxidation in Foods and Beverages and Antioxidant Applications Vol 2 Management in Different Industry Sectors 2010 200 1-528
29
26 National Chicken Council Per Capita Consumption of Poultry Livestock 1965 to Estimated 2012 in Pounds 2012 Retrieved in January 23 2012 from httpwwwnationalchickencouncilorgabout-the-industrystatisticsper-capita-consumption-of-poultry-and-livestock-1965-to-estimated-2012-in-pounds
27 Bilgili SF Poultry meat processing and marketing- what does the future hold Poult Internat 2002 12-22
28 Nolan N L Bowers J A and Kropf D H Lipid Oxidation and Sensory Analysis of Cooked Pork and Turkey Stored under Modified Atmospheres Journal of Food Science 1989 54 846ndash849
29 Esteacutevez M Morcuende D and Ventanas S Determination of Oxidation Nollet Leo M LToldraacute Fidel (Eds) Handbook of Muscle Foods Analysis Boca Raton CRC Press 2009 221-240
30 Frankel E N Lipid oxidation Prog Lipid Res 1980 19 1ndash22
31 Frankel E N Volatile Lipid Oxidation Products Progress in lipid research 1983 221 1-33
32 Hsieh R J and J E Kinsella Oxidation of Polyunsaturated Fatty Acids Mechanisms Products and Inhibition with Emphasis on Fish Advances in Food and Nutrition Research 1989 Vol 33
33 McMillin K W Initiation of oxidative processes in muscle foods Annual Proceedings of the Reciprocal Meat Conference Am Meat Sci Assoc Chicago IL 1997 49th 53ndash64
34 Monahan FJ Oxidation of lipids in muscle foods fundamental and applied concerns In EA Decker C Faustman and CJ Lopez-Bote (Eds) Antioxidants in Muscle Foods Nutritional Strategies to Improve Quality New York John Wiley and Sons Inc 2000
35 Robinson M E Haemoglobin and methaemoglobin as oxidative catalysts Biochemical Journal 1924 18 255-264
36 Jadhav SJ Nimbalkar SS Kulkarni AD and MadhaviDL Lipid oxidation in biological and food systems In Marcel Dekker (Eds) Food Antioxidants Technological Toxicological and Health Perspectives New York 1996
37 Niki E Antioxidants and relation to lipid oxidation Chemistry and physics of lipids 1987 44 227-300
38 Gray J I and Monahan FJ Measurement of lipid oxidation in meat and meat products Trends Food Sci Technol 1992 3 315-9
30
39 Chang S S and Peterson R J The Basis of Quality in Muscle Foods Recent Developments In The Flavor of Meat Journal of Food Science 1977 42 298ndash305
40 Lea C H Methods for determining peroxide in lipids J Sci Food Agric 1952 3 586ndash594
41 White P J Conjugated diene anisidine value and carbonyl value analysis In Warner K and Eskin N A M (Eds) Methods to Access Quality and Stability of Oils and Fat-Containing Foods Champaign IL AOCS Publishing 1995 159-177
42 Coxon D Measurement of lipid oxidation Food Science and Technology Today 1987 1164-6
43 Warner K Sensory evaluation of oils and fat-containing foods In K Warner and N A M Eskin (Eds) Methods to Access Quality and Stability of Oils and Fat-Containing Foods AOCS Publishing 1995 49
44 AMSA Research Guidelines for cookery sensory evaluation and instrumental tenderness measurements of fresh meat American Meat Science Association-National Live Stock and Meat Board 1995
45 Association of Official Analytical Chemists Official methods of analysis (16th ed) Washington DC Association of Official Analytical Chemists 1995
46 Labuza T P and Dugan L R Kinetics of lipid oxidation in foods C R C Critical Reviews in Food Technology 1971 2 3
47 Gordon MF The mechanism of antioxidant action in vitro In Hudson BJF (Ed) Food Antioxidants London Elsevier Applied Science 1990 1-18
48 Shahidi F Janitha P Wanasundara P Phenolic Antioxidants Crit Rev Food Sci Nutr 1992 32 67-103
49 Roozen JP Effects of types I II and III antioxidants on phospholipid oxidation in a meat model for warmed over flavour Food Chem 1987 24 167-185
50 Pokornyacute J Natural antioxidants for food use Trends in Food Science and Technology 1991 2 223-227
51 Wong W H Buah Keluak National Parks 11 Jan 2007 Retrieved 02 July 2012 from httpenwikipediaorgwikiPangium_edule
52 Chye FY Sim KY Antioxidative and Antibacterial Activities of Pangium edule Seed Extracts International Journal of Pharmacology 2009 5 285-297
31
53 Andarwulan N Fardiaz D Wattimena GA Shetty K Antioxidant activity associated with lipid and phenolic mobilization during seed germination of Pangium edule Reinw J Agric Food Chem 1999 47 3158-3163
54 Andarwulan N Fardiaz S Apriyantono A Hariyadi P Shetty K Mobilization of primary metabolites and phenolics during natural fermentation in seeds of Pangium edule Reinw Process Biochemistry 1999 35 197-204
55 Abdullah Moh A B Phyochemical Composition of Fresh and Cooked of Chesnut (Castanopsis argentea) Pangium (Pangium edule) and Pra (Elateriospermum tapos) Seeds Final Year Project Food Science and Technology in the Faculty of Applied Sciences Universiti Teknologi Mara Malaysia January 2012 Retrieved on July 4 2012 from httpeprintsptaruitmedumy49401MOHD_ASRUL_BIN_ABDULLAH_12_24pdf
56 Ma A A Peranakan favorite is ayam buah keluak Chicken stewed with black nuts at True Blue RestaurantWall Street Journal (Online) New York NY Dec 16 2010 Retrieved July 4 2012 from httpproquestumicompqdwebdid=2214039511ampsid=1ampFmt=3ampclientId=36305ampRQT=309ampVName=PQD
57 Fardiaz D Romlah S Antioxidant activity of picung (Pangium edule Reinw) seed In Development of Food Science and Technology in ASEAN Proceedings of the Fourth ASEAN Food Conference February 17ndash21 1992 ASEAN Jakarta Indonesia 1992 814ndash819
58 Food and Drugs Administration Food Additives Permitted for Direct Addition to Food for Human Consumption Code of Federal Regulations Title 21 pt 172190 2006
59 Kerler J Grosch W Character impact odorants of boiled chicken changes during refrigerated storage and reheating Zeitschrift Fur Lebensmittel-Untersuchung Und-Forschung A-Food Research and Technology 1997 205 232-238
60 Baggio S Vicente E Bragagnolo N Cholesterol oxides cholesterol total lipid and fatty acid composition in turkey meat J Agric Food Chem 2002 50 5981-5986
32
CHAPTER 3 MATERIALS AND METHODS
31 Keluak Antioxidant and Chemicals
Keluak (Kupas Wayang Brandreg Peeled Keluak Nuts PT Wira Aksara
Jakarta Indonesia was manufactured for Empire International East Chief
Privado Ontario CA 91761) Butylated hydroxytoluene (BHT) gallic acid (ACS
reagent) and 2-thiobarbituric acid were obtained from Sigma Chemical
Company St Louis MO USA Sodium chloride (crystal ARreg ACS) was obtained
from Mallinckrodt Baker Inc (Phillipsburg NJ USA)
The reagents used included acetone (Certified ACS) and chloroform (certified
ACS) obtained from Fisher Scientific Fair Lawn NJ USA Acetic acid (Glacial
ACS reagent) was purchased from J T Baker (Center Valley PA 18034 USA)
and Folin Ciocalteursquos phenol reagent (2 N) was purchased from Sigma-Aldrich
(St Louis MO USA)
311 Phenolic Extraction
Keluak seeds were ground into fine pieces using a coffee grinder (Braun
Inc Lynnfield MA USA) The fatty material from the ground seed was removed
first using a method modified from Wettasinghe and Shahidi (1) The ground seed
was washed with n-hexane (16 gg) and placed in a sonicator for 15 minutes
with occasional stirring The mixture was vortexed for 30 secs before it was
centrifuged at 2688 x g for 10 minutes (Sorvallreg Instrument RC-5B Du Pont
Company Wilmington DE USA) The upper fat-soluble layer was discarded
The solid was washed 2 ndash 3 additional times The solids remained at the bottom
after washing The defatted solids were then air-dried overnight under the hood
to remove any solvent residue
Forty grams of dried defatted Keluak seeds were extracted by stirring with
200 mL of solvent (acetone water acetic acid 90 95 05 vvv) at 60degC and
600 rpm for 2 hrs The mixture was then filtered through filter paper (Whatman
1 Buckinghamshire UK) The filtrate was collected and dried at 45degC using a
rotary evaporator until no further weight changes occurred The concentrated
extract was further dried using a vacuum oven at 45degC overnight The extract was
33
collected dissolved in 100 ethanol flushed with Argon gas and stored at -20degC
until further use
312 Total Phenolics content
The total phenolic content was measured using the Folin-Ciocalteu assay
as modified by Waterhouse (13) The phenolic extract was diluted with 100
ethanol to make several dilutions (1100 2100 and 10100) One milliliter of each
dilution was added to a test tube containing 5 mL of deionized water Then 05
mL of 50 Folin-Ciocalteu reagent was added to the test tube The solution was
mixed and allowed to stand for 8 mins at 22degC before adding 1 mL of 5 sodium
carbonate (wv) The mixture was vortexed using a touch mixer (model 231
Fisher Scientific Pittsburgh PA USA) and incubated in the dark for 1 hr The
solution was vortexed a second time before reading the absorption with a UV-
spectrophotometer (Spectronic Genesys 5 spectrophotometer Thermo Electron
Corporation Madison WI USA) at 725 nm against DI water A standard curve
was prepared at the same time with gallic acid at concentrations ranging from 0
to 100 mgL The quantity of total phenolic content in the sample was calculated
as gallic acid equivalents (GAE) from the standard curve using the formula
C = c times (V divide m) where
C is total phenolic content (mg GAEg extract)
c is the concentration of gallic acid obtained from the calibration curve (mgmL)
V is volume of sample (mL)
m is mass of the sample extract (g)
32 Sample Preparation
Ground turkey meat (15 fat Jennie-O Turkey Store Wilmar MN USA)
purchased from a local grocery store at day 0 and was immediately divided into 4
treatments according to the formulation (Table 31) (2 3)
(1) Control- No antioxidant
(2) Commercial antioxidant- 002 BHT (ww of lipid)
(3) Natural antioxidant- 002 Keluak extract (ww of lipid)
34
(4) Natural antioxidant ndash 004 Keluak extract (ww of lipid)
The level of Keluak extract antioxidant used was based on the amount of
fat in each formula Salt was dissolved in water prior to addition to the meat The
water addition was 5 of the ground meat (ww) The antioxidant and salt were
mixed in the liquid first before adding it to the meat by sprinkling while mixing
After the antioxidant salt and liquid addition mixing by hand (wearing gloves)
was continued for 5 mins The meat mixture was prepared into patties of uniform
size (using a cookie cutter diameter= 55 cm thickness= 15 cm) The patties
were cooked in an electrical skillet and temperature was monitored by Digi-
Sensereg Scanning Thermometer (Model 92000-00 Cole Parmer Instrument Co
Barrington IL) using copper-constantin thermocouple wires (Type T Omega
Engineering Inc Stamford CT) to an endpoint temperature of 74degC The cooked
patties were cooled and placed in a single layer on a tray and then overwrapped
in commercial PVC (water vapor transmission rate=15 g100 m224 h oxygen
transmission rate 880 cm3m224 h) and aluminum foil over the wrap The
patties were stored at 2degC in the dark and were assayed for the extent of oxidation
by odor sensory TBARS conjugated dienes and peroxide value analysis at days
0 1 3 5 7 for the first study (2)
In a second separate study a longer storage time study was completed to
examine the effect of antioxidants on the cooked ground turkey over a longer
time period The same procedure for antioxidant addition and meat sample
preparation was used However in the second study the samples were stored for
a total of 15 days (5 6) Samples were collected at days 0 1 3 5 7 10 13 15 for
TBARS conjugated dienes peroxide values and pH determinations
33 Thiobarbituric Acid Reactive Substances (TBARS)
Lipid oxidation was assessed by the 2-thiobarbituric acid (TBA) method of
Tarladgis and others (4) and Yu et al (5) Briefly 10 g of meat was homogenized
with 50 mL of deionized water using a homogenizer (IKAreg T25 digital Ultra-
Turrax Wilmington NC USA) The homogenate was filtered through 1
Whatman paper Five mL of the clear filtrate was mixed with 5 mL TBA reagent
35
containing 002 M TBA in 90 glacial acetic acid The mixture was capped
vortexed for 30 secs and incubated in the dark for 15-18 hrs at room temperature
After the color developed the mixture was measured for absorbance at 532 nm
against a blank (deionized water) The absorbance was converted to TBAR values
using 1133- tetraethoxypropane to prepare a standard curve Triplicates of 10 g
samples were prepared for each treatment TBA value is expressed as mg MDA
kg meat
34 Conjugated Dienes
Conjugated dienes (CD) were determined by the method described by
Juntachote and others (6) with slight modifications A cooked meat sample (05
g) was suspended in 5 mL of deionized water and homogenized using a digital
Ultra-Turrax T25 (IKAreg Wilmington NC USA) to obtain a smooth slurry A 05
mL aliquot of this suspension was mixed with 5 mL of extracting solution
containing hexane and isopropanol (31 vv) and mixed for 1 min using a vortex
mixer After centrifugation at 2000 g for 5 mins the supernatant was collected
and the absorbance of the supernatant was determined at 233 nm The
concentration of conjugated dienes was calculated using a molar extinction
coefficient of 25200 M-1cm-1 and the result were expressed as nmole of
conjugated dienes per mg meat sample
35 Peroxide Value
The peroxide value was determined according to the AOAC method 96533
(Association of Official Analytical Chemists) (13) with a few modifications The
lipids from meat samples were extracted by the method of Kim et al (7) First 5 g
of meat sample was broken into small pieces and placed in a water bath at 60˚C
to melt the fat for 30 mins The meat was extracted with a solution containing
acetic acid chloroform (32) and then filtered with Whatman 1 filter paper A
saturated solution of potassium iodide (KI 05 mL) was added to the filtrate The
solution color changed to yellow and then 30 mL of deionized water was added
The mixture was allowed to let stand at room temperature for at least 5 mins and
the color would turn to pale to bright yellow Before titrating with 001 N of
36
sodium thiosulfate (Na2SO3) 05 mL of 1 starch solution was added (a color
changed occurred - the color turned purple to blue-black) The PV is expressed as
meq O2kg lipid
36 pH value
To determine the pH of the meat samples cooked meat samples (10 g)
were blended with 50 mL deionized water for 15 seconds in a homogenizer
(Ultra-Turrax T25 IKAreg Wilmington NC USA) The pH was measured with a
pH meter (Accumet Basic model AB 15 Fisher Scientific Company) The pH
meter was calibrated daily with standard buffers of pH 40 and 70 at 25˚C
37 Sensory Evaluation
Trained panelists (n=15) were recruited from among University of Illinois
graduate students and staff The panelists were prepared using an extensive
training program During each training session panel members practiced and
discussed the techniques developed for sample presentation score sheet terms
and odor sensory evaluation method A panel leader led the panelists to develop
terms to describe the aroma characteristics of fresh cooked turkey meat including
the aroma characteristics of cooked poultry with or without the added Keluak
extract Panel members were trained regularly for 7 sessions for total of two
weeks to identify and discriminate aroma differences Some of the terms were
derived from reference standards including fresh boiled ground turkey meat
lard oxidized vegetable oil hard-boiled egg and wet cardboard (Table 32) The
panelists agreed on the following aroma descriptors for warm-over-flavor meaty
fatty rancid eggy and cardboardy These descriptors were judged for the
presence and overall intensity using a 15 cm-structured line scale (0 = none 15 =
extreme) along with an anchor value for each respective standard Table 2
showed the form used to evaluate the aroma descriptors described above
Cooked patties were uniformly cut into four pie-shaped wedges and placed
in a sniff bottle (Nalgene Teflon PTFE wash bottle Nalge Company Rochester
NY USA) covered with foil to hide the identity of the sample inside Each sample
represented a treatment labeled with three-digit random numbers and were
37
served at random order during each test session The samples were held in an
incubator (45degCplusmn 1degC) for 30 mins prior to presentation to the panelists The
panelists were asked to clean their palate by chewing a piece of unsalted saltine
crackers and rinse with water prior to evaluating the samples Samples were
sniffed Four samples were evaluated for each test session Roasted coffee beans
were presented for panelists to clear the palate between samples Standard
references were prepared daily The second session replicates of the first session
was conducted one week after the first session
38 Statistical Analysis
Statistical assessment was carried out with the program SAS Data were
analyzed as 4 (treatments) by 5 (days of storage) The results from the TBARs
analysis peroxide value analysis conjugated dienes analysis and the
odorsensory analysis were analyzed using one-way analysis of variance
(ANOVA) Differences were considered significant at the P lt 005 level
Comparison of treatment means was based on Fisherrsquos Least Significant
Difference (LSD)
38
39 Tables
Table 31 Formulation of Cooked Ground Turkey Meat for Each Treatment
TREATMENTS
Control BHT AO 200ppm AO 400ppm
INGREDIENTS
Jenny-O 15 fat Ground Turkey
(g) 650 650 650 650
Salt (2 ww) (g) 13 13 13 13
BHT (002 of total fat) (g) 002
Keluak extract (mL)
2487 (002 g
phenolics)
4974 (004 g
phenolics)
Cold water (mL)5 by sample wt
(ww) 325 325 325 325
Table 32 Descriptive Odor Standards for Refrigerated Ground Turkey Meat
Descriptive Odor term Standard Location on the 15-cm line
Rancid Oxidized vegetable oil in water (1100 vv) 7
Cardboard 1 cm2 cardboard in 15 mL water 85
Eggy Fresh hard-boiled egg white (01 g) 9
Meaty Fresh boiled ground turkey meat in water (15 gv) 8
Fatty Lard (02 g) 9
39
310 References
1 Wettasinghe M Shahidi F Antioxidant and free radical-scavenging properties of ethanolic extracts of defatted borage (Borago officinalis L) seeds Food Chem 1999 67 399-414
2 Vara-Ubol S Bowers J Effect of alpha-tocopherol beta-carotene and sodium tripolyphosphate on lipid oxidation of refrigerated cooked ground turkey and ground pork J Food Sci 2001 66 662-667
3 Hassan O Fan L The anti-oxidation potential of polyphenol extract from cocoa leaves on mechanically deboned chicken meat (MDCM) Lwt-Food Science and Technology 2005 38 315-321
4 Tarladgis B Dugan L Pearson A Chemistry of 2-Thiobarbituric Acid Test for Determination of Oxidative Rancidity in Foods 2 Formation of Tba-Malonaldehyde Complex without Acid-Heat Treatment J Sci Food Agric 1964 15 602-amp
5 Yu L Scanlin L Wilson J Schmidt G Rosemary extracts as inhibitors of lipid oxidation and color change in cooked turkey products during refrigerated storage J Food Sci 2002 67 582-585
6 Juntachote T Berghofer E Siebenhandl S Bauer F The antioxidative properties of Holy basil and Galangal in cooked ground pork Meat Sci 2006 72 446-456
7 Kim YJ Jin SK Park WY Kim BW Joo ST Yang HS The Effect of Garlic Or Onion Marinade on the Lipid Oxidation and Meat Quality of Pork during Cold Storage J Food Qual 2010 33 171-185
8 Chye FY Sim KY Antioxidative and Antibacterial Activities of Pangium edule Seed Extracts International Journal of Pharmacology 2009 5 285-297
9 Kahkonen M Hopia A Vuorela H Rauha J Pihlaja K Kujala T Heinonen M Antioxidant activity of plant extracts containing phenolic compounds J Agric Food Chem 1999 47 3954-3962
10 Jayaprakasha G Selvi T Sakariah K Antibacterial and antioxidant activities of grape (Vitis vinifera) seed extracts Food Res Int 2003 36 117-122
11 Fardiaz D Romlah S Antioxidant Activity of Picung (Pangium edule Reinw) Seed In Development of Food Science and Technology in ASEAN Proceedings of the 4th ASEAN Food Conference Feb 17-21 1992 ASEAN Jakarta Indonesia 1992 12 Waterhouse A L Determination of Total Phenolics Current Protocols in
Food Analytical Chemistry 2002 I111-I118
40
13 Association of Official Analytical Chemists (1995) Official methods of analysis (16th ed) Washington DC Association of Official Analytical Chemists
41
Chapter 4 RESULTS AND DISCUSSION
41 Phenolic Extraction Yield
The phenolic extract yield using acetone water acetic acid (90 95 05)
extraction was 503 plusmn 140 g of extract per 70 g of defatted ground Keluak seed or
007 g phenolic extract per gram of defatted Keluak The samples contained
approximately 719 phenolic compounds by weight the values are equal to the
average plusmn standard deviation of the three replicate analyses This value was
moderately greater than that reported by Chye and Sim (1) which reported a
548 yield The total phenolic content as determined using Folin-Ciocalteau
reagent was 1973 plusmn 203 mg GAEg extract which was also moderately greater
than the result reported by Chye and Sim which was 1639plusmn 004 mg GAEg
extract (1) It is possible that the difference is due to the Keluak source Chye and
Sim obtained their seeds material from local indigenous markets in Kota
Kinabalu Sabah Malaysia (1) while the seeds used in this study were grown in
from Indonesia The geographical and horticultural differences could affect the
phenolic content and concentration of the seed
According to Kahkonen et al (2) different phenolic compounds can have
different responses in the Folin Ciocalteau method depending on their chemical
structure Therefore the antioxidant activity of an extract cannot be predicted
solely on its total phenolic content (3 4)
42 Effect of Keluak Extract and storage time on TBARS values during
refrigerated storage of cooked ground turkey
The TBARS values represent the content of secondary lipid oxidation
products particularly malonaldehyde The carbonyls are primarily responsible
for the production of off-flavors in oxidized meat and meat products Aldehydes
are formed by the oxidation of unsaturated fatty acids They react with the TBA
reagent to form a pink complex (TBA chromogen) with a maximum absorbance
at 532 nm The intensity of this pink color is directly related to the concentration
of the TBA-reactive substances in the original sample The results of the TBARs
analysis for the preliminary study (7 days) and the extended storage study (15
days) are shown in Tables 41a b and Figures 41a b respectively Overall lipid
42
oxidation increased substantially as the refrigerated storage progressed due to
the effects of heating and in combination with storage under aerobic conditions
On the first day of analysis for both the 7 and 15 days storage study all the
antioxidant treated samples (BHT and both concentrations of the Keluak
extracts) the TBARS values were significantly lower than the control an
indication that the antioxidants had a positive effect in suppressing oxidation
Similar findings were observed by Juntachote et al and Teets et al (5 6) TBARS
values for both 7 and 15 days storage study ranges from 035- 475 mg MDA kg
meat which was comparable to other study by Juntachote (5) for 14 days of
storage study of pork meat There were examining the effect other natural
sources of antioxidants on oxidation during refrigerated storage of cooked meat
During the preliminary study (Table 41a) the control and BHT treatments
did not show significant differences (Pgt005) from day 1-7 However both of the
Keluak extract treatments showed a significant (Plt005) effect on the
suppression of the progression of lipid oxidation as compared to the control
(Figure 41a)
On the other hand during the 15 day study all the samples with added
antioxidants had significantly lower TBAR values compared to the control
throughout the entire storage period This indicates that both the commercial
treatment and the treatment with Keluak extracts provided substantial protection
to the meat with respect to lipid oxidation The efficacy of the Keluak extracts to
inhibit lipid oxidation is probably related to their phenolic content The results of
this study showed agreement with those obtained by Fardiaz and Romlah (14)
which stated that the addition of Keluak extract to palm oil lengthened the
oxidation induction period from 22 hours to 50 hours
Lipid oxidation was considerably greater with longer storage times due to
the exposure to oxygen TBARs measure the formation of secondary lipid
oxidation products which contribute to WOF in oxidized meat Heat increases the
release of non-heme iron from the heme pigments a major catalyst for lipid
oxidation in cooked meats (7) Cooking also alters cellular compartmentalization
and exposes membrane phospholipids to molecular oxygen and metal ions (8)
43
resulting in greater amounts of lipid oxidation (9) The addition of antioxidants
during processing cooking or packaging can be done to increase the oxidative
stability of cooked meat (10)
43 Effect of Keluak Extract and Storage Time on Conjugated Diene
Content during Refrigerated Storage of Cooked Ground Turkey
Meat
The development of conjugated dienes (CD) is related to the formation of
hydroperoxides found in the extracted lipids of the cooked ground turkey
Unsaturated fatty acid double bonds occur naturally in a methylene interrupted
structure As meat begins to oxidize the double bonds of these fatty acids are
altered creating conjugated systems which can be measured
spectrophotometrically (6) During lipid peroxidation non-conjugated double
bonds (C=CndashCndashC=C) which are present naturally in unsaturated lipids are
converted to conjugated double bonds (C=CndashC=C) with a large increased in
absorption at 232ndash234 nm (11) In the preliminary study there were no significant differences among the
antioxidant treated sample and the control (Pgt005) except on day 5 (Figure 42a
and Table 42a) The CD value for all the treatments peaked at day 5 and the
samples treated with antioxidants were significantly different that the control
(Plt005)
Meanwhile during the second storage study (Table 42b and Figure 42b)
when the CD values were compared to the control on day 0 and day 1 the 002
BHT and both of the Keluak extract treated samples were not significantly
different (Pgt005) However from day 3 on all the antioxidant-treated samples
had less CD formation than the control (Plt005) The CD content of the control
generally increased especially during the last 5 days (Day 10 13 and 15) of the
study Additionally cooked ground turkey treated with Keluak at 400 ppm had
slightly lower concentrations of conjugated dienes compared to cooked ground
turkey containing Keluak extract at 200 ppm and the commercial antioxidant
(BHT) The trend of CD formation was similar to several other studies (5 6 12
13) They generally observed that the CD concentration for most samples peaked
44
on Day 3 and decreased thereafter This phenomenon of decreased CD is likely
due to the decomposition of the conjugated diene hydroperoxides into secondary
oxidation products over time Conjugated dienes hydroperoxides are expected to
decompose into secondary products as was observed in this study According to
Frankel (15) the formation of conjugated dienes which is related to the
production of hydroperoxides occurs in the early stages of lipid oxidation According to Estevez et al (17) measurement of conjugated dienes (CD) in
meat products containing elevated levels of PUFA is limited depending on the
fatty acid composition of the sample as well as the presence of other non-
hydroperoxides CDs In agreement with Grau et al (18) the TBA test showed a
higher sensitivity with respect to lipid oxidation than did the CD determination
44 Effect of Keluak extract and storage time on peroxide value during
refrigerated storage of cooked ground turkey
Peroxide values (PV) were also used to assess the level of lipid oxidation in
cooked ground turkey during storage at 2˚C (Table 43 and Figure 43) However
while there were differences between the control and samples treated with AOs
on a few days the result of this study showed that treatments had no significant
effect (Pgt005) on the peroxide values compared to the control Generally based
on the results in Table 4 and Figure 4 the PVs increased during storage and
peaked on day 10 At the time it is possible that much of the polyunsaturated
membrane lipids may have been oxidized at that point so that further storage
and oxidation resulted in a decrease in the concentration of peroxides and thus
the PV
The PV differences among the samples did not provide proof that any of
the AOs were effective It is not clear why the PV analysis did not provide any
evidence of AO efficacy According to Estevez (17) the sensitivity of this method
is about 05 miliEquivalentkg of lipid Lower peroxide values cannot be
measured satisfactorily by the AOCS method because of the uncertainty with the
iodometric titration endpoint unless the iodine-starch end is determined
potentiometrically at levels as low as 006 Eqkg lipid The iodometric method is
highly empirical and very small procedural differences can cause variation in the
45
results (19) Two major sources of error in this test could be the liberation of
iodine by air oxidation of the KI and absorption of iodine by fatty acid double
bonds (17)
4 5 Effect of Keluak Extract and storage time on Odor of Refrigerated
Cooked Ground Turkey
No significant interaction (Pgt 005) occurred between antioxidant and
storage time for most of the odor characteristics (Tables and Figures 44-48)
For meaty odor characteristic (Figure and Table 44) the score of all the
treatments over the 7 days of storage did not show significant differences
(Pgt005) The scores ranged from 502 ndash 783 which was slightly below the
freshly boiled turkey meat standard for meaty (which was ranked 8 in the 15-cm
line scale) Therefore the panelists were unable to score and detect the cooked
meat aroma differences in the treated samples relative to the standard reference
The meaty aroma in this study was used to determine if there were possible
masking effects from the AO treatments
For the rancid odor (Figure and Table 45) both of the Keluak treated
samples were perceived as more rancid than both control and BHT after day 1
Overall both of the Keluak treated samples were ranked higher than the control
and BHT which disagrees with the results of TBA test However there was no
significant difference among the treatments between day 3-7 According to Ruth
(20) rancidity as a measure of lipid oxidation is usually best measured by the
concentration of TBARS
The minimum TBA values that corresponds to dark chicken meat samples
that were significantly different in rancid aroma was 1933 μg MDAkg of meat
(21) For consumer acceptability the TBA values must be less than 785 μg of
MDAkg (21) The results from Bou et al (21) were comparable to the results
reported by Gray and Pearson (22) showing that rancid flavor in meats is initially
detected between 500 and 2000 μg of MDAkg of meat In addition OrsquoNeill et
al (23) found that the threshold for WOF detection in cooked dark chicken meat
was at TBA values ge800 μg of MDAkg of meat Since chicken and turkey meat
46
have a comparable PUFA content those values were considered useful in this
experiment On the other hand the odor score for Eggy cardboard and fatty were
statistically not different (Pgt 005) Panelists were unable to detect differences
which could be to different reasons such as that Keluak extract has an aroma
masking effect that confuses the panelists with the ldquooff-odorrdquo The Keluak did
have a slight aroma and it is likely that it masked the effects of storage on lipid
oxidation The aroma of Keluak has been described as bitter dirt-like and
chocolate-like odor (16) This aroma masking could be perceived as undesirable
by the panelists and it might have been mistaken as an off-odor or as an oxidized
sample even though the TBARs and CD data showed otherwise
4 6 Effect of Keluak Extract and storage time on pH of Refrigerated
Cooked Ground Turkey
Table 49 shows the effect of antioxidant treatments in pork muscle on pH
values during storage at 2˚C The values of the pH ranged between 633-668
Generally there are no correlations of pH value among the treatments during
storage The trend for the pH value is inconclusive
47
47 Figures Figure 41a The profile of TBARS in cooked ground turkey treated with various
antioxidants during storage at 2˚C- A Preliminary Study
K200 and K400 represent treatments with Keluak extract at concentration of 200 and 400 ppm respectively
0000
1000
2000
3000
4000
5000
6000
0 2 4 6 8
TBA
RS
(mg
MD
Ak
g m
eat
)
Storage Days
Control
BHT
K200
K400
48
Figure 41b The profile of TBARS in Cooked Ground Turkey Treated with Various Antioxidants During Storage at 2˚C- Extended Storage Time
K200 and K400 represent Keluak extract at concentration of 200 and 400 ppm respectively
Figure 42a Conjugated dienes values of different antioxidant treatments over storage at
2˚C - A Preliminary Study
K200 and K400 represent treatments with Keluak extract at concentration of 200 and 400 ppm
respectively
000
100
200
300
400
500
600
0 5 10 15 20
TBA
RS
(mg
MD
Ak
g m
eat
)
Storage time (days)
Control
BHT 002
K200
K400
0000
0050
0100
0150
0200
0250
0300
0350
0400
0450
0 1 2 3 4 5 6 7 8
Co
nju
gate
d D
ien
es
(nm
ol
mg
me
at)
Days
Control
BHT
K200
K400
49
Figure 42b Conjugated dienes values of different antioxidant treatments over storage at
2˚C- Extended Storage Time
K200 and K400 represent treatments with Keluak extract at concentration of 200 and 400 ppm respectively
Figure 43 Peroxide Value (meq kg meat) of Different Antioxidant treatments over
Storage at 2˚C
K200 and K400 represent treatments with Keluak extract at concentration of 200 and 400 ppm
respectively
000
002
004
006
008
010
012
014
016
0 5 10 15 20
Co
nju
gate
d D
ien
es
(nm
ol
mg
me
at)
Storage (days)
Control
BHT 002
K200
K400
0
05
1
15
2
25
3
35
4
0 2 4 6 8 10 12 14 16
PV
(m
eq
kg
me
at)
Storage Time (Days)
Control
BHT 002
K200
K400
50
Figure 44 Intensity of Meaty Odor Descriptor in Cooked Ground Turkey Meat Treated
with Different Antioxidants Rated in a 15-cm Line Scale
K200 and K400 represent Treatment with Keluak extract at concentration of 200 and 400 ppm
respectively
Figure 45 Intensity of Rancid Odor Descriptor in Cooked Ground Turkey Meat Treated
with Different Antioxidants Rated in a 15-cm Line Scale
K200 and K400 represent Treatment with Keluak extract at concentrations of 200 and 400 ppm
respectively
000
200
400
600
800
1000
1200
0 2 4 6 8
15
cm
Lin
e s
cale
(av
era
ge)
Days
CONTROL
BHT
K200
K400
Linear (BHT)
-100
000
100
200
300
400
500
600
700
800
0 2 4 6 8
15
cm
Lin
e s
cale
(av
era
ge)
Days
Control
BHT
K200
K400
51
Figure 46 Intensity of Eggy Odor Descriptor in Cooked Ground Turkey Meat Treated
with Different Antioxidants Rated in a 15-cm Line Scale
K200 and K400 represent Treatment with Keluak extract at concentrations of 200 and 400 ppm
respectively
Figure 47 Intensity of Cardboard Odor Descriptor in Cooked Ground Turkey Meat
Treated with Different Antioxidants Rated in a 15-cm Line Scale
K200 and K400 represent Treatment with Keluak extract at concentrations of 200 and 400 ppm
respectively
000
100
200
300
400
500
600
700
800
900
1000
0 2 4 6 8
15
cm
Lin
e s
cale
(av
era
ge)
Days
Control
BHT
K200
K400
-1
0
1
2
3
4
5
6
7
0 2 4 6 8
15
cm
Lin
e s
cale
(av
era
ge)
Days
Control
BHT
K200
K400
52
Figure 48 Intensity of Fatty Odor Descriptor in Cooked Ground Turkey Meat Treated
with Different Antioxidants Rated in a 15-cm Line Scale
K200 and K400 represent Treatment with Keluak extract at concentrations of 200 and 400 ppm
respectively
000
100
200
300
400
500
600
700
800
900
0 2 4 6 8
15
cm
Lin
e s
cale
(av
era
ge)
Days
Control
BHT
K200
K400
53
48 Tables
Table 41a TBARS Value of Cooked Ground Turkey Meat Treated with Various Antioxidants during Storage at 2˚C- A Preliminary Study
TBARS (mg MDAkg meat) Average
Storage (Day) Control BHT 002 Keluak 200ppm Keluak 400ppm
0
131plusmn009Aa 094plusmn021Ba 050plusmn004Ca 037plusmn010Ca
1
189plusmn003Aab 161plusmn025Aab 080plusmn006Ba 057plusmn026Bab
3
243plusmn010Ac 236plusmn025Abc 111plusmn022Bab 055plusmn008Cab
5
397plusmn016Ad 319plusmn064Acd 170plusmn025Bbc 108plusmn023Bb
7
473plusmn076Ad 373plusmn074ABd 217plusmn040ACc 101plusmn044Cab
Different letters (A-D) within a row indicates that mean values are significantly different (Plt 005) Different letters within a column (a-d) within the same treatment are significantly different (Plt005)
Table 41b TBARS Value of Cooked Ground Turkey Meat Treated with Various Antioxidants during Storage at 2 ˚C- Extended Storage Time
TBARS (mg MDAkg meat) Average
Storage (day) Control BHT 002 K200 K400
0 129 plusmn 008Ae 091plusmn 004Bcd 065plusmn 015Be 101plusmn 003Cf
1 159plusmn 008Ade 076plusmn 005Cd 083plusmn 012Ce 127plusmn 006Bf
3 220plusmn 011Acd 074plusmn 004Dd 119plusmn 003Cd 160plusmn 004Be
5 258plusmn 014Ac 082plusmn 006Cd 076plusmn 014Ce 150plusmn 004Bd
7 377plusmn 001Ab 109plusmn 002Ccb 158plusmn 006Bc 160plusmn 006Bd
10 405plusmn 061Aab 121plusmn 009Bb 197plusmn 012Bb 195plusmn 009Bc
13 465plusmn 014Aa 151plusmn 004Ca 224plusmn 003Bab 218plusmn 003Bb
15 459plusmn 024Aa 154plusmn 013Da 231plusmn 014Ca 284plusmn 010Ba
Different letters (A-D) within a row indicates that mean values are significantly different (Plt 005) Different letters within a column (a-f) within the same treatment are significantly different (Plt005)
K200 and K400 represent treatments with Keluak extract at concentration of 200 and 400 ppm
respectively
54
Table 42a Conjugated Dienes Concentrations with Antioxidant Treatments and Storage
At 2˚C- A Preliminary Study
Conj Dienes (nmolemg meat)
Storage (Days) Control BHT 002 K200 K400
0 015plusmn003Abc 022plusmn001Aa 013plusmn001Ab 020plusmn008Aa
1 012plusmn001Abc 012plusmn003Ab 011plusmn001Ab 019plusmn001Bab
3 006plusmn000Ac 003plusmn002Ac 002plusmn002Ab 004plusmn002Ab
5 038plusmn000Aa 024plusmn001Ba 027plusmn007ABa 021plusmn001Ba
7 023plusmn008Ab 026plusmn001Aa 029plusmn003Aa 016plusmn001Aab
Different letters (A-C) within a row indicates that mean values are significantly different (Plt 005) Different letters within a column (a-d) within the same treatment are significantly different (Plt005)
K200 and K400 represent treatments with Keluak extract at concentration of 200 and 400 ppm
respectively
Table 42b Conjugated Dienes Concentrations After Antioxidant Treatments and
Storage At 2˚C- Extended Storage Time
Conjugated Dienes (nM mg meat)
Storage (Days) Control BHT 002 K200 K400
0 013plusmn 001Aab 009plusmn000Bab 010plusmn 000Ba 010plusmn 001Ba
1 008plusmn 001Ac 008plusmn 001Ab 008plusmn 000Abc 007plusmn 001Ab
3 011plusmn 000Ab 009plusmn 001Bab 008plusmn 000Bbc 006plusmn 000Cb
5 012plusmn001Ab 008plusmn 001B b 006plusmn 000Bd 006plusmn 000Bb
7 011plusmn001Abc 008plusmn 000B ab 006plusmn 001Bcd 007plusmn 000Bb
10 014plusmn 000Aa 009plusmn 000Bab 009plusmn 001Bab 007plusmn 000Cb
13 014plusmn 001Aa 009plusmn 000Bab 008plusmn 000Bbc 006plusmn 000Cb
15 014plusmn 000Aa 010plusmn 001Ba 008plusmn 001BCbcd 007plusmn 000Cb
Different letters (A-C) within a row indicates that mean values are significantly different (Plt 005) Different letters within a column (a-d) within the same treatment are significantly different (Plt005)
K200 and K400 represent treatments with Keluak extract at concentration of 200 and 400 ppm
respectively
55
Table 43 Peroxide Value (meq kg meat) of Different Antioxidant treatments during
Storage of cooked ground turkey meat at 2˚C
PV (meq kg meat)
Storage (Days) Control BHT 002 K200 K400
0 110plusmn 042Abc 070plusmn 014Ae 080plusmn 028Ad 130plusmn 014Acd
1 230plusmn 014Aab 130plusmn 014Bd 090plusmn 014BCd 070plusmn 014Cd
3 080plusmn 000Ac 070plusmn 014Ae 070plusmn 014Ad 070plusmn 014Ad
5 280plusmn 028Aa 140plusmn 000Bcd 110plusmn 014Bcd 080plusmn 028Bd
7 170plusmn 042Aabc 190plusmn 014Ac 195plusmn 021Abc 225plusmn 049Abc
10 310plusmn 042Aa 330plusmn 014Aa 290plusmn 042Aa 340plusmn 028Aa
13 255plusmn 007Aa 265plusmn 021Ab 240plusmn 028Aab 260plusmn 028Aab
15 255plusmn 064Aa 150plusmn 014ABcd 086plusmn 006Bd 100plusmn 028Bd
Different letters (A-C) within a row indicates that mean values are significantly different (Plt 005) Different letters within a column (a-e) within the same treatment are significantly different (Plt005)
K200 and K400 represent Treatment with Keluak extract at concentrations of 200 and 400 ppm
respectively
Table 44 Intensity of Meaty Odor Descriptor in Cooked Ground Turkey Meat Treated with Different Antioxidants Rated in a 15-cm Line Scale
Storage (Day) Control BHT 002 K200 K400
0 595plusmn250Aa 727plusmn144Aa 632plusmn202Aa 606plusmn189Aa
1 783plusmn208Aa 731plusmn174ABa 543plusmn220Ba 542plusmn294Ba
3 613plusmn201Aa 693plusmn143Aa 502plusmn266Aa 552plusmn228Aa
5 734plusmn277Aa 710plusmn290Aa 474plusmn253Aa 487plusmn263Aa
7 694plusmn296Aa 751plusmn265Aa 532plusmn259Aa 543plusmn236Aa
Different letters (A-C) within a row indicates that mean values are significantly different (Plt 005) Different letters within a column (a-b) within the same treatment are significantly different (Plt005)
K200 and K400 represent Treatment with Keluak extract at concentrations of 200 and 400 ppm
respectively
56
Table 45 Intensity of Rancid Odor Descriptor in Cooked Ground Turkey Meat Treated
with Different Antioxidants Rated in a 15-cm Line Scale
Storage (Day) Control BHT 002 K200 K400
0 228plusmn194Aa 193plusmn175Aa 334plusmn231Aa 350plusmn274Aa
1 177plusmn194Aa 172plusmn163Aa 392plusmn274ABa 426plusmn265Ba
3 260plusmn210Aa 272plusmn265Aa 419plusmn306Aa 337plusmn247Aa
5 344plusmn255Aa 329plusmn215Aa 427plusmn248Aa 395plusmn253Aa
7 408plusmn300Aa 289plusmn244Aa 448plusmn241Aa 385plusmn244Aa
Different letters (A-B) within a row indicates that mean values are significantly different (Plt 005) Different letters within a column (a-b) within the same treatment are significantly different (Plt005)
K200 and K400 represent Treatment with Keluak extract at concentrations of 200 and 400 ppm
respectively
Table 46 Intensity of Eggy Odor Descriptor in Cooked Ground Turkey Meat
Treated with Different Antioxidants Rated in a 15-cm Line Scale
Storage (Day) Control BHT 002 K200 K400
0 643plusmn242Aa 513plusmn244Aa 502plusmn324Aa 565plusmn287Aa
1 597plusmn248Aab 476plusmn321Aa 599plusmn332Aa 584plusmn360Aa
3 345plusmn258Ab 400plusmn270Aa 515plusmn335Aa 509plusmn425Aa
5 364plusmn303Aab 424plusmn320Aa 475plusmn269Aa 469plusmn180Aa
7 473plusmn306Aab 364plusmn210Aa 485plusmn268Aa 431plusmn305Aa
Different letters (A-C) within a row indicates that mean values are significantly different (Plt 005) Different letters within a column (a-e) within the same treatment are significantly different (Plt005)
K200 and K400 represent Treatment with Keluak extract at concentrations of 200 and 400 ppm
respectively
57
Table 47 Intensity of Cardboard Odor Descriptor in Cooked Ground Turkey Meat
Treated with Different Antioxidants Rated in a 15-cm Line Scale
Storage (Day) Control BHT 002 K200 K400
0 299plusmn222Aa 209plusmn182Aa 261plusmn198Aa 312plusmn157Aa
1 262plusmn249Aa 180plusmn192Aa 339plusmn238Aa 342plusmn229Aa
3 299plusmn203Aa 284plusmn254Aa 388plusmn235Aa 287plusmn185Aa
5 252plusmn243Aa 290plusmn190Aa 309plusmn193Aa 320plusmn204Aa
7 301plusmn210Aa 273plusmn253Aa 337plusmn195Aa 284plusmn205Aa
Different letters (A-C) within a row indicates that mean values are significantly different (Plt 005) Different letters within a column (a-e) within the same treatment are significantly different (Plt005)
K200 and K400 represent Treatment with Keluak extract at concentrations of 200 and 400 ppm
respectively
Table 48 Intensity of Fatty Odor Descriptor in Cooked Ground Turkey Meat Treated with Different Antioxidants Rated in a 15-cm Line Scale
Storage (Day) Control BHT 002 K200 K400
0 344plusmn226aA 350plusmn256aA 395plusmn309aA 395plusmn277aA
1 417plusmn285aA 389plusmn230aA 401plusmn345aA 438plusmn287aA
3 388plusmn220aA 378plusmn229aA 396plusmn328aA 403plusmn285aA
5 479plusmn252aA 461plusmn293aA 389plusmn255aA 428plusmn320aA
7 460plusmn288aA 492plusmn286aA 426plusmn281aA 428plusmn340aA
Different letters (A-C) within a row indicates that mean values are significantly different (Plt 005) Different letters within a column (a-e) within the same treatment are significantly different (Plt005)
K200 and K400 represent Treatment with Keluak extract at concentrations of 200 and 400 ppm
respectively
58
Table 49 pH Values of Cooked Ground Turkey Treated with Different
Antioxidants Stored at 2˚C
pH Value
Storage (Day) Control BHT 002 K200 K400
0 665plusmn 002Aab 644plusmn 003Bbc 646plusmn 004Bbc 658plusmn 003Aab
1 659plusmn 003Ab 643plusmn 003Cbc 651plusmn 001Babc 662plusmn 001Aab
3 645plusmn 003Bc 634plusmn 002Cd 643plusmn 004Bc 654plusmn 000Ab
5 663plusmn 002Aab 640plusmn 002Cc 645plusmn 004Cc 654plusmn 002Bb
7 647plusmn 001Ac 633plusmn 003Bc 648plusmn 004Aabc 646plusmn 006Ac
10 665plusmn 001Aab 646plusmn 002Dbc 654plusmn 001Cab 660plusmn 003Bab
13 665plusmn 002Aab 648plusmn 002Cab 655plusmn 002Ba 664plusmn 002Aa
15 668plusmn 001Aa 651plusmn 001Da 655plusmn 001Ca 663plusmn 001Ba
Different letters (A-D) within a row indicates that mean values are significantly different (Plt 005) Different letters within a column (a-c) within the same treatment are significantly different (Plt005)
K200 and K400 represent treatments with Keluak extract at concentrations of 200 and 400 ppm
respectively
59
49 References
1 Chye FY Sim KY Antioxidative and Antibacterial Activities of Pangium edule Seed Extracts International Journal of Pharmacology 2009 5 285-297
2 Kahkonen M Hopia A Vuorela H Rauha J Pihlaja K Kujala T Heinonen M Antioxidant activity of plant extracts containing phenolic compounds J Agric Food Chem 1999 47 3954-3962
3 Jayaprakasha G Selvi T Sakariah K Antibacterial and antioxidant activities of grape (Vitis vinifera) seed extracts Food Res Int 2003 36 117-122
4 Gray J Macdonald B Pearson A Morton I Role of Nitrite in Cured Meat Flavor - a Review J Food Prot 1981 44 302-amp
5 Juntachote T Berghofer E Siebenhandl S Bauer F The antioxidative properties of Holy basil and Galangal in cooked ground pork Meat Sci 2006 72 446-456
6 Teets AS Were LM Inhibition of lipid oxidation in refrigerated and frozen salted raw minced chicken breasts with electron beam irradiated almond skin powder Meat Sci 2008 80 1326-1332
7 Han D McMillin K Godber J Bidner T Younathan M Marshall D Hart L Iron Distribution in Heated Beef and Chicken Muscles J Food Sci 1993 58 697-700
8 Ahn D Wolfe F Sim J Prevention of Lipid Oxidation in Precooked Turkey Meat Patties with Hot Packaging and Antioxidant Combinations J Food Sci 1993 58 283-287
9 Asghar A Gray J Buckley D Pearson A Booren A Perspectives on Warmed-Over Flavor Food Technol 1988 42 102-108
10 Kingston E Monahan F Buckley D Lynch P Lipid oxidation in cooked pork as affected by vitamin E cooking and storage conditions J Food Sci 1998 63 386-389
11 Kulas E Ackman R Different tocopherols and the relationship between two methods for determination of primary oxidation products in fish oil J Agric Food Chem 2001 49 1724-1729
12 Srinivasan S Xiong Y Decker E Inhibition of protein and lipid oxidation in beef heart surimi-like material by antioxidants and combinations of pH NaCl and buffer type in the washing media J Agric Food Chem 1996 44 119-125
13 Lee M Choi J Choi Y Han D Kim H Shim S Chung H Kim C The antioxidative properties of mustard leaf (Brassica juncea) kimchi extracts on
60
refrigerated raw ground pork meat against lipid oxidation Meat Sci 2010 84 498-504
14 Fardiaz D Romlah S Antioxidant Activity of Picung (Pangium edule
Reinw) Seed In Development of Food Science and Technology in ASEAN
Proceedings of the 4th ASEAN Food Conference Feb 17-21 1992 ASEAN
Jakarta Indonesia 1992
15 Frankel E N Lipid oxidation Dundee Scotland The Oily Press Ltd 1998 Vol 10 pp 13ndash41 16 Ma Amy A Peranakan favorite is ayam buah keluak Chicken stewed with black nuts at True Blue Restaurant Wall Street Journal (Online) New York NY Dec 16 2010 Retrieved July 20 2011 from httpproquestumicompqdwebdid=2214039511ampsid=1ampFmt=3ampclientId=36305ampRQT=309ampVName=PQD
17 Esteacutevez M Morcuende D and Ventanas S Determination of Oxidation
Nollet Leo M LToldraacute Fidel (Eds) Handbook of Muscle Foods Analysis Boca
Raton CRC Press 2009 221-240
18 Grau A Codony R Rafecas M Barroeta A Guardiola F Lipid
hydroperoxide determination in dark chicken meat through a ferrous oxidation-
xylenol orange method J Agric Food Chem 2000 48 4136-4143
19 Shahidi F Janitha P Wanasundara P Phenolic Antioxidants Crit Rev Food Sci Nutr 1992 32 67-103
20 Ruth SM Techniques for sampling and identification of volatile compounds contributing to sensory perception In Nollet Leo M LToldraacute Fidel (Eds) Handbook of Muscle Foods Analysis Boca Raton CRC Press 2009 503-523
21 Bou R Guardiola F Grau A Grimpa S Manich A Barroeta A Codony R Influence of dietary fat source alpha-tocopherol and ascorbic acid supplementation on sensory quality of dark chicken meat Poult Sci 2001 80 800-807
22 Gray J I and A M Pearson Rancidity and warmed over flavour In Pearson A M and Dutson T R (Eds) Advances in Meat Research Vol 3 Nostrand-Reinbold Co New York NY 1987 221ndash269 23 OrsquoNeill L M K Galvin P A Morrissey and D J Buckley Comparison of effects of dietary olive oil tallow and vitamin E on the quality of broiler meat and meat products Br Poult Sci 1998 39 365ndash371
61
Chapter 5 CONCLUSION AND FUTURE WORK
The results of the present study indicated that the Keluak extract
incorporated into cooked ground turkey can reduce lipid oxidation The addition
of Keluak extracts at 200 and 400 ppm had a positive effect on reducing the
TBAR values and the conjugated dienes content compared to the control without
added AOs during storage at 2˚C for 15 days The Keluak extract used in this
study was comparable to BHT (002) in reducing lipid oxidation in meat
Peroxide value analysis did not differentiate between the control and the
treatments on the extent of lipid oxidation Due to confusion of the odor
components in the Keluak extracts by the panelists there were no significant
differences between the treatments in the odor sensory evaluation
Keluak seed is a culinary spice with no known toxic effect Its moderate
pungent aroma makes it valued as a traditional ethnic food flavorant in parts of
South East Asia With its substantial phenolic content and antioxidant properties
it could be an effective source of natural antioxidants However the application
of this natural antioxidant might be limited in Western cultures due to its effect
on the color and odor of meat products Further investigations are needed to
identify selective extraction and clean-up techniques that could be used to
eliminate the color and odor problem Other chemical analysis methods that
might provide better information on the extent of oxidation in meat products
include the p-anisidine value Food Oil Sensor (FOS) and Gas chromatography
techniques (GC analysis) of selected volatiles
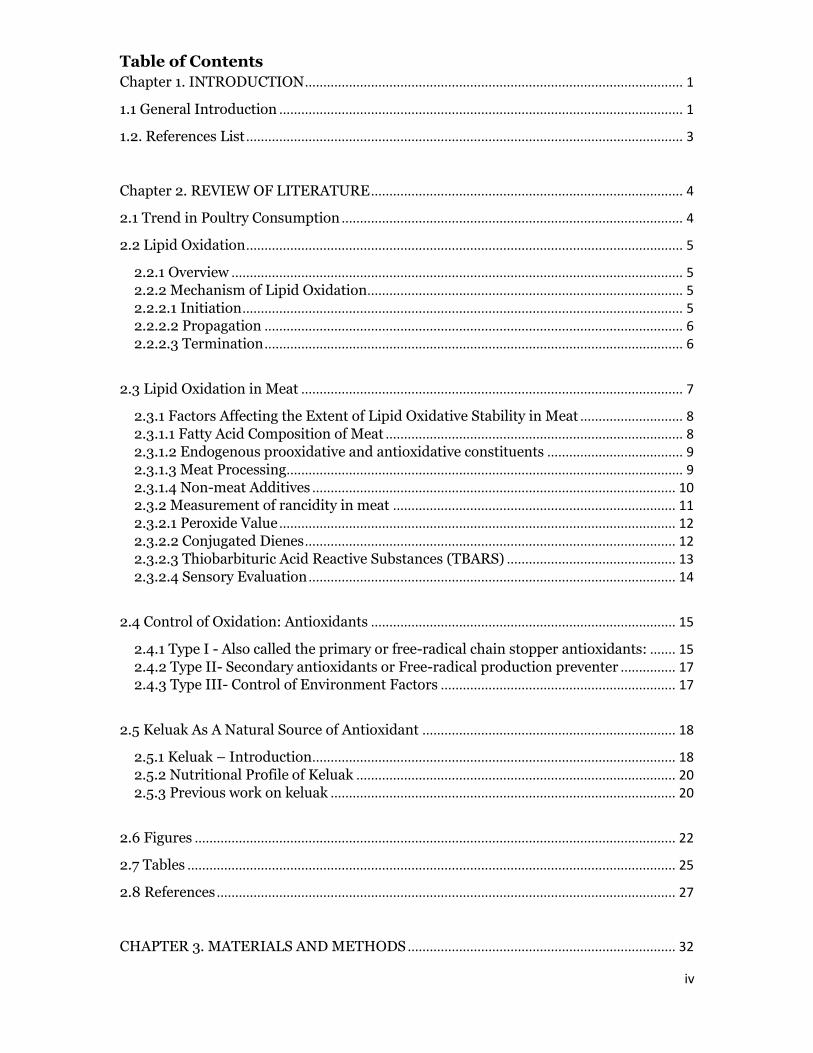
1
Chapter 1 INTRODUCTION
11 General Introduction
Consumer demand for more convenient foods has been increasing rapidly
this includes the demand for precooked meat products Regardless of the major
benefit of consuming poultry meat cooked meat lipid oxidizes over time which
can cause off flavor and odor termed warmed over flavor (WOF) Lipid
hydroperoxides and their breakdown products are the major substances
responsible for the deterioration and undesired flavor in cooked meat products
during storage (1 2) Therefore suppression of lipid oxidation is essential to
improve the quality and stability of precooked meat products
Antioxidant addition has been an effective method to prevent oxidation in
meat products Several synthetic antioxidants including butylated
hydroxytoluene (BHT) butylated hydroxyanisol (BHA) tertiary-butylated
hydroxyquinone (TBHQ) and propyl gallate have been reported to inhibit lipid
oxidation(3 4) The recent increase in the use of natural ingredients has
challenged scientists to discover additional natural source antioxidants The
long-term safety and negative consumer perception of synthetic antioxidants
have been questioned and consumers are increasingly demanding additive-free
or natural sources Antioxidants from several natural sources including honey
(1) rosemary extracts (4) and grape seed extracts (5) were reported to be
effective Recent studies on other natural extracts reported their antioxidant
activity in meats basil and galangal extracts (6) and cocoa powder (7) to name a
few
The fermented seed of Pangium edule Reinw or Keluak possesses
potential antioxidant activity (11) Pangium edule Reinw is a tall tropical tree
that grows primarily in Micronesia including Indonesia Keluak is commonly
used as a spice for soup in some regions in Indonesia Previous studies had
shown that the Keluak extract has antioxidant activity Fardiaz and Romlah (11)
found that the addition of a Keluak seed extract to cooking oil lengthened the
oxidation induction period of the oil Andarwulan et al (8 9) reported that the
total phenolic content in the seeds increased with an increase in the duration of
2
fermentation although the antioxidant activity remained the same Chye and Sim
(10) reported that an acetone extract containing Keluak phenolics had substantial
antioxidant activity as measured by both DPPH radical scavenging and βndash
carotene bleaching assays Keluak seems to be a promising and novel natural
antioxidant source but additional investigations regarding its activity in food
products are needed
The increased consumer focus on natural food ingredients has led to the
search for additional natural sources of antioxidant for reducing oxidation in food
products Several studies on the phenolic constituents in numerous plant sources
have been conducted Keluak could be another possible economical and novel
source of natural antioxidants Even though several studies on the antioxidant
activity of Keluak seeds have been conducted (3- 7) its efficacy in meat products
has not yet been investigated It is important to explore the use of this plant
extract in the meat industry since traditionally it has been used as a spice
flavoring in meat dishes in Southeast Asia Therefore the objective of this
research was to determine the effectiveness of the phenolic extract of Keluak in
cooked ground turkey patties during refrigerated storage
3
12 References List
1 McKibben J Engeseth N Honey as a protective agent against lipid oxidation in ground turkey J Agric Food Chem 2002 50 592-595
2 Oxidation in Foods and Beverages and Antioxidant Applications Vol 2 Management in Different Industry Sectors Oxidation in Foods and Beverages and Antioxidant Applications Vol 2 Management in Different Industry Sectors 2010 200 1-528
3 Khalil A Mansour E Control of lipid oxidation in cooked and uncooked refrigerated carp fillets by antioxidant and packaging combinations J Agric Food Chem 1998 46 1158-1162
4 Yu L Scanlin L Wilson J Schmidt G Rosemary extracts as inhibitors of lipid oxidation and color change in cooked turkey products during refrigerated storage J Food Sci 2002 67 582-585
5 Rojas MC Brewer MS Effect of natural antioxidants on oxidative stability of cooked refrigerated beef and pork J Food Sci 2007 72 S282-S288
6 Juntachote T Berghofer E Siebenhandl S Bauer F The antioxidative properties of Holy basil and Galangal in cooked ground pork Meat Sci 2006 72 446-456
7 Hassan O Fan L The anti-oxidation potential of polyphenol extract from cocoa leaves on mechanically deboned chicken meat (MDCM) Lwt-Food Science and Technology 2005 38 315-321
8 Andarwulan N Fardiaz D Wattimena GA Shetty K Antioxidant activity associated with lipid and phenolic mobilization during seed germination of Pangium edule Reinw J Agric Food Chem 1999 47 3158-3163
9 Andarwulan N Fardiaz S Apriyantono A Hariyadi P Shetty K Mobilization of primary metabolites and phenolics during natural fermentation in seeds of Pangium edule Reinw Process Biochemistry 1999 35 197-204
10 Chye FY Sim KY Antioxidative and Antibacterial Activities of Pangium edule Seed Extracts International Journal of Pharmacology 2009 5 285-297
11 Fardiaz D Romlah S Antioxidant Activity of Picung (Pangium edule Reinw) Seed In Development of Food Science and Technology in ASEAN Proceedings of the 4th ASEAN Food Conference Feb 17-21 1992 ASEAN Jakarta Indonesia 1992
4
Chapter 2 REVIEW OF LITERATURE
21 Trend in Poultry Consumption
Consumption of poultry meat has increased in both developed and
developing countries (25) In the US per capita poultry meat consumption
increased from 79 pounds in 1990 to 954 pounds in 2000 and to just over 100
pounds in 2011 (26) Overall according to the National Chicken Council (6) per
capita consumption of red meat and poultry has not changed significantly but
when beef pork and poultry are examined separately red meat appears to be
losing market share to poultry Chicken and turkey were by far the most widely
consumed poultry species at approximately 822 and 164 pounds per person per
year respectively (26) According to Bilgili (27) it is predicted that poultry will
become the overall meat of choice by 2020
This continued growth and the competitive nature of the poultry industry
has been attributed to a variety of factors such as improvements in intensive
production and processing and development of a wide range of value-added
processed products that meet both direct consumer demand and the rapid
expansion of fast food outlets Poultry products are universally popular because
they are often not subject to cultural or religious constraints and the meat itself is
perceived as wholesome healthy and nutritious since it is relatively low in fat
and it has a more desirable unsaturated fatty acid composition than other meats
Most importantly high quality poultry products are available to many people at
affordable prices even though production costs vary widely around the world
(25) Precooked meat products have attained a high degree of consumer
acceptance because of the relative cost and ease of preparation (28)
Due to the increase in consumption the world production of poultry has
increased the past few decades The industry will remain responsive to consumer
demands both in the range and nature of the products developed although the
focus on quality will continue While the term ldquoqualityrdquo is defined according to
the consumerrsquos own perceptions goals and personal preferences however in
practicality product quality includes scientifically measurable characteristics of
color texture and flavor One main factor limiting the quality and acceptability of
5
meat and meat products is lipid oxidation a process that leads to deterioration of
quality characteristics such as color flavor texture nutritive value and safety
(25) Therefore the meat industry faces a challenge in developing strategies for
preventing lipid oxidation in meat and meat products
22 Lipid Oxidation
221 Overview
A wide variety of organic molecules are susceptible to chemical attack by
oxygen Lipid oxidation can occur in foods containing considerable amounts of
fat (particularly fats containing substantial percentages of unsaturated fatty
acids) including nuts milk and meat products (1) Oxidation of lipids is initiated
by irradiation including exposure to visible light by enzymes and metal catalysts
Heat and pressure will accelerate lipid oxidation (2) Quality attributes of foods
can be substantially affected by this process For instance negative aroma
changes in the food can result from volatile oxidation products the color can
darken as a result of condensation reactions between oxidation products and
proteins and lastly the texture can be modified by the oxidative induction of
protein crosslinks (1) Not unexpectedly the nutritive value and safety can also be
compromised
222 Mechanism of Lipid Oxidation
Lipid autoxidation is a free radical chain reaction that once the
peroxidation process is initiated it proceeds as a free-radical mediated chain
reaction that can be described in terms of initiation propagation and termination
processes (29)
2221 Initiation
R H R + H (1)
An initiator reacts with unsaturated lipids (RH) to form a lipid free radical
(R) (reaction 1) Unsaturated lipids (RH) are easily oxidized by one of several
reactive oxygen species (ROS) which include oxygen radicals and non-radical
derivatives of oxygen (29) such as O2 and OH Poly-unsaturated fatty acids
Initiator
6
(PUFA) are much more susceptible to oxidation than mono-unsaturated fatty
acid (MUFA) (46)
The initiation reaction can include transition metals (ie iron copper)
oxidants various hemolysis-prone substances or enzymes (1) This production of
free radicals can occur because of the direct thermal dissociation (thermolysis) of
hydroperoxides because of transition metal catalysis or exposure to light
(photolysis) with or without the intervention of photosensitizers (30) The
spontaneous abstraction of a hydrogen atom from an organic material by
molecular oxygen is an endothermic reaction which has a large activation energy
and although it might occur to a certain extent this stage is probably too slow to
be of practical importance Either the organic molecule or the oxygen should be
activated before the reaction could take place (1)
2222 Propagation
R + O2 ROO (2)
ROO + RH rarr ROOH + R (3)
An unsaturated lipid contains labile hydrogen(s) that can be abstracted
relatively easily This free radical (R) will react rapidly with molecular oxygen to
produce a peroxyl radical (ROO ) (reaction 2) The newly formed hydroperoxyl
radical can so forth abstract a hydrogen atom from an adjacent unsaturated fatty
acid (reaction 3) and the reaction goes on propagation cycles before termination
(29)
2223 Termination
ROO + ROO rarr non-radical products [ROOOOR] (4)
RO + R rarr ROR
R + R rarr RR
R + ROO rarr ROOR
Termination can occur by condensation of peroxy alkoxy andor alkyl
radicals Peroxy radicals at room temperature can combine to produce peroxy-
linked dimers (ROOR) Alkoxy and alkyl radicals at low oxygen pressure and
7
high temperatures can combine to produce ether-linked dimers (ROR) and
carbon-carbon linked dimers (RR) Alkyl radicals can combine with peroxy
radicals to generate peroxy-linked dimers (ROOR) (30-32)
Hydroperoxides the primary initial products of lipid oxidation can
breakdown as soon as they are formed The decomposition can be catalyzed by
transition metals particularly iron or copper or by elevated temperatures
gt100degC Hydroperoxide decomposition can involve several complex pathways
forming a wide variety of volatile and non-volatile secondary products such as
aldehydes ketones alcohols acids and hydrocarbons which can affect flavor
greatly Some of the volatile aldehydes can be extremely potent and can affect
flavor of food at concentrations less than 1 ppm (31) Another important
termination reaction involves an antioxidant (AH) (30) which will be discussed
later in the chapter
23 Lipid Oxidation in Meat
Meat can oxidize very rapidly post-mortem The rate and degree of lipid
oxidation are affected by factors that include meat composition fatty acid
content processing conditions and chemical additives in the meat products (3)
It is generally agreed that lipid oxidation in muscle foods begins immediately
after slaughter in the highly unsaturated phospholipids fraction in the subcellular
membranes (25) Botsoglou et al (25) added that in most cases fresh meat has an
acceptable stability with respect to oxidation but processing operations such as
freezing and thawing mechanical deboning mincing restructuring the addition
of salt and refrigeration can lead to increased oxidation due to the destruction of
cellular structure and functions
Cooked or pressure-treated meat and meat products can be more
susceptible to oxidation since endogenous antioxidant enzymes may denature
and lose their activities while iron-containing proteins may become a source of
catalytic iron
Poultry meat is particularly susceptible to lipid oxidation due to its high
content of polyunsaturated lipids pigments metal catalysts and various other
8
oxidizing agents (25) This implies that even low-fat poultry meat products are
susceptible to lipid oxidation since fat reduction primarily reflects a reduction in
triacylglycerides while the phospholipid fraction which is high in
polyunsaturated fat is much less affected (34) Another factor is that species
differences in susceptibility to lipid oxidation are largely determined by the level
of poly-unsaturated fatty acid (PUFA) present in meat Thus the extent of lipid
oxidation in cooked meat is directly related to the level of unsaturated fatty lipids
with susceptibility to oxidation decreasing in the order of chicken gt pork gt beef gt
lamb (4) Chicken has fewer tendencies to develop oxidized flavor than turkey
because the higher level of vitamin E in chicken fat retards oxidation Oxidation
proceeds faster in turkey thigh meat than in breast meat as the darker meat
contains more lipid and heme iron (17)
Hydroperoxides formed during lipid peroxidation undergo decomposition
to form secondary oxidation products Those secondary products include volatile
aldehydes ketones acids alcohols and hydrocarbon compounds Aldehydes (ie
hexanal) are one of the primary causes of rancid and stale flavors in precooked
meat products (3)
231 Factors Affecting the Extent of Lipid Oxidative Stability in Meat
There are factors that can affect lipid stability in meat and meat pr0ducts
such as fatty acid composition endogenous prooxidative or antioxidative
components meat processing operations and various additives
2311 Fatty Acid Composition of Meat
It is generally agreed that unsaturated fatty acids (UFA) are responsible
for lipid oxidation in meat Also as the concentration of polyunsaturated fatty
acids (PUFA) increases lipid oxidation increases in muscle foods (4) The amount
of UFA in muscle foods varies depending on the animal species genetic origin
diet sex age at which the animal is slaughtered type of muscle and processing
factors such as fat addition to ground meat (5)
Turkey meat showed low values for total lipid and cholesterol but
greater values than beef pork and lamb for its PUFA content The content of n3
9
fatty acids was the greatest in turkey among meats that included beef pork and
lamb The species is the major source of variation in fatty acid composition The
fatty acid composition of turkey meat is shown in Table 21 (50) Ruminant meats
contain a greater percentage of saturated fat compared with the meat of
monogastric animals (6)
2312 Endogenous prooxidative and antioxidative constituents
Endogenous prooxidative constituents in meat systems consist of iron-
containing proteins transition metals and endogenous enzymes The catalytic
effect of iron-containing protein on the oxidative deterioration of PUFA was first
described by Robinson (35) Since then heme catalyzed lipid oxidation has been
studied extensively and it has become a generally accepted phenomenon that
lipid oxidation is accelerated by heme compounds and transition metals in meat
systems
Lipoxygenase peroxidase and microsomal enzymes identified in various
animal tissues catalyze the reaction of PUFA oxidation with the formation of
unconjugated dienes (7) However enzymatic lipid oxidation catalysts are normal
components in blood and consequently are not a primary problem in most
muscle foods (8)
2313 Meat Processing
According to McMillin (33) quality of raw materials time postmortem
extent of heating and comminution or particle size reduction and the ingredients
added are processing factors that can influence the rate of lipid oxidation Even
though lipid oxidation varies among different animal species such species effects
have been inconsistent and may be due to differences in anatomical location
diet environmental temperature sex age phospholipid content body
composition and experimental conditions such as cooking temperature sample
handling and method for assessing lipid oxidation
Heating encourages the development of lipid oxidation by affecting the
distribution of the iron in the muscle food (9) During cooking a variety of
volatiles producing off-odors and flavors are generated as PUFA oxidize (10)
10
Heat quickly decomposes hydroperoxides produced resulting in the production
of desirable flavor in cooked products The shelf-life of meat products is usually
prolonged by frozen storage Under freezing conditions the rate of oxidation can
be reduced but not completely prevented (1)
Lipid oxidation in cooked meat is commonly referred to as warmed-over-
flavor (WOF) WOF often develops within 1-3 days of refrigerated storage and is
characterized by the loss of fresh cooked meat aroma and a simultaneous
increase in undesirable odors which are commonly described as ldquostalerdquo ldquowet
cardboardrdquo ldquopaintyrdquo ldquograssyrdquo or ldquorancidrdquo (11) The most important contributors
to the development of WOF are the secondary oxidative compounds such as
hexanal pentanal and 2 3- octanedione (12) According to Kerler and Grosch
(59) identified (E E)-2 4-decadienal butyric acid and furaneol as key
compounds in fresh boiled chicken aroma while hexenal butyric acid and 1-
octen-3-one were the main compounds in chicken reheated after 48 hours
storage at 4˚C
The tendency of precooked meat products to oxidize has led food
scientists processors and the industries to develop techniques that allow
extended shelf life of these products In addition to antioxidants the appropriate
packaging and proper storage conditions are useful techniques to achieve
extended storage times
2314 Non-meat Additives
Non-meat additives can be prooxidative or antioxidative agents The
addition of salt NaCl commonly used in meat products to add flavor and
functionality at 05-25 (4) is a prooxidant Salt has been shown to accelerate
oxidation in pork patties (13) by enhancing the activity of iron atoms which then
promotes iron-catalyzed oxidation and flavor deterioration (1) Transitions
metals other than iron (copper especially) supplied by the water from
processing equipment andor spices can also promote oxidation (36)
The use of antioxidants synthetic or natural has been used to prevent lipid
oxidation in meat products The addition of nitrites phosphates citric acid
phytic acid and EDTA has been reported to inhibit lipid oxidation in meat
11
products (10 14) In addition synthetic phenolic antioxidants such as butylated
hydroxytoluene (BHT) butylated hydroxyanisol (BHA) tertiary-butylated
hydroquinone (TBHQ) and propyl gallate has been widely used for more than 50
years to inhibit lipid oxidation in meat products (12)
Several water-soluble compounds including ascorbic acid uric acid
cysteine and glutathione are also known to scavenge radicals and delay oxidation
(37) In meat the functions of ascorbic acid include maintenance of cured color
and prevention of off-flavors (15) Ascorbic acid becomes a prooxidant in meat
products at concentrations greater than 300 mgkg (8)
In the last 30 years natural antioxidant use has increased Various plant
materials and extracts containing polyphenolic compounds have been proven to
be effective antioxidants in meat systems Rosemary and rosemary extracts at
concentrations between 002 to 003 are one of the many natural antioxidants
being studied (3 16-18)
232 Measurement of rancidity in meat
Hydroperoxides the primary products of lipid oxidation are colorless
tasteless and odorless It is the breakdown of these peroxides that produce a
complex mixture of low molecular weight volatile compounds including alkanes
alkenes aldehydes ketones alcohols esters and acids many with distinctive
odor and flavor characteristics (19 38) These compounds convey rancid
cardboard oxidized pungent and other off-flavors characteristic of oxidized meat
(39)
Since oxidative decomposition products are of great importance to product
acceptability and nutritional quality a wide variety of assays from subjective
analyses (ie sensory evaluation) to physical and chemical analyses of various
components have been developed to detect and quantify lipid oxidation in foods
However there is no single effective method to measure all the oxidative
products that are generated during lipid oxidation There is no good method
useful for all stages of oxidation An assay can only monitor only a few changes or
specific reactants when applied to a food system under specific conditions
Therefore a combination of assays would be required to monitor the extent of
12
lipid oxidation in most foods It is also common to apply methods that are based
on measuring one of more of the key primary or secondary oxidation products
2321 Peroxide Value
Since the primary product of lipid oxidation are hydroperoxides it is
proper to determine their concentration as one measure of oxidation The
peroxide value (PV) assay represents the total concentration of peroxides and
hydroperoxides present at a certain time in the food product However this test
is restricted by the chemical instability of these compounds after their
concentration reaches a maximum level they decay as a function of temperature
and the presence of other food components particularly transition metals such
as iron and copper (1)
In muscle tissue the lipid is extracted with a mixture of solvents without
decomposition of the hydroperoxides One of the most common extraction
methods was developed by Folch Lees and Stanley (20) Several methods to
determine the PV have been developed that include iodometric titration method
a ferric thiocyanate method and other colorimetric methods (21 40) PV can be
expressed in several units such as meq iodinekg fat (40) or as meq of
peroxidekg fat (45)
2322 Conjugated Dienes
Conjugated diene hydroperoxides (CDs) are one of the primary products of
the oxidation for linoleate (182) and PUFAs with 3 or more double bonds CDs
can be determined quantitatively by their absorbance at 232-234 nm (22) In
meat samples the CD are first extracted from homogenized sample with an
extracting solution such as 31 hexane isopropanol (23 24)
The greater the amount of PUFA in a fat the greater the potential rise in
the CD values However the CD values plateau at a certain concentration at
which the breakdown roughly equals the formation of new CDs At this point in
the oxidation process no additional changes can be measured by the CD assay
(41)
13
httpwwwchemistrydailycomchemistryDiene
2323 Thiobarbituric Acid Reactive Substances (TBARS)
An alternative approach to the determination of the extent of oxidation is
the measurement of selected secondary oxidation products In contrast to the PV
assay those assays are not limited to the early stages of oxidation and may reflect
the formation of volatile products such as carbonyl compounds which actually
contribute to the rancid and objectionable flavor The application of methods
based on this approach requires a detailed knowledge of the chemistry involved
and an understanding of the stability of the compounds assayed etc Among
these methods the thiobarbituric acid test (TBA) is one of the most common in
spite of criticisms of its reproducibility and reliability The test is based on the
color product resulting from the condensation of TBA with malonaldehyde which
is presumably generated in the oxidized fats However a large body of evidence
suggests that other food components can react with TBA to generate the same
chromophore and even the formation of malonaldehyde is dependent on the
composition of the initial lipid (1) For example other products of lipid oxidation
such as alka-2 4-dienals also react with TBA to form a red complex with the
same absorption maximum as the malonaldehyde-TBA complex shown in the
diagram below (42) For this reason Gray suggested that the TBA procedure
should be used to assess the extent of lipid oxidation in general rather than to
quantify malonaldehyde and the term thiobarbituric acid-reactive substances
(TBARS) is now commonly used in place of the TBA number or value (10)
The extent of lipid oxidation is reported as the TBA number or TBA
value and is expressed as milligrams of malonaldehyde equivalents per kilogram
of sample Malonaldehyde is a relatively minor lipid oxidation product formed
14
during the oxidation of polyunsaturated fatty acids and reacts with TBA to
produce a colored complex with an absorption maximum at 530-532 nm
Malonaldehyde has been reported to correlate well with sensory scores of
oxidized flavors in muscle foods (38) This assay is not recommended for
monitoring the extent of oxidation of food oils
httpmnh20wordpresscom20100719518
2324 Sensory Evaluation
A wide range of methods have been used to examine the effects of lipid
oxidation on the quality of stored turkey meat In addition to the chemical or
instrumental techniques sensory evaluation is very useful for assessing the
quality and stability of meat and meat products from lipid oxidation Most of
these analyses such as the PV TBARs CDs or gas chromatographic analysis of
specific volatiles can be correlated to sensory analysis but none of these chemical
or physical analyses can effectively replace the human nose taste buds and
sensory receptors (43)
According to Warner (43) sensory evaluation is a scientific discipline used
to evoke measure analyze and interpret reactions to food and material
characteristics as they are perceived by sense of sight smell taste touch and
hearing Although sensory evaluation can have a low reproducibility relative to
gas chromatography well-trained and experienced sensory panelists operating
under controlled conditions can provide accurate reliable data The American
Meat Science Association (44) has developed standard guidelines for sensory
analyses The AMSA recommendations include sample preparation cooking
methods and procedures facilities preparation and presentation of samples
15
trained sensory panels test forms consumer panels and instrumental
measurement of tenderness
24 Control of Oxidation Antioxidants
Antioxidants are substances that can delay the onset of lipid oxidation and
extend the induction period They must be added as early as possible in the
manufacturing process or to finished food products to be effective in reducing
lipid oxidation Antioxidants cannot reverse the oxidation of rancid food
products Moreover antioxidants are not effective in controlling hydrolytic
rancidity which is enzyme-catalyzed hydrolysis of fats Antioxidants can control
lipid peroxidation in six ways reducing localized O2 concentrations scavenging
species that initiate peroxidation quenching singlet O2 to prevent the formation
of peroxides binding free metal ions (chelating agent) into a form that will not
generate reactive species or decompose lipid peroxides to peroxyl or alkoxyl
radicals peroxide removal and chain breaking to prevent more hydrogen
abstraction from fatty acid side chains (46) There are three types of antioxidants
based on their mechanism (46 47)
241 Type I - Also called the primary or free-radical chain stopper antioxidants
Type I antioxidants inhibit the chain reaction by acting as hydrogen
donors or free-radical acceptors (AH) (46) Compounds in this category stop the
free radical chain reactions by converting the radicals into more stable products
(47) by reacting primarily with ROO and not with R radicals Basically the
mechanism is a competition between ldquothe inhibitor reactionrdquo (46)
ROO + AH ROOH + A
And ldquothe chain propagation reactionsrdquo
ROO + RH ROOH + R
The effectiveness of a primary antioxidant is dependent on several factors
such as activation energy rate constants oxidation-reduction potential ease of
antioxidant loss or destruction and solubility properties (46) Labuza pointed out
that another important characteristic of an efficient antioxidant is that the
16
resulting antioxidant free radical must not itself initiate new free radicals or be
rapidly oxidized by a chain reaction (46) Type I antioxidants are primarily
phenolic compounds such as butylated hydroxytoluene (BHT) and butylated
hydroxyanisole (BHA) (47) and tert-butylhydroquinone (TBHQ) commonly
present in foods These synthetic food additives are permitted to be used alone or
in combination However the antioxidant content of a food containing these
additives must not exceed 002 of the oil or fat content of the food according to
the Code of Federal Regulations (58)
Butylated Hydroxyanisole
Phenolic compounds synthetic or natural are excellent antioxidants since
they possess benzene rings containing hydroxyl groups and are relatively
reactive Phenols produce stable antioxidant radicals A that are sufficiently
unreactive to propagate the chain and compete with the lipid substrate (RH)
which is present at a much greater concentration (46)
A + ROO Non-radical products
A + A Non-radical products
Since synthetic antioxidants such as BHT and BHA have restrictions for
use in food due to their toxicological effects on several species and they are
suspected to be potential carcinogens (48) the search for natural and safe
antioxidants especially those of plant origin has greatly increased in recent
years
17
242 Type II- Secondary antioxidants or Free-radical production preventer
This category includes compounds that reduce the rate of chain initiation
by metal chelation oxygen scavenging or absorption of UV radiation (47) The
common chelating agents include ethylenediamine tetraacetic acid (EDTA) citric
acid and phosphates EDTA is used for chelation of many metals and it can be an
effective oxidation inhibitor in foods especially those with intermediate to high
moisture content but not in protein-type food such as meats which contain
substantial amounts of bound form of transition metals (46) In addition EDTA
does not protect food during heating because it is less stable at higher
temperatures therefore it is restricted to foods held or processed at cool
temperatures (49) Citric acid is especially useful in oils and intermediate
moisture foods (46) Ascorbic acid is commonly used as a food antioxidant due to
its oxygen scavenging and reducing properties (47) it is especially effective when
it is used in combination with iron chelators (46) Polyphosphates are more
effective chelators and antioxidants than monophosphates However their
antioxidant activity could be reduced or eliminated depending on the
components of the food (50)
Maillard reaction products can bind transition metals such as iron and
deactivate singlet oxygen Because of their dark color and low solubility they are
unsuitable for use in fats and oils but they may be used to improve the oxidative
stability of many foods (51)
Other preventive antioxidants include several enzymes such as catalase
(47) and glutathione peroxidase (37) which reduce the generation of free radicals
by decomposing hydrogen peroxide and hydroperoxides respectively
243 Type III- Control of Environment Factors
This category does not refer to compounds added to inhibit lipid oxidation
Rather this category refers to factors such as the reduction of the oxygen
content a decrease in temperature altering the moisture content (46) and
exclusion of light (47) As the temperature increases oxygen becomes less soluble
in lipids and water slightly influencing the rate The rate of oxidation increases
proportionally to the surface of the lipid exposed to air According to Labuza (46)
18
lipid oxidation can be reduced by altering the water activity which can alter the
catalytic activity of metal catalysts At an elevated water activity (awgt 055) the
rate of oxidation can increase possibly due to the increased mobilization of metal
catalysts
Antioxidant synergism has been observed between primary antioxidants
and between antioxidants with different modes of actions This synergistic effect
can substantially reduce the level of antioxidants needed in a food
25 Keluak As A Natural Source of Antioxidant
251 Keluak ndash Introduction
Pangium edule Reinw (Figure 21) is a tall tropical tree that grows mainly
in Micronesia Melanesia and Southeast Asia including Indonesia The
taxonomy of the tree is uncertain and it may also be classified in the
Flacourtiaceae or the Violale According to Abdullah (55) the tree requires many
years to mature and the seeds are therefore most frequently harvested from wild
trees as it is not economically feasible to cultivate the plant The size of a Pangi
tree is characterized as medium to large with large glossy heart-shaped leaves
that are conspicuously veined and long-stemmed The flowers are large and
greenish and the sexes are separate Flowering occurs from September to October
with seed shed likely to occur in December to January However there are
records of seed shed in April to May and July to September This tropical tree is
wild and not well cultivated (55)
The trees start fruiting when they are approximately 10 to 15 years old The
fruit is oval in shape and the size ranging from 12-30 cm (52) or about a size of a
large husked coconut brown and rough-surfaced (55) The tree produces a large
fruit that is poisonous because of the presence of cyanogenic glucosides (53)
Almost all parts of the plant are poisonous including its leaves barks and seed
(52) Although poisonous to humans the seeds of the tree are part of the natural
diet of the babirusa (Babyroussa babyrussa) (53) a pig-like animal native to the
region However the mature fruit is edible and the juice can be applied to sores
and cuts (55)
19
In Indonesia the seed kernel of this tree is edible after treatments
following the removal of the cyanogenic glucosides Keluak is fermented in a
specific way the seeds are harvested and placed in the field for 10 days The seeds
are then removed washed and boiled for 3 hours to remove the cyanide (54)
After cooling the seeds are buried (indoor) in ash banana leaves and earth for
40 days The seed turn from a creamy white color to dark brown or black (51)
The fermented seeds are cleaned and ready to be used as spices (54) image is
shown in Figure 22 In some countries according to Ma (56) after harvesting the
fruits are buried in the ground for ~100 days before the large seeds are removed
the rest of the plant is poisonous The charcoal-colored nuts are braised for one
hour so the soft flesh can be scooped out of the skin The taste is bitter buttery
and a bit like chocolate while the texture is a familiar one - think mashed
potatoes or roasted chestnuts (56)
Taxonomy of Keluak (55)
Kingdom Plantae
Division Magnoliophyta
Species Pedule
Family Acariaceae
Binomial name Pangium edule Reinw ex Blume
Authority Reinward
Synonym names football fruit kluwek Indonesia black nut kepayang
kluwek keluwek kluwak pangi paying picung penarassan seis
According to Andarwulan et al (54) the fermented seed product of this tree
depending upon the origin is called
Indonesian
o Keluak kluwak kluak kluwek keluwek or kloewak (Dutch spelling)
o Pucung or pucing (Sundanese)
o Rawan or rawon (adjective referring to food prepared with the seed of
this tree) (Figure 23)
Malay
o Kepayang
20
o Payang
Philipines
o Samaun-referring to the oil
o Pangi- referring to the tree
Keluak is commonly used as a spicy flavoring in soups in Java and South
Sulawesi several traditional dishes can be made with Keluak seeds including
ldquoRawonrdquo (Figure 23) and ldquoBlack nut with golden snapperrdquo (Figure 24) Keluak is
also a raw material for another product ldquokecap pangirdquo (ldquokecaprdquo is a soy sauce-like
product) and it has been used as a spice in Saparua Maluku Island in Indonesia
Another of the edible products is called ldquoDagerdquo which is a boiled seed after the
removal of kernels and water after soaking for 2-3 days Dage is utilized in West
java as a vegetable (54) In this document I will use the term ldquoKeluakrdquo and ldquopangi
to refer to the fermented seed that is commonly used as a spice
252 Nutritional Profile of Keluak
The nutrition fact of the Keluak seed is shown in Table 22 Generally
phenolic compounds are found in the seeds and other parts of the plant Most
seeds contain large amounts of polyunsaturated oils and phenolic antioxidants
are necessary to protect the polyunsaturated fatty acids in the oil against
autoxidation (50)
The pangi seed contains some secondary metabolites (Table 23) of the
cyanogen glycosides which include the cyanogen glycoside and various
alkaloids flavonoids steroids saponins tannins and quinine These metabolites
are present in both fresh and dried pangi seed (55)
253 Previous work on keluak
Previous research by Fardiaz and Romlah (57) on the fermented seed
indicated that the methanol extract of keluak possessed antioxidant activity
Fardiaz and Romlah found that the addition of Keluak seed extract to cooking oil
could lengthen the oxidation induction period of the oil Their findings are
summarized in the Table 24 and Figure 25
21
Recently Chye and Sim (52) used several different extraction methods on
Keluak seeds and examined the antioxidant activity of the extract Extracts of
Pangium edule Reinw seed were investigated for their antioxidative activity
using DPPH radical scavenging and β-carotene bleaching assays For the
extraction they used a mixture of acetone acetic acid water which yielded the
higher phenolic content of 2222 plusmn005 mg GAEg among the other methods of
extraction and showed the most potent antioxidative acivity in both DPPH radical
scavenging and β-carotene (Figures 26- 27) They found that significant
correlation was observed between the total phenolic content and its antioxidative
activity (r=0878) suggesting that the phenolics of the Keluak extract could be
potential sources of natural antioxidants (52)
22
26 Figures
Figure 21 Pangium Plant
httpwwwpngplantsorgPNGtreesTreeDescriptionsPangium_edule_Reinwhtml httptravelspotcoolstuffcomgourmet-adventureunusual-food5-lethal-
delicious-meals
Figure 22 Keluak Seed
Source Wayang Brand Kluwak Kupas PT Wira Aksara Jakarta Indonesia
Figure 23 A Dish Made With Keluak Seed- Black Beef Soup (Rawon)
httpwwwlestariwebcomresep-indonesiaEnglishRawonphp
23
Figure 24 A Dish made with Keluak Seed- Black Nut with Golden Snapper
httpdelightfultastebudscom20110501rawon-indonesian-beef-black-soup
Figure 25 The Effect of Kluwak Extract on Oxidation Induction Period of Palm Oil (57)
24
Figure 26 DPPH radical scavenging activity () of Keluak seed extracts at different
concentrations (52)
Phenolic (Ace) = phenolic extracted by acetone Phenolic (EtOAc) = Phenolic extracted by ethyl acetate FPA= Free phenolic acid GBPA= Glycoside-bound
phenolic acid Al= Alkaloid
Figure 27 Antioxidative Activity of Keluak Seed Extracts at 20 mgmL measured by β-
carotene bleaching method (52)
Phenolic (Ace) = phenolic extracted by acetone Phenolic (EtOAc) = Phenolic extracted by ethyl acetate FPA= Free phenolic acid GBPA= Glycoside-bound
phenolic acid Al= Alkaloid
25
27 Tables
Table 21 Fatty Acid Composition of Turkey Meat (50)
Table 22 Nutrition Fact of Keluak Seed
Per 100 grams (or 100 mL)
Energy 2428 kj
Protein 15 g
Fat (Total) 50 g
Carbohydrate (Total) 17 g
Sugar 4 g
Dietary Fiber 10 g
Sodium -
Potassium 680 mg
Calcium 0
Vitamin A 0
Vitamin C 0
Iron 0 Source Wayang Brand Kluwak Kupas PT Wira Aksara Jakarta Indonesia
26
Table 23 Anti- Nutritional Factors of Pangium Seed (55)
Anti- Nutritional Factors Dry wt Basis (microgg)
Arsenic NA
Cyanide 1834
Lead 18
Phytic acid NA
Tannin 046
Alkaloid NA
Table 24 The Antioxidative Activity of Kluwak Expressed as Protective Factor (57)
27
28 References
1 Kanner J Rosenthal I An Assessment of Lipid Oxidation in Foods - Technical Report Pure and Applied Chemistry 1992 64 1959-1964
2 Skibsted LH Understanding oxidation processes in foods Woodhead Publ Food Sci Technol Nutr 2011 199 3-35
3 Yu L Scanlin L Wilson J Schmidt G Rosemary extracts as inhibitors of lipid oxidation and color change in cooked turkey products during refrigerated storage J Food Sci 2002 67 582-585
4 Rhee K Anderson L Sams A Lipid oxidation potential of beef chicken and pork J Food Sci 1996 61 8-12
5 Hernandez P Navarro J Toldra F Lipid composition and lipolytic enzyme activities in porcine skeletal muscles with different oxidative pattern Meat Sci 1998 49 1-10
6 Karakok SG Ozogul Y Saler M Ozogul F Proximate Analysis Fatty Acid Profiles and Mineral Contents of Meats a Comparative Study Journal of Muscle Foods 2010 21 210-223
7 Chan K Decker E Endogenous Skeletal-Muscle Antioxidants Crit Rev Food Sci Nutr 1994 34 403-426
8 Decker E Xu Z Minimizing rancidity in muscle foods Food Technol 1998 52 54-59
9 Rojas MC Brewer MS Effect of natural antioxidants on oxidative stability of cooked refrigerated beef and pork J Food Sci 2007 72 S282-S288
10 Gray J Macdonald B Pearson A Morton I Role of Nitrite in Cured Meat Flavor - a Review J Food Prot 1981 44 302-8
11 Brewer M Vega J Detectable Odor Thresholds of Selected Lipid Oxidation Compounds in a Meat Model System J Food Sci 1995 60 592-595
12 St Angelo A Crippen K Dupuy H James C Chemical and Sensory Studies of Antioxidant-Treated Beef J Food Sci 1990 55 1501-1508
13 Buckley D Gray J Asghar A Price J Crackel R Booren A Pearson A Miller E Effects of Dietary Antioxidants and Oxidized Oil on Membranal Lipid Stability and Pork Product Quality J Food Sci 1989 54 1193-1197
14 Guntensperger B Escher F Oxidative Changes of Heat-Sterilized Meat in Trays J Food Sci 1994 59 689-692
28
15 Bauernfeind JC Antioxidant function of L-ascorbic acid in food technology International journal for vitamin and nutrition researchSupplement = Internationale Zeitschrift fur Vitamin- und ErnahrungsforschungSupplement 1985 27 307-333
16 Georgantelis D Blekas G Katikou P Ambrosiadis I Fletouris DJ Effect of rosemary extract chitosan and alpha-tocopherol on lipid oxidation and colour stability during frozen storage of beef burgers Meat Sci 2007 75 256-264
17 Botsoglou NA Govaris A Giannenas I Botsoglou E Papageorgiou G The incorporation of dehydrated rosemary leaves in the rations of turkeys and their impact on the oxidative stability of the produced raw and cooked meat Int J Food Sci Nutr 2007 58 312-320
18 Karpinska-Tymoszczyk M Effect of the addition of ground rosemary on the quality and shelf-life of turkey meatballs during refrigerated storage Br Poult Sci 2008 49 742-750
19 Drumm T Spanier A Changes in the Content of Lipid Autoxidation and Sulfur-Containing-Compounds in Cooked Beef during Storage J Agric Food Chem 1991 39 336-343
20 Folch J Lees M Stanley GHS A Simple Method For The Isolation And Purification Of Total Lipides From Animal Tissues Journal of Biological Chemistry 1957 226 497-509
21 Grau A Codony R Rafecas M Barroeta A Guardiola F Lipid hydroperoxide determination in dark chicken meat through a ferrous oxidation-xylenol orange method J Agric Food Chem 2000 48 4136-4143
22 Dobarganes M Velasco J Analysis of lipid hydroperoxides European Journal of Lipid Science and Technology 2002 104 420-428
23 Juntachote T Berghofer E Siebenhandl S Bauer F The antioxidative properties of Holy basil and Galangal in cooked ground pork Meat Sci 2006 72 446-456
24 Lee M Choi J Choi Y Han D Kim H Shim S Chung H Kim C The antioxidative properties of mustard leaf (Brassica juncea) kimchi extracts on refrigerated raw ground pork meat against lipid oxidation Meat Sci 2010 84 498-504
25 Botsoglou N and Botsoglou E Oxidation in Foods and Beverages and Antioxidant Applications Vol 2 Management in Different Industry Sectors In Decker EA Elias RJ and McClements D J (eds) Oxidation in Foods and Beverages and Antioxidant Applications Vol 2 Management in Different Industry Sectors 2010 200 1-528
29
26 National Chicken Council Per Capita Consumption of Poultry Livestock 1965 to Estimated 2012 in Pounds 2012 Retrieved in January 23 2012 from httpwwwnationalchickencouncilorgabout-the-industrystatisticsper-capita-consumption-of-poultry-and-livestock-1965-to-estimated-2012-in-pounds
27 Bilgili SF Poultry meat processing and marketing- what does the future hold Poult Internat 2002 12-22
28 Nolan N L Bowers J A and Kropf D H Lipid Oxidation and Sensory Analysis of Cooked Pork and Turkey Stored under Modified Atmospheres Journal of Food Science 1989 54 846ndash849
29 Esteacutevez M Morcuende D and Ventanas S Determination of Oxidation Nollet Leo M LToldraacute Fidel (Eds) Handbook of Muscle Foods Analysis Boca Raton CRC Press 2009 221-240
30 Frankel E N Lipid oxidation Prog Lipid Res 1980 19 1ndash22
31 Frankel E N Volatile Lipid Oxidation Products Progress in lipid research 1983 221 1-33
32 Hsieh R J and J E Kinsella Oxidation of Polyunsaturated Fatty Acids Mechanisms Products and Inhibition with Emphasis on Fish Advances in Food and Nutrition Research 1989 Vol 33
33 McMillin K W Initiation of oxidative processes in muscle foods Annual Proceedings of the Reciprocal Meat Conference Am Meat Sci Assoc Chicago IL 1997 49th 53ndash64
34 Monahan FJ Oxidation of lipids in muscle foods fundamental and applied concerns In EA Decker C Faustman and CJ Lopez-Bote (Eds) Antioxidants in Muscle Foods Nutritional Strategies to Improve Quality New York John Wiley and Sons Inc 2000
35 Robinson M E Haemoglobin and methaemoglobin as oxidative catalysts Biochemical Journal 1924 18 255-264
36 Jadhav SJ Nimbalkar SS Kulkarni AD and MadhaviDL Lipid oxidation in biological and food systems In Marcel Dekker (Eds) Food Antioxidants Technological Toxicological and Health Perspectives New York 1996
37 Niki E Antioxidants and relation to lipid oxidation Chemistry and physics of lipids 1987 44 227-300
38 Gray J I and Monahan FJ Measurement of lipid oxidation in meat and meat products Trends Food Sci Technol 1992 3 315-9
30
39 Chang S S and Peterson R J The Basis of Quality in Muscle Foods Recent Developments In The Flavor of Meat Journal of Food Science 1977 42 298ndash305
40 Lea C H Methods for determining peroxide in lipids J Sci Food Agric 1952 3 586ndash594
41 White P J Conjugated diene anisidine value and carbonyl value analysis In Warner K and Eskin N A M (Eds) Methods to Access Quality and Stability of Oils and Fat-Containing Foods Champaign IL AOCS Publishing 1995 159-177
42 Coxon D Measurement of lipid oxidation Food Science and Technology Today 1987 1164-6
43 Warner K Sensory evaluation of oils and fat-containing foods In K Warner and N A M Eskin (Eds) Methods to Access Quality and Stability of Oils and Fat-Containing Foods AOCS Publishing 1995 49
44 AMSA Research Guidelines for cookery sensory evaluation and instrumental tenderness measurements of fresh meat American Meat Science Association-National Live Stock and Meat Board 1995
45 Association of Official Analytical Chemists Official methods of analysis (16th ed) Washington DC Association of Official Analytical Chemists 1995
46 Labuza T P and Dugan L R Kinetics of lipid oxidation in foods C R C Critical Reviews in Food Technology 1971 2 3
47 Gordon MF The mechanism of antioxidant action in vitro In Hudson BJF (Ed) Food Antioxidants London Elsevier Applied Science 1990 1-18
48 Shahidi F Janitha P Wanasundara P Phenolic Antioxidants Crit Rev Food Sci Nutr 1992 32 67-103
49 Roozen JP Effects of types I II and III antioxidants on phospholipid oxidation in a meat model for warmed over flavour Food Chem 1987 24 167-185
50 Pokornyacute J Natural antioxidants for food use Trends in Food Science and Technology 1991 2 223-227
51 Wong W H Buah Keluak National Parks 11 Jan 2007 Retrieved 02 July 2012 from httpenwikipediaorgwikiPangium_edule
52 Chye FY Sim KY Antioxidative and Antibacterial Activities of Pangium edule Seed Extracts International Journal of Pharmacology 2009 5 285-297
31
53 Andarwulan N Fardiaz D Wattimena GA Shetty K Antioxidant activity associated with lipid and phenolic mobilization during seed germination of Pangium edule Reinw J Agric Food Chem 1999 47 3158-3163
54 Andarwulan N Fardiaz S Apriyantono A Hariyadi P Shetty K Mobilization of primary metabolites and phenolics during natural fermentation in seeds of Pangium edule Reinw Process Biochemistry 1999 35 197-204
55 Abdullah Moh A B Phyochemical Composition of Fresh and Cooked of Chesnut (Castanopsis argentea) Pangium (Pangium edule) and Pra (Elateriospermum tapos) Seeds Final Year Project Food Science and Technology in the Faculty of Applied Sciences Universiti Teknologi Mara Malaysia January 2012 Retrieved on July 4 2012 from httpeprintsptaruitmedumy49401MOHD_ASRUL_BIN_ABDULLAH_12_24pdf
56 Ma A A Peranakan favorite is ayam buah keluak Chicken stewed with black nuts at True Blue RestaurantWall Street Journal (Online) New York NY Dec 16 2010 Retrieved July 4 2012 from httpproquestumicompqdwebdid=2214039511ampsid=1ampFmt=3ampclientId=36305ampRQT=309ampVName=PQD
57 Fardiaz D Romlah S Antioxidant activity of picung (Pangium edule Reinw) seed In Development of Food Science and Technology in ASEAN Proceedings of the Fourth ASEAN Food Conference February 17ndash21 1992 ASEAN Jakarta Indonesia 1992 814ndash819
58 Food and Drugs Administration Food Additives Permitted for Direct Addition to Food for Human Consumption Code of Federal Regulations Title 21 pt 172190 2006
59 Kerler J Grosch W Character impact odorants of boiled chicken changes during refrigerated storage and reheating Zeitschrift Fur Lebensmittel-Untersuchung Und-Forschung A-Food Research and Technology 1997 205 232-238
60 Baggio S Vicente E Bragagnolo N Cholesterol oxides cholesterol total lipid and fatty acid composition in turkey meat J Agric Food Chem 2002 50 5981-5986
32
CHAPTER 3 MATERIALS AND METHODS
31 Keluak Antioxidant and Chemicals
Keluak (Kupas Wayang Brandreg Peeled Keluak Nuts PT Wira Aksara
Jakarta Indonesia was manufactured for Empire International East Chief
Privado Ontario CA 91761) Butylated hydroxytoluene (BHT) gallic acid (ACS
reagent) and 2-thiobarbituric acid were obtained from Sigma Chemical
Company St Louis MO USA Sodium chloride (crystal ARreg ACS) was obtained
from Mallinckrodt Baker Inc (Phillipsburg NJ USA)
The reagents used included acetone (Certified ACS) and chloroform (certified
ACS) obtained from Fisher Scientific Fair Lawn NJ USA Acetic acid (Glacial
ACS reagent) was purchased from J T Baker (Center Valley PA 18034 USA)
and Folin Ciocalteursquos phenol reagent (2 N) was purchased from Sigma-Aldrich
(St Louis MO USA)
311 Phenolic Extraction
Keluak seeds were ground into fine pieces using a coffee grinder (Braun
Inc Lynnfield MA USA) The fatty material from the ground seed was removed
first using a method modified from Wettasinghe and Shahidi (1) The ground seed
was washed with n-hexane (16 gg) and placed in a sonicator for 15 minutes
with occasional stirring The mixture was vortexed for 30 secs before it was
centrifuged at 2688 x g for 10 minutes (Sorvallreg Instrument RC-5B Du Pont
Company Wilmington DE USA) The upper fat-soluble layer was discarded
The solid was washed 2 ndash 3 additional times The solids remained at the bottom
after washing The defatted solids were then air-dried overnight under the hood
to remove any solvent residue
Forty grams of dried defatted Keluak seeds were extracted by stirring with
200 mL of solvent (acetone water acetic acid 90 95 05 vvv) at 60degC and
600 rpm for 2 hrs The mixture was then filtered through filter paper (Whatman
1 Buckinghamshire UK) The filtrate was collected and dried at 45degC using a
rotary evaporator until no further weight changes occurred The concentrated
extract was further dried using a vacuum oven at 45degC overnight The extract was
33
collected dissolved in 100 ethanol flushed with Argon gas and stored at -20degC
until further use
312 Total Phenolics content
The total phenolic content was measured using the Folin-Ciocalteu assay
as modified by Waterhouse (13) The phenolic extract was diluted with 100
ethanol to make several dilutions (1100 2100 and 10100) One milliliter of each
dilution was added to a test tube containing 5 mL of deionized water Then 05
mL of 50 Folin-Ciocalteu reagent was added to the test tube The solution was
mixed and allowed to stand for 8 mins at 22degC before adding 1 mL of 5 sodium
carbonate (wv) The mixture was vortexed using a touch mixer (model 231
Fisher Scientific Pittsburgh PA USA) and incubated in the dark for 1 hr The
solution was vortexed a second time before reading the absorption with a UV-
spectrophotometer (Spectronic Genesys 5 spectrophotometer Thermo Electron
Corporation Madison WI USA) at 725 nm against DI water A standard curve
was prepared at the same time with gallic acid at concentrations ranging from 0
to 100 mgL The quantity of total phenolic content in the sample was calculated
as gallic acid equivalents (GAE) from the standard curve using the formula
C = c times (V divide m) where
C is total phenolic content (mg GAEg extract)
c is the concentration of gallic acid obtained from the calibration curve (mgmL)
V is volume of sample (mL)
m is mass of the sample extract (g)
32 Sample Preparation
Ground turkey meat (15 fat Jennie-O Turkey Store Wilmar MN USA)
purchased from a local grocery store at day 0 and was immediately divided into 4
treatments according to the formulation (Table 31) (2 3)
(1) Control- No antioxidant
(2) Commercial antioxidant- 002 BHT (ww of lipid)
(3) Natural antioxidant- 002 Keluak extract (ww of lipid)
34
(4) Natural antioxidant ndash 004 Keluak extract (ww of lipid)
The level of Keluak extract antioxidant used was based on the amount of
fat in each formula Salt was dissolved in water prior to addition to the meat The
water addition was 5 of the ground meat (ww) The antioxidant and salt were
mixed in the liquid first before adding it to the meat by sprinkling while mixing
After the antioxidant salt and liquid addition mixing by hand (wearing gloves)
was continued for 5 mins The meat mixture was prepared into patties of uniform
size (using a cookie cutter diameter= 55 cm thickness= 15 cm) The patties
were cooked in an electrical skillet and temperature was monitored by Digi-
Sensereg Scanning Thermometer (Model 92000-00 Cole Parmer Instrument Co
Barrington IL) using copper-constantin thermocouple wires (Type T Omega
Engineering Inc Stamford CT) to an endpoint temperature of 74degC The cooked
patties were cooled and placed in a single layer on a tray and then overwrapped
in commercial PVC (water vapor transmission rate=15 g100 m224 h oxygen
transmission rate 880 cm3m224 h) and aluminum foil over the wrap The
patties were stored at 2degC in the dark and were assayed for the extent of oxidation
by odor sensory TBARS conjugated dienes and peroxide value analysis at days
0 1 3 5 7 for the first study (2)
In a second separate study a longer storage time study was completed to
examine the effect of antioxidants on the cooked ground turkey over a longer
time period The same procedure for antioxidant addition and meat sample
preparation was used However in the second study the samples were stored for
a total of 15 days (5 6) Samples were collected at days 0 1 3 5 7 10 13 15 for
TBARS conjugated dienes peroxide values and pH determinations
33 Thiobarbituric Acid Reactive Substances (TBARS)
Lipid oxidation was assessed by the 2-thiobarbituric acid (TBA) method of
Tarladgis and others (4) and Yu et al (5) Briefly 10 g of meat was homogenized
with 50 mL of deionized water using a homogenizer (IKAreg T25 digital Ultra-
Turrax Wilmington NC USA) The homogenate was filtered through 1
Whatman paper Five mL of the clear filtrate was mixed with 5 mL TBA reagent
35
containing 002 M TBA in 90 glacial acetic acid The mixture was capped
vortexed for 30 secs and incubated in the dark for 15-18 hrs at room temperature
After the color developed the mixture was measured for absorbance at 532 nm
against a blank (deionized water) The absorbance was converted to TBAR values
using 1133- tetraethoxypropane to prepare a standard curve Triplicates of 10 g
samples were prepared for each treatment TBA value is expressed as mg MDA
kg meat
34 Conjugated Dienes
Conjugated dienes (CD) were determined by the method described by
Juntachote and others (6) with slight modifications A cooked meat sample (05
g) was suspended in 5 mL of deionized water and homogenized using a digital
Ultra-Turrax T25 (IKAreg Wilmington NC USA) to obtain a smooth slurry A 05
mL aliquot of this suspension was mixed with 5 mL of extracting solution
containing hexane and isopropanol (31 vv) and mixed for 1 min using a vortex
mixer After centrifugation at 2000 g for 5 mins the supernatant was collected
and the absorbance of the supernatant was determined at 233 nm The
concentration of conjugated dienes was calculated using a molar extinction
coefficient of 25200 M-1cm-1 and the result were expressed as nmole of
conjugated dienes per mg meat sample
35 Peroxide Value
The peroxide value was determined according to the AOAC method 96533
(Association of Official Analytical Chemists) (13) with a few modifications The
lipids from meat samples were extracted by the method of Kim et al (7) First 5 g
of meat sample was broken into small pieces and placed in a water bath at 60˚C
to melt the fat for 30 mins The meat was extracted with a solution containing
acetic acid chloroform (32) and then filtered with Whatman 1 filter paper A
saturated solution of potassium iodide (KI 05 mL) was added to the filtrate The
solution color changed to yellow and then 30 mL of deionized water was added
The mixture was allowed to let stand at room temperature for at least 5 mins and
the color would turn to pale to bright yellow Before titrating with 001 N of
36
sodium thiosulfate (Na2SO3) 05 mL of 1 starch solution was added (a color
changed occurred - the color turned purple to blue-black) The PV is expressed as
meq O2kg lipid
36 pH value
To determine the pH of the meat samples cooked meat samples (10 g)
were blended with 50 mL deionized water for 15 seconds in a homogenizer
(Ultra-Turrax T25 IKAreg Wilmington NC USA) The pH was measured with a
pH meter (Accumet Basic model AB 15 Fisher Scientific Company) The pH
meter was calibrated daily with standard buffers of pH 40 and 70 at 25˚C
37 Sensory Evaluation
Trained panelists (n=15) were recruited from among University of Illinois
graduate students and staff The panelists were prepared using an extensive
training program During each training session panel members practiced and
discussed the techniques developed for sample presentation score sheet terms
and odor sensory evaluation method A panel leader led the panelists to develop
terms to describe the aroma characteristics of fresh cooked turkey meat including
the aroma characteristics of cooked poultry with or without the added Keluak
extract Panel members were trained regularly for 7 sessions for total of two
weeks to identify and discriminate aroma differences Some of the terms were
derived from reference standards including fresh boiled ground turkey meat
lard oxidized vegetable oil hard-boiled egg and wet cardboard (Table 32) The
panelists agreed on the following aroma descriptors for warm-over-flavor meaty
fatty rancid eggy and cardboardy These descriptors were judged for the
presence and overall intensity using a 15 cm-structured line scale (0 = none 15 =
extreme) along with an anchor value for each respective standard Table 2
showed the form used to evaluate the aroma descriptors described above
Cooked patties were uniformly cut into four pie-shaped wedges and placed
in a sniff bottle (Nalgene Teflon PTFE wash bottle Nalge Company Rochester
NY USA) covered with foil to hide the identity of the sample inside Each sample
represented a treatment labeled with three-digit random numbers and were
37
served at random order during each test session The samples were held in an
incubator (45degCplusmn 1degC) for 30 mins prior to presentation to the panelists The
panelists were asked to clean their palate by chewing a piece of unsalted saltine
crackers and rinse with water prior to evaluating the samples Samples were
sniffed Four samples were evaluated for each test session Roasted coffee beans
were presented for panelists to clear the palate between samples Standard
references were prepared daily The second session replicates of the first session
was conducted one week after the first session
38 Statistical Analysis
Statistical assessment was carried out with the program SAS Data were
analyzed as 4 (treatments) by 5 (days of storage) The results from the TBARs
analysis peroxide value analysis conjugated dienes analysis and the
odorsensory analysis were analyzed using one-way analysis of variance
(ANOVA) Differences were considered significant at the P lt 005 level
Comparison of treatment means was based on Fisherrsquos Least Significant
Difference (LSD)
38
39 Tables
Table 31 Formulation of Cooked Ground Turkey Meat for Each Treatment
TREATMENTS
Control BHT AO 200ppm AO 400ppm
INGREDIENTS
Jenny-O 15 fat Ground Turkey
(g) 650 650 650 650
Salt (2 ww) (g) 13 13 13 13
BHT (002 of total fat) (g) 002
Keluak extract (mL)
2487 (002 g
phenolics)
4974 (004 g
phenolics)
Cold water (mL)5 by sample wt
(ww) 325 325 325 325
Table 32 Descriptive Odor Standards for Refrigerated Ground Turkey Meat
Descriptive Odor term Standard Location on the 15-cm line
Rancid Oxidized vegetable oil in water (1100 vv) 7
Cardboard 1 cm2 cardboard in 15 mL water 85
Eggy Fresh hard-boiled egg white (01 g) 9
Meaty Fresh boiled ground turkey meat in water (15 gv) 8
Fatty Lard (02 g) 9
39
310 References
1 Wettasinghe M Shahidi F Antioxidant and free radical-scavenging properties of ethanolic extracts of defatted borage (Borago officinalis L) seeds Food Chem 1999 67 399-414
2 Vara-Ubol S Bowers J Effect of alpha-tocopherol beta-carotene and sodium tripolyphosphate on lipid oxidation of refrigerated cooked ground turkey and ground pork J Food Sci 2001 66 662-667
3 Hassan O Fan L The anti-oxidation potential of polyphenol extract from cocoa leaves on mechanically deboned chicken meat (MDCM) Lwt-Food Science and Technology 2005 38 315-321
4 Tarladgis B Dugan L Pearson A Chemistry of 2-Thiobarbituric Acid Test for Determination of Oxidative Rancidity in Foods 2 Formation of Tba-Malonaldehyde Complex without Acid-Heat Treatment J Sci Food Agric 1964 15 602-amp
5 Yu L Scanlin L Wilson J Schmidt G Rosemary extracts as inhibitors of lipid oxidation and color change in cooked turkey products during refrigerated storage J Food Sci 2002 67 582-585
6 Juntachote T Berghofer E Siebenhandl S Bauer F The antioxidative properties of Holy basil and Galangal in cooked ground pork Meat Sci 2006 72 446-456
7 Kim YJ Jin SK Park WY Kim BW Joo ST Yang HS The Effect of Garlic Or Onion Marinade on the Lipid Oxidation and Meat Quality of Pork during Cold Storage J Food Qual 2010 33 171-185
8 Chye FY Sim KY Antioxidative and Antibacterial Activities of Pangium edule Seed Extracts International Journal of Pharmacology 2009 5 285-297
9 Kahkonen M Hopia A Vuorela H Rauha J Pihlaja K Kujala T Heinonen M Antioxidant activity of plant extracts containing phenolic compounds J Agric Food Chem 1999 47 3954-3962
10 Jayaprakasha G Selvi T Sakariah K Antibacterial and antioxidant activities of grape (Vitis vinifera) seed extracts Food Res Int 2003 36 117-122
11 Fardiaz D Romlah S Antioxidant Activity of Picung (Pangium edule Reinw) Seed In Development of Food Science and Technology in ASEAN Proceedings of the 4th ASEAN Food Conference Feb 17-21 1992 ASEAN Jakarta Indonesia 1992 12 Waterhouse A L Determination of Total Phenolics Current Protocols in
Food Analytical Chemistry 2002 I111-I118
40
13 Association of Official Analytical Chemists (1995) Official methods of analysis (16th ed) Washington DC Association of Official Analytical Chemists
41
Chapter 4 RESULTS AND DISCUSSION
41 Phenolic Extraction Yield
The phenolic extract yield using acetone water acetic acid (90 95 05)
extraction was 503 plusmn 140 g of extract per 70 g of defatted ground Keluak seed or
007 g phenolic extract per gram of defatted Keluak The samples contained
approximately 719 phenolic compounds by weight the values are equal to the
average plusmn standard deviation of the three replicate analyses This value was
moderately greater than that reported by Chye and Sim (1) which reported a
548 yield The total phenolic content as determined using Folin-Ciocalteau
reagent was 1973 plusmn 203 mg GAEg extract which was also moderately greater
than the result reported by Chye and Sim which was 1639plusmn 004 mg GAEg
extract (1) It is possible that the difference is due to the Keluak source Chye and
Sim obtained their seeds material from local indigenous markets in Kota
Kinabalu Sabah Malaysia (1) while the seeds used in this study were grown in
from Indonesia The geographical and horticultural differences could affect the
phenolic content and concentration of the seed
According to Kahkonen et al (2) different phenolic compounds can have
different responses in the Folin Ciocalteau method depending on their chemical
structure Therefore the antioxidant activity of an extract cannot be predicted
solely on its total phenolic content (3 4)
42 Effect of Keluak Extract and storage time on TBARS values during
refrigerated storage of cooked ground turkey
The TBARS values represent the content of secondary lipid oxidation
products particularly malonaldehyde The carbonyls are primarily responsible
for the production of off-flavors in oxidized meat and meat products Aldehydes
are formed by the oxidation of unsaturated fatty acids They react with the TBA
reagent to form a pink complex (TBA chromogen) with a maximum absorbance
at 532 nm The intensity of this pink color is directly related to the concentration
of the TBA-reactive substances in the original sample The results of the TBARs
analysis for the preliminary study (7 days) and the extended storage study (15
days) are shown in Tables 41a b and Figures 41a b respectively Overall lipid
42
oxidation increased substantially as the refrigerated storage progressed due to
the effects of heating and in combination with storage under aerobic conditions
On the first day of analysis for both the 7 and 15 days storage study all the
antioxidant treated samples (BHT and both concentrations of the Keluak
extracts) the TBARS values were significantly lower than the control an
indication that the antioxidants had a positive effect in suppressing oxidation
Similar findings were observed by Juntachote et al and Teets et al (5 6) TBARS
values for both 7 and 15 days storage study ranges from 035- 475 mg MDA kg
meat which was comparable to other study by Juntachote (5) for 14 days of
storage study of pork meat There were examining the effect other natural
sources of antioxidants on oxidation during refrigerated storage of cooked meat
During the preliminary study (Table 41a) the control and BHT treatments
did not show significant differences (Pgt005) from day 1-7 However both of the
Keluak extract treatments showed a significant (Plt005) effect on the
suppression of the progression of lipid oxidation as compared to the control
(Figure 41a)
On the other hand during the 15 day study all the samples with added
antioxidants had significantly lower TBAR values compared to the control
throughout the entire storage period This indicates that both the commercial
treatment and the treatment with Keluak extracts provided substantial protection
to the meat with respect to lipid oxidation The efficacy of the Keluak extracts to
inhibit lipid oxidation is probably related to their phenolic content The results of
this study showed agreement with those obtained by Fardiaz and Romlah (14)
which stated that the addition of Keluak extract to palm oil lengthened the
oxidation induction period from 22 hours to 50 hours
Lipid oxidation was considerably greater with longer storage times due to
the exposure to oxygen TBARs measure the formation of secondary lipid
oxidation products which contribute to WOF in oxidized meat Heat increases the
release of non-heme iron from the heme pigments a major catalyst for lipid
oxidation in cooked meats (7) Cooking also alters cellular compartmentalization
and exposes membrane phospholipids to molecular oxygen and metal ions (8)
43
resulting in greater amounts of lipid oxidation (9) The addition of antioxidants
during processing cooking or packaging can be done to increase the oxidative
stability of cooked meat (10)
43 Effect of Keluak Extract and Storage Time on Conjugated Diene
Content during Refrigerated Storage of Cooked Ground Turkey
Meat
The development of conjugated dienes (CD) is related to the formation of
hydroperoxides found in the extracted lipids of the cooked ground turkey
Unsaturated fatty acid double bonds occur naturally in a methylene interrupted
structure As meat begins to oxidize the double bonds of these fatty acids are
altered creating conjugated systems which can be measured
spectrophotometrically (6) During lipid peroxidation non-conjugated double
bonds (C=CndashCndashC=C) which are present naturally in unsaturated lipids are
converted to conjugated double bonds (C=CndashC=C) with a large increased in
absorption at 232ndash234 nm (11) In the preliminary study there were no significant differences among the
antioxidant treated sample and the control (Pgt005) except on day 5 (Figure 42a
and Table 42a) The CD value for all the treatments peaked at day 5 and the
samples treated with antioxidants were significantly different that the control
(Plt005)
Meanwhile during the second storage study (Table 42b and Figure 42b)
when the CD values were compared to the control on day 0 and day 1 the 002
BHT and both of the Keluak extract treated samples were not significantly
different (Pgt005) However from day 3 on all the antioxidant-treated samples
had less CD formation than the control (Plt005) The CD content of the control
generally increased especially during the last 5 days (Day 10 13 and 15) of the
study Additionally cooked ground turkey treated with Keluak at 400 ppm had
slightly lower concentrations of conjugated dienes compared to cooked ground
turkey containing Keluak extract at 200 ppm and the commercial antioxidant
(BHT) The trend of CD formation was similar to several other studies (5 6 12
13) They generally observed that the CD concentration for most samples peaked
44
on Day 3 and decreased thereafter This phenomenon of decreased CD is likely
due to the decomposition of the conjugated diene hydroperoxides into secondary
oxidation products over time Conjugated dienes hydroperoxides are expected to
decompose into secondary products as was observed in this study According to
Frankel (15) the formation of conjugated dienes which is related to the
production of hydroperoxides occurs in the early stages of lipid oxidation According to Estevez et al (17) measurement of conjugated dienes (CD) in
meat products containing elevated levels of PUFA is limited depending on the
fatty acid composition of the sample as well as the presence of other non-
hydroperoxides CDs In agreement with Grau et al (18) the TBA test showed a
higher sensitivity with respect to lipid oxidation than did the CD determination
44 Effect of Keluak extract and storage time on peroxide value during
refrigerated storage of cooked ground turkey
Peroxide values (PV) were also used to assess the level of lipid oxidation in
cooked ground turkey during storage at 2˚C (Table 43 and Figure 43) However
while there were differences between the control and samples treated with AOs
on a few days the result of this study showed that treatments had no significant
effect (Pgt005) on the peroxide values compared to the control Generally based
on the results in Table 4 and Figure 4 the PVs increased during storage and
peaked on day 10 At the time it is possible that much of the polyunsaturated
membrane lipids may have been oxidized at that point so that further storage
and oxidation resulted in a decrease in the concentration of peroxides and thus
the PV
The PV differences among the samples did not provide proof that any of
the AOs were effective It is not clear why the PV analysis did not provide any
evidence of AO efficacy According to Estevez (17) the sensitivity of this method
is about 05 miliEquivalentkg of lipid Lower peroxide values cannot be
measured satisfactorily by the AOCS method because of the uncertainty with the
iodometric titration endpoint unless the iodine-starch end is determined
potentiometrically at levels as low as 006 Eqkg lipid The iodometric method is
highly empirical and very small procedural differences can cause variation in the
45
results (19) Two major sources of error in this test could be the liberation of
iodine by air oxidation of the KI and absorption of iodine by fatty acid double
bonds (17)
4 5 Effect of Keluak Extract and storage time on Odor of Refrigerated
Cooked Ground Turkey
No significant interaction (Pgt 005) occurred between antioxidant and
storage time for most of the odor characteristics (Tables and Figures 44-48)
For meaty odor characteristic (Figure and Table 44) the score of all the
treatments over the 7 days of storage did not show significant differences
(Pgt005) The scores ranged from 502 ndash 783 which was slightly below the
freshly boiled turkey meat standard for meaty (which was ranked 8 in the 15-cm
line scale) Therefore the panelists were unable to score and detect the cooked
meat aroma differences in the treated samples relative to the standard reference
The meaty aroma in this study was used to determine if there were possible
masking effects from the AO treatments
For the rancid odor (Figure and Table 45) both of the Keluak treated
samples were perceived as more rancid than both control and BHT after day 1
Overall both of the Keluak treated samples were ranked higher than the control
and BHT which disagrees with the results of TBA test However there was no
significant difference among the treatments between day 3-7 According to Ruth
(20) rancidity as a measure of lipid oxidation is usually best measured by the
concentration of TBARS
The minimum TBA values that corresponds to dark chicken meat samples
that were significantly different in rancid aroma was 1933 μg MDAkg of meat
(21) For consumer acceptability the TBA values must be less than 785 μg of
MDAkg (21) The results from Bou et al (21) were comparable to the results
reported by Gray and Pearson (22) showing that rancid flavor in meats is initially
detected between 500 and 2000 μg of MDAkg of meat In addition OrsquoNeill et
al (23) found that the threshold for WOF detection in cooked dark chicken meat
was at TBA values ge800 μg of MDAkg of meat Since chicken and turkey meat
46
have a comparable PUFA content those values were considered useful in this
experiment On the other hand the odor score for Eggy cardboard and fatty were
statistically not different (Pgt 005) Panelists were unable to detect differences
which could be to different reasons such as that Keluak extract has an aroma
masking effect that confuses the panelists with the ldquooff-odorrdquo The Keluak did
have a slight aroma and it is likely that it masked the effects of storage on lipid
oxidation The aroma of Keluak has been described as bitter dirt-like and
chocolate-like odor (16) This aroma masking could be perceived as undesirable
by the panelists and it might have been mistaken as an off-odor or as an oxidized
sample even though the TBARs and CD data showed otherwise
4 6 Effect of Keluak Extract and storage time on pH of Refrigerated
Cooked Ground Turkey
Table 49 shows the effect of antioxidant treatments in pork muscle on pH
values during storage at 2˚C The values of the pH ranged between 633-668
Generally there are no correlations of pH value among the treatments during
storage The trend for the pH value is inconclusive
47
47 Figures Figure 41a The profile of TBARS in cooked ground turkey treated with various
antioxidants during storage at 2˚C- A Preliminary Study
K200 and K400 represent treatments with Keluak extract at concentration of 200 and 400 ppm respectively
0000
1000
2000
3000
4000
5000
6000
0 2 4 6 8
TBA
RS
(mg
MD
Ak
g m
eat
)
Storage Days
Control
BHT
K200
K400
48
Figure 41b The profile of TBARS in Cooked Ground Turkey Treated with Various Antioxidants During Storage at 2˚C- Extended Storage Time
K200 and K400 represent Keluak extract at concentration of 200 and 400 ppm respectively
Figure 42a Conjugated dienes values of different antioxidant treatments over storage at
2˚C - A Preliminary Study
K200 and K400 represent treatments with Keluak extract at concentration of 200 and 400 ppm
respectively
000
100
200
300
400
500
600
0 5 10 15 20
TBA
RS
(mg
MD
Ak
g m
eat
)
Storage time (days)
Control
BHT 002
K200
K400
0000
0050
0100
0150
0200
0250
0300
0350
0400
0450
0 1 2 3 4 5 6 7 8
Co
nju
gate
d D
ien
es
(nm
ol
mg
me
at)
Days
Control
BHT
K200
K400
49
Figure 42b Conjugated dienes values of different antioxidant treatments over storage at
2˚C- Extended Storage Time
K200 and K400 represent treatments with Keluak extract at concentration of 200 and 400 ppm respectively
Figure 43 Peroxide Value (meq kg meat) of Different Antioxidant treatments over
Storage at 2˚C
K200 and K400 represent treatments with Keluak extract at concentration of 200 and 400 ppm
respectively
000
002
004
006
008
010
012
014
016
0 5 10 15 20
Co
nju
gate
d D
ien
es
(nm
ol
mg
me
at)
Storage (days)
Control
BHT 002
K200
K400
0
05
1
15
2
25
3
35
4
0 2 4 6 8 10 12 14 16
PV
(m
eq
kg
me
at)
Storage Time (Days)
Control
BHT 002
K200
K400
50
Figure 44 Intensity of Meaty Odor Descriptor in Cooked Ground Turkey Meat Treated
with Different Antioxidants Rated in a 15-cm Line Scale
K200 and K400 represent Treatment with Keluak extract at concentration of 200 and 400 ppm
respectively
Figure 45 Intensity of Rancid Odor Descriptor in Cooked Ground Turkey Meat Treated
with Different Antioxidants Rated in a 15-cm Line Scale
K200 and K400 represent Treatment with Keluak extract at concentrations of 200 and 400 ppm
respectively
000
200
400
600
800
1000
1200
0 2 4 6 8
15
cm
Lin
e s
cale
(av
era
ge)
Days
CONTROL
BHT
K200
K400
Linear (BHT)
-100
000
100
200
300
400
500
600
700
800
0 2 4 6 8
15
cm
Lin
e s
cale
(av
era
ge)
Days
Control
BHT
K200
K400
51
Figure 46 Intensity of Eggy Odor Descriptor in Cooked Ground Turkey Meat Treated
with Different Antioxidants Rated in a 15-cm Line Scale
K200 and K400 represent Treatment with Keluak extract at concentrations of 200 and 400 ppm
respectively
Figure 47 Intensity of Cardboard Odor Descriptor in Cooked Ground Turkey Meat
Treated with Different Antioxidants Rated in a 15-cm Line Scale
K200 and K400 represent Treatment with Keluak extract at concentrations of 200 and 400 ppm
respectively
000
100
200
300
400
500
600
700
800
900
1000
0 2 4 6 8
15
cm
Lin
e s
cale
(av
era
ge)
Days
Control
BHT
K200
K400
-1
0
1
2
3
4
5
6
7
0 2 4 6 8
15
cm
Lin
e s
cale
(av
era
ge)
Days
Control
BHT
K200
K400
52
Figure 48 Intensity of Fatty Odor Descriptor in Cooked Ground Turkey Meat Treated
with Different Antioxidants Rated in a 15-cm Line Scale
K200 and K400 represent Treatment with Keluak extract at concentrations of 200 and 400 ppm
respectively
000
100
200
300
400
500
600
700
800
900
0 2 4 6 8
15
cm
Lin
e s
cale
(av
era
ge)
Days
Control
BHT
K200
K400
53
48 Tables
Table 41a TBARS Value of Cooked Ground Turkey Meat Treated with Various Antioxidants during Storage at 2˚C- A Preliminary Study
TBARS (mg MDAkg meat) Average
Storage (Day) Control BHT 002 Keluak 200ppm Keluak 400ppm
0
131plusmn009Aa 094plusmn021Ba 050plusmn004Ca 037plusmn010Ca
1
189plusmn003Aab 161plusmn025Aab 080plusmn006Ba 057plusmn026Bab
3
243plusmn010Ac 236plusmn025Abc 111plusmn022Bab 055plusmn008Cab
5
397plusmn016Ad 319plusmn064Acd 170plusmn025Bbc 108plusmn023Bb
7
473plusmn076Ad 373plusmn074ABd 217plusmn040ACc 101plusmn044Cab
Different letters (A-D) within a row indicates that mean values are significantly different (Plt 005) Different letters within a column (a-d) within the same treatment are significantly different (Plt005)
Table 41b TBARS Value of Cooked Ground Turkey Meat Treated with Various Antioxidants during Storage at 2 ˚C- Extended Storage Time
TBARS (mg MDAkg meat) Average
Storage (day) Control BHT 002 K200 K400
0 129 plusmn 008Ae 091plusmn 004Bcd 065plusmn 015Be 101plusmn 003Cf
1 159plusmn 008Ade 076plusmn 005Cd 083plusmn 012Ce 127plusmn 006Bf
3 220plusmn 011Acd 074plusmn 004Dd 119plusmn 003Cd 160plusmn 004Be
5 258plusmn 014Ac 082plusmn 006Cd 076plusmn 014Ce 150plusmn 004Bd
7 377plusmn 001Ab 109plusmn 002Ccb 158plusmn 006Bc 160plusmn 006Bd
10 405plusmn 061Aab 121plusmn 009Bb 197plusmn 012Bb 195plusmn 009Bc
13 465plusmn 014Aa 151plusmn 004Ca 224plusmn 003Bab 218plusmn 003Bb
15 459plusmn 024Aa 154plusmn 013Da 231plusmn 014Ca 284plusmn 010Ba
Different letters (A-D) within a row indicates that mean values are significantly different (Plt 005) Different letters within a column (a-f) within the same treatment are significantly different (Plt005)
K200 and K400 represent treatments with Keluak extract at concentration of 200 and 400 ppm
respectively
54
Table 42a Conjugated Dienes Concentrations with Antioxidant Treatments and Storage
At 2˚C- A Preliminary Study
Conj Dienes (nmolemg meat)
Storage (Days) Control BHT 002 K200 K400
0 015plusmn003Abc 022plusmn001Aa 013plusmn001Ab 020plusmn008Aa
1 012plusmn001Abc 012plusmn003Ab 011plusmn001Ab 019plusmn001Bab
3 006plusmn000Ac 003plusmn002Ac 002plusmn002Ab 004plusmn002Ab
5 038plusmn000Aa 024plusmn001Ba 027plusmn007ABa 021plusmn001Ba
7 023plusmn008Ab 026plusmn001Aa 029plusmn003Aa 016plusmn001Aab
Different letters (A-C) within a row indicates that mean values are significantly different (Plt 005) Different letters within a column (a-d) within the same treatment are significantly different (Plt005)
K200 and K400 represent treatments with Keluak extract at concentration of 200 and 400 ppm
respectively
Table 42b Conjugated Dienes Concentrations After Antioxidant Treatments and
Storage At 2˚C- Extended Storage Time
Conjugated Dienes (nM mg meat)
Storage (Days) Control BHT 002 K200 K400
0 013plusmn 001Aab 009plusmn000Bab 010plusmn 000Ba 010plusmn 001Ba
1 008plusmn 001Ac 008plusmn 001Ab 008plusmn 000Abc 007plusmn 001Ab
3 011plusmn 000Ab 009plusmn 001Bab 008plusmn 000Bbc 006plusmn 000Cb
5 012plusmn001Ab 008plusmn 001B b 006plusmn 000Bd 006plusmn 000Bb
7 011plusmn001Abc 008plusmn 000B ab 006plusmn 001Bcd 007plusmn 000Bb
10 014plusmn 000Aa 009plusmn 000Bab 009plusmn 001Bab 007plusmn 000Cb
13 014plusmn 001Aa 009plusmn 000Bab 008plusmn 000Bbc 006plusmn 000Cb
15 014plusmn 000Aa 010plusmn 001Ba 008plusmn 001BCbcd 007plusmn 000Cb
Different letters (A-C) within a row indicates that mean values are significantly different (Plt 005) Different letters within a column (a-d) within the same treatment are significantly different (Plt005)
K200 and K400 represent treatments with Keluak extract at concentration of 200 and 400 ppm
respectively
55
Table 43 Peroxide Value (meq kg meat) of Different Antioxidant treatments during
Storage of cooked ground turkey meat at 2˚C
PV (meq kg meat)
Storage (Days) Control BHT 002 K200 K400
0 110plusmn 042Abc 070plusmn 014Ae 080plusmn 028Ad 130plusmn 014Acd
1 230plusmn 014Aab 130plusmn 014Bd 090plusmn 014BCd 070plusmn 014Cd
3 080plusmn 000Ac 070plusmn 014Ae 070plusmn 014Ad 070plusmn 014Ad
5 280plusmn 028Aa 140plusmn 000Bcd 110plusmn 014Bcd 080plusmn 028Bd
7 170plusmn 042Aabc 190plusmn 014Ac 195plusmn 021Abc 225plusmn 049Abc
10 310plusmn 042Aa 330plusmn 014Aa 290plusmn 042Aa 340plusmn 028Aa
13 255plusmn 007Aa 265plusmn 021Ab 240plusmn 028Aab 260plusmn 028Aab
15 255plusmn 064Aa 150plusmn 014ABcd 086plusmn 006Bd 100plusmn 028Bd
Different letters (A-C) within a row indicates that mean values are significantly different (Plt 005) Different letters within a column (a-e) within the same treatment are significantly different (Plt005)
K200 and K400 represent Treatment with Keluak extract at concentrations of 200 and 400 ppm
respectively
Table 44 Intensity of Meaty Odor Descriptor in Cooked Ground Turkey Meat Treated with Different Antioxidants Rated in a 15-cm Line Scale
Storage (Day) Control BHT 002 K200 K400
0 595plusmn250Aa 727plusmn144Aa 632plusmn202Aa 606plusmn189Aa
1 783plusmn208Aa 731plusmn174ABa 543plusmn220Ba 542plusmn294Ba
3 613plusmn201Aa 693plusmn143Aa 502plusmn266Aa 552plusmn228Aa
5 734plusmn277Aa 710plusmn290Aa 474plusmn253Aa 487plusmn263Aa
7 694plusmn296Aa 751plusmn265Aa 532plusmn259Aa 543plusmn236Aa
Different letters (A-C) within a row indicates that mean values are significantly different (Plt 005) Different letters within a column (a-b) within the same treatment are significantly different (Plt005)
K200 and K400 represent Treatment with Keluak extract at concentrations of 200 and 400 ppm
respectively
56
Table 45 Intensity of Rancid Odor Descriptor in Cooked Ground Turkey Meat Treated
with Different Antioxidants Rated in a 15-cm Line Scale
Storage (Day) Control BHT 002 K200 K400
0 228plusmn194Aa 193plusmn175Aa 334plusmn231Aa 350plusmn274Aa
1 177plusmn194Aa 172plusmn163Aa 392plusmn274ABa 426plusmn265Ba
3 260plusmn210Aa 272plusmn265Aa 419plusmn306Aa 337plusmn247Aa
5 344plusmn255Aa 329plusmn215Aa 427plusmn248Aa 395plusmn253Aa
7 408plusmn300Aa 289plusmn244Aa 448plusmn241Aa 385plusmn244Aa
Different letters (A-B) within a row indicates that mean values are significantly different (Plt 005) Different letters within a column (a-b) within the same treatment are significantly different (Plt005)
K200 and K400 represent Treatment with Keluak extract at concentrations of 200 and 400 ppm
respectively
Table 46 Intensity of Eggy Odor Descriptor in Cooked Ground Turkey Meat
Treated with Different Antioxidants Rated in a 15-cm Line Scale
Storage (Day) Control BHT 002 K200 K400
0 643plusmn242Aa 513plusmn244Aa 502plusmn324Aa 565plusmn287Aa
1 597plusmn248Aab 476plusmn321Aa 599plusmn332Aa 584plusmn360Aa
3 345plusmn258Ab 400plusmn270Aa 515plusmn335Aa 509plusmn425Aa
5 364plusmn303Aab 424plusmn320Aa 475plusmn269Aa 469plusmn180Aa
7 473plusmn306Aab 364plusmn210Aa 485plusmn268Aa 431plusmn305Aa
Different letters (A-C) within a row indicates that mean values are significantly different (Plt 005) Different letters within a column (a-e) within the same treatment are significantly different (Plt005)
K200 and K400 represent Treatment with Keluak extract at concentrations of 200 and 400 ppm
respectively
57
Table 47 Intensity of Cardboard Odor Descriptor in Cooked Ground Turkey Meat
Treated with Different Antioxidants Rated in a 15-cm Line Scale
Storage (Day) Control BHT 002 K200 K400
0 299plusmn222Aa 209plusmn182Aa 261plusmn198Aa 312plusmn157Aa
1 262plusmn249Aa 180plusmn192Aa 339plusmn238Aa 342plusmn229Aa
3 299plusmn203Aa 284plusmn254Aa 388plusmn235Aa 287plusmn185Aa
5 252plusmn243Aa 290plusmn190Aa 309plusmn193Aa 320plusmn204Aa
7 301plusmn210Aa 273plusmn253Aa 337plusmn195Aa 284plusmn205Aa
Different letters (A-C) within a row indicates that mean values are significantly different (Plt 005) Different letters within a column (a-e) within the same treatment are significantly different (Plt005)
K200 and K400 represent Treatment with Keluak extract at concentrations of 200 and 400 ppm
respectively
Table 48 Intensity of Fatty Odor Descriptor in Cooked Ground Turkey Meat Treated with Different Antioxidants Rated in a 15-cm Line Scale
Storage (Day) Control BHT 002 K200 K400
0 344plusmn226aA 350plusmn256aA 395plusmn309aA 395plusmn277aA
1 417plusmn285aA 389plusmn230aA 401plusmn345aA 438plusmn287aA
3 388plusmn220aA 378plusmn229aA 396plusmn328aA 403plusmn285aA
5 479plusmn252aA 461plusmn293aA 389plusmn255aA 428plusmn320aA
7 460plusmn288aA 492plusmn286aA 426plusmn281aA 428plusmn340aA
Different letters (A-C) within a row indicates that mean values are significantly different (Plt 005) Different letters within a column (a-e) within the same treatment are significantly different (Plt005)
K200 and K400 represent Treatment with Keluak extract at concentrations of 200 and 400 ppm
respectively
58
Table 49 pH Values of Cooked Ground Turkey Treated with Different
Antioxidants Stored at 2˚C
pH Value
Storage (Day) Control BHT 002 K200 K400
0 665plusmn 002Aab 644plusmn 003Bbc 646plusmn 004Bbc 658plusmn 003Aab
1 659plusmn 003Ab 643plusmn 003Cbc 651plusmn 001Babc 662plusmn 001Aab
3 645plusmn 003Bc 634plusmn 002Cd 643plusmn 004Bc 654plusmn 000Ab
5 663plusmn 002Aab 640plusmn 002Cc 645plusmn 004Cc 654plusmn 002Bb
7 647plusmn 001Ac 633plusmn 003Bc 648plusmn 004Aabc 646plusmn 006Ac
10 665plusmn 001Aab 646plusmn 002Dbc 654plusmn 001Cab 660plusmn 003Bab
13 665plusmn 002Aab 648plusmn 002Cab 655plusmn 002Ba 664plusmn 002Aa
15 668plusmn 001Aa 651plusmn 001Da 655plusmn 001Ca 663plusmn 001Ba
Different letters (A-D) within a row indicates that mean values are significantly different (Plt 005) Different letters within a column (a-c) within the same treatment are significantly different (Plt005)
K200 and K400 represent treatments with Keluak extract at concentrations of 200 and 400 ppm
respectively
59
49 References
1 Chye FY Sim KY Antioxidative and Antibacterial Activities of Pangium edule Seed Extracts International Journal of Pharmacology 2009 5 285-297
2 Kahkonen M Hopia A Vuorela H Rauha J Pihlaja K Kujala T Heinonen M Antioxidant activity of plant extracts containing phenolic compounds J Agric Food Chem 1999 47 3954-3962
3 Jayaprakasha G Selvi T Sakariah K Antibacterial and antioxidant activities of grape (Vitis vinifera) seed extracts Food Res Int 2003 36 117-122
4 Gray J Macdonald B Pearson A Morton I Role of Nitrite in Cured Meat Flavor - a Review J Food Prot 1981 44 302-amp
5 Juntachote T Berghofer E Siebenhandl S Bauer F The antioxidative properties of Holy basil and Galangal in cooked ground pork Meat Sci 2006 72 446-456
6 Teets AS Were LM Inhibition of lipid oxidation in refrigerated and frozen salted raw minced chicken breasts with electron beam irradiated almond skin powder Meat Sci 2008 80 1326-1332
7 Han D McMillin K Godber J Bidner T Younathan M Marshall D Hart L Iron Distribution in Heated Beef and Chicken Muscles J Food Sci 1993 58 697-700
8 Ahn D Wolfe F Sim J Prevention of Lipid Oxidation in Precooked Turkey Meat Patties with Hot Packaging and Antioxidant Combinations J Food Sci 1993 58 283-287
9 Asghar A Gray J Buckley D Pearson A Booren A Perspectives on Warmed-Over Flavor Food Technol 1988 42 102-108
10 Kingston E Monahan F Buckley D Lynch P Lipid oxidation in cooked pork as affected by vitamin E cooking and storage conditions J Food Sci 1998 63 386-389
11 Kulas E Ackman R Different tocopherols and the relationship between two methods for determination of primary oxidation products in fish oil J Agric Food Chem 2001 49 1724-1729
12 Srinivasan S Xiong Y Decker E Inhibition of protein and lipid oxidation in beef heart surimi-like material by antioxidants and combinations of pH NaCl and buffer type in the washing media J Agric Food Chem 1996 44 119-125
13 Lee M Choi J Choi Y Han D Kim H Shim S Chung H Kim C The antioxidative properties of mustard leaf (Brassica juncea) kimchi extracts on
60
refrigerated raw ground pork meat against lipid oxidation Meat Sci 2010 84 498-504
14 Fardiaz D Romlah S Antioxidant Activity of Picung (Pangium edule
Reinw) Seed In Development of Food Science and Technology in ASEAN
Proceedings of the 4th ASEAN Food Conference Feb 17-21 1992 ASEAN
Jakarta Indonesia 1992
15 Frankel E N Lipid oxidation Dundee Scotland The Oily Press Ltd 1998 Vol 10 pp 13ndash41 16 Ma Amy A Peranakan favorite is ayam buah keluak Chicken stewed with black nuts at True Blue Restaurant Wall Street Journal (Online) New York NY Dec 16 2010 Retrieved July 20 2011 from httpproquestumicompqdwebdid=2214039511ampsid=1ampFmt=3ampclientId=36305ampRQT=309ampVName=PQD
17 Esteacutevez M Morcuende D and Ventanas S Determination of Oxidation
Nollet Leo M LToldraacute Fidel (Eds) Handbook of Muscle Foods Analysis Boca
Raton CRC Press 2009 221-240
18 Grau A Codony R Rafecas M Barroeta A Guardiola F Lipid
hydroperoxide determination in dark chicken meat through a ferrous oxidation-
xylenol orange method J Agric Food Chem 2000 48 4136-4143
19 Shahidi F Janitha P Wanasundara P Phenolic Antioxidants Crit Rev Food Sci Nutr 1992 32 67-103
20 Ruth SM Techniques for sampling and identification of volatile compounds contributing to sensory perception In Nollet Leo M LToldraacute Fidel (Eds) Handbook of Muscle Foods Analysis Boca Raton CRC Press 2009 503-523
21 Bou R Guardiola F Grau A Grimpa S Manich A Barroeta A Codony R Influence of dietary fat source alpha-tocopherol and ascorbic acid supplementation on sensory quality of dark chicken meat Poult Sci 2001 80 800-807
22 Gray J I and A M Pearson Rancidity and warmed over flavour In Pearson A M and Dutson T R (Eds) Advances in Meat Research Vol 3 Nostrand-Reinbold Co New York NY 1987 221ndash269 23 OrsquoNeill L M K Galvin P A Morrissey and D J Buckley Comparison of effects of dietary olive oil tallow and vitamin E on the quality of broiler meat and meat products Br Poult Sci 1998 39 365ndash371
61
Chapter 5 CONCLUSION AND FUTURE WORK
The results of the present study indicated that the Keluak extract
incorporated into cooked ground turkey can reduce lipid oxidation The addition
of Keluak extracts at 200 and 400 ppm had a positive effect on reducing the
TBAR values and the conjugated dienes content compared to the control without
added AOs during storage at 2˚C for 15 days The Keluak extract used in this
study was comparable to BHT (002) in reducing lipid oxidation in meat
Peroxide value analysis did not differentiate between the control and the
treatments on the extent of lipid oxidation Due to confusion of the odor
components in the Keluak extracts by the panelists there were no significant
differences between the treatments in the odor sensory evaluation
Keluak seed is a culinary spice with no known toxic effect Its moderate
pungent aroma makes it valued as a traditional ethnic food flavorant in parts of
South East Asia With its substantial phenolic content and antioxidant properties
it could be an effective source of natural antioxidants However the application
of this natural antioxidant might be limited in Western cultures due to its effect
on the color and odor of meat products Further investigations are needed to
identify selective extraction and clean-up techniques that could be used to
eliminate the color and odor problem Other chemical analysis methods that
might provide better information on the extent of oxidation in meat products
include the p-anisidine value Food Oil Sensor (FOS) and Gas chromatography
techniques (GC analysis) of selected volatiles
2
fermentation although the antioxidant activity remained the same Chye and Sim
(10) reported that an acetone extract containing Keluak phenolics had substantial
antioxidant activity as measured by both DPPH radical scavenging and βndash
carotene bleaching assays Keluak seems to be a promising and novel natural
antioxidant source but additional investigations regarding its activity in food
products are needed
The increased consumer focus on natural food ingredients has led to the
search for additional natural sources of antioxidant for reducing oxidation in food
products Several studies on the phenolic constituents in numerous plant sources
have been conducted Keluak could be another possible economical and novel
source of natural antioxidants Even though several studies on the antioxidant
activity of Keluak seeds have been conducted (3- 7) its efficacy in meat products
has not yet been investigated It is important to explore the use of this plant
extract in the meat industry since traditionally it has been used as a spice
flavoring in meat dishes in Southeast Asia Therefore the objective of this
research was to determine the effectiveness of the phenolic extract of Keluak in
cooked ground turkey patties during refrigerated storage
3
12 References List
1 McKibben J Engeseth N Honey as a protective agent against lipid oxidation in ground turkey J Agric Food Chem 2002 50 592-595
2 Oxidation in Foods and Beverages and Antioxidant Applications Vol 2 Management in Different Industry Sectors Oxidation in Foods and Beverages and Antioxidant Applications Vol 2 Management in Different Industry Sectors 2010 200 1-528
3 Khalil A Mansour E Control of lipid oxidation in cooked and uncooked refrigerated carp fillets by antioxidant and packaging combinations J Agric Food Chem 1998 46 1158-1162
4 Yu L Scanlin L Wilson J Schmidt G Rosemary extracts as inhibitors of lipid oxidation and color change in cooked turkey products during refrigerated storage J Food Sci 2002 67 582-585
5 Rojas MC Brewer MS Effect of natural antioxidants on oxidative stability of cooked refrigerated beef and pork J Food Sci 2007 72 S282-S288
6 Juntachote T Berghofer E Siebenhandl S Bauer F The antioxidative properties of Holy basil and Galangal in cooked ground pork Meat Sci 2006 72 446-456
7 Hassan O Fan L The anti-oxidation potential of polyphenol extract from cocoa leaves on mechanically deboned chicken meat (MDCM) Lwt-Food Science and Technology 2005 38 315-321
8 Andarwulan N Fardiaz D Wattimena GA Shetty K Antioxidant activity associated with lipid and phenolic mobilization during seed germination of Pangium edule Reinw J Agric Food Chem 1999 47 3158-3163
9 Andarwulan N Fardiaz S Apriyantono A Hariyadi P Shetty K Mobilization of primary metabolites and phenolics during natural fermentation in seeds of Pangium edule Reinw Process Biochemistry 1999 35 197-204
10 Chye FY Sim KY Antioxidative and Antibacterial Activities of Pangium edule Seed Extracts International Journal of Pharmacology 2009 5 285-297
11 Fardiaz D Romlah S Antioxidant Activity of Picung (Pangium edule Reinw) Seed In Development of Food Science and Technology in ASEAN Proceedings of the 4th ASEAN Food Conference Feb 17-21 1992 ASEAN Jakarta Indonesia 1992
4
Chapter 2 REVIEW OF LITERATURE
21 Trend in Poultry Consumption
Consumption of poultry meat has increased in both developed and
developing countries (25) In the US per capita poultry meat consumption
increased from 79 pounds in 1990 to 954 pounds in 2000 and to just over 100
pounds in 2011 (26) Overall according to the National Chicken Council (6) per
capita consumption of red meat and poultry has not changed significantly but
when beef pork and poultry are examined separately red meat appears to be
losing market share to poultry Chicken and turkey were by far the most widely
consumed poultry species at approximately 822 and 164 pounds per person per
year respectively (26) According to Bilgili (27) it is predicted that poultry will
become the overall meat of choice by 2020
This continued growth and the competitive nature of the poultry industry
has been attributed to a variety of factors such as improvements in intensive
production and processing and development of a wide range of value-added
processed products that meet both direct consumer demand and the rapid
expansion of fast food outlets Poultry products are universally popular because
they are often not subject to cultural or religious constraints and the meat itself is
perceived as wholesome healthy and nutritious since it is relatively low in fat
and it has a more desirable unsaturated fatty acid composition than other meats
Most importantly high quality poultry products are available to many people at
affordable prices even though production costs vary widely around the world
(25) Precooked meat products have attained a high degree of consumer
acceptance because of the relative cost and ease of preparation (28)
Due to the increase in consumption the world production of poultry has
increased the past few decades The industry will remain responsive to consumer
demands both in the range and nature of the products developed although the
focus on quality will continue While the term ldquoqualityrdquo is defined according to
the consumerrsquos own perceptions goals and personal preferences however in
practicality product quality includes scientifically measurable characteristics of
color texture and flavor One main factor limiting the quality and acceptability of
5
meat and meat products is lipid oxidation a process that leads to deterioration of
quality characteristics such as color flavor texture nutritive value and safety
(25) Therefore the meat industry faces a challenge in developing strategies for
preventing lipid oxidation in meat and meat products
22 Lipid Oxidation
221 Overview
A wide variety of organic molecules are susceptible to chemical attack by
oxygen Lipid oxidation can occur in foods containing considerable amounts of
fat (particularly fats containing substantial percentages of unsaturated fatty
acids) including nuts milk and meat products (1) Oxidation of lipids is initiated
by irradiation including exposure to visible light by enzymes and metal catalysts
Heat and pressure will accelerate lipid oxidation (2) Quality attributes of foods
can be substantially affected by this process For instance negative aroma
changes in the food can result from volatile oxidation products the color can
darken as a result of condensation reactions between oxidation products and
proteins and lastly the texture can be modified by the oxidative induction of
protein crosslinks (1) Not unexpectedly the nutritive value and safety can also be
compromised
222 Mechanism of Lipid Oxidation
Lipid autoxidation is a free radical chain reaction that once the
peroxidation process is initiated it proceeds as a free-radical mediated chain
reaction that can be described in terms of initiation propagation and termination
processes (29)
2221 Initiation
R H R + H (1)
An initiator reacts with unsaturated lipids (RH) to form a lipid free radical
(R) (reaction 1) Unsaturated lipids (RH) are easily oxidized by one of several
reactive oxygen species (ROS) which include oxygen radicals and non-radical
derivatives of oxygen (29) such as O2 and OH Poly-unsaturated fatty acids
Initiator
6
(PUFA) are much more susceptible to oxidation than mono-unsaturated fatty
acid (MUFA) (46)
The initiation reaction can include transition metals (ie iron copper)
oxidants various hemolysis-prone substances or enzymes (1) This production of
free radicals can occur because of the direct thermal dissociation (thermolysis) of
hydroperoxides because of transition metal catalysis or exposure to light
(photolysis) with or without the intervention of photosensitizers (30) The
spontaneous abstraction of a hydrogen atom from an organic material by
molecular oxygen is an endothermic reaction which has a large activation energy
and although it might occur to a certain extent this stage is probably too slow to
be of practical importance Either the organic molecule or the oxygen should be
activated before the reaction could take place (1)
2222 Propagation
R + O2 ROO (2)
ROO + RH rarr ROOH + R (3)
An unsaturated lipid contains labile hydrogen(s) that can be abstracted
relatively easily This free radical (R) will react rapidly with molecular oxygen to
produce a peroxyl radical (ROO ) (reaction 2) The newly formed hydroperoxyl
radical can so forth abstract a hydrogen atom from an adjacent unsaturated fatty
acid (reaction 3) and the reaction goes on propagation cycles before termination
(29)
2223 Termination
ROO + ROO rarr non-radical products [ROOOOR] (4)
RO + R rarr ROR
R + R rarr RR
R + ROO rarr ROOR
Termination can occur by condensation of peroxy alkoxy andor alkyl
radicals Peroxy radicals at room temperature can combine to produce peroxy-
linked dimers (ROOR) Alkoxy and alkyl radicals at low oxygen pressure and
7
high temperatures can combine to produce ether-linked dimers (ROR) and
carbon-carbon linked dimers (RR) Alkyl radicals can combine with peroxy
radicals to generate peroxy-linked dimers (ROOR) (30-32)
Hydroperoxides the primary initial products of lipid oxidation can
breakdown as soon as they are formed The decomposition can be catalyzed by
transition metals particularly iron or copper or by elevated temperatures
gt100degC Hydroperoxide decomposition can involve several complex pathways
forming a wide variety of volatile and non-volatile secondary products such as
aldehydes ketones alcohols acids and hydrocarbons which can affect flavor
greatly Some of the volatile aldehydes can be extremely potent and can affect
flavor of food at concentrations less than 1 ppm (31) Another important
termination reaction involves an antioxidant (AH) (30) which will be discussed
later in the chapter
23 Lipid Oxidation in Meat
Meat can oxidize very rapidly post-mortem The rate and degree of lipid
oxidation are affected by factors that include meat composition fatty acid
content processing conditions and chemical additives in the meat products (3)
It is generally agreed that lipid oxidation in muscle foods begins immediately
after slaughter in the highly unsaturated phospholipids fraction in the subcellular
membranes (25) Botsoglou et al (25) added that in most cases fresh meat has an
acceptable stability with respect to oxidation but processing operations such as
freezing and thawing mechanical deboning mincing restructuring the addition
of salt and refrigeration can lead to increased oxidation due to the destruction of
cellular structure and functions
Cooked or pressure-treated meat and meat products can be more
susceptible to oxidation since endogenous antioxidant enzymes may denature
and lose their activities while iron-containing proteins may become a source of
catalytic iron
Poultry meat is particularly susceptible to lipid oxidation due to its high
content of polyunsaturated lipids pigments metal catalysts and various other
8
oxidizing agents (25) This implies that even low-fat poultry meat products are
susceptible to lipid oxidation since fat reduction primarily reflects a reduction in
triacylglycerides while the phospholipid fraction which is high in
polyunsaturated fat is much less affected (34) Another factor is that species
differences in susceptibility to lipid oxidation are largely determined by the level
of poly-unsaturated fatty acid (PUFA) present in meat Thus the extent of lipid
oxidation in cooked meat is directly related to the level of unsaturated fatty lipids
with susceptibility to oxidation decreasing in the order of chicken gt pork gt beef gt
lamb (4) Chicken has fewer tendencies to develop oxidized flavor than turkey
because the higher level of vitamin E in chicken fat retards oxidation Oxidation
proceeds faster in turkey thigh meat than in breast meat as the darker meat
contains more lipid and heme iron (17)
Hydroperoxides formed during lipid peroxidation undergo decomposition
to form secondary oxidation products Those secondary products include volatile
aldehydes ketones acids alcohols and hydrocarbon compounds Aldehydes (ie
hexanal) are one of the primary causes of rancid and stale flavors in precooked
meat products (3)
231 Factors Affecting the Extent of Lipid Oxidative Stability in Meat
There are factors that can affect lipid stability in meat and meat pr0ducts
such as fatty acid composition endogenous prooxidative or antioxidative
components meat processing operations and various additives
2311 Fatty Acid Composition of Meat
It is generally agreed that unsaturated fatty acids (UFA) are responsible
for lipid oxidation in meat Also as the concentration of polyunsaturated fatty
acids (PUFA) increases lipid oxidation increases in muscle foods (4) The amount
of UFA in muscle foods varies depending on the animal species genetic origin
diet sex age at which the animal is slaughtered type of muscle and processing
factors such as fat addition to ground meat (5)
Turkey meat showed low values for total lipid and cholesterol but
greater values than beef pork and lamb for its PUFA content The content of n3
9
fatty acids was the greatest in turkey among meats that included beef pork and
lamb The species is the major source of variation in fatty acid composition The
fatty acid composition of turkey meat is shown in Table 21 (50) Ruminant meats
contain a greater percentage of saturated fat compared with the meat of
monogastric animals (6)
2312 Endogenous prooxidative and antioxidative constituents
Endogenous prooxidative constituents in meat systems consist of iron-
containing proteins transition metals and endogenous enzymes The catalytic
effect of iron-containing protein on the oxidative deterioration of PUFA was first
described by Robinson (35) Since then heme catalyzed lipid oxidation has been
studied extensively and it has become a generally accepted phenomenon that
lipid oxidation is accelerated by heme compounds and transition metals in meat
systems
Lipoxygenase peroxidase and microsomal enzymes identified in various
animal tissues catalyze the reaction of PUFA oxidation with the formation of
unconjugated dienes (7) However enzymatic lipid oxidation catalysts are normal
components in blood and consequently are not a primary problem in most
muscle foods (8)
2313 Meat Processing
According to McMillin (33) quality of raw materials time postmortem
extent of heating and comminution or particle size reduction and the ingredients
added are processing factors that can influence the rate of lipid oxidation Even
though lipid oxidation varies among different animal species such species effects
have been inconsistent and may be due to differences in anatomical location
diet environmental temperature sex age phospholipid content body
composition and experimental conditions such as cooking temperature sample
handling and method for assessing lipid oxidation
Heating encourages the development of lipid oxidation by affecting the
distribution of the iron in the muscle food (9) During cooking a variety of
volatiles producing off-odors and flavors are generated as PUFA oxidize (10)
10
Heat quickly decomposes hydroperoxides produced resulting in the production
of desirable flavor in cooked products The shelf-life of meat products is usually
prolonged by frozen storage Under freezing conditions the rate of oxidation can
be reduced but not completely prevented (1)
Lipid oxidation in cooked meat is commonly referred to as warmed-over-
flavor (WOF) WOF often develops within 1-3 days of refrigerated storage and is
characterized by the loss of fresh cooked meat aroma and a simultaneous
increase in undesirable odors which are commonly described as ldquostalerdquo ldquowet
cardboardrdquo ldquopaintyrdquo ldquograssyrdquo or ldquorancidrdquo (11) The most important contributors
to the development of WOF are the secondary oxidative compounds such as
hexanal pentanal and 2 3- octanedione (12) According to Kerler and Grosch
(59) identified (E E)-2 4-decadienal butyric acid and furaneol as key
compounds in fresh boiled chicken aroma while hexenal butyric acid and 1-
octen-3-one were the main compounds in chicken reheated after 48 hours
storage at 4˚C
The tendency of precooked meat products to oxidize has led food
scientists processors and the industries to develop techniques that allow
extended shelf life of these products In addition to antioxidants the appropriate
packaging and proper storage conditions are useful techniques to achieve
extended storage times
2314 Non-meat Additives
Non-meat additives can be prooxidative or antioxidative agents The
addition of salt NaCl commonly used in meat products to add flavor and
functionality at 05-25 (4) is a prooxidant Salt has been shown to accelerate
oxidation in pork patties (13) by enhancing the activity of iron atoms which then
promotes iron-catalyzed oxidation and flavor deterioration (1) Transitions
metals other than iron (copper especially) supplied by the water from
processing equipment andor spices can also promote oxidation (36)
The use of antioxidants synthetic or natural has been used to prevent lipid
oxidation in meat products The addition of nitrites phosphates citric acid
phytic acid and EDTA has been reported to inhibit lipid oxidation in meat
11
products (10 14) In addition synthetic phenolic antioxidants such as butylated
hydroxytoluene (BHT) butylated hydroxyanisol (BHA) tertiary-butylated
hydroquinone (TBHQ) and propyl gallate has been widely used for more than 50
years to inhibit lipid oxidation in meat products (12)
Several water-soluble compounds including ascorbic acid uric acid
cysteine and glutathione are also known to scavenge radicals and delay oxidation
(37) In meat the functions of ascorbic acid include maintenance of cured color
and prevention of off-flavors (15) Ascorbic acid becomes a prooxidant in meat
products at concentrations greater than 300 mgkg (8)
In the last 30 years natural antioxidant use has increased Various plant
materials and extracts containing polyphenolic compounds have been proven to
be effective antioxidants in meat systems Rosemary and rosemary extracts at
concentrations between 002 to 003 are one of the many natural antioxidants
being studied (3 16-18)
232 Measurement of rancidity in meat
Hydroperoxides the primary products of lipid oxidation are colorless
tasteless and odorless It is the breakdown of these peroxides that produce a
complex mixture of low molecular weight volatile compounds including alkanes
alkenes aldehydes ketones alcohols esters and acids many with distinctive
odor and flavor characteristics (19 38) These compounds convey rancid
cardboard oxidized pungent and other off-flavors characteristic of oxidized meat
(39)
Since oxidative decomposition products are of great importance to product
acceptability and nutritional quality a wide variety of assays from subjective
analyses (ie sensory evaluation) to physical and chemical analyses of various
components have been developed to detect and quantify lipid oxidation in foods
However there is no single effective method to measure all the oxidative
products that are generated during lipid oxidation There is no good method
useful for all stages of oxidation An assay can only monitor only a few changes or
specific reactants when applied to a food system under specific conditions
Therefore a combination of assays would be required to monitor the extent of
12
lipid oxidation in most foods It is also common to apply methods that are based
on measuring one of more of the key primary or secondary oxidation products
2321 Peroxide Value
Since the primary product of lipid oxidation are hydroperoxides it is
proper to determine their concentration as one measure of oxidation The
peroxide value (PV) assay represents the total concentration of peroxides and
hydroperoxides present at a certain time in the food product However this test
is restricted by the chemical instability of these compounds after their
concentration reaches a maximum level they decay as a function of temperature
and the presence of other food components particularly transition metals such
as iron and copper (1)
In muscle tissue the lipid is extracted with a mixture of solvents without
decomposition of the hydroperoxides One of the most common extraction
methods was developed by Folch Lees and Stanley (20) Several methods to
determine the PV have been developed that include iodometric titration method
a ferric thiocyanate method and other colorimetric methods (21 40) PV can be
expressed in several units such as meq iodinekg fat (40) or as meq of
peroxidekg fat (45)
2322 Conjugated Dienes
Conjugated diene hydroperoxides (CDs) are one of the primary products of
the oxidation for linoleate (182) and PUFAs with 3 or more double bonds CDs
can be determined quantitatively by their absorbance at 232-234 nm (22) In
meat samples the CD are first extracted from homogenized sample with an
extracting solution such as 31 hexane isopropanol (23 24)
The greater the amount of PUFA in a fat the greater the potential rise in
the CD values However the CD values plateau at a certain concentration at
which the breakdown roughly equals the formation of new CDs At this point in
the oxidation process no additional changes can be measured by the CD assay
(41)
13
httpwwwchemistrydailycomchemistryDiene
2323 Thiobarbituric Acid Reactive Substances (TBARS)
An alternative approach to the determination of the extent of oxidation is
the measurement of selected secondary oxidation products In contrast to the PV
assay those assays are not limited to the early stages of oxidation and may reflect
the formation of volatile products such as carbonyl compounds which actually
contribute to the rancid and objectionable flavor The application of methods
based on this approach requires a detailed knowledge of the chemistry involved
and an understanding of the stability of the compounds assayed etc Among
these methods the thiobarbituric acid test (TBA) is one of the most common in
spite of criticisms of its reproducibility and reliability The test is based on the
color product resulting from the condensation of TBA with malonaldehyde which
is presumably generated in the oxidized fats However a large body of evidence
suggests that other food components can react with TBA to generate the same
chromophore and even the formation of malonaldehyde is dependent on the
composition of the initial lipid (1) For example other products of lipid oxidation
such as alka-2 4-dienals also react with TBA to form a red complex with the
same absorption maximum as the malonaldehyde-TBA complex shown in the
diagram below (42) For this reason Gray suggested that the TBA procedure
should be used to assess the extent of lipid oxidation in general rather than to
quantify malonaldehyde and the term thiobarbituric acid-reactive substances
(TBARS) is now commonly used in place of the TBA number or value (10)
The extent of lipid oxidation is reported as the TBA number or TBA
value and is expressed as milligrams of malonaldehyde equivalents per kilogram
of sample Malonaldehyde is a relatively minor lipid oxidation product formed
14
during the oxidation of polyunsaturated fatty acids and reacts with TBA to
produce a colored complex with an absorption maximum at 530-532 nm
Malonaldehyde has been reported to correlate well with sensory scores of
oxidized flavors in muscle foods (38) This assay is not recommended for
monitoring the extent of oxidation of food oils
httpmnh20wordpresscom20100719518
2324 Sensory Evaluation
A wide range of methods have been used to examine the effects of lipid
oxidation on the quality of stored turkey meat In addition to the chemical or
instrumental techniques sensory evaluation is very useful for assessing the
quality and stability of meat and meat products from lipid oxidation Most of
these analyses such as the PV TBARs CDs or gas chromatographic analysis of
specific volatiles can be correlated to sensory analysis but none of these chemical
or physical analyses can effectively replace the human nose taste buds and
sensory receptors (43)
According to Warner (43) sensory evaluation is a scientific discipline used
to evoke measure analyze and interpret reactions to food and material
characteristics as they are perceived by sense of sight smell taste touch and
hearing Although sensory evaluation can have a low reproducibility relative to
gas chromatography well-trained and experienced sensory panelists operating
under controlled conditions can provide accurate reliable data The American
Meat Science Association (44) has developed standard guidelines for sensory
analyses The AMSA recommendations include sample preparation cooking
methods and procedures facilities preparation and presentation of samples
15
trained sensory panels test forms consumer panels and instrumental
measurement of tenderness
24 Control of Oxidation Antioxidants
Antioxidants are substances that can delay the onset of lipid oxidation and
extend the induction period They must be added as early as possible in the
manufacturing process or to finished food products to be effective in reducing
lipid oxidation Antioxidants cannot reverse the oxidation of rancid food
products Moreover antioxidants are not effective in controlling hydrolytic
rancidity which is enzyme-catalyzed hydrolysis of fats Antioxidants can control
lipid peroxidation in six ways reducing localized O2 concentrations scavenging
species that initiate peroxidation quenching singlet O2 to prevent the formation
of peroxides binding free metal ions (chelating agent) into a form that will not
generate reactive species or decompose lipid peroxides to peroxyl or alkoxyl
radicals peroxide removal and chain breaking to prevent more hydrogen
abstraction from fatty acid side chains (46) There are three types of antioxidants
based on their mechanism (46 47)
241 Type I - Also called the primary or free-radical chain stopper antioxidants
Type I antioxidants inhibit the chain reaction by acting as hydrogen
donors or free-radical acceptors (AH) (46) Compounds in this category stop the
free radical chain reactions by converting the radicals into more stable products
(47) by reacting primarily with ROO and not with R radicals Basically the
mechanism is a competition between ldquothe inhibitor reactionrdquo (46)
ROO + AH ROOH + A
And ldquothe chain propagation reactionsrdquo
ROO + RH ROOH + R
The effectiveness of a primary antioxidant is dependent on several factors
such as activation energy rate constants oxidation-reduction potential ease of
antioxidant loss or destruction and solubility properties (46) Labuza pointed out
that another important characteristic of an efficient antioxidant is that the
16
resulting antioxidant free radical must not itself initiate new free radicals or be
rapidly oxidized by a chain reaction (46) Type I antioxidants are primarily
phenolic compounds such as butylated hydroxytoluene (BHT) and butylated
hydroxyanisole (BHA) (47) and tert-butylhydroquinone (TBHQ) commonly
present in foods These synthetic food additives are permitted to be used alone or
in combination However the antioxidant content of a food containing these
additives must not exceed 002 of the oil or fat content of the food according to
the Code of Federal Regulations (58)
Butylated Hydroxyanisole
Phenolic compounds synthetic or natural are excellent antioxidants since
they possess benzene rings containing hydroxyl groups and are relatively
reactive Phenols produce stable antioxidant radicals A that are sufficiently
unreactive to propagate the chain and compete with the lipid substrate (RH)
which is present at a much greater concentration (46)
A + ROO Non-radical products
A + A Non-radical products
Since synthetic antioxidants such as BHT and BHA have restrictions for
use in food due to their toxicological effects on several species and they are
suspected to be potential carcinogens (48) the search for natural and safe
antioxidants especially those of plant origin has greatly increased in recent
years
17
242 Type II- Secondary antioxidants or Free-radical production preventer
This category includes compounds that reduce the rate of chain initiation
by metal chelation oxygen scavenging or absorption of UV radiation (47) The
common chelating agents include ethylenediamine tetraacetic acid (EDTA) citric
acid and phosphates EDTA is used for chelation of many metals and it can be an
effective oxidation inhibitor in foods especially those with intermediate to high
moisture content but not in protein-type food such as meats which contain
substantial amounts of bound form of transition metals (46) In addition EDTA
does not protect food during heating because it is less stable at higher
temperatures therefore it is restricted to foods held or processed at cool
temperatures (49) Citric acid is especially useful in oils and intermediate
moisture foods (46) Ascorbic acid is commonly used as a food antioxidant due to
its oxygen scavenging and reducing properties (47) it is especially effective when
it is used in combination with iron chelators (46) Polyphosphates are more
effective chelators and antioxidants than monophosphates However their
antioxidant activity could be reduced or eliminated depending on the
components of the food (50)
Maillard reaction products can bind transition metals such as iron and
deactivate singlet oxygen Because of their dark color and low solubility they are
unsuitable for use in fats and oils but they may be used to improve the oxidative
stability of many foods (51)
Other preventive antioxidants include several enzymes such as catalase
(47) and glutathione peroxidase (37) which reduce the generation of free radicals
by decomposing hydrogen peroxide and hydroperoxides respectively
243 Type III- Control of Environment Factors
This category does not refer to compounds added to inhibit lipid oxidation
Rather this category refers to factors such as the reduction of the oxygen
content a decrease in temperature altering the moisture content (46) and
exclusion of light (47) As the temperature increases oxygen becomes less soluble
in lipids and water slightly influencing the rate The rate of oxidation increases
proportionally to the surface of the lipid exposed to air According to Labuza (46)
18
lipid oxidation can be reduced by altering the water activity which can alter the
catalytic activity of metal catalysts At an elevated water activity (awgt 055) the
rate of oxidation can increase possibly due to the increased mobilization of metal
catalysts
Antioxidant synergism has been observed between primary antioxidants
and between antioxidants with different modes of actions This synergistic effect
can substantially reduce the level of antioxidants needed in a food
25 Keluak As A Natural Source of Antioxidant
251 Keluak ndash Introduction
Pangium edule Reinw (Figure 21) is a tall tropical tree that grows mainly
in Micronesia Melanesia and Southeast Asia including Indonesia The
taxonomy of the tree is uncertain and it may also be classified in the
Flacourtiaceae or the Violale According to Abdullah (55) the tree requires many
years to mature and the seeds are therefore most frequently harvested from wild
trees as it is not economically feasible to cultivate the plant The size of a Pangi
tree is characterized as medium to large with large glossy heart-shaped leaves
that are conspicuously veined and long-stemmed The flowers are large and
greenish and the sexes are separate Flowering occurs from September to October
with seed shed likely to occur in December to January However there are
records of seed shed in April to May and July to September This tropical tree is
wild and not well cultivated (55)
The trees start fruiting when they are approximately 10 to 15 years old The
fruit is oval in shape and the size ranging from 12-30 cm (52) or about a size of a
large husked coconut brown and rough-surfaced (55) The tree produces a large
fruit that is poisonous because of the presence of cyanogenic glucosides (53)
Almost all parts of the plant are poisonous including its leaves barks and seed
(52) Although poisonous to humans the seeds of the tree are part of the natural
diet of the babirusa (Babyroussa babyrussa) (53) a pig-like animal native to the
region However the mature fruit is edible and the juice can be applied to sores
and cuts (55)
19
In Indonesia the seed kernel of this tree is edible after treatments
following the removal of the cyanogenic glucosides Keluak is fermented in a
specific way the seeds are harvested and placed in the field for 10 days The seeds
are then removed washed and boiled for 3 hours to remove the cyanide (54)
After cooling the seeds are buried (indoor) in ash banana leaves and earth for
40 days The seed turn from a creamy white color to dark brown or black (51)
The fermented seeds are cleaned and ready to be used as spices (54) image is
shown in Figure 22 In some countries according to Ma (56) after harvesting the
fruits are buried in the ground for ~100 days before the large seeds are removed
the rest of the plant is poisonous The charcoal-colored nuts are braised for one
hour so the soft flesh can be scooped out of the skin The taste is bitter buttery
and a bit like chocolate while the texture is a familiar one - think mashed
potatoes or roasted chestnuts (56)
Taxonomy of Keluak (55)
Kingdom Plantae
Division Magnoliophyta
Species Pedule
Family Acariaceae
Binomial name Pangium edule Reinw ex Blume
Authority Reinward
Synonym names football fruit kluwek Indonesia black nut kepayang
kluwek keluwek kluwak pangi paying picung penarassan seis
According to Andarwulan et al (54) the fermented seed product of this tree
depending upon the origin is called
Indonesian
o Keluak kluwak kluak kluwek keluwek or kloewak (Dutch spelling)
o Pucung or pucing (Sundanese)
o Rawan or rawon (adjective referring to food prepared with the seed of
this tree) (Figure 23)
Malay
o Kepayang
20
o Payang
Philipines
o Samaun-referring to the oil
o Pangi- referring to the tree
Keluak is commonly used as a spicy flavoring in soups in Java and South
Sulawesi several traditional dishes can be made with Keluak seeds including
ldquoRawonrdquo (Figure 23) and ldquoBlack nut with golden snapperrdquo (Figure 24) Keluak is
also a raw material for another product ldquokecap pangirdquo (ldquokecaprdquo is a soy sauce-like
product) and it has been used as a spice in Saparua Maluku Island in Indonesia
Another of the edible products is called ldquoDagerdquo which is a boiled seed after the
removal of kernels and water after soaking for 2-3 days Dage is utilized in West
java as a vegetable (54) In this document I will use the term ldquoKeluakrdquo and ldquopangi
to refer to the fermented seed that is commonly used as a spice
252 Nutritional Profile of Keluak
The nutrition fact of the Keluak seed is shown in Table 22 Generally
phenolic compounds are found in the seeds and other parts of the plant Most
seeds contain large amounts of polyunsaturated oils and phenolic antioxidants
are necessary to protect the polyunsaturated fatty acids in the oil against
autoxidation (50)
The pangi seed contains some secondary metabolites (Table 23) of the
cyanogen glycosides which include the cyanogen glycoside and various
alkaloids flavonoids steroids saponins tannins and quinine These metabolites
are present in both fresh and dried pangi seed (55)
253 Previous work on keluak
Previous research by Fardiaz and Romlah (57) on the fermented seed
indicated that the methanol extract of keluak possessed antioxidant activity
Fardiaz and Romlah found that the addition of Keluak seed extract to cooking oil
could lengthen the oxidation induction period of the oil Their findings are
summarized in the Table 24 and Figure 25
21
Recently Chye and Sim (52) used several different extraction methods on
Keluak seeds and examined the antioxidant activity of the extract Extracts of
Pangium edule Reinw seed were investigated for their antioxidative activity
using DPPH radical scavenging and β-carotene bleaching assays For the
extraction they used a mixture of acetone acetic acid water which yielded the
higher phenolic content of 2222 plusmn005 mg GAEg among the other methods of
extraction and showed the most potent antioxidative acivity in both DPPH radical
scavenging and β-carotene (Figures 26- 27) They found that significant
correlation was observed between the total phenolic content and its antioxidative
activity (r=0878) suggesting that the phenolics of the Keluak extract could be
potential sources of natural antioxidants (52)
22
26 Figures
Figure 21 Pangium Plant
httpwwwpngplantsorgPNGtreesTreeDescriptionsPangium_edule_Reinwhtml httptravelspotcoolstuffcomgourmet-adventureunusual-food5-lethal-
delicious-meals
Figure 22 Keluak Seed
Source Wayang Brand Kluwak Kupas PT Wira Aksara Jakarta Indonesia
Figure 23 A Dish Made With Keluak Seed- Black Beef Soup (Rawon)
httpwwwlestariwebcomresep-indonesiaEnglishRawonphp
23
Figure 24 A Dish made with Keluak Seed- Black Nut with Golden Snapper
httpdelightfultastebudscom20110501rawon-indonesian-beef-black-soup
Figure 25 The Effect of Kluwak Extract on Oxidation Induction Period of Palm Oil (57)
24
Figure 26 DPPH radical scavenging activity () of Keluak seed extracts at different
concentrations (52)
Phenolic (Ace) = phenolic extracted by acetone Phenolic (EtOAc) = Phenolic extracted by ethyl acetate FPA= Free phenolic acid GBPA= Glycoside-bound
phenolic acid Al= Alkaloid
Figure 27 Antioxidative Activity of Keluak Seed Extracts at 20 mgmL measured by β-
carotene bleaching method (52)
Phenolic (Ace) = phenolic extracted by acetone Phenolic (EtOAc) = Phenolic extracted by ethyl acetate FPA= Free phenolic acid GBPA= Glycoside-bound
phenolic acid Al= Alkaloid
25
27 Tables
Table 21 Fatty Acid Composition of Turkey Meat (50)
Table 22 Nutrition Fact of Keluak Seed
Per 100 grams (or 100 mL)
Energy 2428 kj
Protein 15 g
Fat (Total) 50 g
Carbohydrate (Total) 17 g
Sugar 4 g
Dietary Fiber 10 g
Sodium -
Potassium 680 mg
Calcium 0
Vitamin A 0
Vitamin C 0
Iron 0 Source Wayang Brand Kluwak Kupas PT Wira Aksara Jakarta Indonesia
26
Table 23 Anti- Nutritional Factors of Pangium Seed (55)
Anti- Nutritional Factors Dry wt Basis (microgg)
Arsenic NA
Cyanide 1834
Lead 18
Phytic acid NA
Tannin 046
Alkaloid NA
Table 24 The Antioxidative Activity of Kluwak Expressed as Protective Factor (57)
27
28 References
1 Kanner J Rosenthal I An Assessment of Lipid Oxidation in Foods - Technical Report Pure and Applied Chemistry 1992 64 1959-1964
2 Skibsted LH Understanding oxidation processes in foods Woodhead Publ Food Sci Technol Nutr 2011 199 3-35
3 Yu L Scanlin L Wilson J Schmidt G Rosemary extracts as inhibitors of lipid oxidation and color change in cooked turkey products during refrigerated storage J Food Sci 2002 67 582-585
4 Rhee K Anderson L Sams A Lipid oxidation potential of beef chicken and pork J Food Sci 1996 61 8-12
5 Hernandez P Navarro J Toldra F Lipid composition and lipolytic enzyme activities in porcine skeletal muscles with different oxidative pattern Meat Sci 1998 49 1-10
6 Karakok SG Ozogul Y Saler M Ozogul F Proximate Analysis Fatty Acid Profiles and Mineral Contents of Meats a Comparative Study Journal of Muscle Foods 2010 21 210-223
7 Chan K Decker E Endogenous Skeletal-Muscle Antioxidants Crit Rev Food Sci Nutr 1994 34 403-426
8 Decker E Xu Z Minimizing rancidity in muscle foods Food Technol 1998 52 54-59
9 Rojas MC Brewer MS Effect of natural antioxidants on oxidative stability of cooked refrigerated beef and pork J Food Sci 2007 72 S282-S288
10 Gray J Macdonald B Pearson A Morton I Role of Nitrite in Cured Meat Flavor - a Review J Food Prot 1981 44 302-8
11 Brewer M Vega J Detectable Odor Thresholds of Selected Lipid Oxidation Compounds in a Meat Model System J Food Sci 1995 60 592-595
12 St Angelo A Crippen K Dupuy H James C Chemical and Sensory Studies of Antioxidant-Treated Beef J Food Sci 1990 55 1501-1508
13 Buckley D Gray J Asghar A Price J Crackel R Booren A Pearson A Miller E Effects of Dietary Antioxidants and Oxidized Oil on Membranal Lipid Stability and Pork Product Quality J Food Sci 1989 54 1193-1197
14 Guntensperger B Escher F Oxidative Changes of Heat-Sterilized Meat in Trays J Food Sci 1994 59 689-692
28
15 Bauernfeind JC Antioxidant function of L-ascorbic acid in food technology International journal for vitamin and nutrition researchSupplement = Internationale Zeitschrift fur Vitamin- und ErnahrungsforschungSupplement 1985 27 307-333
16 Georgantelis D Blekas G Katikou P Ambrosiadis I Fletouris DJ Effect of rosemary extract chitosan and alpha-tocopherol on lipid oxidation and colour stability during frozen storage of beef burgers Meat Sci 2007 75 256-264
17 Botsoglou NA Govaris A Giannenas I Botsoglou E Papageorgiou G The incorporation of dehydrated rosemary leaves in the rations of turkeys and their impact on the oxidative stability of the produced raw and cooked meat Int J Food Sci Nutr 2007 58 312-320
18 Karpinska-Tymoszczyk M Effect of the addition of ground rosemary on the quality and shelf-life of turkey meatballs during refrigerated storage Br Poult Sci 2008 49 742-750
19 Drumm T Spanier A Changes in the Content of Lipid Autoxidation and Sulfur-Containing-Compounds in Cooked Beef during Storage J Agric Food Chem 1991 39 336-343
20 Folch J Lees M Stanley GHS A Simple Method For The Isolation And Purification Of Total Lipides From Animal Tissues Journal of Biological Chemistry 1957 226 497-509
21 Grau A Codony R Rafecas M Barroeta A Guardiola F Lipid hydroperoxide determination in dark chicken meat through a ferrous oxidation-xylenol orange method J Agric Food Chem 2000 48 4136-4143
22 Dobarganes M Velasco J Analysis of lipid hydroperoxides European Journal of Lipid Science and Technology 2002 104 420-428
23 Juntachote T Berghofer E Siebenhandl S Bauer F The antioxidative properties of Holy basil and Galangal in cooked ground pork Meat Sci 2006 72 446-456
24 Lee M Choi J Choi Y Han D Kim H Shim S Chung H Kim C The antioxidative properties of mustard leaf (Brassica juncea) kimchi extracts on refrigerated raw ground pork meat against lipid oxidation Meat Sci 2010 84 498-504
25 Botsoglou N and Botsoglou E Oxidation in Foods and Beverages and Antioxidant Applications Vol 2 Management in Different Industry Sectors In Decker EA Elias RJ and McClements D J (eds) Oxidation in Foods and Beverages and Antioxidant Applications Vol 2 Management in Different Industry Sectors 2010 200 1-528
29
26 National Chicken Council Per Capita Consumption of Poultry Livestock 1965 to Estimated 2012 in Pounds 2012 Retrieved in January 23 2012 from httpwwwnationalchickencouncilorgabout-the-industrystatisticsper-capita-consumption-of-poultry-and-livestock-1965-to-estimated-2012-in-pounds
27 Bilgili SF Poultry meat processing and marketing- what does the future hold Poult Internat 2002 12-22
28 Nolan N L Bowers J A and Kropf D H Lipid Oxidation and Sensory Analysis of Cooked Pork and Turkey Stored under Modified Atmospheres Journal of Food Science 1989 54 846ndash849
29 Esteacutevez M Morcuende D and Ventanas S Determination of Oxidation Nollet Leo M LToldraacute Fidel (Eds) Handbook of Muscle Foods Analysis Boca Raton CRC Press 2009 221-240
30 Frankel E N Lipid oxidation Prog Lipid Res 1980 19 1ndash22
31 Frankel E N Volatile Lipid Oxidation Products Progress in lipid research 1983 221 1-33
32 Hsieh R J and J E Kinsella Oxidation of Polyunsaturated Fatty Acids Mechanisms Products and Inhibition with Emphasis on Fish Advances in Food and Nutrition Research 1989 Vol 33
33 McMillin K W Initiation of oxidative processes in muscle foods Annual Proceedings of the Reciprocal Meat Conference Am Meat Sci Assoc Chicago IL 1997 49th 53ndash64
34 Monahan FJ Oxidation of lipids in muscle foods fundamental and applied concerns In EA Decker C Faustman and CJ Lopez-Bote (Eds) Antioxidants in Muscle Foods Nutritional Strategies to Improve Quality New York John Wiley and Sons Inc 2000
35 Robinson M E Haemoglobin and methaemoglobin as oxidative catalysts Biochemical Journal 1924 18 255-264
36 Jadhav SJ Nimbalkar SS Kulkarni AD and MadhaviDL Lipid oxidation in biological and food systems In Marcel Dekker (Eds) Food Antioxidants Technological Toxicological and Health Perspectives New York 1996
37 Niki E Antioxidants and relation to lipid oxidation Chemistry and physics of lipids 1987 44 227-300
38 Gray J I and Monahan FJ Measurement of lipid oxidation in meat and meat products Trends Food Sci Technol 1992 3 315-9
30
39 Chang S S and Peterson R J The Basis of Quality in Muscle Foods Recent Developments In The Flavor of Meat Journal of Food Science 1977 42 298ndash305
40 Lea C H Methods for determining peroxide in lipids J Sci Food Agric 1952 3 586ndash594
41 White P J Conjugated diene anisidine value and carbonyl value analysis In Warner K and Eskin N A M (Eds) Methods to Access Quality and Stability of Oils and Fat-Containing Foods Champaign IL AOCS Publishing 1995 159-177
42 Coxon D Measurement of lipid oxidation Food Science and Technology Today 1987 1164-6
43 Warner K Sensory evaluation of oils and fat-containing foods In K Warner and N A M Eskin (Eds) Methods to Access Quality and Stability of Oils and Fat-Containing Foods AOCS Publishing 1995 49
44 AMSA Research Guidelines for cookery sensory evaluation and instrumental tenderness measurements of fresh meat American Meat Science Association-National Live Stock and Meat Board 1995
45 Association of Official Analytical Chemists Official methods of analysis (16th ed) Washington DC Association of Official Analytical Chemists 1995
46 Labuza T P and Dugan L R Kinetics of lipid oxidation in foods C R C Critical Reviews in Food Technology 1971 2 3
47 Gordon MF The mechanism of antioxidant action in vitro In Hudson BJF (Ed) Food Antioxidants London Elsevier Applied Science 1990 1-18
48 Shahidi F Janitha P Wanasundara P Phenolic Antioxidants Crit Rev Food Sci Nutr 1992 32 67-103
49 Roozen JP Effects of types I II and III antioxidants on phospholipid oxidation in a meat model for warmed over flavour Food Chem 1987 24 167-185
50 Pokornyacute J Natural antioxidants for food use Trends in Food Science and Technology 1991 2 223-227
51 Wong W H Buah Keluak National Parks 11 Jan 2007 Retrieved 02 July 2012 from httpenwikipediaorgwikiPangium_edule
52 Chye FY Sim KY Antioxidative and Antibacterial Activities of Pangium edule Seed Extracts International Journal of Pharmacology 2009 5 285-297
31
53 Andarwulan N Fardiaz D Wattimena GA Shetty K Antioxidant activity associated with lipid and phenolic mobilization during seed germination of Pangium edule Reinw J Agric Food Chem 1999 47 3158-3163
54 Andarwulan N Fardiaz S Apriyantono A Hariyadi P Shetty K Mobilization of primary metabolites and phenolics during natural fermentation in seeds of Pangium edule Reinw Process Biochemistry 1999 35 197-204
55 Abdullah Moh A B Phyochemical Composition of Fresh and Cooked of Chesnut (Castanopsis argentea) Pangium (Pangium edule) and Pra (Elateriospermum tapos) Seeds Final Year Project Food Science and Technology in the Faculty of Applied Sciences Universiti Teknologi Mara Malaysia January 2012 Retrieved on July 4 2012 from httpeprintsptaruitmedumy49401MOHD_ASRUL_BIN_ABDULLAH_12_24pdf
56 Ma A A Peranakan favorite is ayam buah keluak Chicken stewed with black nuts at True Blue RestaurantWall Street Journal (Online) New York NY Dec 16 2010 Retrieved July 4 2012 from httpproquestumicompqdwebdid=2214039511ampsid=1ampFmt=3ampclientId=36305ampRQT=309ampVName=PQD
57 Fardiaz D Romlah S Antioxidant activity of picung (Pangium edule Reinw) seed In Development of Food Science and Technology in ASEAN Proceedings of the Fourth ASEAN Food Conference February 17ndash21 1992 ASEAN Jakarta Indonesia 1992 814ndash819
58 Food and Drugs Administration Food Additives Permitted for Direct Addition to Food for Human Consumption Code of Federal Regulations Title 21 pt 172190 2006
59 Kerler J Grosch W Character impact odorants of boiled chicken changes during refrigerated storage and reheating Zeitschrift Fur Lebensmittel-Untersuchung Und-Forschung A-Food Research and Technology 1997 205 232-238
60 Baggio S Vicente E Bragagnolo N Cholesterol oxides cholesterol total lipid and fatty acid composition in turkey meat J Agric Food Chem 2002 50 5981-5986
32
CHAPTER 3 MATERIALS AND METHODS
31 Keluak Antioxidant and Chemicals
Keluak (Kupas Wayang Brandreg Peeled Keluak Nuts PT Wira Aksara
Jakarta Indonesia was manufactured for Empire International East Chief
Privado Ontario CA 91761) Butylated hydroxytoluene (BHT) gallic acid (ACS
reagent) and 2-thiobarbituric acid were obtained from Sigma Chemical
Company St Louis MO USA Sodium chloride (crystal ARreg ACS) was obtained
from Mallinckrodt Baker Inc (Phillipsburg NJ USA)
The reagents used included acetone (Certified ACS) and chloroform (certified
ACS) obtained from Fisher Scientific Fair Lawn NJ USA Acetic acid (Glacial
ACS reagent) was purchased from J T Baker (Center Valley PA 18034 USA)
and Folin Ciocalteursquos phenol reagent (2 N) was purchased from Sigma-Aldrich
(St Louis MO USA)
311 Phenolic Extraction
Keluak seeds were ground into fine pieces using a coffee grinder (Braun
Inc Lynnfield MA USA) The fatty material from the ground seed was removed
first using a method modified from Wettasinghe and Shahidi (1) The ground seed
was washed with n-hexane (16 gg) and placed in a sonicator for 15 minutes
with occasional stirring The mixture was vortexed for 30 secs before it was
centrifuged at 2688 x g for 10 minutes (Sorvallreg Instrument RC-5B Du Pont
Company Wilmington DE USA) The upper fat-soluble layer was discarded
The solid was washed 2 ndash 3 additional times The solids remained at the bottom
after washing The defatted solids were then air-dried overnight under the hood
to remove any solvent residue
Forty grams of dried defatted Keluak seeds were extracted by stirring with
200 mL of solvent (acetone water acetic acid 90 95 05 vvv) at 60degC and
600 rpm for 2 hrs The mixture was then filtered through filter paper (Whatman
1 Buckinghamshire UK) The filtrate was collected and dried at 45degC using a
rotary evaporator until no further weight changes occurred The concentrated
extract was further dried using a vacuum oven at 45degC overnight The extract was
33
collected dissolved in 100 ethanol flushed with Argon gas and stored at -20degC
until further use
312 Total Phenolics content
The total phenolic content was measured using the Folin-Ciocalteu assay
as modified by Waterhouse (13) The phenolic extract was diluted with 100
ethanol to make several dilutions (1100 2100 and 10100) One milliliter of each
dilution was added to a test tube containing 5 mL of deionized water Then 05
mL of 50 Folin-Ciocalteu reagent was added to the test tube The solution was
mixed and allowed to stand for 8 mins at 22degC before adding 1 mL of 5 sodium
carbonate (wv) The mixture was vortexed using a touch mixer (model 231
Fisher Scientific Pittsburgh PA USA) and incubated in the dark for 1 hr The
solution was vortexed a second time before reading the absorption with a UV-
spectrophotometer (Spectronic Genesys 5 spectrophotometer Thermo Electron
Corporation Madison WI USA) at 725 nm against DI water A standard curve
was prepared at the same time with gallic acid at concentrations ranging from 0
to 100 mgL The quantity of total phenolic content in the sample was calculated
as gallic acid equivalents (GAE) from the standard curve using the formula
C = c times (V divide m) where
C is total phenolic content (mg GAEg extract)
c is the concentration of gallic acid obtained from the calibration curve (mgmL)
V is volume of sample (mL)
m is mass of the sample extract (g)
32 Sample Preparation
Ground turkey meat (15 fat Jennie-O Turkey Store Wilmar MN USA)
purchased from a local grocery store at day 0 and was immediately divided into 4
treatments according to the formulation (Table 31) (2 3)
(1) Control- No antioxidant
(2) Commercial antioxidant- 002 BHT (ww of lipid)
(3) Natural antioxidant- 002 Keluak extract (ww of lipid)
34
(4) Natural antioxidant ndash 004 Keluak extract (ww of lipid)
The level of Keluak extract antioxidant used was based on the amount of
fat in each formula Salt was dissolved in water prior to addition to the meat The
water addition was 5 of the ground meat (ww) The antioxidant and salt were
mixed in the liquid first before adding it to the meat by sprinkling while mixing
After the antioxidant salt and liquid addition mixing by hand (wearing gloves)
was continued for 5 mins The meat mixture was prepared into patties of uniform
size (using a cookie cutter diameter= 55 cm thickness= 15 cm) The patties
were cooked in an electrical skillet and temperature was monitored by Digi-
Sensereg Scanning Thermometer (Model 92000-00 Cole Parmer Instrument Co
Barrington IL) using copper-constantin thermocouple wires (Type T Omega
Engineering Inc Stamford CT) to an endpoint temperature of 74degC The cooked
patties were cooled and placed in a single layer on a tray and then overwrapped
in commercial PVC (water vapor transmission rate=15 g100 m224 h oxygen
transmission rate 880 cm3m224 h) and aluminum foil over the wrap The
patties were stored at 2degC in the dark and were assayed for the extent of oxidation
by odor sensory TBARS conjugated dienes and peroxide value analysis at days
0 1 3 5 7 for the first study (2)
In a second separate study a longer storage time study was completed to
examine the effect of antioxidants on the cooked ground turkey over a longer
time period The same procedure for antioxidant addition and meat sample
preparation was used However in the second study the samples were stored for
a total of 15 days (5 6) Samples were collected at days 0 1 3 5 7 10 13 15 for
TBARS conjugated dienes peroxide values and pH determinations
33 Thiobarbituric Acid Reactive Substances (TBARS)
Lipid oxidation was assessed by the 2-thiobarbituric acid (TBA) method of
Tarladgis and others (4) and Yu et al (5) Briefly 10 g of meat was homogenized
with 50 mL of deionized water using a homogenizer (IKAreg T25 digital Ultra-
Turrax Wilmington NC USA) The homogenate was filtered through 1
Whatman paper Five mL of the clear filtrate was mixed with 5 mL TBA reagent
35
containing 002 M TBA in 90 glacial acetic acid The mixture was capped
vortexed for 30 secs and incubated in the dark for 15-18 hrs at room temperature
After the color developed the mixture was measured for absorbance at 532 nm
against a blank (deionized water) The absorbance was converted to TBAR values
using 1133- tetraethoxypropane to prepare a standard curve Triplicates of 10 g
samples were prepared for each treatment TBA value is expressed as mg MDA
kg meat
34 Conjugated Dienes
Conjugated dienes (CD) were determined by the method described by
Juntachote and others (6) with slight modifications A cooked meat sample (05
g) was suspended in 5 mL of deionized water and homogenized using a digital
Ultra-Turrax T25 (IKAreg Wilmington NC USA) to obtain a smooth slurry A 05
mL aliquot of this suspension was mixed with 5 mL of extracting solution
containing hexane and isopropanol (31 vv) and mixed for 1 min using a vortex
mixer After centrifugation at 2000 g for 5 mins the supernatant was collected
and the absorbance of the supernatant was determined at 233 nm The
concentration of conjugated dienes was calculated using a molar extinction
coefficient of 25200 M-1cm-1 and the result were expressed as nmole of
conjugated dienes per mg meat sample
35 Peroxide Value
The peroxide value was determined according to the AOAC method 96533
(Association of Official Analytical Chemists) (13) with a few modifications The
lipids from meat samples were extracted by the method of Kim et al (7) First 5 g
of meat sample was broken into small pieces and placed in a water bath at 60˚C
to melt the fat for 30 mins The meat was extracted with a solution containing
acetic acid chloroform (32) and then filtered with Whatman 1 filter paper A
saturated solution of potassium iodide (KI 05 mL) was added to the filtrate The
solution color changed to yellow and then 30 mL of deionized water was added
The mixture was allowed to let stand at room temperature for at least 5 mins and
the color would turn to pale to bright yellow Before titrating with 001 N of
36
sodium thiosulfate (Na2SO3) 05 mL of 1 starch solution was added (a color
changed occurred - the color turned purple to blue-black) The PV is expressed as
meq O2kg lipid
36 pH value
To determine the pH of the meat samples cooked meat samples (10 g)
were blended with 50 mL deionized water for 15 seconds in a homogenizer
(Ultra-Turrax T25 IKAreg Wilmington NC USA) The pH was measured with a
pH meter (Accumet Basic model AB 15 Fisher Scientific Company) The pH
meter was calibrated daily with standard buffers of pH 40 and 70 at 25˚C
37 Sensory Evaluation
Trained panelists (n=15) were recruited from among University of Illinois
graduate students and staff The panelists were prepared using an extensive
training program During each training session panel members practiced and
discussed the techniques developed for sample presentation score sheet terms
and odor sensory evaluation method A panel leader led the panelists to develop
terms to describe the aroma characteristics of fresh cooked turkey meat including
the aroma characteristics of cooked poultry with or without the added Keluak
extract Panel members were trained regularly for 7 sessions for total of two
weeks to identify and discriminate aroma differences Some of the terms were
derived from reference standards including fresh boiled ground turkey meat
lard oxidized vegetable oil hard-boiled egg and wet cardboard (Table 32) The
panelists agreed on the following aroma descriptors for warm-over-flavor meaty
fatty rancid eggy and cardboardy These descriptors were judged for the
presence and overall intensity using a 15 cm-structured line scale (0 = none 15 =
extreme) along with an anchor value for each respective standard Table 2
showed the form used to evaluate the aroma descriptors described above
Cooked patties were uniformly cut into four pie-shaped wedges and placed
in a sniff bottle (Nalgene Teflon PTFE wash bottle Nalge Company Rochester
NY USA) covered with foil to hide the identity of the sample inside Each sample
represented a treatment labeled with three-digit random numbers and were
37
served at random order during each test session The samples were held in an
incubator (45degCplusmn 1degC) for 30 mins prior to presentation to the panelists The
panelists were asked to clean their palate by chewing a piece of unsalted saltine
crackers and rinse with water prior to evaluating the samples Samples were
sniffed Four samples were evaluated for each test session Roasted coffee beans
were presented for panelists to clear the palate between samples Standard
references were prepared daily The second session replicates of the first session
was conducted one week after the first session
38 Statistical Analysis
Statistical assessment was carried out with the program SAS Data were
analyzed as 4 (treatments) by 5 (days of storage) The results from the TBARs
analysis peroxide value analysis conjugated dienes analysis and the
odorsensory analysis were analyzed using one-way analysis of variance
(ANOVA) Differences were considered significant at the P lt 005 level
Comparison of treatment means was based on Fisherrsquos Least Significant
Difference (LSD)
38
39 Tables
Table 31 Formulation of Cooked Ground Turkey Meat for Each Treatment
TREATMENTS
Control BHT AO 200ppm AO 400ppm
INGREDIENTS
Jenny-O 15 fat Ground Turkey
(g) 650 650 650 650
Salt (2 ww) (g) 13 13 13 13
BHT (002 of total fat) (g) 002
Keluak extract (mL)
2487 (002 g
phenolics)
4974 (004 g
phenolics)
Cold water (mL)5 by sample wt
(ww) 325 325 325 325
Table 32 Descriptive Odor Standards for Refrigerated Ground Turkey Meat
Descriptive Odor term Standard Location on the 15-cm line
Rancid Oxidized vegetable oil in water (1100 vv) 7
Cardboard 1 cm2 cardboard in 15 mL water 85
Eggy Fresh hard-boiled egg white (01 g) 9
Meaty Fresh boiled ground turkey meat in water (15 gv) 8
Fatty Lard (02 g) 9
39
310 References
1 Wettasinghe M Shahidi F Antioxidant and free radical-scavenging properties of ethanolic extracts of defatted borage (Borago officinalis L) seeds Food Chem 1999 67 399-414
2 Vara-Ubol S Bowers J Effect of alpha-tocopherol beta-carotene and sodium tripolyphosphate on lipid oxidation of refrigerated cooked ground turkey and ground pork J Food Sci 2001 66 662-667
3 Hassan O Fan L The anti-oxidation potential of polyphenol extract from cocoa leaves on mechanically deboned chicken meat (MDCM) Lwt-Food Science and Technology 2005 38 315-321
4 Tarladgis B Dugan L Pearson A Chemistry of 2-Thiobarbituric Acid Test for Determination of Oxidative Rancidity in Foods 2 Formation of Tba-Malonaldehyde Complex without Acid-Heat Treatment J Sci Food Agric 1964 15 602-amp
5 Yu L Scanlin L Wilson J Schmidt G Rosemary extracts as inhibitors of lipid oxidation and color change in cooked turkey products during refrigerated storage J Food Sci 2002 67 582-585
6 Juntachote T Berghofer E Siebenhandl S Bauer F The antioxidative properties of Holy basil and Galangal in cooked ground pork Meat Sci 2006 72 446-456
7 Kim YJ Jin SK Park WY Kim BW Joo ST Yang HS The Effect of Garlic Or Onion Marinade on the Lipid Oxidation and Meat Quality of Pork during Cold Storage J Food Qual 2010 33 171-185
8 Chye FY Sim KY Antioxidative and Antibacterial Activities of Pangium edule Seed Extracts International Journal of Pharmacology 2009 5 285-297
9 Kahkonen M Hopia A Vuorela H Rauha J Pihlaja K Kujala T Heinonen M Antioxidant activity of plant extracts containing phenolic compounds J Agric Food Chem 1999 47 3954-3962
10 Jayaprakasha G Selvi T Sakariah K Antibacterial and antioxidant activities of grape (Vitis vinifera) seed extracts Food Res Int 2003 36 117-122
11 Fardiaz D Romlah S Antioxidant Activity of Picung (Pangium edule Reinw) Seed In Development of Food Science and Technology in ASEAN Proceedings of the 4th ASEAN Food Conference Feb 17-21 1992 ASEAN Jakarta Indonesia 1992 12 Waterhouse A L Determination of Total Phenolics Current Protocols in
Food Analytical Chemistry 2002 I111-I118
40
13 Association of Official Analytical Chemists (1995) Official methods of analysis (16th ed) Washington DC Association of Official Analytical Chemists
41
Chapter 4 RESULTS AND DISCUSSION
41 Phenolic Extraction Yield
The phenolic extract yield using acetone water acetic acid (90 95 05)
extraction was 503 plusmn 140 g of extract per 70 g of defatted ground Keluak seed or
007 g phenolic extract per gram of defatted Keluak The samples contained
approximately 719 phenolic compounds by weight the values are equal to the
average plusmn standard deviation of the three replicate analyses This value was
moderately greater than that reported by Chye and Sim (1) which reported a
548 yield The total phenolic content as determined using Folin-Ciocalteau
reagent was 1973 plusmn 203 mg GAEg extract which was also moderately greater
than the result reported by Chye and Sim which was 1639plusmn 004 mg GAEg
extract (1) It is possible that the difference is due to the Keluak source Chye and
Sim obtained their seeds material from local indigenous markets in Kota
Kinabalu Sabah Malaysia (1) while the seeds used in this study were grown in
from Indonesia The geographical and horticultural differences could affect the
phenolic content and concentration of the seed
According to Kahkonen et al (2) different phenolic compounds can have
different responses in the Folin Ciocalteau method depending on their chemical
structure Therefore the antioxidant activity of an extract cannot be predicted
solely on its total phenolic content (3 4)
42 Effect of Keluak Extract and storage time on TBARS values during
refrigerated storage of cooked ground turkey
The TBARS values represent the content of secondary lipid oxidation
products particularly malonaldehyde The carbonyls are primarily responsible
for the production of off-flavors in oxidized meat and meat products Aldehydes
are formed by the oxidation of unsaturated fatty acids They react with the TBA
reagent to form a pink complex (TBA chromogen) with a maximum absorbance
at 532 nm The intensity of this pink color is directly related to the concentration
of the TBA-reactive substances in the original sample The results of the TBARs
analysis for the preliminary study (7 days) and the extended storage study (15
days) are shown in Tables 41a b and Figures 41a b respectively Overall lipid
42
oxidation increased substantially as the refrigerated storage progressed due to
the effects of heating and in combination with storage under aerobic conditions
On the first day of analysis for both the 7 and 15 days storage study all the
antioxidant treated samples (BHT and both concentrations of the Keluak
extracts) the TBARS values were significantly lower than the control an
indication that the antioxidants had a positive effect in suppressing oxidation
Similar findings were observed by Juntachote et al and Teets et al (5 6) TBARS
values for both 7 and 15 days storage study ranges from 035- 475 mg MDA kg
meat which was comparable to other study by Juntachote (5) for 14 days of
storage study of pork meat There were examining the effect other natural
sources of antioxidants on oxidation during refrigerated storage of cooked meat
During the preliminary study (Table 41a) the control and BHT treatments
did not show significant differences (Pgt005) from day 1-7 However both of the
Keluak extract treatments showed a significant (Plt005) effect on the
suppression of the progression of lipid oxidation as compared to the control
(Figure 41a)
On the other hand during the 15 day study all the samples with added
antioxidants had significantly lower TBAR values compared to the control
throughout the entire storage period This indicates that both the commercial
treatment and the treatment with Keluak extracts provided substantial protection
to the meat with respect to lipid oxidation The efficacy of the Keluak extracts to
inhibit lipid oxidation is probably related to their phenolic content The results of
this study showed agreement with those obtained by Fardiaz and Romlah (14)
which stated that the addition of Keluak extract to palm oil lengthened the
oxidation induction period from 22 hours to 50 hours
Lipid oxidation was considerably greater with longer storage times due to
the exposure to oxygen TBARs measure the formation of secondary lipid
oxidation products which contribute to WOF in oxidized meat Heat increases the
release of non-heme iron from the heme pigments a major catalyst for lipid
oxidation in cooked meats (7) Cooking also alters cellular compartmentalization
and exposes membrane phospholipids to molecular oxygen and metal ions (8)
43
resulting in greater amounts of lipid oxidation (9) The addition of antioxidants
during processing cooking or packaging can be done to increase the oxidative
stability of cooked meat (10)
43 Effect of Keluak Extract and Storage Time on Conjugated Diene
Content during Refrigerated Storage of Cooked Ground Turkey
Meat
The development of conjugated dienes (CD) is related to the formation of
hydroperoxides found in the extracted lipids of the cooked ground turkey
Unsaturated fatty acid double bonds occur naturally in a methylene interrupted
structure As meat begins to oxidize the double bonds of these fatty acids are
altered creating conjugated systems which can be measured
spectrophotometrically (6) During lipid peroxidation non-conjugated double
bonds (C=CndashCndashC=C) which are present naturally in unsaturated lipids are
converted to conjugated double bonds (C=CndashC=C) with a large increased in
absorption at 232ndash234 nm (11) In the preliminary study there were no significant differences among the
antioxidant treated sample and the control (Pgt005) except on day 5 (Figure 42a
and Table 42a) The CD value for all the treatments peaked at day 5 and the
samples treated with antioxidants were significantly different that the control
(Plt005)
Meanwhile during the second storage study (Table 42b and Figure 42b)
when the CD values were compared to the control on day 0 and day 1 the 002
BHT and both of the Keluak extract treated samples were not significantly
different (Pgt005) However from day 3 on all the antioxidant-treated samples
had less CD formation than the control (Plt005) The CD content of the control
generally increased especially during the last 5 days (Day 10 13 and 15) of the
study Additionally cooked ground turkey treated with Keluak at 400 ppm had
slightly lower concentrations of conjugated dienes compared to cooked ground
turkey containing Keluak extract at 200 ppm and the commercial antioxidant
(BHT) The trend of CD formation was similar to several other studies (5 6 12
13) They generally observed that the CD concentration for most samples peaked
44
on Day 3 and decreased thereafter This phenomenon of decreased CD is likely
due to the decomposition of the conjugated diene hydroperoxides into secondary
oxidation products over time Conjugated dienes hydroperoxides are expected to
decompose into secondary products as was observed in this study According to
Frankel (15) the formation of conjugated dienes which is related to the
production of hydroperoxides occurs in the early stages of lipid oxidation According to Estevez et al (17) measurement of conjugated dienes (CD) in
meat products containing elevated levels of PUFA is limited depending on the
fatty acid composition of the sample as well as the presence of other non-
hydroperoxides CDs In agreement with Grau et al (18) the TBA test showed a
higher sensitivity with respect to lipid oxidation than did the CD determination
44 Effect of Keluak extract and storage time on peroxide value during
refrigerated storage of cooked ground turkey
Peroxide values (PV) were also used to assess the level of lipid oxidation in
cooked ground turkey during storage at 2˚C (Table 43 and Figure 43) However
while there were differences between the control and samples treated with AOs
on a few days the result of this study showed that treatments had no significant
effect (Pgt005) on the peroxide values compared to the control Generally based
on the results in Table 4 and Figure 4 the PVs increased during storage and
peaked on day 10 At the time it is possible that much of the polyunsaturated
membrane lipids may have been oxidized at that point so that further storage
and oxidation resulted in a decrease in the concentration of peroxides and thus
the PV
The PV differences among the samples did not provide proof that any of
the AOs were effective It is not clear why the PV analysis did not provide any
evidence of AO efficacy According to Estevez (17) the sensitivity of this method
is about 05 miliEquivalentkg of lipid Lower peroxide values cannot be
measured satisfactorily by the AOCS method because of the uncertainty with the
iodometric titration endpoint unless the iodine-starch end is determined
potentiometrically at levels as low as 006 Eqkg lipid The iodometric method is
highly empirical and very small procedural differences can cause variation in the
45
results (19) Two major sources of error in this test could be the liberation of
iodine by air oxidation of the KI and absorption of iodine by fatty acid double
bonds (17)
4 5 Effect of Keluak Extract and storage time on Odor of Refrigerated
Cooked Ground Turkey
No significant interaction (Pgt 005) occurred between antioxidant and
storage time for most of the odor characteristics (Tables and Figures 44-48)
For meaty odor characteristic (Figure and Table 44) the score of all the
treatments over the 7 days of storage did not show significant differences
(Pgt005) The scores ranged from 502 ndash 783 which was slightly below the
freshly boiled turkey meat standard for meaty (which was ranked 8 in the 15-cm
line scale) Therefore the panelists were unable to score and detect the cooked
meat aroma differences in the treated samples relative to the standard reference
The meaty aroma in this study was used to determine if there were possible
masking effects from the AO treatments
For the rancid odor (Figure and Table 45) both of the Keluak treated
samples were perceived as more rancid than both control and BHT after day 1
Overall both of the Keluak treated samples were ranked higher than the control
and BHT which disagrees with the results of TBA test However there was no
significant difference among the treatments between day 3-7 According to Ruth
(20) rancidity as a measure of lipid oxidation is usually best measured by the
concentration of TBARS
The minimum TBA values that corresponds to dark chicken meat samples
that were significantly different in rancid aroma was 1933 μg MDAkg of meat
(21) For consumer acceptability the TBA values must be less than 785 μg of
MDAkg (21) The results from Bou et al (21) were comparable to the results
reported by Gray and Pearson (22) showing that rancid flavor in meats is initially
detected between 500 and 2000 μg of MDAkg of meat In addition OrsquoNeill et
al (23) found that the threshold for WOF detection in cooked dark chicken meat
was at TBA values ge800 μg of MDAkg of meat Since chicken and turkey meat
46
have a comparable PUFA content those values were considered useful in this
experiment On the other hand the odor score for Eggy cardboard and fatty were
statistically not different (Pgt 005) Panelists were unable to detect differences
which could be to different reasons such as that Keluak extract has an aroma
masking effect that confuses the panelists with the ldquooff-odorrdquo The Keluak did
have a slight aroma and it is likely that it masked the effects of storage on lipid
oxidation The aroma of Keluak has been described as bitter dirt-like and
chocolate-like odor (16) This aroma masking could be perceived as undesirable
by the panelists and it might have been mistaken as an off-odor or as an oxidized
sample even though the TBARs and CD data showed otherwise
4 6 Effect of Keluak Extract and storage time on pH of Refrigerated
Cooked Ground Turkey
Table 49 shows the effect of antioxidant treatments in pork muscle on pH
values during storage at 2˚C The values of the pH ranged between 633-668
Generally there are no correlations of pH value among the treatments during
storage The trend for the pH value is inconclusive
47
47 Figures Figure 41a The profile of TBARS in cooked ground turkey treated with various
antioxidants during storage at 2˚C- A Preliminary Study
K200 and K400 represent treatments with Keluak extract at concentration of 200 and 400 ppm respectively
0000
1000
2000
3000
4000
5000
6000
0 2 4 6 8
TBA
RS
(mg
MD
Ak
g m
eat
)
Storage Days
Control
BHT
K200
K400
48
Figure 41b The profile of TBARS in Cooked Ground Turkey Treated with Various Antioxidants During Storage at 2˚C- Extended Storage Time
K200 and K400 represent Keluak extract at concentration of 200 and 400 ppm respectively
Figure 42a Conjugated dienes values of different antioxidant treatments over storage at
2˚C - A Preliminary Study
K200 and K400 represent treatments with Keluak extract at concentration of 200 and 400 ppm
respectively
000
100
200
300
400
500
600
0 5 10 15 20
TBA
RS
(mg
MD
Ak
g m
eat
)
Storage time (days)
Control
BHT 002
K200
K400
0000
0050
0100
0150
0200
0250
0300
0350
0400
0450
0 1 2 3 4 5 6 7 8
Co
nju
gate
d D
ien
es
(nm
ol
mg
me
at)
Days
Control
BHT
K200
K400
49
Figure 42b Conjugated dienes values of different antioxidant treatments over storage at
2˚C- Extended Storage Time
K200 and K400 represent treatments with Keluak extract at concentration of 200 and 400 ppm respectively
Figure 43 Peroxide Value (meq kg meat) of Different Antioxidant treatments over
Storage at 2˚C
K200 and K400 represent treatments with Keluak extract at concentration of 200 and 400 ppm
respectively
000
002
004
006
008
010
012
014
016
0 5 10 15 20
Co
nju
gate
d D
ien
es
(nm
ol
mg
me
at)
Storage (days)
Control
BHT 002
K200
K400
0
05
1
15
2
25
3
35
4
0 2 4 6 8 10 12 14 16
PV
(m
eq
kg
me
at)
Storage Time (Days)
Control
BHT 002
K200
K400
50
Figure 44 Intensity of Meaty Odor Descriptor in Cooked Ground Turkey Meat Treated
with Different Antioxidants Rated in a 15-cm Line Scale
K200 and K400 represent Treatment with Keluak extract at concentration of 200 and 400 ppm
respectively
Figure 45 Intensity of Rancid Odor Descriptor in Cooked Ground Turkey Meat Treated
with Different Antioxidants Rated in a 15-cm Line Scale
K200 and K400 represent Treatment with Keluak extract at concentrations of 200 and 400 ppm
respectively
000
200
400
600
800
1000
1200
0 2 4 6 8
15
cm
Lin
e s
cale
(av
era
ge)
Days
CONTROL
BHT
K200
K400
Linear (BHT)
-100
000
100
200
300
400
500
600
700
800
0 2 4 6 8
15
cm
Lin
e s
cale
(av
era
ge)
Days
Control
BHT
K200
K400
51
Figure 46 Intensity of Eggy Odor Descriptor in Cooked Ground Turkey Meat Treated
with Different Antioxidants Rated in a 15-cm Line Scale
K200 and K400 represent Treatment with Keluak extract at concentrations of 200 and 400 ppm
respectively
Figure 47 Intensity of Cardboard Odor Descriptor in Cooked Ground Turkey Meat
Treated with Different Antioxidants Rated in a 15-cm Line Scale
K200 and K400 represent Treatment with Keluak extract at concentrations of 200 and 400 ppm
respectively
000
100
200
300
400
500
600
700
800
900
1000
0 2 4 6 8
15
cm
Lin
e s
cale
(av
era
ge)
Days
Control
BHT
K200
K400
-1
0
1
2
3
4
5
6
7
0 2 4 6 8
15
cm
Lin
e s
cale
(av
era
ge)
Days
Control
BHT
K200
K400
52
Figure 48 Intensity of Fatty Odor Descriptor in Cooked Ground Turkey Meat Treated
with Different Antioxidants Rated in a 15-cm Line Scale
K200 and K400 represent Treatment with Keluak extract at concentrations of 200 and 400 ppm
respectively
000
100
200
300
400
500
600
700
800
900
0 2 4 6 8
15
cm
Lin
e s
cale
(av
era
ge)
Days
Control
BHT
K200
K400
53
48 Tables
Table 41a TBARS Value of Cooked Ground Turkey Meat Treated with Various Antioxidants during Storage at 2˚C- A Preliminary Study
TBARS (mg MDAkg meat) Average
Storage (Day) Control BHT 002 Keluak 200ppm Keluak 400ppm
0
131plusmn009Aa 094plusmn021Ba 050plusmn004Ca 037plusmn010Ca
1
189plusmn003Aab 161plusmn025Aab 080plusmn006Ba 057plusmn026Bab
3
243plusmn010Ac 236plusmn025Abc 111plusmn022Bab 055plusmn008Cab
5
397plusmn016Ad 319plusmn064Acd 170plusmn025Bbc 108plusmn023Bb
7
473plusmn076Ad 373plusmn074ABd 217plusmn040ACc 101plusmn044Cab
Different letters (A-D) within a row indicates that mean values are significantly different (Plt 005) Different letters within a column (a-d) within the same treatment are significantly different (Plt005)
Table 41b TBARS Value of Cooked Ground Turkey Meat Treated with Various Antioxidants during Storage at 2 ˚C- Extended Storage Time
TBARS (mg MDAkg meat) Average
Storage (day) Control BHT 002 K200 K400
0 129 plusmn 008Ae 091plusmn 004Bcd 065plusmn 015Be 101plusmn 003Cf
1 159plusmn 008Ade 076plusmn 005Cd 083plusmn 012Ce 127plusmn 006Bf
3 220plusmn 011Acd 074plusmn 004Dd 119plusmn 003Cd 160plusmn 004Be
5 258plusmn 014Ac 082plusmn 006Cd 076plusmn 014Ce 150plusmn 004Bd
7 377plusmn 001Ab 109plusmn 002Ccb 158plusmn 006Bc 160plusmn 006Bd
10 405plusmn 061Aab 121plusmn 009Bb 197plusmn 012Bb 195plusmn 009Bc
13 465plusmn 014Aa 151plusmn 004Ca 224plusmn 003Bab 218plusmn 003Bb
15 459plusmn 024Aa 154plusmn 013Da 231plusmn 014Ca 284plusmn 010Ba
Different letters (A-D) within a row indicates that mean values are significantly different (Plt 005) Different letters within a column (a-f) within the same treatment are significantly different (Plt005)
K200 and K400 represent treatments with Keluak extract at concentration of 200 and 400 ppm
respectively
54
Table 42a Conjugated Dienes Concentrations with Antioxidant Treatments and Storage
At 2˚C- A Preliminary Study
Conj Dienes (nmolemg meat)
Storage (Days) Control BHT 002 K200 K400
0 015plusmn003Abc 022plusmn001Aa 013plusmn001Ab 020plusmn008Aa
1 012plusmn001Abc 012plusmn003Ab 011plusmn001Ab 019plusmn001Bab
3 006plusmn000Ac 003plusmn002Ac 002plusmn002Ab 004plusmn002Ab
5 038plusmn000Aa 024plusmn001Ba 027plusmn007ABa 021plusmn001Ba
7 023plusmn008Ab 026plusmn001Aa 029plusmn003Aa 016plusmn001Aab
Different letters (A-C) within a row indicates that mean values are significantly different (Plt 005) Different letters within a column (a-d) within the same treatment are significantly different (Plt005)
K200 and K400 represent treatments with Keluak extract at concentration of 200 and 400 ppm
respectively
Table 42b Conjugated Dienes Concentrations After Antioxidant Treatments and
Storage At 2˚C- Extended Storage Time
Conjugated Dienes (nM mg meat)
Storage (Days) Control BHT 002 K200 K400
0 013plusmn 001Aab 009plusmn000Bab 010plusmn 000Ba 010plusmn 001Ba
1 008plusmn 001Ac 008plusmn 001Ab 008plusmn 000Abc 007plusmn 001Ab
3 011plusmn 000Ab 009plusmn 001Bab 008plusmn 000Bbc 006plusmn 000Cb
5 012plusmn001Ab 008plusmn 001B b 006plusmn 000Bd 006plusmn 000Bb
7 011plusmn001Abc 008plusmn 000B ab 006plusmn 001Bcd 007plusmn 000Bb
10 014plusmn 000Aa 009plusmn 000Bab 009plusmn 001Bab 007plusmn 000Cb
13 014plusmn 001Aa 009plusmn 000Bab 008plusmn 000Bbc 006plusmn 000Cb
15 014plusmn 000Aa 010plusmn 001Ba 008plusmn 001BCbcd 007plusmn 000Cb
Different letters (A-C) within a row indicates that mean values are significantly different (Plt 005) Different letters within a column (a-d) within the same treatment are significantly different (Plt005)
K200 and K400 represent treatments with Keluak extract at concentration of 200 and 400 ppm
respectively
55
Table 43 Peroxide Value (meq kg meat) of Different Antioxidant treatments during
Storage of cooked ground turkey meat at 2˚C
PV (meq kg meat)
Storage (Days) Control BHT 002 K200 K400
0 110plusmn 042Abc 070plusmn 014Ae 080plusmn 028Ad 130plusmn 014Acd
1 230plusmn 014Aab 130plusmn 014Bd 090plusmn 014BCd 070plusmn 014Cd
3 080plusmn 000Ac 070plusmn 014Ae 070plusmn 014Ad 070plusmn 014Ad
5 280plusmn 028Aa 140plusmn 000Bcd 110plusmn 014Bcd 080plusmn 028Bd
7 170plusmn 042Aabc 190plusmn 014Ac 195plusmn 021Abc 225plusmn 049Abc
10 310plusmn 042Aa 330plusmn 014Aa 290plusmn 042Aa 340plusmn 028Aa
13 255plusmn 007Aa 265plusmn 021Ab 240plusmn 028Aab 260plusmn 028Aab
15 255plusmn 064Aa 150plusmn 014ABcd 086plusmn 006Bd 100plusmn 028Bd
Different letters (A-C) within a row indicates that mean values are significantly different (Plt 005) Different letters within a column (a-e) within the same treatment are significantly different (Plt005)
K200 and K400 represent Treatment with Keluak extract at concentrations of 200 and 400 ppm
respectively
Table 44 Intensity of Meaty Odor Descriptor in Cooked Ground Turkey Meat Treated with Different Antioxidants Rated in a 15-cm Line Scale
Storage (Day) Control BHT 002 K200 K400
0 595plusmn250Aa 727plusmn144Aa 632plusmn202Aa 606plusmn189Aa
1 783plusmn208Aa 731plusmn174ABa 543plusmn220Ba 542plusmn294Ba
3 613plusmn201Aa 693plusmn143Aa 502plusmn266Aa 552plusmn228Aa
5 734plusmn277Aa 710plusmn290Aa 474plusmn253Aa 487plusmn263Aa
7 694plusmn296Aa 751plusmn265Aa 532plusmn259Aa 543plusmn236Aa
Different letters (A-C) within a row indicates that mean values are significantly different (Plt 005) Different letters within a column (a-b) within the same treatment are significantly different (Plt005)
K200 and K400 represent Treatment with Keluak extract at concentrations of 200 and 400 ppm
respectively
56
Table 45 Intensity of Rancid Odor Descriptor in Cooked Ground Turkey Meat Treated
with Different Antioxidants Rated in a 15-cm Line Scale
Storage (Day) Control BHT 002 K200 K400
0 228plusmn194Aa 193plusmn175Aa 334plusmn231Aa 350plusmn274Aa
1 177plusmn194Aa 172plusmn163Aa 392plusmn274ABa 426plusmn265Ba
3 260plusmn210Aa 272plusmn265Aa 419plusmn306Aa 337plusmn247Aa
5 344plusmn255Aa 329plusmn215Aa 427plusmn248Aa 395plusmn253Aa
7 408plusmn300Aa 289plusmn244Aa 448plusmn241Aa 385plusmn244Aa
Different letters (A-B) within a row indicates that mean values are significantly different (Plt 005) Different letters within a column (a-b) within the same treatment are significantly different (Plt005)
K200 and K400 represent Treatment with Keluak extract at concentrations of 200 and 400 ppm
respectively
Table 46 Intensity of Eggy Odor Descriptor in Cooked Ground Turkey Meat
Treated with Different Antioxidants Rated in a 15-cm Line Scale
Storage (Day) Control BHT 002 K200 K400
0 643plusmn242Aa 513plusmn244Aa 502plusmn324Aa 565plusmn287Aa
1 597plusmn248Aab 476plusmn321Aa 599plusmn332Aa 584plusmn360Aa
3 345plusmn258Ab 400plusmn270Aa 515plusmn335Aa 509plusmn425Aa
5 364plusmn303Aab 424plusmn320Aa 475plusmn269Aa 469plusmn180Aa
7 473plusmn306Aab 364plusmn210Aa 485plusmn268Aa 431plusmn305Aa
Different letters (A-C) within a row indicates that mean values are significantly different (Plt 005) Different letters within a column (a-e) within the same treatment are significantly different (Plt005)
K200 and K400 represent Treatment with Keluak extract at concentrations of 200 and 400 ppm
respectively
57
Table 47 Intensity of Cardboard Odor Descriptor in Cooked Ground Turkey Meat
Treated with Different Antioxidants Rated in a 15-cm Line Scale
Storage (Day) Control BHT 002 K200 K400
0 299plusmn222Aa 209plusmn182Aa 261plusmn198Aa 312plusmn157Aa
1 262plusmn249Aa 180plusmn192Aa 339plusmn238Aa 342plusmn229Aa
3 299plusmn203Aa 284plusmn254Aa 388plusmn235Aa 287plusmn185Aa
5 252plusmn243Aa 290plusmn190Aa 309plusmn193Aa 320plusmn204Aa
7 301plusmn210Aa 273plusmn253Aa 337plusmn195Aa 284plusmn205Aa
Different letters (A-C) within a row indicates that mean values are significantly different (Plt 005) Different letters within a column (a-e) within the same treatment are significantly different (Plt005)
K200 and K400 represent Treatment with Keluak extract at concentrations of 200 and 400 ppm
respectively
Table 48 Intensity of Fatty Odor Descriptor in Cooked Ground Turkey Meat Treated with Different Antioxidants Rated in a 15-cm Line Scale
Storage (Day) Control BHT 002 K200 K400
0 344plusmn226aA 350plusmn256aA 395plusmn309aA 395plusmn277aA
1 417plusmn285aA 389plusmn230aA 401plusmn345aA 438plusmn287aA
3 388plusmn220aA 378plusmn229aA 396plusmn328aA 403plusmn285aA
5 479plusmn252aA 461plusmn293aA 389plusmn255aA 428plusmn320aA
7 460plusmn288aA 492plusmn286aA 426plusmn281aA 428plusmn340aA
Different letters (A-C) within a row indicates that mean values are significantly different (Plt 005) Different letters within a column (a-e) within the same treatment are significantly different (Plt005)
K200 and K400 represent Treatment with Keluak extract at concentrations of 200 and 400 ppm
respectively
58
Table 49 pH Values of Cooked Ground Turkey Treated with Different
Antioxidants Stored at 2˚C
pH Value
Storage (Day) Control BHT 002 K200 K400
0 665plusmn 002Aab 644plusmn 003Bbc 646plusmn 004Bbc 658plusmn 003Aab
1 659plusmn 003Ab 643plusmn 003Cbc 651plusmn 001Babc 662plusmn 001Aab
3 645plusmn 003Bc 634plusmn 002Cd 643plusmn 004Bc 654plusmn 000Ab
5 663plusmn 002Aab 640plusmn 002Cc 645plusmn 004Cc 654plusmn 002Bb
7 647plusmn 001Ac 633plusmn 003Bc 648plusmn 004Aabc 646plusmn 006Ac
10 665plusmn 001Aab 646plusmn 002Dbc 654plusmn 001Cab 660plusmn 003Bab
13 665plusmn 002Aab 648plusmn 002Cab 655plusmn 002Ba 664plusmn 002Aa
15 668plusmn 001Aa 651plusmn 001Da 655plusmn 001Ca 663plusmn 001Ba
Different letters (A-D) within a row indicates that mean values are significantly different (Plt 005) Different letters within a column (a-c) within the same treatment are significantly different (Plt005)
K200 and K400 represent treatments with Keluak extract at concentrations of 200 and 400 ppm
respectively
59
49 References
1 Chye FY Sim KY Antioxidative and Antibacterial Activities of Pangium edule Seed Extracts International Journal of Pharmacology 2009 5 285-297
2 Kahkonen M Hopia A Vuorela H Rauha J Pihlaja K Kujala T Heinonen M Antioxidant activity of plant extracts containing phenolic compounds J Agric Food Chem 1999 47 3954-3962
3 Jayaprakasha G Selvi T Sakariah K Antibacterial and antioxidant activities of grape (Vitis vinifera) seed extracts Food Res Int 2003 36 117-122
4 Gray J Macdonald B Pearson A Morton I Role of Nitrite in Cured Meat Flavor - a Review J Food Prot 1981 44 302-amp
5 Juntachote T Berghofer E Siebenhandl S Bauer F The antioxidative properties of Holy basil and Galangal in cooked ground pork Meat Sci 2006 72 446-456
6 Teets AS Were LM Inhibition of lipid oxidation in refrigerated and frozen salted raw minced chicken breasts with electron beam irradiated almond skin powder Meat Sci 2008 80 1326-1332
7 Han D McMillin K Godber J Bidner T Younathan M Marshall D Hart L Iron Distribution in Heated Beef and Chicken Muscles J Food Sci 1993 58 697-700
8 Ahn D Wolfe F Sim J Prevention of Lipid Oxidation in Precooked Turkey Meat Patties with Hot Packaging and Antioxidant Combinations J Food Sci 1993 58 283-287
9 Asghar A Gray J Buckley D Pearson A Booren A Perspectives on Warmed-Over Flavor Food Technol 1988 42 102-108
10 Kingston E Monahan F Buckley D Lynch P Lipid oxidation in cooked pork as affected by vitamin E cooking and storage conditions J Food Sci 1998 63 386-389
11 Kulas E Ackman R Different tocopherols and the relationship between two methods for determination of primary oxidation products in fish oil J Agric Food Chem 2001 49 1724-1729
12 Srinivasan S Xiong Y Decker E Inhibition of protein and lipid oxidation in beef heart surimi-like material by antioxidants and combinations of pH NaCl and buffer type in the washing media J Agric Food Chem 1996 44 119-125
13 Lee M Choi J Choi Y Han D Kim H Shim S Chung H Kim C The antioxidative properties of mustard leaf (Brassica juncea) kimchi extracts on
60
refrigerated raw ground pork meat against lipid oxidation Meat Sci 2010 84 498-504
14 Fardiaz D Romlah S Antioxidant Activity of Picung (Pangium edule
Reinw) Seed In Development of Food Science and Technology in ASEAN
Proceedings of the 4th ASEAN Food Conference Feb 17-21 1992 ASEAN
Jakarta Indonesia 1992
15 Frankel E N Lipid oxidation Dundee Scotland The Oily Press Ltd 1998 Vol 10 pp 13ndash41 16 Ma Amy A Peranakan favorite is ayam buah keluak Chicken stewed with black nuts at True Blue Restaurant Wall Street Journal (Online) New York NY Dec 16 2010 Retrieved July 20 2011 from httpproquestumicompqdwebdid=2214039511ampsid=1ampFmt=3ampclientId=36305ampRQT=309ampVName=PQD
17 Esteacutevez M Morcuende D and Ventanas S Determination of Oxidation
Nollet Leo M LToldraacute Fidel (Eds) Handbook of Muscle Foods Analysis Boca
Raton CRC Press 2009 221-240
18 Grau A Codony R Rafecas M Barroeta A Guardiola F Lipid
hydroperoxide determination in dark chicken meat through a ferrous oxidation-
xylenol orange method J Agric Food Chem 2000 48 4136-4143
19 Shahidi F Janitha P Wanasundara P Phenolic Antioxidants Crit Rev Food Sci Nutr 1992 32 67-103
20 Ruth SM Techniques for sampling and identification of volatile compounds contributing to sensory perception In Nollet Leo M LToldraacute Fidel (Eds) Handbook of Muscle Foods Analysis Boca Raton CRC Press 2009 503-523
21 Bou R Guardiola F Grau A Grimpa S Manich A Barroeta A Codony R Influence of dietary fat source alpha-tocopherol and ascorbic acid supplementation on sensory quality of dark chicken meat Poult Sci 2001 80 800-807
22 Gray J I and A M Pearson Rancidity and warmed over flavour In Pearson A M and Dutson T R (Eds) Advances in Meat Research Vol 3 Nostrand-Reinbold Co New York NY 1987 221ndash269 23 OrsquoNeill L M K Galvin P A Morrissey and D J Buckley Comparison of effects of dietary olive oil tallow and vitamin E on the quality of broiler meat and meat products Br Poult Sci 1998 39 365ndash371
61
Chapter 5 CONCLUSION AND FUTURE WORK
The results of the present study indicated that the Keluak extract
incorporated into cooked ground turkey can reduce lipid oxidation The addition
of Keluak extracts at 200 and 400 ppm had a positive effect on reducing the
TBAR values and the conjugated dienes content compared to the control without
added AOs during storage at 2˚C for 15 days The Keluak extract used in this
study was comparable to BHT (002) in reducing lipid oxidation in meat
Peroxide value analysis did not differentiate between the control and the
treatments on the extent of lipid oxidation Due to confusion of the odor
components in the Keluak extracts by the panelists there were no significant
differences between the treatments in the odor sensory evaluation
Keluak seed is a culinary spice with no known toxic effect Its moderate
pungent aroma makes it valued as a traditional ethnic food flavorant in parts of
South East Asia With its substantial phenolic content and antioxidant properties
it could be an effective source of natural antioxidants However the application
of this natural antioxidant might be limited in Western cultures due to its effect
on the color and odor of meat products Further investigations are needed to
identify selective extraction and clean-up techniques that could be used to
eliminate the color and odor problem Other chemical analysis methods that
might provide better information on the extent of oxidation in meat products
include the p-anisidine value Food Oil Sensor (FOS) and Gas chromatography
techniques (GC analysis) of selected volatiles
3
12 References List
1 McKibben J Engeseth N Honey as a protective agent against lipid oxidation in ground turkey J Agric Food Chem 2002 50 592-595
2 Oxidation in Foods and Beverages and Antioxidant Applications Vol 2 Management in Different Industry Sectors Oxidation in Foods and Beverages and Antioxidant Applications Vol 2 Management in Different Industry Sectors 2010 200 1-528
3 Khalil A Mansour E Control of lipid oxidation in cooked and uncooked refrigerated carp fillets by antioxidant and packaging combinations J Agric Food Chem 1998 46 1158-1162
4 Yu L Scanlin L Wilson J Schmidt G Rosemary extracts as inhibitors of lipid oxidation and color change in cooked turkey products during refrigerated storage J Food Sci 2002 67 582-585
5 Rojas MC Brewer MS Effect of natural antioxidants on oxidative stability of cooked refrigerated beef and pork J Food Sci 2007 72 S282-S288
6 Juntachote T Berghofer E Siebenhandl S Bauer F The antioxidative properties of Holy basil and Galangal in cooked ground pork Meat Sci 2006 72 446-456
7 Hassan O Fan L The anti-oxidation potential of polyphenol extract from cocoa leaves on mechanically deboned chicken meat (MDCM) Lwt-Food Science and Technology 2005 38 315-321
8 Andarwulan N Fardiaz D Wattimena GA Shetty K Antioxidant activity associated with lipid and phenolic mobilization during seed germination of Pangium edule Reinw J Agric Food Chem 1999 47 3158-3163
9 Andarwulan N Fardiaz S Apriyantono A Hariyadi P Shetty K Mobilization of primary metabolites and phenolics during natural fermentation in seeds of Pangium edule Reinw Process Biochemistry 1999 35 197-204
10 Chye FY Sim KY Antioxidative and Antibacterial Activities of Pangium edule Seed Extracts International Journal of Pharmacology 2009 5 285-297
11 Fardiaz D Romlah S Antioxidant Activity of Picung (Pangium edule Reinw) Seed In Development of Food Science and Technology in ASEAN Proceedings of the 4th ASEAN Food Conference Feb 17-21 1992 ASEAN Jakarta Indonesia 1992
4
Chapter 2 REVIEW OF LITERATURE
21 Trend in Poultry Consumption
Consumption of poultry meat has increased in both developed and
developing countries (25) In the US per capita poultry meat consumption
increased from 79 pounds in 1990 to 954 pounds in 2000 and to just over 100
pounds in 2011 (26) Overall according to the National Chicken Council (6) per
capita consumption of red meat and poultry has not changed significantly but
when beef pork and poultry are examined separately red meat appears to be
losing market share to poultry Chicken and turkey were by far the most widely
consumed poultry species at approximately 822 and 164 pounds per person per
year respectively (26) According to Bilgili (27) it is predicted that poultry will
become the overall meat of choice by 2020
This continued growth and the competitive nature of the poultry industry
has been attributed to a variety of factors such as improvements in intensive
production and processing and development of a wide range of value-added
processed products that meet both direct consumer demand and the rapid
expansion of fast food outlets Poultry products are universally popular because
they are often not subject to cultural or religious constraints and the meat itself is
perceived as wholesome healthy and nutritious since it is relatively low in fat
and it has a more desirable unsaturated fatty acid composition than other meats
Most importantly high quality poultry products are available to many people at
affordable prices even though production costs vary widely around the world
(25) Precooked meat products have attained a high degree of consumer
acceptance because of the relative cost and ease of preparation (28)
Due to the increase in consumption the world production of poultry has
increased the past few decades The industry will remain responsive to consumer
demands both in the range and nature of the products developed although the
focus on quality will continue While the term ldquoqualityrdquo is defined according to
the consumerrsquos own perceptions goals and personal preferences however in
practicality product quality includes scientifically measurable characteristics of
color texture and flavor One main factor limiting the quality and acceptability of
5
meat and meat products is lipid oxidation a process that leads to deterioration of
quality characteristics such as color flavor texture nutritive value and safety
(25) Therefore the meat industry faces a challenge in developing strategies for
preventing lipid oxidation in meat and meat products
22 Lipid Oxidation
221 Overview
A wide variety of organic molecules are susceptible to chemical attack by
oxygen Lipid oxidation can occur in foods containing considerable amounts of
fat (particularly fats containing substantial percentages of unsaturated fatty
acids) including nuts milk and meat products (1) Oxidation of lipids is initiated
by irradiation including exposure to visible light by enzymes and metal catalysts
Heat and pressure will accelerate lipid oxidation (2) Quality attributes of foods
can be substantially affected by this process For instance negative aroma
changes in the food can result from volatile oxidation products the color can
darken as a result of condensation reactions between oxidation products and
proteins and lastly the texture can be modified by the oxidative induction of
protein crosslinks (1) Not unexpectedly the nutritive value and safety can also be
compromised
222 Mechanism of Lipid Oxidation
Lipid autoxidation is a free radical chain reaction that once the
peroxidation process is initiated it proceeds as a free-radical mediated chain
reaction that can be described in terms of initiation propagation and termination
processes (29)
2221 Initiation
R H R + H (1)
An initiator reacts with unsaturated lipids (RH) to form a lipid free radical
(R) (reaction 1) Unsaturated lipids (RH) are easily oxidized by one of several
reactive oxygen species (ROS) which include oxygen radicals and non-radical
derivatives of oxygen (29) such as O2 and OH Poly-unsaturated fatty acids
Initiator
6
(PUFA) are much more susceptible to oxidation than mono-unsaturated fatty
acid (MUFA) (46)
The initiation reaction can include transition metals (ie iron copper)
oxidants various hemolysis-prone substances or enzymes (1) This production of
free radicals can occur because of the direct thermal dissociation (thermolysis) of
hydroperoxides because of transition metal catalysis or exposure to light
(photolysis) with or without the intervention of photosensitizers (30) The
spontaneous abstraction of a hydrogen atom from an organic material by
molecular oxygen is an endothermic reaction which has a large activation energy
and although it might occur to a certain extent this stage is probably too slow to
be of practical importance Either the organic molecule or the oxygen should be
activated before the reaction could take place (1)
2222 Propagation
R + O2 ROO (2)
ROO + RH rarr ROOH + R (3)
An unsaturated lipid contains labile hydrogen(s) that can be abstracted
relatively easily This free radical (R) will react rapidly with molecular oxygen to
produce a peroxyl radical (ROO ) (reaction 2) The newly formed hydroperoxyl
radical can so forth abstract a hydrogen atom from an adjacent unsaturated fatty
acid (reaction 3) and the reaction goes on propagation cycles before termination
(29)
2223 Termination
ROO + ROO rarr non-radical products [ROOOOR] (4)
RO + R rarr ROR
R + R rarr RR
R + ROO rarr ROOR
Termination can occur by condensation of peroxy alkoxy andor alkyl
radicals Peroxy radicals at room temperature can combine to produce peroxy-
linked dimers (ROOR) Alkoxy and alkyl radicals at low oxygen pressure and
7
high temperatures can combine to produce ether-linked dimers (ROR) and
carbon-carbon linked dimers (RR) Alkyl radicals can combine with peroxy
radicals to generate peroxy-linked dimers (ROOR) (30-32)
Hydroperoxides the primary initial products of lipid oxidation can
breakdown as soon as they are formed The decomposition can be catalyzed by
transition metals particularly iron or copper or by elevated temperatures
gt100degC Hydroperoxide decomposition can involve several complex pathways
forming a wide variety of volatile and non-volatile secondary products such as
aldehydes ketones alcohols acids and hydrocarbons which can affect flavor
greatly Some of the volatile aldehydes can be extremely potent and can affect
flavor of food at concentrations less than 1 ppm (31) Another important
termination reaction involves an antioxidant (AH) (30) which will be discussed
later in the chapter
23 Lipid Oxidation in Meat
Meat can oxidize very rapidly post-mortem The rate and degree of lipid
oxidation are affected by factors that include meat composition fatty acid
content processing conditions and chemical additives in the meat products (3)
It is generally agreed that lipid oxidation in muscle foods begins immediately
after slaughter in the highly unsaturated phospholipids fraction in the subcellular
membranes (25) Botsoglou et al (25) added that in most cases fresh meat has an
acceptable stability with respect to oxidation but processing operations such as
freezing and thawing mechanical deboning mincing restructuring the addition
of salt and refrigeration can lead to increased oxidation due to the destruction of
cellular structure and functions
Cooked or pressure-treated meat and meat products can be more
susceptible to oxidation since endogenous antioxidant enzymes may denature
and lose their activities while iron-containing proteins may become a source of
catalytic iron
Poultry meat is particularly susceptible to lipid oxidation due to its high
content of polyunsaturated lipids pigments metal catalysts and various other
8
oxidizing agents (25) This implies that even low-fat poultry meat products are
susceptible to lipid oxidation since fat reduction primarily reflects a reduction in
triacylglycerides while the phospholipid fraction which is high in
polyunsaturated fat is much less affected (34) Another factor is that species
differences in susceptibility to lipid oxidation are largely determined by the level
of poly-unsaturated fatty acid (PUFA) present in meat Thus the extent of lipid
oxidation in cooked meat is directly related to the level of unsaturated fatty lipids
with susceptibility to oxidation decreasing in the order of chicken gt pork gt beef gt
lamb (4) Chicken has fewer tendencies to develop oxidized flavor than turkey
because the higher level of vitamin E in chicken fat retards oxidation Oxidation
proceeds faster in turkey thigh meat than in breast meat as the darker meat
contains more lipid and heme iron (17)
Hydroperoxides formed during lipid peroxidation undergo decomposition
to form secondary oxidation products Those secondary products include volatile
aldehydes ketones acids alcohols and hydrocarbon compounds Aldehydes (ie
hexanal) are one of the primary causes of rancid and stale flavors in precooked
meat products (3)
231 Factors Affecting the Extent of Lipid Oxidative Stability in Meat
There are factors that can affect lipid stability in meat and meat pr0ducts
such as fatty acid composition endogenous prooxidative or antioxidative
components meat processing operations and various additives
2311 Fatty Acid Composition of Meat
It is generally agreed that unsaturated fatty acids (UFA) are responsible
for lipid oxidation in meat Also as the concentration of polyunsaturated fatty
acids (PUFA) increases lipid oxidation increases in muscle foods (4) The amount
of UFA in muscle foods varies depending on the animal species genetic origin
diet sex age at which the animal is slaughtered type of muscle and processing
factors such as fat addition to ground meat (5)
Turkey meat showed low values for total lipid and cholesterol but
greater values than beef pork and lamb for its PUFA content The content of n3
9
fatty acids was the greatest in turkey among meats that included beef pork and
lamb The species is the major source of variation in fatty acid composition The
fatty acid composition of turkey meat is shown in Table 21 (50) Ruminant meats
contain a greater percentage of saturated fat compared with the meat of
monogastric animals (6)
2312 Endogenous prooxidative and antioxidative constituents
Endogenous prooxidative constituents in meat systems consist of iron-
containing proteins transition metals and endogenous enzymes The catalytic
effect of iron-containing protein on the oxidative deterioration of PUFA was first
described by Robinson (35) Since then heme catalyzed lipid oxidation has been
studied extensively and it has become a generally accepted phenomenon that
lipid oxidation is accelerated by heme compounds and transition metals in meat
systems
Lipoxygenase peroxidase and microsomal enzymes identified in various
animal tissues catalyze the reaction of PUFA oxidation with the formation of
unconjugated dienes (7) However enzymatic lipid oxidation catalysts are normal
components in blood and consequently are not a primary problem in most
muscle foods (8)
2313 Meat Processing
According to McMillin (33) quality of raw materials time postmortem
extent of heating and comminution or particle size reduction and the ingredients
added are processing factors that can influence the rate of lipid oxidation Even
though lipid oxidation varies among different animal species such species effects
have been inconsistent and may be due to differences in anatomical location
diet environmental temperature sex age phospholipid content body
composition and experimental conditions such as cooking temperature sample
handling and method for assessing lipid oxidation
Heating encourages the development of lipid oxidation by affecting the
distribution of the iron in the muscle food (9) During cooking a variety of
volatiles producing off-odors and flavors are generated as PUFA oxidize (10)
10
Heat quickly decomposes hydroperoxides produced resulting in the production
of desirable flavor in cooked products The shelf-life of meat products is usually
prolonged by frozen storage Under freezing conditions the rate of oxidation can
be reduced but not completely prevented (1)
Lipid oxidation in cooked meat is commonly referred to as warmed-over-
flavor (WOF) WOF often develops within 1-3 days of refrigerated storage and is
characterized by the loss of fresh cooked meat aroma and a simultaneous
increase in undesirable odors which are commonly described as ldquostalerdquo ldquowet
cardboardrdquo ldquopaintyrdquo ldquograssyrdquo or ldquorancidrdquo (11) The most important contributors
to the development of WOF are the secondary oxidative compounds such as
hexanal pentanal and 2 3- octanedione (12) According to Kerler and Grosch
(59) identified (E E)-2 4-decadienal butyric acid and furaneol as key
compounds in fresh boiled chicken aroma while hexenal butyric acid and 1-
octen-3-one were the main compounds in chicken reheated after 48 hours
storage at 4˚C
The tendency of precooked meat products to oxidize has led food
scientists processors and the industries to develop techniques that allow
extended shelf life of these products In addition to antioxidants the appropriate
packaging and proper storage conditions are useful techniques to achieve
extended storage times
2314 Non-meat Additives
Non-meat additives can be prooxidative or antioxidative agents The
addition of salt NaCl commonly used in meat products to add flavor and
functionality at 05-25 (4) is a prooxidant Salt has been shown to accelerate
oxidation in pork patties (13) by enhancing the activity of iron atoms which then
promotes iron-catalyzed oxidation and flavor deterioration (1) Transitions
metals other than iron (copper especially) supplied by the water from
processing equipment andor spices can also promote oxidation (36)
The use of antioxidants synthetic or natural has been used to prevent lipid
oxidation in meat products The addition of nitrites phosphates citric acid
phytic acid and EDTA has been reported to inhibit lipid oxidation in meat
11
products (10 14) In addition synthetic phenolic antioxidants such as butylated
hydroxytoluene (BHT) butylated hydroxyanisol (BHA) tertiary-butylated
hydroquinone (TBHQ) and propyl gallate has been widely used for more than 50
years to inhibit lipid oxidation in meat products (12)
Several water-soluble compounds including ascorbic acid uric acid
cysteine and glutathione are also known to scavenge radicals and delay oxidation
(37) In meat the functions of ascorbic acid include maintenance of cured color
and prevention of off-flavors (15) Ascorbic acid becomes a prooxidant in meat
products at concentrations greater than 300 mgkg (8)
In the last 30 years natural antioxidant use has increased Various plant
materials and extracts containing polyphenolic compounds have been proven to
be effective antioxidants in meat systems Rosemary and rosemary extracts at
concentrations between 002 to 003 are one of the many natural antioxidants
being studied (3 16-18)
232 Measurement of rancidity in meat
Hydroperoxides the primary products of lipid oxidation are colorless
tasteless and odorless It is the breakdown of these peroxides that produce a
complex mixture of low molecular weight volatile compounds including alkanes
alkenes aldehydes ketones alcohols esters and acids many with distinctive
odor and flavor characteristics (19 38) These compounds convey rancid
cardboard oxidized pungent and other off-flavors characteristic of oxidized meat
(39)
Since oxidative decomposition products are of great importance to product
acceptability and nutritional quality a wide variety of assays from subjective
analyses (ie sensory evaluation) to physical and chemical analyses of various
components have been developed to detect and quantify lipid oxidation in foods
However there is no single effective method to measure all the oxidative
products that are generated during lipid oxidation There is no good method
useful for all stages of oxidation An assay can only monitor only a few changes or
specific reactants when applied to a food system under specific conditions
Therefore a combination of assays would be required to monitor the extent of
12
lipid oxidation in most foods It is also common to apply methods that are based
on measuring one of more of the key primary or secondary oxidation products
2321 Peroxide Value
Since the primary product of lipid oxidation are hydroperoxides it is
proper to determine their concentration as one measure of oxidation The
peroxide value (PV) assay represents the total concentration of peroxides and
hydroperoxides present at a certain time in the food product However this test
is restricted by the chemical instability of these compounds after their
concentration reaches a maximum level they decay as a function of temperature
and the presence of other food components particularly transition metals such
as iron and copper (1)
In muscle tissue the lipid is extracted with a mixture of solvents without
decomposition of the hydroperoxides One of the most common extraction
methods was developed by Folch Lees and Stanley (20) Several methods to
determine the PV have been developed that include iodometric titration method
a ferric thiocyanate method and other colorimetric methods (21 40) PV can be
expressed in several units such as meq iodinekg fat (40) or as meq of
peroxidekg fat (45)
2322 Conjugated Dienes
Conjugated diene hydroperoxides (CDs) are one of the primary products of
the oxidation for linoleate (182) and PUFAs with 3 or more double bonds CDs
can be determined quantitatively by their absorbance at 232-234 nm (22) In
meat samples the CD are first extracted from homogenized sample with an
extracting solution such as 31 hexane isopropanol (23 24)
The greater the amount of PUFA in a fat the greater the potential rise in
the CD values However the CD values plateau at a certain concentration at
which the breakdown roughly equals the formation of new CDs At this point in
the oxidation process no additional changes can be measured by the CD assay
(41)
13
httpwwwchemistrydailycomchemistryDiene
2323 Thiobarbituric Acid Reactive Substances (TBARS)
An alternative approach to the determination of the extent of oxidation is
the measurement of selected secondary oxidation products In contrast to the PV
assay those assays are not limited to the early stages of oxidation and may reflect
the formation of volatile products such as carbonyl compounds which actually
contribute to the rancid and objectionable flavor The application of methods
based on this approach requires a detailed knowledge of the chemistry involved
and an understanding of the stability of the compounds assayed etc Among
these methods the thiobarbituric acid test (TBA) is one of the most common in
spite of criticisms of its reproducibility and reliability The test is based on the
color product resulting from the condensation of TBA with malonaldehyde which
is presumably generated in the oxidized fats However a large body of evidence
suggests that other food components can react with TBA to generate the same
chromophore and even the formation of malonaldehyde is dependent on the
composition of the initial lipid (1) For example other products of lipid oxidation
such as alka-2 4-dienals also react with TBA to form a red complex with the
same absorption maximum as the malonaldehyde-TBA complex shown in the
diagram below (42) For this reason Gray suggested that the TBA procedure
should be used to assess the extent of lipid oxidation in general rather than to
quantify malonaldehyde and the term thiobarbituric acid-reactive substances
(TBARS) is now commonly used in place of the TBA number or value (10)
The extent of lipid oxidation is reported as the TBA number or TBA
value and is expressed as milligrams of malonaldehyde equivalents per kilogram
of sample Malonaldehyde is a relatively minor lipid oxidation product formed
14
during the oxidation of polyunsaturated fatty acids and reacts with TBA to
produce a colored complex with an absorption maximum at 530-532 nm
Malonaldehyde has been reported to correlate well with sensory scores of
oxidized flavors in muscle foods (38) This assay is not recommended for
monitoring the extent of oxidation of food oils
httpmnh20wordpresscom20100719518
2324 Sensory Evaluation
A wide range of methods have been used to examine the effects of lipid
oxidation on the quality of stored turkey meat In addition to the chemical or
instrumental techniques sensory evaluation is very useful for assessing the
quality and stability of meat and meat products from lipid oxidation Most of
these analyses such as the PV TBARs CDs or gas chromatographic analysis of
specific volatiles can be correlated to sensory analysis but none of these chemical
or physical analyses can effectively replace the human nose taste buds and
sensory receptors (43)
According to Warner (43) sensory evaluation is a scientific discipline used
to evoke measure analyze and interpret reactions to food and material
characteristics as they are perceived by sense of sight smell taste touch and
hearing Although sensory evaluation can have a low reproducibility relative to
gas chromatography well-trained and experienced sensory panelists operating
under controlled conditions can provide accurate reliable data The American
Meat Science Association (44) has developed standard guidelines for sensory
analyses The AMSA recommendations include sample preparation cooking
methods and procedures facilities preparation and presentation of samples
15
trained sensory panels test forms consumer panels and instrumental
measurement of tenderness
24 Control of Oxidation Antioxidants
Antioxidants are substances that can delay the onset of lipid oxidation and
extend the induction period They must be added as early as possible in the
manufacturing process or to finished food products to be effective in reducing
lipid oxidation Antioxidants cannot reverse the oxidation of rancid food
products Moreover antioxidants are not effective in controlling hydrolytic
rancidity which is enzyme-catalyzed hydrolysis of fats Antioxidants can control
lipid peroxidation in six ways reducing localized O2 concentrations scavenging
species that initiate peroxidation quenching singlet O2 to prevent the formation
of peroxides binding free metal ions (chelating agent) into a form that will not
generate reactive species or decompose lipid peroxides to peroxyl or alkoxyl
radicals peroxide removal and chain breaking to prevent more hydrogen
abstraction from fatty acid side chains (46) There are three types of antioxidants
based on their mechanism (46 47)
241 Type I - Also called the primary or free-radical chain stopper antioxidants
Type I antioxidants inhibit the chain reaction by acting as hydrogen
donors or free-radical acceptors (AH) (46) Compounds in this category stop the
free radical chain reactions by converting the radicals into more stable products
(47) by reacting primarily with ROO and not with R radicals Basically the
mechanism is a competition between ldquothe inhibitor reactionrdquo (46)
ROO + AH ROOH + A
And ldquothe chain propagation reactionsrdquo
ROO + RH ROOH + R
The effectiveness of a primary antioxidant is dependent on several factors
such as activation energy rate constants oxidation-reduction potential ease of
antioxidant loss or destruction and solubility properties (46) Labuza pointed out
that another important characteristic of an efficient antioxidant is that the
16
resulting antioxidant free radical must not itself initiate new free radicals or be
rapidly oxidized by a chain reaction (46) Type I antioxidants are primarily
phenolic compounds such as butylated hydroxytoluene (BHT) and butylated
hydroxyanisole (BHA) (47) and tert-butylhydroquinone (TBHQ) commonly
present in foods These synthetic food additives are permitted to be used alone or
in combination However the antioxidant content of a food containing these
additives must not exceed 002 of the oil or fat content of the food according to
the Code of Federal Regulations (58)
Butylated Hydroxyanisole
Phenolic compounds synthetic or natural are excellent antioxidants since
they possess benzene rings containing hydroxyl groups and are relatively
reactive Phenols produce stable antioxidant radicals A that are sufficiently
unreactive to propagate the chain and compete with the lipid substrate (RH)
which is present at a much greater concentration (46)
A + ROO Non-radical products
A + A Non-radical products
Since synthetic antioxidants such as BHT and BHA have restrictions for
use in food due to their toxicological effects on several species and they are
suspected to be potential carcinogens (48) the search for natural and safe
antioxidants especially those of plant origin has greatly increased in recent
years
17
242 Type II- Secondary antioxidants or Free-radical production preventer
This category includes compounds that reduce the rate of chain initiation
by metal chelation oxygen scavenging or absorption of UV radiation (47) The
common chelating agents include ethylenediamine tetraacetic acid (EDTA) citric
acid and phosphates EDTA is used for chelation of many metals and it can be an
effective oxidation inhibitor in foods especially those with intermediate to high
moisture content but not in protein-type food such as meats which contain
substantial amounts of bound form of transition metals (46) In addition EDTA
does not protect food during heating because it is less stable at higher
temperatures therefore it is restricted to foods held or processed at cool
temperatures (49) Citric acid is especially useful in oils and intermediate
moisture foods (46) Ascorbic acid is commonly used as a food antioxidant due to
its oxygen scavenging and reducing properties (47) it is especially effective when
it is used in combination with iron chelators (46) Polyphosphates are more
effective chelators and antioxidants than monophosphates However their
antioxidant activity could be reduced or eliminated depending on the
components of the food (50)
Maillard reaction products can bind transition metals such as iron and
deactivate singlet oxygen Because of their dark color and low solubility they are
unsuitable for use in fats and oils but they may be used to improve the oxidative
stability of many foods (51)
Other preventive antioxidants include several enzymes such as catalase
(47) and glutathione peroxidase (37) which reduce the generation of free radicals
by decomposing hydrogen peroxide and hydroperoxides respectively
243 Type III- Control of Environment Factors
This category does not refer to compounds added to inhibit lipid oxidation
Rather this category refers to factors such as the reduction of the oxygen
content a decrease in temperature altering the moisture content (46) and
exclusion of light (47) As the temperature increases oxygen becomes less soluble
in lipids and water slightly influencing the rate The rate of oxidation increases
proportionally to the surface of the lipid exposed to air According to Labuza (46)
18
lipid oxidation can be reduced by altering the water activity which can alter the
catalytic activity of metal catalysts At an elevated water activity (awgt 055) the
rate of oxidation can increase possibly due to the increased mobilization of metal
catalysts
Antioxidant synergism has been observed between primary antioxidants
and between antioxidants with different modes of actions This synergistic effect
can substantially reduce the level of antioxidants needed in a food
25 Keluak As A Natural Source of Antioxidant
251 Keluak ndash Introduction
Pangium edule Reinw (Figure 21) is a tall tropical tree that grows mainly
in Micronesia Melanesia and Southeast Asia including Indonesia The
taxonomy of the tree is uncertain and it may also be classified in the
Flacourtiaceae or the Violale According to Abdullah (55) the tree requires many
years to mature and the seeds are therefore most frequently harvested from wild
trees as it is not economically feasible to cultivate the plant The size of a Pangi
tree is characterized as medium to large with large glossy heart-shaped leaves
that are conspicuously veined and long-stemmed The flowers are large and
greenish and the sexes are separate Flowering occurs from September to October
with seed shed likely to occur in December to January However there are
records of seed shed in April to May and July to September This tropical tree is
wild and not well cultivated (55)
The trees start fruiting when they are approximately 10 to 15 years old The
fruit is oval in shape and the size ranging from 12-30 cm (52) or about a size of a
large husked coconut brown and rough-surfaced (55) The tree produces a large
fruit that is poisonous because of the presence of cyanogenic glucosides (53)
Almost all parts of the plant are poisonous including its leaves barks and seed
(52) Although poisonous to humans the seeds of the tree are part of the natural
diet of the babirusa (Babyroussa babyrussa) (53) a pig-like animal native to the
region However the mature fruit is edible and the juice can be applied to sores
and cuts (55)
19
In Indonesia the seed kernel of this tree is edible after treatments
following the removal of the cyanogenic glucosides Keluak is fermented in a
specific way the seeds are harvested and placed in the field for 10 days The seeds
are then removed washed and boiled for 3 hours to remove the cyanide (54)
After cooling the seeds are buried (indoor) in ash banana leaves and earth for
40 days The seed turn from a creamy white color to dark brown or black (51)
The fermented seeds are cleaned and ready to be used as spices (54) image is
shown in Figure 22 In some countries according to Ma (56) after harvesting the
fruits are buried in the ground for ~100 days before the large seeds are removed
the rest of the plant is poisonous The charcoal-colored nuts are braised for one
hour so the soft flesh can be scooped out of the skin The taste is bitter buttery
and a bit like chocolate while the texture is a familiar one - think mashed
potatoes or roasted chestnuts (56)
Taxonomy of Keluak (55)
Kingdom Plantae
Division Magnoliophyta
Species Pedule
Family Acariaceae
Binomial name Pangium edule Reinw ex Blume
Authority Reinward
Synonym names football fruit kluwek Indonesia black nut kepayang
kluwek keluwek kluwak pangi paying picung penarassan seis
According to Andarwulan et al (54) the fermented seed product of this tree
depending upon the origin is called
Indonesian
o Keluak kluwak kluak kluwek keluwek or kloewak (Dutch spelling)
o Pucung or pucing (Sundanese)
o Rawan or rawon (adjective referring to food prepared with the seed of
this tree) (Figure 23)
Malay
o Kepayang
20
o Payang
Philipines
o Samaun-referring to the oil
o Pangi- referring to the tree
Keluak is commonly used as a spicy flavoring in soups in Java and South
Sulawesi several traditional dishes can be made with Keluak seeds including
ldquoRawonrdquo (Figure 23) and ldquoBlack nut with golden snapperrdquo (Figure 24) Keluak is
also a raw material for another product ldquokecap pangirdquo (ldquokecaprdquo is a soy sauce-like
product) and it has been used as a spice in Saparua Maluku Island in Indonesia
Another of the edible products is called ldquoDagerdquo which is a boiled seed after the
removal of kernels and water after soaking for 2-3 days Dage is utilized in West
java as a vegetable (54) In this document I will use the term ldquoKeluakrdquo and ldquopangi
to refer to the fermented seed that is commonly used as a spice
252 Nutritional Profile of Keluak
The nutrition fact of the Keluak seed is shown in Table 22 Generally
phenolic compounds are found in the seeds and other parts of the plant Most
seeds contain large amounts of polyunsaturated oils and phenolic antioxidants
are necessary to protect the polyunsaturated fatty acids in the oil against
autoxidation (50)
The pangi seed contains some secondary metabolites (Table 23) of the
cyanogen glycosides which include the cyanogen glycoside and various
alkaloids flavonoids steroids saponins tannins and quinine These metabolites
are present in both fresh and dried pangi seed (55)
253 Previous work on keluak
Previous research by Fardiaz and Romlah (57) on the fermented seed
indicated that the methanol extract of keluak possessed antioxidant activity
Fardiaz and Romlah found that the addition of Keluak seed extract to cooking oil
could lengthen the oxidation induction period of the oil Their findings are
summarized in the Table 24 and Figure 25
21
Recently Chye and Sim (52) used several different extraction methods on
Keluak seeds and examined the antioxidant activity of the extract Extracts of
Pangium edule Reinw seed were investigated for their antioxidative activity
using DPPH radical scavenging and β-carotene bleaching assays For the
extraction they used a mixture of acetone acetic acid water which yielded the
higher phenolic content of 2222 plusmn005 mg GAEg among the other methods of
extraction and showed the most potent antioxidative acivity in both DPPH radical
scavenging and β-carotene (Figures 26- 27) They found that significant
correlation was observed between the total phenolic content and its antioxidative
activity (r=0878) suggesting that the phenolics of the Keluak extract could be
potential sources of natural antioxidants (52)
22
26 Figures
Figure 21 Pangium Plant
httpwwwpngplantsorgPNGtreesTreeDescriptionsPangium_edule_Reinwhtml httptravelspotcoolstuffcomgourmet-adventureunusual-food5-lethal-
delicious-meals
Figure 22 Keluak Seed
Source Wayang Brand Kluwak Kupas PT Wira Aksara Jakarta Indonesia
Figure 23 A Dish Made With Keluak Seed- Black Beef Soup (Rawon)
httpwwwlestariwebcomresep-indonesiaEnglishRawonphp
23
Figure 24 A Dish made with Keluak Seed- Black Nut with Golden Snapper
httpdelightfultastebudscom20110501rawon-indonesian-beef-black-soup
Figure 25 The Effect of Kluwak Extract on Oxidation Induction Period of Palm Oil (57)
24
Figure 26 DPPH radical scavenging activity () of Keluak seed extracts at different
concentrations (52)
Phenolic (Ace) = phenolic extracted by acetone Phenolic (EtOAc) = Phenolic extracted by ethyl acetate FPA= Free phenolic acid GBPA= Glycoside-bound
phenolic acid Al= Alkaloid
Figure 27 Antioxidative Activity of Keluak Seed Extracts at 20 mgmL measured by β-
carotene bleaching method (52)
Phenolic (Ace) = phenolic extracted by acetone Phenolic (EtOAc) = Phenolic extracted by ethyl acetate FPA= Free phenolic acid GBPA= Glycoside-bound
phenolic acid Al= Alkaloid
25
27 Tables
Table 21 Fatty Acid Composition of Turkey Meat (50)
Table 22 Nutrition Fact of Keluak Seed
Per 100 grams (or 100 mL)
Energy 2428 kj
Protein 15 g
Fat (Total) 50 g
Carbohydrate (Total) 17 g
Sugar 4 g
Dietary Fiber 10 g
Sodium -
Potassium 680 mg
Calcium 0
Vitamin A 0
Vitamin C 0
Iron 0 Source Wayang Brand Kluwak Kupas PT Wira Aksara Jakarta Indonesia
26
Table 23 Anti- Nutritional Factors of Pangium Seed (55)
Anti- Nutritional Factors Dry wt Basis (microgg)
Arsenic NA
Cyanide 1834
Lead 18
Phytic acid NA
Tannin 046
Alkaloid NA
Table 24 The Antioxidative Activity of Kluwak Expressed as Protective Factor (57)
27
28 References
1 Kanner J Rosenthal I An Assessment of Lipid Oxidation in Foods - Technical Report Pure and Applied Chemistry 1992 64 1959-1964
2 Skibsted LH Understanding oxidation processes in foods Woodhead Publ Food Sci Technol Nutr 2011 199 3-35
3 Yu L Scanlin L Wilson J Schmidt G Rosemary extracts as inhibitors of lipid oxidation and color change in cooked turkey products during refrigerated storage J Food Sci 2002 67 582-585
4 Rhee K Anderson L Sams A Lipid oxidation potential of beef chicken and pork J Food Sci 1996 61 8-12
5 Hernandez P Navarro J Toldra F Lipid composition and lipolytic enzyme activities in porcine skeletal muscles with different oxidative pattern Meat Sci 1998 49 1-10
6 Karakok SG Ozogul Y Saler M Ozogul F Proximate Analysis Fatty Acid Profiles and Mineral Contents of Meats a Comparative Study Journal of Muscle Foods 2010 21 210-223
7 Chan K Decker E Endogenous Skeletal-Muscle Antioxidants Crit Rev Food Sci Nutr 1994 34 403-426
8 Decker E Xu Z Minimizing rancidity in muscle foods Food Technol 1998 52 54-59
9 Rojas MC Brewer MS Effect of natural antioxidants on oxidative stability of cooked refrigerated beef and pork J Food Sci 2007 72 S282-S288
10 Gray J Macdonald B Pearson A Morton I Role of Nitrite in Cured Meat Flavor - a Review J Food Prot 1981 44 302-8
11 Brewer M Vega J Detectable Odor Thresholds of Selected Lipid Oxidation Compounds in a Meat Model System J Food Sci 1995 60 592-595
12 St Angelo A Crippen K Dupuy H James C Chemical and Sensory Studies of Antioxidant-Treated Beef J Food Sci 1990 55 1501-1508
13 Buckley D Gray J Asghar A Price J Crackel R Booren A Pearson A Miller E Effects of Dietary Antioxidants and Oxidized Oil on Membranal Lipid Stability and Pork Product Quality J Food Sci 1989 54 1193-1197
14 Guntensperger B Escher F Oxidative Changes of Heat-Sterilized Meat in Trays J Food Sci 1994 59 689-692
28
15 Bauernfeind JC Antioxidant function of L-ascorbic acid in food technology International journal for vitamin and nutrition researchSupplement = Internationale Zeitschrift fur Vitamin- und ErnahrungsforschungSupplement 1985 27 307-333
16 Georgantelis D Blekas G Katikou P Ambrosiadis I Fletouris DJ Effect of rosemary extract chitosan and alpha-tocopherol on lipid oxidation and colour stability during frozen storage of beef burgers Meat Sci 2007 75 256-264
17 Botsoglou NA Govaris A Giannenas I Botsoglou E Papageorgiou G The incorporation of dehydrated rosemary leaves in the rations of turkeys and their impact on the oxidative stability of the produced raw and cooked meat Int J Food Sci Nutr 2007 58 312-320
18 Karpinska-Tymoszczyk M Effect of the addition of ground rosemary on the quality and shelf-life of turkey meatballs during refrigerated storage Br Poult Sci 2008 49 742-750
19 Drumm T Spanier A Changes in the Content of Lipid Autoxidation and Sulfur-Containing-Compounds in Cooked Beef during Storage J Agric Food Chem 1991 39 336-343
20 Folch J Lees M Stanley GHS A Simple Method For The Isolation And Purification Of Total Lipides From Animal Tissues Journal of Biological Chemistry 1957 226 497-509
21 Grau A Codony R Rafecas M Barroeta A Guardiola F Lipid hydroperoxide determination in dark chicken meat through a ferrous oxidation-xylenol orange method J Agric Food Chem 2000 48 4136-4143
22 Dobarganes M Velasco J Analysis of lipid hydroperoxides European Journal of Lipid Science and Technology 2002 104 420-428
23 Juntachote T Berghofer E Siebenhandl S Bauer F The antioxidative properties of Holy basil and Galangal in cooked ground pork Meat Sci 2006 72 446-456
24 Lee M Choi J Choi Y Han D Kim H Shim S Chung H Kim C The antioxidative properties of mustard leaf (Brassica juncea) kimchi extracts on refrigerated raw ground pork meat against lipid oxidation Meat Sci 2010 84 498-504
25 Botsoglou N and Botsoglou E Oxidation in Foods and Beverages and Antioxidant Applications Vol 2 Management in Different Industry Sectors In Decker EA Elias RJ and McClements D J (eds) Oxidation in Foods and Beverages and Antioxidant Applications Vol 2 Management in Different Industry Sectors 2010 200 1-528
29
26 National Chicken Council Per Capita Consumption of Poultry Livestock 1965 to Estimated 2012 in Pounds 2012 Retrieved in January 23 2012 from httpwwwnationalchickencouncilorgabout-the-industrystatisticsper-capita-consumption-of-poultry-and-livestock-1965-to-estimated-2012-in-pounds
27 Bilgili SF Poultry meat processing and marketing- what does the future hold Poult Internat 2002 12-22
28 Nolan N L Bowers J A and Kropf D H Lipid Oxidation and Sensory Analysis of Cooked Pork and Turkey Stored under Modified Atmospheres Journal of Food Science 1989 54 846ndash849
29 Esteacutevez M Morcuende D and Ventanas S Determination of Oxidation Nollet Leo M LToldraacute Fidel (Eds) Handbook of Muscle Foods Analysis Boca Raton CRC Press 2009 221-240
30 Frankel E N Lipid oxidation Prog Lipid Res 1980 19 1ndash22
31 Frankel E N Volatile Lipid Oxidation Products Progress in lipid research 1983 221 1-33
32 Hsieh R J and J E Kinsella Oxidation of Polyunsaturated Fatty Acids Mechanisms Products and Inhibition with Emphasis on Fish Advances in Food and Nutrition Research 1989 Vol 33
33 McMillin K W Initiation of oxidative processes in muscle foods Annual Proceedings of the Reciprocal Meat Conference Am Meat Sci Assoc Chicago IL 1997 49th 53ndash64
34 Monahan FJ Oxidation of lipids in muscle foods fundamental and applied concerns In EA Decker C Faustman and CJ Lopez-Bote (Eds) Antioxidants in Muscle Foods Nutritional Strategies to Improve Quality New York John Wiley and Sons Inc 2000
35 Robinson M E Haemoglobin and methaemoglobin as oxidative catalysts Biochemical Journal 1924 18 255-264
36 Jadhav SJ Nimbalkar SS Kulkarni AD and MadhaviDL Lipid oxidation in biological and food systems In Marcel Dekker (Eds) Food Antioxidants Technological Toxicological and Health Perspectives New York 1996
37 Niki E Antioxidants and relation to lipid oxidation Chemistry and physics of lipids 1987 44 227-300
38 Gray J I and Monahan FJ Measurement of lipid oxidation in meat and meat products Trends Food Sci Technol 1992 3 315-9
30
39 Chang S S and Peterson R J The Basis of Quality in Muscle Foods Recent Developments In The Flavor of Meat Journal of Food Science 1977 42 298ndash305
40 Lea C H Methods for determining peroxide in lipids J Sci Food Agric 1952 3 586ndash594
41 White P J Conjugated diene anisidine value and carbonyl value analysis In Warner K and Eskin N A M (Eds) Methods to Access Quality and Stability of Oils and Fat-Containing Foods Champaign IL AOCS Publishing 1995 159-177
42 Coxon D Measurement of lipid oxidation Food Science and Technology Today 1987 1164-6
43 Warner K Sensory evaluation of oils and fat-containing foods In K Warner and N A M Eskin (Eds) Methods to Access Quality and Stability of Oils and Fat-Containing Foods AOCS Publishing 1995 49
44 AMSA Research Guidelines for cookery sensory evaluation and instrumental tenderness measurements of fresh meat American Meat Science Association-National Live Stock and Meat Board 1995
45 Association of Official Analytical Chemists Official methods of analysis (16th ed) Washington DC Association of Official Analytical Chemists 1995
46 Labuza T P and Dugan L R Kinetics of lipid oxidation in foods C R C Critical Reviews in Food Technology 1971 2 3
47 Gordon MF The mechanism of antioxidant action in vitro In Hudson BJF (Ed) Food Antioxidants London Elsevier Applied Science 1990 1-18
48 Shahidi F Janitha P Wanasundara P Phenolic Antioxidants Crit Rev Food Sci Nutr 1992 32 67-103
49 Roozen JP Effects of types I II and III antioxidants on phospholipid oxidation in a meat model for warmed over flavour Food Chem 1987 24 167-185
50 Pokornyacute J Natural antioxidants for food use Trends in Food Science and Technology 1991 2 223-227
51 Wong W H Buah Keluak National Parks 11 Jan 2007 Retrieved 02 July 2012 from httpenwikipediaorgwikiPangium_edule
52 Chye FY Sim KY Antioxidative and Antibacterial Activities of Pangium edule Seed Extracts International Journal of Pharmacology 2009 5 285-297
31
53 Andarwulan N Fardiaz D Wattimena GA Shetty K Antioxidant activity associated with lipid and phenolic mobilization during seed germination of Pangium edule Reinw J Agric Food Chem 1999 47 3158-3163
54 Andarwulan N Fardiaz S Apriyantono A Hariyadi P Shetty K Mobilization of primary metabolites and phenolics during natural fermentation in seeds of Pangium edule Reinw Process Biochemistry 1999 35 197-204
55 Abdullah Moh A B Phyochemical Composition of Fresh and Cooked of Chesnut (Castanopsis argentea) Pangium (Pangium edule) and Pra (Elateriospermum tapos) Seeds Final Year Project Food Science and Technology in the Faculty of Applied Sciences Universiti Teknologi Mara Malaysia January 2012 Retrieved on July 4 2012 from httpeprintsptaruitmedumy49401MOHD_ASRUL_BIN_ABDULLAH_12_24pdf
56 Ma A A Peranakan favorite is ayam buah keluak Chicken stewed with black nuts at True Blue RestaurantWall Street Journal (Online) New York NY Dec 16 2010 Retrieved July 4 2012 from httpproquestumicompqdwebdid=2214039511ampsid=1ampFmt=3ampclientId=36305ampRQT=309ampVName=PQD
57 Fardiaz D Romlah S Antioxidant activity of picung (Pangium edule Reinw) seed In Development of Food Science and Technology in ASEAN Proceedings of the Fourth ASEAN Food Conference February 17ndash21 1992 ASEAN Jakarta Indonesia 1992 814ndash819
58 Food and Drugs Administration Food Additives Permitted for Direct Addition to Food for Human Consumption Code of Federal Regulations Title 21 pt 172190 2006
59 Kerler J Grosch W Character impact odorants of boiled chicken changes during refrigerated storage and reheating Zeitschrift Fur Lebensmittel-Untersuchung Und-Forschung A-Food Research and Technology 1997 205 232-238
60 Baggio S Vicente E Bragagnolo N Cholesterol oxides cholesterol total lipid and fatty acid composition in turkey meat J Agric Food Chem 2002 50 5981-5986
32
CHAPTER 3 MATERIALS AND METHODS
31 Keluak Antioxidant and Chemicals
Keluak (Kupas Wayang Brandreg Peeled Keluak Nuts PT Wira Aksara
Jakarta Indonesia was manufactured for Empire International East Chief
Privado Ontario CA 91761) Butylated hydroxytoluene (BHT) gallic acid (ACS
reagent) and 2-thiobarbituric acid were obtained from Sigma Chemical
Company St Louis MO USA Sodium chloride (crystal ARreg ACS) was obtained
from Mallinckrodt Baker Inc (Phillipsburg NJ USA)
The reagents used included acetone (Certified ACS) and chloroform (certified
ACS) obtained from Fisher Scientific Fair Lawn NJ USA Acetic acid (Glacial
ACS reagent) was purchased from J T Baker (Center Valley PA 18034 USA)
and Folin Ciocalteursquos phenol reagent (2 N) was purchased from Sigma-Aldrich
(St Louis MO USA)
311 Phenolic Extraction
Keluak seeds were ground into fine pieces using a coffee grinder (Braun
Inc Lynnfield MA USA) The fatty material from the ground seed was removed
first using a method modified from Wettasinghe and Shahidi (1) The ground seed
was washed with n-hexane (16 gg) and placed in a sonicator for 15 minutes
with occasional stirring The mixture was vortexed for 30 secs before it was
centrifuged at 2688 x g for 10 minutes (Sorvallreg Instrument RC-5B Du Pont
Company Wilmington DE USA) The upper fat-soluble layer was discarded
The solid was washed 2 ndash 3 additional times The solids remained at the bottom
after washing The defatted solids were then air-dried overnight under the hood
to remove any solvent residue
Forty grams of dried defatted Keluak seeds were extracted by stirring with
200 mL of solvent (acetone water acetic acid 90 95 05 vvv) at 60degC and
600 rpm for 2 hrs The mixture was then filtered through filter paper (Whatman
1 Buckinghamshire UK) The filtrate was collected and dried at 45degC using a
rotary evaporator until no further weight changes occurred The concentrated
extract was further dried using a vacuum oven at 45degC overnight The extract was
33
collected dissolved in 100 ethanol flushed with Argon gas and stored at -20degC
until further use
312 Total Phenolics content
The total phenolic content was measured using the Folin-Ciocalteu assay
as modified by Waterhouse (13) The phenolic extract was diluted with 100
ethanol to make several dilutions (1100 2100 and 10100) One milliliter of each
dilution was added to a test tube containing 5 mL of deionized water Then 05
mL of 50 Folin-Ciocalteu reagent was added to the test tube The solution was
mixed and allowed to stand for 8 mins at 22degC before adding 1 mL of 5 sodium
carbonate (wv) The mixture was vortexed using a touch mixer (model 231
Fisher Scientific Pittsburgh PA USA) and incubated in the dark for 1 hr The
solution was vortexed a second time before reading the absorption with a UV-
spectrophotometer (Spectronic Genesys 5 spectrophotometer Thermo Electron
Corporation Madison WI USA) at 725 nm against DI water A standard curve
was prepared at the same time with gallic acid at concentrations ranging from 0
to 100 mgL The quantity of total phenolic content in the sample was calculated
as gallic acid equivalents (GAE) from the standard curve using the formula
C = c times (V divide m) where
C is total phenolic content (mg GAEg extract)
c is the concentration of gallic acid obtained from the calibration curve (mgmL)
V is volume of sample (mL)
m is mass of the sample extract (g)
32 Sample Preparation
Ground turkey meat (15 fat Jennie-O Turkey Store Wilmar MN USA)
purchased from a local grocery store at day 0 and was immediately divided into 4
treatments according to the formulation (Table 31) (2 3)
(1) Control- No antioxidant
(2) Commercial antioxidant- 002 BHT (ww of lipid)
(3) Natural antioxidant- 002 Keluak extract (ww of lipid)
34
(4) Natural antioxidant ndash 004 Keluak extract (ww of lipid)
The level of Keluak extract antioxidant used was based on the amount of
fat in each formula Salt was dissolved in water prior to addition to the meat The
water addition was 5 of the ground meat (ww) The antioxidant and salt were
mixed in the liquid first before adding it to the meat by sprinkling while mixing
After the antioxidant salt and liquid addition mixing by hand (wearing gloves)
was continued for 5 mins The meat mixture was prepared into patties of uniform
size (using a cookie cutter diameter= 55 cm thickness= 15 cm) The patties
were cooked in an electrical skillet and temperature was monitored by Digi-
Sensereg Scanning Thermometer (Model 92000-00 Cole Parmer Instrument Co
Barrington IL) using copper-constantin thermocouple wires (Type T Omega
Engineering Inc Stamford CT) to an endpoint temperature of 74degC The cooked
patties were cooled and placed in a single layer on a tray and then overwrapped
in commercial PVC (water vapor transmission rate=15 g100 m224 h oxygen
transmission rate 880 cm3m224 h) and aluminum foil over the wrap The
patties were stored at 2degC in the dark and were assayed for the extent of oxidation
by odor sensory TBARS conjugated dienes and peroxide value analysis at days
0 1 3 5 7 for the first study (2)
In a second separate study a longer storage time study was completed to
examine the effect of antioxidants on the cooked ground turkey over a longer
time period The same procedure for antioxidant addition and meat sample
preparation was used However in the second study the samples were stored for
a total of 15 days (5 6) Samples were collected at days 0 1 3 5 7 10 13 15 for
TBARS conjugated dienes peroxide values and pH determinations
33 Thiobarbituric Acid Reactive Substances (TBARS)
Lipid oxidation was assessed by the 2-thiobarbituric acid (TBA) method of
Tarladgis and others (4) and Yu et al (5) Briefly 10 g of meat was homogenized
with 50 mL of deionized water using a homogenizer (IKAreg T25 digital Ultra-
Turrax Wilmington NC USA) The homogenate was filtered through 1
Whatman paper Five mL of the clear filtrate was mixed with 5 mL TBA reagent
35
containing 002 M TBA in 90 glacial acetic acid The mixture was capped
vortexed for 30 secs and incubated in the dark for 15-18 hrs at room temperature
After the color developed the mixture was measured for absorbance at 532 nm
against a blank (deionized water) The absorbance was converted to TBAR values
using 1133- tetraethoxypropane to prepare a standard curve Triplicates of 10 g
samples were prepared for each treatment TBA value is expressed as mg MDA
kg meat
34 Conjugated Dienes
Conjugated dienes (CD) were determined by the method described by
Juntachote and others (6) with slight modifications A cooked meat sample (05
g) was suspended in 5 mL of deionized water and homogenized using a digital
Ultra-Turrax T25 (IKAreg Wilmington NC USA) to obtain a smooth slurry A 05
mL aliquot of this suspension was mixed with 5 mL of extracting solution
containing hexane and isopropanol (31 vv) and mixed for 1 min using a vortex
mixer After centrifugation at 2000 g for 5 mins the supernatant was collected
and the absorbance of the supernatant was determined at 233 nm The
concentration of conjugated dienes was calculated using a molar extinction
coefficient of 25200 M-1cm-1 and the result were expressed as nmole of
conjugated dienes per mg meat sample
35 Peroxide Value
The peroxide value was determined according to the AOAC method 96533
(Association of Official Analytical Chemists) (13) with a few modifications The
lipids from meat samples were extracted by the method of Kim et al (7) First 5 g
of meat sample was broken into small pieces and placed in a water bath at 60˚C
to melt the fat for 30 mins The meat was extracted with a solution containing
acetic acid chloroform (32) and then filtered with Whatman 1 filter paper A
saturated solution of potassium iodide (KI 05 mL) was added to the filtrate The
solution color changed to yellow and then 30 mL of deionized water was added
The mixture was allowed to let stand at room temperature for at least 5 mins and
the color would turn to pale to bright yellow Before titrating with 001 N of
36
sodium thiosulfate (Na2SO3) 05 mL of 1 starch solution was added (a color
changed occurred - the color turned purple to blue-black) The PV is expressed as
meq O2kg lipid
36 pH value
To determine the pH of the meat samples cooked meat samples (10 g)
were blended with 50 mL deionized water for 15 seconds in a homogenizer
(Ultra-Turrax T25 IKAreg Wilmington NC USA) The pH was measured with a
pH meter (Accumet Basic model AB 15 Fisher Scientific Company) The pH
meter was calibrated daily with standard buffers of pH 40 and 70 at 25˚C
37 Sensory Evaluation
Trained panelists (n=15) were recruited from among University of Illinois
graduate students and staff The panelists were prepared using an extensive
training program During each training session panel members practiced and
discussed the techniques developed for sample presentation score sheet terms
and odor sensory evaluation method A panel leader led the panelists to develop
terms to describe the aroma characteristics of fresh cooked turkey meat including
the aroma characteristics of cooked poultry with or without the added Keluak
extract Panel members were trained regularly for 7 sessions for total of two
weeks to identify and discriminate aroma differences Some of the terms were
derived from reference standards including fresh boiled ground turkey meat
lard oxidized vegetable oil hard-boiled egg and wet cardboard (Table 32) The
panelists agreed on the following aroma descriptors for warm-over-flavor meaty
fatty rancid eggy and cardboardy These descriptors were judged for the
presence and overall intensity using a 15 cm-structured line scale (0 = none 15 =
extreme) along with an anchor value for each respective standard Table 2
showed the form used to evaluate the aroma descriptors described above
Cooked patties were uniformly cut into four pie-shaped wedges and placed
in a sniff bottle (Nalgene Teflon PTFE wash bottle Nalge Company Rochester
NY USA) covered with foil to hide the identity of the sample inside Each sample
represented a treatment labeled with three-digit random numbers and were
37
served at random order during each test session The samples were held in an
incubator (45degCplusmn 1degC) for 30 mins prior to presentation to the panelists The
panelists were asked to clean their palate by chewing a piece of unsalted saltine
crackers and rinse with water prior to evaluating the samples Samples were
sniffed Four samples were evaluated for each test session Roasted coffee beans
were presented for panelists to clear the palate between samples Standard
references were prepared daily The second session replicates of the first session
was conducted one week after the first session
38 Statistical Analysis
Statistical assessment was carried out with the program SAS Data were
analyzed as 4 (treatments) by 5 (days of storage) The results from the TBARs
analysis peroxide value analysis conjugated dienes analysis and the
odorsensory analysis were analyzed using one-way analysis of variance
(ANOVA) Differences were considered significant at the P lt 005 level
Comparison of treatment means was based on Fisherrsquos Least Significant
Difference (LSD)
38
39 Tables
Table 31 Formulation of Cooked Ground Turkey Meat for Each Treatment
TREATMENTS
Control BHT AO 200ppm AO 400ppm
INGREDIENTS
Jenny-O 15 fat Ground Turkey
(g) 650 650 650 650
Salt (2 ww) (g) 13 13 13 13
BHT (002 of total fat) (g) 002
Keluak extract (mL)
2487 (002 g
phenolics)
4974 (004 g
phenolics)
Cold water (mL)5 by sample wt
(ww) 325 325 325 325
Table 32 Descriptive Odor Standards for Refrigerated Ground Turkey Meat
Descriptive Odor term Standard Location on the 15-cm line
Rancid Oxidized vegetable oil in water (1100 vv) 7
Cardboard 1 cm2 cardboard in 15 mL water 85
Eggy Fresh hard-boiled egg white (01 g) 9
Meaty Fresh boiled ground turkey meat in water (15 gv) 8
Fatty Lard (02 g) 9
39
310 References
1 Wettasinghe M Shahidi F Antioxidant and free radical-scavenging properties of ethanolic extracts of defatted borage (Borago officinalis L) seeds Food Chem 1999 67 399-414
2 Vara-Ubol S Bowers J Effect of alpha-tocopherol beta-carotene and sodium tripolyphosphate on lipid oxidation of refrigerated cooked ground turkey and ground pork J Food Sci 2001 66 662-667
3 Hassan O Fan L The anti-oxidation potential of polyphenol extract from cocoa leaves on mechanically deboned chicken meat (MDCM) Lwt-Food Science and Technology 2005 38 315-321
4 Tarladgis B Dugan L Pearson A Chemistry of 2-Thiobarbituric Acid Test for Determination of Oxidative Rancidity in Foods 2 Formation of Tba-Malonaldehyde Complex without Acid-Heat Treatment J Sci Food Agric 1964 15 602-amp
5 Yu L Scanlin L Wilson J Schmidt G Rosemary extracts as inhibitors of lipid oxidation and color change in cooked turkey products during refrigerated storage J Food Sci 2002 67 582-585
6 Juntachote T Berghofer E Siebenhandl S Bauer F The antioxidative properties of Holy basil and Galangal in cooked ground pork Meat Sci 2006 72 446-456
7 Kim YJ Jin SK Park WY Kim BW Joo ST Yang HS The Effect of Garlic Or Onion Marinade on the Lipid Oxidation and Meat Quality of Pork during Cold Storage J Food Qual 2010 33 171-185
8 Chye FY Sim KY Antioxidative and Antibacterial Activities of Pangium edule Seed Extracts International Journal of Pharmacology 2009 5 285-297
9 Kahkonen M Hopia A Vuorela H Rauha J Pihlaja K Kujala T Heinonen M Antioxidant activity of plant extracts containing phenolic compounds J Agric Food Chem 1999 47 3954-3962
10 Jayaprakasha G Selvi T Sakariah K Antibacterial and antioxidant activities of grape (Vitis vinifera) seed extracts Food Res Int 2003 36 117-122
11 Fardiaz D Romlah S Antioxidant Activity of Picung (Pangium edule Reinw) Seed In Development of Food Science and Technology in ASEAN Proceedings of the 4th ASEAN Food Conference Feb 17-21 1992 ASEAN Jakarta Indonesia 1992 12 Waterhouse A L Determination of Total Phenolics Current Protocols in
Food Analytical Chemistry 2002 I111-I118
40
13 Association of Official Analytical Chemists (1995) Official methods of analysis (16th ed) Washington DC Association of Official Analytical Chemists
41
Chapter 4 RESULTS AND DISCUSSION
41 Phenolic Extraction Yield
The phenolic extract yield using acetone water acetic acid (90 95 05)
extraction was 503 plusmn 140 g of extract per 70 g of defatted ground Keluak seed or
007 g phenolic extract per gram of defatted Keluak The samples contained
approximately 719 phenolic compounds by weight the values are equal to the
average plusmn standard deviation of the three replicate analyses This value was
moderately greater than that reported by Chye and Sim (1) which reported a
548 yield The total phenolic content as determined using Folin-Ciocalteau
reagent was 1973 plusmn 203 mg GAEg extract which was also moderately greater
than the result reported by Chye and Sim which was 1639plusmn 004 mg GAEg
extract (1) It is possible that the difference is due to the Keluak source Chye and
Sim obtained their seeds material from local indigenous markets in Kota
Kinabalu Sabah Malaysia (1) while the seeds used in this study were grown in
from Indonesia The geographical and horticultural differences could affect the
phenolic content and concentration of the seed
According to Kahkonen et al (2) different phenolic compounds can have
different responses in the Folin Ciocalteau method depending on their chemical
structure Therefore the antioxidant activity of an extract cannot be predicted
solely on its total phenolic content (3 4)
42 Effect of Keluak Extract and storage time on TBARS values during
refrigerated storage of cooked ground turkey
The TBARS values represent the content of secondary lipid oxidation
products particularly malonaldehyde The carbonyls are primarily responsible
for the production of off-flavors in oxidized meat and meat products Aldehydes
are formed by the oxidation of unsaturated fatty acids They react with the TBA
reagent to form a pink complex (TBA chromogen) with a maximum absorbance
at 532 nm The intensity of this pink color is directly related to the concentration
of the TBA-reactive substances in the original sample The results of the TBARs
analysis for the preliminary study (7 days) and the extended storage study (15
days) are shown in Tables 41a b and Figures 41a b respectively Overall lipid
42
oxidation increased substantially as the refrigerated storage progressed due to
the effects of heating and in combination with storage under aerobic conditions
On the first day of analysis for both the 7 and 15 days storage study all the
antioxidant treated samples (BHT and both concentrations of the Keluak
extracts) the TBARS values were significantly lower than the control an
indication that the antioxidants had a positive effect in suppressing oxidation
Similar findings were observed by Juntachote et al and Teets et al (5 6) TBARS
values for both 7 and 15 days storage study ranges from 035- 475 mg MDA kg
meat which was comparable to other study by Juntachote (5) for 14 days of
storage study of pork meat There were examining the effect other natural
sources of antioxidants on oxidation during refrigerated storage of cooked meat
During the preliminary study (Table 41a) the control and BHT treatments
did not show significant differences (Pgt005) from day 1-7 However both of the
Keluak extract treatments showed a significant (Plt005) effect on the
suppression of the progression of lipid oxidation as compared to the control
(Figure 41a)
On the other hand during the 15 day study all the samples with added
antioxidants had significantly lower TBAR values compared to the control
throughout the entire storage period This indicates that both the commercial
treatment and the treatment with Keluak extracts provided substantial protection
to the meat with respect to lipid oxidation The efficacy of the Keluak extracts to
inhibit lipid oxidation is probably related to their phenolic content The results of
this study showed agreement with those obtained by Fardiaz and Romlah (14)
which stated that the addition of Keluak extract to palm oil lengthened the
oxidation induction period from 22 hours to 50 hours
Lipid oxidation was considerably greater with longer storage times due to
the exposure to oxygen TBARs measure the formation of secondary lipid
oxidation products which contribute to WOF in oxidized meat Heat increases the
release of non-heme iron from the heme pigments a major catalyst for lipid
oxidation in cooked meats (7) Cooking also alters cellular compartmentalization
and exposes membrane phospholipids to molecular oxygen and metal ions (8)
43
resulting in greater amounts of lipid oxidation (9) The addition of antioxidants
during processing cooking or packaging can be done to increase the oxidative
stability of cooked meat (10)
43 Effect of Keluak Extract and Storage Time on Conjugated Diene
Content during Refrigerated Storage of Cooked Ground Turkey
Meat
The development of conjugated dienes (CD) is related to the formation of
hydroperoxides found in the extracted lipids of the cooked ground turkey
Unsaturated fatty acid double bonds occur naturally in a methylene interrupted
structure As meat begins to oxidize the double bonds of these fatty acids are
altered creating conjugated systems which can be measured
spectrophotometrically (6) During lipid peroxidation non-conjugated double
bonds (C=CndashCndashC=C) which are present naturally in unsaturated lipids are
converted to conjugated double bonds (C=CndashC=C) with a large increased in
absorption at 232ndash234 nm (11) In the preliminary study there were no significant differences among the
antioxidant treated sample and the control (Pgt005) except on day 5 (Figure 42a
and Table 42a) The CD value for all the treatments peaked at day 5 and the
samples treated with antioxidants were significantly different that the control
(Plt005)
Meanwhile during the second storage study (Table 42b and Figure 42b)
when the CD values were compared to the control on day 0 and day 1 the 002
BHT and both of the Keluak extract treated samples were not significantly
different (Pgt005) However from day 3 on all the antioxidant-treated samples
had less CD formation than the control (Plt005) The CD content of the control
generally increased especially during the last 5 days (Day 10 13 and 15) of the
study Additionally cooked ground turkey treated with Keluak at 400 ppm had
slightly lower concentrations of conjugated dienes compared to cooked ground
turkey containing Keluak extract at 200 ppm and the commercial antioxidant
(BHT) The trend of CD formation was similar to several other studies (5 6 12
13) They generally observed that the CD concentration for most samples peaked
44
on Day 3 and decreased thereafter This phenomenon of decreased CD is likely
due to the decomposition of the conjugated diene hydroperoxides into secondary
oxidation products over time Conjugated dienes hydroperoxides are expected to
decompose into secondary products as was observed in this study According to
Frankel (15) the formation of conjugated dienes which is related to the
production of hydroperoxides occurs in the early stages of lipid oxidation According to Estevez et al (17) measurement of conjugated dienes (CD) in
meat products containing elevated levels of PUFA is limited depending on the
fatty acid composition of the sample as well as the presence of other non-
hydroperoxides CDs In agreement with Grau et al (18) the TBA test showed a
higher sensitivity with respect to lipid oxidation than did the CD determination
44 Effect of Keluak extract and storage time on peroxide value during
refrigerated storage of cooked ground turkey
Peroxide values (PV) were also used to assess the level of lipid oxidation in
cooked ground turkey during storage at 2˚C (Table 43 and Figure 43) However
while there were differences between the control and samples treated with AOs
on a few days the result of this study showed that treatments had no significant
effect (Pgt005) on the peroxide values compared to the control Generally based
on the results in Table 4 and Figure 4 the PVs increased during storage and
peaked on day 10 At the time it is possible that much of the polyunsaturated
membrane lipids may have been oxidized at that point so that further storage
and oxidation resulted in a decrease in the concentration of peroxides and thus
the PV
The PV differences among the samples did not provide proof that any of
the AOs were effective It is not clear why the PV analysis did not provide any
evidence of AO efficacy According to Estevez (17) the sensitivity of this method
is about 05 miliEquivalentkg of lipid Lower peroxide values cannot be
measured satisfactorily by the AOCS method because of the uncertainty with the
iodometric titration endpoint unless the iodine-starch end is determined
potentiometrically at levels as low as 006 Eqkg lipid The iodometric method is
highly empirical and very small procedural differences can cause variation in the
45
results (19) Two major sources of error in this test could be the liberation of
iodine by air oxidation of the KI and absorption of iodine by fatty acid double
bonds (17)
4 5 Effect of Keluak Extract and storage time on Odor of Refrigerated
Cooked Ground Turkey
No significant interaction (Pgt 005) occurred between antioxidant and
storage time for most of the odor characteristics (Tables and Figures 44-48)
For meaty odor characteristic (Figure and Table 44) the score of all the
treatments over the 7 days of storage did not show significant differences
(Pgt005) The scores ranged from 502 ndash 783 which was slightly below the
freshly boiled turkey meat standard for meaty (which was ranked 8 in the 15-cm
line scale) Therefore the panelists were unable to score and detect the cooked
meat aroma differences in the treated samples relative to the standard reference
The meaty aroma in this study was used to determine if there were possible
masking effects from the AO treatments
For the rancid odor (Figure and Table 45) both of the Keluak treated
samples were perceived as more rancid than both control and BHT after day 1
Overall both of the Keluak treated samples were ranked higher than the control
and BHT which disagrees with the results of TBA test However there was no
significant difference among the treatments between day 3-7 According to Ruth
(20) rancidity as a measure of lipid oxidation is usually best measured by the
concentration of TBARS
The minimum TBA values that corresponds to dark chicken meat samples
that were significantly different in rancid aroma was 1933 μg MDAkg of meat
(21) For consumer acceptability the TBA values must be less than 785 μg of
MDAkg (21) The results from Bou et al (21) were comparable to the results
reported by Gray and Pearson (22) showing that rancid flavor in meats is initially
detected between 500 and 2000 μg of MDAkg of meat In addition OrsquoNeill et
al (23) found that the threshold for WOF detection in cooked dark chicken meat
was at TBA values ge800 μg of MDAkg of meat Since chicken and turkey meat
46
have a comparable PUFA content those values were considered useful in this
experiment On the other hand the odor score for Eggy cardboard and fatty were
statistically not different (Pgt 005) Panelists were unable to detect differences
which could be to different reasons such as that Keluak extract has an aroma
masking effect that confuses the panelists with the ldquooff-odorrdquo The Keluak did
have a slight aroma and it is likely that it masked the effects of storage on lipid
oxidation The aroma of Keluak has been described as bitter dirt-like and
chocolate-like odor (16) This aroma masking could be perceived as undesirable
by the panelists and it might have been mistaken as an off-odor or as an oxidized
sample even though the TBARs and CD data showed otherwise
4 6 Effect of Keluak Extract and storage time on pH of Refrigerated
Cooked Ground Turkey
Table 49 shows the effect of antioxidant treatments in pork muscle on pH
values during storage at 2˚C The values of the pH ranged between 633-668
Generally there are no correlations of pH value among the treatments during
storage The trend for the pH value is inconclusive
47
47 Figures Figure 41a The profile of TBARS in cooked ground turkey treated with various
antioxidants during storage at 2˚C- A Preliminary Study
K200 and K400 represent treatments with Keluak extract at concentration of 200 and 400 ppm respectively
0000
1000
2000
3000
4000
5000
6000
0 2 4 6 8
TBA
RS
(mg
MD
Ak
g m
eat
)
Storage Days
Control
BHT
K200
K400
48
Figure 41b The profile of TBARS in Cooked Ground Turkey Treated with Various Antioxidants During Storage at 2˚C- Extended Storage Time
K200 and K400 represent Keluak extract at concentration of 200 and 400 ppm respectively
Figure 42a Conjugated dienes values of different antioxidant treatments over storage at
2˚C - A Preliminary Study
K200 and K400 represent treatments with Keluak extract at concentration of 200 and 400 ppm
respectively
000
100
200
300
400
500
600
0 5 10 15 20
TBA
RS
(mg
MD
Ak
g m
eat
)
Storage time (days)
Control
BHT 002
K200
K400
0000
0050
0100
0150
0200
0250
0300
0350
0400
0450
0 1 2 3 4 5 6 7 8
Co
nju
gate
d D
ien
es
(nm
ol
mg
me
at)
Days
Control
BHT
K200
K400
49
Figure 42b Conjugated dienes values of different antioxidant treatments over storage at
2˚C- Extended Storage Time
K200 and K400 represent treatments with Keluak extract at concentration of 200 and 400 ppm respectively
Figure 43 Peroxide Value (meq kg meat) of Different Antioxidant treatments over
Storage at 2˚C
K200 and K400 represent treatments with Keluak extract at concentration of 200 and 400 ppm
respectively
000
002
004
006
008
010
012
014
016
0 5 10 15 20
Co
nju
gate
d D
ien
es
(nm
ol
mg
me
at)
Storage (days)
Control
BHT 002
K200
K400
0
05
1
15
2
25
3
35
4
0 2 4 6 8 10 12 14 16
PV
(m
eq
kg
me
at)
Storage Time (Days)
Control
BHT 002
K200
K400
50
Figure 44 Intensity of Meaty Odor Descriptor in Cooked Ground Turkey Meat Treated
with Different Antioxidants Rated in a 15-cm Line Scale
K200 and K400 represent Treatment with Keluak extract at concentration of 200 and 400 ppm
respectively
Figure 45 Intensity of Rancid Odor Descriptor in Cooked Ground Turkey Meat Treated
with Different Antioxidants Rated in a 15-cm Line Scale
K200 and K400 represent Treatment with Keluak extract at concentrations of 200 and 400 ppm
respectively
000
200
400
600
800
1000
1200
0 2 4 6 8
15
cm
Lin
e s
cale
(av
era
ge)
Days
CONTROL
BHT
K200
K400
Linear (BHT)
-100
000
100
200
300
400
500
600
700
800
0 2 4 6 8
15
cm
Lin
e s
cale
(av
era
ge)
Days
Control
BHT
K200
K400
51
Figure 46 Intensity of Eggy Odor Descriptor in Cooked Ground Turkey Meat Treated
with Different Antioxidants Rated in a 15-cm Line Scale
K200 and K400 represent Treatment with Keluak extract at concentrations of 200 and 400 ppm
respectively
Figure 47 Intensity of Cardboard Odor Descriptor in Cooked Ground Turkey Meat
Treated with Different Antioxidants Rated in a 15-cm Line Scale
K200 and K400 represent Treatment with Keluak extract at concentrations of 200 and 400 ppm
respectively
000
100
200
300
400
500
600
700
800
900
1000
0 2 4 6 8
15
cm
Lin
e s
cale
(av
era
ge)
Days
Control
BHT
K200
K400
-1
0
1
2
3
4
5
6
7
0 2 4 6 8
15
cm
Lin
e s
cale
(av
era
ge)
Days
Control
BHT
K200
K400
52
Figure 48 Intensity of Fatty Odor Descriptor in Cooked Ground Turkey Meat Treated
with Different Antioxidants Rated in a 15-cm Line Scale
K200 and K400 represent Treatment with Keluak extract at concentrations of 200 and 400 ppm
respectively
000
100
200
300
400
500
600
700
800
900
0 2 4 6 8
15
cm
Lin
e s
cale
(av
era
ge)
Days
Control
BHT
K200
K400
53
48 Tables
Table 41a TBARS Value of Cooked Ground Turkey Meat Treated with Various Antioxidants during Storage at 2˚C- A Preliminary Study
TBARS (mg MDAkg meat) Average
Storage (Day) Control BHT 002 Keluak 200ppm Keluak 400ppm
0
131plusmn009Aa 094plusmn021Ba 050plusmn004Ca 037plusmn010Ca
1
189plusmn003Aab 161plusmn025Aab 080plusmn006Ba 057plusmn026Bab
3
243plusmn010Ac 236plusmn025Abc 111plusmn022Bab 055plusmn008Cab
5
397plusmn016Ad 319plusmn064Acd 170plusmn025Bbc 108plusmn023Bb
7
473plusmn076Ad 373plusmn074ABd 217plusmn040ACc 101plusmn044Cab
Different letters (A-D) within a row indicates that mean values are significantly different (Plt 005) Different letters within a column (a-d) within the same treatment are significantly different (Plt005)
Table 41b TBARS Value of Cooked Ground Turkey Meat Treated with Various Antioxidants during Storage at 2 ˚C- Extended Storage Time
TBARS (mg MDAkg meat) Average
Storage (day) Control BHT 002 K200 K400
0 129 plusmn 008Ae 091plusmn 004Bcd 065plusmn 015Be 101plusmn 003Cf
1 159plusmn 008Ade 076plusmn 005Cd 083plusmn 012Ce 127plusmn 006Bf
3 220plusmn 011Acd 074plusmn 004Dd 119plusmn 003Cd 160plusmn 004Be
5 258plusmn 014Ac 082plusmn 006Cd 076plusmn 014Ce 150plusmn 004Bd
7 377plusmn 001Ab 109plusmn 002Ccb 158plusmn 006Bc 160plusmn 006Bd
10 405plusmn 061Aab 121plusmn 009Bb 197plusmn 012Bb 195plusmn 009Bc
13 465plusmn 014Aa 151plusmn 004Ca 224plusmn 003Bab 218plusmn 003Bb
15 459plusmn 024Aa 154plusmn 013Da 231plusmn 014Ca 284plusmn 010Ba
Different letters (A-D) within a row indicates that mean values are significantly different (Plt 005) Different letters within a column (a-f) within the same treatment are significantly different (Plt005)
K200 and K400 represent treatments with Keluak extract at concentration of 200 and 400 ppm
respectively
54
Table 42a Conjugated Dienes Concentrations with Antioxidant Treatments and Storage
At 2˚C- A Preliminary Study
Conj Dienes (nmolemg meat)
Storage (Days) Control BHT 002 K200 K400
0 015plusmn003Abc 022plusmn001Aa 013plusmn001Ab 020plusmn008Aa
1 012plusmn001Abc 012plusmn003Ab 011plusmn001Ab 019plusmn001Bab
3 006plusmn000Ac 003plusmn002Ac 002plusmn002Ab 004plusmn002Ab
5 038plusmn000Aa 024plusmn001Ba 027plusmn007ABa 021plusmn001Ba
7 023plusmn008Ab 026plusmn001Aa 029plusmn003Aa 016plusmn001Aab
Different letters (A-C) within a row indicates that mean values are significantly different (Plt 005) Different letters within a column (a-d) within the same treatment are significantly different (Plt005)
K200 and K400 represent treatments with Keluak extract at concentration of 200 and 400 ppm
respectively
Table 42b Conjugated Dienes Concentrations After Antioxidant Treatments and
Storage At 2˚C- Extended Storage Time
Conjugated Dienes (nM mg meat)
Storage (Days) Control BHT 002 K200 K400
0 013plusmn 001Aab 009plusmn000Bab 010plusmn 000Ba 010plusmn 001Ba
1 008plusmn 001Ac 008plusmn 001Ab 008plusmn 000Abc 007plusmn 001Ab
3 011plusmn 000Ab 009plusmn 001Bab 008plusmn 000Bbc 006plusmn 000Cb
5 012plusmn001Ab 008plusmn 001B b 006plusmn 000Bd 006plusmn 000Bb
7 011plusmn001Abc 008plusmn 000B ab 006plusmn 001Bcd 007plusmn 000Bb
10 014plusmn 000Aa 009plusmn 000Bab 009plusmn 001Bab 007plusmn 000Cb
13 014plusmn 001Aa 009plusmn 000Bab 008plusmn 000Bbc 006plusmn 000Cb
15 014plusmn 000Aa 010plusmn 001Ba 008plusmn 001BCbcd 007plusmn 000Cb
Different letters (A-C) within a row indicates that mean values are significantly different (Plt 005) Different letters within a column (a-d) within the same treatment are significantly different (Plt005)
K200 and K400 represent treatments with Keluak extract at concentration of 200 and 400 ppm
respectively
55
Table 43 Peroxide Value (meq kg meat) of Different Antioxidant treatments during
Storage of cooked ground turkey meat at 2˚C
PV (meq kg meat)
Storage (Days) Control BHT 002 K200 K400
0 110plusmn 042Abc 070plusmn 014Ae 080plusmn 028Ad 130plusmn 014Acd
1 230plusmn 014Aab 130plusmn 014Bd 090plusmn 014BCd 070plusmn 014Cd
3 080plusmn 000Ac 070plusmn 014Ae 070plusmn 014Ad 070plusmn 014Ad
5 280plusmn 028Aa 140plusmn 000Bcd 110plusmn 014Bcd 080plusmn 028Bd
7 170plusmn 042Aabc 190plusmn 014Ac 195plusmn 021Abc 225plusmn 049Abc
10 310plusmn 042Aa 330plusmn 014Aa 290plusmn 042Aa 340plusmn 028Aa
13 255plusmn 007Aa 265plusmn 021Ab 240plusmn 028Aab 260plusmn 028Aab
15 255plusmn 064Aa 150plusmn 014ABcd 086plusmn 006Bd 100plusmn 028Bd
Different letters (A-C) within a row indicates that mean values are significantly different (Plt 005) Different letters within a column (a-e) within the same treatment are significantly different (Plt005)
K200 and K400 represent Treatment with Keluak extract at concentrations of 200 and 400 ppm
respectively
Table 44 Intensity of Meaty Odor Descriptor in Cooked Ground Turkey Meat Treated with Different Antioxidants Rated in a 15-cm Line Scale
Storage (Day) Control BHT 002 K200 K400
0 595plusmn250Aa 727plusmn144Aa 632plusmn202Aa 606plusmn189Aa
1 783plusmn208Aa 731plusmn174ABa 543plusmn220Ba 542plusmn294Ba
3 613plusmn201Aa 693plusmn143Aa 502plusmn266Aa 552plusmn228Aa
5 734plusmn277Aa 710plusmn290Aa 474plusmn253Aa 487plusmn263Aa
7 694plusmn296Aa 751plusmn265Aa 532plusmn259Aa 543plusmn236Aa
Different letters (A-C) within a row indicates that mean values are significantly different (Plt 005) Different letters within a column (a-b) within the same treatment are significantly different (Plt005)
K200 and K400 represent Treatment with Keluak extract at concentrations of 200 and 400 ppm
respectively
56
Table 45 Intensity of Rancid Odor Descriptor in Cooked Ground Turkey Meat Treated
with Different Antioxidants Rated in a 15-cm Line Scale
Storage (Day) Control BHT 002 K200 K400
0 228plusmn194Aa 193plusmn175Aa 334plusmn231Aa 350plusmn274Aa
1 177plusmn194Aa 172plusmn163Aa 392plusmn274ABa 426plusmn265Ba
3 260plusmn210Aa 272plusmn265Aa 419plusmn306Aa 337plusmn247Aa
5 344plusmn255Aa 329plusmn215Aa 427plusmn248Aa 395plusmn253Aa
7 408plusmn300Aa 289plusmn244Aa 448plusmn241Aa 385plusmn244Aa
Different letters (A-B) within a row indicates that mean values are significantly different (Plt 005) Different letters within a column (a-b) within the same treatment are significantly different (Plt005)
K200 and K400 represent Treatment with Keluak extract at concentrations of 200 and 400 ppm
respectively
Table 46 Intensity of Eggy Odor Descriptor in Cooked Ground Turkey Meat
Treated with Different Antioxidants Rated in a 15-cm Line Scale
Storage (Day) Control BHT 002 K200 K400
0 643plusmn242Aa 513plusmn244Aa 502plusmn324Aa 565plusmn287Aa
1 597plusmn248Aab 476plusmn321Aa 599plusmn332Aa 584plusmn360Aa
3 345plusmn258Ab 400plusmn270Aa 515plusmn335Aa 509plusmn425Aa
5 364plusmn303Aab 424plusmn320Aa 475plusmn269Aa 469plusmn180Aa
7 473plusmn306Aab 364plusmn210Aa 485plusmn268Aa 431plusmn305Aa
Different letters (A-C) within a row indicates that mean values are significantly different (Plt 005) Different letters within a column (a-e) within the same treatment are significantly different (Plt005)
K200 and K400 represent Treatment with Keluak extract at concentrations of 200 and 400 ppm
respectively
57
Table 47 Intensity of Cardboard Odor Descriptor in Cooked Ground Turkey Meat
Treated with Different Antioxidants Rated in a 15-cm Line Scale
Storage (Day) Control BHT 002 K200 K400
0 299plusmn222Aa 209plusmn182Aa 261plusmn198Aa 312plusmn157Aa
1 262plusmn249Aa 180plusmn192Aa 339plusmn238Aa 342plusmn229Aa
3 299plusmn203Aa 284plusmn254Aa 388plusmn235Aa 287plusmn185Aa
5 252plusmn243Aa 290plusmn190Aa 309plusmn193Aa 320plusmn204Aa
7 301plusmn210Aa 273plusmn253Aa 337plusmn195Aa 284plusmn205Aa
Different letters (A-C) within a row indicates that mean values are significantly different (Plt 005) Different letters within a column (a-e) within the same treatment are significantly different (Plt005)
K200 and K400 represent Treatment with Keluak extract at concentrations of 200 and 400 ppm
respectively
Table 48 Intensity of Fatty Odor Descriptor in Cooked Ground Turkey Meat Treated with Different Antioxidants Rated in a 15-cm Line Scale
Storage (Day) Control BHT 002 K200 K400
0 344plusmn226aA 350plusmn256aA 395plusmn309aA 395plusmn277aA
1 417plusmn285aA 389plusmn230aA 401plusmn345aA 438plusmn287aA
3 388plusmn220aA 378plusmn229aA 396plusmn328aA 403plusmn285aA
5 479plusmn252aA 461plusmn293aA 389plusmn255aA 428plusmn320aA
7 460plusmn288aA 492plusmn286aA 426plusmn281aA 428plusmn340aA
Different letters (A-C) within a row indicates that mean values are significantly different (Plt 005) Different letters within a column (a-e) within the same treatment are significantly different (Plt005)
K200 and K400 represent Treatment with Keluak extract at concentrations of 200 and 400 ppm
respectively
58
Table 49 pH Values of Cooked Ground Turkey Treated with Different
Antioxidants Stored at 2˚C
pH Value
Storage (Day) Control BHT 002 K200 K400
0 665plusmn 002Aab 644plusmn 003Bbc 646plusmn 004Bbc 658plusmn 003Aab
1 659plusmn 003Ab 643plusmn 003Cbc 651plusmn 001Babc 662plusmn 001Aab
3 645plusmn 003Bc 634plusmn 002Cd 643plusmn 004Bc 654plusmn 000Ab
5 663plusmn 002Aab 640plusmn 002Cc 645plusmn 004Cc 654plusmn 002Bb
7 647plusmn 001Ac 633plusmn 003Bc 648plusmn 004Aabc 646plusmn 006Ac
10 665plusmn 001Aab 646plusmn 002Dbc 654plusmn 001Cab 660plusmn 003Bab
13 665plusmn 002Aab 648plusmn 002Cab 655plusmn 002Ba 664plusmn 002Aa
15 668plusmn 001Aa 651plusmn 001Da 655plusmn 001Ca 663plusmn 001Ba
Different letters (A-D) within a row indicates that mean values are significantly different (Plt 005) Different letters within a column (a-c) within the same treatment are significantly different (Plt005)
K200 and K400 represent treatments with Keluak extract at concentrations of 200 and 400 ppm
respectively
59
49 References
1 Chye FY Sim KY Antioxidative and Antibacterial Activities of Pangium edule Seed Extracts International Journal of Pharmacology 2009 5 285-297
2 Kahkonen M Hopia A Vuorela H Rauha J Pihlaja K Kujala T Heinonen M Antioxidant activity of plant extracts containing phenolic compounds J Agric Food Chem 1999 47 3954-3962
3 Jayaprakasha G Selvi T Sakariah K Antibacterial and antioxidant activities of grape (Vitis vinifera) seed extracts Food Res Int 2003 36 117-122
4 Gray J Macdonald B Pearson A Morton I Role of Nitrite in Cured Meat Flavor - a Review J Food Prot 1981 44 302-amp
5 Juntachote T Berghofer E Siebenhandl S Bauer F The antioxidative properties of Holy basil and Galangal in cooked ground pork Meat Sci 2006 72 446-456
6 Teets AS Were LM Inhibition of lipid oxidation in refrigerated and frozen salted raw minced chicken breasts with electron beam irradiated almond skin powder Meat Sci 2008 80 1326-1332
7 Han D McMillin K Godber J Bidner T Younathan M Marshall D Hart L Iron Distribution in Heated Beef and Chicken Muscles J Food Sci 1993 58 697-700
8 Ahn D Wolfe F Sim J Prevention of Lipid Oxidation in Precooked Turkey Meat Patties with Hot Packaging and Antioxidant Combinations J Food Sci 1993 58 283-287
9 Asghar A Gray J Buckley D Pearson A Booren A Perspectives on Warmed-Over Flavor Food Technol 1988 42 102-108
10 Kingston E Monahan F Buckley D Lynch P Lipid oxidation in cooked pork as affected by vitamin E cooking and storage conditions J Food Sci 1998 63 386-389
11 Kulas E Ackman R Different tocopherols and the relationship between two methods for determination of primary oxidation products in fish oil J Agric Food Chem 2001 49 1724-1729
12 Srinivasan S Xiong Y Decker E Inhibition of protein and lipid oxidation in beef heart surimi-like material by antioxidants and combinations of pH NaCl and buffer type in the washing media J Agric Food Chem 1996 44 119-125
13 Lee M Choi J Choi Y Han D Kim H Shim S Chung H Kim C The antioxidative properties of mustard leaf (Brassica juncea) kimchi extracts on
60
refrigerated raw ground pork meat against lipid oxidation Meat Sci 2010 84 498-504
14 Fardiaz D Romlah S Antioxidant Activity of Picung (Pangium edule
Reinw) Seed In Development of Food Science and Technology in ASEAN
Proceedings of the 4th ASEAN Food Conference Feb 17-21 1992 ASEAN
Jakarta Indonesia 1992
15 Frankel E N Lipid oxidation Dundee Scotland The Oily Press Ltd 1998 Vol 10 pp 13ndash41 16 Ma Amy A Peranakan favorite is ayam buah keluak Chicken stewed with black nuts at True Blue Restaurant Wall Street Journal (Online) New York NY Dec 16 2010 Retrieved July 20 2011 from httpproquestumicompqdwebdid=2214039511ampsid=1ampFmt=3ampclientId=36305ampRQT=309ampVName=PQD
17 Esteacutevez M Morcuende D and Ventanas S Determination of Oxidation
Nollet Leo M LToldraacute Fidel (Eds) Handbook of Muscle Foods Analysis Boca
Raton CRC Press 2009 221-240
18 Grau A Codony R Rafecas M Barroeta A Guardiola F Lipid
hydroperoxide determination in dark chicken meat through a ferrous oxidation-
xylenol orange method J Agric Food Chem 2000 48 4136-4143
19 Shahidi F Janitha P Wanasundara P Phenolic Antioxidants Crit Rev Food Sci Nutr 1992 32 67-103
20 Ruth SM Techniques for sampling and identification of volatile compounds contributing to sensory perception In Nollet Leo M LToldraacute Fidel (Eds) Handbook of Muscle Foods Analysis Boca Raton CRC Press 2009 503-523
21 Bou R Guardiola F Grau A Grimpa S Manich A Barroeta A Codony R Influence of dietary fat source alpha-tocopherol and ascorbic acid supplementation on sensory quality of dark chicken meat Poult Sci 2001 80 800-807
22 Gray J I and A M Pearson Rancidity and warmed over flavour In Pearson A M and Dutson T R (Eds) Advances in Meat Research Vol 3 Nostrand-Reinbold Co New York NY 1987 221ndash269 23 OrsquoNeill L M K Galvin P A Morrissey and D J Buckley Comparison of effects of dietary olive oil tallow and vitamin E on the quality of broiler meat and meat products Br Poult Sci 1998 39 365ndash371
61
Chapter 5 CONCLUSION AND FUTURE WORK
The results of the present study indicated that the Keluak extract
incorporated into cooked ground turkey can reduce lipid oxidation The addition
of Keluak extracts at 200 and 400 ppm had a positive effect on reducing the
TBAR values and the conjugated dienes content compared to the control without
added AOs during storage at 2˚C for 15 days The Keluak extract used in this
study was comparable to BHT (002) in reducing lipid oxidation in meat
Peroxide value analysis did not differentiate between the control and the
treatments on the extent of lipid oxidation Due to confusion of the odor
components in the Keluak extracts by the panelists there were no significant
differences between the treatments in the odor sensory evaluation
Keluak seed is a culinary spice with no known toxic effect Its moderate
pungent aroma makes it valued as a traditional ethnic food flavorant in parts of
South East Asia With its substantial phenolic content and antioxidant properties
it could be an effective source of natural antioxidants However the application
of this natural antioxidant might be limited in Western cultures due to its effect
on the color and odor of meat products Further investigations are needed to
identify selective extraction and clean-up techniques that could be used to
eliminate the color and odor problem Other chemical analysis methods that
might provide better information on the extent of oxidation in meat products
include the p-anisidine value Food Oil Sensor (FOS) and Gas chromatography
techniques (GC analysis) of selected volatiles
4
Chapter 2 REVIEW OF LITERATURE
21 Trend in Poultry Consumption
Consumption of poultry meat has increased in both developed and
developing countries (25) In the US per capita poultry meat consumption
increased from 79 pounds in 1990 to 954 pounds in 2000 and to just over 100
pounds in 2011 (26) Overall according to the National Chicken Council (6) per
capita consumption of red meat and poultry has not changed significantly but
when beef pork and poultry are examined separately red meat appears to be
losing market share to poultry Chicken and turkey were by far the most widely
consumed poultry species at approximately 822 and 164 pounds per person per
year respectively (26) According to Bilgili (27) it is predicted that poultry will
become the overall meat of choice by 2020
This continued growth and the competitive nature of the poultry industry
has been attributed to a variety of factors such as improvements in intensive
production and processing and development of a wide range of value-added
processed products that meet both direct consumer demand and the rapid
expansion of fast food outlets Poultry products are universally popular because
they are often not subject to cultural or religious constraints and the meat itself is
perceived as wholesome healthy and nutritious since it is relatively low in fat
and it has a more desirable unsaturated fatty acid composition than other meats
Most importantly high quality poultry products are available to many people at
affordable prices even though production costs vary widely around the world
(25) Precooked meat products have attained a high degree of consumer
acceptance because of the relative cost and ease of preparation (28)
Due to the increase in consumption the world production of poultry has
increased the past few decades The industry will remain responsive to consumer
demands both in the range and nature of the products developed although the
focus on quality will continue While the term ldquoqualityrdquo is defined according to
the consumerrsquos own perceptions goals and personal preferences however in
practicality product quality includes scientifically measurable characteristics of
color texture and flavor One main factor limiting the quality and acceptability of
5
meat and meat products is lipid oxidation a process that leads to deterioration of
quality characteristics such as color flavor texture nutritive value and safety
(25) Therefore the meat industry faces a challenge in developing strategies for
preventing lipid oxidation in meat and meat products
22 Lipid Oxidation
221 Overview
A wide variety of organic molecules are susceptible to chemical attack by
oxygen Lipid oxidation can occur in foods containing considerable amounts of
fat (particularly fats containing substantial percentages of unsaturated fatty
acids) including nuts milk and meat products (1) Oxidation of lipids is initiated
by irradiation including exposure to visible light by enzymes and metal catalysts
Heat and pressure will accelerate lipid oxidation (2) Quality attributes of foods
can be substantially affected by this process For instance negative aroma
changes in the food can result from volatile oxidation products the color can
darken as a result of condensation reactions between oxidation products and
proteins and lastly the texture can be modified by the oxidative induction of
protein crosslinks (1) Not unexpectedly the nutritive value and safety can also be
compromised
222 Mechanism of Lipid Oxidation
Lipid autoxidation is a free radical chain reaction that once the
peroxidation process is initiated it proceeds as a free-radical mediated chain
reaction that can be described in terms of initiation propagation and termination
processes (29)
2221 Initiation
R H R + H (1)
An initiator reacts with unsaturated lipids (RH) to form a lipid free radical
(R) (reaction 1) Unsaturated lipids (RH) are easily oxidized by one of several
reactive oxygen species (ROS) which include oxygen radicals and non-radical
derivatives of oxygen (29) such as O2 and OH Poly-unsaturated fatty acids
Initiator
6
(PUFA) are much more susceptible to oxidation than mono-unsaturated fatty
acid (MUFA) (46)
The initiation reaction can include transition metals (ie iron copper)
oxidants various hemolysis-prone substances or enzymes (1) This production of
free radicals can occur because of the direct thermal dissociation (thermolysis) of
hydroperoxides because of transition metal catalysis or exposure to light
(photolysis) with or without the intervention of photosensitizers (30) The
spontaneous abstraction of a hydrogen atom from an organic material by
molecular oxygen is an endothermic reaction which has a large activation energy
and although it might occur to a certain extent this stage is probably too slow to
be of practical importance Either the organic molecule or the oxygen should be
activated before the reaction could take place (1)
2222 Propagation
R + O2 ROO (2)
ROO + RH rarr ROOH + R (3)
An unsaturated lipid contains labile hydrogen(s) that can be abstracted
relatively easily This free radical (R) will react rapidly with molecular oxygen to
produce a peroxyl radical (ROO ) (reaction 2) The newly formed hydroperoxyl
radical can so forth abstract a hydrogen atom from an adjacent unsaturated fatty
acid (reaction 3) and the reaction goes on propagation cycles before termination
(29)
2223 Termination
ROO + ROO rarr non-radical products [ROOOOR] (4)
RO + R rarr ROR
R + R rarr RR
R + ROO rarr ROOR
Termination can occur by condensation of peroxy alkoxy andor alkyl
radicals Peroxy radicals at room temperature can combine to produce peroxy-
linked dimers (ROOR) Alkoxy and alkyl radicals at low oxygen pressure and
7
high temperatures can combine to produce ether-linked dimers (ROR) and
carbon-carbon linked dimers (RR) Alkyl radicals can combine with peroxy
radicals to generate peroxy-linked dimers (ROOR) (30-32)
Hydroperoxides the primary initial products of lipid oxidation can
breakdown as soon as they are formed The decomposition can be catalyzed by
transition metals particularly iron or copper or by elevated temperatures
gt100degC Hydroperoxide decomposition can involve several complex pathways
forming a wide variety of volatile and non-volatile secondary products such as
aldehydes ketones alcohols acids and hydrocarbons which can affect flavor
greatly Some of the volatile aldehydes can be extremely potent and can affect
flavor of food at concentrations less than 1 ppm (31) Another important
termination reaction involves an antioxidant (AH) (30) which will be discussed
later in the chapter
23 Lipid Oxidation in Meat
Meat can oxidize very rapidly post-mortem The rate and degree of lipid
oxidation are affected by factors that include meat composition fatty acid
content processing conditions and chemical additives in the meat products (3)
It is generally agreed that lipid oxidation in muscle foods begins immediately
after slaughter in the highly unsaturated phospholipids fraction in the subcellular
membranes (25) Botsoglou et al (25) added that in most cases fresh meat has an
acceptable stability with respect to oxidation but processing operations such as
freezing and thawing mechanical deboning mincing restructuring the addition
of salt and refrigeration can lead to increased oxidation due to the destruction of
cellular structure and functions
Cooked or pressure-treated meat and meat products can be more
susceptible to oxidation since endogenous antioxidant enzymes may denature
and lose their activities while iron-containing proteins may become a source of
catalytic iron
Poultry meat is particularly susceptible to lipid oxidation due to its high
content of polyunsaturated lipids pigments metal catalysts and various other
8
oxidizing agents (25) This implies that even low-fat poultry meat products are
susceptible to lipid oxidation since fat reduction primarily reflects a reduction in
triacylglycerides while the phospholipid fraction which is high in
polyunsaturated fat is much less affected (34) Another factor is that species
differences in susceptibility to lipid oxidation are largely determined by the level
of poly-unsaturated fatty acid (PUFA) present in meat Thus the extent of lipid
oxidation in cooked meat is directly related to the level of unsaturated fatty lipids
with susceptibility to oxidation decreasing in the order of chicken gt pork gt beef gt
lamb (4) Chicken has fewer tendencies to develop oxidized flavor than turkey
because the higher level of vitamin E in chicken fat retards oxidation Oxidation
proceeds faster in turkey thigh meat than in breast meat as the darker meat
contains more lipid and heme iron (17)
Hydroperoxides formed during lipid peroxidation undergo decomposition
to form secondary oxidation products Those secondary products include volatile
aldehydes ketones acids alcohols and hydrocarbon compounds Aldehydes (ie
hexanal) are one of the primary causes of rancid and stale flavors in precooked
meat products (3)
231 Factors Affecting the Extent of Lipid Oxidative Stability in Meat
There are factors that can affect lipid stability in meat and meat pr0ducts
such as fatty acid composition endogenous prooxidative or antioxidative
components meat processing operations and various additives
2311 Fatty Acid Composition of Meat
It is generally agreed that unsaturated fatty acids (UFA) are responsible
for lipid oxidation in meat Also as the concentration of polyunsaturated fatty
acids (PUFA) increases lipid oxidation increases in muscle foods (4) The amount
of UFA in muscle foods varies depending on the animal species genetic origin
diet sex age at which the animal is slaughtered type of muscle and processing
factors such as fat addition to ground meat (5)
Turkey meat showed low values for total lipid and cholesterol but
greater values than beef pork and lamb for its PUFA content The content of n3
9
fatty acids was the greatest in turkey among meats that included beef pork and
lamb The species is the major source of variation in fatty acid composition The
fatty acid composition of turkey meat is shown in Table 21 (50) Ruminant meats
contain a greater percentage of saturated fat compared with the meat of
monogastric animals (6)
2312 Endogenous prooxidative and antioxidative constituents
Endogenous prooxidative constituents in meat systems consist of iron-
containing proteins transition metals and endogenous enzymes The catalytic
effect of iron-containing protein on the oxidative deterioration of PUFA was first
described by Robinson (35) Since then heme catalyzed lipid oxidation has been
studied extensively and it has become a generally accepted phenomenon that
lipid oxidation is accelerated by heme compounds and transition metals in meat
systems
Lipoxygenase peroxidase and microsomal enzymes identified in various
animal tissues catalyze the reaction of PUFA oxidation with the formation of
unconjugated dienes (7) However enzymatic lipid oxidation catalysts are normal
components in blood and consequently are not a primary problem in most
muscle foods (8)
2313 Meat Processing
According to McMillin (33) quality of raw materials time postmortem
extent of heating and comminution or particle size reduction and the ingredients
added are processing factors that can influence the rate of lipid oxidation Even
though lipid oxidation varies among different animal species such species effects
have been inconsistent and may be due to differences in anatomical location
diet environmental temperature sex age phospholipid content body
composition and experimental conditions such as cooking temperature sample
handling and method for assessing lipid oxidation
Heating encourages the development of lipid oxidation by affecting the
distribution of the iron in the muscle food (9) During cooking a variety of
volatiles producing off-odors and flavors are generated as PUFA oxidize (10)
10
Heat quickly decomposes hydroperoxides produced resulting in the production
of desirable flavor in cooked products The shelf-life of meat products is usually
prolonged by frozen storage Under freezing conditions the rate of oxidation can
be reduced but not completely prevented (1)
Lipid oxidation in cooked meat is commonly referred to as warmed-over-
flavor (WOF) WOF often develops within 1-3 days of refrigerated storage and is
characterized by the loss of fresh cooked meat aroma and a simultaneous
increase in undesirable odors which are commonly described as ldquostalerdquo ldquowet
cardboardrdquo ldquopaintyrdquo ldquograssyrdquo or ldquorancidrdquo (11) The most important contributors
to the development of WOF are the secondary oxidative compounds such as
hexanal pentanal and 2 3- octanedione (12) According to Kerler and Grosch
(59) identified (E E)-2 4-decadienal butyric acid and furaneol as key
compounds in fresh boiled chicken aroma while hexenal butyric acid and 1-
octen-3-one were the main compounds in chicken reheated after 48 hours
storage at 4˚C
The tendency of precooked meat products to oxidize has led food
scientists processors and the industries to develop techniques that allow
extended shelf life of these products In addition to antioxidants the appropriate
packaging and proper storage conditions are useful techniques to achieve
extended storage times
2314 Non-meat Additives
Non-meat additives can be prooxidative or antioxidative agents The
addition of salt NaCl commonly used in meat products to add flavor and
functionality at 05-25 (4) is a prooxidant Salt has been shown to accelerate
oxidation in pork patties (13) by enhancing the activity of iron atoms which then
promotes iron-catalyzed oxidation and flavor deterioration (1) Transitions
metals other than iron (copper especially) supplied by the water from
processing equipment andor spices can also promote oxidation (36)
The use of antioxidants synthetic or natural has been used to prevent lipid
oxidation in meat products The addition of nitrites phosphates citric acid
phytic acid and EDTA has been reported to inhibit lipid oxidation in meat
11
products (10 14) In addition synthetic phenolic antioxidants such as butylated
hydroxytoluene (BHT) butylated hydroxyanisol (BHA) tertiary-butylated
hydroquinone (TBHQ) and propyl gallate has been widely used for more than 50
years to inhibit lipid oxidation in meat products (12)
Several water-soluble compounds including ascorbic acid uric acid
cysteine and glutathione are also known to scavenge radicals and delay oxidation
(37) In meat the functions of ascorbic acid include maintenance of cured color
and prevention of off-flavors (15) Ascorbic acid becomes a prooxidant in meat
products at concentrations greater than 300 mgkg (8)
In the last 30 years natural antioxidant use has increased Various plant
materials and extracts containing polyphenolic compounds have been proven to
be effective antioxidants in meat systems Rosemary and rosemary extracts at
concentrations between 002 to 003 are one of the many natural antioxidants
being studied (3 16-18)
232 Measurement of rancidity in meat
Hydroperoxides the primary products of lipid oxidation are colorless
tasteless and odorless It is the breakdown of these peroxides that produce a
complex mixture of low molecular weight volatile compounds including alkanes
alkenes aldehydes ketones alcohols esters and acids many with distinctive
odor and flavor characteristics (19 38) These compounds convey rancid
cardboard oxidized pungent and other off-flavors characteristic of oxidized meat
(39)
Since oxidative decomposition products are of great importance to product
acceptability and nutritional quality a wide variety of assays from subjective
analyses (ie sensory evaluation) to physical and chemical analyses of various
components have been developed to detect and quantify lipid oxidation in foods
However there is no single effective method to measure all the oxidative
products that are generated during lipid oxidation There is no good method
useful for all stages of oxidation An assay can only monitor only a few changes or
specific reactants when applied to a food system under specific conditions
Therefore a combination of assays would be required to monitor the extent of
12
lipid oxidation in most foods It is also common to apply methods that are based
on measuring one of more of the key primary or secondary oxidation products
2321 Peroxide Value
Since the primary product of lipid oxidation are hydroperoxides it is
proper to determine their concentration as one measure of oxidation The
peroxide value (PV) assay represents the total concentration of peroxides and
hydroperoxides present at a certain time in the food product However this test
is restricted by the chemical instability of these compounds after their
concentration reaches a maximum level they decay as a function of temperature
and the presence of other food components particularly transition metals such
as iron and copper (1)
In muscle tissue the lipid is extracted with a mixture of solvents without
decomposition of the hydroperoxides One of the most common extraction
methods was developed by Folch Lees and Stanley (20) Several methods to
determine the PV have been developed that include iodometric titration method
a ferric thiocyanate method and other colorimetric methods (21 40) PV can be
expressed in several units such as meq iodinekg fat (40) or as meq of
peroxidekg fat (45)
2322 Conjugated Dienes
Conjugated diene hydroperoxides (CDs) are one of the primary products of
the oxidation for linoleate (182) and PUFAs with 3 or more double bonds CDs
can be determined quantitatively by their absorbance at 232-234 nm (22) In
meat samples the CD are first extracted from homogenized sample with an
extracting solution such as 31 hexane isopropanol (23 24)
The greater the amount of PUFA in a fat the greater the potential rise in
the CD values However the CD values plateau at a certain concentration at
which the breakdown roughly equals the formation of new CDs At this point in
the oxidation process no additional changes can be measured by the CD assay
(41)
13
httpwwwchemistrydailycomchemistryDiene
2323 Thiobarbituric Acid Reactive Substances (TBARS)
An alternative approach to the determination of the extent of oxidation is
the measurement of selected secondary oxidation products In contrast to the PV
assay those assays are not limited to the early stages of oxidation and may reflect
the formation of volatile products such as carbonyl compounds which actually
contribute to the rancid and objectionable flavor The application of methods
based on this approach requires a detailed knowledge of the chemistry involved
and an understanding of the stability of the compounds assayed etc Among
these methods the thiobarbituric acid test (TBA) is one of the most common in
spite of criticisms of its reproducibility and reliability The test is based on the
color product resulting from the condensation of TBA with malonaldehyde which
is presumably generated in the oxidized fats However a large body of evidence
suggests that other food components can react with TBA to generate the same
chromophore and even the formation of malonaldehyde is dependent on the
composition of the initial lipid (1) For example other products of lipid oxidation
such as alka-2 4-dienals also react with TBA to form a red complex with the
same absorption maximum as the malonaldehyde-TBA complex shown in the
diagram below (42) For this reason Gray suggested that the TBA procedure
should be used to assess the extent of lipid oxidation in general rather than to
quantify malonaldehyde and the term thiobarbituric acid-reactive substances
(TBARS) is now commonly used in place of the TBA number or value (10)
The extent of lipid oxidation is reported as the TBA number or TBA
value and is expressed as milligrams of malonaldehyde equivalents per kilogram
of sample Malonaldehyde is a relatively minor lipid oxidation product formed
14
during the oxidation of polyunsaturated fatty acids and reacts with TBA to
produce a colored complex with an absorption maximum at 530-532 nm
Malonaldehyde has been reported to correlate well with sensory scores of
oxidized flavors in muscle foods (38) This assay is not recommended for
monitoring the extent of oxidation of food oils
httpmnh20wordpresscom20100719518
2324 Sensory Evaluation
A wide range of methods have been used to examine the effects of lipid
oxidation on the quality of stored turkey meat In addition to the chemical or
instrumental techniques sensory evaluation is very useful for assessing the
quality and stability of meat and meat products from lipid oxidation Most of
these analyses such as the PV TBARs CDs or gas chromatographic analysis of
specific volatiles can be correlated to sensory analysis but none of these chemical
or physical analyses can effectively replace the human nose taste buds and
sensory receptors (43)
According to Warner (43) sensory evaluation is a scientific discipline used
to evoke measure analyze and interpret reactions to food and material
characteristics as they are perceived by sense of sight smell taste touch and
hearing Although sensory evaluation can have a low reproducibility relative to
gas chromatography well-trained and experienced sensory panelists operating
under controlled conditions can provide accurate reliable data The American
Meat Science Association (44) has developed standard guidelines for sensory
analyses The AMSA recommendations include sample preparation cooking
methods and procedures facilities preparation and presentation of samples
15
trained sensory panels test forms consumer panels and instrumental
measurement of tenderness
24 Control of Oxidation Antioxidants
Antioxidants are substances that can delay the onset of lipid oxidation and
extend the induction period They must be added as early as possible in the
manufacturing process or to finished food products to be effective in reducing
lipid oxidation Antioxidants cannot reverse the oxidation of rancid food
products Moreover antioxidants are not effective in controlling hydrolytic
rancidity which is enzyme-catalyzed hydrolysis of fats Antioxidants can control
lipid peroxidation in six ways reducing localized O2 concentrations scavenging
species that initiate peroxidation quenching singlet O2 to prevent the formation
of peroxides binding free metal ions (chelating agent) into a form that will not
generate reactive species or decompose lipid peroxides to peroxyl or alkoxyl
radicals peroxide removal and chain breaking to prevent more hydrogen
abstraction from fatty acid side chains (46) There are three types of antioxidants
based on their mechanism (46 47)
241 Type I - Also called the primary or free-radical chain stopper antioxidants
Type I antioxidants inhibit the chain reaction by acting as hydrogen
donors or free-radical acceptors (AH) (46) Compounds in this category stop the
free radical chain reactions by converting the radicals into more stable products
(47) by reacting primarily with ROO and not with R radicals Basically the
mechanism is a competition between ldquothe inhibitor reactionrdquo (46)
ROO + AH ROOH + A
And ldquothe chain propagation reactionsrdquo
ROO + RH ROOH + R
The effectiveness of a primary antioxidant is dependent on several factors
such as activation energy rate constants oxidation-reduction potential ease of
antioxidant loss or destruction and solubility properties (46) Labuza pointed out
that another important characteristic of an efficient antioxidant is that the
16
resulting antioxidant free radical must not itself initiate new free radicals or be
rapidly oxidized by a chain reaction (46) Type I antioxidants are primarily
phenolic compounds such as butylated hydroxytoluene (BHT) and butylated
hydroxyanisole (BHA) (47) and tert-butylhydroquinone (TBHQ) commonly
present in foods These synthetic food additives are permitted to be used alone or
in combination However the antioxidant content of a food containing these
additives must not exceed 002 of the oil or fat content of the food according to
the Code of Federal Regulations (58)
Butylated Hydroxyanisole
Phenolic compounds synthetic or natural are excellent antioxidants since
they possess benzene rings containing hydroxyl groups and are relatively
reactive Phenols produce stable antioxidant radicals A that are sufficiently
unreactive to propagate the chain and compete with the lipid substrate (RH)
which is present at a much greater concentration (46)
A + ROO Non-radical products
A + A Non-radical products
Since synthetic antioxidants such as BHT and BHA have restrictions for
use in food due to their toxicological effects on several species and they are
suspected to be potential carcinogens (48) the search for natural and safe
antioxidants especially those of plant origin has greatly increased in recent
years
17
242 Type II- Secondary antioxidants or Free-radical production preventer
This category includes compounds that reduce the rate of chain initiation
by metal chelation oxygen scavenging or absorption of UV radiation (47) The
common chelating agents include ethylenediamine tetraacetic acid (EDTA) citric
acid and phosphates EDTA is used for chelation of many metals and it can be an
effective oxidation inhibitor in foods especially those with intermediate to high
moisture content but not in protein-type food such as meats which contain
substantial amounts of bound form of transition metals (46) In addition EDTA
does not protect food during heating because it is less stable at higher
temperatures therefore it is restricted to foods held or processed at cool
temperatures (49) Citric acid is especially useful in oils and intermediate
moisture foods (46) Ascorbic acid is commonly used as a food antioxidant due to
its oxygen scavenging and reducing properties (47) it is especially effective when
it is used in combination with iron chelators (46) Polyphosphates are more
effective chelators and antioxidants than monophosphates However their
antioxidant activity could be reduced or eliminated depending on the
components of the food (50)
Maillard reaction products can bind transition metals such as iron and
deactivate singlet oxygen Because of their dark color and low solubility they are
unsuitable for use in fats and oils but they may be used to improve the oxidative
stability of many foods (51)
Other preventive antioxidants include several enzymes such as catalase
(47) and glutathione peroxidase (37) which reduce the generation of free radicals
by decomposing hydrogen peroxide and hydroperoxides respectively
243 Type III- Control of Environment Factors
This category does not refer to compounds added to inhibit lipid oxidation
Rather this category refers to factors such as the reduction of the oxygen
content a decrease in temperature altering the moisture content (46) and
exclusion of light (47) As the temperature increases oxygen becomes less soluble
in lipids and water slightly influencing the rate The rate of oxidation increases
proportionally to the surface of the lipid exposed to air According to Labuza (46)
18
lipid oxidation can be reduced by altering the water activity which can alter the
catalytic activity of metal catalysts At an elevated water activity (awgt 055) the
rate of oxidation can increase possibly due to the increased mobilization of metal
catalysts
Antioxidant synergism has been observed between primary antioxidants
and between antioxidants with different modes of actions This synergistic effect
can substantially reduce the level of antioxidants needed in a food
25 Keluak As A Natural Source of Antioxidant
251 Keluak ndash Introduction
Pangium edule Reinw (Figure 21) is a tall tropical tree that grows mainly
in Micronesia Melanesia and Southeast Asia including Indonesia The
taxonomy of the tree is uncertain and it may also be classified in the
Flacourtiaceae or the Violale According to Abdullah (55) the tree requires many
years to mature and the seeds are therefore most frequently harvested from wild
trees as it is not economically feasible to cultivate the plant The size of a Pangi
tree is characterized as medium to large with large glossy heart-shaped leaves
that are conspicuously veined and long-stemmed The flowers are large and
greenish and the sexes are separate Flowering occurs from September to October
with seed shed likely to occur in December to January However there are
records of seed shed in April to May and July to September This tropical tree is
wild and not well cultivated (55)
The trees start fruiting when they are approximately 10 to 15 years old The
fruit is oval in shape and the size ranging from 12-30 cm (52) or about a size of a
large husked coconut brown and rough-surfaced (55) The tree produces a large
fruit that is poisonous because of the presence of cyanogenic glucosides (53)
Almost all parts of the plant are poisonous including its leaves barks and seed
(52) Although poisonous to humans the seeds of the tree are part of the natural
diet of the babirusa (Babyroussa babyrussa) (53) a pig-like animal native to the
region However the mature fruit is edible and the juice can be applied to sores
and cuts (55)
19
In Indonesia the seed kernel of this tree is edible after treatments
following the removal of the cyanogenic glucosides Keluak is fermented in a
specific way the seeds are harvested and placed in the field for 10 days The seeds
are then removed washed and boiled for 3 hours to remove the cyanide (54)
After cooling the seeds are buried (indoor) in ash banana leaves and earth for
40 days The seed turn from a creamy white color to dark brown or black (51)
The fermented seeds are cleaned and ready to be used as spices (54) image is
shown in Figure 22 In some countries according to Ma (56) after harvesting the
fruits are buried in the ground for ~100 days before the large seeds are removed
the rest of the plant is poisonous The charcoal-colored nuts are braised for one
hour so the soft flesh can be scooped out of the skin The taste is bitter buttery
and a bit like chocolate while the texture is a familiar one - think mashed
potatoes or roasted chestnuts (56)
Taxonomy of Keluak (55)
Kingdom Plantae
Division Magnoliophyta
Species Pedule
Family Acariaceae
Binomial name Pangium edule Reinw ex Blume
Authority Reinward
Synonym names football fruit kluwek Indonesia black nut kepayang
kluwek keluwek kluwak pangi paying picung penarassan seis
According to Andarwulan et al (54) the fermented seed product of this tree
depending upon the origin is called
Indonesian
o Keluak kluwak kluak kluwek keluwek or kloewak (Dutch spelling)
o Pucung or pucing (Sundanese)
o Rawan or rawon (adjective referring to food prepared with the seed of
this tree) (Figure 23)
Malay
o Kepayang
20
o Payang
Philipines
o Samaun-referring to the oil
o Pangi- referring to the tree
Keluak is commonly used as a spicy flavoring in soups in Java and South
Sulawesi several traditional dishes can be made with Keluak seeds including
ldquoRawonrdquo (Figure 23) and ldquoBlack nut with golden snapperrdquo (Figure 24) Keluak is
also a raw material for another product ldquokecap pangirdquo (ldquokecaprdquo is a soy sauce-like
product) and it has been used as a spice in Saparua Maluku Island in Indonesia
Another of the edible products is called ldquoDagerdquo which is a boiled seed after the
removal of kernels and water after soaking for 2-3 days Dage is utilized in West
java as a vegetable (54) In this document I will use the term ldquoKeluakrdquo and ldquopangi
to refer to the fermented seed that is commonly used as a spice
252 Nutritional Profile of Keluak
The nutrition fact of the Keluak seed is shown in Table 22 Generally
phenolic compounds are found in the seeds and other parts of the plant Most
seeds contain large amounts of polyunsaturated oils and phenolic antioxidants
are necessary to protect the polyunsaturated fatty acids in the oil against
autoxidation (50)
The pangi seed contains some secondary metabolites (Table 23) of the
cyanogen glycosides which include the cyanogen glycoside and various
alkaloids flavonoids steroids saponins tannins and quinine These metabolites
are present in both fresh and dried pangi seed (55)
253 Previous work on keluak
Previous research by Fardiaz and Romlah (57) on the fermented seed
indicated that the methanol extract of keluak possessed antioxidant activity
Fardiaz and Romlah found that the addition of Keluak seed extract to cooking oil
could lengthen the oxidation induction period of the oil Their findings are
summarized in the Table 24 and Figure 25
21
Recently Chye and Sim (52) used several different extraction methods on
Keluak seeds and examined the antioxidant activity of the extract Extracts of
Pangium edule Reinw seed were investigated for their antioxidative activity
using DPPH radical scavenging and β-carotene bleaching assays For the
extraction they used a mixture of acetone acetic acid water which yielded the
higher phenolic content of 2222 plusmn005 mg GAEg among the other methods of
extraction and showed the most potent antioxidative acivity in both DPPH radical
scavenging and β-carotene (Figures 26- 27) They found that significant
correlation was observed between the total phenolic content and its antioxidative
activity (r=0878) suggesting that the phenolics of the Keluak extract could be
potential sources of natural antioxidants (52)
22
26 Figures
Figure 21 Pangium Plant
httpwwwpngplantsorgPNGtreesTreeDescriptionsPangium_edule_Reinwhtml httptravelspotcoolstuffcomgourmet-adventureunusual-food5-lethal-
delicious-meals
Figure 22 Keluak Seed
Source Wayang Brand Kluwak Kupas PT Wira Aksara Jakarta Indonesia
Figure 23 A Dish Made With Keluak Seed- Black Beef Soup (Rawon)
httpwwwlestariwebcomresep-indonesiaEnglishRawonphp
23
Figure 24 A Dish made with Keluak Seed- Black Nut with Golden Snapper
httpdelightfultastebudscom20110501rawon-indonesian-beef-black-soup
Figure 25 The Effect of Kluwak Extract on Oxidation Induction Period of Palm Oil (57)
24
Figure 26 DPPH radical scavenging activity () of Keluak seed extracts at different
concentrations (52)
Phenolic (Ace) = phenolic extracted by acetone Phenolic (EtOAc) = Phenolic extracted by ethyl acetate FPA= Free phenolic acid GBPA= Glycoside-bound
phenolic acid Al= Alkaloid
Figure 27 Antioxidative Activity of Keluak Seed Extracts at 20 mgmL measured by β-
carotene bleaching method (52)
Phenolic (Ace) = phenolic extracted by acetone Phenolic (EtOAc) = Phenolic extracted by ethyl acetate FPA= Free phenolic acid GBPA= Glycoside-bound
phenolic acid Al= Alkaloid
25
27 Tables
Table 21 Fatty Acid Composition of Turkey Meat (50)
Table 22 Nutrition Fact of Keluak Seed
Per 100 grams (or 100 mL)
Energy 2428 kj
Protein 15 g
Fat (Total) 50 g
Carbohydrate (Total) 17 g
Sugar 4 g
Dietary Fiber 10 g
Sodium -
Potassium 680 mg
Calcium 0
Vitamin A 0
Vitamin C 0
Iron 0 Source Wayang Brand Kluwak Kupas PT Wira Aksara Jakarta Indonesia
26
Table 23 Anti- Nutritional Factors of Pangium Seed (55)
Anti- Nutritional Factors Dry wt Basis (microgg)
Arsenic NA
Cyanide 1834
Lead 18
Phytic acid NA
Tannin 046
Alkaloid NA
Table 24 The Antioxidative Activity of Kluwak Expressed as Protective Factor (57)
27
28 References
1 Kanner J Rosenthal I An Assessment of Lipid Oxidation in Foods - Technical Report Pure and Applied Chemistry 1992 64 1959-1964
2 Skibsted LH Understanding oxidation processes in foods Woodhead Publ Food Sci Technol Nutr 2011 199 3-35
3 Yu L Scanlin L Wilson J Schmidt G Rosemary extracts as inhibitors of lipid oxidation and color change in cooked turkey products during refrigerated storage J Food Sci 2002 67 582-585
4 Rhee K Anderson L Sams A Lipid oxidation potential of beef chicken and pork J Food Sci 1996 61 8-12
5 Hernandez P Navarro J Toldra F Lipid composition and lipolytic enzyme activities in porcine skeletal muscles with different oxidative pattern Meat Sci 1998 49 1-10
6 Karakok SG Ozogul Y Saler M Ozogul F Proximate Analysis Fatty Acid Profiles and Mineral Contents of Meats a Comparative Study Journal of Muscle Foods 2010 21 210-223
7 Chan K Decker E Endogenous Skeletal-Muscle Antioxidants Crit Rev Food Sci Nutr 1994 34 403-426
8 Decker E Xu Z Minimizing rancidity in muscle foods Food Technol 1998 52 54-59
9 Rojas MC Brewer MS Effect of natural antioxidants on oxidative stability of cooked refrigerated beef and pork J Food Sci 2007 72 S282-S288
10 Gray J Macdonald B Pearson A Morton I Role of Nitrite in Cured Meat Flavor - a Review J Food Prot 1981 44 302-8
11 Brewer M Vega J Detectable Odor Thresholds of Selected Lipid Oxidation Compounds in a Meat Model System J Food Sci 1995 60 592-595
12 St Angelo A Crippen K Dupuy H James C Chemical and Sensory Studies of Antioxidant-Treated Beef J Food Sci 1990 55 1501-1508
13 Buckley D Gray J Asghar A Price J Crackel R Booren A Pearson A Miller E Effects of Dietary Antioxidants and Oxidized Oil on Membranal Lipid Stability and Pork Product Quality J Food Sci 1989 54 1193-1197
14 Guntensperger B Escher F Oxidative Changes of Heat-Sterilized Meat in Trays J Food Sci 1994 59 689-692
28
15 Bauernfeind JC Antioxidant function of L-ascorbic acid in food technology International journal for vitamin and nutrition researchSupplement = Internationale Zeitschrift fur Vitamin- und ErnahrungsforschungSupplement 1985 27 307-333
16 Georgantelis D Blekas G Katikou P Ambrosiadis I Fletouris DJ Effect of rosemary extract chitosan and alpha-tocopherol on lipid oxidation and colour stability during frozen storage of beef burgers Meat Sci 2007 75 256-264
17 Botsoglou NA Govaris A Giannenas I Botsoglou E Papageorgiou G The incorporation of dehydrated rosemary leaves in the rations of turkeys and their impact on the oxidative stability of the produced raw and cooked meat Int J Food Sci Nutr 2007 58 312-320
18 Karpinska-Tymoszczyk M Effect of the addition of ground rosemary on the quality and shelf-life of turkey meatballs during refrigerated storage Br Poult Sci 2008 49 742-750
19 Drumm T Spanier A Changes in the Content of Lipid Autoxidation and Sulfur-Containing-Compounds in Cooked Beef during Storage J Agric Food Chem 1991 39 336-343
20 Folch J Lees M Stanley GHS A Simple Method For The Isolation And Purification Of Total Lipides From Animal Tissues Journal of Biological Chemistry 1957 226 497-509
21 Grau A Codony R Rafecas M Barroeta A Guardiola F Lipid hydroperoxide determination in dark chicken meat through a ferrous oxidation-xylenol orange method J Agric Food Chem 2000 48 4136-4143
22 Dobarganes M Velasco J Analysis of lipid hydroperoxides European Journal of Lipid Science and Technology 2002 104 420-428
23 Juntachote T Berghofer E Siebenhandl S Bauer F The antioxidative properties of Holy basil and Galangal in cooked ground pork Meat Sci 2006 72 446-456
24 Lee M Choi J Choi Y Han D Kim H Shim S Chung H Kim C The antioxidative properties of mustard leaf (Brassica juncea) kimchi extracts on refrigerated raw ground pork meat against lipid oxidation Meat Sci 2010 84 498-504
25 Botsoglou N and Botsoglou E Oxidation in Foods and Beverages and Antioxidant Applications Vol 2 Management in Different Industry Sectors In Decker EA Elias RJ and McClements D J (eds) Oxidation in Foods and Beverages and Antioxidant Applications Vol 2 Management in Different Industry Sectors 2010 200 1-528
29
26 National Chicken Council Per Capita Consumption of Poultry Livestock 1965 to Estimated 2012 in Pounds 2012 Retrieved in January 23 2012 from httpwwwnationalchickencouncilorgabout-the-industrystatisticsper-capita-consumption-of-poultry-and-livestock-1965-to-estimated-2012-in-pounds
27 Bilgili SF Poultry meat processing and marketing- what does the future hold Poult Internat 2002 12-22
28 Nolan N L Bowers J A and Kropf D H Lipid Oxidation and Sensory Analysis of Cooked Pork and Turkey Stored under Modified Atmospheres Journal of Food Science 1989 54 846ndash849
29 Esteacutevez M Morcuende D and Ventanas S Determination of Oxidation Nollet Leo M LToldraacute Fidel (Eds) Handbook of Muscle Foods Analysis Boca Raton CRC Press 2009 221-240
30 Frankel E N Lipid oxidation Prog Lipid Res 1980 19 1ndash22
31 Frankel E N Volatile Lipid Oxidation Products Progress in lipid research 1983 221 1-33
32 Hsieh R J and J E Kinsella Oxidation of Polyunsaturated Fatty Acids Mechanisms Products and Inhibition with Emphasis on Fish Advances in Food and Nutrition Research 1989 Vol 33
33 McMillin K W Initiation of oxidative processes in muscle foods Annual Proceedings of the Reciprocal Meat Conference Am Meat Sci Assoc Chicago IL 1997 49th 53ndash64
34 Monahan FJ Oxidation of lipids in muscle foods fundamental and applied concerns In EA Decker C Faustman and CJ Lopez-Bote (Eds) Antioxidants in Muscle Foods Nutritional Strategies to Improve Quality New York John Wiley and Sons Inc 2000
35 Robinson M E Haemoglobin and methaemoglobin as oxidative catalysts Biochemical Journal 1924 18 255-264
36 Jadhav SJ Nimbalkar SS Kulkarni AD and MadhaviDL Lipid oxidation in biological and food systems In Marcel Dekker (Eds) Food Antioxidants Technological Toxicological and Health Perspectives New York 1996
37 Niki E Antioxidants and relation to lipid oxidation Chemistry and physics of lipids 1987 44 227-300
38 Gray J I and Monahan FJ Measurement of lipid oxidation in meat and meat products Trends Food Sci Technol 1992 3 315-9
30
39 Chang S S and Peterson R J The Basis of Quality in Muscle Foods Recent Developments In The Flavor of Meat Journal of Food Science 1977 42 298ndash305
40 Lea C H Methods for determining peroxide in lipids J Sci Food Agric 1952 3 586ndash594
41 White P J Conjugated diene anisidine value and carbonyl value analysis In Warner K and Eskin N A M (Eds) Methods to Access Quality and Stability of Oils and Fat-Containing Foods Champaign IL AOCS Publishing 1995 159-177
42 Coxon D Measurement of lipid oxidation Food Science and Technology Today 1987 1164-6
43 Warner K Sensory evaluation of oils and fat-containing foods In K Warner and N A M Eskin (Eds) Methods to Access Quality and Stability of Oils and Fat-Containing Foods AOCS Publishing 1995 49
44 AMSA Research Guidelines for cookery sensory evaluation and instrumental tenderness measurements of fresh meat American Meat Science Association-National Live Stock and Meat Board 1995
45 Association of Official Analytical Chemists Official methods of analysis (16th ed) Washington DC Association of Official Analytical Chemists 1995
46 Labuza T P and Dugan L R Kinetics of lipid oxidation in foods C R C Critical Reviews in Food Technology 1971 2 3
47 Gordon MF The mechanism of antioxidant action in vitro In Hudson BJF (Ed) Food Antioxidants London Elsevier Applied Science 1990 1-18
48 Shahidi F Janitha P Wanasundara P Phenolic Antioxidants Crit Rev Food Sci Nutr 1992 32 67-103
49 Roozen JP Effects of types I II and III antioxidants on phospholipid oxidation in a meat model for warmed over flavour Food Chem 1987 24 167-185
50 Pokornyacute J Natural antioxidants for food use Trends in Food Science and Technology 1991 2 223-227
51 Wong W H Buah Keluak National Parks 11 Jan 2007 Retrieved 02 July 2012 from httpenwikipediaorgwikiPangium_edule
52 Chye FY Sim KY Antioxidative and Antibacterial Activities of Pangium edule Seed Extracts International Journal of Pharmacology 2009 5 285-297
31
53 Andarwulan N Fardiaz D Wattimena GA Shetty K Antioxidant activity associated with lipid and phenolic mobilization during seed germination of Pangium edule Reinw J Agric Food Chem 1999 47 3158-3163
54 Andarwulan N Fardiaz S Apriyantono A Hariyadi P Shetty K Mobilization of primary metabolites and phenolics during natural fermentation in seeds of Pangium edule Reinw Process Biochemistry 1999 35 197-204
55 Abdullah Moh A B Phyochemical Composition of Fresh and Cooked of Chesnut (Castanopsis argentea) Pangium (Pangium edule) and Pra (Elateriospermum tapos) Seeds Final Year Project Food Science and Technology in the Faculty of Applied Sciences Universiti Teknologi Mara Malaysia January 2012 Retrieved on July 4 2012 from httpeprintsptaruitmedumy49401MOHD_ASRUL_BIN_ABDULLAH_12_24pdf
56 Ma A A Peranakan favorite is ayam buah keluak Chicken stewed with black nuts at True Blue RestaurantWall Street Journal (Online) New York NY Dec 16 2010 Retrieved July 4 2012 from httpproquestumicompqdwebdid=2214039511ampsid=1ampFmt=3ampclientId=36305ampRQT=309ampVName=PQD
57 Fardiaz D Romlah S Antioxidant activity of picung (Pangium edule Reinw) seed In Development of Food Science and Technology in ASEAN Proceedings of the Fourth ASEAN Food Conference February 17ndash21 1992 ASEAN Jakarta Indonesia 1992 814ndash819
58 Food and Drugs Administration Food Additives Permitted for Direct Addition to Food for Human Consumption Code of Federal Regulations Title 21 pt 172190 2006
59 Kerler J Grosch W Character impact odorants of boiled chicken changes during refrigerated storage and reheating Zeitschrift Fur Lebensmittel-Untersuchung Und-Forschung A-Food Research and Technology 1997 205 232-238
60 Baggio S Vicente E Bragagnolo N Cholesterol oxides cholesterol total lipid and fatty acid composition in turkey meat J Agric Food Chem 2002 50 5981-5986
32
CHAPTER 3 MATERIALS AND METHODS
31 Keluak Antioxidant and Chemicals
Keluak (Kupas Wayang Brandreg Peeled Keluak Nuts PT Wira Aksara
Jakarta Indonesia was manufactured for Empire International East Chief
Privado Ontario CA 91761) Butylated hydroxytoluene (BHT) gallic acid (ACS
reagent) and 2-thiobarbituric acid were obtained from Sigma Chemical
Company St Louis MO USA Sodium chloride (crystal ARreg ACS) was obtained
from Mallinckrodt Baker Inc (Phillipsburg NJ USA)
The reagents used included acetone (Certified ACS) and chloroform (certified
ACS) obtained from Fisher Scientific Fair Lawn NJ USA Acetic acid (Glacial
ACS reagent) was purchased from J T Baker (Center Valley PA 18034 USA)
and Folin Ciocalteursquos phenol reagent (2 N) was purchased from Sigma-Aldrich
(St Louis MO USA)
311 Phenolic Extraction
Keluak seeds were ground into fine pieces using a coffee grinder (Braun
Inc Lynnfield MA USA) The fatty material from the ground seed was removed
first using a method modified from Wettasinghe and Shahidi (1) The ground seed
was washed with n-hexane (16 gg) and placed in a sonicator for 15 minutes
with occasional stirring The mixture was vortexed for 30 secs before it was
centrifuged at 2688 x g for 10 minutes (Sorvallreg Instrument RC-5B Du Pont
Company Wilmington DE USA) The upper fat-soluble layer was discarded
The solid was washed 2 ndash 3 additional times The solids remained at the bottom
after washing The defatted solids were then air-dried overnight under the hood
to remove any solvent residue
Forty grams of dried defatted Keluak seeds were extracted by stirring with
200 mL of solvent (acetone water acetic acid 90 95 05 vvv) at 60degC and
600 rpm for 2 hrs The mixture was then filtered through filter paper (Whatman
1 Buckinghamshire UK) The filtrate was collected and dried at 45degC using a
rotary evaporator until no further weight changes occurred The concentrated
extract was further dried using a vacuum oven at 45degC overnight The extract was
33
collected dissolved in 100 ethanol flushed with Argon gas and stored at -20degC
until further use
312 Total Phenolics content
The total phenolic content was measured using the Folin-Ciocalteu assay
as modified by Waterhouse (13) The phenolic extract was diluted with 100
ethanol to make several dilutions (1100 2100 and 10100) One milliliter of each
dilution was added to a test tube containing 5 mL of deionized water Then 05
mL of 50 Folin-Ciocalteu reagent was added to the test tube The solution was
mixed and allowed to stand for 8 mins at 22degC before adding 1 mL of 5 sodium
carbonate (wv) The mixture was vortexed using a touch mixer (model 231
Fisher Scientific Pittsburgh PA USA) and incubated in the dark for 1 hr The
solution was vortexed a second time before reading the absorption with a UV-
spectrophotometer (Spectronic Genesys 5 spectrophotometer Thermo Electron
Corporation Madison WI USA) at 725 nm against DI water A standard curve
was prepared at the same time with gallic acid at concentrations ranging from 0
to 100 mgL The quantity of total phenolic content in the sample was calculated
as gallic acid equivalents (GAE) from the standard curve using the formula
C = c times (V divide m) where
C is total phenolic content (mg GAEg extract)
c is the concentration of gallic acid obtained from the calibration curve (mgmL)
V is volume of sample (mL)
m is mass of the sample extract (g)
32 Sample Preparation
Ground turkey meat (15 fat Jennie-O Turkey Store Wilmar MN USA)
purchased from a local grocery store at day 0 and was immediately divided into 4
treatments according to the formulation (Table 31) (2 3)
(1) Control- No antioxidant
(2) Commercial antioxidant- 002 BHT (ww of lipid)
(3) Natural antioxidant- 002 Keluak extract (ww of lipid)
34
(4) Natural antioxidant ndash 004 Keluak extract (ww of lipid)
The level of Keluak extract antioxidant used was based on the amount of
fat in each formula Salt was dissolved in water prior to addition to the meat The
water addition was 5 of the ground meat (ww) The antioxidant and salt were
mixed in the liquid first before adding it to the meat by sprinkling while mixing
After the antioxidant salt and liquid addition mixing by hand (wearing gloves)
was continued for 5 mins The meat mixture was prepared into patties of uniform
size (using a cookie cutter diameter= 55 cm thickness= 15 cm) The patties
were cooked in an electrical skillet and temperature was monitored by Digi-
Sensereg Scanning Thermometer (Model 92000-00 Cole Parmer Instrument Co
Barrington IL) using copper-constantin thermocouple wires (Type T Omega
Engineering Inc Stamford CT) to an endpoint temperature of 74degC The cooked
patties were cooled and placed in a single layer on a tray and then overwrapped
in commercial PVC (water vapor transmission rate=15 g100 m224 h oxygen
transmission rate 880 cm3m224 h) and aluminum foil over the wrap The
patties were stored at 2degC in the dark and were assayed for the extent of oxidation
by odor sensory TBARS conjugated dienes and peroxide value analysis at days
0 1 3 5 7 for the first study (2)
In a second separate study a longer storage time study was completed to
examine the effect of antioxidants on the cooked ground turkey over a longer
time period The same procedure for antioxidant addition and meat sample
preparation was used However in the second study the samples were stored for
a total of 15 days (5 6) Samples were collected at days 0 1 3 5 7 10 13 15 for
TBARS conjugated dienes peroxide values and pH determinations
33 Thiobarbituric Acid Reactive Substances (TBARS)
Lipid oxidation was assessed by the 2-thiobarbituric acid (TBA) method of
Tarladgis and others (4) and Yu et al (5) Briefly 10 g of meat was homogenized
with 50 mL of deionized water using a homogenizer (IKAreg T25 digital Ultra-
Turrax Wilmington NC USA) The homogenate was filtered through 1
Whatman paper Five mL of the clear filtrate was mixed with 5 mL TBA reagent
35
containing 002 M TBA in 90 glacial acetic acid The mixture was capped
vortexed for 30 secs and incubated in the dark for 15-18 hrs at room temperature
After the color developed the mixture was measured for absorbance at 532 nm
against a blank (deionized water) The absorbance was converted to TBAR values
using 1133- tetraethoxypropane to prepare a standard curve Triplicates of 10 g
samples were prepared for each treatment TBA value is expressed as mg MDA
kg meat
34 Conjugated Dienes
Conjugated dienes (CD) were determined by the method described by
Juntachote and others (6) with slight modifications A cooked meat sample (05
g) was suspended in 5 mL of deionized water and homogenized using a digital
Ultra-Turrax T25 (IKAreg Wilmington NC USA) to obtain a smooth slurry A 05
mL aliquot of this suspension was mixed with 5 mL of extracting solution
containing hexane and isopropanol (31 vv) and mixed for 1 min using a vortex
mixer After centrifugation at 2000 g for 5 mins the supernatant was collected
and the absorbance of the supernatant was determined at 233 nm The
concentration of conjugated dienes was calculated using a molar extinction
coefficient of 25200 M-1cm-1 and the result were expressed as nmole of
conjugated dienes per mg meat sample
35 Peroxide Value
The peroxide value was determined according to the AOAC method 96533
(Association of Official Analytical Chemists) (13) with a few modifications The
lipids from meat samples were extracted by the method of Kim et al (7) First 5 g
of meat sample was broken into small pieces and placed in a water bath at 60˚C
to melt the fat for 30 mins The meat was extracted with a solution containing
acetic acid chloroform (32) and then filtered with Whatman 1 filter paper A
saturated solution of potassium iodide (KI 05 mL) was added to the filtrate The
solution color changed to yellow and then 30 mL of deionized water was added
The mixture was allowed to let stand at room temperature for at least 5 mins and
the color would turn to pale to bright yellow Before titrating with 001 N of
36
sodium thiosulfate (Na2SO3) 05 mL of 1 starch solution was added (a color
changed occurred - the color turned purple to blue-black) The PV is expressed as
meq O2kg lipid
36 pH value
To determine the pH of the meat samples cooked meat samples (10 g)
were blended with 50 mL deionized water for 15 seconds in a homogenizer
(Ultra-Turrax T25 IKAreg Wilmington NC USA) The pH was measured with a
pH meter (Accumet Basic model AB 15 Fisher Scientific Company) The pH
meter was calibrated daily with standard buffers of pH 40 and 70 at 25˚C
37 Sensory Evaluation
Trained panelists (n=15) were recruited from among University of Illinois
graduate students and staff The panelists were prepared using an extensive
training program During each training session panel members practiced and
discussed the techniques developed for sample presentation score sheet terms
and odor sensory evaluation method A panel leader led the panelists to develop
terms to describe the aroma characteristics of fresh cooked turkey meat including
the aroma characteristics of cooked poultry with or without the added Keluak
extract Panel members were trained regularly for 7 sessions for total of two
weeks to identify and discriminate aroma differences Some of the terms were
derived from reference standards including fresh boiled ground turkey meat
lard oxidized vegetable oil hard-boiled egg and wet cardboard (Table 32) The
panelists agreed on the following aroma descriptors for warm-over-flavor meaty
fatty rancid eggy and cardboardy These descriptors were judged for the
presence and overall intensity using a 15 cm-structured line scale (0 = none 15 =
extreme) along with an anchor value for each respective standard Table 2
showed the form used to evaluate the aroma descriptors described above
Cooked patties were uniformly cut into four pie-shaped wedges and placed
in a sniff bottle (Nalgene Teflon PTFE wash bottle Nalge Company Rochester
NY USA) covered with foil to hide the identity of the sample inside Each sample
represented a treatment labeled with three-digit random numbers and were
37
served at random order during each test session The samples were held in an
incubator (45degCplusmn 1degC) for 30 mins prior to presentation to the panelists The
panelists were asked to clean their palate by chewing a piece of unsalted saltine
crackers and rinse with water prior to evaluating the samples Samples were
sniffed Four samples were evaluated for each test session Roasted coffee beans
were presented for panelists to clear the palate between samples Standard
references were prepared daily The second session replicates of the first session
was conducted one week after the first session
38 Statistical Analysis
Statistical assessment was carried out with the program SAS Data were
analyzed as 4 (treatments) by 5 (days of storage) The results from the TBARs
analysis peroxide value analysis conjugated dienes analysis and the
odorsensory analysis were analyzed using one-way analysis of variance
(ANOVA) Differences were considered significant at the P lt 005 level
Comparison of treatment means was based on Fisherrsquos Least Significant
Difference (LSD)
38
39 Tables
Table 31 Formulation of Cooked Ground Turkey Meat for Each Treatment
TREATMENTS
Control BHT AO 200ppm AO 400ppm
INGREDIENTS
Jenny-O 15 fat Ground Turkey
(g) 650 650 650 650
Salt (2 ww) (g) 13 13 13 13
BHT (002 of total fat) (g) 002
Keluak extract (mL)
2487 (002 g
phenolics)
4974 (004 g
phenolics)
Cold water (mL)5 by sample wt
(ww) 325 325 325 325
Table 32 Descriptive Odor Standards for Refrigerated Ground Turkey Meat
Descriptive Odor term Standard Location on the 15-cm line
Rancid Oxidized vegetable oil in water (1100 vv) 7
Cardboard 1 cm2 cardboard in 15 mL water 85
Eggy Fresh hard-boiled egg white (01 g) 9
Meaty Fresh boiled ground turkey meat in water (15 gv) 8
Fatty Lard (02 g) 9
39
310 References
1 Wettasinghe M Shahidi F Antioxidant and free radical-scavenging properties of ethanolic extracts of defatted borage (Borago officinalis L) seeds Food Chem 1999 67 399-414
2 Vara-Ubol S Bowers J Effect of alpha-tocopherol beta-carotene and sodium tripolyphosphate on lipid oxidation of refrigerated cooked ground turkey and ground pork J Food Sci 2001 66 662-667
3 Hassan O Fan L The anti-oxidation potential of polyphenol extract from cocoa leaves on mechanically deboned chicken meat (MDCM) Lwt-Food Science and Technology 2005 38 315-321
4 Tarladgis B Dugan L Pearson A Chemistry of 2-Thiobarbituric Acid Test for Determination of Oxidative Rancidity in Foods 2 Formation of Tba-Malonaldehyde Complex without Acid-Heat Treatment J Sci Food Agric 1964 15 602-amp
5 Yu L Scanlin L Wilson J Schmidt G Rosemary extracts as inhibitors of lipid oxidation and color change in cooked turkey products during refrigerated storage J Food Sci 2002 67 582-585
6 Juntachote T Berghofer E Siebenhandl S Bauer F The antioxidative properties of Holy basil and Galangal in cooked ground pork Meat Sci 2006 72 446-456
7 Kim YJ Jin SK Park WY Kim BW Joo ST Yang HS The Effect of Garlic Or Onion Marinade on the Lipid Oxidation and Meat Quality of Pork during Cold Storage J Food Qual 2010 33 171-185
8 Chye FY Sim KY Antioxidative and Antibacterial Activities of Pangium edule Seed Extracts International Journal of Pharmacology 2009 5 285-297
9 Kahkonen M Hopia A Vuorela H Rauha J Pihlaja K Kujala T Heinonen M Antioxidant activity of plant extracts containing phenolic compounds J Agric Food Chem 1999 47 3954-3962
10 Jayaprakasha G Selvi T Sakariah K Antibacterial and antioxidant activities of grape (Vitis vinifera) seed extracts Food Res Int 2003 36 117-122
11 Fardiaz D Romlah S Antioxidant Activity of Picung (Pangium edule Reinw) Seed In Development of Food Science and Technology in ASEAN Proceedings of the 4th ASEAN Food Conference Feb 17-21 1992 ASEAN Jakarta Indonesia 1992 12 Waterhouse A L Determination of Total Phenolics Current Protocols in
Food Analytical Chemistry 2002 I111-I118
40
13 Association of Official Analytical Chemists (1995) Official methods of analysis (16th ed) Washington DC Association of Official Analytical Chemists
41
Chapter 4 RESULTS AND DISCUSSION
41 Phenolic Extraction Yield
The phenolic extract yield using acetone water acetic acid (90 95 05)
extraction was 503 plusmn 140 g of extract per 70 g of defatted ground Keluak seed or
007 g phenolic extract per gram of defatted Keluak The samples contained
approximately 719 phenolic compounds by weight the values are equal to the
average plusmn standard deviation of the three replicate analyses This value was
moderately greater than that reported by Chye and Sim (1) which reported a
548 yield The total phenolic content as determined using Folin-Ciocalteau
reagent was 1973 plusmn 203 mg GAEg extract which was also moderately greater
than the result reported by Chye and Sim which was 1639plusmn 004 mg GAEg
extract (1) It is possible that the difference is due to the Keluak source Chye and
Sim obtained their seeds material from local indigenous markets in Kota
Kinabalu Sabah Malaysia (1) while the seeds used in this study were grown in
from Indonesia The geographical and horticultural differences could affect the
phenolic content and concentration of the seed
According to Kahkonen et al (2) different phenolic compounds can have
different responses in the Folin Ciocalteau method depending on their chemical
structure Therefore the antioxidant activity of an extract cannot be predicted
solely on its total phenolic content (3 4)
42 Effect of Keluak Extract and storage time on TBARS values during
refrigerated storage of cooked ground turkey
The TBARS values represent the content of secondary lipid oxidation
products particularly malonaldehyde The carbonyls are primarily responsible
for the production of off-flavors in oxidized meat and meat products Aldehydes
are formed by the oxidation of unsaturated fatty acids They react with the TBA
reagent to form a pink complex (TBA chromogen) with a maximum absorbance
at 532 nm The intensity of this pink color is directly related to the concentration
of the TBA-reactive substances in the original sample The results of the TBARs
analysis for the preliminary study (7 days) and the extended storage study (15
days) are shown in Tables 41a b and Figures 41a b respectively Overall lipid
42
oxidation increased substantially as the refrigerated storage progressed due to
the effects of heating and in combination with storage under aerobic conditions
On the first day of analysis for both the 7 and 15 days storage study all the
antioxidant treated samples (BHT and both concentrations of the Keluak
extracts) the TBARS values were significantly lower than the control an
indication that the antioxidants had a positive effect in suppressing oxidation
Similar findings were observed by Juntachote et al and Teets et al (5 6) TBARS
values for both 7 and 15 days storage study ranges from 035- 475 mg MDA kg
meat which was comparable to other study by Juntachote (5) for 14 days of
storage study of pork meat There were examining the effect other natural
sources of antioxidants on oxidation during refrigerated storage of cooked meat
During the preliminary study (Table 41a) the control and BHT treatments
did not show significant differences (Pgt005) from day 1-7 However both of the
Keluak extract treatments showed a significant (Plt005) effect on the
suppression of the progression of lipid oxidation as compared to the control
(Figure 41a)
On the other hand during the 15 day study all the samples with added
antioxidants had significantly lower TBAR values compared to the control
throughout the entire storage period This indicates that both the commercial
treatment and the treatment with Keluak extracts provided substantial protection
to the meat with respect to lipid oxidation The efficacy of the Keluak extracts to
inhibit lipid oxidation is probably related to their phenolic content The results of
this study showed agreement with those obtained by Fardiaz and Romlah (14)
which stated that the addition of Keluak extract to palm oil lengthened the
oxidation induction period from 22 hours to 50 hours
Lipid oxidation was considerably greater with longer storage times due to
the exposure to oxygen TBARs measure the formation of secondary lipid
oxidation products which contribute to WOF in oxidized meat Heat increases the
release of non-heme iron from the heme pigments a major catalyst for lipid
oxidation in cooked meats (7) Cooking also alters cellular compartmentalization
and exposes membrane phospholipids to molecular oxygen and metal ions (8)
43
resulting in greater amounts of lipid oxidation (9) The addition of antioxidants
during processing cooking or packaging can be done to increase the oxidative
stability of cooked meat (10)
43 Effect of Keluak Extract and Storage Time on Conjugated Diene
Content during Refrigerated Storage of Cooked Ground Turkey
Meat
The development of conjugated dienes (CD) is related to the formation of
hydroperoxides found in the extracted lipids of the cooked ground turkey
Unsaturated fatty acid double bonds occur naturally in a methylene interrupted
structure As meat begins to oxidize the double bonds of these fatty acids are
altered creating conjugated systems which can be measured
spectrophotometrically (6) During lipid peroxidation non-conjugated double
bonds (C=CndashCndashC=C) which are present naturally in unsaturated lipids are
converted to conjugated double bonds (C=CndashC=C) with a large increased in
absorption at 232ndash234 nm (11) In the preliminary study there were no significant differences among the
antioxidant treated sample and the control (Pgt005) except on day 5 (Figure 42a
and Table 42a) The CD value for all the treatments peaked at day 5 and the
samples treated with antioxidants were significantly different that the control
(Plt005)
Meanwhile during the second storage study (Table 42b and Figure 42b)
when the CD values were compared to the control on day 0 and day 1 the 002
BHT and both of the Keluak extract treated samples were not significantly
different (Pgt005) However from day 3 on all the antioxidant-treated samples
had less CD formation than the control (Plt005) The CD content of the control
generally increased especially during the last 5 days (Day 10 13 and 15) of the
study Additionally cooked ground turkey treated with Keluak at 400 ppm had
slightly lower concentrations of conjugated dienes compared to cooked ground
turkey containing Keluak extract at 200 ppm and the commercial antioxidant
(BHT) The trend of CD formation was similar to several other studies (5 6 12
13) They generally observed that the CD concentration for most samples peaked
44
on Day 3 and decreased thereafter This phenomenon of decreased CD is likely
due to the decomposition of the conjugated diene hydroperoxides into secondary
oxidation products over time Conjugated dienes hydroperoxides are expected to
decompose into secondary products as was observed in this study According to
Frankel (15) the formation of conjugated dienes which is related to the
production of hydroperoxides occurs in the early stages of lipid oxidation According to Estevez et al (17) measurement of conjugated dienes (CD) in
meat products containing elevated levels of PUFA is limited depending on the
fatty acid composition of the sample as well as the presence of other non-
hydroperoxides CDs In agreement with Grau et al (18) the TBA test showed a
higher sensitivity with respect to lipid oxidation than did the CD determination
44 Effect of Keluak extract and storage time on peroxide value during
refrigerated storage of cooked ground turkey
Peroxide values (PV) were also used to assess the level of lipid oxidation in
cooked ground turkey during storage at 2˚C (Table 43 and Figure 43) However
while there were differences between the control and samples treated with AOs
on a few days the result of this study showed that treatments had no significant
effect (Pgt005) on the peroxide values compared to the control Generally based
on the results in Table 4 and Figure 4 the PVs increased during storage and
peaked on day 10 At the time it is possible that much of the polyunsaturated
membrane lipids may have been oxidized at that point so that further storage
and oxidation resulted in a decrease in the concentration of peroxides and thus
the PV
The PV differences among the samples did not provide proof that any of
the AOs were effective It is not clear why the PV analysis did not provide any
evidence of AO efficacy According to Estevez (17) the sensitivity of this method
is about 05 miliEquivalentkg of lipid Lower peroxide values cannot be
measured satisfactorily by the AOCS method because of the uncertainty with the
iodometric titration endpoint unless the iodine-starch end is determined
potentiometrically at levels as low as 006 Eqkg lipid The iodometric method is
highly empirical and very small procedural differences can cause variation in the
45
results (19) Two major sources of error in this test could be the liberation of
iodine by air oxidation of the KI and absorption of iodine by fatty acid double
bonds (17)
4 5 Effect of Keluak Extract and storage time on Odor of Refrigerated
Cooked Ground Turkey
No significant interaction (Pgt 005) occurred between antioxidant and
storage time for most of the odor characteristics (Tables and Figures 44-48)
For meaty odor characteristic (Figure and Table 44) the score of all the
treatments over the 7 days of storage did not show significant differences
(Pgt005) The scores ranged from 502 ndash 783 which was slightly below the
freshly boiled turkey meat standard for meaty (which was ranked 8 in the 15-cm
line scale) Therefore the panelists were unable to score and detect the cooked
meat aroma differences in the treated samples relative to the standard reference
The meaty aroma in this study was used to determine if there were possible
masking effects from the AO treatments
For the rancid odor (Figure and Table 45) both of the Keluak treated
samples were perceived as more rancid than both control and BHT after day 1
Overall both of the Keluak treated samples were ranked higher than the control
and BHT which disagrees with the results of TBA test However there was no
significant difference among the treatments between day 3-7 According to Ruth
(20) rancidity as a measure of lipid oxidation is usually best measured by the
concentration of TBARS
The minimum TBA values that corresponds to dark chicken meat samples
that were significantly different in rancid aroma was 1933 μg MDAkg of meat
(21) For consumer acceptability the TBA values must be less than 785 μg of
MDAkg (21) The results from Bou et al (21) were comparable to the results
reported by Gray and Pearson (22) showing that rancid flavor in meats is initially
detected between 500 and 2000 μg of MDAkg of meat In addition OrsquoNeill et
al (23) found that the threshold for WOF detection in cooked dark chicken meat
was at TBA values ge800 μg of MDAkg of meat Since chicken and turkey meat
46
have a comparable PUFA content those values were considered useful in this
experiment On the other hand the odor score for Eggy cardboard and fatty were
statistically not different (Pgt 005) Panelists were unable to detect differences
which could be to different reasons such as that Keluak extract has an aroma
masking effect that confuses the panelists with the ldquooff-odorrdquo The Keluak did
have a slight aroma and it is likely that it masked the effects of storage on lipid
oxidation The aroma of Keluak has been described as bitter dirt-like and
chocolate-like odor (16) This aroma masking could be perceived as undesirable
by the panelists and it might have been mistaken as an off-odor or as an oxidized
sample even though the TBARs and CD data showed otherwise
4 6 Effect of Keluak Extract and storage time on pH of Refrigerated
Cooked Ground Turkey
Table 49 shows the effect of antioxidant treatments in pork muscle on pH
values during storage at 2˚C The values of the pH ranged between 633-668
Generally there are no correlations of pH value among the treatments during
storage The trend for the pH value is inconclusive
47
47 Figures Figure 41a The profile of TBARS in cooked ground turkey treated with various
antioxidants during storage at 2˚C- A Preliminary Study
K200 and K400 represent treatments with Keluak extract at concentration of 200 and 400 ppm respectively
0000
1000
2000
3000
4000
5000
6000
0 2 4 6 8
TBA
RS
(mg
MD
Ak
g m
eat
)
Storage Days
Control
BHT
K200
K400
48
Figure 41b The profile of TBARS in Cooked Ground Turkey Treated with Various Antioxidants During Storage at 2˚C- Extended Storage Time
K200 and K400 represent Keluak extract at concentration of 200 and 400 ppm respectively
Figure 42a Conjugated dienes values of different antioxidant treatments over storage at
2˚C - A Preliminary Study
K200 and K400 represent treatments with Keluak extract at concentration of 200 and 400 ppm
respectively
000
100
200
300
400
500
600
0 5 10 15 20
TBA
RS
(mg
MD
Ak
g m
eat
)
Storage time (days)
Control
BHT 002
K200
K400
0000
0050
0100
0150
0200
0250
0300
0350
0400
0450
0 1 2 3 4 5 6 7 8
Co
nju
gate
d D
ien
es
(nm
ol
mg
me
at)
Days
Control
BHT
K200
K400
49
Figure 42b Conjugated dienes values of different antioxidant treatments over storage at
2˚C- Extended Storage Time
K200 and K400 represent treatments with Keluak extract at concentration of 200 and 400 ppm respectively
Figure 43 Peroxide Value (meq kg meat) of Different Antioxidant treatments over
Storage at 2˚C
K200 and K400 represent treatments with Keluak extract at concentration of 200 and 400 ppm
respectively
000
002
004
006
008
010
012
014
016
0 5 10 15 20
Co
nju
gate
d D
ien
es
(nm
ol
mg
me
at)
Storage (days)
Control
BHT 002
K200
K400
0
05
1
15
2
25
3
35
4
0 2 4 6 8 10 12 14 16
PV
(m
eq
kg
me
at)
Storage Time (Days)
Control
BHT 002
K200
K400
50
Figure 44 Intensity of Meaty Odor Descriptor in Cooked Ground Turkey Meat Treated
with Different Antioxidants Rated in a 15-cm Line Scale
K200 and K400 represent Treatment with Keluak extract at concentration of 200 and 400 ppm
respectively
Figure 45 Intensity of Rancid Odor Descriptor in Cooked Ground Turkey Meat Treated
with Different Antioxidants Rated in a 15-cm Line Scale
K200 and K400 represent Treatment with Keluak extract at concentrations of 200 and 400 ppm
respectively
000
200
400
600
800
1000
1200
0 2 4 6 8
15
cm
Lin
e s
cale
(av
era
ge)
Days
CONTROL
BHT
K200
K400
Linear (BHT)
-100
000
100
200
300
400
500
600
700
800
0 2 4 6 8
15
cm
Lin
e s
cale
(av
era
ge)
Days
Control
BHT
K200
K400
51
Figure 46 Intensity of Eggy Odor Descriptor in Cooked Ground Turkey Meat Treated
with Different Antioxidants Rated in a 15-cm Line Scale
K200 and K400 represent Treatment with Keluak extract at concentrations of 200 and 400 ppm
respectively
Figure 47 Intensity of Cardboard Odor Descriptor in Cooked Ground Turkey Meat
Treated with Different Antioxidants Rated in a 15-cm Line Scale
K200 and K400 represent Treatment with Keluak extract at concentrations of 200 and 400 ppm
respectively
000
100
200
300
400
500
600
700
800
900
1000
0 2 4 6 8
15
cm
Lin
e s
cale
(av
era
ge)
Days
Control
BHT
K200
K400
-1
0
1
2
3
4
5
6
7
0 2 4 6 8
15
cm
Lin
e s
cale
(av
era
ge)
Days
Control
BHT
K200
K400
52
Figure 48 Intensity of Fatty Odor Descriptor in Cooked Ground Turkey Meat Treated
with Different Antioxidants Rated in a 15-cm Line Scale
K200 and K400 represent Treatment with Keluak extract at concentrations of 200 and 400 ppm
respectively
000
100
200
300
400
500
600
700
800
900
0 2 4 6 8
15
cm
Lin
e s
cale
(av
era
ge)
Days
Control
BHT
K200
K400
53
48 Tables
Table 41a TBARS Value of Cooked Ground Turkey Meat Treated with Various Antioxidants during Storage at 2˚C- A Preliminary Study
TBARS (mg MDAkg meat) Average
Storage (Day) Control BHT 002 Keluak 200ppm Keluak 400ppm
0
131plusmn009Aa 094plusmn021Ba 050plusmn004Ca 037plusmn010Ca
1
189plusmn003Aab 161plusmn025Aab 080plusmn006Ba 057plusmn026Bab
3
243plusmn010Ac 236plusmn025Abc 111plusmn022Bab 055plusmn008Cab
5
397plusmn016Ad 319plusmn064Acd 170plusmn025Bbc 108plusmn023Bb
7
473plusmn076Ad 373plusmn074ABd 217plusmn040ACc 101plusmn044Cab
Different letters (A-D) within a row indicates that mean values are significantly different (Plt 005) Different letters within a column (a-d) within the same treatment are significantly different (Plt005)
Table 41b TBARS Value of Cooked Ground Turkey Meat Treated with Various Antioxidants during Storage at 2 ˚C- Extended Storage Time
TBARS (mg MDAkg meat) Average
Storage (day) Control BHT 002 K200 K400
0 129 plusmn 008Ae 091plusmn 004Bcd 065plusmn 015Be 101plusmn 003Cf
1 159plusmn 008Ade 076plusmn 005Cd 083plusmn 012Ce 127plusmn 006Bf
3 220plusmn 011Acd 074plusmn 004Dd 119plusmn 003Cd 160plusmn 004Be
5 258plusmn 014Ac 082plusmn 006Cd 076plusmn 014Ce 150plusmn 004Bd
7 377plusmn 001Ab 109plusmn 002Ccb 158plusmn 006Bc 160plusmn 006Bd
10 405plusmn 061Aab 121plusmn 009Bb 197plusmn 012Bb 195plusmn 009Bc
13 465plusmn 014Aa 151plusmn 004Ca 224plusmn 003Bab 218plusmn 003Bb
15 459plusmn 024Aa 154plusmn 013Da 231plusmn 014Ca 284plusmn 010Ba
Different letters (A-D) within a row indicates that mean values are significantly different (Plt 005) Different letters within a column (a-f) within the same treatment are significantly different (Plt005)
K200 and K400 represent treatments with Keluak extract at concentration of 200 and 400 ppm
respectively
54
Table 42a Conjugated Dienes Concentrations with Antioxidant Treatments and Storage
At 2˚C- A Preliminary Study
Conj Dienes (nmolemg meat)
Storage (Days) Control BHT 002 K200 K400
0 015plusmn003Abc 022plusmn001Aa 013plusmn001Ab 020plusmn008Aa
1 012plusmn001Abc 012plusmn003Ab 011plusmn001Ab 019plusmn001Bab
3 006plusmn000Ac 003plusmn002Ac 002plusmn002Ab 004plusmn002Ab
5 038plusmn000Aa 024plusmn001Ba 027plusmn007ABa 021plusmn001Ba
7 023plusmn008Ab 026plusmn001Aa 029plusmn003Aa 016plusmn001Aab
Different letters (A-C) within a row indicates that mean values are significantly different (Plt 005) Different letters within a column (a-d) within the same treatment are significantly different (Plt005)
K200 and K400 represent treatments with Keluak extract at concentration of 200 and 400 ppm
respectively
Table 42b Conjugated Dienes Concentrations After Antioxidant Treatments and
Storage At 2˚C- Extended Storage Time
Conjugated Dienes (nM mg meat)
Storage (Days) Control BHT 002 K200 K400
0 013plusmn 001Aab 009plusmn000Bab 010plusmn 000Ba 010plusmn 001Ba
1 008plusmn 001Ac 008plusmn 001Ab 008plusmn 000Abc 007plusmn 001Ab
3 011plusmn 000Ab 009plusmn 001Bab 008plusmn 000Bbc 006plusmn 000Cb
5 012plusmn001Ab 008plusmn 001B b 006plusmn 000Bd 006plusmn 000Bb
7 011plusmn001Abc 008plusmn 000B ab 006plusmn 001Bcd 007plusmn 000Bb
10 014plusmn 000Aa 009plusmn 000Bab 009plusmn 001Bab 007plusmn 000Cb
13 014plusmn 001Aa 009plusmn 000Bab 008plusmn 000Bbc 006plusmn 000Cb
15 014plusmn 000Aa 010plusmn 001Ba 008plusmn 001BCbcd 007plusmn 000Cb
Different letters (A-C) within a row indicates that mean values are significantly different (Plt 005) Different letters within a column (a-d) within the same treatment are significantly different (Plt005)
K200 and K400 represent treatments with Keluak extract at concentration of 200 and 400 ppm
respectively
55
Table 43 Peroxide Value (meq kg meat) of Different Antioxidant treatments during
Storage of cooked ground turkey meat at 2˚C
PV (meq kg meat)
Storage (Days) Control BHT 002 K200 K400
0 110plusmn 042Abc 070plusmn 014Ae 080plusmn 028Ad 130plusmn 014Acd
1 230plusmn 014Aab 130plusmn 014Bd 090plusmn 014BCd 070plusmn 014Cd
3 080plusmn 000Ac 070plusmn 014Ae 070plusmn 014Ad 070plusmn 014Ad
5 280plusmn 028Aa 140plusmn 000Bcd 110plusmn 014Bcd 080plusmn 028Bd
7 170plusmn 042Aabc 190plusmn 014Ac 195plusmn 021Abc 225plusmn 049Abc
10 310plusmn 042Aa 330plusmn 014Aa 290plusmn 042Aa 340plusmn 028Aa
13 255plusmn 007Aa 265plusmn 021Ab 240plusmn 028Aab 260plusmn 028Aab
15 255plusmn 064Aa 150plusmn 014ABcd 086plusmn 006Bd 100plusmn 028Bd
Different letters (A-C) within a row indicates that mean values are significantly different (Plt 005) Different letters within a column (a-e) within the same treatment are significantly different (Plt005)
K200 and K400 represent Treatment with Keluak extract at concentrations of 200 and 400 ppm
respectively
Table 44 Intensity of Meaty Odor Descriptor in Cooked Ground Turkey Meat Treated with Different Antioxidants Rated in a 15-cm Line Scale
Storage (Day) Control BHT 002 K200 K400
0 595plusmn250Aa 727plusmn144Aa 632plusmn202Aa 606plusmn189Aa
1 783plusmn208Aa 731plusmn174ABa 543plusmn220Ba 542plusmn294Ba
3 613plusmn201Aa 693plusmn143Aa 502plusmn266Aa 552plusmn228Aa
5 734plusmn277Aa 710plusmn290Aa 474plusmn253Aa 487plusmn263Aa
7 694plusmn296Aa 751plusmn265Aa 532plusmn259Aa 543plusmn236Aa
Different letters (A-C) within a row indicates that mean values are significantly different (Plt 005) Different letters within a column (a-b) within the same treatment are significantly different (Plt005)
K200 and K400 represent Treatment with Keluak extract at concentrations of 200 and 400 ppm
respectively
56
Table 45 Intensity of Rancid Odor Descriptor in Cooked Ground Turkey Meat Treated
with Different Antioxidants Rated in a 15-cm Line Scale
Storage (Day) Control BHT 002 K200 K400
0 228plusmn194Aa 193plusmn175Aa 334plusmn231Aa 350plusmn274Aa
1 177plusmn194Aa 172plusmn163Aa 392plusmn274ABa 426plusmn265Ba
3 260plusmn210Aa 272plusmn265Aa 419plusmn306Aa 337plusmn247Aa
5 344plusmn255Aa 329plusmn215Aa 427plusmn248Aa 395plusmn253Aa
7 408plusmn300Aa 289plusmn244Aa 448plusmn241Aa 385plusmn244Aa
Different letters (A-B) within a row indicates that mean values are significantly different (Plt 005) Different letters within a column (a-b) within the same treatment are significantly different (Plt005)
K200 and K400 represent Treatment with Keluak extract at concentrations of 200 and 400 ppm
respectively
Table 46 Intensity of Eggy Odor Descriptor in Cooked Ground Turkey Meat
Treated with Different Antioxidants Rated in a 15-cm Line Scale
Storage (Day) Control BHT 002 K200 K400
0 643plusmn242Aa 513plusmn244Aa 502plusmn324Aa 565plusmn287Aa
1 597plusmn248Aab 476plusmn321Aa 599plusmn332Aa 584plusmn360Aa
3 345plusmn258Ab 400plusmn270Aa 515plusmn335Aa 509plusmn425Aa
5 364plusmn303Aab 424plusmn320Aa 475plusmn269Aa 469plusmn180Aa
7 473plusmn306Aab 364plusmn210Aa 485plusmn268Aa 431plusmn305Aa
Different letters (A-C) within a row indicates that mean values are significantly different (Plt 005) Different letters within a column (a-e) within the same treatment are significantly different (Plt005)
K200 and K400 represent Treatment with Keluak extract at concentrations of 200 and 400 ppm
respectively
57
Table 47 Intensity of Cardboard Odor Descriptor in Cooked Ground Turkey Meat
Treated with Different Antioxidants Rated in a 15-cm Line Scale
Storage (Day) Control BHT 002 K200 K400
0 299plusmn222Aa 209plusmn182Aa 261plusmn198Aa 312plusmn157Aa
1 262plusmn249Aa 180plusmn192Aa 339plusmn238Aa 342plusmn229Aa
3 299plusmn203Aa 284plusmn254Aa 388plusmn235Aa 287plusmn185Aa
5 252plusmn243Aa 290plusmn190Aa 309plusmn193Aa 320plusmn204Aa
7 301plusmn210Aa 273plusmn253Aa 337plusmn195Aa 284plusmn205Aa
Different letters (A-C) within a row indicates that mean values are significantly different (Plt 005) Different letters within a column (a-e) within the same treatment are significantly different (Plt005)
K200 and K400 represent Treatment with Keluak extract at concentrations of 200 and 400 ppm
respectively
Table 48 Intensity of Fatty Odor Descriptor in Cooked Ground Turkey Meat Treated with Different Antioxidants Rated in a 15-cm Line Scale
Storage (Day) Control BHT 002 K200 K400
0 344plusmn226aA 350plusmn256aA 395plusmn309aA 395plusmn277aA
1 417plusmn285aA 389plusmn230aA 401plusmn345aA 438plusmn287aA
3 388plusmn220aA 378plusmn229aA 396plusmn328aA 403plusmn285aA
5 479plusmn252aA 461plusmn293aA 389plusmn255aA 428plusmn320aA
7 460plusmn288aA 492plusmn286aA 426plusmn281aA 428plusmn340aA
Different letters (A-C) within a row indicates that mean values are significantly different (Plt 005) Different letters within a column (a-e) within the same treatment are significantly different (Plt005)
K200 and K400 represent Treatment with Keluak extract at concentrations of 200 and 400 ppm
respectively
58
Table 49 pH Values of Cooked Ground Turkey Treated with Different
Antioxidants Stored at 2˚C
pH Value
Storage (Day) Control BHT 002 K200 K400
0 665plusmn 002Aab 644plusmn 003Bbc 646plusmn 004Bbc 658plusmn 003Aab
1 659plusmn 003Ab 643plusmn 003Cbc 651plusmn 001Babc 662plusmn 001Aab
3 645plusmn 003Bc 634plusmn 002Cd 643plusmn 004Bc 654plusmn 000Ab
5 663plusmn 002Aab 640plusmn 002Cc 645plusmn 004Cc 654plusmn 002Bb
7 647plusmn 001Ac 633plusmn 003Bc 648plusmn 004Aabc 646plusmn 006Ac
10 665plusmn 001Aab 646plusmn 002Dbc 654plusmn 001Cab 660plusmn 003Bab
13 665plusmn 002Aab 648plusmn 002Cab 655plusmn 002Ba 664plusmn 002Aa
15 668plusmn 001Aa 651plusmn 001Da 655plusmn 001Ca 663plusmn 001Ba
Different letters (A-D) within a row indicates that mean values are significantly different (Plt 005) Different letters within a column (a-c) within the same treatment are significantly different (Plt005)
K200 and K400 represent treatments with Keluak extract at concentrations of 200 and 400 ppm
respectively
59
49 References
1 Chye FY Sim KY Antioxidative and Antibacterial Activities of Pangium edule Seed Extracts International Journal of Pharmacology 2009 5 285-297
2 Kahkonen M Hopia A Vuorela H Rauha J Pihlaja K Kujala T Heinonen M Antioxidant activity of plant extracts containing phenolic compounds J Agric Food Chem 1999 47 3954-3962
3 Jayaprakasha G Selvi T Sakariah K Antibacterial and antioxidant activities of grape (Vitis vinifera) seed extracts Food Res Int 2003 36 117-122
4 Gray J Macdonald B Pearson A Morton I Role of Nitrite in Cured Meat Flavor - a Review J Food Prot 1981 44 302-amp
5 Juntachote T Berghofer E Siebenhandl S Bauer F The antioxidative properties of Holy basil and Galangal in cooked ground pork Meat Sci 2006 72 446-456
6 Teets AS Were LM Inhibition of lipid oxidation in refrigerated and frozen salted raw minced chicken breasts with electron beam irradiated almond skin powder Meat Sci 2008 80 1326-1332
7 Han D McMillin K Godber J Bidner T Younathan M Marshall D Hart L Iron Distribution in Heated Beef and Chicken Muscles J Food Sci 1993 58 697-700
8 Ahn D Wolfe F Sim J Prevention of Lipid Oxidation in Precooked Turkey Meat Patties with Hot Packaging and Antioxidant Combinations J Food Sci 1993 58 283-287
9 Asghar A Gray J Buckley D Pearson A Booren A Perspectives on Warmed-Over Flavor Food Technol 1988 42 102-108
10 Kingston E Monahan F Buckley D Lynch P Lipid oxidation in cooked pork as affected by vitamin E cooking and storage conditions J Food Sci 1998 63 386-389
11 Kulas E Ackman R Different tocopherols and the relationship between two methods for determination of primary oxidation products in fish oil J Agric Food Chem 2001 49 1724-1729
12 Srinivasan S Xiong Y Decker E Inhibition of protein and lipid oxidation in beef heart surimi-like material by antioxidants and combinations of pH NaCl and buffer type in the washing media J Agric Food Chem 1996 44 119-125
13 Lee M Choi J Choi Y Han D Kim H Shim S Chung H Kim C The antioxidative properties of mustard leaf (Brassica juncea) kimchi extracts on
60
refrigerated raw ground pork meat against lipid oxidation Meat Sci 2010 84 498-504
14 Fardiaz D Romlah S Antioxidant Activity of Picung (Pangium edule
Reinw) Seed In Development of Food Science and Technology in ASEAN
Proceedings of the 4th ASEAN Food Conference Feb 17-21 1992 ASEAN
Jakarta Indonesia 1992
15 Frankel E N Lipid oxidation Dundee Scotland The Oily Press Ltd 1998 Vol 10 pp 13ndash41 16 Ma Amy A Peranakan favorite is ayam buah keluak Chicken stewed with black nuts at True Blue Restaurant Wall Street Journal (Online) New York NY Dec 16 2010 Retrieved July 20 2011 from httpproquestumicompqdwebdid=2214039511ampsid=1ampFmt=3ampclientId=36305ampRQT=309ampVName=PQD
17 Esteacutevez M Morcuende D and Ventanas S Determination of Oxidation
Nollet Leo M LToldraacute Fidel (Eds) Handbook of Muscle Foods Analysis Boca
Raton CRC Press 2009 221-240
18 Grau A Codony R Rafecas M Barroeta A Guardiola F Lipid
hydroperoxide determination in dark chicken meat through a ferrous oxidation-
xylenol orange method J Agric Food Chem 2000 48 4136-4143
19 Shahidi F Janitha P Wanasundara P Phenolic Antioxidants Crit Rev Food Sci Nutr 1992 32 67-103
20 Ruth SM Techniques for sampling and identification of volatile compounds contributing to sensory perception In Nollet Leo M LToldraacute Fidel (Eds) Handbook of Muscle Foods Analysis Boca Raton CRC Press 2009 503-523
21 Bou R Guardiola F Grau A Grimpa S Manich A Barroeta A Codony R Influence of dietary fat source alpha-tocopherol and ascorbic acid supplementation on sensory quality of dark chicken meat Poult Sci 2001 80 800-807
22 Gray J I and A M Pearson Rancidity and warmed over flavour In Pearson A M and Dutson T R (Eds) Advances in Meat Research Vol 3 Nostrand-Reinbold Co New York NY 1987 221ndash269 23 OrsquoNeill L M K Galvin P A Morrissey and D J Buckley Comparison of effects of dietary olive oil tallow and vitamin E on the quality of broiler meat and meat products Br Poult Sci 1998 39 365ndash371
61
Chapter 5 CONCLUSION AND FUTURE WORK
The results of the present study indicated that the Keluak extract
incorporated into cooked ground turkey can reduce lipid oxidation The addition
of Keluak extracts at 200 and 400 ppm had a positive effect on reducing the
TBAR values and the conjugated dienes content compared to the control without
added AOs during storage at 2˚C for 15 days The Keluak extract used in this
study was comparable to BHT (002) in reducing lipid oxidation in meat
Peroxide value analysis did not differentiate between the control and the
treatments on the extent of lipid oxidation Due to confusion of the odor
components in the Keluak extracts by the panelists there were no significant
differences between the treatments in the odor sensory evaluation
Keluak seed is a culinary spice with no known toxic effect Its moderate
pungent aroma makes it valued as a traditional ethnic food flavorant in parts of
South East Asia With its substantial phenolic content and antioxidant properties
it could be an effective source of natural antioxidants However the application
of this natural antioxidant might be limited in Western cultures due to its effect
on the color and odor of meat products Further investigations are needed to
identify selective extraction and clean-up techniques that could be used to
eliminate the color and odor problem Other chemical analysis methods that
might provide better information on the extent of oxidation in meat products
include the p-anisidine value Food Oil Sensor (FOS) and Gas chromatography
techniques (GC analysis) of selected volatiles
5
meat and meat products is lipid oxidation a process that leads to deterioration of
quality characteristics such as color flavor texture nutritive value and safety
(25) Therefore the meat industry faces a challenge in developing strategies for
preventing lipid oxidation in meat and meat products
22 Lipid Oxidation
221 Overview
A wide variety of organic molecules are susceptible to chemical attack by
oxygen Lipid oxidation can occur in foods containing considerable amounts of
fat (particularly fats containing substantial percentages of unsaturated fatty
acids) including nuts milk and meat products (1) Oxidation of lipids is initiated
by irradiation including exposure to visible light by enzymes and metal catalysts
Heat and pressure will accelerate lipid oxidation (2) Quality attributes of foods
can be substantially affected by this process For instance negative aroma
changes in the food can result from volatile oxidation products the color can
darken as a result of condensation reactions between oxidation products and
proteins and lastly the texture can be modified by the oxidative induction of
protein crosslinks (1) Not unexpectedly the nutritive value and safety can also be
compromised
222 Mechanism of Lipid Oxidation
Lipid autoxidation is a free radical chain reaction that once the
peroxidation process is initiated it proceeds as a free-radical mediated chain
reaction that can be described in terms of initiation propagation and termination
processes (29)
2221 Initiation
R H R + H (1)
An initiator reacts with unsaturated lipids (RH) to form a lipid free radical
(R) (reaction 1) Unsaturated lipids (RH) are easily oxidized by one of several
reactive oxygen species (ROS) which include oxygen radicals and non-radical
derivatives of oxygen (29) such as O2 and OH Poly-unsaturated fatty acids
Initiator
6
(PUFA) are much more susceptible to oxidation than mono-unsaturated fatty
acid (MUFA) (46)
The initiation reaction can include transition metals (ie iron copper)
oxidants various hemolysis-prone substances or enzymes (1) This production of
free radicals can occur because of the direct thermal dissociation (thermolysis) of
hydroperoxides because of transition metal catalysis or exposure to light
(photolysis) with or without the intervention of photosensitizers (30) The
spontaneous abstraction of a hydrogen atom from an organic material by
molecular oxygen is an endothermic reaction which has a large activation energy
and although it might occur to a certain extent this stage is probably too slow to
be of practical importance Either the organic molecule or the oxygen should be
activated before the reaction could take place (1)
2222 Propagation
R + O2 ROO (2)
ROO + RH rarr ROOH + R (3)
An unsaturated lipid contains labile hydrogen(s) that can be abstracted
relatively easily This free radical (R) will react rapidly with molecular oxygen to
produce a peroxyl radical (ROO ) (reaction 2) The newly formed hydroperoxyl
radical can so forth abstract a hydrogen atom from an adjacent unsaturated fatty
acid (reaction 3) and the reaction goes on propagation cycles before termination
(29)
2223 Termination
ROO + ROO rarr non-radical products [ROOOOR] (4)
RO + R rarr ROR
R + R rarr RR
R + ROO rarr ROOR
Termination can occur by condensation of peroxy alkoxy andor alkyl
radicals Peroxy radicals at room temperature can combine to produce peroxy-
linked dimers (ROOR) Alkoxy and alkyl radicals at low oxygen pressure and
7
high temperatures can combine to produce ether-linked dimers (ROR) and
carbon-carbon linked dimers (RR) Alkyl radicals can combine with peroxy
radicals to generate peroxy-linked dimers (ROOR) (30-32)
Hydroperoxides the primary initial products of lipid oxidation can
breakdown as soon as they are formed The decomposition can be catalyzed by
transition metals particularly iron or copper or by elevated temperatures
gt100degC Hydroperoxide decomposition can involve several complex pathways
forming a wide variety of volatile and non-volatile secondary products such as
aldehydes ketones alcohols acids and hydrocarbons which can affect flavor
greatly Some of the volatile aldehydes can be extremely potent and can affect
flavor of food at concentrations less than 1 ppm (31) Another important
termination reaction involves an antioxidant (AH) (30) which will be discussed
later in the chapter
23 Lipid Oxidation in Meat
Meat can oxidize very rapidly post-mortem The rate and degree of lipid
oxidation are affected by factors that include meat composition fatty acid
content processing conditions and chemical additives in the meat products (3)
It is generally agreed that lipid oxidation in muscle foods begins immediately
after slaughter in the highly unsaturated phospholipids fraction in the subcellular
membranes (25) Botsoglou et al (25) added that in most cases fresh meat has an
acceptable stability with respect to oxidation but processing operations such as
freezing and thawing mechanical deboning mincing restructuring the addition
of salt and refrigeration can lead to increased oxidation due to the destruction of
cellular structure and functions
Cooked or pressure-treated meat and meat products can be more
susceptible to oxidation since endogenous antioxidant enzymes may denature
and lose their activities while iron-containing proteins may become a source of
catalytic iron
Poultry meat is particularly susceptible to lipid oxidation due to its high
content of polyunsaturated lipids pigments metal catalysts and various other
8
oxidizing agents (25) This implies that even low-fat poultry meat products are
susceptible to lipid oxidation since fat reduction primarily reflects a reduction in
triacylglycerides while the phospholipid fraction which is high in
polyunsaturated fat is much less affected (34) Another factor is that species
differences in susceptibility to lipid oxidation are largely determined by the level
of poly-unsaturated fatty acid (PUFA) present in meat Thus the extent of lipid
oxidation in cooked meat is directly related to the level of unsaturated fatty lipids
with susceptibility to oxidation decreasing in the order of chicken gt pork gt beef gt
lamb (4) Chicken has fewer tendencies to develop oxidized flavor than turkey
because the higher level of vitamin E in chicken fat retards oxidation Oxidation
proceeds faster in turkey thigh meat than in breast meat as the darker meat
contains more lipid and heme iron (17)
Hydroperoxides formed during lipid peroxidation undergo decomposition
to form secondary oxidation products Those secondary products include volatile
aldehydes ketones acids alcohols and hydrocarbon compounds Aldehydes (ie
hexanal) are one of the primary causes of rancid and stale flavors in precooked
meat products (3)
231 Factors Affecting the Extent of Lipid Oxidative Stability in Meat
There are factors that can affect lipid stability in meat and meat pr0ducts
such as fatty acid composition endogenous prooxidative or antioxidative
components meat processing operations and various additives
2311 Fatty Acid Composition of Meat
It is generally agreed that unsaturated fatty acids (UFA) are responsible
for lipid oxidation in meat Also as the concentration of polyunsaturated fatty
acids (PUFA) increases lipid oxidation increases in muscle foods (4) The amount
of UFA in muscle foods varies depending on the animal species genetic origin
diet sex age at which the animal is slaughtered type of muscle and processing
factors such as fat addition to ground meat (5)
Turkey meat showed low values for total lipid and cholesterol but
greater values than beef pork and lamb for its PUFA content The content of n3
9
fatty acids was the greatest in turkey among meats that included beef pork and
lamb The species is the major source of variation in fatty acid composition The
fatty acid composition of turkey meat is shown in Table 21 (50) Ruminant meats
contain a greater percentage of saturated fat compared with the meat of
monogastric animals (6)
2312 Endogenous prooxidative and antioxidative constituents
Endogenous prooxidative constituents in meat systems consist of iron-
containing proteins transition metals and endogenous enzymes The catalytic
effect of iron-containing protein on the oxidative deterioration of PUFA was first
described by Robinson (35) Since then heme catalyzed lipid oxidation has been
studied extensively and it has become a generally accepted phenomenon that
lipid oxidation is accelerated by heme compounds and transition metals in meat
systems
Lipoxygenase peroxidase and microsomal enzymes identified in various
animal tissues catalyze the reaction of PUFA oxidation with the formation of
unconjugated dienes (7) However enzymatic lipid oxidation catalysts are normal
components in blood and consequently are not a primary problem in most
muscle foods (8)
2313 Meat Processing
According to McMillin (33) quality of raw materials time postmortem
extent of heating and comminution or particle size reduction and the ingredients
added are processing factors that can influence the rate of lipid oxidation Even
though lipid oxidation varies among different animal species such species effects
have been inconsistent and may be due to differences in anatomical location
diet environmental temperature sex age phospholipid content body
composition and experimental conditions such as cooking temperature sample
handling and method for assessing lipid oxidation
Heating encourages the development of lipid oxidation by affecting the
distribution of the iron in the muscle food (9) During cooking a variety of
volatiles producing off-odors and flavors are generated as PUFA oxidize (10)
10
Heat quickly decomposes hydroperoxides produced resulting in the production
of desirable flavor in cooked products The shelf-life of meat products is usually
prolonged by frozen storage Under freezing conditions the rate of oxidation can
be reduced but not completely prevented (1)
Lipid oxidation in cooked meat is commonly referred to as warmed-over-
flavor (WOF) WOF often develops within 1-3 days of refrigerated storage and is
characterized by the loss of fresh cooked meat aroma and a simultaneous
increase in undesirable odors which are commonly described as ldquostalerdquo ldquowet
cardboardrdquo ldquopaintyrdquo ldquograssyrdquo or ldquorancidrdquo (11) The most important contributors
to the development of WOF are the secondary oxidative compounds such as
hexanal pentanal and 2 3- octanedione (12) According to Kerler and Grosch
(59) identified (E E)-2 4-decadienal butyric acid and furaneol as key
compounds in fresh boiled chicken aroma while hexenal butyric acid and 1-
octen-3-one were the main compounds in chicken reheated after 48 hours
storage at 4˚C
The tendency of precooked meat products to oxidize has led food
scientists processors and the industries to develop techniques that allow
extended shelf life of these products In addition to antioxidants the appropriate
packaging and proper storage conditions are useful techniques to achieve
extended storage times
2314 Non-meat Additives
Non-meat additives can be prooxidative or antioxidative agents The
addition of salt NaCl commonly used in meat products to add flavor and
functionality at 05-25 (4) is a prooxidant Salt has been shown to accelerate
oxidation in pork patties (13) by enhancing the activity of iron atoms which then
promotes iron-catalyzed oxidation and flavor deterioration (1) Transitions
metals other than iron (copper especially) supplied by the water from
processing equipment andor spices can also promote oxidation (36)
The use of antioxidants synthetic or natural has been used to prevent lipid
oxidation in meat products The addition of nitrites phosphates citric acid
phytic acid and EDTA has been reported to inhibit lipid oxidation in meat
11
products (10 14) In addition synthetic phenolic antioxidants such as butylated
hydroxytoluene (BHT) butylated hydroxyanisol (BHA) tertiary-butylated
hydroquinone (TBHQ) and propyl gallate has been widely used for more than 50
years to inhibit lipid oxidation in meat products (12)
Several water-soluble compounds including ascorbic acid uric acid
cysteine and glutathione are also known to scavenge radicals and delay oxidation
(37) In meat the functions of ascorbic acid include maintenance of cured color
and prevention of off-flavors (15) Ascorbic acid becomes a prooxidant in meat
products at concentrations greater than 300 mgkg (8)
In the last 30 years natural antioxidant use has increased Various plant
materials and extracts containing polyphenolic compounds have been proven to
be effective antioxidants in meat systems Rosemary and rosemary extracts at
concentrations between 002 to 003 are one of the many natural antioxidants
being studied (3 16-18)
232 Measurement of rancidity in meat
Hydroperoxides the primary products of lipid oxidation are colorless
tasteless and odorless It is the breakdown of these peroxides that produce a
complex mixture of low molecular weight volatile compounds including alkanes
alkenes aldehydes ketones alcohols esters and acids many with distinctive
odor and flavor characteristics (19 38) These compounds convey rancid
cardboard oxidized pungent and other off-flavors characteristic of oxidized meat
(39)
Since oxidative decomposition products are of great importance to product
acceptability and nutritional quality a wide variety of assays from subjective
analyses (ie sensory evaluation) to physical and chemical analyses of various
components have been developed to detect and quantify lipid oxidation in foods
However there is no single effective method to measure all the oxidative
products that are generated during lipid oxidation There is no good method
useful for all stages of oxidation An assay can only monitor only a few changes or
specific reactants when applied to a food system under specific conditions
Therefore a combination of assays would be required to monitor the extent of
12
lipid oxidation in most foods It is also common to apply methods that are based
on measuring one of more of the key primary or secondary oxidation products
2321 Peroxide Value
Since the primary product of lipid oxidation are hydroperoxides it is
proper to determine their concentration as one measure of oxidation The
peroxide value (PV) assay represents the total concentration of peroxides and
hydroperoxides present at a certain time in the food product However this test
is restricted by the chemical instability of these compounds after their
concentration reaches a maximum level they decay as a function of temperature
and the presence of other food components particularly transition metals such
as iron and copper (1)
In muscle tissue the lipid is extracted with a mixture of solvents without
decomposition of the hydroperoxides One of the most common extraction
methods was developed by Folch Lees and Stanley (20) Several methods to
determine the PV have been developed that include iodometric titration method
a ferric thiocyanate method and other colorimetric methods (21 40) PV can be
expressed in several units such as meq iodinekg fat (40) or as meq of
peroxidekg fat (45)
2322 Conjugated Dienes
Conjugated diene hydroperoxides (CDs) are one of the primary products of
the oxidation for linoleate (182) and PUFAs with 3 or more double bonds CDs
can be determined quantitatively by their absorbance at 232-234 nm (22) In
meat samples the CD are first extracted from homogenized sample with an
extracting solution such as 31 hexane isopropanol (23 24)
The greater the amount of PUFA in a fat the greater the potential rise in
the CD values However the CD values plateau at a certain concentration at
which the breakdown roughly equals the formation of new CDs At this point in
the oxidation process no additional changes can be measured by the CD assay
(41)
13
httpwwwchemistrydailycomchemistryDiene
2323 Thiobarbituric Acid Reactive Substances (TBARS)
An alternative approach to the determination of the extent of oxidation is
the measurement of selected secondary oxidation products In contrast to the PV
assay those assays are not limited to the early stages of oxidation and may reflect
the formation of volatile products such as carbonyl compounds which actually
contribute to the rancid and objectionable flavor The application of methods
based on this approach requires a detailed knowledge of the chemistry involved
and an understanding of the stability of the compounds assayed etc Among
these methods the thiobarbituric acid test (TBA) is one of the most common in
spite of criticisms of its reproducibility and reliability The test is based on the
color product resulting from the condensation of TBA with malonaldehyde which
is presumably generated in the oxidized fats However a large body of evidence
suggests that other food components can react with TBA to generate the same
chromophore and even the formation of malonaldehyde is dependent on the
composition of the initial lipid (1) For example other products of lipid oxidation
such as alka-2 4-dienals also react with TBA to form a red complex with the
same absorption maximum as the malonaldehyde-TBA complex shown in the
diagram below (42) For this reason Gray suggested that the TBA procedure
should be used to assess the extent of lipid oxidation in general rather than to
quantify malonaldehyde and the term thiobarbituric acid-reactive substances
(TBARS) is now commonly used in place of the TBA number or value (10)
The extent of lipid oxidation is reported as the TBA number or TBA
value and is expressed as milligrams of malonaldehyde equivalents per kilogram
of sample Malonaldehyde is a relatively minor lipid oxidation product formed
14
during the oxidation of polyunsaturated fatty acids and reacts with TBA to
produce a colored complex with an absorption maximum at 530-532 nm
Malonaldehyde has been reported to correlate well with sensory scores of
oxidized flavors in muscle foods (38) This assay is not recommended for
monitoring the extent of oxidation of food oils
httpmnh20wordpresscom20100719518
2324 Sensory Evaluation
A wide range of methods have been used to examine the effects of lipid
oxidation on the quality of stored turkey meat In addition to the chemical or
instrumental techniques sensory evaluation is very useful for assessing the
quality and stability of meat and meat products from lipid oxidation Most of
these analyses such as the PV TBARs CDs or gas chromatographic analysis of
specific volatiles can be correlated to sensory analysis but none of these chemical
or physical analyses can effectively replace the human nose taste buds and
sensory receptors (43)
According to Warner (43) sensory evaluation is a scientific discipline used
to evoke measure analyze and interpret reactions to food and material
characteristics as they are perceived by sense of sight smell taste touch and
hearing Although sensory evaluation can have a low reproducibility relative to
gas chromatography well-trained and experienced sensory panelists operating
under controlled conditions can provide accurate reliable data The American
Meat Science Association (44) has developed standard guidelines for sensory
analyses The AMSA recommendations include sample preparation cooking
methods and procedures facilities preparation and presentation of samples
15
trained sensory panels test forms consumer panels and instrumental
measurement of tenderness
24 Control of Oxidation Antioxidants
Antioxidants are substances that can delay the onset of lipid oxidation and
extend the induction period They must be added as early as possible in the
manufacturing process or to finished food products to be effective in reducing
lipid oxidation Antioxidants cannot reverse the oxidation of rancid food
products Moreover antioxidants are not effective in controlling hydrolytic
rancidity which is enzyme-catalyzed hydrolysis of fats Antioxidants can control
lipid peroxidation in six ways reducing localized O2 concentrations scavenging
species that initiate peroxidation quenching singlet O2 to prevent the formation
of peroxides binding free metal ions (chelating agent) into a form that will not
generate reactive species or decompose lipid peroxides to peroxyl or alkoxyl
radicals peroxide removal and chain breaking to prevent more hydrogen
abstraction from fatty acid side chains (46) There are three types of antioxidants
based on their mechanism (46 47)
241 Type I - Also called the primary or free-radical chain stopper antioxidants
Type I antioxidants inhibit the chain reaction by acting as hydrogen
donors or free-radical acceptors (AH) (46) Compounds in this category stop the
free radical chain reactions by converting the radicals into more stable products
(47) by reacting primarily with ROO and not with R radicals Basically the
mechanism is a competition between ldquothe inhibitor reactionrdquo (46)
ROO + AH ROOH + A
And ldquothe chain propagation reactionsrdquo
ROO + RH ROOH + R
The effectiveness of a primary antioxidant is dependent on several factors
such as activation energy rate constants oxidation-reduction potential ease of
antioxidant loss or destruction and solubility properties (46) Labuza pointed out
that another important characteristic of an efficient antioxidant is that the
16
resulting antioxidant free radical must not itself initiate new free radicals or be
rapidly oxidized by a chain reaction (46) Type I antioxidants are primarily
phenolic compounds such as butylated hydroxytoluene (BHT) and butylated
hydroxyanisole (BHA) (47) and tert-butylhydroquinone (TBHQ) commonly
present in foods These synthetic food additives are permitted to be used alone or
in combination However the antioxidant content of a food containing these
additives must not exceed 002 of the oil or fat content of the food according to
the Code of Federal Regulations (58)
Butylated Hydroxyanisole
Phenolic compounds synthetic or natural are excellent antioxidants since
they possess benzene rings containing hydroxyl groups and are relatively
reactive Phenols produce stable antioxidant radicals A that are sufficiently
unreactive to propagate the chain and compete with the lipid substrate (RH)
which is present at a much greater concentration (46)
A + ROO Non-radical products
A + A Non-radical products
Since synthetic antioxidants such as BHT and BHA have restrictions for
use in food due to their toxicological effects on several species and they are
suspected to be potential carcinogens (48) the search for natural and safe
antioxidants especially those of plant origin has greatly increased in recent
years
17
242 Type II- Secondary antioxidants or Free-radical production preventer
This category includes compounds that reduce the rate of chain initiation
by metal chelation oxygen scavenging or absorption of UV radiation (47) The
common chelating agents include ethylenediamine tetraacetic acid (EDTA) citric
acid and phosphates EDTA is used for chelation of many metals and it can be an
effective oxidation inhibitor in foods especially those with intermediate to high
moisture content but not in protein-type food such as meats which contain
substantial amounts of bound form of transition metals (46) In addition EDTA
does not protect food during heating because it is less stable at higher
temperatures therefore it is restricted to foods held or processed at cool
temperatures (49) Citric acid is especially useful in oils and intermediate
moisture foods (46) Ascorbic acid is commonly used as a food antioxidant due to
its oxygen scavenging and reducing properties (47) it is especially effective when
it is used in combination with iron chelators (46) Polyphosphates are more
effective chelators and antioxidants than monophosphates However their
antioxidant activity could be reduced or eliminated depending on the
components of the food (50)
Maillard reaction products can bind transition metals such as iron and
deactivate singlet oxygen Because of their dark color and low solubility they are
unsuitable for use in fats and oils but they may be used to improve the oxidative
stability of many foods (51)
Other preventive antioxidants include several enzymes such as catalase
(47) and glutathione peroxidase (37) which reduce the generation of free radicals
by decomposing hydrogen peroxide and hydroperoxides respectively
243 Type III- Control of Environment Factors
This category does not refer to compounds added to inhibit lipid oxidation
Rather this category refers to factors such as the reduction of the oxygen
content a decrease in temperature altering the moisture content (46) and
exclusion of light (47) As the temperature increases oxygen becomes less soluble
in lipids and water slightly influencing the rate The rate of oxidation increases
proportionally to the surface of the lipid exposed to air According to Labuza (46)
18
lipid oxidation can be reduced by altering the water activity which can alter the
catalytic activity of metal catalysts At an elevated water activity (awgt 055) the
rate of oxidation can increase possibly due to the increased mobilization of metal
catalysts
Antioxidant synergism has been observed between primary antioxidants
and between antioxidants with different modes of actions This synergistic effect
can substantially reduce the level of antioxidants needed in a food
25 Keluak As A Natural Source of Antioxidant
251 Keluak ndash Introduction
Pangium edule Reinw (Figure 21) is a tall tropical tree that grows mainly
in Micronesia Melanesia and Southeast Asia including Indonesia The
taxonomy of the tree is uncertain and it may also be classified in the
Flacourtiaceae or the Violale According to Abdullah (55) the tree requires many
years to mature and the seeds are therefore most frequently harvested from wild
trees as it is not economically feasible to cultivate the plant The size of a Pangi
tree is characterized as medium to large with large glossy heart-shaped leaves
that are conspicuously veined and long-stemmed The flowers are large and
greenish and the sexes are separate Flowering occurs from September to October
with seed shed likely to occur in December to January However there are
records of seed shed in April to May and July to September This tropical tree is
wild and not well cultivated (55)
The trees start fruiting when they are approximately 10 to 15 years old The
fruit is oval in shape and the size ranging from 12-30 cm (52) or about a size of a
large husked coconut brown and rough-surfaced (55) The tree produces a large
fruit that is poisonous because of the presence of cyanogenic glucosides (53)
Almost all parts of the plant are poisonous including its leaves barks and seed
(52) Although poisonous to humans the seeds of the tree are part of the natural
diet of the babirusa (Babyroussa babyrussa) (53) a pig-like animal native to the
region However the mature fruit is edible and the juice can be applied to sores
and cuts (55)
19
In Indonesia the seed kernel of this tree is edible after treatments
following the removal of the cyanogenic glucosides Keluak is fermented in a
specific way the seeds are harvested and placed in the field for 10 days The seeds
are then removed washed and boiled for 3 hours to remove the cyanide (54)
After cooling the seeds are buried (indoor) in ash banana leaves and earth for
40 days The seed turn from a creamy white color to dark brown or black (51)
The fermented seeds are cleaned and ready to be used as spices (54) image is
shown in Figure 22 In some countries according to Ma (56) after harvesting the
fruits are buried in the ground for ~100 days before the large seeds are removed
the rest of the plant is poisonous The charcoal-colored nuts are braised for one
hour so the soft flesh can be scooped out of the skin The taste is bitter buttery
and a bit like chocolate while the texture is a familiar one - think mashed
potatoes or roasted chestnuts (56)
Taxonomy of Keluak (55)
Kingdom Plantae
Division Magnoliophyta
Species Pedule
Family Acariaceae
Binomial name Pangium edule Reinw ex Blume
Authority Reinward
Synonym names football fruit kluwek Indonesia black nut kepayang
kluwek keluwek kluwak pangi paying picung penarassan seis
According to Andarwulan et al (54) the fermented seed product of this tree
depending upon the origin is called
Indonesian
o Keluak kluwak kluak kluwek keluwek or kloewak (Dutch spelling)
o Pucung or pucing (Sundanese)
o Rawan or rawon (adjective referring to food prepared with the seed of
this tree) (Figure 23)
Malay
o Kepayang
20
o Payang
Philipines
o Samaun-referring to the oil
o Pangi- referring to the tree
Keluak is commonly used as a spicy flavoring in soups in Java and South
Sulawesi several traditional dishes can be made with Keluak seeds including
ldquoRawonrdquo (Figure 23) and ldquoBlack nut with golden snapperrdquo (Figure 24) Keluak is
also a raw material for another product ldquokecap pangirdquo (ldquokecaprdquo is a soy sauce-like
product) and it has been used as a spice in Saparua Maluku Island in Indonesia
Another of the edible products is called ldquoDagerdquo which is a boiled seed after the
removal of kernels and water after soaking for 2-3 days Dage is utilized in West
java as a vegetable (54) In this document I will use the term ldquoKeluakrdquo and ldquopangi
to refer to the fermented seed that is commonly used as a spice
252 Nutritional Profile of Keluak
The nutrition fact of the Keluak seed is shown in Table 22 Generally
phenolic compounds are found in the seeds and other parts of the plant Most
seeds contain large amounts of polyunsaturated oils and phenolic antioxidants
are necessary to protect the polyunsaturated fatty acids in the oil against
autoxidation (50)
The pangi seed contains some secondary metabolites (Table 23) of the
cyanogen glycosides which include the cyanogen glycoside and various
alkaloids flavonoids steroids saponins tannins and quinine These metabolites
are present in both fresh and dried pangi seed (55)
253 Previous work on keluak
Previous research by Fardiaz and Romlah (57) on the fermented seed
indicated that the methanol extract of keluak possessed antioxidant activity
Fardiaz and Romlah found that the addition of Keluak seed extract to cooking oil
could lengthen the oxidation induction period of the oil Their findings are
summarized in the Table 24 and Figure 25
21
Recently Chye and Sim (52) used several different extraction methods on
Keluak seeds and examined the antioxidant activity of the extract Extracts of
Pangium edule Reinw seed were investigated for their antioxidative activity
using DPPH radical scavenging and β-carotene bleaching assays For the
extraction they used a mixture of acetone acetic acid water which yielded the
higher phenolic content of 2222 plusmn005 mg GAEg among the other methods of
extraction and showed the most potent antioxidative acivity in both DPPH radical
scavenging and β-carotene (Figures 26- 27) They found that significant
correlation was observed between the total phenolic content and its antioxidative
activity (r=0878) suggesting that the phenolics of the Keluak extract could be
potential sources of natural antioxidants (52)
22
26 Figures
Figure 21 Pangium Plant
httpwwwpngplantsorgPNGtreesTreeDescriptionsPangium_edule_Reinwhtml httptravelspotcoolstuffcomgourmet-adventureunusual-food5-lethal-
delicious-meals
Figure 22 Keluak Seed
Source Wayang Brand Kluwak Kupas PT Wira Aksara Jakarta Indonesia
Figure 23 A Dish Made With Keluak Seed- Black Beef Soup (Rawon)
httpwwwlestariwebcomresep-indonesiaEnglishRawonphp
23
Figure 24 A Dish made with Keluak Seed- Black Nut with Golden Snapper
httpdelightfultastebudscom20110501rawon-indonesian-beef-black-soup
Figure 25 The Effect of Kluwak Extract on Oxidation Induction Period of Palm Oil (57)
24
Figure 26 DPPH radical scavenging activity () of Keluak seed extracts at different
concentrations (52)
Phenolic (Ace) = phenolic extracted by acetone Phenolic (EtOAc) = Phenolic extracted by ethyl acetate FPA= Free phenolic acid GBPA= Glycoside-bound
phenolic acid Al= Alkaloid
Figure 27 Antioxidative Activity of Keluak Seed Extracts at 20 mgmL measured by β-
carotene bleaching method (52)
Phenolic (Ace) = phenolic extracted by acetone Phenolic (EtOAc) = Phenolic extracted by ethyl acetate FPA= Free phenolic acid GBPA= Glycoside-bound
phenolic acid Al= Alkaloid
25
27 Tables
Table 21 Fatty Acid Composition of Turkey Meat (50)
Table 22 Nutrition Fact of Keluak Seed
Per 100 grams (or 100 mL)
Energy 2428 kj
Protein 15 g
Fat (Total) 50 g
Carbohydrate (Total) 17 g
Sugar 4 g
Dietary Fiber 10 g
Sodium -
Potassium 680 mg
Calcium 0
Vitamin A 0
Vitamin C 0
Iron 0 Source Wayang Brand Kluwak Kupas PT Wira Aksara Jakarta Indonesia
26
Table 23 Anti- Nutritional Factors of Pangium Seed (55)
Anti- Nutritional Factors Dry wt Basis (microgg)
Arsenic NA
Cyanide 1834
Lead 18
Phytic acid NA
Tannin 046
Alkaloid NA
Table 24 The Antioxidative Activity of Kluwak Expressed as Protective Factor (57)
27
28 References
1 Kanner J Rosenthal I An Assessment of Lipid Oxidation in Foods - Technical Report Pure and Applied Chemistry 1992 64 1959-1964
2 Skibsted LH Understanding oxidation processes in foods Woodhead Publ Food Sci Technol Nutr 2011 199 3-35
3 Yu L Scanlin L Wilson J Schmidt G Rosemary extracts as inhibitors of lipid oxidation and color change in cooked turkey products during refrigerated storage J Food Sci 2002 67 582-585
4 Rhee K Anderson L Sams A Lipid oxidation potential of beef chicken and pork J Food Sci 1996 61 8-12
5 Hernandez P Navarro J Toldra F Lipid composition and lipolytic enzyme activities in porcine skeletal muscles with different oxidative pattern Meat Sci 1998 49 1-10
6 Karakok SG Ozogul Y Saler M Ozogul F Proximate Analysis Fatty Acid Profiles and Mineral Contents of Meats a Comparative Study Journal of Muscle Foods 2010 21 210-223
7 Chan K Decker E Endogenous Skeletal-Muscle Antioxidants Crit Rev Food Sci Nutr 1994 34 403-426
8 Decker E Xu Z Minimizing rancidity in muscle foods Food Technol 1998 52 54-59
9 Rojas MC Brewer MS Effect of natural antioxidants on oxidative stability of cooked refrigerated beef and pork J Food Sci 2007 72 S282-S288
10 Gray J Macdonald B Pearson A Morton I Role of Nitrite in Cured Meat Flavor - a Review J Food Prot 1981 44 302-8
11 Brewer M Vega J Detectable Odor Thresholds of Selected Lipid Oxidation Compounds in a Meat Model System J Food Sci 1995 60 592-595
12 St Angelo A Crippen K Dupuy H James C Chemical and Sensory Studies of Antioxidant-Treated Beef J Food Sci 1990 55 1501-1508
13 Buckley D Gray J Asghar A Price J Crackel R Booren A Pearson A Miller E Effects of Dietary Antioxidants and Oxidized Oil on Membranal Lipid Stability and Pork Product Quality J Food Sci 1989 54 1193-1197
14 Guntensperger B Escher F Oxidative Changes of Heat-Sterilized Meat in Trays J Food Sci 1994 59 689-692
28
15 Bauernfeind JC Antioxidant function of L-ascorbic acid in food technology International journal for vitamin and nutrition researchSupplement = Internationale Zeitschrift fur Vitamin- und ErnahrungsforschungSupplement 1985 27 307-333
16 Georgantelis D Blekas G Katikou P Ambrosiadis I Fletouris DJ Effect of rosemary extract chitosan and alpha-tocopherol on lipid oxidation and colour stability during frozen storage of beef burgers Meat Sci 2007 75 256-264
17 Botsoglou NA Govaris A Giannenas I Botsoglou E Papageorgiou G The incorporation of dehydrated rosemary leaves in the rations of turkeys and their impact on the oxidative stability of the produced raw and cooked meat Int J Food Sci Nutr 2007 58 312-320
18 Karpinska-Tymoszczyk M Effect of the addition of ground rosemary on the quality and shelf-life of turkey meatballs during refrigerated storage Br Poult Sci 2008 49 742-750
19 Drumm T Spanier A Changes in the Content of Lipid Autoxidation and Sulfur-Containing-Compounds in Cooked Beef during Storage J Agric Food Chem 1991 39 336-343
20 Folch J Lees M Stanley GHS A Simple Method For The Isolation And Purification Of Total Lipides From Animal Tissues Journal of Biological Chemistry 1957 226 497-509
21 Grau A Codony R Rafecas M Barroeta A Guardiola F Lipid hydroperoxide determination in dark chicken meat through a ferrous oxidation-xylenol orange method J Agric Food Chem 2000 48 4136-4143
22 Dobarganes M Velasco J Analysis of lipid hydroperoxides European Journal of Lipid Science and Technology 2002 104 420-428
23 Juntachote T Berghofer E Siebenhandl S Bauer F The antioxidative properties of Holy basil and Galangal in cooked ground pork Meat Sci 2006 72 446-456
24 Lee M Choi J Choi Y Han D Kim H Shim S Chung H Kim C The antioxidative properties of mustard leaf (Brassica juncea) kimchi extracts on refrigerated raw ground pork meat against lipid oxidation Meat Sci 2010 84 498-504
25 Botsoglou N and Botsoglou E Oxidation in Foods and Beverages and Antioxidant Applications Vol 2 Management in Different Industry Sectors In Decker EA Elias RJ and McClements D J (eds) Oxidation in Foods and Beverages and Antioxidant Applications Vol 2 Management in Different Industry Sectors 2010 200 1-528
29
26 National Chicken Council Per Capita Consumption of Poultry Livestock 1965 to Estimated 2012 in Pounds 2012 Retrieved in January 23 2012 from httpwwwnationalchickencouncilorgabout-the-industrystatisticsper-capita-consumption-of-poultry-and-livestock-1965-to-estimated-2012-in-pounds
27 Bilgili SF Poultry meat processing and marketing- what does the future hold Poult Internat 2002 12-22
28 Nolan N L Bowers J A and Kropf D H Lipid Oxidation and Sensory Analysis of Cooked Pork and Turkey Stored under Modified Atmospheres Journal of Food Science 1989 54 846ndash849
29 Esteacutevez M Morcuende D and Ventanas S Determination of Oxidation Nollet Leo M LToldraacute Fidel (Eds) Handbook of Muscle Foods Analysis Boca Raton CRC Press 2009 221-240
30 Frankel E N Lipid oxidation Prog Lipid Res 1980 19 1ndash22
31 Frankel E N Volatile Lipid Oxidation Products Progress in lipid research 1983 221 1-33
32 Hsieh R J and J E Kinsella Oxidation of Polyunsaturated Fatty Acids Mechanisms Products and Inhibition with Emphasis on Fish Advances in Food and Nutrition Research 1989 Vol 33
33 McMillin K W Initiation of oxidative processes in muscle foods Annual Proceedings of the Reciprocal Meat Conference Am Meat Sci Assoc Chicago IL 1997 49th 53ndash64
34 Monahan FJ Oxidation of lipids in muscle foods fundamental and applied concerns In EA Decker C Faustman and CJ Lopez-Bote (Eds) Antioxidants in Muscle Foods Nutritional Strategies to Improve Quality New York John Wiley and Sons Inc 2000
35 Robinson M E Haemoglobin and methaemoglobin as oxidative catalysts Biochemical Journal 1924 18 255-264
36 Jadhav SJ Nimbalkar SS Kulkarni AD and MadhaviDL Lipid oxidation in biological and food systems In Marcel Dekker (Eds) Food Antioxidants Technological Toxicological and Health Perspectives New York 1996
37 Niki E Antioxidants and relation to lipid oxidation Chemistry and physics of lipids 1987 44 227-300
38 Gray J I and Monahan FJ Measurement of lipid oxidation in meat and meat products Trends Food Sci Technol 1992 3 315-9
30
39 Chang S S and Peterson R J The Basis of Quality in Muscle Foods Recent Developments In The Flavor of Meat Journal of Food Science 1977 42 298ndash305
40 Lea C H Methods for determining peroxide in lipids J Sci Food Agric 1952 3 586ndash594
41 White P J Conjugated diene anisidine value and carbonyl value analysis In Warner K and Eskin N A M (Eds) Methods to Access Quality and Stability of Oils and Fat-Containing Foods Champaign IL AOCS Publishing 1995 159-177
42 Coxon D Measurement of lipid oxidation Food Science and Technology Today 1987 1164-6
43 Warner K Sensory evaluation of oils and fat-containing foods In K Warner and N A M Eskin (Eds) Methods to Access Quality and Stability of Oils and Fat-Containing Foods AOCS Publishing 1995 49
44 AMSA Research Guidelines for cookery sensory evaluation and instrumental tenderness measurements of fresh meat American Meat Science Association-National Live Stock and Meat Board 1995
45 Association of Official Analytical Chemists Official methods of analysis (16th ed) Washington DC Association of Official Analytical Chemists 1995
46 Labuza T P and Dugan L R Kinetics of lipid oxidation in foods C R C Critical Reviews in Food Technology 1971 2 3
47 Gordon MF The mechanism of antioxidant action in vitro In Hudson BJF (Ed) Food Antioxidants London Elsevier Applied Science 1990 1-18
48 Shahidi F Janitha P Wanasundara P Phenolic Antioxidants Crit Rev Food Sci Nutr 1992 32 67-103
49 Roozen JP Effects of types I II and III antioxidants on phospholipid oxidation in a meat model for warmed over flavour Food Chem 1987 24 167-185
50 Pokornyacute J Natural antioxidants for food use Trends in Food Science and Technology 1991 2 223-227
51 Wong W H Buah Keluak National Parks 11 Jan 2007 Retrieved 02 July 2012 from httpenwikipediaorgwikiPangium_edule
52 Chye FY Sim KY Antioxidative and Antibacterial Activities of Pangium edule Seed Extracts International Journal of Pharmacology 2009 5 285-297
31
53 Andarwulan N Fardiaz D Wattimena GA Shetty K Antioxidant activity associated with lipid and phenolic mobilization during seed germination of Pangium edule Reinw J Agric Food Chem 1999 47 3158-3163
54 Andarwulan N Fardiaz S Apriyantono A Hariyadi P Shetty K Mobilization of primary metabolites and phenolics during natural fermentation in seeds of Pangium edule Reinw Process Biochemistry 1999 35 197-204
55 Abdullah Moh A B Phyochemical Composition of Fresh and Cooked of Chesnut (Castanopsis argentea) Pangium (Pangium edule) and Pra (Elateriospermum tapos) Seeds Final Year Project Food Science and Technology in the Faculty of Applied Sciences Universiti Teknologi Mara Malaysia January 2012 Retrieved on July 4 2012 from httpeprintsptaruitmedumy49401MOHD_ASRUL_BIN_ABDULLAH_12_24pdf
56 Ma A A Peranakan favorite is ayam buah keluak Chicken stewed with black nuts at True Blue RestaurantWall Street Journal (Online) New York NY Dec 16 2010 Retrieved July 4 2012 from httpproquestumicompqdwebdid=2214039511ampsid=1ampFmt=3ampclientId=36305ampRQT=309ampVName=PQD
57 Fardiaz D Romlah S Antioxidant activity of picung (Pangium edule Reinw) seed In Development of Food Science and Technology in ASEAN Proceedings of the Fourth ASEAN Food Conference February 17ndash21 1992 ASEAN Jakarta Indonesia 1992 814ndash819
58 Food and Drugs Administration Food Additives Permitted for Direct Addition to Food for Human Consumption Code of Federal Regulations Title 21 pt 172190 2006
59 Kerler J Grosch W Character impact odorants of boiled chicken changes during refrigerated storage and reheating Zeitschrift Fur Lebensmittel-Untersuchung Und-Forschung A-Food Research and Technology 1997 205 232-238
60 Baggio S Vicente E Bragagnolo N Cholesterol oxides cholesterol total lipid and fatty acid composition in turkey meat J Agric Food Chem 2002 50 5981-5986
32
CHAPTER 3 MATERIALS AND METHODS
31 Keluak Antioxidant and Chemicals
Keluak (Kupas Wayang Brandreg Peeled Keluak Nuts PT Wira Aksara
Jakarta Indonesia was manufactured for Empire International East Chief
Privado Ontario CA 91761) Butylated hydroxytoluene (BHT) gallic acid (ACS
reagent) and 2-thiobarbituric acid were obtained from Sigma Chemical
Company St Louis MO USA Sodium chloride (crystal ARreg ACS) was obtained
from Mallinckrodt Baker Inc (Phillipsburg NJ USA)
The reagents used included acetone (Certified ACS) and chloroform (certified
ACS) obtained from Fisher Scientific Fair Lawn NJ USA Acetic acid (Glacial
ACS reagent) was purchased from J T Baker (Center Valley PA 18034 USA)
and Folin Ciocalteursquos phenol reagent (2 N) was purchased from Sigma-Aldrich
(St Louis MO USA)
311 Phenolic Extraction
Keluak seeds were ground into fine pieces using a coffee grinder (Braun
Inc Lynnfield MA USA) The fatty material from the ground seed was removed
first using a method modified from Wettasinghe and Shahidi (1) The ground seed
was washed with n-hexane (16 gg) and placed in a sonicator for 15 minutes
with occasional stirring The mixture was vortexed for 30 secs before it was
centrifuged at 2688 x g for 10 minutes (Sorvallreg Instrument RC-5B Du Pont
Company Wilmington DE USA) The upper fat-soluble layer was discarded
The solid was washed 2 ndash 3 additional times The solids remained at the bottom
after washing The defatted solids were then air-dried overnight under the hood
to remove any solvent residue
Forty grams of dried defatted Keluak seeds were extracted by stirring with
200 mL of solvent (acetone water acetic acid 90 95 05 vvv) at 60degC and
600 rpm for 2 hrs The mixture was then filtered through filter paper (Whatman
1 Buckinghamshire UK) The filtrate was collected and dried at 45degC using a
rotary evaporator until no further weight changes occurred The concentrated
extract was further dried using a vacuum oven at 45degC overnight The extract was
33
collected dissolved in 100 ethanol flushed with Argon gas and stored at -20degC
until further use
312 Total Phenolics content
The total phenolic content was measured using the Folin-Ciocalteu assay
as modified by Waterhouse (13) The phenolic extract was diluted with 100
ethanol to make several dilutions (1100 2100 and 10100) One milliliter of each
dilution was added to a test tube containing 5 mL of deionized water Then 05
mL of 50 Folin-Ciocalteu reagent was added to the test tube The solution was
mixed and allowed to stand for 8 mins at 22degC before adding 1 mL of 5 sodium
carbonate (wv) The mixture was vortexed using a touch mixer (model 231
Fisher Scientific Pittsburgh PA USA) and incubated in the dark for 1 hr The
solution was vortexed a second time before reading the absorption with a UV-
spectrophotometer (Spectronic Genesys 5 spectrophotometer Thermo Electron
Corporation Madison WI USA) at 725 nm against DI water A standard curve
was prepared at the same time with gallic acid at concentrations ranging from 0
to 100 mgL The quantity of total phenolic content in the sample was calculated
as gallic acid equivalents (GAE) from the standard curve using the formula
C = c times (V divide m) where
C is total phenolic content (mg GAEg extract)
c is the concentration of gallic acid obtained from the calibration curve (mgmL)
V is volume of sample (mL)
m is mass of the sample extract (g)
32 Sample Preparation
Ground turkey meat (15 fat Jennie-O Turkey Store Wilmar MN USA)
purchased from a local grocery store at day 0 and was immediately divided into 4
treatments according to the formulation (Table 31) (2 3)
(1) Control- No antioxidant
(2) Commercial antioxidant- 002 BHT (ww of lipid)
(3) Natural antioxidant- 002 Keluak extract (ww of lipid)
34
(4) Natural antioxidant ndash 004 Keluak extract (ww of lipid)
The level of Keluak extract antioxidant used was based on the amount of
fat in each formula Salt was dissolved in water prior to addition to the meat The
water addition was 5 of the ground meat (ww) The antioxidant and salt were
mixed in the liquid first before adding it to the meat by sprinkling while mixing
After the antioxidant salt and liquid addition mixing by hand (wearing gloves)
was continued for 5 mins The meat mixture was prepared into patties of uniform
size (using a cookie cutter diameter= 55 cm thickness= 15 cm) The patties
were cooked in an electrical skillet and temperature was monitored by Digi-
Sensereg Scanning Thermometer (Model 92000-00 Cole Parmer Instrument Co
Barrington IL) using copper-constantin thermocouple wires (Type T Omega
Engineering Inc Stamford CT) to an endpoint temperature of 74degC The cooked
patties were cooled and placed in a single layer on a tray and then overwrapped
in commercial PVC (water vapor transmission rate=15 g100 m224 h oxygen
transmission rate 880 cm3m224 h) and aluminum foil over the wrap The
patties were stored at 2degC in the dark and were assayed for the extent of oxidation
by odor sensory TBARS conjugated dienes and peroxide value analysis at days
0 1 3 5 7 for the first study (2)
In a second separate study a longer storage time study was completed to
examine the effect of antioxidants on the cooked ground turkey over a longer
time period The same procedure for antioxidant addition and meat sample
preparation was used However in the second study the samples were stored for
a total of 15 days (5 6) Samples were collected at days 0 1 3 5 7 10 13 15 for
TBARS conjugated dienes peroxide values and pH determinations
33 Thiobarbituric Acid Reactive Substances (TBARS)
Lipid oxidation was assessed by the 2-thiobarbituric acid (TBA) method of
Tarladgis and others (4) and Yu et al (5) Briefly 10 g of meat was homogenized
with 50 mL of deionized water using a homogenizer (IKAreg T25 digital Ultra-
Turrax Wilmington NC USA) The homogenate was filtered through 1
Whatman paper Five mL of the clear filtrate was mixed with 5 mL TBA reagent
35
containing 002 M TBA in 90 glacial acetic acid The mixture was capped
vortexed for 30 secs and incubated in the dark for 15-18 hrs at room temperature
After the color developed the mixture was measured for absorbance at 532 nm
against a blank (deionized water) The absorbance was converted to TBAR values
using 1133- tetraethoxypropane to prepare a standard curve Triplicates of 10 g
samples were prepared for each treatment TBA value is expressed as mg MDA
kg meat
34 Conjugated Dienes
Conjugated dienes (CD) were determined by the method described by
Juntachote and others (6) with slight modifications A cooked meat sample (05
g) was suspended in 5 mL of deionized water and homogenized using a digital
Ultra-Turrax T25 (IKAreg Wilmington NC USA) to obtain a smooth slurry A 05
mL aliquot of this suspension was mixed with 5 mL of extracting solution
containing hexane and isopropanol (31 vv) and mixed for 1 min using a vortex
mixer After centrifugation at 2000 g for 5 mins the supernatant was collected
and the absorbance of the supernatant was determined at 233 nm The
concentration of conjugated dienes was calculated using a molar extinction
coefficient of 25200 M-1cm-1 and the result were expressed as nmole of
conjugated dienes per mg meat sample
35 Peroxide Value
The peroxide value was determined according to the AOAC method 96533
(Association of Official Analytical Chemists) (13) with a few modifications The
lipids from meat samples were extracted by the method of Kim et al (7) First 5 g
of meat sample was broken into small pieces and placed in a water bath at 60˚C
to melt the fat for 30 mins The meat was extracted with a solution containing
acetic acid chloroform (32) and then filtered with Whatman 1 filter paper A
saturated solution of potassium iodide (KI 05 mL) was added to the filtrate The
solution color changed to yellow and then 30 mL of deionized water was added
The mixture was allowed to let stand at room temperature for at least 5 mins and
the color would turn to pale to bright yellow Before titrating with 001 N of
36
sodium thiosulfate (Na2SO3) 05 mL of 1 starch solution was added (a color
changed occurred - the color turned purple to blue-black) The PV is expressed as
meq O2kg lipid
36 pH value
To determine the pH of the meat samples cooked meat samples (10 g)
were blended with 50 mL deionized water for 15 seconds in a homogenizer
(Ultra-Turrax T25 IKAreg Wilmington NC USA) The pH was measured with a
pH meter (Accumet Basic model AB 15 Fisher Scientific Company) The pH
meter was calibrated daily with standard buffers of pH 40 and 70 at 25˚C
37 Sensory Evaluation
Trained panelists (n=15) were recruited from among University of Illinois
graduate students and staff The panelists were prepared using an extensive
training program During each training session panel members practiced and
discussed the techniques developed for sample presentation score sheet terms
and odor sensory evaluation method A panel leader led the panelists to develop
terms to describe the aroma characteristics of fresh cooked turkey meat including
the aroma characteristics of cooked poultry with or without the added Keluak
extract Panel members were trained regularly for 7 sessions for total of two
weeks to identify and discriminate aroma differences Some of the terms were
derived from reference standards including fresh boiled ground turkey meat
lard oxidized vegetable oil hard-boiled egg and wet cardboard (Table 32) The
panelists agreed on the following aroma descriptors for warm-over-flavor meaty
fatty rancid eggy and cardboardy These descriptors were judged for the
presence and overall intensity using a 15 cm-structured line scale (0 = none 15 =
extreme) along with an anchor value for each respective standard Table 2
showed the form used to evaluate the aroma descriptors described above
Cooked patties were uniformly cut into four pie-shaped wedges and placed
in a sniff bottle (Nalgene Teflon PTFE wash bottle Nalge Company Rochester
NY USA) covered with foil to hide the identity of the sample inside Each sample
represented a treatment labeled with three-digit random numbers and were
37
served at random order during each test session The samples were held in an
incubator (45degCplusmn 1degC) for 30 mins prior to presentation to the panelists The
panelists were asked to clean their palate by chewing a piece of unsalted saltine
crackers and rinse with water prior to evaluating the samples Samples were
sniffed Four samples were evaluated for each test session Roasted coffee beans
were presented for panelists to clear the palate between samples Standard
references were prepared daily The second session replicates of the first session
was conducted one week after the first session
38 Statistical Analysis
Statistical assessment was carried out with the program SAS Data were
analyzed as 4 (treatments) by 5 (days of storage) The results from the TBARs
analysis peroxide value analysis conjugated dienes analysis and the
odorsensory analysis were analyzed using one-way analysis of variance
(ANOVA) Differences were considered significant at the P lt 005 level
Comparison of treatment means was based on Fisherrsquos Least Significant
Difference (LSD)
38
39 Tables
Table 31 Formulation of Cooked Ground Turkey Meat for Each Treatment
TREATMENTS
Control BHT AO 200ppm AO 400ppm
INGREDIENTS
Jenny-O 15 fat Ground Turkey
(g) 650 650 650 650
Salt (2 ww) (g) 13 13 13 13
BHT (002 of total fat) (g) 002
Keluak extract (mL)
2487 (002 g
phenolics)
4974 (004 g
phenolics)
Cold water (mL)5 by sample wt
(ww) 325 325 325 325
Table 32 Descriptive Odor Standards for Refrigerated Ground Turkey Meat
Descriptive Odor term Standard Location on the 15-cm line
Rancid Oxidized vegetable oil in water (1100 vv) 7
Cardboard 1 cm2 cardboard in 15 mL water 85
Eggy Fresh hard-boiled egg white (01 g) 9
Meaty Fresh boiled ground turkey meat in water (15 gv) 8
Fatty Lard (02 g) 9
39
310 References
1 Wettasinghe M Shahidi F Antioxidant and free radical-scavenging properties of ethanolic extracts of defatted borage (Borago officinalis L) seeds Food Chem 1999 67 399-414
2 Vara-Ubol S Bowers J Effect of alpha-tocopherol beta-carotene and sodium tripolyphosphate on lipid oxidation of refrigerated cooked ground turkey and ground pork J Food Sci 2001 66 662-667
3 Hassan O Fan L The anti-oxidation potential of polyphenol extract from cocoa leaves on mechanically deboned chicken meat (MDCM) Lwt-Food Science and Technology 2005 38 315-321
4 Tarladgis B Dugan L Pearson A Chemistry of 2-Thiobarbituric Acid Test for Determination of Oxidative Rancidity in Foods 2 Formation of Tba-Malonaldehyde Complex without Acid-Heat Treatment J Sci Food Agric 1964 15 602-amp
5 Yu L Scanlin L Wilson J Schmidt G Rosemary extracts as inhibitors of lipid oxidation and color change in cooked turkey products during refrigerated storage J Food Sci 2002 67 582-585
6 Juntachote T Berghofer E Siebenhandl S Bauer F The antioxidative properties of Holy basil and Galangal in cooked ground pork Meat Sci 2006 72 446-456
7 Kim YJ Jin SK Park WY Kim BW Joo ST Yang HS The Effect of Garlic Or Onion Marinade on the Lipid Oxidation and Meat Quality of Pork during Cold Storage J Food Qual 2010 33 171-185
8 Chye FY Sim KY Antioxidative and Antibacterial Activities of Pangium edule Seed Extracts International Journal of Pharmacology 2009 5 285-297
9 Kahkonen M Hopia A Vuorela H Rauha J Pihlaja K Kujala T Heinonen M Antioxidant activity of plant extracts containing phenolic compounds J Agric Food Chem 1999 47 3954-3962
10 Jayaprakasha G Selvi T Sakariah K Antibacterial and antioxidant activities of grape (Vitis vinifera) seed extracts Food Res Int 2003 36 117-122
11 Fardiaz D Romlah S Antioxidant Activity of Picung (Pangium edule Reinw) Seed In Development of Food Science and Technology in ASEAN Proceedings of the 4th ASEAN Food Conference Feb 17-21 1992 ASEAN Jakarta Indonesia 1992 12 Waterhouse A L Determination of Total Phenolics Current Protocols in
Food Analytical Chemistry 2002 I111-I118
40
13 Association of Official Analytical Chemists (1995) Official methods of analysis (16th ed) Washington DC Association of Official Analytical Chemists
41
Chapter 4 RESULTS AND DISCUSSION
41 Phenolic Extraction Yield
The phenolic extract yield using acetone water acetic acid (90 95 05)
extraction was 503 plusmn 140 g of extract per 70 g of defatted ground Keluak seed or
007 g phenolic extract per gram of defatted Keluak The samples contained
approximately 719 phenolic compounds by weight the values are equal to the
average plusmn standard deviation of the three replicate analyses This value was
moderately greater than that reported by Chye and Sim (1) which reported a
548 yield The total phenolic content as determined using Folin-Ciocalteau
reagent was 1973 plusmn 203 mg GAEg extract which was also moderately greater
than the result reported by Chye and Sim which was 1639plusmn 004 mg GAEg
extract (1) It is possible that the difference is due to the Keluak source Chye and
Sim obtained their seeds material from local indigenous markets in Kota
Kinabalu Sabah Malaysia (1) while the seeds used in this study were grown in
from Indonesia The geographical and horticultural differences could affect the
phenolic content and concentration of the seed
According to Kahkonen et al (2) different phenolic compounds can have
different responses in the Folin Ciocalteau method depending on their chemical
structure Therefore the antioxidant activity of an extract cannot be predicted
solely on its total phenolic content (3 4)
42 Effect of Keluak Extract and storage time on TBARS values during
refrigerated storage of cooked ground turkey
The TBARS values represent the content of secondary lipid oxidation
products particularly malonaldehyde The carbonyls are primarily responsible
for the production of off-flavors in oxidized meat and meat products Aldehydes
are formed by the oxidation of unsaturated fatty acids They react with the TBA
reagent to form a pink complex (TBA chromogen) with a maximum absorbance
at 532 nm The intensity of this pink color is directly related to the concentration
of the TBA-reactive substances in the original sample The results of the TBARs
analysis for the preliminary study (7 days) and the extended storage study (15
days) are shown in Tables 41a b and Figures 41a b respectively Overall lipid
42
oxidation increased substantially as the refrigerated storage progressed due to
the effects of heating and in combination with storage under aerobic conditions
On the first day of analysis for both the 7 and 15 days storage study all the
antioxidant treated samples (BHT and both concentrations of the Keluak
extracts) the TBARS values were significantly lower than the control an
indication that the antioxidants had a positive effect in suppressing oxidation
Similar findings were observed by Juntachote et al and Teets et al (5 6) TBARS
values for both 7 and 15 days storage study ranges from 035- 475 mg MDA kg
meat which was comparable to other study by Juntachote (5) for 14 days of
storage study of pork meat There were examining the effect other natural
sources of antioxidants on oxidation during refrigerated storage of cooked meat
During the preliminary study (Table 41a) the control and BHT treatments
did not show significant differences (Pgt005) from day 1-7 However both of the
Keluak extract treatments showed a significant (Plt005) effect on the
suppression of the progression of lipid oxidation as compared to the control
(Figure 41a)
On the other hand during the 15 day study all the samples with added
antioxidants had significantly lower TBAR values compared to the control
throughout the entire storage period This indicates that both the commercial
treatment and the treatment with Keluak extracts provided substantial protection
to the meat with respect to lipid oxidation The efficacy of the Keluak extracts to
inhibit lipid oxidation is probably related to their phenolic content The results of
this study showed agreement with those obtained by Fardiaz and Romlah (14)
which stated that the addition of Keluak extract to palm oil lengthened the
oxidation induction period from 22 hours to 50 hours
Lipid oxidation was considerably greater with longer storage times due to
the exposure to oxygen TBARs measure the formation of secondary lipid
oxidation products which contribute to WOF in oxidized meat Heat increases the
release of non-heme iron from the heme pigments a major catalyst for lipid
oxidation in cooked meats (7) Cooking also alters cellular compartmentalization
and exposes membrane phospholipids to molecular oxygen and metal ions (8)
43
resulting in greater amounts of lipid oxidation (9) The addition of antioxidants
during processing cooking or packaging can be done to increase the oxidative
stability of cooked meat (10)
43 Effect of Keluak Extract and Storage Time on Conjugated Diene
Content during Refrigerated Storage of Cooked Ground Turkey
Meat
The development of conjugated dienes (CD) is related to the formation of
hydroperoxides found in the extracted lipids of the cooked ground turkey
Unsaturated fatty acid double bonds occur naturally in a methylene interrupted
structure As meat begins to oxidize the double bonds of these fatty acids are
altered creating conjugated systems which can be measured
spectrophotometrically (6) During lipid peroxidation non-conjugated double
bonds (C=CndashCndashC=C) which are present naturally in unsaturated lipids are
converted to conjugated double bonds (C=CndashC=C) with a large increased in
absorption at 232ndash234 nm (11) In the preliminary study there were no significant differences among the
antioxidant treated sample and the control (Pgt005) except on day 5 (Figure 42a
and Table 42a) The CD value for all the treatments peaked at day 5 and the
samples treated with antioxidants were significantly different that the control
(Plt005)
Meanwhile during the second storage study (Table 42b and Figure 42b)
when the CD values were compared to the control on day 0 and day 1 the 002
BHT and both of the Keluak extract treated samples were not significantly
different (Pgt005) However from day 3 on all the antioxidant-treated samples
had less CD formation than the control (Plt005) The CD content of the control
generally increased especially during the last 5 days (Day 10 13 and 15) of the
study Additionally cooked ground turkey treated with Keluak at 400 ppm had
slightly lower concentrations of conjugated dienes compared to cooked ground
turkey containing Keluak extract at 200 ppm and the commercial antioxidant
(BHT) The trend of CD formation was similar to several other studies (5 6 12
13) They generally observed that the CD concentration for most samples peaked
44
on Day 3 and decreased thereafter This phenomenon of decreased CD is likely
due to the decomposition of the conjugated diene hydroperoxides into secondary
oxidation products over time Conjugated dienes hydroperoxides are expected to
decompose into secondary products as was observed in this study According to
Frankel (15) the formation of conjugated dienes which is related to the
production of hydroperoxides occurs in the early stages of lipid oxidation According to Estevez et al (17) measurement of conjugated dienes (CD) in
meat products containing elevated levels of PUFA is limited depending on the
fatty acid composition of the sample as well as the presence of other non-
hydroperoxides CDs In agreement with Grau et al (18) the TBA test showed a
higher sensitivity with respect to lipid oxidation than did the CD determination
44 Effect of Keluak extract and storage time on peroxide value during
refrigerated storage of cooked ground turkey
Peroxide values (PV) were also used to assess the level of lipid oxidation in
cooked ground turkey during storage at 2˚C (Table 43 and Figure 43) However
while there were differences between the control and samples treated with AOs
on a few days the result of this study showed that treatments had no significant
effect (Pgt005) on the peroxide values compared to the control Generally based
on the results in Table 4 and Figure 4 the PVs increased during storage and
peaked on day 10 At the time it is possible that much of the polyunsaturated
membrane lipids may have been oxidized at that point so that further storage
and oxidation resulted in a decrease in the concentration of peroxides and thus
the PV
The PV differences among the samples did not provide proof that any of
the AOs were effective It is not clear why the PV analysis did not provide any
evidence of AO efficacy According to Estevez (17) the sensitivity of this method
is about 05 miliEquivalentkg of lipid Lower peroxide values cannot be
measured satisfactorily by the AOCS method because of the uncertainty with the
iodometric titration endpoint unless the iodine-starch end is determined
potentiometrically at levels as low as 006 Eqkg lipid The iodometric method is
highly empirical and very small procedural differences can cause variation in the
45
results (19) Two major sources of error in this test could be the liberation of
iodine by air oxidation of the KI and absorption of iodine by fatty acid double
bonds (17)
4 5 Effect of Keluak Extract and storage time on Odor of Refrigerated
Cooked Ground Turkey
No significant interaction (Pgt 005) occurred between antioxidant and
storage time for most of the odor characteristics (Tables and Figures 44-48)
For meaty odor characteristic (Figure and Table 44) the score of all the
treatments over the 7 days of storage did not show significant differences
(Pgt005) The scores ranged from 502 ndash 783 which was slightly below the
freshly boiled turkey meat standard for meaty (which was ranked 8 in the 15-cm
line scale) Therefore the panelists were unable to score and detect the cooked
meat aroma differences in the treated samples relative to the standard reference
The meaty aroma in this study was used to determine if there were possible
masking effects from the AO treatments
For the rancid odor (Figure and Table 45) both of the Keluak treated
samples were perceived as more rancid than both control and BHT after day 1
Overall both of the Keluak treated samples were ranked higher than the control
and BHT which disagrees with the results of TBA test However there was no
significant difference among the treatments between day 3-7 According to Ruth
(20) rancidity as a measure of lipid oxidation is usually best measured by the
concentration of TBARS
The minimum TBA values that corresponds to dark chicken meat samples
that were significantly different in rancid aroma was 1933 μg MDAkg of meat
(21) For consumer acceptability the TBA values must be less than 785 μg of
MDAkg (21) The results from Bou et al (21) were comparable to the results
reported by Gray and Pearson (22) showing that rancid flavor in meats is initially
detected between 500 and 2000 μg of MDAkg of meat In addition OrsquoNeill et
al (23) found that the threshold for WOF detection in cooked dark chicken meat
was at TBA values ge800 μg of MDAkg of meat Since chicken and turkey meat
46
have a comparable PUFA content those values were considered useful in this
experiment On the other hand the odor score for Eggy cardboard and fatty were
statistically not different (Pgt 005) Panelists were unable to detect differences
which could be to different reasons such as that Keluak extract has an aroma
masking effect that confuses the panelists with the ldquooff-odorrdquo The Keluak did
have a slight aroma and it is likely that it masked the effects of storage on lipid
oxidation The aroma of Keluak has been described as bitter dirt-like and
chocolate-like odor (16) This aroma masking could be perceived as undesirable
by the panelists and it might have been mistaken as an off-odor or as an oxidized
sample even though the TBARs and CD data showed otherwise
4 6 Effect of Keluak Extract and storage time on pH of Refrigerated
Cooked Ground Turkey
Table 49 shows the effect of antioxidant treatments in pork muscle on pH
values during storage at 2˚C The values of the pH ranged between 633-668
Generally there are no correlations of pH value among the treatments during
storage The trend for the pH value is inconclusive
47
47 Figures Figure 41a The profile of TBARS in cooked ground turkey treated with various
antioxidants during storage at 2˚C- A Preliminary Study
K200 and K400 represent treatments with Keluak extract at concentration of 200 and 400 ppm respectively
0000
1000
2000
3000
4000
5000
6000
0 2 4 6 8
TBA
RS
(mg
MD
Ak
g m
eat
)
Storage Days
Control
BHT
K200
K400
48
Figure 41b The profile of TBARS in Cooked Ground Turkey Treated with Various Antioxidants During Storage at 2˚C- Extended Storage Time
K200 and K400 represent Keluak extract at concentration of 200 and 400 ppm respectively
Figure 42a Conjugated dienes values of different antioxidant treatments over storage at
2˚C - A Preliminary Study
K200 and K400 represent treatments with Keluak extract at concentration of 200 and 400 ppm
respectively
000
100
200
300
400
500
600
0 5 10 15 20
TBA
RS
(mg
MD
Ak
g m
eat
)
Storage time (days)
Control
BHT 002
K200
K400
0000
0050
0100
0150
0200
0250
0300
0350
0400
0450
0 1 2 3 4 5 6 7 8
Co
nju
gate
d D
ien
es
(nm
ol
mg
me
at)
Days
Control
BHT
K200
K400
49
Figure 42b Conjugated dienes values of different antioxidant treatments over storage at
2˚C- Extended Storage Time
K200 and K400 represent treatments with Keluak extract at concentration of 200 and 400 ppm respectively
Figure 43 Peroxide Value (meq kg meat) of Different Antioxidant treatments over
Storage at 2˚C
K200 and K400 represent treatments with Keluak extract at concentration of 200 and 400 ppm
respectively
000
002
004
006
008
010
012
014
016
0 5 10 15 20
Co
nju
gate
d D
ien
es
(nm
ol
mg
me
at)
Storage (days)
Control
BHT 002
K200
K400
0
05
1
15
2
25
3
35
4
0 2 4 6 8 10 12 14 16
PV
(m
eq
kg
me
at)
Storage Time (Days)
Control
BHT 002
K200
K400
50
Figure 44 Intensity of Meaty Odor Descriptor in Cooked Ground Turkey Meat Treated
with Different Antioxidants Rated in a 15-cm Line Scale
K200 and K400 represent Treatment with Keluak extract at concentration of 200 and 400 ppm
respectively
Figure 45 Intensity of Rancid Odor Descriptor in Cooked Ground Turkey Meat Treated
with Different Antioxidants Rated in a 15-cm Line Scale
K200 and K400 represent Treatment with Keluak extract at concentrations of 200 and 400 ppm
respectively
000
200
400
600
800
1000
1200
0 2 4 6 8
15
cm
Lin
e s
cale
(av
era
ge)
Days
CONTROL
BHT
K200
K400
Linear (BHT)
-100
000
100
200
300
400
500
600
700
800
0 2 4 6 8
15
cm
Lin
e s
cale
(av
era
ge)
Days
Control
BHT
K200
K400
51
Figure 46 Intensity of Eggy Odor Descriptor in Cooked Ground Turkey Meat Treated
with Different Antioxidants Rated in a 15-cm Line Scale
K200 and K400 represent Treatment with Keluak extract at concentrations of 200 and 400 ppm
respectively
Figure 47 Intensity of Cardboard Odor Descriptor in Cooked Ground Turkey Meat
Treated with Different Antioxidants Rated in a 15-cm Line Scale
K200 and K400 represent Treatment with Keluak extract at concentrations of 200 and 400 ppm
respectively
000
100
200
300
400
500
600
700
800
900
1000
0 2 4 6 8
15
cm
Lin
e s
cale
(av
era
ge)
Days
Control
BHT
K200
K400
-1
0
1
2
3
4
5
6
7
0 2 4 6 8
15
cm
Lin
e s
cale
(av
era
ge)
Days
Control
BHT
K200
K400
52
Figure 48 Intensity of Fatty Odor Descriptor in Cooked Ground Turkey Meat Treated
with Different Antioxidants Rated in a 15-cm Line Scale
K200 and K400 represent Treatment with Keluak extract at concentrations of 200 and 400 ppm
respectively
000
100
200
300
400
500
600
700
800
900
0 2 4 6 8
15
cm
Lin
e s
cale
(av
era
ge)
Days
Control
BHT
K200
K400
53
48 Tables
Table 41a TBARS Value of Cooked Ground Turkey Meat Treated with Various Antioxidants during Storage at 2˚C- A Preliminary Study
TBARS (mg MDAkg meat) Average
Storage (Day) Control BHT 002 Keluak 200ppm Keluak 400ppm
0
131plusmn009Aa 094plusmn021Ba 050plusmn004Ca 037plusmn010Ca
1
189plusmn003Aab 161plusmn025Aab 080plusmn006Ba 057plusmn026Bab
3
243plusmn010Ac 236plusmn025Abc 111plusmn022Bab 055plusmn008Cab
5
397plusmn016Ad 319plusmn064Acd 170plusmn025Bbc 108plusmn023Bb
7
473plusmn076Ad 373plusmn074ABd 217plusmn040ACc 101plusmn044Cab
Different letters (A-D) within a row indicates that mean values are significantly different (Plt 005) Different letters within a column (a-d) within the same treatment are significantly different (Plt005)
Table 41b TBARS Value of Cooked Ground Turkey Meat Treated with Various Antioxidants during Storage at 2 ˚C- Extended Storage Time
TBARS (mg MDAkg meat) Average
Storage (day) Control BHT 002 K200 K400
0 129 plusmn 008Ae 091plusmn 004Bcd 065plusmn 015Be 101plusmn 003Cf
1 159plusmn 008Ade 076plusmn 005Cd 083plusmn 012Ce 127plusmn 006Bf
3 220plusmn 011Acd 074plusmn 004Dd 119plusmn 003Cd 160plusmn 004Be
5 258plusmn 014Ac 082plusmn 006Cd 076plusmn 014Ce 150plusmn 004Bd
7 377plusmn 001Ab 109plusmn 002Ccb 158plusmn 006Bc 160plusmn 006Bd
10 405plusmn 061Aab 121plusmn 009Bb 197plusmn 012Bb 195plusmn 009Bc
13 465plusmn 014Aa 151plusmn 004Ca 224plusmn 003Bab 218plusmn 003Bb
15 459plusmn 024Aa 154plusmn 013Da 231plusmn 014Ca 284plusmn 010Ba
Different letters (A-D) within a row indicates that mean values are significantly different (Plt 005) Different letters within a column (a-f) within the same treatment are significantly different (Plt005)
K200 and K400 represent treatments with Keluak extract at concentration of 200 and 400 ppm
respectively
54
Table 42a Conjugated Dienes Concentrations with Antioxidant Treatments and Storage
At 2˚C- A Preliminary Study
Conj Dienes (nmolemg meat)
Storage (Days) Control BHT 002 K200 K400
0 015plusmn003Abc 022plusmn001Aa 013plusmn001Ab 020plusmn008Aa
1 012plusmn001Abc 012plusmn003Ab 011plusmn001Ab 019plusmn001Bab
3 006plusmn000Ac 003plusmn002Ac 002plusmn002Ab 004plusmn002Ab
5 038plusmn000Aa 024plusmn001Ba 027plusmn007ABa 021plusmn001Ba
7 023plusmn008Ab 026plusmn001Aa 029plusmn003Aa 016plusmn001Aab
Different letters (A-C) within a row indicates that mean values are significantly different (Plt 005) Different letters within a column (a-d) within the same treatment are significantly different (Plt005)
K200 and K400 represent treatments with Keluak extract at concentration of 200 and 400 ppm
respectively
Table 42b Conjugated Dienes Concentrations After Antioxidant Treatments and
Storage At 2˚C- Extended Storage Time
Conjugated Dienes (nM mg meat)
Storage (Days) Control BHT 002 K200 K400
0 013plusmn 001Aab 009plusmn000Bab 010plusmn 000Ba 010plusmn 001Ba
1 008plusmn 001Ac 008plusmn 001Ab 008plusmn 000Abc 007plusmn 001Ab
3 011plusmn 000Ab 009plusmn 001Bab 008plusmn 000Bbc 006plusmn 000Cb
5 012plusmn001Ab 008plusmn 001B b 006plusmn 000Bd 006plusmn 000Bb
7 011plusmn001Abc 008plusmn 000B ab 006plusmn 001Bcd 007plusmn 000Bb
10 014plusmn 000Aa 009plusmn 000Bab 009plusmn 001Bab 007plusmn 000Cb
13 014plusmn 001Aa 009plusmn 000Bab 008plusmn 000Bbc 006plusmn 000Cb
15 014plusmn 000Aa 010plusmn 001Ba 008plusmn 001BCbcd 007plusmn 000Cb
Different letters (A-C) within a row indicates that mean values are significantly different (Plt 005) Different letters within a column (a-d) within the same treatment are significantly different (Plt005)
K200 and K400 represent treatments with Keluak extract at concentration of 200 and 400 ppm
respectively
55
Table 43 Peroxide Value (meq kg meat) of Different Antioxidant treatments during
Storage of cooked ground turkey meat at 2˚C
PV (meq kg meat)
Storage (Days) Control BHT 002 K200 K400
0 110plusmn 042Abc 070plusmn 014Ae 080plusmn 028Ad 130plusmn 014Acd
1 230plusmn 014Aab 130plusmn 014Bd 090plusmn 014BCd 070plusmn 014Cd
3 080plusmn 000Ac 070plusmn 014Ae 070plusmn 014Ad 070plusmn 014Ad
5 280plusmn 028Aa 140plusmn 000Bcd 110plusmn 014Bcd 080plusmn 028Bd
7 170plusmn 042Aabc 190plusmn 014Ac 195plusmn 021Abc 225plusmn 049Abc
10 310plusmn 042Aa 330plusmn 014Aa 290plusmn 042Aa 340plusmn 028Aa
13 255plusmn 007Aa 265plusmn 021Ab 240plusmn 028Aab 260plusmn 028Aab
15 255plusmn 064Aa 150plusmn 014ABcd 086plusmn 006Bd 100plusmn 028Bd
Different letters (A-C) within a row indicates that mean values are significantly different (Plt 005) Different letters within a column (a-e) within the same treatment are significantly different (Plt005)
K200 and K400 represent Treatment with Keluak extract at concentrations of 200 and 400 ppm
respectively
Table 44 Intensity of Meaty Odor Descriptor in Cooked Ground Turkey Meat Treated with Different Antioxidants Rated in a 15-cm Line Scale
Storage (Day) Control BHT 002 K200 K400
0 595plusmn250Aa 727plusmn144Aa 632plusmn202Aa 606plusmn189Aa
1 783plusmn208Aa 731plusmn174ABa 543plusmn220Ba 542plusmn294Ba
3 613plusmn201Aa 693plusmn143Aa 502plusmn266Aa 552plusmn228Aa
5 734plusmn277Aa 710plusmn290Aa 474plusmn253Aa 487plusmn263Aa
7 694plusmn296Aa 751plusmn265Aa 532plusmn259Aa 543plusmn236Aa
Different letters (A-C) within a row indicates that mean values are significantly different (Plt 005) Different letters within a column (a-b) within the same treatment are significantly different (Plt005)
K200 and K400 represent Treatment with Keluak extract at concentrations of 200 and 400 ppm
respectively
56
Table 45 Intensity of Rancid Odor Descriptor in Cooked Ground Turkey Meat Treated
with Different Antioxidants Rated in a 15-cm Line Scale
Storage (Day) Control BHT 002 K200 K400
0 228plusmn194Aa 193plusmn175Aa 334plusmn231Aa 350plusmn274Aa
1 177plusmn194Aa 172plusmn163Aa 392plusmn274ABa 426plusmn265Ba
3 260plusmn210Aa 272plusmn265Aa 419plusmn306Aa 337plusmn247Aa
5 344plusmn255Aa 329plusmn215Aa 427plusmn248Aa 395plusmn253Aa
7 408plusmn300Aa 289plusmn244Aa 448plusmn241Aa 385plusmn244Aa
Different letters (A-B) within a row indicates that mean values are significantly different (Plt 005) Different letters within a column (a-b) within the same treatment are significantly different (Plt005)
K200 and K400 represent Treatment with Keluak extract at concentrations of 200 and 400 ppm
respectively
Table 46 Intensity of Eggy Odor Descriptor in Cooked Ground Turkey Meat
Treated with Different Antioxidants Rated in a 15-cm Line Scale
Storage (Day) Control BHT 002 K200 K400
0 643plusmn242Aa 513plusmn244Aa 502plusmn324Aa 565plusmn287Aa
1 597plusmn248Aab 476plusmn321Aa 599plusmn332Aa 584plusmn360Aa
3 345plusmn258Ab 400plusmn270Aa 515plusmn335Aa 509plusmn425Aa
5 364plusmn303Aab 424plusmn320Aa 475plusmn269Aa 469plusmn180Aa
7 473plusmn306Aab 364plusmn210Aa 485plusmn268Aa 431plusmn305Aa
Different letters (A-C) within a row indicates that mean values are significantly different (Plt 005) Different letters within a column (a-e) within the same treatment are significantly different (Plt005)
K200 and K400 represent Treatment with Keluak extract at concentrations of 200 and 400 ppm
respectively
57
Table 47 Intensity of Cardboard Odor Descriptor in Cooked Ground Turkey Meat
Treated with Different Antioxidants Rated in a 15-cm Line Scale
Storage (Day) Control BHT 002 K200 K400
0 299plusmn222Aa 209plusmn182Aa 261plusmn198Aa 312plusmn157Aa
1 262plusmn249Aa 180plusmn192Aa 339plusmn238Aa 342plusmn229Aa
3 299plusmn203Aa 284plusmn254Aa 388plusmn235Aa 287plusmn185Aa
5 252plusmn243Aa 290plusmn190Aa 309plusmn193Aa 320plusmn204Aa
7 301plusmn210Aa 273plusmn253Aa 337plusmn195Aa 284plusmn205Aa
Different letters (A-C) within a row indicates that mean values are significantly different (Plt 005) Different letters within a column (a-e) within the same treatment are significantly different (Plt005)
K200 and K400 represent Treatment with Keluak extract at concentrations of 200 and 400 ppm
respectively
Table 48 Intensity of Fatty Odor Descriptor in Cooked Ground Turkey Meat Treated with Different Antioxidants Rated in a 15-cm Line Scale
Storage (Day) Control BHT 002 K200 K400
0 344plusmn226aA 350plusmn256aA 395plusmn309aA 395plusmn277aA
1 417plusmn285aA 389plusmn230aA 401plusmn345aA 438plusmn287aA
3 388plusmn220aA 378plusmn229aA 396plusmn328aA 403plusmn285aA
5 479plusmn252aA 461plusmn293aA 389plusmn255aA 428plusmn320aA
7 460plusmn288aA 492plusmn286aA 426plusmn281aA 428plusmn340aA
Different letters (A-C) within a row indicates that mean values are significantly different (Plt 005) Different letters within a column (a-e) within the same treatment are significantly different (Plt005)
K200 and K400 represent Treatment with Keluak extract at concentrations of 200 and 400 ppm
respectively
58
Table 49 pH Values of Cooked Ground Turkey Treated with Different
Antioxidants Stored at 2˚C
pH Value
Storage (Day) Control BHT 002 K200 K400
0 665plusmn 002Aab 644plusmn 003Bbc 646plusmn 004Bbc 658plusmn 003Aab
1 659plusmn 003Ab 643plusmn 003Cbc 651plusmn 001Babc 662plusmn 001Aab
3 645plusmn 003Bc 634plusmn 002Cd 643plusmn 004Bc 654plusmn 000Ab
5 663plusmn 002Aab 640plusmn 002Cc 645plusmn 004Cc 654plusmn 002Bb
7 647plusmn 001Ac 633plusmn 003Bc 648plusmn 004Aabc 646plusmn 006Ac
10 665plusmn 001Aab 646plusmn 002Dbc 654plusmn 001Cab 660plusmn 003Bab
13 665plusmn 002Aab 648plusmn 002Cab 655plusmn 002Ba 664plusmn 002Aa
15 668plusmn 001Aa 651plusmn 001Da 655plusmn 001Ca 663plusmn 001Ba
Different letters (A-D) within a row indicates that mean values are significantly different (Plt 005) Different letters within a column (a-c) within the same treatment are significantly different (Plt005)
K200 and K400 represent treatments with Keluak extract at concentrations of 200 and 400 ppm
respectively
59
49 References
1 Chye FY Sim KY Antioxidative and Antibacterial Activities of Pangium edule Seed Extracts International Journal of Pharmacology 2009 5 285-297
2 Kahkonen M Hopia A Vuorela H Rauha J Pihlaja K Kujala T Heinonen M Antioxidant activity of plant extracts containing phenolic compounds J Agric Food Chem 1999 47 3954-3962
3 Jayaprakasha G Selvi T Sakariah K Antibacterial and antioxidant activities of grape (Vitis vinifera) seed extracts Food Res Int 2003 36 117-122
4 Gray J Macdonald B Pearson A Morton I Role of Nitrite in Cured Meat Flavor - a Review J Food Prot 1981 44 302-amp
5 Juntachote T Berghofer E Siebenhandl S Bauer F The antioxidative properties of Holy basil and Galangal in cooked ground pork Meat Sci 2006 72 446-456
6 Teets AS Were LM Inhibition of lipid oxidation in refrigerated and frozen salted raw minced chicken breasts with electron beam irradiated almond skin powder Meat Sci 2008 80 1326-1332
7 Han D McMillin K Godber J Bidner T Younathan M Marshall D Hart L Iron Distribution in Heated Beef and Chicken Muscles J Food Sci 1993 58 697-700
8 Ahn D Wolfe F Sim J Prevention of Lipid Oxidation in Precooked Turkey Meat Patties with Hot Packaging and Antioxidant Combinations J Food Sci 1993 58 283-287
9 Asghar A Gray J Buckley D Pearson A Booren A Perspectives on Warmed-Over Flavor Food Technol 1988 42 102-108
10 Kingston E Monahan F Buckley D Lynch P Lipid oxidation in cooked pork as affected by vitamin E cooking and storage conditions J Food Sci 1998 63 386-389
11 Kulas E Ackman R Different tocopherols and the relationship between two methods for determination of primary oxidation products in fish oil J Agric Food Chem 2001 49 1724-1729
12 Srinivasan S Xiong Y Decker E Inhibition of protein and lipid oxidation in beef heart surimi-like material by antioxidants and combinations of pH NaCl and buffer type in the washing media J Agric Food Chem 1996 44 119-125
13 Lee M Choi J Choi Y Han D Kim H Shim S Chung H Kim C The antioxidative properties of mustard leaf (Brassica juncea) kimchi extracts on
60
refrigerated raw ground pork meat against lipid oxidation Meat Sci 2010 84 498-504
14 Fardiaz D Romlah S Antioxidant Activity of Picung (Pangium edule
Reinw) Seed In Development of Food Science and Technology in ASEAN
Proceedings of the 4th ASEAN Food Conference Feb 17-21 1992 ASEAN
Jakarta Indonesia 1992
15 Frankel E N Lipid oxidation Dundee Scotland The Oily Press Ltd 1998 Vol 10 pp 13ndash41 16 Ma Amy A Peranakan favorite is ayam buah keluak Chicken stewed with black nuts at True Blue Restaurant Wall Street Journal (Online) New York NY Dec 16 2010 Retrieved July 20 2011 from httpproquestumicompqdwebdid=2214039511ampsid=1ampFmt=3ampclientId=36305ampRQT=309ampVName=PQD
17 Esteacutevez M Morcuende D and Ventanas S Determination of Oxidation
Nollet Leo M LToldraacute Fidel (Eds) Handbook of Muscle Foods Analysis Boca
Raton CRC Press 2009 221-240
18 Grau A Codony R Rafecas M Barroeta A Guardiola F Lipid
hydroperoxide determination in dark chicken meat through a ferrous oxidation-
xylenol orange method J Agric Food Chem 2000 48 4136-4143
19 Shahidi F Janitha P Wanasundara P Phenolic Antioxidants Crit Rev Food Sci Nutr 1992 32 67-103
20 Ruth SM Techniques for sampling and identification of volatile compounds contributing to sensory perception In Nollet Leo M LToldraacute Fidel (Eds) Handbook of Muscle Foods Analysis Boca Raton CRC Press 2009 503-523
21 Bou R Guardiola F Grau A Grimpa S Manich A Barroeta A Codony R Influence of dietary fat source alpha-tocopherol and ascorbic acid supplementation on sensory quality of dark chicken meat Poult Sci 2001 80 800-807
22 Gray J I and A M Pearson Rancidity and warmed over flavour In Pearson A M and Dutson T R (Eds) Advances in Meat Research Vol 3 Nostrand-Reinbold Co New York NY 1987 221ndash269 23 OrsquoNeill L M K Galvin P A Morrissey and D J Buckley Comparison of effects of dietary olive oil tallow and vitamin E on the quality of broiler meat and meat products Br Poult Sci 1998 39 365ndash371
61
Chapter 5 CONCLUSION AND FUTURE WORK
The results of the present study indicated that the Keluak extract
incorporated into cooked ground turkey can reduce lipid oxidation The addition
of Keluak extracts at 200 and 400 ppm had a positive effect on reducing the
TBAR values and the conjugated dienes content compared to the control without
added AOs during storage at 2˚C for 15 days The Keluak extract used in this
study was comparable to BHT (002) in reducing lipid oxidation in meat
Peroxide value analysis did not differentiate between the control and the
treatments on the extent of lipid oxidation Due to confusion of the odor
components in the Keluak extracts by the panelists there were no significant
differences between the treatments in the odor sensory evaluation
Keluak seed is a culinary spice with no known toxic effect Its moderate
pungent aroma makes it valued as a traditional ethnic food flavorant in parts of
South East Asia With its substantial phenolic content and antioxidant properties
it could be an effective source of natural antioxidants However the application
of this natural antioxidant might be limited in Western cultures due to its effect
on the color and odor of meat products Further investigations are needed to
identify selective extraction and clean-up techniques that could be used to
eliminate the color and odor problem Other chemical analysis methods that
might provide better information on the extent of oxidation in meat products
include the p-anisidine value Food Oil Sensor (FOS) and Gas chromatography
techniques (GC analysis) of selected volatiles
6
(PUFA) are much more susceptible to oxidation than mono-unsaturated fatty
acid (MUFA) (46)
The initiation reaction can include transition metals (ie iron copper)
oxidants various hemolysis-prone substances or enzymes (1) This production of
free radicals can occur because of the direct thermal dissociation (thermolysis) of
hydroperoxides because of transition metal catalysis or exposure to light
(photolysis) with or without the intervention of photosensitizers (30) The
spontaneous abstraction of a hydrogen atom from an organic material by
molecular oxygen is an endothermic reaction which has a large activation energy
and although it might occur to a certain extent this stage is probably too slow to
be of practical importance Either the organic molecule or the oxygen should be
activated before the reaction could take place (1)
2222 Propagation
R + O2 ROO (2)
ROO + RH rarr ROOH + R (3)
An unsaturated lipid contains labile hydrogen(s) that can be abstracted
relatively easily This free radical (R) will react rapidly with molecular oxygen to
produce a peroxyl radical (ROO ) (reaction 2) The newly formed hydroperoxyl
radical can so forth abstract a hydrogen atom from an adjacent unsaturated fatty
acid (reaction 3) and the reaction goes on propagation cycles before termination
(29)
2223 Termination
ROO + ROO rarr non-radical products [ROOOOR] (4)
RO + R rarr ROR
R + R rarr RR
R + ROO rarr ROOR
Termination can occur by condensation of peroxy alkoxy andor alkyl
radicals Peroxy radicals at room temperature can combine to produce peroxy-
linked dimers (ROOR) Alkoxy and alkyl radicals at low oxygen pressure and
7
high temperatures can combine to produce ether-linked dimers (ROR) and
carbon-carbon linked dimers (RR) Alkyl radicals can combine with peroxy
radicals to generate peroxy-linked dimers (ROOR) (30-32)
Hydroperoxides the primary initial products of lipid oxidation can
breakdown as soon as they are formed The decomposition can be catalyzed by
transition metals particularly iron or copper or by elevated temperatures
gt100degC Hydroperoxide decomposition can involve several complex pathways
forming a wide variety of volatile and non-volatile secondary products such as
aldehydes ketones alcohols acids and hydrocarbons which can affect flavor
greatly Some of the volatile aldehydes can be extremely potent and can affect
flavor of food at concentrations less than 1 ppm (31) Another important
termination reaction involves an antioxidant (AH) (30) which will be discussed
later in the chapter
23 Lipid Oxidation in Meat
Meat can oxidize very rapidly post-mortem The rate and degree of lipid
oxidation are affected by factors that include meat composition fatty acid
content processing conditions and chemical additives in the meat products (3)
It is generally agreed that lipid oxidation in muscle foods begins immediately
after slaughter in the highly unsaturated phospholipids fraction in the subcellular
membranes (25) Botsoglou et al (25) added that in most cases fresh meat has an
acceptable stability with respect to oxidation but processing operations such as
freezing and thawing mechanical deboning mincing restructuring the addition
of salt and refrigeration can lead to increased oxidation due to the destruction of
cellular structure and functions
Cooked or pressure-treated meat and meat products can be more
susceptible to oxidation since endogenous antioxidant enzymes may denature
and lose their activities while iron-containing proteins may become a source of
catalytic iron
Poultry meat is particularly susceptible to lipid oxidation due to its high
content of polyunsaturated lipids pigments metal catalysts and various other
8
oxidizing agents (25) This implies that even low-fat poultry meat products are
susceptible to lipid oxidation since fat reduction primarily reflects a reduction in
triacylglycerides while the phospholipid fraction which is high in
polyunsaturated fat is much less affected (34) Another factor is that species
differences in susceptibility to lipid oxidation are largely determined by the level
of poly-unsaturated fatty acid (PUFA) present in meat Thus the extent of lipid
oxidation in cooked meat is directly related to the level of unsaturated fatty lipids
with susceptibility to oxidation decreasing in the order of chicken gt pork gt beef gt
lamb (4) Chicken has fewer tendencies to develop oxidized flavor than turkey
because the higher level of vitamin E in chicken fat retards oxidation Oxidation
proceeds faster in turkey thigh meat than in breast meat as the darker meat
contains more lipid and heme iron (17)
Hydroperoxides formed during lipid peroxidation undergo decomposition
to form secondary oxidation products Those secondary products include volatile
aldehydes ketones acids alcohols and hydrocarbon compounds Aldehydes (ie
hexanal) are one of the primary causes of rancid and stale flavors in precooked
meat products (3)
231 Factors Affecting the Extent of Lipid Oxidative Stability in Meat
There are factors that can affect lipid stability in meat and meat pr0ducts
such as fatty acid composition endogenous prooxidative or antioxidative
components meat processing operations and various additives
2311 Fatty Acid Composition of Meat
It is generally agreed that unsaturated fatty acids (UFA) are responsible
for lipid oxidation in meat Also as the concentration of polyunsaturated fatty
acids (PUFA) increases lipid oxidation increases in muscle foods (4) The amount
of UFA in muscle foods varies depending on the animal species genetic origin
diet sex age at which the animal is slaughtered type of muscle and processing
factors such as fat addition to ground meat (5)
Turkey meat showed low values for total lipid and cholesterol but
greater values than beef pork and lamb for its PUFA content The content of n3
9
fatty acids was the greatest in turkey among meats that included beef pork and
lamb The species is the major source of variation in fatty acid composition The
fatty acid composition of turkey meat is shown in Table 21 (50) Ruminant meats
contain a greater percentage of saturated fat compared with the meat of
monogastric animals (6)
2312 Endogenous prooxidative and antioxidative constituents
Endogenous prooxidative constituents in meat systems consist of iron-
containing proteins transition metals and endogenous enzymes The catalytic
effect of iron-containing protein on the oxidative deterioration of PUFA was first
described by Robinson (35) Since then heme catalyzed lipid oxidation has been
studied extensively and it has become a generally accepted phenomenon that
lipid oxidation is accelerated by heme compounds and transition metals in meat
systems
Lipoxygenase peroxidase and microsomal enzymes identified in various
animal tissues catalyze the reaction of PUFA oxidation with the formation of
unconjugated dienes (7) However enzymatic lipid oxidation catalysts are normal
components in blood and consequently are not a primary problem in most
muscle foods (8)
2313 Meat Processing
According to McMillin (33) quality of raw materials time postmortem
extent of heating and comminution or particle size reduction and the ingredients
added are processing factors that can influence the rate of lipid oxidation Even
though lipid oxidation varies among different animal species such species effects
have been inconsistent and may be due to differences in anatomical location
diet environmental temperature sex age phospholipid content body
composition and experimental conditions such as cooking temperature sample
handling and method for assessing lipid oxidation
Heating encourages the development of lipid oxidation by affecting the
distribution of the iron in the muscle food (9) During cooking a variety of
volatiles producing off-odors and flavors are generated as PUFA oxidize (10)
10
Heat quickly decomposes hydroperoxides produced resulting in the production
of desirable flavor in cooked products The shelf-life of meat products is usually
prolonged by frozen storage Under freezing conditions the rate of oxidation can
be reduced but not completely prevented (1)
Lipid oxidation in cooked meat is commonly referred to as warmed-over-
flavor (WOF) WOF often develops within 1-3 days of refrigerated storage and is
characterized by the loss of fresh cooked meat aroma and a simultaneous
increase in undesirable odors which are commonly described as ldquostalerdquo ldquowet
cardboardrdquo ldquopaintyrdquo ldquograssyrdquo or ldquorancidrdquo (11) The most important contributors
to the development of WOF are the secondary oxidative compounds such as
hexanal pentanal and 2 3- octanedione (12) According to Kerler and Grosch
(59) identified (E E)-2 4-decadienal butyric acid and furaneol as key
compounds in fresh boiled chicken aroma while hexenal butyric acid and 1-
octen-3-one were the main compounds in chicken reheated after 48 hours
storage at 4˚C
The tendency of precooked meat products to oxidize has led food
scientists processors and the industries to develop techniques that allow
extended shelf life of these products In addition to antioxidants the appropriate
packaging and proper storage conditions are useful techniques to achieve
extended storage times
2314 Non-meat Additives
Non-meat additives can be prooxidative or antioxidative agents The
addition of salt NaCl commonly used in meat products to add flavor and
functionality at 05-25 (4) is a prooxidant Salt has been shown to accelerate
oxidation in pork patties (13) by enhancing the activity of iron atoms which then
promotes iron-catalyzed oxidation and flavor deterioration (1) Transitions
metals other than iron (copper especially) supplied by the water from
processing equipment andor spices can also promote oxidation (36)
The use of antioxidants synthetic or natural has been used to prevent lipid
oxidation in meat products The addition of nitrites phosphates citric acid
phytic acid and EDTA has been reported to inhibit lipid oxidation in meat
11
products (10 14) In addition synthetic phenolic antioxidants such as butylated
hydroxytoluene (BHT) butylated hydroxyanisol (BHA) tertiary-butylated
hydroquinone (TBHQ) and propyl gallate has been widely used for more than 50
years to inhibit lipid oxidation in meat products (12)
Several water-soluble compounds including ascorbic acid uric acid
cysteine and glutathione are also known to scavenge radicals and delay oxidation
(37) In meat the functions of ascorbic acid include maintenance of cured color
and prevention of off-flavors (15) Ascorbic acid becomes a prooxidant in meat
products at concentrations greater than 300 mgkg (8)
In the last 30 years natural antioxidant use has increased Various plant
materials and extracts containing polyphenolic compounds have been proven to
be effective antioxidants in meat systems Rosemary and rosemary extracts at
concentrations between 002 to 003 are one of the many natural antioxidants
being studied (3 16-18)
232 Measurement of rancidity in meat
Hydroperoxides the primary products of lipid oxidation are colorless
tasteless and odorless It is the breakdown of these peroxides that produce a
complex mixture of low molecular weight volatile compounds including alkanes
alkenes aldehydes ketones alcohols esters and acids many with distinctive
odor and flavor characteristics (19 38) These compounds convey rancid
cardboard oxidized pungent and other off-flavors characteristic of oxidized meat
(39)
Since oxidative decomposition products are of great importance to product
acceptability and nutritional quality a wide variety of assays from subjective
analyses (ie sensory evaluation) to physical and chemical analyses of various
components have been developed to detect and quantify lipid oxidation in foods
However there is no single effective method to measure all the oxidative
products that are generated during lipid oxidation There is no good method
useful for all stages of oxidation An assay can only monitor only a few changes or
specific reactants when applied to a food system under specific conditions
Therefore a combination of assays would be required to monitor the extent of
12
lipid oxidation in most foods It is also common to apply methods that are based
on measuring one of more of the key primary or secondary oxidation products
2321 Peroxide Value
Since the primary product of lipid oxidation are hydroperoxides it is
proper to determine their concentration as one measure of oxidation The
peroxide value (PV) assay represents the total concentration of peroxides and
hydroperoxides present at a certain time in the food product However this test
is restricted by the chemical instability of these compounds after their
concentration reaches a maximum level they decay as a function of temperature
and the presence of other food components particularly transition metals such
as iron and copper (1)
In muscle tissue the lipid is extracted with a mixture of solvents without
decomposition of the hydroperoxides One of the most common extraction
methods was developed by Folch Lees and Stanley (20) Several methods to
determine the PV have been developed that include iodometric titration method
a ferric thiocyanate method and other colorimetric methods (21 40) PV can be
expressed in several units such as meq iodinekg fat (40) or as meq of
peroxidekg fat (45)
2322 Conjugated Dienes
Conjugated diene hydroperoxides (CDs) are one of the primary products of
the oxidation for linoleate (182) and PUFAs with 3 or more double bonds CDs
can be determined quantitatively by their absorbance at 232-234 nm (22) In
meat samples the CD are first extracted from homogenized sample with an
extracting solution such as 31 hexane isopropanol (23 24)
The greater the amount of PUFA in a fat the greater the potential rise in
the CD values However the CD values plateau at a certain concentration at
which the breakdown roughly equals the formation of new CDs At this point in
the oxidation process no additional changes can be measured by the CD assay
(41)
13
httpwwwchemistrydailycomchemistryDiene
2323 Thiobarbituric Acid Reactive Substances (TBARS)
An alternative approach to the determination of the extent of oxidation is
the measurement of selected secondary oxidation products In contrast to the PV
assay those assays are not limited to the early stages of oxidation and may reflect
the formation of volatile products such as carbonyl compounds which actually
contribute to the rancid and objectionable flavor The application of methods
based on this approach requires a detailed knowledge of the chemistry involved
and an understanding of the stability of the compounds assayed etc Among
these methods the thiobarbituric acid test (TBA) is one of the most common in
spite of criticisms of its reproducibility and reliability The test is based on the
color product resulting from the condensation of TBA with malonaldehyde which
is presumably generated in the oxidized fats However a large body of evidence
suggests that other food components can react with TBA to generate the same
chromophore and even the formation of malonaldehyde is dependent on the
composition of the initial lipid (1) For example other products of lipid oxidation
such as alka-2 4-dienals also react with TBA to form a red complex with the
same absorption maximum as the malonaldehyde-TBA complex shown in the
diagram below (42) For this reason Gray suggested that the TBA procedure
should be used to assess the extent of lipid oxidation in general rather than to
quantify malonaldehyde and the term thiobarbituric acid-reactive substances
(TBARS) is now commonly used in place of the TBA number or value (10)
The extent of lipid oxidation is reported as the TBA number or TBA
value and is expressed as milligrams of malonaldehyde equivalents per kilogram
of sample Malonaldehyde is a relatively minor lipid oxidation product formed
14
during the oxidation of polyunsaturated fatty acids and reacts with TBA to
produce a colored complex with an absorption maximum at 530-532 nm
Malonaldehyde has been reported to correlate well with sensory scores of
oxidized flavors in muscle foods (38) This assay is not recommended for
monitoring the extent of oxidation of food oils
httpmnh20wordpresscom20100719518
2324 Sensory Evaluation
A wide range of methods have been used to examine the effects of lipid
oxidation on the quality of stored turkey meat In addition to the chemical or
instrumental techniques sensory evaluation is very useful for assessing the
quality and stability of meat and meat products from lipid oxidation Most of
these analyses such as the PV TBARs CDs or gas chromatographic analysis of
specific volatiles can be correlated to sensory analysis but none of these chemical
or physical analyses can effectively replace the human nose taste buds and
sensory receptors (43)
According to Warner (43) sensory evaluation is a scientific discipline used
to evoke measure analyze and interpret reactions to food and material
characteristics as they are perceived by sense of sight smell taste touch and
hearing Although sensory evaluation can have a low reproducibility relative to
gas chromatography well-trained and experienced sensory panelists operating
under controlled conditions can provide accurate reliable data The American
Meat Science Association (44) has developed standard guidelines for sensory
analyses The AMSA recommendations include sample preparation cooking
methods and procedures facilities preparation and presentation of samples
15
trained sensory panels test forms consumer panels and instrumental
measurement of tenderness
24 Control of Oxidation Antioxidants
Antioxidants are substances that can delay the onset of lipid oxidation and
extend the induction period They must be added as early as possible in the
manufacturing process or to finished food products to be effective in reducing
lipid oxidation Antioxidants cannot reverse the oxidation of rancid food
products Moreover antioxidants are not effective in controlling hydrolytic
rancidity which is enzyme-catalyzed hydrolysis of fats Antioxidants can control
lipid peroxidation in six ways reducing localized O2 concentrations scavenging
species that initiate peroxidation quenching singlet O2 to prevent the formation
of peroxides binding free metal ions (chelating agent) into a form that will not
generate reactive species or decompose lipid peroxides to peroxyl or alkoxyl
radicals peroxide removal and chain breaking to prevent more hydrogen
abstraction from fatty acid side chains (46) There are three types of antioxidants
based on their mechanism (46 47)
241 Type I - Also called the primary or free-radical chain stopper antioxidants
Type I antioxidants inhibit the chain reaction by acting as hydrogen
donors or free-radical acceptors (AH) (46) Compounds in this category stop the
free radical chain reactions by converting the radicals into more stable products
(47) by reacting primarily with ROO and not with R radicals Basically the
mechanism is a competition between ldquothe inhibitor reactionrdquo (46)
ROO + AH ROOH + A
And ldquothe chain propagation reactionsrdquo
ROO + RH ROOH + R
The effectiveness of a primary antioxidant is dependent on several factors
such as activation energy rate constants oxidation-reduction potential ease of
antioxidant loss or destruction and solubility properties (46) Labuza pointed out
that another important characteristic of an efficient antioxidant is that the
16
resulting antioxidant free radical must not itself initiate new free radicals or be
rapidly oxidized by a chain reaction (46) Type I antioxidants are primarily
phenolic compounds such as butylated hydroxytoluene (BHT) and butylated
hydroxyanisole (BHA) (47) and tert-butylhydroquinone (TBHQ) commonly
present in foods These synthetic food additives are permitted to be used alone or
in combination However the antioxidant content of a food containing these
additives must not exceed 002 of the oil or fat content of the food according to
the Code of Federal Regulations (58)
Butylated Hydroxyanisole
Phenolic compounds synthetic or natural are excellent antioxidants since
they possess benzene rings containing hydroxyl groups and are relatively
reactive Phenols produce stable antioxidant radicals A that are sufficiently
unreactive to propagate the chain and compete with the lipid substrate (RH)
which is present at a much greater concentration (46)
A + ROO Non-radical products
A + A Non-radical products
Since synthetic antioxidants such as BHT and BHA have restrictions for
use in food due to their toxicological effects on several species and they are
suspected to be potential carcinogens (48) the search for natural and safe
antioxidants especially those of plant origin has greatly increased in recent
years
17
242 Type II- Secondary antioxidants or Free-radical production preventer
This category includes compounds that reduce the rate of chain initiation
by metal chelation oxygen scavenging or absorption of UV radiation (47) The
common chelating agents include ethylenediamine tetraacetic acid (EDTA) citric
acid and phosphates EDTA is used for chelation of many metals and it can be an
effective oxidation inhibitor in foods especially those with intermediate to high
moisture content but not in protein-type food such as meats which contain
substantial amounts of bound form of transition metals (46) In addition EDTA
does not protect food during heating because it is less stable at higher
temperatures therefore it is restricted to foods held or processed at cool
temperatures (49) Citric acid is especially useful in oils and intermediate
moisture foods (46) Ascorbic acid is commonly used as a food antioxidant due to
its oxygen scavenging and reducing properties (47) it is especially effective when
it is used in combination with iron chelators (46) Polyphosphates are more
effective chelators and antioxidants than monophosphates However their
antioxidant activity could be reduced or eliminated depending on the
components of the food (50)
Maillard reaction products can bind transition metals such as iron and
deactivate singlet oxygen Because of their dark color and low solubility they are
unsuitable for use in fats and oils but they may be used to improve the oxidative
stability of many foods (51)
Other preventive antioxidants include several enzymes such as catalase
(47) and glutathione peroxidase (37) which reduce the generation of free radicals
by decomposing hydrogen peroxide and hydroperoxides respectively
243 Type III- Control of Environment Factors
This category does not refer to compounds added to inhibit lipid oxidation
Rather this category refers to factors such as the reduction of the oxygen
content a decrease in temperature altering the moisture content (46) and
exclusion of light (47) As the temperature increases oxygen becomes less soluble
in lipids and water slightly influencing the rate The rate of oxidation increases
proportionally to the surface of the lipid exposed to air According to Labuza (46)
18
lipid oxidation can be reduced by altering the water activity which can alter the
catalytic activity of metal catalysts At an elevated water activity (awgt 055) the
rate of oxidation can increase possibly due to the increased mobilization of metal
catalysts
Antioxidant synergism has been observed between primary antioxidants
and between antioxidants with different modes of actions This synergistic effect
can substantially reduce the level of antioxidants needed in a food
25 Keluak As A Natural Source of Antioxidant
251 Keluak ndash Introduction
Pangium edule Reinw (Figure 21) is a tall tropical tree that grows mainly
in Micronesia Melanesia and Southeast Asia including Indonesia The
taxonomy of the tree is uncertain and it may also be classified in the
Flacourtiaceae or the Violale According to Abdullah (55) the tree requires many
years to mature and the seeds are therefore most frequently harvested from wild
trees as it is not economically feasible to cultivate the plant The size of a Pangi
tree is characterized as medium to large with large glossy heart-shaped leaves
that are conspicuously veined and long-stemmed The flowers are large and
greenish and the sexes are separate Flowering occurs from September to October
with seed shed likely to occur in December to January However there are
records of seed shed in April to May and July to September This tropical tree is
wild and not well cultivated (55)
The trees start fruiting when they are approximately 10 to 15 years old The
fruit is oval in shape and the size ranging from 12-30 cm (52) or about a size of a
large husked coconut brown and rough-surfaced (55) The tree produces a large
fruit that is poisonous because of the presence of cyanogenic glucosides (53)
Almost all parts of the plant are poisonous including its leaves barks and seed
(52) Although poisonous to humans the seeds of the tree are part of the natural
diet of the babirusa (Babyroussa babyrussa) (53) a pig-like animal native to the
region However the mature fruit is edible and the juice can be applied to sores
and cuts (55)
19
In Indonesia the seed kernel of this tree is edible after treatments
following the removal of the cyanogenic glucosides Keluak is fermented in a
specific way the seeds are harvested and placed in the field for 10 days The seeds
are then removed washed and boiled for 3 hours to remove the cyanide (54)
After cooling the seeds are buried (indoor) in ash banana leaves and earth for
40 days The seed turn from a creamy white color to dark brown or black (51)
The fermented seeds are cleaned and ready to be used as spices (54) image is
shown in Figure 22 In some countries according to Ma (56) after harvesting the
fruits are buried in the ground for ~100 days before the large seeds are removed
the rest of the plant is poisonous The charcoal-colored nuts are braised for one
hour so the soft flesh can be scooped out of the skin The taste is bitter buttery
and a bit like chocolate while the texture is a familiar one - think mashed
potatoes or roasted chestnuts (56)
Taxonomy of Keluak (55)
Kingdom Plantae
Division Magnoliophyta
Species Pedule
Family Acariaceae
Binomial name Pangium edule Reinw ex Blume
Authority Reinward
Synonym names football fruit kluwek Indonesia black nut kepayang
kluwek keluwek kluwak pangi paying picung penarassan seis
According to Andarwulan et al (54) the fermented seed product of this tree
depending upon the origin is called
Indonesian
o Keluak kluwak kluak kluwek keluwek or kloewak (Dutch spelling)
o Pucung or pucing (Sundanese)
o Rawan or rawon (adjective referring to food prepared with the seed of
this tree) (Figure 23)
Malay
o Kepayang
20
o Payang
Philipines
o Samaun-referring to the oil
o Pangi- referring to the tree
Keluak is commonly used as a spicy flavoring in soups in Java and South
Sulawesi several traditional dishes can be made with Keluak seeds including
ldquoRawonrdquo (Figure 23) and ldquoBlack nut with golden snapperrdquo (Figure 24) Keluak is
also a raw material for another product ldquokecap pangirdquo (ldquokecaprdquo is a soy sauce-like
product) and it has been used as a spice in Saparua Maluku Island in Indonesia
Another of the edible products is called ldquoDagerdquo which is a boiled seed after the
removal of kernels and water after soaking for 2-3 days Dage is utilized in West
java as a vegetable (54) In this document I will use the term ldquoKeluakrdquo and ldquopangi
to refer to the fermented seed that is commonly used as a spice
252 Nutritional Profile of Keluak
The nutrition fact of the Keluak seed is shown in Table 22 Generally
phenolic compounds are found in the seeds and other parts of the plant Most
seeds contain large amounts of polyunsaturated oils and phenolic antioxidants
are necessary to protect the polyunsaturated fatty acids in the oil against
autoxidation (50)
The pangi seed contains some secondary metabolites (Table 23) of the
cyanogen glycosides which include the cyanogen glycoside and various
alkaloids flavonoids steroids saponins tannins and quinine These metabolites
are present in both fresh and dried pangi seed (55)
253 Previous work on keluak
Previous research by Fardiaz and Romlah (57) on the fermented seed
indicated that the methanol extract of keluak possessed antioxidant activity
Fardiaz and Romlah found that the addition of Keluak seed extract to cooking oil
could lengthen the oxidation induction period of the oil Their findings are
summarized in the Table 24 and Figure 25
21
Recently Chye and Sim (52) used several different extraction methods on
Keluak seeds and examined the antioxidant activity of the extract Extracts of
Pangium edule Reinw seed were investigated for their antioxidative activity
using DPPH radical scavenging and β-carotene bleaching assays For the
extraction they used a mixture of acetone acetic acid water which yielded the
higher phenolic content of 2222 plusmn005 mg GAEg among the other methods of
extraction and showed the most potent antioxidative acivity in both DPPH radical
scavenging and β-carotene (Figures 26- 27) They found that significant
correlation was observed between the total phenolic content and its antioxidative
activity (r=0878) suggesting that the phenolics of the Keluak extract could be
potential sources of natural antioxidants (52)
22
26 Figures
Figure 21 Pangium Plant
httpwwwpngplantsorgPNGtreesTreeDescriptionsPangium_edule_Reinwhtml httptravelspotcoolstuffcomgourmet-adventureunusual-food5-lethal-
delicious-meals
Figure 22 Keluak Seed
Source Wayang Brand Kluwak Kupas PT Wira Aksara Jakarta Indonesia
Figure 23 A Dish Made With Keluak Seed- Black Beef Soup (Rawon)
httpwwwlestariwebcomresep-indonesiaEnglishRawonphp
23
Figure 24 A Dish made with Keluak Seed- Black Nut with Golden Snapper
httpdelightfultastebudscom20110501rawon-indonesian-beef-black-soup
Figure 25 The Effect of Kluwak Extract on Oxidation Induction Period of Palm Oil (57)
24
Figure 26 DPPH radical scavenging activity () of Keluak seed extracts at different
concentrations (52)
Phenolic (Ace) = phenolic extracted by acetone Phenolic (EtOAc) = Phenolic extracted by ethyl acetate FPA= Free phenolic acid GBPA= Glycoside-bound
phenolic acid Al= Alkaloid
Figure 27 Antioxidative Activity of Keluak Seed Extracts at 20 mgmL measured by β-
carotene bleaching method (52)
Phenolic (Ace) = phenolic extracted by acetone Phenolic (EtOAc) = Phenolic extracted by ethyl acetate FPA= Free phenolic acid GBPA= Glycoside-bound
phenolic acid Al= Alkaloid
25
27 Tables
Table 21 Fatty Acid Composition of Turkey Meat (50)
Table 22 Nutrition Fact of Keluak Seed
Per 100 grams (or 100 mL)
Energy 2428 kj
Protein 15 g
Fat (Total) 50 g
Carbohydrate (Total) 17 g
Sugar 4 g
Dietary Fiber 10 g
Sodium -
Potassium 680 mg
Calcium 0
Vitamin A 0
Vitamin C 0
Iron 0 Source Wayang Brand Kluwak Kupas PT Wira Aksara Jakarta Indonesia
26
Table 23 Anti- Nutritional Factors of Pangium Seed (55)
Anti- Nutritional Factors Dry wt Basis (microgg)
Arsenic NA
Cyanide 1834
Lead 18
Phytic acid NA
Tannin 046
Alkaloid NA
Table 24 The Antioxidative Activity of Kluwak Expressed as Protective Factor (57)
27
28 References
1 Kanner J Rosenthal I An Assessment of Lipid Oxidation in Foods - Technical Report Pure and Applied Chemistry 1992 64 1959-1964
2 Skibsted LH Understanding oxidation processes in foods Woodhead Publ Food Sci Technol Nutr 2011 199 3-35
3 Yu L Scanlin L Wilson J Schmidt G Rosemary extracts as inhibitors of lipid oxidation and color change in cooked turkey products during refrigerated storage J Food Sci 2002 67 582-585
4 Rhee K Anderson L Sams A Lipid oxidation potential of beef chicken and pork J Food Sci 1996 61 8-12
5 Hernandez P Navarro J Toldra F Lipid composition and lipolytic enzyme activities in porcine skeletal muscles with different oxidative pattern Meat Sci 1998 49 1-10
6 Karakok SG Ozogul Y Saler M Ozogul F Proximate Analysis Fatty Acid Profiles and Mineral Contents of Meats a Comparative Study Journal of Muscle Foods 2010 21 210-223
7 Chan K Decker E Endogenous Skeletal-Muscle Antioxidants Crit Rev Food Sci Nutr 1994 34 403-426
8 Decker E Xu Z Minimizing rancidity in muscle foods Food Technol 1998 52 54-59
9 Rojas MC Brewer MS Effect of natural antioxidants on oxidative stability of cooked refrigerated beef and pork J Food Sci 2007 72 S282-S288
10 Gray J Macdonald B Pearson A Morton I Role of Nitrite in Cured Meat Flavor - a Review J Food Prot 1981 44 302-8
11 Brewer M Vega J Detectable Odor Thresholds of Selected Lipid Oxidation Compounds in a Meat Model System J Food Sci 1995 60 592-595
12 St Angelo A Crippen K Dupuy H James C Chemical and Sensory Studies of Antioxidant-Treated Beef J Food Sci 1990 55 1501-1508
13 Buckley D Gray J Asghar A Price J Crackel R Booren A Pearson A Miller E Effects of Dietary Antioxidants and Oxidized Oil on Membranal Lipid Stability and Pork Product Quality J Food Sci 1989 54 1193-1197
14 Guntensperger B Escher F Oxidative Changes of Heat-Sterilized Meat in Trays J Food Sci 1994 59 689-692
28
15 Bauernfeind JC Antioxidant function of L-ascorbic acid in food technology International journal for vitamin and nutrition researchSupplement = Internationale Zeitschrift fur Vitamin- und ErnahrungsforschungSupplement 1985 27 307-333
16 Georgantelis D Blekas G Katikou P Ambrosiadis I Fletouris DJ Effect of rosemary extract chitosan and alpha-tocopherol on lipid oxidation and colour stability during frozen storage of beef burgers Meat Sci 2007 75 256-264
17 Botsoglou NA Govaris A Giannenas I Botsoglou E Papageorgiou G The incorporation of dehydrated rosemary leaves in the rations of turkeys and their impact on the oxidative stability of the produced raw and cooked meat Int J Food Sci Nutr 2007 58 312-320
18 Karpinska-Tymoszczyk M Effect of the addition of ground rosemary on the quality and shelf-life of turkey meatballs during refrigerated storage Br Poult Sci 2008 49 742-750
19 Drumm T Spanier A Changes in the Content of Lipid Autoxidation and Sulfur-Containing-Compounds in Cooked Beef during Storage J Agric Food Chem 1991 39 336-343
20 Folch J Lees M Stanley GHS A Simple Method For The Isolation And Purification Of Total Lipides From Animal Tissues Journal of Biological Chemistry 1957 226 497-509
21 Grau A Codony R Rafecas M Barroeta A Guardiola F Lipid hydroperoxide determination in dark chicken meat through a ferrous oxidation-xylenol orange method J Agric Food Chem 2000 48 4136-4143
22 Dobarganes M Velasco J Analysis of lipid hydroperoxides European Journal of Lipid Science and Technology 2002 104 420-428
23 Juntachote T Berghofer E Siebenhandl S Bauer F The antioxidative properties of Holy basil and Galangal in cooked ground pork Meat Sci 2006 72 446-456
24 Lee M Choi J Choi Y Han D Kim H Shim S Chung H Kim C The antioxidative properties of mustard leaf (Brassica juncea) kimchi extracts on refrigerated raw ground pork meat against lipid oxidation Meat Sci 2010 84 498-504
25 Botsoglou N and Botsoglou E Oxidation in Foods and Beverages and Antioxidant Applications Vol 2 Management in Different Industry Sectors In Decker EA Elias RJ and McClements D J (eds) Oxidation in Foods and Beverages and Antioxidant Applications Vol 2 Management in Different Industry Sectors 2010 200 1-528
29
26 National Chicken Council Per Capita Consumption of Poultry Livestock 1965 to Estimated 2012 in Pounds 2012 Retrieved in January 23 2012 from httpwwwnationalchickencouncilorgabout-the-industrystatisticsper-capita-consumption-of-poultry-and-livestock-1965-to-estimated-2012-in-pounds
27 Bilgili SF Poultry meat processing and marketing- what does the future hold Poult Internat 2002 12-22
28 Nolan N L Bowers J A and Kropf D H Lipid Oxidation and Sensory Analysis of Cooked Pork and Turkey Stored under Modified Atmospheres Journal of Food Science 1989 54 846ndash849
29 Esteacutevez M Morcuende D and Ventanas S Determination of Oxidation Nollet Leo M LToldraacute Fidel (Eds) Handbook of Muscle Foods Analysis Boca Raton CRC Press 2009 221-240
30 Frankel E N Lipid oxidation Prog Lipid Res 1980 19 1ndash22
31 Frankel E N Volatile Lipid Oxidation Products Progress in lipid research 1983 221 1-33
32 Hsieh R J and J E Kinsella Oxidation of Polyunsaturated Fatty Acids Mechanisms Products and Inhibition with Emphasis on Fish Advances in Food and Nutrition Research 1989 Vol 33
33 McMillin K W Initiation of oxidative processes in muscle foods Annual Proceedings of the Reciprocal Meat Conference Am Meat Sci Assoc Chicago IL 1997 49th 53ndash64
34 Monahan FJ Oxidation of lipids in muscle foods fundamental and applied concerns In EA Decker C Faustman and CJ Lopez-Bote (Eds) Antioxidants in Muscle Foods Nutritional Strategies to Improve Quality New York John Wiley and Sons Inc 2000
35 Robinson M E Haemoglobin and methaemoglobin as oxidative catalysts Biochemical Journal 1924 18 255-264
36 Jadhav SJ Nimbalkar SS Kulkarni AD and MadhaviDL Lipid oxidation in biological and food systems In Marcel Dekker (Eds) Food Antioxidants Technological Toxicological and Health Perspectives New York 1996
37 Niki E Antioxidants and relation to lipid oxidation Chemistry and physics of lipids 1987 44 227-300
38 Gray J I and Monahan FJ Measurement of lipid oxidation in meat and meat products Trends Food Sci Technol 1992 3 315-9
30
39 Chang S S and Peterson R J The Basis of Quality in Muscle Foods Recent Developments In The Flavor of Meat Journal of Food Science 1977 42 298ndash305
40 Lea C H Methods for determining peroxide in lipids J Sci Food Agric 1952 3 586ndash594
41 White P J Conjugated diene anisidine value and carbonyl value analysis In Warner K and Eskin N A M (Eds) Methods to Access Quality and Stability of Oils and Fat-Containing Foods Champaign IL AOCS Publishing 1995 159-177
42 Coxon D Measurement of lipid oxidation Food Science and Technology Today 1987 1164-6
43 Warner K Sensory evaluation of oils and fat-containing foods In K Warner and N A M Eskin (Eds) Methods to Access Quality and Stability of Oils and Fat-Containing Foods AOCS Publishing 1995 49
44 AMSA Research Guidelines for cookery sensory evaluation and instrumental tenderness measurements of fresh meat American Meat Science Association-National Live Stock and Meat Board 1995
45 Association of Official Analytical Chemists Official methods of analysis (16th ed) Washington DC Association of Official Analytical Chemists 1995
46 Labuza T P and Dugan L R Kinetics of lipid oxidation in foods C R C Critical Reviews in Food Technology 1971 2 3
47 Gordon MF The mechanism of antioxidant action in vitro In Hudson BJF (Ed) Food Antioxidants London Elsevier Applied Science 1990 1-18
48 Shahidi F Janitha P Wanasundara P Phenolic Antioxidants Crit Rev Food Sci Nutr 1992 32 67-103
49 Roozen JP Effects of types I II and III antioxidants on phospholipid oxidation in a meat model for warmed over flavour Food Chem 1987 24 167-185
50 Pokornyacute J Natural antioxidants for food use Trends in Food Science and Technology 1991 2 223-227
51 Wong W H Buah Keluak National Parks 11 Jan 2007 Retrieved 02 July 2012 from httpenwikipediaorgwikiPangium_edule
52 Chye FY Sim KY Antioxidative and Antibacterial Activities of Pangium edule Seed Extracts International Journal of Pharmacology 2009 5 285-297
31
53 Andarwulan N Fardiaz D Wattimena GA Shetty K Antioxidant activity associated with lipid and phenolic mobilization during seed germination of Pangium edule Reinw J Agric Food Chem 1999 47 3158-3163
54 Andarwulan N Fardiaz S Apriyantono A Hariyadi P Shetty K Mobilization of primary metabolites and phenolics during natural fermentation in seeds of Pangium edule Reinw Process Biochemistry 1999 35 197-204
55 Abdullah Moh A B Phyochemical Composition of Fresh and Cooked of Chesnut (Castanopsis argentea) Pangium (Pangium edule) and Pra (Elateriospermum tapos) Seeds Final Year Project Food Science and Technology in the Faculty of Applied Sciences Universiti Teknologi Mara Malaysia January 2012 Retrieved on July 4 2012 from httpeprintsptaruitmedumy49401MOHD_ASRUL_BIN_ABDULLAH_12_24pdf
56 Ma A A Peranakan favorite is ayam buah keluak Chicken stewed with black nuts at True Blue RestaurantWall Street Journal (Online) New York NY Dec 16 2010 Retrieved July 4 2012 from httpproquestumicompqdwebdid=2214039511ampsid=1ampFmt=3ampclientId=36305ampRQT=309ampVName=PQD
57 Fardiaz D Romlah S Antioxidant activity of picung (Pangium edule Reinw) seed In Development of Food Science and Technology in ASEAN Proceedings of the Fourth ASEAN Food Conference February 17ndash21 1992 ASEAN Jakarta Indonesia 1992 814ndash819
58 Food and Drugs Administration Food Additives Permitted for Direct Addition to Food for Human Consumption Code of Federal Regulations Title 21 pt 172190 2006
59 Kerler J Grosch W Character impact odorants of boiled chicken changes during refrigerated storage and reheating Zeitschrift Fur Lebensmittel-Untersuchung Und-Forschung A-Food Research and Technology 1997 205 232-238
60 Baggio S Vicente E Bragagnolo N Cholesterol oxides cholesterol total lipid and fatty acid composition in turkey meat J Agric Food Chem 2002 50 5981-5986
32
CHAPTER 3 MATERIALS AND METHODS
31 Keluak Antioxidant and Chemicals
Keluak (Kupas Wayang Brandreg Peeled Keluak Nuts PT Wira Aksara
Jakarta Indonesia was manufactured for Empire International East Chief
Privado Ontario CA 91761) Butylated hydroxytoluene (BHT) gallic acid (ACS
reagent) and 2-thiobarbituric acid were obtained from Sigma Chemical
Company St Louis MO USA Sodium chloride (crystal ARreg ACS) was obtained
from Mallinckrodt Baker Inc (Phillipsburg NJ USA)
The reagents used included acetone (Certified ACS) and chloroform (certified
ACS) obtained from Fisher Scientific Fair Lawn NJ USA Acetic acid (Glacial
ACS reagent) was purchased from J T Baker (Center Valley PA 18034 USA)
and Folin Ciocalteursquos phenol reagent (2 N) was purchased from Sigma-Aldrich
(St Louis MO USA)
311 Phenolic Extraction
Keluak seeds were ground into fine pieces using a coffee grinder (Braun
Inc Lynnfield MA USA) The fatty material from the ground seed was removed
first using a method modified from Wettasinghe and Shahidi (1) The ground seed
was washed with n-hexane (16 gg) and placed in a sonicator for 15 minutes
with occasional stirring The mixture was vortexed for 30 secs before it was
centrifuged at 2688 x g for 10 minutes (Sorvallreg Instrument RC-5B Du Pont
Company Wilmington DE USA) The upper fat-soluble layer was discarded
The solid was washed 2 ndash 3 additional times The solids remained at the bottom
after washing The defatted solids were then air-dried overnight under the hood
to remove any solvent residue
Forty grams of dried defatted Keluak seeds were extracted by stirring with
200 mL of solvent (acetone water acetic acid 90 95 05 vvv) at 60degC and
600 rpm for 2 hrs The mixture was then filtered through filter paper (Whatman
1 Buckinghamshire UK) The filtrate was collected and dried at 45degC using a
rotary evaporator until no further weight changes occurred The concentrated
extract was further dried using a vacuum oven at 45degC overnight The extract was
33
collected dissolved in 100 ethanol flushed with Argon gas and stored at -20degC
until further use
312 Total Phenolics content
The total phenolic content was measured using the Folin-Ciocalteu assay
as modified by Waterhouse (13) The phenolic extract was diluted with 100
ethanol to make several dilutions (1100 2100 and 10100) One milliliter of each
dilution was added to a test tube containing 5 mL of deionized water Then 05
mL of 50 Folin-Ciocalteu reagent was added to the test tube The solution was
mixed and allowed to stand for 8 mins at 22degC before adding 1 mL of 5 sodium
carbonate (wv) The mixture was vortexed using a touch mixer (model 231
Fisher Scientific Pittsburgh PA USA) and incubated in the dark for 1 hr The
solution was vortexed a second time before reading the absorption with a UV-
spectrophotometer (Spectronic Genesys 5 spectrophotometer Thermo Electron
Corporation Madison WI USA) at 725 nm against DI water A standard curve
was prepared at the same time with gallic acid at concentrations ranging from 0
to 100 mgL The quantity of total phenolic content in the sample was calculated
as gallic acid equivalents (GAE) from the standard curve using the formula
C = c times (V divide m) where
C is total phenolic content (mg GAEg extract)
c is the concentration of gallic acid obtained from the calibration curve (mgmL)
V is volume of sample (mL)
m is mass of the sample extract (g)
32 Sample Preparation
Ground turkey meat (15 fat Jennie-O Turkey Store Wilmar MN USA)
purchased from a local grocery store at day 0 and was immediately divided into 4
treatments according to the formulation (Table 31) (2 3)
(1) Control- No antioxidant
(2) Commercial antioxidant- 002 BHT (ww of lipid)
(3) Natural antioxidant- 002 Keluak extract (ww of lipid)
34
(4) Natural antioxidant ndash 004 Keluak extract (ww of lipid)
The level of Keluak extract antioxidant used was based on the amount of
fat in each formula Salt was dissolved in water prior to addition to the meat The
water addition was 5 of the ground meat (ww) The antioxidant and salt were
mixed in the liquid first before adding it to the meat by sprinkling while mixing
After the antioxidant salt and liquid addition mixing by hand (wearing gloves)
was continued for 5 mins The meat mixture was prepared into patties of uniform
size (using a cookie cutter diameter= 55 cm thickness= 15 cm) The patties
were cooked in an electrical skillet and temperature was monitored by Digi-
Sensereg Scanning Thermometer (Model 92000-00 Cole Parmer Instrument Co
Barrington IL) using copper-constantin thermocouple wires (Type T Omega
Engineering Inc Stamford CT) to an endpoint temperature of 74degC The cooked
patties were cooled and placed in a single layer on a tray and then overwrapped
in commercial PVC (water vapor transmission rate=15 g100 m224 h oxygen
transmission rate 880 cm3m224 h) and aluminum foil over the wrap The
patties were stored at 2degC in the dark and were assayed for the extent of oxidation
by odor sensory TBARS conjugated dienes and peroxide value analysis at days
0 1 3 5 7 for the first study (2)
In a second separate study a longer storage time study was completed to
examine the effect of antioxidants on the cooked ground turkey over a longer
time period The same procedure for antioxidant addition and meat sample
preparation was used However in the second study the samples were stored for
a total of 15 days (5 6) Samples were collected at days 0 1 3 5 7 10 13 15 for
TBARS conjugated dienes peroxide values and pH determinations
33 Thiobarbituric Acid Reactive Substances (TBARS)
Lipid oxidation was assessed by the 2-thiobarbituric acid (TBA) method of
Tarladgis and others (4) and Yu et al (5) Briefly 10 g of meat was homogenized
with 50 mL of deionized water using a homogenizer (IKAreg T25 digital Ultra-
Turrax Wilmington NC USA) The homogenate was filtered through 1
Whatman paper Five mL of the clear filtrate was mixed with 5 mL TBA reagent
35
containing 002 M TBA in 90 glacial acetic acid The mixture was capped
vortexed for 30 secs and incubated in the dark for 15-18 hrs at room temperature
After the color developed the mixture was measured for absorbance at 532 nm
against a blank (deionized water) The absorbance was converted to TBAR values
using 1133- tetraethoxypropane to prepare a standard curve Triplicates of 10 g
samples were prepared for each treatment TBA value is expressed as mg MDA
kg meat
34 Conjugated Dienes
Conjugated dienes (CD) were determined by the method described by
Juntachote and others (6) with slight modifications A cooked meat sample (05
g) was suspended in 5 mL of deionized water and homogenized using a digital
Ultra-Turrax T25 (IKAreg Wilmington NC USA) to obtain a smooth slurry A 05
mL aliquot of this suspension was mixed with 5 mL of extracting solution
containing hexane and isopropanol (31 vv) and mixed for 1 min using a vortex
mixer After centrifugation at 2000 g for 5 mins the supernatant was collected
and the absorbance of the supernatant was determined at 233 nm The
concentration of conjugated dienes was calculated using a molar extinction
coefficient of 25200 M-1cm-1 and the result were expressed as nmole of
conjugated dienes per mg meat sample
35 Peroxide Value
The peroxide value was determined according to the AOAC method 96533
(Association of Official Analytical Chemists) (13) with a few modifications The
lipids from meat samples were extracted by the method of Kim et al (7) First 5 g
of meat sample was broken into small pieces and placed in a water bath at 60˚C
to melt the fat for 30 mins The meat was extracted with a solution containing
acetic acid chloroform (32) and then filtered with Whatman 1 filter paper A
saturated solution of potassium iodide (KI 05 mL) was added to the filtrate The
solution color changed to yellow and then 30 mL of deionized water was added
The mixture was allowed to let stand at room temperature for at least 5 mins and
the color would turn to pale to bright yellow Before titrating with 001 N of
36
sodium thiosulfate (Na2SO3) 05 mL of 1 starch solution was added (a color
changed occurred - the color turned purple to blue-black) The PV is expressed as
meq O2kg lipid
36 pH value
To determine the pH of the meat samples cooked meat samples (10 g)
were blended with 50 mL deionized water for 15 seconds in a homogenizer
(Ultra-Turrax T25 IKAreg Wilmington NC USA) The pH was measured with a
pH meter (Accumet Basic model AB 15 Fisher Scientific Company) The pH
meter was calibrated daily with standard buffers of pH 40 and 70 at 25˚C
37 Sensory Evaluation
Trained panelists (n=15) were recruited from among University of Illinois
graduate students and staff The panelists were prepared using an extensive
training program During each training session panel members practiced and
discussed the techniques developed for sample presentation score sheet terms
and odor sensory evaluation method A panel leader led the panelists to develop
terms to describe the aroma characteristics of fresh cooked turkey meat including
the aroma characteristics of cooked poultry with or without the added Keluak
extract Panel members were trained regularly for 7 sessions for total of two
weeks to identify and discriminate aroma differences Some of the terms were
derived from reference standards including fresh boiled ground turkey meat
lard oxidized vegetable oil hard-boiled egg and wet cardboard (Table 32) The
panelists agreed on the following aroma descriptors for warm-over-flavor meaty
fatty rancid eggy and cardboardy These descriptors were judged for the
presence and overall intensity using a 15 cm-structured line scale (0 = none 15 =
extreme) along with an anchor value for each respective standard Table 2
showed the form used to evaluate the aroma descriptors described above
Cooked patties were uniformly cut into four pie-shaped wedges and placed
in a sniff bottle (Nalgene Teflon PTFE wash bottle Nalge Company Rochester
NY USA) covered with foil to hide the identity of the sample inside Each sample
represented a treatment labeled with three-digit random numbers and were
37
served at random order during each test session The samples were held in an
incubator (45degCplusmn 1degC) for 30 mins prior to presentation to the panelists The
panelists were asked to clean their palate by chewing a piece of unsalted saltine
crackers and rinse with water prior to evaluating the samples Samples were
sniffed Four samples were evaluated for each test session Roasted coffee beans
were presented for panelists to clear the palate between samples Standard
references were prepared daily The second session replicates of the first session
was conducted one week after the first session
38 Statistical Analysis
Statistical assessment was carried out with the program SAS Data were
analyzed as 4 (treatments) by 5 (days of storage) The results from the TBARs
analysis peroxide value analysis conjugated dienes analysis and the
odorsensory analysis were analyzed using one-way analysis of variance
(ANOVA) Differences were considered significant at the P lt 005 level
Comparison of treatment means was based on Fisherrsquos Least Significant
Difference (LSD)
38
39 Tables
Table 31 Formulation of Cooked Ground Turkey Meat for Each Treatment
TREATMENTS
Control BHT AO 200ppm AO 400ppm
INGREDIENTS
Jenny-O 15 fat Ground Turkey
(g) 650 650 650 650
Salt (2 ww) (g) 13 13 13 13
BHT (002 of total fat) (g) 002
Keluak extract (mL)
2487 (002 g
phenolics)
4974 (004 g
phenolics)
Cold water (mL)5 by sample wt
(ww) 325 325 325 325
Table 32 Descriptive Odor Standards for Refrigerated Ground Turkey Meat
Descriptive Odor term Standard Location on the 15-cm line
Rancid Oxidized vegetable oil in water (1100 vv) 7
Cardboard 1 cm2 cardboard in 15 mL water 85
Eggy Fresh hard-boiled egg white (01 g) 9
Meaty Fresh boiled ground turkey meat in water (15 gv) 8
Fatty Lard (02 g) 9
39
310 References
1 Wettasinghe M Shahidi F Antioxidant and free radical-scavenging properties of ethanolic extracts of defatted borage (Borago officinalis L) seeds Food Chem 1999 67 399-414
2 Vara-Ubol S Bowers J Effect of alpha-tocopherol beta-carotene and sodium tripolyphosphate on lipid oxidation of refrigerated cooked ground turkey and ground pork J Food Sci 2001 66 662-667
3 Hassan O Fan L The anti-oxidation potential of polyphenol extract from cocoa leaves on mechanically deboned chicken meat (MDCM) Lwt-Food Science and Technology 2005 38 315-321
4 Tarladgis B Dugan L Pearson A Chemistry of 2-Thiobarbituric Acid Test for Determination of Oxidative Rancidity in Foods 2 Formation of Tba-Malonaldehyde Complex without Acid-Heat Treatment J Sci Food Agric 1964 15 602-amp
5 Yu L Scanlin L Wilson J Schmidt G Rosemary extracts as inhibitors of lipid oxidation and color change in cooked turkey products during refrigerated storage J Food Sci 2002 67 582-585
6 Juntachote T Berghofer E Siebenhandl S Bauer F The antioxidative properties of Holy basil and Galangal in cooked ground pork Meat Sci 2006 72 446-456
7 Kim YJ Jin SK Park WY Kim BW Joo ST Yang HS The Effect of Garlic Or Onion Marinade on the Lipid Oxidation and Meat Quality of Pork during Cold Storage J Food Qual 2010 33 171-185
8 Chye FY Sim KY Antioxidative and Antibacterial Activities of Pangium edule Seed Extracts International Journal of Pharmacology 2009 5 285-297
9 Kahkonen M Hopia A Vuorela H Rauha J Pihlaja K Kujala T Heinonen M Antioxidant activity of plant extracts containing phenolic compounds J Agric Food Chem 1999 47 3954-3962
10 Jayaprakasha G Selvi T Sakariah K Antibacterial and antioxidant activities of grape (Vitis vinifera) seed extracts Food Res Int 2003 36 117-122
11 Fardiaz D Romlah S Antioxidant Activity of Picung (Pangium edule Reinw) Seed In Development of Food Science and Technology in ASEAN Proceedings of the 4th ASEAN Food Conference Feb 17-21 1992 ASEAN Jakarta Indonesia 1992 12 Waterhouse A L Determination of Total Phenolics Current Protocols in
Food Analytical Chemistry 2002 I111-I118
40
13 Association of Official Analytical Chemists (1995) Official methods of analysis (16th ed) Washington DC Association of Official Analytical Chemists
41
Chapter 4 RESULTS AND DISCUSSION
41 Phenolic Extraction Yield
The phenolic extract yield using acetone water acetic acid (90 95 05)
extraction was 503 plusmn 140 g of extract per 70 g of defatted ground Keluak seed or
007 g phenolic extract per gram of defatted Keluak The samples contained
approximately 719 phenolic compounds by weight the values are equal to the
average plusmn standard deviation of the three replicate analyses This value was
moderately greater than that reported by Chye and Sim (1) which reported a
548 yield The total phenolic content as determined using Folin-Ciocalteau
reagent was 1973 plusmn 203 mg GAEg extract which was also moderately greater
than the result reported by Chye and Sim which was 1639plusmn 004 mg GAEg
extract (1) It is possible that the difference is due to the Keluak source Chye and
Sim obtained their seeds material from local indigenous markets in Kota
Kinabalu Sabah Malaysia (1) while the seeds used in this study were grown in
from Indonesia The geographical and horticultural differences could affect the
phenolic content and concentration of the seed
According to Kahkonen et al (2) different phenolic compounds can have
different responses in the Folin Ciocalteau method depending on their chemical
structure Therefore the antioxidant activity of an extract cannot be predicted
solely on its total phenolic content (3 4)
42 Effect of Keluak Extract and storage time on TBARS values during
refrigerated storage of cooked ground turkey
The TBARS values represent the content of secondary lipid oxidation
products particularly malonaldehyde The carbonyls are primarily responsible
for the production of off-flavors in oxidized meat and meat products Aldehydes
are formed by the oxidation of unsaturated fatty acids They react with the TBA
reagent to form a pink complex (TBA chromogen) with a maximum absorbance
at 532 nm The intensity of this pink color is directly related to the concentration
of the TBA-reactive substances in the original sample The results of the TBARs
analysis for the preliminary study (7 days) and the extended storage study (15
days) are shown in Tables 41a b and Figures 41a b respectively Overall lipid
42
oxidation increased substantially as the refrigerated storage progressed due to
the effects of heating and in combination with storage under aerobic conditions
On the first day of analysis for both the 7 and 15 days storage study all the
antioxidant treated samples (BHT and both concentrations of the Keluak
extracts) the TBARS values were significantly lower than the control an
indication that the antioxidants had a positive effect in suppressing oxidation
Similar findings were observed by Juntachote et al and Teets et al (5 6) TBARS
values for both 7 and 15 days storage study ranges from 035- 475 mg MDA kg
meat which was comparable to other study by Juntachote (5) for 14 days of
storage study of pork meat There were examining the effect other natural
sources of antioxidants on oxidation during refrigerated storage of cooked meat
During the preliminary study (Table 41a) the control and BHT treatments
did not show significant differences (Pgt005) from day 1-7 However both of the
Keluak extract treatments showed a significant (Plt005) effect on the
suppression of the progression of lipid oxidation as compared to the control
(Figure 41a)
On the other hand during the 15 day study all the samples with added
antioxidants had significantly lower TBAR values compared to the control
throughout the entire storage period This indicates that both the commercial
treatment and the treatment with Keluak extracts provided substantial protection
to the meat with respect to lipid oxidation The efficacy of the Keluak extracts to
inhibit lipid oxidation is probably related to their phenolic content The results of
this study showed agreement with those obtained by Fardiaz and Romlah (14)
which stated that the addition of Keluak extract to palm oil lengthened the
oxidation induction period from 22 hours to 50 hours
Lipid oxidation was considerably greater with longer storage times due to
the exposure to oxygen TBARs measure the formation of secondary lipid
oxidation products which contribute to WOF in oxidized meat Heat increases the
release of non-heme iron from the heme pigments a major catalyst for lipid
oxidation in cooked meats (7) Cooking also alters cellular compartmentalization
and exposes membrane phospholipids to molecular oxygen and metal ions (8)
43
resulting in greater amounts of lipid oxidation (9) The addition of antioxidants
during processing cooking or packaging can be done to increase the oxidative
stability of cooked meat (10)
43 Effect of Keluak Extract and Storage Time on Conjugated Diene
Content during Refrigerated Storage of Cooked Ground Turkey
Meat
The development of conjugated dienes (CD) is related to the formation of
hydroperoxides found in the extracted lipids of the cooked ground turkey
Unsaturated fatty acid double bonds occur naturally in a methylene interrupted
structure As meat begins to oxidize the double bonds of these fatty acids are
altered creating conjugated systems which can be measured
spectrophotometrically (6) During lipid peroxidation non-conjugated double
bonds (C=CndashCndashC=C) which are present naturally in unsaturated lipids are
converted to conjugated double bonds (C=CndashC=C) with a large increased in
absorption at 232ndash234 nm (11) In the preliminary study there were no significant differences among the
antioxidant treated sample and the control (Pgt005) except on day 5 (Figure 42a
and Table 42a) The CD value for all the treatments peaked at day 5 and the
samples treated with antioxidants were significantly different that the control
(Plt005)
Meanwhile during the second storage study (Table 42b and Figure 42b)
when the CD values were compared to the control on day 0 and day 1 the 002
BHT and both of the Keluak extract treated samples were not significantly
different (Pgt005) However from day 3 on all the antioxidant-treated samples
had less CD formation than the control (Plt005) The CD content of the control
generally increased especially during the last 5 days (Day 10 13 and 15) of the
study Additionally cooked ground turkey treated with Keluak at 400 ppm had
slightly lower concentrations of conjugated dienes compared to cooked ground
turkey containing Keluak extract at 200 ppm and the commercial antioxidant
(BHT) The trend of CD formation was similar to several other studies (5 6 12
13) They generally observed that the CD concentration for most samples peaked
44
on Day 3 and decreased thereafter This phenomenon of decreased CD is likely
due to the decomposition of the conjugated diene hydroperoxides into secondary
oxidation products over time Conjugated dienes hydroperoxides are expected to
decompose into secondary products as was observed in this study According to
Frankel (15) the formation of conjugated dienes which is related to the
production of hydroperoxides occurs in the early stages of lipid oxidation According to Estevez et al (17) measurement of conjugated dienes (CD) in
meat products containing elevated levels of PUFA is limited depending on the
fatty acid composition of the sample as well as the presence of other non-
hydroperoxides CDs In agreement with Grau et al (18) the TBA test showed a
higher sensitivity with respect to lipid oxidation than did the CD determination
44 Effect of Keluak extract and storage time on peroxide value during
refrigerated storage of cooked ground turkey
Peroxide values (PV) were also used to assess the level of lipid oxidation in
cooked ground turkey during storage at 2˚C (Table 43 and Figure 43) However
while there were differences between the control and samples treated with AOs
on a few days the result of this study showed that treatments had no significant
effect (Pgt005) on the peroxide values compared to the control Generally based
on the results in Table 4 and Figure 4 the PVs increased during storage and
peaked on day 10 At the time it is possible that much of the polyunsaturated
membrane lipids may have been oxidized at that point so that further storage
and oxidation resulted in a decrease in the concentration of peroxides and thus
the PV
The PV differences among the samples did not provide proof that any of
the AOs were effective It is not clear why the PV analysis did not provide any
evidence of AO efficacy According to Estevez (17) the sensitivity of this method
is about 05 miliEquivalentkg of lipid Lower peroxide values cannot be
measured satisfactorily by the AOCS method because of the uncertainty with the
iodometric titration endpoint unless the iodine-starch end is determined
potentiometrically at levels as low as 006 Eqkg lipid The iodometric method is
highly empirical and very small procedural differences can cause variation in the
45
results (19) Two major sources of error in this test could be the liberation of
iodine by air oxidation of the KI and absorption of iodine by fatty acid double
bonds (17)
4 5 Effect of Keluak Extract and storage time on Odor of Refrigerated
Cooked Ground Turkey
No significant interaction (Pgt 005) occurred between antioxidant and
storage time for most of the odor characteristics (Tables and Figures 44-48)
For meaty odor characteristic (Figure and Table 44) the score of all the
treatments over the 7 days of storage did not show significant differences
(Pgt005) The scores ranged from 502 ndash 783 which was slightly below the
freshly boiled turkey meat standard for meaty (which was ranked 8 in the 15-cm
line scale) Therefore the panelists were unable to score and detect the cooked
meat aroma differences in the treated samples relative to the standard reference
The meaty aroma in this study was used to determine if there were possible
masking effects from the AO treatments
For the rancid odor (Figure and Table 45) both of the Keluak treated
samples were perceived as more rancid than both control and BHT after day 1
Overall both of the Keluak treated samples were ranked higher than the control
and BHT which disagrees with the results of TBA test However there was no
significant difference among the treatments between day 3-7 According to Ruth
(20) rancidity as a measure of lipid oxidation is usually best measured by the
concentration of TBARS
The minimum TBA values that corresponds to dark chicken meat samples
that were significantly different in rancid aroma was 1933 μg MDAkg of meat
(21) For consumer acceptability the TBA values must be less than 785 μg of
MDAkg (21) The results from Bou et al (21) were comparable to the results
reported by Gray and Pearson (22) showing that rancid flavor in meats is initially
detected between 500 and 2000 μg of MDAkg of meat In addition OrsquoNeill et
al (23) found that the threshold for WOF detection in cooked dark chicken meat
was at TBA values ge800 μg of MDAkg of meat Since chicken and turkey meat
46
have a comparable PUFA content those values were considered useful in this
experiment On the other hand the odor score for Eggy cardboard and fatty were
statistically not different (Pgt 005) Panelists were unable to detect differences
which could be to different reasons such as that Keluak extract has an aroma
masking effect that confuses the panelists with the ldquooff-odorrdquo The Keluak did
have a slight aroma and it is likely that it masked the effects of storage on lipid
oxidation The aroma of Keluak has been described as bitter dirt-like and
chocolate-like odor (16) This aroma masking could be perceived as undesirable
by the panelists and it might have been mistaken as an off-odor or as an oxidized
sample even though the TBARs and CD data showed otherwise
4 6 Effect of Keluak Extract and storage time on pH of Refrigerated
Cooked Ground Turkey
Table 49 shows the effect of antioxidant treatments in pork muscle on pH
values during storage at 2˚C The values of the pH ranged between 633-668
Generally there are no correlations of pH value among the treatments during
storage The trend for the pH value is inconclusive
47
47 Figures Figure 41a The profile of TBARS in cooked ground turkey treated with various
antioxidants during storage at 2˚C- A Preliminary Study
K200 and K400 represent treatments with Keluak extract at concentration of 200 and 400 ppm respectively
0000
1000
2000
3000
4000
5000
6000
0 2 4 6 8
TBA
RS
(mg
MD
Ak
g m
eat
)
Storage Days
Control
BHT
K200
K400
48
Figure 41b The profile of TBARS in Cooked Ground Turkey Treated with Various Antioxidants During Storage at 2˚C- Extended Storage Time
K200 and K400 represent Keluak extract at concentration of 200 and 400 ppm respectively
Figure 42a Conjugated dienes values of different antioxidant treatments over storage at
2˚C - A Preliminary Study
K200 and K400 represent treatments with Keluak extract at concentration of 200 and 400 ppm
respectively
000
100
200
300
400
500
600
0 5 10 15 20
TBA
RS
(mg
MD
Ak
g m
eat
)
Storage time (days)
Control
BHT 002
K200
K400
0000
0050
0100
0150
0200
0250
0300
0350
0400
0450
0 1 2 3 4 5 6 7 8
Co
nju
gate
d D
ien
es
(nm
ol
mg
me
at)
Days
Control
BHT
K200
K400
49
Figure 42b Conjugated dienes values of different antioxidant treatments over storage at
2˚C- Extended Storage Time
K200 and K400 represent treatments with Keluak extract at concentration of 200 and 400 ppm respectively
Figure 43 Peroxide Value (meq kg meat) of Different Antioxidant treatments over
Storage at 2˚C
K200 and K400 represent treatments with Keluak extract at concentration of 200 and 400 ppm
respectively
000
002
004
006
008
010
012
014
016
0 5 10 15 20
Co
nju
gate
d D
ien
es
(nm
ol
mg
me
at)
Storage (days)
Control
BHT 002
K200
K400
0
05
1
15
2
25
3
35
4
0 2 4 6 8 10 12 14 16
PV
(m
eq
kg
me
at)
Storage Time (Days)
Control
BHT 002
K200
K400
50
Figure 44 Intensity of Meaty Odor Descriptor in Cooked Ground Turkey Meat Treated
with Different Antioxidants Rated in a 15-cm Line Scale
K200 and K400 represent Treatment with Keluak extract at concentration of 200 and 400 ppm
respectively
Figure 45 Intensity of Rancid Odor Descriptor in Cooked Ground Turkey Meat Treated
with Different Antioxidants Rated in a 15-cm Line Scale
K200 and K400 represent Treatment with Keluak extract at concentrations of 200 and 400 ppm
respectively
000
200
400
600
800
1000
1200
0 2 4 6 8
15
cm
Lin
e s
cale
(av
era
ge)
Days
CONTROL
BHT
K200
K400
Linear (BHT)
-100
000
100
200
300
400
500
600
700
800
0 2 4 6 8
15
cm
Lin
e s
cale
(av
era
ge)
Days
Control
BHT
K200
K400
51
Figure 46 Intensity of Eggy Odor Descriptor in Cooked Ground Turkey Meat Treated
with Different Antioxidants Rated in a 15-cm Line Scale
K200 and K400 represent Treatment with Keluak extract at concentrations of 200 and 400 ppm
respectively
Figure 47 Intensity of Cardboard Odor Descriptor in Cooked Ground Turkey Meat
Treated with Different Antioxidants Rated in a 15-cm Line Scale
K200 and K400 represent Treatment with Keluak extract at concentrations of 200 and 400 ppm
respectively
000
100
200
300
400
500
600
700
800
900
1000
0 2 4 6 8
15
cm
Lin
e s
cale
(av
era
ge)
Days
Control
BHT
K200
K400
-1
0
1
2
3
4
5
6
7
0 2 4 6 8
15
cm
Lin
e s
cale
(av
era
ge)
Days
Control
BHT
K200
K400
52
Figure 48 Intensity of Fatty Odor Descriptor in Cooked Ground Turkey Meat Treated
with Different Antioxidants Rated in a 15-cm Line Scale
K200 and K400 represent Treatment with Keluak extract at concentrations of 200 and 400 ppm
respectively
000
100
200
300
400
500
600
700
800
900
0 2 4 6 8
15
cm
Lin
e s
cale
(av
era
ge)
Days
Control
BHT
K200
K400
53
48 Tables
Table 41a TBARS Value of Cooked Ground Turkey Meat Treated with Various Antioxidants during Storage at 2˚C- A Preliminary Study
TBARS (mg MDAkg meat) Average
Storage (Day) Control BHT 002 Keluak 200ppm Keluak 400ppm
0
131plusmn009Aa 094plusmn021Ba 050plusmn004Ca 037plusmn010Ca
1
189plusmn003Aab 161plusmn025Aab 080plusmn006Ba 057plusmn026Bab
3
243plusmn010Ac 236plusmn025Abc 111plusmn022Bab 055plusmn008Cab
5
397plusmn016Ad 319plusmn064Acd 170plusmn025Bbc 108plusmn023Bb
7
473plusmn076Ad 373plusmn074ABd 217plusmn040ACc 101plusmn044Cab
Different letters (A-D) within a row indicates that mean values are significantly different (Plt 005) Different letters within a column (a-d) within the same treatment are significantly different (Plt005)
Table 41b TBARS Value of Cooked Ground Turkey Meat Treated with Various Antioxidants during Storage at 2 ˚C- Extended Storage Time
TBARS (mg MDAkg meat) Average
Storage (day) Control BHT 002 K200 K400
0 129 plusmn 008Ae 091plusmn 004Bcd 065plusmn 015Be 101plusmn 003Cf
1 159plusmn 008Ade 076plusmn 005Cd 083plusmn 012Ce 127plusmn 006Bf
3 220plusmn 011Acd 074plusmn 004Dd 119plusmn 003Cd 160plusmn 004Be
5 258plusmn 014Ac 082plusmn 006Cd 076plusmn 014Ce 150plusmn 004Bd
7 377plusmn 001Ab 109plusmn 002Ccb 158plusmn 006Bc 160plusmn 006Bd
10 405plusmn 061Aab 121plusmn 009Bb 197plusmn 012Bb 195plusmn 009Bc
13 465plusmn 014Aa 151plusmn 004Ca 224plusmn 003Bab 218plusmn 003Bb
15 459plusmn 024Aa 154plusmn 013Da 231plusmn 014Ca 284plusmn 010Ba
Different letters (A-D) within a row indicates that mean values are significantly different (Plt 005) Different letters within a column (a-f) within the same treatment are significantly different (Plt005)
K200 and K400 represent treatments with Keluak extract at concentration of 200 and 400 ppm
respectively
54
Table 42a Conjugated Dienes Concentrations with Antioxidant Treatments and Storage
At 2˚C- A Preliminary Study
Conj Dienes (nmolemg meat)
Storage (Days) Control BHT 002 K200 K400
0 015plusmn003Abc 022plusmn001Aa 013plusmn001Ab 020plusmn008Aa
1 012plusmn001Abc 012plusmn003Ab 011plusmn001Ab 019plusmn001Bab
3 006plusmn000Ac 003plusmn002Ac 002plusmn002Ab 004plusmn002Ab
5 038plusmn000Aa 024plusmn001Ba 027plusmn007ABa 021plusmn001Ba
7 023plusmn008Ab 026plusmn001Aa 029plusmn003Aa 016plusmn001Aab
Different letters (A-C) within a row indicates that mean values are significantly different (Plt 005) Different letters within a column (a-d) within the same treatment are significantly different (Plt005)
K200 and K400 represent treatments with Keluak extract at concentration of 200 and 400 ppm
respectively
Table 42b Conjugated Dienes Concentrations After Antioxidant Treatments and
Storage At 2˚C- Extended Storage Time
Conjugated Dienes (nM mg meat)
Storage (Days) Control BHT 002 K200 K400
0 013plusmn 001Aab 009plusmn000Bab 010plusmn 000Ba 010plusmn 001Ba
1 008plusmn 001Ac 008plusmn 001Ab 008plusmn 000Abc 007plusmn 001Ab
3 011plusmn 000Ab 009plusmn 001Bab 008plusmn 000Bbc 006plusmn 000Cb
5 012plusmn001Ab 008plusmn 001B b 006plusmn 000Bd 006plusmn 000Bb
7 011plusmn001Abc 008plusmn 000B ab 006plusmn 001Bcd 007plusmn 000Bb
10 014plusmn 000Aa 009plusmn 000Bab 009plusmn 001Bab 007plusmn 000Cb
13 014plusmn 001Aa 009plusmn 000Bab 008plusmn 000Bbc 006plusmn 000Cb
15 014plusmn 000Aa 010plusmn 001Ba 008plusmn 001BCbcd 007plusmn 000Cb
Different letters (A-C) within a row indicates that mean values are significantly different (Plt 005) Different letters within a column (a-d) within the same treatment are significantly different (Plt005)
K200 and K400 represent treatments with Keluak extract at concentration of 200 and 400 ppm
respectively
55
Table 43 Peroxide Value (meq kg meat) of Different Antioxidant treatments during
Storage of cooked ground turkey meat at 2˚C
PV (meq kg meat)
Storage (Days) Control BHT 002 K200 K400
0 110plusmn 042Abc 070plusmn 014Ae 080plusmn 028Ad 130plusmn 014Acd
1 230plusmn 014Aab 130plusmn 014Bd 090plusmn 014BCd 070plusmn 014Cd
3 080plusmn 000Ac 070plusmn 014Ae 070plusmn 014Ad 070plusmn 014Ad
5 280plusmn 028Aa 140plusmn 000Bcd 110plusmn 014Bcd 080plusmn 028Bd
7 170plusmn 042Aabc 190plusmn 014Ac 195plusmn 021Abc 225plusmn 049Abc
10 310plusmn 042Aa 330plusmn 014Aa 290plusmn 042Aa 340plusmn 028Aa
13 255plusmn 007Aa 265plusmn 021Ab 240plusmn 028Aab 260plusmn 028Aab
15 255plusmn 064Aa 150plusmn 014ABcd 086plusmn 006Bd 100plusmn 028Bd
Different letters (A-C) within a row indicates that mean values are significantly different (Plt 005) Different letters within a column (a-e) within the same treatment are significantly different (Plt005)
K200 and K400 represent Treatment with Keluak extract at concentrations of 200 and 400 ppm
respectively
Table 44 Intensity of Meaty Odor Descriptor in Cooked Ground Turkey Meat Treated with Different Antioxidants Rated in a 15-cm Line Scale
Storage (Day) Control BHT 002 K200 K400
0 595plusmn250Aa 727plusmn144Aa 632plusmn202Aa 606plusmn189Aa
1 783plusmn208Aa 731plusmn174ABa 543plusmn220Ba 542plusmn294Ba
3 613plusmn201Aa 693plusmn143Aa 502plusmn266Aa 552plusmn228Aa
5 734plusmn277Aa 710plusmn290Aa 474plusmn253Aa 487plusmn263Aa
7 694plusmn296Aa 751plusmn265Aa 532plusmn259Aa 543plusmn236Aa
Different letters (A-C) within a row indicates that mean values are significantly different (Plt 005) Different letters within a column (a-b) within the same treatment are significantly different (Plt005)
K200 and K400 represent Treatment with Keluak extract at concentrations of 200 and 400 ppm
respectively
56
Table 45 Intensity of Rancid Odor Descriptor in Cooked Ground Turkey Meat Treated
with Different Antioxidants Rated in a 15-cm Line Scale
Storage (Day) Control BHT 002 K200 K400
0 228plusmn194Aa 193plusmn175Aa 334plusmn231Aa 350plusmn274Aa
1 177plusmn194Aa 172plusmn163Aa 392plusmn274ABa 426plusmn265Ba
3 260plusmn210Aa 272plusmn265Aa 419plusmn306Aa 337plusmn247Aa
5 344plusmn255Aa 329plusmn215Aa 427plusmn248Aa 395plusmn253Aa
7 408plusmn300Aa 289plusmn244Aa 448plusmn241Aa 385plusmn244Aa
Different letters (A-B) within a row indicates that mean values are significantly different (Plt 005) Different letters within a column (a-b) within the same treatment are significantly different (Plt005)
K200 and K400 represent Treatment with Keluak extract at concentrations of 200 and 400 ppm
respectively
Table 46 Intensity of Eggy Odor Descriptor in Cooked Ground Turkey Meat
Treated with Different Antioxidants Rated in a 15-cm Line Scale
Storage (Day) Control BHT 002 K200 K400
0 643plusmn242Aa 513plusmn244Aa 502plusmn324Aa 565plusmn287Aa
1 597plusmn248Aab 476plusmn321Aa 599plusmn332Aa 584plusmn360Aa
3 345plusmn258Ab 400plusmn270Aa 515plusmn335Aa 509plusmn425Aa
5 364plusmn303Aab 424plusmn320Aa 475plusmn269Aa 469plusmn180Aa
7 473plusmn306Aab 364plusmn210Aa 485plusmn268Aa 431plusmn305Aa
Different letters (A-C) within a row indicates that mean values are significantly different (Plt 005) Different letters within a column (a-e) within the same treatment are significantly different (Plt005)
K200 and K400 represent Treatment with Keluak extract at concentrations of 200 and 400 ppm
respectively
57
Table 47 Intensity of Cardboard Odor Descriptor in Cooked Ground Turkey Meat
Treated with Different Antioxidants Rated in a 15-cm Line Scale
Storage (Day) Control BHT 002 K200 K400
0 299plusmn222Aa 209plusmn182Aa 261plusmn198Aa 312plusmn157Aa
1 262plusmn249Aa 180plusmn192Aa 339plusmn238Aa 342plusmn229Aa
3 299plusmn203Aa 284plusmn254Aa 388plusmn235Aa 287plusmn185Aa
5 252plusmn243Aa 290plusmn190Aa 309plusmn193Aa 320plusmn204Aa
7 301plusmn210Aa 273plusmn253Aa 337plusmn195Aa 284plusmn205Aa
Different letters (A-C) within a row indicates that mean values are significantly different (Plt 005) Different letters within a column (a-e) within the same treatment are significantly different (Plt005)
K200 and K400 represent Treatment with Keluak extract at concentrations of 200 and 400 ppm
respectively
Table 48 Intensity of Fatty Odor Descriptor in Cooked Ground Turkey Meat Treated with Different Antioxidants Rated in a 15-cm Line Scale
Storage (Day) Control BHT 002 K200 K400
0 344plusmn226aA 350plusmn256aA 395plusmn309aA 395plusmn277aA
1 417plusmn285aA 389plusmn230aA 401plusmn345aA 438plusmn287aA
3 388plusmn220aA 378plusmn229aA 396plusmn328aA 403plusmn285aA
5 479plusmn252aA 461plusmn293aA 389plusmn255aA 428plusmn320aA
7 460plusmn288aA 492plusmn286aA 426plusmn281aA 428plusmn340aA
Different letters (A-C) within a row indicates that mean values are significantly different (Plt 005) Different letters within a column (a-e) within the same treatment are significantly different (Plt005)
K200 and K400 represent Treatment with Keluak extract at concentrations of 200 and 400 ppm
respectively
58
Table 49 pH Values of Cooked Ground Turkey Treated with Different
Antioxidants Stored at 2˚C
pH Value
Storage (Day) Control BHT 002 K200 K400
0 665plusmn 002Aab 644plusmn 003Bbc 646plusmn 004Bbc 658plusmn 003Aab
1 659plusmn 003Ab 643plusmn 003Cbc 651plusmn 001Babc 662plusmn 001Aab
3 645plusmn 003Bc 634plusmn 002Cd 643plusmn 004Bc 654plusmn 000Ab
5 663plusmn 002Aab 640plusmn 002Cc 645plusmn 004Cc 654plusmn 002Bb
7 647plusmn 001Ac 633plusmn 003Bc 648plusmn 004Aabc 646plusmn 006Ac
10 665plusmn 001Aab 646plusmn 002Dbc 654plusmn 001Cab 660plusmn 003Bab
13 665plusmn 002Aab 648plusmn 002Cab 655plusmn 002Ba 664plusmn 002Aa
15 668plusmn 001Aa 651plusmn 001Da 655plusmn 001Ca 663plusmn 001Ba
Different letters (A-D) within a row indicates that mean values are significantly different (Plt 005) Different letters within a column (a-c) within the same treatment are significantly different (Plt005)
K200 and K400 represent treatments with Keluak extract at concentrations of 200 and 400 ppm
respectively
59
49 References
1 Chye FY Sim KY Antioxidative and Antibacterial Activities of Pangium edule Seed Extracts International Journal of Pharmacology 2009 5 285-297
2 Kahkonen M Hopia A Vuorela H Rauha J Pihlaja K Kujala T Heinonen M Antioxidant activity of plant extracts containing phenolic compounds J Agric Food Chem 1999 47 3954-3962
3 Jayaprakasha G Selvi T Sakariah K Antibacterial and antioxidant activities of grape (Vitis vinifera) seed extracts Food Res Int 2003 36 117-122
4 Gray J Macdonald B Pearson A Morton I Role of Nitrite in Cured Meat Flavor - a Review J Food Prot 1981 44 302-amp
5 Juntachote T Berghofer E Siebenhandl S Bauer F The antioxidative properties of Holy basil and Galangal in cooked ground pork Meat Sci 2006 72 446-456
6 Teets AS Were LM Inhibition of lipid oxidation in refrigerated and frozen salted raw minced chicken breasts with electron beam irradiated almond skin powder Meat Sci 2008 80 1326-1332
7 Han D McMillin K Godber J Bidner T Younathan M Marshall D Hart L Iron Distribution in Heated Beef and Chicken Muscles J Food Sci 1993 58 697-700
8 Ahn D Wolfe F Sim J Prevention of Lipid Oxidation in Precooked Turkey Meat Patties with Hot Packaging and Antioxidant Combinations J Food Sci 1993 58 283-287
9 Asghar A Gray J Buckley D Pearson A Booren A Perspectives on Warmed-Over Flavor Food Technol 1988 42 102-108
10 Kingston E Monahan F Buckley D Lynch P Lipid oxidation in cooked pork as affected by vitamin E cooking and storage conditions J Food Sci 1998 63 386-389
11 Kulas E Ackman R Different tocopherols and the relationship between two methods for determination of primary oxidation products in fish oil J Agric Food Chem 2001 49 1724-1729
12 Srinivasan S Xiong Y Decker E Inhibition of protein and lipid oxidation in beef heart surimi-like material by antioxidants and combinations of pH NaCl and buffer type in the washing media J Agric Food Chem 1996 44 119-125
13 Lee M Choi J Choi Y Han D Kim H Shim S Chung H Kim C The antioxidative properties of mustard leaf (Brassica juncea) kimchi extracts on
60
refrigerated raw ground pork meat against lipid oxidation Meat Sci 2010 84 498-504
14 Fardiaz D Romlah S Antioxidant Activity of Picung (Pangium edule
Reinw) Seed In Development of Food Science and Technology in ASEAN
Proceedings of the 4th ASEAN Food Conference Feb 17-21 1992 ASEAN
Jakarta Indonesia 1992
15 Frankel E N Lipid oxidation Dundee Scotland The Oily Press Ltd 1998 Vol 10 pp 13ndash41 16 Ma Amy A Peranakan favorite is ayam buah keluak Chicken stewed with black nuts at True Blue Restaurant Wall Street Journal (Online) New York NY Dec 16 2010 Retrieved July 20 2011 from httpproquestumicompqdwebdid=2214039511ampsid=1ampFmt=3ampclientId=36305ampRQT=309ampVName=PQD
17 Esteacutevez M Morcuende D and Ventanas S Determination of Oxidation
Nollet Leo M LToldraacute Fidel (Eds) Handbook of Muscle Foods Analysis Boca
Raton CRC Press 2009 221-240
18 Grau A Codony R Rafecas M Barroeta A Guardiola F Lipid
hydroperoxide determination in dark chicken meat through a ferrous oxidation-
xylenol orange method J Agric Food Chem 2000 48 4136-4143
19 Shahidi F Janitha P Wanasundara P Phenolic Antioxidants Crit Rev Food Sci Nutr 1992 32 67-103
20 Ruth SM Techniques for sampling and identification of volatile compounds contributing to sensory perception In Nollet Leo M LToldraacute Fidel (Eds) Handbook of Muscle Foods Analysis Boca Raton CRC Press 2009 503-523
21 Bou R Guardiola F Grau A Grimpa S Manich A Barroeta A Codony R Influence of dietary fat source alpha-tocopherol and ascorbic acid supplementation on sensory quality of dark chicken meat Poult Sci 2001 80 800-807
22 Gray J I and A M Pearson Rancidity and warmed over flavour In Pearson A M and Dutson T R (Eds) Advances in Meat Research Vol 3 Nostrand-Reinbold Co New York NY 1987 221ndash269 23 OrsquoNeill L M K Galvin P A Morrissey and D J Buckley Comparison of effects of dietary olive oil tallow and vitamin E on the quality of broiler meat and meat products Br Poult Sci 1998 39 365ndash371
61
Chapter 5 CONCLUSION AND FUTURE WORK
The results of the present study indicated that the Keluak extract
incorporated into cooked ground turkey can reduce lipid oxidation The addition
of Keluak extracts at 200 and 400 ppm had a positive effect on reducing the
TBAR values and the conjugated dienes content compared to the control without
added AOs during storage at 2˚C for 15 days The Keluak extract used in this
study was comparable to BHT (002) in reducing lipid oxidation in meat
Peroxide value analysis did not differentiate between the control and the
treatments on the extent of lipid oxidation Due to confusion of the odor
components in the Keluak extracts by the panelists there were no significant
differences between the treatments in the odor sensory evaluation
Keluak seed is a culinary spice with no known toxic effect Its moderate
pungent aroma makes it valued as a traditional ethnic food flavorant in parts of
South East Asia With its substantial phenolic content and antioxidant properties
it could be an effective source of natural antioxidants However the application
of this natural antioxidant might be limited in Western cultures due to its effect
on the color and odor of meat products Further investigations are needed to
identify selective extraction and clean-up techniques that could be used to
eliminate the color and odor problem Other chemical analysis methods that
might provide better information on the extent of oxidation in meat products
include the p-anisidine value Food Oil Sensor (FOS) and Gas chromatography
techniques (GC analysis) of selected volatiles
7
high temperatures can combine to produce ether-linked dimers (ROR) and
carbon-carbon linked dimers (RR) Alkyl radicals can combine with peroxy
radicals to generate peroxy-linked dimers (ROOR) (30-32)
Hydroperoxides the primary initial products of lipid oxidation can
breakdown as soon as they are formed The decomposition can be catalyzed by
transition metals particularly iron or copper or by elevated temperatures
gt100degC Hydroperoxide decomposition can involve several complex pathways
forming a wide variety of volatile and non-volatile secondary products such as
aldehydes ketones alcohols acids and hydrocarbons which can affect flavor
greatly Some of the volatile aldehydes can be extremely potent and can affect
flavor of food at concentrations less than 1 ppm (31) Another important
termination reaction involves an antioxidant (AH) (30) which will be discussed
later in the chapter
23 Lipid Oxidation in Meat
Meat can oxidize very rapidly post-mortem The rate and degree of lipid
oxidation are affected by factors that include meat composition fatty acid
content processing conditions and chemical additives in the meat products (3)
It is generally agreed that lipid oxidation in muscle foods begins immediately
after slaughter in the highly unsaturated phospholipids fraction in the subcellular
membranes (25) Botsoglou et al (25) added that in most cases fresh meat has an
acceptable stability with respect to oxidation but processing operations such as
freezing and thawing mechanical deboning mincing restructuring the addition
of salt and refrigeration can lead to increased oxidation due to the destruction of
cellular structure and functions
Cooked or pressure-treated meat and meat products can be more
susceptible to oxidation since endogenous antioxidant enzymes may denature
and lose their activities while iron-containing proteins may become a source of
catalytic iron
Poultry meat is particularly susceptible to lipid oxidation due to its high
content of polyunsaturated lipids pigments metal catalysts and various other
8
oxidizing agents (25) This implies that even low-fat poultry meat products are
susceptible to lipid oxidation since fat reduction primarily reflects a reduction in
triacylglycerides while the phospholipid fraction which is high in
polyunsaturated fat is much less affected (34) Another factor is that species
differences in susceptibility to lipid oxidation are largely determined by the level
of poly-unsaturated fatty acid (PUFA) present in meat Thus the extent of lipid
oxidation in cooked meat is directly related to the level of unsaturated fatty lipids
with susceptibility to oxidation decreasing in the order of chicken gt pork gt beef gt
lamb (4) Chicken has fewer tendencies to develop oxidized flavor than turkey
because the higher level of vitamin E in chicken fat retards oxidation Oxidation
proceeds faster in turkey thigh meat than in breast meat as the darker meat
contains more lipid and heme iron (17)
Hydroperoxides formed during lipid peroxidation undergo decomposition
to form secondary oxidation products Those secondary products include volatile
aldehydes ketones acids alcohols and hydrocarbon compounds Aldehydes (ie
hexanal) are one of the primary causes of rancid and stale flavors in precooked
meat products (3)
231 Factors Affecting the Extent of Lipid Oxidative Stability in Meat
There are factors that can affect lipid stability in meat and meat pr0ducts
such as fatty acid composition endogenous prooxidative or antioxidative
components meat processing operations and various additives
2311 Fatty Acid Composition of Meat
It is generally agreed that unsaturated fatty acids (UFA) are responsible
for lipid oxidation in meat Also as the concentration of polyunsaturated fatty
acids (PUFA) increases lipid oxidation increases in muscle foods (4) The amount
of UFA in muscle foods varies depending on the animal species genetic origin
diet sex age at which the animal is slaughtered type of muscle and processing
factors such as fat addition to ground meat (5)
Turkey meat showed low values for total lipid and cholesterol but
greater values than beef pork and lamb for its PUFA content The content of n3
9
fatty acids was the greatest in turkey among meats that included beef pork and
lamb The species is the major source of variation in fatty acid composition The
fatty acid composition of turkey meat is shown in Table 21 (50) Ruminant meats
contain a greater percentage of saturated fat compared with the meat of
monogastric animals (6)
2312 Endogenous prooxidative and antioxidative constituents
Endogenous prooxidative constituents in meat systems consist of iron-
containing proteins transition metals and endogenous enzymes The catalytic
effect of iron-containing protein on the oxidative deterioration of PUFA was first
described by Robinson (35) Since then heme catalyzed lipid oxidation has been
studied extensively and it has become a generally accepted phenomenon that
lipid oxidation is accelerated by heme compounds and transition metals in meat
systems
Lipoxygenase peroxidase and microsomal enzymes identified in various
animal tissues catalyze the reaction of PUFA oxidation with the formation of
unconjugated dienes (7) However enzymatic lipid oxidation catalysts are normal
components in blood and consequently are not a primary problem in most
muscle foods (8)
2313 Meat Processing
According to McMillin (33) quality of raw materials time postmortem
extent of heating and comminution or particle size reduction and the ingredients
added are processing factors that can influence the rate of lipid oxidation Even
though lipid oxidation varies among different animal species such species effects
have been inconsistent and may be due to differences in anatomical location
diet environmental temperature sex age phospholipid content body
composition and experimental conditions such as cooking temperature sample
handling and method for assessing lipid oxidation
Heating encourages the development of lipid oxidation by affecting the
distribution of the iron in the muscle food (9) During cooking a variety of
volatiles producing off-odors and flavors are generated as PUFA oxidize (10)
10
Heat quickly decomposes hydroperoxides produced resulting in the production
of desirable flavor in cooked products The shelf-life of meat products is usually
prolonged by frozen storage Under freezing conditions the rate of oxidation can
be reduced but not completely prevented (1)
Lipid oxidation in cooked meat is commonly referred to as warmed-over-
flavor (WOF) WOF often develops within 1-3 days of refrigerated storage and is
characterized by the loss of fresh cooked meat aroma and a simultaneous
increase in undesirable odors which are commonly described as ldquostalerdquo ldquowet
cardboardrdquo ldquopaintyrdquo ldquograssyrdquo or ldquorancidrdquo (11) The most important contributors
to the development of WOF are the secondary oxidative compounds such as
hexanal pentanal and 2 3- octanedione (12) According to Kerler and Grosch
(59) identified (E E)-2 4-decadienal butyric acid and furaneol as key
compounds in fresh boiled chicken aroma while hexenal butyric acid and 1-
octen-3-one were the main compounds in chicken reheated after 48 hours
storage at 4˚C
The tendency of precooked meat products to oxidize has led food
scientists processors and the industries to develop techniques that allow
extended shelf life of these products In addition to antioxidants the appropriate
packaging and proper storage conditions are useful techniques to achieve
extended storage times
2314 Non-meat Additives
Non-meat additives can be prooxidative or antioxidative agents The
addition of salt NaCl commonly used in meat products to add flavor and
functionality at 05-25 (4) is a prooxidant Salt has been shown to accelerate
oxidation in pork patties (13) by enhancing the activity of iron atoms which then
promotes iron-catalyzed oxidation and flavor deterioration (1) Transitions
metals other than iron (copper especially) supplied by the water from
processing equipment andor spices can also promote oxidation (36)
The use of antioxidants synthetic or natural has been used to prevent lipid
oxidation in meat products The addition of nitrites phosphates citric acid
phytic acid and EDTA has been reported to inhibit lipid oxidation in meat
11
products (10 14) In addition synthetic phenolic antioxidants such as butylated
hydroxytoluene (BHT) butylated hydroxyanisol (BHA) tertiary-butylated
hydroquinone (TBHQ) and propyl gallate has been widely used for more than 50
years to inhibit lipid oxidation in meat products (12)
Several water-soluble compounds including ascorbic acid uric acid
cysteine and glutathione are also known to scavenge radicals and delay oxidation
(37) In meat the functions of ascorbic acid include maintenance of cured color
and prevention of off-flavors (15) Ascorbic acid becomes a prooxidant in meat
products at concentrations greater than 300 mgkg (8)
In the last 30 years natural antioxidant use has increased Various plant
materials and extracts containing polyphenolic compounds have been proven to
be effective antioxidants in meat systems Rosemary and rosemary extracts at
concentrations between 002 to 003 are one of the many natural antioxidants
being studied (3 16-18)
232 Measurement of rancidity in meat
Hydroperoxides the primary products of lipid oxidation are colorless
tasteless and odorless It is the breakdown of these peroxides that produce a
complex mixture of low molecular weight volatile compounds including alkanes
alkenes aldehydes ketones alcohols esters and acids many with distinctive
odor and flavor characteristics (19 38) These compounds convey rancid
cardboard oxidized pungent and other off-flavors characteristic of oxidized meat
(39)
Since oxidative decomposition products are of great importance to product
acceptability and nutritional quality a wide variety of assays from subjective
analyses (ie sensory evaluation) to physical and chemical analyses of various
components have been developed to detect and quantify lipid oxidation in foods
However there is no single effective method to measure all the oxidative
products that are generated during lipid oxidation There is no good method
useful for all stages of oxidation An assay can only monitor only a few changes or
specific reactants when applied to a food system under specific conditions
Therefore a combination of assays would be required to monitor the extent of
12
lipid oxidation in most foods It is also common to apply methods that are based
on measuring one of more of the key primary or secondary oxidation products
2321 Peroxide Value
Since the primary product of lipid oxidation are hydroperoxides it is
proper to determine their concentration as one measure of oxidation The
peroxide value (PV) assay represents the total concentration of peroxides and
hydroperoxides present at a certain time in the food product However this test
is restricted by the chemical instability of these compounds after their
concentration reaches a maximum level they decay as a function of temperature
and the presence of other food components particularly transition metals such
as iron and copper (1)
In muscle tissue the lipid is extracted with a mixture of solvents without
decomposition of the hydroperoxides One of the most common extraction
methods was developed by Folch Lees and Stanley (20) Several methods to
determine the PV have been developed that include iodometric titration method
a ferric thiocyanate method and other colorimetric methods (21 40) PV can be
expressed in several units such as meq iodinekg fat (40) or as meq of
peroxidekg fat (45)
2322 Conjugated Dienes
Conjugated diene hydroperoxides (CDs) are one of the primary products of
the oxidation for linoleate (182) and PUFAs with 3 or more double bonds CDs
can be determined quantitatively by their absorbance at 232-234 nm (22) In
meat samples the CD are first extracted from homogenized sample with an
extracting solution such as 31 hexane isopropanol (23 24)
The greater the amount of PUFA in a fat the greater the potential rise in
the CD values However the CD values plateau at a certain concentration at
which the breakdown roughly equals the formation of new CDs At this point in
the oxidation process no additional changes can be measured by the CD assay
(41)
13
httpwwwchemistrydailycomchemistryDiene
2323 Thiobarbituric Acid Reactive Substances (TBARS)
An alternative approach to the determination of the extent of oxidation is
the measurement of selected secondary oxidation products In contrast to the PV
assay those assays are not limited to the early stages of oxidation and may reflect
the formation of volatile products such as carbonyl compounds which actually
contribute to the rancid and objectionable flavor The application of methods
based on this approach requires a detailed knowledge of the chemistry involved
and an understanding of the stability of the compounds assayed etc Among
these methods the thiobarbituric acid test (TBA) is one of the most common in
spite of criticisms of its reproducibility and reliability The test is based on the
color product resulting from the condensation of TBA with malonaldehyde which
is presumably generated in the oxidized fats However a large body of evidence
suggests that other food components can react with TBA to generate the same
chromophore and even the formation of malonaldehyde is dependent on the
composition of the initial lipid (1) For example other products of lipid oxidation
such as alka-2 4-dienals also react with TBA to form a red complex with the
same absorption maximum as the malonaldehyde-TBA complex shown in the
diagram below (42) For this reason Gray suggested that the TBA procedure
should be used to assess the extent of lipid oxidation in general rather than to
quantify malonaldehyde and the term thiobarbituric acid-reactive substances
(TBARS) is now commonly used in place of the TBA number or value (10)
The extent of lipid oxidation is reported as the TBA number or TBA
value and is expressed as milligrams of malonaldehyde equivalents per kilogram
of sample Malonaldehyde is a relatively minor lipid oxidation product formed
14
during the oxidation of polyunsaturated fatty acids and reacts with TBA to
produce a colored complex with an absorption maximum at 530-532 nm
Malonaldehyde has been reported to correlate well with sensory scores of
oxidized flavors in muscle foods (38) This assay is not recommended for
monitoring the extent of oxidation of food oils
httpmnh20wordpresscom20100719518
2324 Sensory Evaluation
A wide range of methods have been used to examine the effects of lipid
oxidation on the quality of stored turkey meat In addition to the chemical or
instrumental techniques sensory evaluation is very useful for assessing the
quality and stability of meat and meat products from lipid oxidation Most of
these analyses such as the PV TBARs CDs or gas chromatographic analysis of
specific volatiles can be correlated to sensory analysis but none of these chemical
or physical analyses can effectively replace the human nose taste buds and
sensory receptors (43)
According to Warner (43) sensory evaluation is a scientific discipline used
to evoke measure analyze and interpret reactions to food and material
characteristics as they are perceived by sense of sight smell taste touch and
hearing Although sensory evaluation can have a low reproducibility relative to
gas chromatography well-trained and experienced sensory panelists operating
under controlled conditions can provide accurate reliable data The American
Meat Science Association (44) has developed standard guidelines for sensory
analyses The AMSA recommendations include sample preparation cooking
methods and procedures facilities preparation and presentation of samples
15
trained sensory panels test forms consumer panels and instrumental
measurement of tenderness
24 Control of Oxidation Antioxidants
Antioxidants are substances that can delay the onset of lipid oxidation and
extend the induction period They must be added as early as possible in the
manufacturing process or to finished food products to be effective in reducing
lipid oxidation Antioxidants cannot reverse the oxidation of rancid food
products Moreover antioxidants are not effective in controlling hydrolytic
rancidity which is enzyme-catalyzed hydrolysis of fats Antioxidants can control
lipid peroxidation in six ways reducing localized O2 concentrations scavenging
species that initiate peroxidation quenching singlet O2 to prevent the formation
of peroxides binding free metal ions (chelating agent) into a form that will not
generate reactive species or decompose lipid peroxides to peroxyl or alkoxyl
radicals peroxide removal and chain breaking to prevent more hydrogen
abstraction from fatty acid side chains (46) There are three types of antioxidants
based on their mechanism (46 47)
241 Type I - Also called the primary or free-radical chain stopper antioxidants
Type I antioxidants inhibit the chain reaction by acting as hydrogen
donors or free-radical acceptors (AH) (46) Compounds in this category stop the
free radical chain reactions by converting the radicals into more stable products
(47) by reacting primarily with ROO and not with R radicals Basically the
mechanism is a competition between ldquothe inhibitor reactionrdquo (46)
ROO + AH ROOH + A
And ldquothe chain propagation reactionsrdquo
ROO + RH ROOH + R
The effectiveness of a primary antioxidant is dependent on several factors
such as activation energy rate constants oxidation-reduction potential ease of
antioxidant loss or destruction and solubility properties (46) Labuza pointed out
that another important characteristic of an efficient antioxidant is that the
16
resulting antioxidant free radical must not itself initiate new free radicals or be
rapidly oxidized by a chain reaction (46) Type I antioxidants are primarily
phenolic compounds such as butylated hydroxytoluene (BHT) and butylated
hydroxyanisole (BHA) (47) and tert-butylhydroquinone (TBHQ) commonly
present in foods These synthetic food additives are permitted to be used alone or
in combination However the antioxidant content of a food containing these
additives must not exceed 002 of the oil or fat content of the food according to
the Code of Federal Regulations (58)
Butylated Hydroxyanisole
Phenolic compounds synthetic or natural are excellent antioxidants since
they possess benzene rings containing hydroxyl groups and are relatively
reactive Phenols produce stable antioxidant radicals A that are sufficiently
unreactive to propagate the chain and compete with the lipid substrate (RH)
which is present at a much greater concentration (46)
A + ROO Non-radical products
A + A Non-radical products
Since synthetic antioxidants such as BHT and BHA have restrictions for
use in food due to their toxicological effects on several species and they are
suspected to be potential carcinogens (48) the search for natural and safe
antioxidants especially those of plant origin has greatly increased in recent
years
17
242 Type II- Secondary antioxidants or Free-radical production preventer
This category includes compounds that reduce the rate of chain initiation
by metal chelation oxygen scavenging or absorption of UV radiation (47) The
common chelating agents include ethylenediamine tetraacetic acid (EDTA) citric
acid and phosphates EDTA is used for chelation of many metals and it can be an
effective oxidation inhibitor in foods especially those with intermediate to high
moisture content but not in protein-type food such as meats which contain
substantial amounts of bound form of transition metals (46) In addition EDTA
does not protect food during heating because it is less stable at higher
temperatures therefore it is restricted to foods held or processed at cool
temperatures (49) Citric acid is especially useful in oils and intermediate
moisture foods (46) Ascorbic acid is commonly used as a food antioxidant due to
its oxygen scavenging and reducing properties (47) it is especially effective when
it is used in combination with iron chelators (46) Polyphosphates are more
effective chelators and antioxidants than monophosphates However their
antioxidant activity could be reduced or eliminated depending on the
components of the food (50)
Maillard reaction products can bind transition metals such as iron and
deactivate singlet oxygen Because of their dark color and low solubility they are
unsuitable for use in fats and oils but they may be used to improve the oxidative
stability of many foods (51)
Other preventive antioxidants include several enzymes such as catalase
(47) and glutathione peroxidase (37) which reduce the generation of free radicals
by decomposing hydrogen peroxide and hydroperoxides respectively
243 Type III- Control of Environment Factors
This category does not refer to compounds added to inhibit lipid oxidation
Rather this category refers to factors such as the reduction of the oxygen
content a decrease in temperature altering the moisture content (46) and
exclusion of light (47) As the temperature increases oxygen becomes less soluble
in lipids and water slightly influencing the rate The rate of oxidation increases
proportionally to the surface of the lipid exposed to air According to Labuza (46)
18
lipid oxidation can be reduced by altering the water activity which can alter the
catalytic activity of metal catalysts At an elevated water activity (awgt 055) the
rate of oxidation can increase possibly due to the increased mobilization of metal
catalysts
Antioxidant synergism has been observed between primary antioxidants
and between antioxidants with different modes of actions This synergistic effect
can substantially reduce the level of antioxidants needed in a food
25 Keluak As A Natural Source of Antioxidant
251 Keluak ndash Introduction
Pangium edule Reinw (Figure 21) is a tall tropical tree that grows mainly
in Micronesia Melanesia and Southeast Asia including Indonesia The
taxonomy of the tree is uncertain and it may also be classified in the
Flacourtiaceae or the Violale According to Abdullah (55) the tree requires many
years to mature and the seeds are therefore most frequently harvested from wild
trees as it is not economically feasible to cultivate the plant The size of a Pangi
tree is characterized as medium to large with large glossy heart-shaped leaves
that are conspicuously veined and long-stemmed The flowers are large and
greenish and the sexes are separate Flowering occurs from September to October
with seed shed likely to occur in December to January However there are
records of seed shed in April to May and July to September This tropical tree is
wild and not well cultivated (55)
The trees start fruiting when they are approximately 10 to 15 years old The
fruit is oval in shape and the size ranging from 12-30 cm (52) or about a size of a
large husked coconut brown and rough-surfaced (55) The tree produces a large
fruit that is poisonous because of the presence of cyanogenic glucosides (53)
Almost all parts of the plant are poisonous including its leaves barks and seed
(52) Although poisonous to humans the seeds of the tree are part of the natural
diet of the babirusa (Babyroussa babyrussa) (53) a pig-like animal native to the
region However the mature fruit is edible and the juice can be applied to sores
and cuts (55)
19
In Indonesia the seed kernel of this tree is edible after treatments
following the removal of the cyanogenic glucosides Keluak is fermented in a
specific way the seeds are harvested and placed in the field for 10 days The seeds
are then removed washed and boiled for 3 hours to remove the cyanide (54)
After cooling the seeds are buried (indoor) in ash banana leaves and earth for
40 days The seed turn from a creamy white color to dark brown or black (51)
The fermented seeds are cleaned and ready to be used as spices (54) image is
shown in Figure 22 In some countries according to Ma (56) after harvesting the
fruits are buried in the ground for ~100 days before the large seeds are removed
the rest of the plant is poisonous The charcoal-colored nuts are braised for one
hour so the soft flesh can be scooped out of the skin The taste is bitter buttery
and a bit like chocolate while the texture is a familiar one - think mashed
potatoes or roasted chestnuts (56)
Taxonomy of Keluak (55)
Kingdom Plantae
Division Magnoliophyta
Species Pedule
Family Acariaceae
Binomial name Pangium edule Reinw ex Blume
Authority Reinward
Synonym names football fruit kluwek Indonesia black nut kepayang
kluwek keluwek kluwak pangi paying picung penarassan seis
According to Andarwulan et al (54) the fermented seed product of this tree
depending upon the origin is called
Indonesian
o Keluak kluwak kluak kluwek keluwek or kloewak (Dutch spelling)
o Pucung or pucing (Sundanese)
o Rawan or rawon (adjective referring to food prepared with the seed of
this tree) (Figure 23)
Malay
o Kepayang
20
o Payang
Philipines
o Samaun-referring to the oil
o Pangi- referring to the tree
Keluak is commonly used as a spicy flavoring in soups in Java and South
Sulawesi several traditional dishes can be made with Keluak seeds including
ldquoRawonrdquo (Figure 23) and ldquoBlack nut with golden snapperrdquo (Figure 24) Keluak is
also a raw material for another product ldquokecap pangirdquo (ldquokecaprdquo is a soy sauce-like
product) and it has been used as a spice in Saparua Maluku Island in Indonesia
Another of the edible products is called ldquoDagerdquo which is a boiled seed after the
removal of kernels and water after soaking for 2-3 days Dage is utilized in West
java as a vegetable (54) In this document I will use the term ldquoKeluakrdquo and ldquopangi
to refer to the fermented seed that is commonly used as a spice
252 Nutritional Profile of Keluak
The nutrition fact of the Keluak seed is shown in Table 22 Generally
phenolic compounds are found in the seeds and other parts of the plant Most
seeds contain large amounts of polyunsaturated oils and phenolic antioxidants
are necessary to protect the polyunsaturated fatty acids in the oil against
autoxidation (50)
The pangi seed contains some secondary metabolites (Table 23) of the
cyanogen glycosides which include the cyanogen glycoside and various
alkaloids flavonoids steroids saponins tannins and quinine These metabolites
are present in both fresh and dried pangi seed (55)
253 Previous work on keluak
Previous research by Fardiaz and Romlah (57) on the fermented seed
indicated that the methanol extract of keluak possessed antioxidant activity
Fardiaz and Romlah found that the addition of Keluak seed extract to cooking oil
could lengthen the oxidation induction period of the oil Their findings are
summarized in the Table 24 and Figure 25
21
Recently Chye and Sim (52) used several different extraction methods on
Keluak seeds and examined the antioxidant activity of the extract Extracts of
Pangium edule Reinw seed were investigated for their antioxidative activity
using DPPH radical scavenging and β-carotene bleaching assays For the
extraction they used a mixture of acetone acetic acid water which yielded the
higher phenolic content of 2222 plusmn005 mg GAEg among the other methods of
extraction and showed the most potent antioxidative acivity in both DPPH radical
scavenging and β-carotene (Figures 26- 27) They found that significant
correlation was observed between the total phenolic content and its antioxidative
activity (r=0878) suggesting that the phenolics of the Keluak extract could be
potential sources of natural antioxidants (52)
22
26 Figures
Figure 21 Pangium Plant
httpwwwpngplantsorgPNGtreesTreeDescriptionsPangium_edule_Reinwhtml httptravelspotcoolstuffcomgourmet-adventureunusual-food5-lethal-
delicious-meals
Figure 22 Keluak Seed
Source Wayang Brand Kluwak Kupas PT Wira Aksara Jakarta Indonesia
Figure 23 A Dish Made With Keluak Seed- Black Beef Soup (Rawon)
httpwwwlestariwebcomresep-indonesiaEnglishRawonphp
23
Figure 24 A Dish made with Keluak Seed- Black Nut with Golden Snapper
httpdelightfultastebudscom20110501rawon-indonesian-beef-black-soup
Figure 25 The Effect of Kluwak Extract on Oxidation Induction Period of Palm Oil (57)
24
Figure 26 DPPH radical scavenging activity () of Keluak seed extracts at different
concentrations (52)
Phenolic (Ace) = phenolic extracted by acetone Phenolic (EtOAc) = Phenolic extracted by ethyl acetate FPA= Free phenolic acid GBPA= Glycoside-bound
phenolic acid Al= Alkaloid
Figure 27 Antioxidative Activity of Keluak Seed Extracts at 20 mgmL measured by β-
carotene bleaching method (52)
Phenolic (Ace) = phenolic extracted by acetone Phenolic (EtOAc) = Phenolic extracted by ethyl acetate FPA= Free phenolic acid GBPA= Glycoside-bound
phenolic acid Al= Alkaloid
25
27 Tables
Table 21 Fatty Acid Composition of Turkey Meat (50)
Table 22 Nutrition Fact of Keluak Seed
Per 100 grams (or 100 mL)
Energy 2428 kj
Protein 15 g
Fat (Total) 50 g
Carbohydrate (Total) 17 g
Sugar 4 g
Dietary Fiber 10 g
Sodium -
Potassium 680 mg
Calcium 0
Vitamin A 0
Vitamin C 0
Iron 0 Source Wayang Brand Kluwak Kupas PT Wira Aksara Jakarta Indonesia
26
Table 23 Anti- Nutritional Factors of Pangium Seed (55)
Anti- Nutritional Factors Dry wt Basis (microgg)
Arsenic NA
Cyanide 1834
Lead 18
Phytic acid NA
Tannin 046
Alkaloid NA
Table 24 The Antioxidative Activity of Kluwak Expressed as Protective Factor (57)
27
28 References
1 Kanner J Rosenthal I An Assessment of Lipid Oxidation in Foods - Technical Report Pure and Applied Chemistry 1992 64 1959-1964
2 Skibsted LH Understanding oxidation processes in foods Woodhead Publ Food Sci Technol Nutr 2011 199 3-35
3 Yu L Scanlin L Wilson J Schmidt G Rosemary extracts as inhibitors of lipid oxidation and color change in cooked turkey products during refrigerated storage J Food Sci 2002 67 582-585
4 Rhee K Anderson L Sams A Lipid oxidation potential of beef chicken and pork J Food Sci 1996 61 8-12
5 Hernandez P Navarro J Toldra F Lipid composition and lipolytic enzyme activities in porcine skeletal muscles with different oxidative pattern Meat Sci 1998 49 1-10
6 Karakok SG Ozogul Y Saler M Ozogul F Proximate Analysis Fatty Acid Profiles and Mineral Contents of Meats a Comparative Study Journal of Muscle Foods 2010 21 210-223
7 Chan K Decker E Endogenous Skeletal-Muscle Antioxidants Crit Rev Food Sci Nutr 1994 34 403-426
8 Decker E Xu Z Minimizing rancidity in muscle foods Food Technol 1998 52 54-59
9 Rojas MC Brewer MS Effect of natural antioxidants on oxidative stability of cooked refrigerated beef and pork J Food Sci 2007 72 S282-S288
10 Gray J Macdonald B Pearson A Morton I Role of Nitrite in Cured Meat Flavor - a Review J Food Prot 1981 44 302-8
11 Brewer M Vega J Detectable Odor Thresholds of Selected Lipid Oxidation Compounds in a Meat Model System J Food Sci 1995 60 592-595
12 St Angelo A Crippen K Dupuy H James C Chemical and Sensory Studies of Antioxidant-Treated Beef J Food Sci 1990 55 1501-1508
13 Buckley D Gray J Asghar A Price J Crackel R Booren A Pearson A Miller E Effects of Dietary Antioxidants and Oxidized Oil on Membranal Lipid Stability and Pork Product Quality J Food Sci 1989 54 1193-1197
14 Guntensperger B Escher F Oxidative Changes of Heat-Sterilized Meat in Trays J Food Sci 1994 59 689-692
28
15 Bauernfeind JC Antioxidant function of L-ascorbic acid in food technology International journal for vitamin and nutrition researchSupplement = Internationale Zeitschrift fur Vitamin- und ErnahrungsforschungSupplement 1985 27 307-333
16 Georgantelis D Blekas G Katikou P Ambrosiadis I Fletouris DJ Effect of rosemary extract chitosan and alpha-tocopherol on lipid oxidation and colour stability during frozen storage of beef burgers Meat Sci 2007 75 256-264
17 Botsoglou NA Govaris A Giannenas I Botsoglou E Papageorgiou G The incorporation of dehydrated rosemary leaves in the rations of turkeys and their impact on the oxidative stability of the produced raw and cooked meat Int J Food Sci Nutr 2007 58 312-320
18 Karpinska-Tymoszczyk M Effect of the addition of ground rosemary on the quality and shelf-life of turkey meatballs during refrigerated storage Br Poult Sci 2008 49 742-750
19 Drumm T Spanier A Changes in the Content of Lipid Autoxidation and Sulfur-Containing-Compounds in Cooked Beef during Storage J Agric Food Chem 1991 39 336-343
20 Folch J Lees M Stanley GHS A Simple Method For The Isolation And Purification Of Total Lipides From Animal Tissues Journal of Biological Chemistry 1957 226 497-509
21 Grau A Codony R Rafecas M Barroeta A Guardiola F Lipid hydroperoxide determination in dark chicken meat through a ferrous oxidation-xylenol orange method J Agric Food Chem 2000 48 4136-4143
22 Dobarganes M Velasco J Analysis of lipid hydroperoxides European Journal of Lipid Science and Technology 2002 104 420-428
23 Juntachote T Berghofer E Siebenhandl S Bauer F The antioxidative properties of Holy basil and Galangal in cooked ground pork Meat Sci 2006 72 446-456
24 Lee M Choi J Choi Y Han D Kim H Shim S Chung H Kim C The antioxidative properties of mustard leaf (Brassica juncea) kimchi extracts on refrigerated raw ground pork meat against lipid oxidation Meat Sci 2010 84 498-504
25 Botsoglou N and Botsoglou E Oxidation in Foods and Beverages and Antioxidant Applications Vol 2 Management in Different Industry Sectors In Decker EA Elias RJ and McClements D J (eds) Oxidation in Foods and Beverages and Antioxidant Applications Vol 2 Management in Different Industry Sectors 2010 200 1-528
29
26 National Chicken Council Per Capita Consumption of Poultry Livestock 1965 to Estimated 2012 in Pounds 2012 Retrieved in January 23 2012 from httpwwwnationalchickencouncilorgabout-the-industrystatisticsper-capita-consumption-of-poultry-and-livestock-1965-to-estimated-2012-in-pounds
27 Bilgili SF Poultry meat processing and marketing- what does the future hold Poult Internat 2002 12-22
28 Nolan N L Bowers J A and Kropf D H Lipid Oxidation and Sensory Analysis of Cooked Pork and Turkey Stored under Modified Atmospheres Journal of Food Science 1989 54 846ndash849
29 Esteacutevez M Morcuende D and Ventanas S Determination of Oxidation Nollet Leo M LToldraacute Fidel (Eds) Handbook of Muscle Foods Analysis Boca Raton CRC Press 2009 221-240
30 Frankel E N Lipid oxidation Prog Lipid Res 1980 19 1ndash22
31 Frankel E N Volatile Lipid Oxidation Products Progress in lipid research 1983 221 1-33
32 Hsieh R J and J E Kinsella Oxidation of Polyunsaturated Fatty Acids Mechanisms Products and Inhibition with Emphasis on Fish Advances in Food and Nutrition Research 1989 Vol 33
33 McMillin K W Initiation of oxidative processes in muscle foods Annual Proceedings of the Reciprocal Meat Conference Am Meat Sci Assoc Chicago IL 1997 49th 53ndash64
34 Monahan FJ Oxidation of lipids in muscle foods fundamental and applied concerns In EA Decker C Faustman and CJ Lopez-Bote (Eds) Antioxidants in Muscle Foods Nutritional Strategies to Improve Quality New York John Wiley and Sons Inc 2000
35 Robinson M E Haemoglobin and methaemoglobin as oxidative catalysts Biochemical Journal 1924 18 255-264
36 Jadhav SJ Nimbalkar SS Kulkarni AD and MadhaviDL Lipid oxidation in biological and food systems In Marcel Dekker (Eds) Food Antioxidants Technological Toxicological and Health Perspectives New York 1996
37 Niki E Antioxidants and relation to lipid oxidation Chemistry and physics of lipids 1987 44 227-300
38 Gray J I and Monahan FJ Measurement of lipid oxidation in meat and meat products Trends Food Sci Technol 1992 3 315-9
30
39 Chang S S and Peterson R J The Basis of Quality in Muscle Foods Recent Developments In The Flavor of Meat Journal of Food Science 1977 42 298ndash305
40 Lea C H Methods for determining peroxide in lipids J Sci Food Agric 1952 3 586ndash594
41 White P J Conjugated diene anisidine value and carbonyl value analysis In Warner K and Eskin N A M (Eds) Methods to Access Quality and Stability of Oils and Fat-Containing Foods Champaign IL AOCS Publishing 1995 159-177
42 Coxon D Measurement of lipid oxidation Food Science and Technology Today 1987 1164-6
43 Warner K Sensory evaluation of oils and fat-containing foods In K Warner and N A M Eskin (Eds) Methods to Access Quality and Stability of Oils and Fat-Containing Foods AOCS Publishing 1995 49
44 AMSA Research Guidelines for cookery sensory evaluation and instrumental tenderness measurements of fresh meat American Meat Science Association-National Live Stock and Meat Board 1995
45 Association of Official Analytical Chemists Official methods of analysis (16th ed) Washington DC Association of Official Analytical Chemists 1995
46 Labuza T P and Dugan L R Kinetics of lipid oxidation in foods C R C Critical Reviews in Food Technology 1971 2 3
47 Gordon MF The mechanism of antioxidant action in vitro In Hudson BJF (Ed) Food Antioxidants London Elsevier Applied Science 1990 1-18
48 Shahidi F Janitha P Wanasundara P Phenolic Antioxidants Crit Rev Food Sci Nutr 1992 32 67-103
49 Roozen JP Effects of types I II and III antioxidants on phospholipid oxidation in a meat model for warmed over flavour Food Chem 1987 24 167-185
50 Pokornyacute J Natural antioxidants for food use Trends in Food Science and Technology 1991 2 223-227
51 Wong W H Buah Keluak National Parks 11 Jan 2007 Retrieved 02 July 2012 from httpenwikipediaorgwikiPangium_edule
52 Chye FY Sim KY Antioxidative and Antibacterial Activities of Pangium edule Seed Extracts International Journal of Pharmacology 2009 5 285-297
31
53 Andarwulan N Fardiaz D Wattimena GA Shetty K Antioxidant activity associated with lipid and phenolic mobilization during seed germination of Pangium edule Reinw J Agric Food Chem 1999 47 3158-3163
54 Andarwulan N Fardiaz S Apriyantono A Hariyadi P Shetty K Mobilization of primary metabolites and phenolics during natural fermentation in seeds of Pangium edule Reinw Process Biochemistry 1999 35 197-204
55 Abdullah Moh A B Phyochemical Composition of Fresh and Cooked of Chesnut (Castanopsis argentea) Pangium (Pangium edule) and Pra (Elateriospermum tapos) Seeds Final Year Project Food Science and Technology in the Faculty of Applied Sciences Universiti Teknologi Mara Malaysia January 2012 Retrieved on July 4 2012 from httpeprintsptaruitmedumy49401MOHD_ASRUL_BIN_ABDULLAH_12_24pdf
56 Ma A A Peranakan favorite is ayam buah keluak Chicken stewed with black nuts at True Blue RestaurantWall Street Journal (Online) New York NY Dec 16 2010 Retrieved July 4 2012 from httpproquestumicompqdwebdid=2214039511ampsid=1ampFmt=3ampclientId=36305ampRQT=309ampVName=PQD
57 Fardiaz D Romlah S Antioxidant activity of picung (Pangium edule Reinw) seed In Development of Food Science and Technology in ASEAN Proceedings of the Fourth ASEAN Food Conference February 17ndash21 1992 ASEAN Jakarta Indonesia 1992 814ndash819
58 Food and Drugs Administration Food Additives Permitted for Direct Addition to Food for Human Consumption Code of Federal Regulations Title 21 pt 172190 2006
59 Kerler J Grosch W Character impact odorants of boiled chicken changes during refrigerated storage and reheating Zeitschrift Fur Lebensmittel-Untersuchung Und-Forschung A-Food Research and Technology 1997 205 232-238
60 Baggio S Vicente E Bragagnolo N Cholesterol oxides cholesterol total lipid and fatty acid composition in turkey meat J Agric Food Chem 2002 50 5981-5986
32
CHAPTER 3 MATERIALS AND METHODS
31 Keluak Antioxidant and Chemicals
Keluak (Kupas Wayang Brandreg Peeled Keluak Nuts PT Wira Aksara
Jakarta Indonesia was manufactured for Empire International East Chief
Privado Ontario CA 91761) Butylated hydroxytoluene (BHT) gallic acid (ACS
reagent) and 2-thiobarbituric acid were obtained from Sigma Chemical
Company St Louis MO USA Sodium chloride (crystal ARreg ACS) was obtained
from Mallinckrodt Baker Inc (Phillipsburg NJ USA)
The reagents used included acetone (Certified ACS) and chloroform (certified
ACS) obtained from Fisher Scientific Fair Lawn NJ USA Acetic acid (Glacial
ACS reagent) was purchased from J T Baker (Center Valley PA 18034 USA)
and Folin Ciocalteursquos phenol reagent (2 N) was purchased from Sigma-Aldrich
(St Louis MO USA)
311 Phenolic Extraction
Keluak seeds were ground into fine pieces using a coffee grinder (Braun
Inc Lynnfield MA USA) The fatty material from the ground seed was removed
first using a method modified from Wettasinghe and Shahidi (1) The ground seed
was washed with n-hexane (16 gg) and placed in a sonicator for 15 minutes
with occasional stirring The mixture was vortexed for 30 secs before it was
centrifuged at 2688 x g for 10 minutes (Sorvallreg Instrument RC-5B Du Pont
Company Wilmington DE USA) The upper fat-soluble layer was discarded
The solid was washed 2 ndash 3 additional times The solids remained at the bottom
after washing The defatted solids were then air-dried overnight under the hood
to remove any solvent residue
Forty grams of dried defatted Keluak seeds were extracted by stirring with
200 mL of solvent (acetone water acetic acid 90 95 05 vvv) at 60degC and
600 rpm for 2 hrs The mixture was then filtered through filter paper (Whatman
1 Buckinghamshire UK) The filtrate was collected and dried at 45degC using a
rotary evaporator until no further weight changes occurred The concentrated
extract was further dried using a vacuum oven at 45degC overnight The extract was
33
collected dissolved in 100 ethanol flushed with Argon gas and stored at -20degC
until further use
312 Total Phenolics content
The total phenolic content was measured using the Folin-Ciocalteu assay
as modified by Waterhouse (13) The phenolic extract was diluted with 100
ethanol to make several dilutions (1100 2100 and 10100) One milliliter of each
dilution was added to a test tube containing 5 mL of deionized water Then 05
mL of 50 Folin-Ciocalteu reagent was added to the test tube The solution was
mixed and allowed to stand for 8 mins at 22degC before adding 1 mL of 5 sodium
carbonate (wv) The mixture was vortexed using a touch mixer (model 231
Fisher Scientific Pittsburgh PA USA) and incubated in the dark for 1 hr The
solution was vortexed a second time before reading the absorption with a UV-
spectrophotometer (Spectronic Genesys 5 spectrophotometer Thermo Electron
Corporation Madison WI USA) at 725 nm against DI water A standard curve
was prepared at the same time with gallic acid at concentrations ranging from 0
to 100 mgL The quantity of total phenolic content in the sample was calculated
as gallic acid equivalents (GAE) from the standard curve using the formula
C = c times (V divide m) where
C is total phenolic content (mg GAEg extract)
c is the concentration of gallic acid obtained from the calibration curve (mgmL)
V is volume of sample (mL)
m is mass of the sample extract (g)
32 Sample Preparation
Ground turkey meat (15 fat Jennie-O Turkey Store Wilmar MN USA)
purchased from a local grocery store at day 0 and was immediately divided into 4
treatments according to the formulation (Table 31) (2 3)
(1) Control- No antioxidant
(2) Commercial antioxidant- 002 BHT (ww of lipid)
(3) Natural antioxidant- 002 Keluak extract (ww of lipid)
34
(4) Natural antioxidant ndash 004 Keluak extract (ww of lipid)
The level of Keluak extract antioxidant used was based on the amount of
fat in each formula Salt was dissolved in water prior to addition to the meat The
water addition was 5 of the ground meat (ww) The antioxidant and salt were
mixed in the liquid first before adding it to the meat by sprinkling while mixing
After the antioxidant salt and liquid addition mixing by hand (wearing gloves)
was continued for 5 mins The meat mixture was prepared into patties of uniform
size (using a cookie cutter diameter= 55 cm thickness= 15 cm) The patties
were cooked in an electrical skillet and temperature was monitored by Digi-
Sensereg Scanning Thermometer (Model 92000-00 Cole Parmer Instrument Co
Barrington IL) using copper-constantin thermocouple wires (Type T Omega
Engineering Inc Stamford CT) to an endpoint temperature of 74degC The cooked
patties were cooled and placed in a single layer on a tray and then overwrapped
in commercial PVC (water vapor transmission rate=15 g100 m224 h oxygen
transmission rate 880 cm3m224 h) and aluminum foil over the wrap The
patties were stored at 2degC in the dark and were assayed for the extent of oxidation
by odor sensory TBARS conjugated dienes and peroxide value analysis at days
0 1 3 5 7 for the first study (2)
In a second separate study a longer storage time study was completed to
examine the effect of antioxidants on the cooked ground turkey over a longer
time period The same procedure for antioxidant addition and meat sample
preparation was used However in the second study the samples were stored for
a total of 15 days (5 6) Samples were collected at days 0 1 3 5 7 10 13 15 for
TBARS conjugated dienes peroxide values and pH determinations
33 Thiobarbituric Acid Reactive Substances (TBARS)
Lipid oxidation was assessed by the 2-thiobarbituric acid (TBA) method of
Tarladgis and others (4) and Yu et al (5) Briefly 10 g of meat was homogenized
with 50 mL of deionized water using a homogenizer (IKAreg T25 digital Ultra-
Turrax Wilmington NC USA) The homogenate was filtered through 1
Whatman paper Five mL of the clear filtrate was mixed with 5 mL TBA reagent
35
containing 002 M TBA in 90 glacial acetic acid The mixture was capped
vortexed for 30 secs and incubated in the dark for 15-18 hrs at room temperature
After the color developed the mixture was measured for absorbance at 532 nm
against a blank (deionized water) The absorbance was converted to TBAR values
using 1133- tetraethoxypropane to prepare a standard curve Triplicates of 10 g
samples were prepared for each treatment TBA value is expressed as mg MDA
kg meat
34 Conjugated Dienes
Conjugated dienes (CD) were determined by the method described by
Juntachote and others (6) with slight modifications A cooked meat sample (05
g) was suspended in 5 mL of deionized water and homogenized using a digital
Ultra-Turrax T25 (IKAreg Wilmington NC USA) to obtain a smooth slurry A 05
mL aliquot of this suspension was mixed with 5 mL of extracting solution
containing hexane and isopropanol (31 vv) and mixed for 1 min using a vortex
mixer After centrifugation at 2000 g for 5 mins the supernatant was collected
and the absorbance of the supernatant was determined at 233 nm The
concentration of conjugated dienes was calculated using a molar extinction
coefficient of 25200 M-1cm-1 and the result were expressed as nmole of
conjugated dienes per mg meat sample
35 Peroxide Value
The peroxide value was determined according to the AOAC method 96533
(Association of Official Analytical Chemists) (13) with a few modifications The
lipids from meat samples were extracted by the method of Kim et al (7) First 5 g
of meat sample was broken into small pieces and placed in a water bath at 60˚C
to melt the fat for 30 mins The meat was extracted with a solution containing
acetic acid chloroform (32) and then filtered with Whatman 1 filter paper A
saturated solution of potassium iodide (KI 05 mL) was added to the filtrate The
solution color changed to yellow and then 30 mL of deionized water was added
The mixture was allowed to let stand at room temperature for at least 5 mins and
the color would turn to pale to bright yellow Before titrating with 001 N of
36
sodium thiosulfate (Na2SO3) 05 mL of 1 starch solution was added (a color
changed occurred - the color turned purple to blue-black) The PV is expressed as
meq O2kg lipid
36 pH value
To determine the pH of the meat samples cooked meat samples (10 g)
were blended with 50 mL deionized water for 15 seconds in a homogenizer
(Ultra-Turrax T25 IKAreg Wilmington NC USA) The pH was measured with a
pH meter (Accumet Basic model AB 15 Fisher Scientific Company) The pH
meter was calibrated daily with standard buffers of pH 40 and 70 at 25˚C
37 Sensory Evaluation
Trained panelists (n=15) were recruited from among University of Illinois
graduate students and staff The panelists were prepared using an extensive
training program During each training session panel members practiced and
discussed the techniques developed for sample presentation score sheet terms
and odor sensory evaluation method A panel leader led the panelists to develop
terms to describe the aroma characteristics of fresh cooked turkey meat including
the aroma characteristics of cooked poultry with or without the added Keluak
extract Panel members were trained regularly for 7 sessions for total of two
weeks to identify and discriminate aroma differences Some of the terms were
derived from reference standards including fresh boiled ground turkey meat
lard oxidized vegetable oil hard-boiled egg and wet cardboard (Table 32) The
panelists agreed on the following aroma descriptors for warm-over-flavor meaty
fatty rancid eggy and cardboardy These descriptors were judged for the
presence and overall intensity using a 15 cm-structured line scale (0 = none 15 =
extreme) along with an anchor value for each respective standard Table 2
showed the form used to evaluate the aroma descriptors described above
Cooked patties were uniformly cut into four pie-shaped wedges and placed
in a sniff bottle (Nalgene Teflon PTFE wash bottle Nalge Company Rochester
NY USA) covered with foil to hide the identity of the sample inside Each sample
represented a treatment labeled with three-digit random numbers and were
37
served at random order during each test session The samples were held in an
incubator (45degCplusmn 1degC) for 30 mins prior to presentation to the panelists The
panelists were asked to clean their palate by chewing a piece of unsalted saltine
crackers and rinse with water prior to evaluating the samples Samples were
sniffed Four samples were evaluated for each test session Roasted coffee beans
were presented for panelists to clear the palate between samples Standard
references were prepared daily The second session replicates of the first session
was conducted one week after the first session
38 Statistical Analysis
Statistical assessment was carried out with the program SAS Data were
analyzed as 4 (treatments) by 5 (days of storage) The results from the TBARs
analysis peroxide value analysis conjugated dienes analysis and the
odorsensory analysis were analyzed using one-way analysis of variance
(ANOVA) Differences were considered significant at the P lt 005 level
Comparison of treatment means was based on Fisherrsquos Least Significant
Difference (LSD)
38
39 Tables
Table 31 Formulation of Cooked Ground Turkey Meat for Each Treatment
TREATMENTS
Control BHT AO 200ppm AO 400ppm
INGREDIENTS
Jenny-O 15 fat Ground Turkey
(g) 650 650 650 650
Salt (2 ww) (g) 13 13 13 13
BHT (002 of total fat) (g) 002
Keluak extract (mL)
2487 (002 g
phenolics)
4974 (004 g
phenolics)
Cold water (mL)5 by sample wt
(ww) 325 325 325 325
Table 32 Descriptive Odor Standards for Refrigerated Ground Turkey Meat
Descriptive Odor term Standard Location on the 15-cm line
Rancid Oxidized vegetable oil in water (1100 vv) 7
Cardboard 1 cm2 cardboard in 15 mL water 85
Eggy Fresh hard-boiled egg white (01 g) 9
Meaty Fresh boiled ground turkey meat in water (15 gv) 8
Fatty Lard (02 g) 9
39
310 References
1 Wettasinghe M Shahidi F Antioxidant and free radical-scavenging properties of ethanolic extracts of defatted borage (Borago officinalis L) seeds Food Chem 1999 67 399-414
2 Vara-Ubol S Bowers J Effect of alpha-tocopherol beta-carotene and sodium tripolyphosphate on lipid oxidation of refrigerated cooked ground turkey and ground pork J Food Sci 2001 66 662-667
3 Hassan O Fan L The anti-oxidation potential of polyphenol extract from cocoa leaves on mechanically deboned chicken meat (MDCM) Lwt-Food Science and Technology 2005 38 315-321
4 Tarladgis B Dugan L Pearson A Chemistry of 2-Thiobarbituric Acid Test for Determination of Oxidative Rancidity in Foods 2 Formation of Tba-Malonaldehyde Complex without Acid-Heat Treatment J Sci Food Agric 1964 15 602-amp
5 Yu L Scanlin L Wilson J Schmidt G Rosemary extracts as inhibitors of lipid oxidation and color change in cooked turkey products during refrigerated storage J Food Sci 2002 67 582-585
6 Juntachote T Berghofer E Siebenhandl S Bauer F The antioxidative properties of Holy basil and Galangal in cooked ground pork Meat Sci 2006 72 446-456
7 Kim YJ Jin SK Park WY Kim BW Joo ST Yang HS The Effect of Garlic Or Onion Marinade on the Lipid Oxidation and Meat Quality of Pork during Cold Storage J Food Qual 2010 33 171-185
8 Chye FY Sim KY Antioxidative and Antibacterial Activities of Pangium edule Seed Extracts International Journal of Pharmacology 2009 5 285-297
9 Kahkonen M Hopia A Vuorela H Rauha J Pihlaja K Kujala T Heinonen M Antioxidant activity of plant extracts containing phenolic compounds J Agric Food Chem 1999 47 3954-3962
10 Jayaprakasha G Selvi T Sakariah K Antibacterial and antioxidant activities of grape (Vitis vinifera) seed extracts Food Res Int 2003 36 117-122
11 Fardiaz D Romlah S Antioxidant Activity of Picung (Pangium edule Reinw) Seed In Development of Food Science and Technology in ASEAN Proceedings of the 4th ASEAN Food Conference Feb 17-21 1992 ASEAN Jakarta Indonesia 1992 12 Waterhouse A L Determination of Total Phenolics Current Protocols in
Food Analytical Chemistry 2002 I111-I118
40
13 Association of Official Analytical Chemists (1995) Official methods of analysis (16th ed) Washington DC Association of Official Analytical Chemists
41
Chapter 4 RESULTS AND DISCUSSION
41 Phenolic Extraction Yield
The phenolic extract yield using acetone water acetic acid (90 95 05)
extraction was 503 plusmn 140 g of extract per 70 g of defatted ground Keluak seed or
007 g phenolic extract per gram of defatted Keluak The samples contained
approximately 719 phenolic compounds by weight the values are equal to the
average plusmn standard deviation of the three replicate analyses This value was
moderately greater than that reported by Chye and Sim (1) which reported a
548 yield The total phenolic content as determined using Folin-Ciocalteau
reagent was 1973 plusmn 203 mg GAEg extract which was also moderately greater
than the result reported by Chye and Sim which was 1639plusmn 004 mg GAEg
extract (1) It is possible that the difference is due to the Keluak source Chye and
Sim obtained their seeds material from local indigenous markets in Kota
Kinabalu Sabah Malaysia (1) while the seeds used in this study were grown in
from Indonesia The geographical and horticultural differences could affect the
phenolic content and concentration of the seed
According to Kahkonen et al (2) different phenolic compounds can have
different responses in the Folin Ciocalteau method depending on their chemical
structure Therefore the antioxidant activity of an extract cannot be predicted
solely on its total phenolic content (3 4)
42 Effect of Keluak Extract and storage time on TBARS values during
refrigerated storage of cooked ground turkey
The TBARS values represent the content of secondary lipid oxidation
products particularly malonaldehyde The carbonyls are primarily responsible
for the production of off-flavors in oxidized meat and meat products Aldehydes
are formed by the oxidation of unsaturated fatty acids They react with the TBA
reagent to form a pink complex (TBA chromogen) with a maximum absorbance
at 532 nm The intensity of this pink color is directly related to the concentration
of the TBA-reactive substances in the original sample The results of the TBARs
analysis for the preliminary study (7 days) and the extended storage study (15
days) are shown in Tables 41a b and Figures 41a b respectively Overall lipid
42
oxidation increased substantially as the refrigerated storage progressed due to
the effects of heating and in combination with storage under aerobic conditions
On the first day of analysis for both the 7 and 15 days storage study all the
antioxidant treated samples (BHT and both concentrations of the Keluak
extracts) the TBARS values were significantly lower than the control an
indication that the antioxidants had a positive effect in suppressing oxidation
Similar findings were observed by Juntachote et al and Teets et al (5 6) TBARS
values for both 7 and 15 days storage study ranges from 035- 475 mg MDA kg
meat which was comparable to other study by Juntachote (5) for 14 days of
storage study of pork meat There were examining the effect other natural
sources of antioxidants on oxidation during refrigerated storage of cooked meat
During the preliminary study (Table 41a) the control and BHT treatments
did not show significant differences (Pgt005) from day 1-7 However both of the
Keluak extract treatments showed a significant (Plt005) effect on the
suppression of the progression of lipid oxidation as compared to the control
(Figure 41a)
On the other hand during the 15 day study all the samples with added
antioxidants had significantly lower TBAR values compared to the control
throughout the entire storage period This indicates that both the commercial
treatment and the treatment with Keluak extracts provided substantial protection
to the meat with respect to lipid oxidation The efficacy of the Keluak extracts to
inhibit lipid oxidation is probably related to their phenolic content The results of
this study showed agreement with those obtained by Fardiaz and Romlah (14)
which stated that the addition of Keluak extract to palm oil lengthened the
oxidation induction period from 22 hours to 50 hours
Lipid oxidation was considerably greater with longer storage times due to
the exposure to oxygen TBARs measure the formation of secondary lipid
oxidation products which contribute to WOF in oxidized meat Heat increases the
release of non-heme iron from the heme pigments a major catalyst for lipid
oxidation in cooked meats (7) Cooking also alters cellular compartmentalization
and exposes membrane phospholipids to molecular oxygen and metal ions (8)
43
resulting in greater amounts of lipid oxidation (9) The addition of antioxidants
during processing cooking or packaging can be done to increase the oxidative
stability of cooked meat (10)
43 Effect of Keluak Extract and Storage Time on Conjugated Diene
Content during Refrigerated Storage of Cooked Ground Turkey
Meat
The development of conjugated dienes (CD) is related to the formation of
hydroperoxides found in the extracted lipids of the cooked ground turkey
Unsaturated fatty acid double bonds occur naturally in a methylene interrupted
structure As meat begins to oxidize the double bonds of these fatty acids are
altered creating conjugated systems which can be measured
spectrophotometrically (6) During lipid peroxidation non-conjugated double
bonds (C=CndashCndashC=C) which are present naturally in unsaturated lipids are
converted to conjugated double bonds (C=CndashC=C) with a large increased in
absorption at 232ndash234 nm (11) In the preliminary study there were no significant differences among the
antioxidant treated sample and the control (Pgt005) except on day 5 (Figure 42a
and Table 42a) The CD value for all the treatments peaked at day 5 and the
samples treated with antioxidants were significantly different that the control
(Plt005)
Meanwhile during the second storage study (Table 42b and Figure 42b)
when the CD values were compared to the control on day 0 and day 1 the 002
BHT and both of the Keluak extract treated samples were not significantly
different (Pgt005) However from day 3 on all the antioxidant-treated samples
had less CD formation than the control (Plt005) The CD content of the control
generally increased especially during the last 5 days (Day 10 13 and 15) of the
study Additionally cooked ground turkey treated with Keluak at 400 ppm had
slightly lower concentrations of conjugated dienes compared to cooked ground
turkey containing Keluak extract at 200 ppm and the commercial antioxidant
(BHT) The trend of CD formation was similar to several other studies (5 6 12
13) They generally observed that the CD concentration for most samples peaked
44
on Day 3 and decreased thereafter This phenomenon of decreased CD is likely
due to the decomposition of the conjugated diene hydroperoxides into secondary
oxidation products over time Conjugated dienes hydroperoxides are expected to
decompose into secondary products as was observed in this study According to
Frankel (15) the formation of conjugated dienes which is related to the
production of hydroperoxides occurs in the early stages of lipid oxidation According to Estevez et al (17) measurement of conjugated dienes (CD) in
meat products containing elevated levels of PUFA is limited depending on the
fatty acid composition of the sample as well as the presence of other non-
hydroperoxides CDs In agreement with Grau et al (18) the TBA test showed a
higher sensitivity with respect to lipid oxidation than did the CD determination
44 Effect of Keluak extract and storage time on peroxide value during
refrigerated storage of cooked ground turkey
Peroxide values (PV) were also used to assess the level of lipid oxidation in
cooked ground turkey during storage at 2˚C (Table 43 and Figure 43) However
while there were differences between the control and samples treated with AOs
on a few days the result of this study showed that treatments had no significant
effect (Pgt005) on the peroxide values compared to the control Generally based
on the results in Table 4 and Figure 4 the PVs increased during storage and
peaked on day 10 At the time it is possible that much of the polyunsaturated
membrane lipids may have been oxidized at that point so that further storage
and oxidation resulted in a decrease in the concentration of peroxides and thus
the PV
The PV differences among the samples did not provide proof that any of
the AOs were effective It is not clear why the PV analysis did not provide any
evidence of AO efficacy According to Estevez (17) the sensitivity of this method
is about 05 miliEquivalentkg of lipid Lower peroxide values cannot be
measured satisfactorily by the AOCS method because of the uncertainty with the
iodometric titration endpoint unless the iodine-starch end is determined
potentiometrically at levels as low as 006 Eqkg lipid The iodometric method is
highly empirical and very small procedural differences can cause variation in the
45
results (19) Two major sources of error in this test could be the liberation of
iodine by air oxidation of the KI and absorption of iodine by fatty acid double
bonds (17)
4 5 Effect of Keluak Extract and storage time on Odor of Refrigerated
Cooked Ground Turkey
No significant interaction (Pgt 005) occurred between antioxidant and
storage time for most of the odor characteristics (Tables and Figures 44-48)
For meaty odor characteristic (Figure and Table 44) the score of all the
treatments over the 7 days of storage did not show significant differences
(Pgt005) The scores ranged from 502 ndash 783 which was slightly below the
freshly boiled turkey meat standard for meaty (which was ranked 8 in the 15-cm
line scale) Therefore the panelists were unable to score and detect the cooked
meat aroma differences in the treated samples relative to the standard reference
The meaty aroma in this study was used to determine if there were possible
masking effects from the AO treatments
For the rancid odor (Figure and Table 45) both of the Keluak treated
samples were perceived as more rancid than both control and BHT after day 1
Overall both of the Keluak treated samples were ranked higher than the control
and BHT which disagrees with the results of TBA test However there was no
significant difference among the treatments between day 3-7 According to Ruth
(20) rancidity as a measure of lipid oxidation is usually best measured by the
concentration of TBARS
The minimum TBA values that corresponds to dark chicken meat samples
that were significantly different in rancid aroma was 1933 μg MDAkg of meat
(21) For consumer acceptability the TBA values must be less than 785 μg of
MDAkg (21) The results from Bou et al (21) were comparable to the results
reported by Gray and Pearson (22) showing that rancid flavor in meats is initially
detected between 500 and 2000 μg of MDAkg of meat In addition OrsquoNeill et
al (23) found that the threshold for WOF detection in cooked dark chicken meat
was at TBA values ge800 μg of MDAkg of meat Since chicken and turkey meat
46
have a comparable PUFA content those values were considered useful in this
experiment On the other hand the odor score for Eggy cardboard and fatty were
statistically not different (Pgt 005) Panelists were unable to detect differences
which could be to different reasons such as that Keluak extract has an aroma
masking effect that confuses the panelists with the ldquooff-odorrdquo The Keluak did
have a slight aroma and it is likely that it masked the effects of storage on lipid
oxidation The aroma of Keluak has been described as bitter dirt-like and
chocolate-like odor (16) This aroma masking could be perceived as undesirable
by the panelists and it might have been mistaken as an off-odor or as an oxidized
sample even though the TBARs and CD data showed otherwise
4 6 Effect of Keluak Extract and storage time on pH of Refrigerated
Cooked Ground Turkey
Table 49 shows the effect of antioxidant treatments in pork muscle on pH
values during storage at 2˚C The values of the pH ranged between 633-668
Generally there are no correlations of pH value among the treatments during
storage The trend for the pH value is inconclusive
47
47 Figures Figure 41a The profile of TBARS in cooked ground turkey treated with various
antioxidants during storage at 2˚C- A Preliminary Study
K200 and K400 represent treatments with Keluak extract at concentration of 200 and 400 ppm respectively
0000
1000
2000
3000
4000
5000
6000
0 2 4 6 8
TBA
RS
(mg
MD
Ak
g m
eat
)
Storage Days
Control
BHT
K200
K400
48
Figure 41b The profile of TBARS in Cooked Ground Turkey Treated with Various Antioxidants During Storage at 2˚C- Extended Storage Time
K200 and K400 represent Keluak extract at concentration of 200 and 400 ppm respectively
Figure 42a Conjugated dienes values of different antioxidant treatments over storage at
2˚C - A Preliminary Study
K200 and K400 represent treatments with Keluak extract at concentration of 200 and 400 ppm
respectively
000
100
200
300
400
500
600
0 5 10 15 20
TBA
RS
(mg
MD
Ak
g m
eat
)
Storage time (days)
Control
BHT 002
K200
K400
0000
0050
0100
0150
0200
0250
0300
0350
0400
0450
0 1 2 3 4 5 6 7 8
Co
nju
gate
d D
ien
es
(nm
ol
mg
me
at)
Days
Control
BHT
K200
K400
49
Figure 42b Conjugated dienes values of different antioxidant treatments over storage at
2˚C- Extended Storage Time
K200 and K400 represent treatments with Keluak extract at concentration of 200 and 400 ppm respectively
Figure 43 Peroxide Value (meq kg meat) of Different Antioxidant treatments over
Storage at 2˚C
K200 and K400 represent treatments with Keluak extract at concentration of 200 and 400 ppm
respectively
000
002
004
006
008
010
012
014
016
0 5 10 15 20
Co
nju
gate
d D
ien
es
(nm
ol
mg
me
at)
Storage (days)
Control
BHT 002
K200
K400
0
05
1
15
2
25
3
35
4
0 2 4 6 8 10 12 14 16
PV
(m
eq
kg
me
at)
Storage Time (Days)
Control
BHT 002
K200
K400
50
Figure 44 Intensity of Meaty Odor Descriptor in Cooked Ground Turkey Meat Treated
with Different Antioxidants Rated in a 15-cm Line Scale
K200 and K400 represent Treatment with Keluak extract at concentration of 200 and 400 ppm
respectively
Figure 45 Intensity of Rancid Odor Descriptor in Cooked Ground Turkey Meat Treated
with Different Antioxidants Rated in a 15-cm Line Scale
K200 and K400 represent Treatment with Keluak extract at concentrations of 200 and 400 ppm
respectively
000
200
400
600
800
1000
1200
0 2 4 6 8
15
cm
Lin
e s
cale
(av
era
ge)
Days
CONTROL
BHT
K200
K400
Linear (BHT)
-100
000
100
200
300
400
500
600
700
800
0 2 4 6 8
15
cm
Lin
e s
cale
(av
era
ge)
Days
Control
BHT
K200
K400
51
Figure 46 Intensity of Eggy Odor Descriptor in Cooked Ground Turkey Meat Treated
with Different Antioxidants Rated in a 15-cm Line Scale
K200 and K400 represent Treatment with Keluak extract at concentrations of 200 and 400 ppm
respectively
Figure 47 Intensity of Cardboard Odor Descriptor in Cooked Ground Turkey Meat
Treated with Different Antioxidants Rated in a 15-cm Line Scale
K200 and K400 represent Treatment with Keluak extract at concentrations of 200 and 400 ppm
respectively
000
100
200
300
400
500
600
700
800
900
1000
0 2 4 6 8
15
cm
Lin
e s
cale
(av
era
ge)
Days
Control
BHT
K200
K400
-1
0
1
2
3
4
5
6
7
0 2 4 6 8
15
cm
Lin
e s
cale
(av
era
ge)
Days
Control
BHT
K200
K400
52
Figure 48 Intensity of Fatty Odor Descriptor in Cooked Ground Turkey Meat Treated
with Different Antioxidants Rated in a 15-cm Line Scale
K200 and K400 represent Treatment with Keluak extract at concentrations of 200 and 400 ppm
respectively
000
100
200
300
400
500
600
700
800
900
0 2 4 6 8
15
cm
Lin
e s
cale
(av
era
ge)
Days
Control
BHT
K200
K400
53
48 Tables
Table 41a TBARS Value of Cooked Ground Turkey Meat Treated with Various Antioxidants during Storage at 2˚C- A Preliminary Study
TBARS (mg MDAkg meat) Average
Storage (Day) Control BHT 002 Keluak 200ppm Keluak 400ppm
0
131plusmn009Aa 094plusmn021Ba 050plusmn004Ca 037plusmn010Ca
1
189plusmn003Aab 161plusmn025Aab 080plusmn006Ba 057plusmn026Bab
3
243plusmn010Ac 236plusmn025Abc 111plusmn022Bab 055plusmn008Cab
5
397plusmn016Ad 319plusmn064Acd 170plusmn025Bbc 108plusmn023Bb
7
473plusmn076Ad 373plusmn074ABd 217plusmn040ACc 101plusmn044Cab
Different letters (A-D) within a row indicates that mean values are significantly different (Plt 005) Different letters within a column (a-d) within the same treatment are significantly different (Plt005)
Table 41b TBARS Value of Cooked Ground Turkey Meat Treated with Various Antioxidants during Storage at 2 ˚C- Extended Storage Time
TBARS (mg MDAkg meat) Average
Storage (day) Control BHT 002 K200 K400
0 129 plusmn 008Ae 091plusmn 004Bcd 065plusmn 015Be 101plusmn 003Cf
1 159plusmn 008Ade 076plusmn 005Cd 083plusmn 012Ce 127plusmn 006Bf
3 220plusmn 011Acd 074plusmn 004Dd 119plusmn 003Cd 160plusmn 004Be
5 258plusmn 014Ac 082plusmn 006Cd 076plusmn 014Ce 150plusmn 004Bd
7 377plusmn 001Ab 109plusmn 002Ccb 158plusmn 006Bc 160plusmn 006Bd
10 405plusmn 061Aab 121plusmn 009Bb 197plusmn 012Bb 195plusmn 009Bc
13 465plusmn 014Aa 151plusmn 004Ca 224plusmn 003Bab 218plusmn 003Bb
15 459plusmn 024Aa 154plusmn 013Da 231plusmn 014Ca 284plusmn 010Ba
Different letters (A-D) within a row indicates that mean values are significantly different (Plt 005) Different letters within a column (a-f) within the same treatment are significantly different (Plt005)
K200 and K400 represent treatments with Keluak extract at concentration of 200 and 400 ppm
respectively
54
Table 42a Conjugated Dienes Concentrations with Antioxidant Treatments and Storage
At 2˚C- A Preliminary Study
Conj Dienes (nmolemg meat)
Storage (Days) Control BHT 002 K200 K400
0 015plusmn003Abc 022plusmn001Aa 013plusmn001Ab 020plusmn008Aa
1 012plusmn001Abc 012plusmn003Ab 011plusmn001Ab 019plusmn001Bab
3 006plusmn000Ac 003plusmn002Ac 002plusmn002Ab 004plusmn002Ab
5 038plusmn000Aa 024plusmn001Ba 027plusmn007ABa 021plusmn001Ba
7 023plusmn008Ab 026plusmn001Aa 029plusmn003Aa 016plusmn001Aab
Different letters (A-C) within a row indicates that mean values are significantly different (Plt 005) Different letters within a column (a-d) within the same treatment are significantly different (Plt005)
K200 and K400 represent treatments with Keluak extract at concentration of 200 and 400 ppm
respectively
Table 42b Conjugated Dienes Concentrations After Antioxidant Treatments and
Storage At 2˚C- Extended Storage Time
Conjugated Dienes (nM mg meat)
Storage (Days) Control BHT 002 K200 K400
0 013plusmn 001Aab 009plusmn000Bab 010plusmn 000Ba 010plusmn 001Ba
1 008plusmn 001Ac 008plusmn 001Ab 008plusmn 000Abc 007plusmn 001Ab
3 011plusmn 000Ab 009plusmn 001Bab 008plusmn 000Bbc 006plusmn 000Cb
5 012plusmn001Ab 008plusmn 001B b 006plusmn 000Bd 006plusmn 000Bb
7 011plusmn001Abc 008plusmn 000B ab 006plusmn 001Bcd 007plusmn 000Bb
10 014plusmn 000Aa 009plusmn 000Bab 009plusmn 001Bab 007plusmn 000Cb
13 014plusmn 001Aa 009plusmn 000Bab 008plusmn 000Bbc 006plusmn 000Cb
15 014plusmn 000Aa 010plusmn 001Ba 008plusmn 001BCbcd 007plusmn 000Cb
Different letters (A-C) within a row indicates that mean values are significantly different (Plt 005) Different letters within a column (a-d) within the same treatment are significantly different (Plt005)
K200 and K400 represent treatments with Keluak extract at concentration of 200 and 400 ppm
respectively
55
Table 43 Peroxide Value (meq kg meat) of Different Antioxidant treatments during
Storage of cooked ground turkey meat at 2˚C
PV (meq kg meat)
Storage (Days) Control BHT 002 K200 K400
0 110plusmn 042Abc 070plusmn 014Ae 080plusmn 028Ad 130plusmn 014Acd
1 230plusmn 014Aab 130plusmn 014Bd 090plusmn 014BCd 070plusmn 014Cd
3 080plusmn 000Ac 070plusmn 014Ae 070plusmn 014Ad 070plusmn 014Ad
5 280plusmn 028Aa 140plusmn 000Bcd 110plusmn 014Bcd 080plusmn 028Bd
7 170plusmn 042Aabc 190plusmn 014Ac 195plusmn 021Abc 225plusmn 049Abc
10 310plusmn 042Aa 330plusmn 014Aa 290plusmn 042Aa 340plusmn 028Aa
13 255plusmn 007Aa 265plusmn 021Ab 240plusmn 028Aab 260plusmn 028Aab
15 255plusmn 064Aa 150plusmn 014ABcd 086plusmn 006Bd 100plusmn 028Bd
Different letters (A-C) within a row indicates that mean values are significantly different (Plt 005) Different letters within a column (a-e) within the same treatment are significantly different (Plt005)
K200 and K400 represent Treatment with Keluak extract at concentrations of 200 and 400 ppm
respectively
Table 44 Intensity of Meaty Odor Descriptor in Cooked Ground Turkey Meat Treated with Different Antioxidants Rated in a 15-cm Line Scale
Storage (Day) Control BHT 002 K200 K400
0 595plusmn250Aa 727plusmn144Aa 632plusmn202Aa 606plusmn189Aa
1 783plusmn208Aa 731plusmn174ABa 543plusmn220Ba 542plusmn294Ba
3 613plusmn201Aa 693plusmn143Aa 502plusmn266Aa 552plusmn228Aa
5 734plusmn277Aa 710plusmn290Aa 474plusmn253Aa 487plusmn263Aa
7 694plusmn296Aa 751plusmn265Aa 532plusmn259Aa 543plusmn236Aa
Different letters (A-C) within a row indicates that mean values are significantly different (Plt 005) Different letters within a column (a-b) within the same treatment are significantly different (Plt005)
K200 and K400 represent Treatment with Keluak extract at concentrations of 200 and 400 ppm
respectively
56
Table 45 Intensity of Rancid Odor Descriptor in Cooked Ground Turkey Meat Treated
with Different Antioxidants Rated in a 15-cm Line Scale
Storage (Day) Control BHT 002 K200 K400
0 228plusmn194Aa 193plusmn175Aa 334plusmn231Aa 350plusmn274Aa
1 177plusmn194Aa 172plusmn163Aa 392plusmn274ABa 426plusmn265Ba
3 260plusmn210Aa 272plusmn265Aa 419plusmn306Aa 337plusmn247Aa
5 344plusmn255Aa 329plusmn215Aa 427plusmn248Aa 395plusmn253Aa
7 408plusmn300Aa 289plusmn244Aa 448plusmn241Aa 385plusmn244Aa
Different letters (A-B) within a row indicates that mean values are significantly different (Plt 005) Different letters within a column (a-b) within the same treatment are significantly different (Plt005)
K200 and K400 represent Treatment with Keluak extract at concentrations of 200 and 400 ppm
respectively
Table 46 Intensity of Eggy Odor Descriptor in Cooked Ground Turkey Meat
Treated with Different Antioxidants Rated in a 15-cm Line Scale
Storage (Day) Control BHT 002 K200 K400
0 643plusmn242Aa 513plusmn244Aa 502plusmn324Aa 565plusmn287Aa
1 597plusmn248Aab 476plusmn321Aa 599plusmn332Aa 584plusmn360Aa
3 345plusmn258Ab 400plusmn270Aa 515plusmn335Aa 509plusmn425Aa
5 364plusmn303Aab 424plusmn320Aa 475plusmn269Aa 469plusmn180Aa
7 473plusmn306Aab 364plusmn210Aa 485plusmn268Aa 431plusmn305Aa
Different letters (A-C) within a row indicates that mean values are significantly different (Plt 005) Different letters within a column (a-e) within the same treatment are significantly different (Plt005)
K200 and K400 represent Treatment with Keluak extract at concentrations of 200 and 400 ppm
respectively
57
Table 47 Intensity of Cardboard Odor Descriptor in Cooked Ground Turkey Meat
Treated with Different Antioxidants Rated in a 15-cm Line Scale
Storage (Day) Control BHT 002 K200 K400
0 299plusmn222Aa 209plusmn182Aa 261plusmn198Aa 312plusmn157Aa
1 262plusmn249Aa 180plusmn192Aa 339plusmn238Aa 342plusmn229Aa
3 299plusmn203Aa 284plusmn254Aa 388plusmn235Aa 287plusmn185Aa
5 252plusmn243Aa 290plusmn190Aa 309plusmn193Aa 320plusmn204Aa
7 301plusmn210Aa 273plusmn253Aa 337plusmn195Aa 284plusmn205Aa
Different letters (A-C) within a row indicates that mean values are significantly different (Plt 005) Different letters within a column (a-e) within the same treatment are significantly different (Plt005)
K200 and K400 represent Treatment with Keluak extract at concentrations of 200 and 400 ppm
respectively
Table 48 Intensity of Fatty Odor Descriptor in Cooked Ground Turkey Meat Treated with Different Antioxidants Rated in a 15-cm Line Scale
Storage (Day) Control BHT 002 K200 K400
0 344plusmn226aA 350plusmn256aA 395plusmn309aA 395plusmn277aA
1 417plusmn285aA 389plusmn230aA 401plusmn345aA 438plusmn287aA
3 388plusmn220aA 378plusmn229aA 396plusmn328aA 403plusmn285aA
5 479plusmn252aA 461plusmn293aA 389plusmn255aA 428plusmn320aA
7 460plusmn288aA 492plusmn286aA 426plusmn281aA 428plusmn340aA
Different letters (A-C) within a row indicates that mean values are significantly different (Plt 005) Different letters within a column (a-e) within the same treatment are significantly different (Plt005)
K200 and K400 represent Treatment with Keluak extract at concentrations of 200 and 400 ppm
respectively
58
Table 49 pH Values of Cooked Ground Turkey Treated with Different
Antioxidants Stored at 2˚C
pH Value
Storage (Day) Control BHT 002 K200 K400
0 665plusmn 002Aab 644plusmn 003Bbc 646plusmn 004Bbc 658plusmn 003Aab
1 659plusmn 003Ab 643plusmn 003Cbc 651plusmn 001Babc 662plusmn 001Aab
3 645plusmn 003Bc 634plusmn 002Cd 643plusmn 004Bc 654plusmn 000Ab
5 663plusmn 002Aab 640plusmn 002Cc 645plusmn 004Cc 654plusmn 002Bb
7 647plusmn 001Ac 633plusmn 003Bc 648plusmn 004Aabc 646plusmn 006Ac
10 665plusmn 001Aab 646plusmn 002Dbc 654plusmn 001Cab 660plusmn 003Bab
13 665plusmn 002Aab 648plusmn 002Cab 655plusmn 002Ba 664plusmn 002Aa
15 668plusmn 001Aa 651plusmn 001Da 655plusmn 001Ca 663plusmn 001Ba
Different letters (A-D) within a row indicates that mean values are significantly different (Plt 005) Different letters within a column (a-c) within the same treatment are significantly different (Plt005)
K200 and K400 represent treatments with Keluak extract at concentrations of 200 and 400 ppm
respectively
59
49 References
1 Chye FY Sim KY Antioxidative and Antibacterial Activities of Pangium edule Seed Extracts International Journal of Pharmacology 2009 5 285-297
2 Kahkonen M Hopia A Vuorela H Rauha J Pihlaja K Kujala T Heinonen M Antioxidant activity of plant extracts containing phenolic compounds J Agric Food Chem 1999 47 3954-3962
3 Jayaprakasha G Selvi T Sakariah K Antibacterial and antioxidant activities of grape (Vitis vinifera) seed extracts Food Res Int 2003 36 117-122
4 Gray J Macdonald B Pearson A Morton I Role of Nitrite in Cured Meat Flavor - a Review J Food Prot 1981 44 302-amp
5 Juntachote T Berghofer E Siebenhandl S Bauer F The antioxidative properties of Holy basil and Galangal in cooked ground pork Meat Sci 2006 72 446-456
6 Teets AS Were LM Inhibition of lipid oxidation in refrigerated and frozen salted raw minced chicken breasts with electron beam irradiated almond skin powder Meat Sci 2008 80 1326-1332
7 Han D McMillin K Godber J Bidner T Younathan M Marshall D Hart L Iron Distribution in Heated Beef and Chicken Muscles J Food Sci 1993 58 697-700
8 Ahn D Wolfe F Sim J Prevention of Lipid Oxidation in Precooked Turkey Meat Patties with Hot Packaging and Antioxidant Combinations J Food Sci 1993 58 283-287
9 Asghar A Gray J Buckley D Pearson A Booren A Perspectives on Warmed-Over Flavor Food Technol 1988 42 102-108
10 Kingston E Monahan F Buckley D Lynch P Lipid oxidation in cooked pork as affected by vitamin E cooking and storage conditions J Food Sci 1998 63 386-389
11 Kulas E Ackman R Different tocopherols and the relationship between two methods for determination of primary oxidation products in fish oil J Agric Food Chem 2001 49 1724-1729
12 Srinivasan S Xiong Y Decker E Inhibition of protein and lipid oxidation in beef heart surimi-like material by antioxidants and combinations of pH NaCl and buffer type in the washing media J Agric Food Chem 1996 44 119-125
13 Lee M Choi J Choi Y Han D Kim H Shim S Chung H Kim C The antioxidative properties of mustard leaf (Brassica juncea) kimchi extracts on
60
refrigerated raw ground pork meat against lipid oxidation Meat Sci 2010 84 498-504
14 Fardiaz D Romlah S Antioxidant Activity of Picung (Pangium edule
Reinw) Seed In Development of Food Science and Technology in ASEAN
Proceedings of the 4th ASEAN Food Conference Feb 17-21 1992 ASEAN
Jakarta Indonesia 1992
15 Frankel E N Lipid oxidation Dundee Scotland The Oily Press Ltd 1998 Vol 10 pp 13ndash41 16 Ma Amy A Peranakan favorite is ayam buah keluak Chicken stewed with black nuts at True Blue Restaurant Wall Street Journal (Online) New York NY Dec 16 2010 Retrieved July 20 2011 from httpproquestumicompqdwebdid=2214039511ampsid=1ampFmt=3ampclientId=36305ampRQT=309ampVName=PQD
17 Esteacutevez M Morcuende D and Ventanas S Determination of Oxidation
Nollet Leo M LToldraacute Fidel (Eds) Handbook of Muscle Foods Analysis Boca
Raton CRC Press 2009 221-240
18 Grau A Codony R Rafecas M Barroeta A Guardiola F Lipid
hydroperoxide determination in dark chicken meat through a ferrous oxidation-
xylenol orange method J Agric Food Chem 2000 48 4136-4143
19 Shahidi F Janitha P Wanasundara P Phenolic Antioxidants Crit Rev Food Sci Nutr 1992 32 67-103
20 Ruth SM Techniques for sampling and identification of volatile compounds contributing to sensory perception In Nollet Leo M LToldraacute Fidel (Eds) Handbook of Muscle Foods Analysis Boca Raton CRC Press 2009 503-523
21 Bou R Guardiola F Grau A Grimpa S Manich A Barroeta A Codony R Influence of dietary fat source alpha-tocopherol and ascorbic acid supplementation on sensory quality of dark chicken meat Poult Sci 2001 80 800-807
22 Gray J I and A M Pearson Rancidity and warmed over flavour In Pearson A M and Dutson T R (Eds) Advances in Meat Research Vol 3 Nostrand-Reinbold Co New York NY 1987 221ndash269 23 OrsquoNeill L M K Galvin P A Morrissey and D J Buckley Comparison of effects of dietary olive oil tallow and vitamin E on the quality of broiler meat and meat products Br Poult Sci 1998 39 365ndash371
61
Chapter 5 CONCLUSION AND FUTURE WORK
The results of the present study indicated that the Keluak extract
incorporated into cooked ground turkey can reduce lipid oxidation The addition
of Keluak extracts at 200 and 400 ppm had a positive effect on reducing the
TBAR values and the conjugated dienes content compared to the control without
added AOs during storage at 2˚C for 15 days The Keluak extract used in this
study was comparable to BHT (002) in reducing lipid oxidation in meat
Peroxide value analysis did not differentiate between the control and the
treatments on the extent of lipid oxidation Due to confusion of the odor
components in the Keluak extracts by the panelists there were no significant
differences between the treatments in the odor sensory evaluation
Keluak seed is a culinary spice with no known toxic effect Its moderate
pungent aroma makes it valued as a traditional ethnic food flavorant in parts of
South East Asia With its substantial phenolic content and antioxidant properties
it could be an effective source of natural antioxidants However the application
of this natural antioxidant might be limited in Western cultures due to its effect
on the color and odor of meat products Further investigations are needed to
identify selective extraction and clean-up techniques that could be used to
eliminate the color and odor problem Other chemical analysis methods that
might provide better information on the extent of oxidation in meat products
include the p-anisidine value Food Oil Sensor (FOS) and Gas chromatography
techniques (GC analysis) of selected volatiles
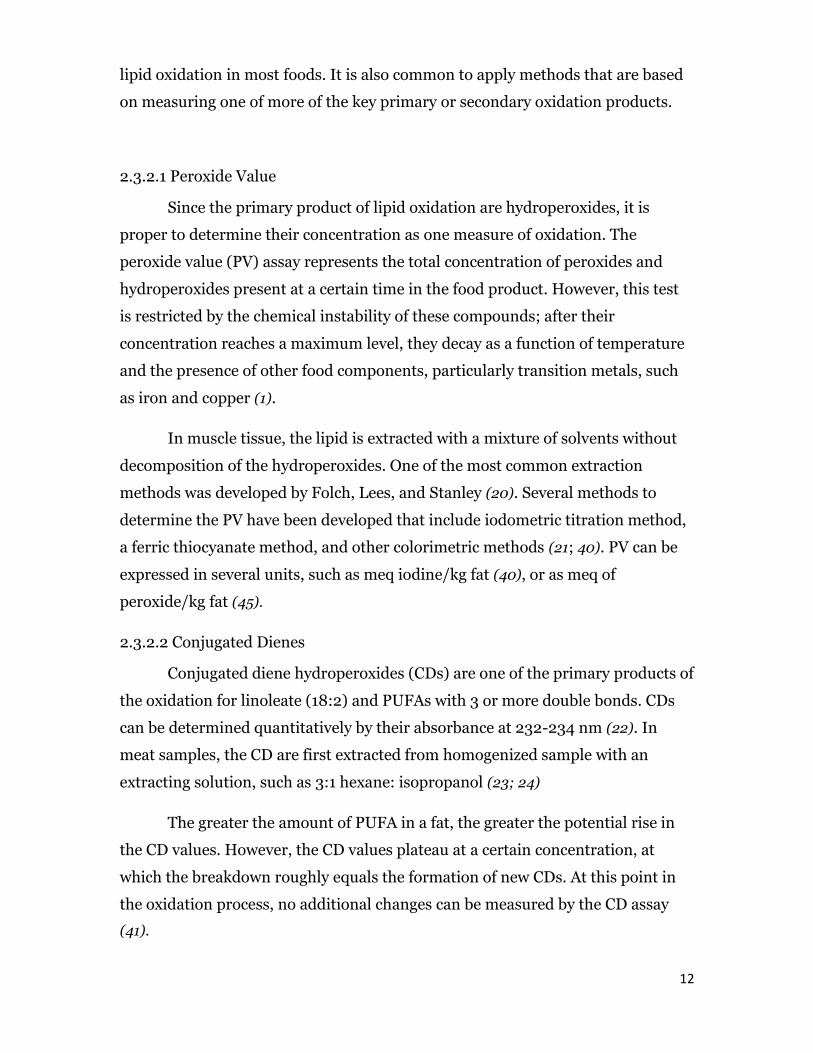
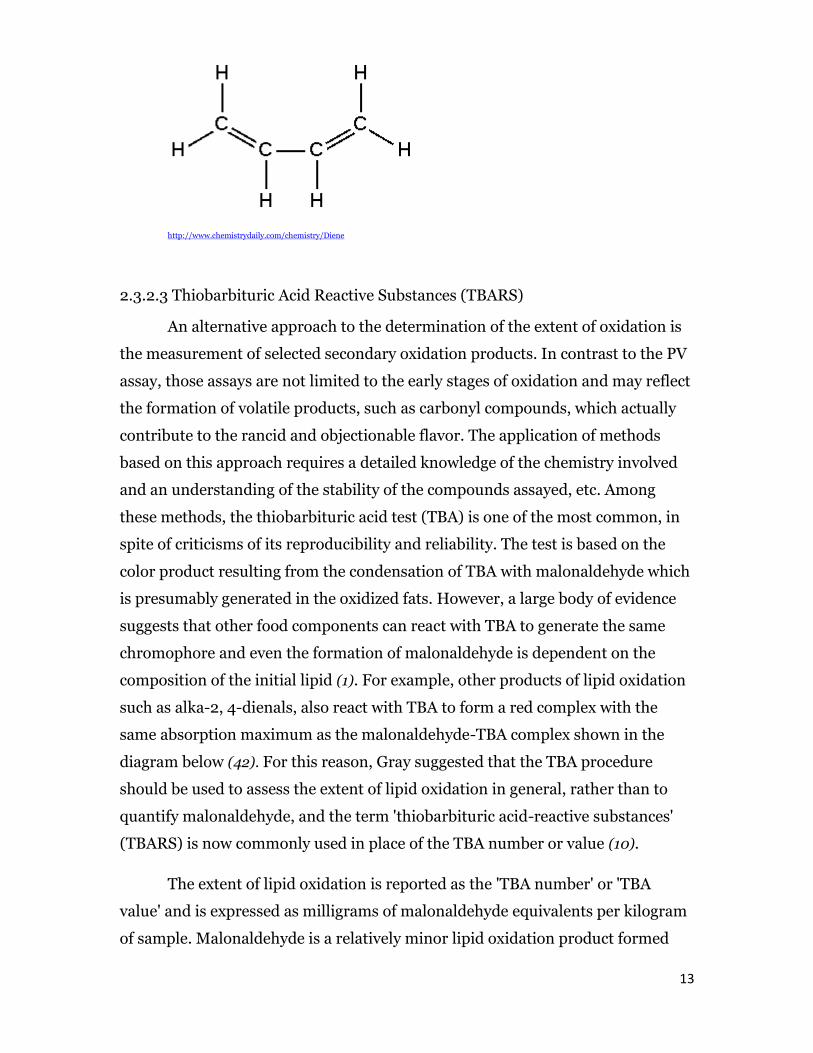
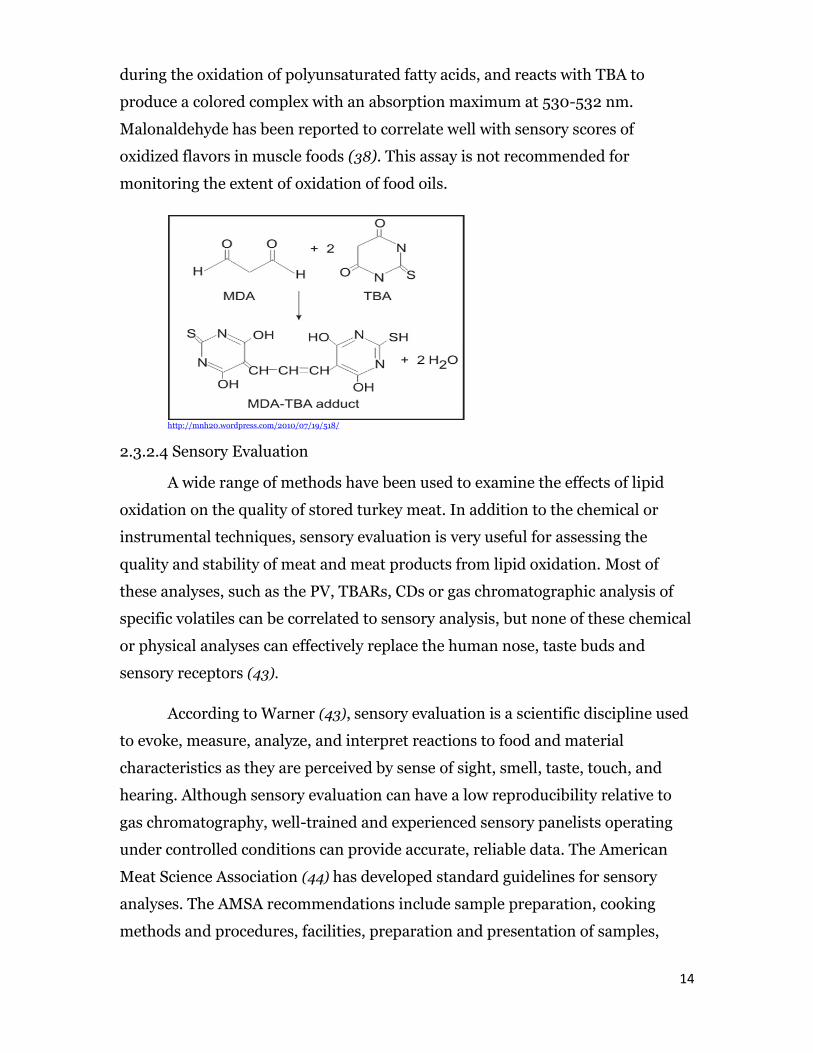

15
trained sensory panels test forms consumer panels and instrumental
measurement of tenderness
24 Control of Oxidation Antioxidants
Antioxidants are substances that can delay the onset of lipid oxidation and
extend the induction period They must be added as early as possible in the
manufacturing process or to finished food products to be effective in reducing
lipid oxidation Antioxidants cannot reverse the oxidation of rancid food
products Moreover antioxidants are not effective in controlling hydrolytic
rancidity which is enzyme-catalyzed hydrolysis of fats Antioxidants can control
lipid peroxidation in six ways reducing localized O2 concentrations scavenging
species that initiate peroxidation quenching singlet O2 to prevent the formation
of peroxides binding free metal ions (chelating agent) into a form that will not
generate reactive species or decompose lipid peroxides to peroxyl or alkoxyl
radicals peroxide removal and chain breaking to prevent more hydrogen
abstraction from fatty acid side chains (46) There are three types of antioxidants
based on their mechanism (46 47)
241 Type I - Also called the primary or free-radical chain stopper antioxidants
Type I antioxidants inhibit the chain reaction by acting as hydrogen
donors or free-radical acceptors (AH) (46) Compounds in this category stop the
free radical chain reactions by converting the radicals into more stable products
(47) by reacting primarily with ROO and not with R radicals Basically the
mechanism is a competition between ldquothe inhibitor reactionrdquo (46)
ROO + AH ROOH + A
And ldquothe chain propagation reactionsrdquo
ROO + RH ROOH + R
The effectiveness of a primary antioxidant is dependent on several factors
such as activation energy rate constants oxidation-reduction potential ease of
antioxidant loss or destruction and solubility properties (46) Labuza pointed out
that another important characteristic of an efficient antioxidant is that the
16
resulting antioxidant free radical must not itself initiate new free radicals or be
rapidly oxidized by a chain reaction (46) Type I antioxidants are primarily
phenolic compounds such as butylated hydroxytoluene (BHT) and butylated
hydroxyanisole (BHA) (47) and tert-butylhydroquinone (TBHQ) commonly
present in foods These synthetic food additives are permitted to be used alone or
in combination However the antioxidant content of a food containing these
additives must not exceed 002 of the oil or fat content of the food according to
the Code of Federal Regulations (58)
Butylated Hydroxyanisole
Phenolic compounds synthetic or natural are excellent antioxidants since
they possess benzene rings containing hydroxyl groups and are relatively
reactive Phenols produce stable antioxidant radicals A that are sufficiently
unreactive to propagate the chain and compete with the lipid substrate (RH)
which is present at a much greater concentration (46)
A + ROO Non-radical products
A + A Non-radical products
Since synthetic antioxidants such as BHT and BHA have restrictions for
use in food due to their toxicological effects on several species and they are
suspected to be potential carcinogens (48) the search for natural and safe
antioxidants especially those of plant origin has greatly increased in recent
years
17
242 Type II- Secondary antioxidants or Free-radical production preventer
This category includes compounds that reduce the rate of chain initiation
by metal chelation oxygen scavenging or absorption of UV radiation (47) The
common chelating agents include ethylenediamine tetraacetic acid (EDTA) citric
acid and phosphates EDTA is used for chelation of many metals and it can be an
effective oxidation inhibitor in foods especially those with intermediate to high
moisture content but not in protein-type food such as meats which contain
substantial amounts of bound form of transition metals (46) In addition EDTA
does not protect food during heating because it is less stable at higher
temperatures therefore it is restricted to foods held or processed at cool
temperatures (49) Citric acid is especially useful in oils and intermediate
moisture foods (46) Ascorbic acid is commonly used as a food antioxidant due to
its oxygen scavenging and reducing properties (47) it is especially effective when
it is used in combination with iron chelators (46) Polyphosphates are more
effective chelators and antioxidants than monophosphates However their
antioxidant activity could be reduced or eliminated depending on the
components of the food (50)
Maillard reaction products can bind transition metals such as iron and
deactivate singlet oxygen Because of their dark color and low solubility they are
unsuitable for use in fats and oils but they may be used to improve the oxidative
stability of many foods (51)
Other preventive antioxidants include several enzymes such as catalase
(47) and glutathione peroxidase (37) which reduce the generation of free radicals
by decomposing hydrogen peroxide and hydroperoxides respectively
243 Type III- Control of Environment Factors
This category does not refer to compounds added to inhibit lipid oxidation
Rather this category refers to factors such as the reduction of the oxygen
content a decrease in temperature altering the moisture content (46) and
exclusion of light (47) As the temperature increases oxygen becomes less soluble
in lipids and water slightly influencing the rate The rate of oxidation increases
proportionally to the surface of the lipid exposed to air According to Labuza (46)
18
lipid oxidation can be reduced by altering the water activity which can alter the
catalytic activity of metal catalysts At an elevated water activity (awgt 055) the
rate of oxidation can increase possibly due to the increased mobilization of metal
catalysts
Antioxidant synergism has been observed between primary antioxidants
and between antioxidants with different modes of actions This synergistic effect
can substantially reduce the level of antioxidants needed in a food
25 Keluak As A Natural Source of Antioxidant
251 Keluak ndash Introduction
Pangium edule Reinw (Figure 21) is a tall tropical tree that grows mainly
in Micronesia Melanesia and Southeast Asia including Indonesia The
taxonomy of the tree is uncertain and it may also be classified in the
Flacourtiaceae or the Violale According to Abdullah (55) the tree requires many
years to mature and the seeds are therefore most frequently harvested from wild
trees as it is not economically feasible to cultivate the plant The size of a Pangi
tree is characterized as medium to large with large glossy heart-shaped leaves
that are conspicuously veined and long-stemmed The flowers are large and
greenish and the sexes are separate Flowering occurs from September to October
with seed shed likely to occur in December to January However there are
records of seed shed in April to May and July to September This tropical tree is
wild and not well cultivated (55)
The trees start fruiting when they are approximately 10 to 15 years old The
fruit is oval in shape and the size ranging from 12-30 cm (52) or about a size of a
large husked coconut brown and rough-surfaced (55) The tree produces a large
fruit that is poisonous because of the presence of cyanogenic glucosides (53)
Almost all parts of the plant are poisonous including its leaves barks and seed
(52) Although poisonous to humans the seeds of the tree are part of the natural
diet of the babirusa (Babyroussa babyrussa) (53) a pig-like animal native to the
region However the mature fruit is edible and the juice can be applied to sores
and cuts (55)
19
In Indonesia the seed kernel of this tree is edible after treatments
following the removal of the cyanogenic glucosides Keluak is fermented in a
specific way the seeds are harvested and placed in the field for 10 days The seeds
are then removed washed and boiled for 3 hours to remove the cyanide (54)
After cooling the seeds are buried (indoor) in ash banana leaves and earth for
40 days The seed turn from a creamy white color to dark brown or black (51)
The fermented seeds are cleaned and ready to be used as spices (54) image is
shown in Figure 22 In some countries according to Ma (56) after harvesting the
fruits are buried in the ground for ~100 days before the large seeds are removed
the rest of the plant is poisonous The charcoal-colored nuts are braised for one
hour so the soft flesh can be scooped out of the skin The taste is bitter buttery
and a bit like chocolate while the texture is a familiar one - think mashed
potatoes or roasted chestnuts (56)
Taxonomy of Keluak (55)
Kingdom Plantae
Division Magnoliophyta
Species Pedule
Family Acariaceae
Binomial name Pangium edule Reinw ex Blume
Authority Reinward
Synonym names football fruit kluwek Indonesia black nut kepayang
kluwek keluwek kluwak pangi paying picung penarassan seis
According to Andarwulan et al (54) the fermented seed product of this tree
depending upon the origin is called
Indonesian
o Keluak kluwak kluak kluwek keluwek or kloewak (Dutch spelling)
o Pucung or pucing (Sundanese)
o Rawan or rawon (adjective referring to food prepared with the seed of
this tree) (Figure 23)
Malay
o Kepayang
20
o Payang
Philipines
o Samaun-referring to the oil
o Pangi- referring to the tree
Keluak is commonly used as a spicy flavoring in soups in Java and South
Sulawesi several traditional dishes can be made with Keluak seeds including
ldquoRawonrdquo (Figure 23) and ldquoBlack nut with golden snapperrdquo (Figure 24) Keluak is
also a raw material for another product ldquokecap pangirdquo (ldquokecaprdquo is a soy sauce-like
product) and it has been used as a spice in Saparua Maluku Island in Indonesia
Another of the edible products is called ldquoDagerdquo which is a boiled seed after the
removal of kernels and water after soaking for 2-3 days Dage is utilized in West
java as a vegetable (54) In this document I will use the term ldquoKeluakrdquo and ldquopangi
to refer to the fermented seed that is commonly used as a spice
252 Nutritional Profile of Keluak
The nutrition fact of the Keluak seed is shown in Table 22 Generally
phenolic compounds are found in the seeds and other parts of the plant Most
seeds contain large amounts of polyunsaturated oils and phenolic antioxidants
are necessary to protect the polyunsaturated fatty acids in the oil against
autoxidation (50)
The pangi seed contains some secondary metabolites (Table 23) of the
cyanogen glycosides which include the cyanogen glycoside and various
alkaloids flavonoids steroids saponins tannins and quinine These metabolites
are present in both fresh and dried pangi seed (55)
253 Previous work on keluak
Previous research by Fardiaz and Romlah (57) on the fermented seed
indicated that the methanol extract of keluak possessed antioxidant activity
Fardiaz and Romlah found that the addition of Keluak seed extract to cooking oil
could lengthen the oxidation induction period of the oil Their findings are
summarized in the Table 24 and Figure 25
21
Recently Chye and Sim (52) used several different extraction methods on
Keluak seeds and examined the antioxidant activity of the extract Extracts of
Pangium edule Reinw seed were investigated for their antioxidative activity
using DPPH radical scavenging and β-carotene bleaching assays For the
extraction they used a mixture of acetone acetic acid water which yielded the
higher phenolic content of 2222 plusmn005 mg GAEg among the other methods of
extraction and showed the most potent antioxidative acivity in both DPPH radical
scavenging and β-carotene (Figures 26- 27) They found that significant
correlation was observed between the total phenolic content and its antioxidative
activity (r=0878) suggesting that the phenolics of the Keluak extract could be
potential sources of natural antioxidants (52)
22
26 Figures
Figure 21 Pangium Plant
httpwwwpngplantsorgPNGtreesTreeDescriptionsPangium_edule_Reinwhtml httptravelspotcoolstuffcomgourmet-adventureunusual-food5-lethal-
delicious-meals
Figure 22 Keluak Seed
Source Wayang Brand Kluwak Kupas PT Wira Aksara Jakarta Indonesia
Figure 23 A Dish Made With Keluak Seed- Black Beef Soup (Rawon)
httpwwwlestariwebcomresep-indonesiaEnglishRawonphp
23
Figure 24 A Dish made with Keluak Seed- Black Nut with Golden Snapper
httpdelightfultastebudscom20110501rawon-indonesian-beef-black-soup
Figure 25 The Effect of Kluwak Extract on Oxidation Induction Period of Palm Oil (57)
24
Figure 26 DPPH radical scavenging activity () of Keluak seed extracts at different
concentrations (52)
Phenolic (Ace) = phenolic extracted by acetone Phenolic (EtOAc) = Phenolic extracted by ethyl acetate FPA= Free phenolic acid GBPA= Glycoside-bound
phenolic acid Al= Alkaloid
Figure 27 Antioxidative Activity of Keluak Seed Extracts at 20 mgmL measured by β-
carotene bleaching method (52)
Phenolic (Ace) = phenolic extracted by acetone Phenolic (EtOAc) = Phenolic extracted by ethyl acetate FPA= Free phenolic acid GBPA= Glycoside-bound
phenolic acid Al= Alkaloid
25
27 Tables
Table 21 Fatty Acid Composition of Turkey Meat (50)
Table 22 Nutrition Fact of Keluak Seed
Per 100 grams (or 100 mL)
Energy 2428 kj
Protein 15 g
Fat (Total) 50 g
Carbohydrate (Total) 17 g
Sugar 4 g
Dietary Fiber 10 g
Sodium -
Potassium 680 mg
Calcium 0
Vitamin A 0
Vitamin C 0
Iron 0 Source Wayang Brand Kluwak Kupas PT Wira Aksara Jakarta Indonesia
26
Table 23 Anti- Nutritional Factors of Pangium Seed (55)
Anti- Nutritional Factors Dry wt Basis (microgg)
Arsenic NA
Cyanide 1834
Lead 18
Phytic acid NA
Tannin 046
Alkaloid NA
Table 24 The Antioxidative Activity of Kluwak Expressed as Protective Factor (57)
27
28 References
1 Kanner J Rosenthal I An Assessment of Lipid Oxidation in Foods - Technical Report Pure and Applied Chemistry 1992 64 1959-1964
2 Skibsted LH Understanding oxidation processes in foods Woodhead Publ Food Sci Technol Nutr 2011 199 3-35
3 Yu L Scanlin L Wilson J Schmidt G Rosemary extracts as inhibitors of lipid oxidation and color change in cooked turkey products during refrigerated storage J Food Sci 2002 67 582-585
4 Rhee K Anderson L Sams A Lipid oxidation potential of beef chicken and pork J Food Sci 1996 61 8-12
5 Hernandez P Navarro J Toldra F Lipid composition and lipolytic enzyme activities in porcine skeletal muscles with different oxidative pattern Meat Sci 1998 49 1-10
6 Karakok SG Ozogul Y Saler M Ozogul F Proximate Analysis Fatty Acid Profiles and Mineral Contents of Meats a Comparative Study Journal of Muscle Foods 2010 21 210-223
7 Chan K Decker E Endogenous Skeletal-Muscle Antioxidants Crit Rev Food Sci Nutr 1994 34 403-426
8 Decker E Xu Z Minimizing rancidity in muscle foods Food Technol 1998 52 54-59
9 Rojas MC Brewer MS Effect of natural antioxidants on oxidative stability of cooked refrigerated beef and pork J Food Sci 2007 72 S282-S288
10 Gray J Macdonald B Pearson A Morton I Role of Nitrite in Cured Meat Flavor - a Review J Food Prot 1981 44 302-8
11 Brewer M Vega J Detectable Odor Thresholds of Selected Lipid Oxidation Compounds in a Meat Model System J Food Sci 1995 60 592-595
12 St Angelo A Crippen K Dupuy H James C Chemical and Sensory Studies of Antioxidant-Treated Beef J Food Sci 1990 55 1501-1508
13 Buckley D Gray J Asghar A Price J Crackel R Booren A Pearson A Miller E Effects of Dietary Antioxidants and Oxidized Oil on Membranal Lipid Stability and Pork Product Quality J Food Sci 1989 54 1193-1197
14 Guntensperger B Escher F Oxidative Changes of Heat-Sterilized Meat in Trays J Food Sci 1994 59 689-692
28
15 Bauernfeind JC Antioxidant function of L-ascorbic acid in food technology International journal for vitamin and nutrition researchSupplement = Internationale Zeitschrift fur Vitamin- und ErnahrungsforschungSupplement 1985 27 307-333
16 Georgantelis D Blekas G Katikou P Ambrosiadis I Fletouris DJ Effect of rosemary extract chitosan and alpha-tocopherol on lipid oxidation and colour stability during frozen storage of beef burgers Meat Sci 2007 75 256-264
17 Botsoglou NA Govaris A Giannenas I Botsoglou E Papageorgiou G The incorporation of dehydrated rosemary leaves in the rations of turkeys and their impact on the oxidative stability of the produced raw and cooked meat Int J Food Sci Nutr 2007 58 312-320
18 Karpinska-Tymoszczyk M Effect of the addition of ground rosemary on the quality and shelf-life of turkey meatballs during refrigerated storage Br Poult Sci 2008 49 742-750
19 Drumm T Spanier A Changes in the Content of Lipid Autoxidation and Sulfur-Containing-Compounds in Cooked Beef during Storage J Agric Food Chem 1991 39 336-343
20 Folch J Lees M Stanley GHS A Simple Method For The Isolation And Purification Of Total Lipides From Animal Tissues Journal of Biological Chemistry 1957 226 497-509
21 Grau A Codony R Rafecas M Barroeta A Guardiola F Lipid hydroperoxide determination in dark chicken meat through a ferrous oxidation-xylenol orange method J Agric Food Chem 2000 48 4136-4143
22 Dobarganes M Velasco J Analysis of lipid hydroperoxides European Journal of Lipid Science and Technology 2002 104 420-428
23 Juntachote T Berghofer E Siebenhandl S Bauer F The antioxidative properties of Holy basil and Galangal in cooked ground pork Meat Sci 2006 72 446-456
24 Lee M Choi J Choi Y Han D Kim H Shim S Chung H Kim C The antioxidative properties of mustard leaf (Brassica juncea) kimchi extracts on refrigerated raw ground pork meat against lipid oxidation Meat Sci 2010 84 498-504
25 Botsoglou N and Botsoglou E Oxidation in Foods and Beverages and Antioxidant Applications Vol 2 Management in Different Industry Sectors In Decker EA Elias RJ and McClements D J (eds) Oxidation in Foods and Beverages and Antioxidant Applications Vol 2 Management in Different Industry Sectors 2010 200 1-528
29
26 National Chicken Council Per Capita Consumption of Poultry Livestock 1965 to Estimated 2012 in Pounds 2012 Retrieved in January 23 2012 from httpwwwnationalchickencouncilorgabout-the-industrystatisticsper-capita-consumption-of-poultry-and-livestock-1965-to-estimated-2012-in-pounds
27 Bilgili SF Poultry meat processing and marketing- what does the future hold Poult Internat 2002 12-22
28 Nolan N L Bowers J A and Kropf D H Lipid Oxidation and Sensory Analysis of Cooked Pork and Turkey Stored under Modified Atmospheres Journal of Food Science 1989 54 846ndash849
29 Esteacutevez M Morcuende D and Ventanas S Determination of Oxidation Nollet Leo M LToldraacute Fidel (Eds) Handbook of Muscle Foods Analysis Boca Raton CRC Press 2009 221-240
30 Frankel E N Lipid oxidation Prog Lipid Res 1980 19 1ndash22
31 Frankel E N Volatile Lipid Oxidation Products Progress in lipid research 1983 221 1-33
32 Hsieh R J and J E Kinsella Oxidation of Polyunsaturated Fatty Acids Mechanisms Products and Inhibition with Emphasis on Fish Advances in Food and Nutrition Research 1989 Vol 33
33 McMillin K W Initiation of oxidative processes in muscle foods Annual Proceedings of the Reciprocal Meat Conference Am Meat Sci Assoc Chicago IL 1997 49th 53ndash64
34 Monahan FJ Oxidation of lipids in muscle foods fundamental and applied concerns In EA Decker C Faustman and CJ Lopez-Bote (Eds) Antioxidants in Muscle Foods Nutritional Strategies to Improve Quality New York John Wiley and Sons Inc 2000
35 Robinson M E Haemoglobin and methaemoglobin as oxidative catalysts Biochemical Journal 1924 18 255-264
36 Jadhav SJ Nimbalkar SS Kulkarni AD and MadhaviDL Lipid oxidation in biological and food systems In Marcel Dekker (Eds) Food Antioxidants Technological Toxicological and Health Perspectives New York 1996
37 Niki E Antioxidants and relation to lipid oxidation Chemistry and physics of lipids 1987 44 227-300
38 Gray J I and Monahan FJ Measurement of lipid oxidation in meat and meat products Trends Food Sci Technol 1992 3 315-9
30
39 Chang S S and Peterson R J The Basis of Quality in Muscle Foods Recent Developments In The Flavor of Meat Journal of Food Science 1977 42 298ndash305
40 Lea C H Methods for determining peroxide in lipids J Sci Food Agric 1952 3 586ndash594
41 White P J Conjugated diene anisidine value and carbonyl value analysis In Warner K and Eskin N A M (Eds) Methods to Access Quality and Stability of Oils and Fat-Containing Foods Champaign IL AOCS Publishing 1995 159-177
42 Coxon D Measurement of lipid oxidation Food Science and Technology Today 1987 1164-6
43 Warner K Sensory evaluation of oils and fat-containing foods In K Warner and N A M Eskin (Eds) Methods to Access Quality and Stability of Oils and Fat-Containing Foods AOCS Publishing 1995 49
44 AMSA Research Guidelines for cookery sensory evaluation and instrumental tenderness measurements of fresh meat American Meat Science Association-National Live Stock and Meat Board 1995
45 Association of Official Analytical Chemists Official methods of analysis (16th ed) Washington DC Association of Official Analytical Chemists 1995
46 Labuza T P and Dugan L R Kinetics of lipid oxidation in foods C R C Critical Reviews in Food Technology 1971 2 3
47 Gordon MF The mechanism of antioxidant action in vitro In Hudson BJF (Ed) Food Antioxidants London Elsevier Applied Science 1990 1-18
48 Shahidi F Janitha P Wanasundara P Phenolic Antioxidants Crit Rev Food Sci Nutr 1992 32 67-103
49 Roozen JP Effects of types I II and III antioxidants on phospholipid oxidation in a meat model for warmed over flavour Food Chem 1987 24 167-185
50 Pokornyacute J Natural antioxidants for food use Trends in Food Science and Technology 1991 2 223-227
51 Wong W H Buah Keluak National Parks 11 Jan 2007 Retrieved 02 July 2012 from httpenwikipediaorgwikiPangium_edule
52 Chye FY Sim KY Antioxidative and Antibacterial Activities of Pangium edule Seed Extracts International Journal of Pharmacology 2009 5 285-297
31
53 Andarwulan N Fardiaz D Wattimena GA Shetty K Antioxidant activity associated with lipid and phenolic mobilization during seed germination of Pangium edule Reinw J Agric Food Chem 1999 47 3158-3163
54 Andarwulan N Fardiaz S Apriyantono A Hariyadi P Shetty K Mobilization of primary metabolites and phenolics during natural fermentation in seeds of Pangium edule Reinw Process Biochemistry 1999 35 197-204
55 Abdullah Moh A B Phyochemical Composition of Fresh and Cooked of Chesnut (Castanopsis argentea) Pangium (Pangium edule) and Pra (Elateriospermum tapos) Seeds Final Year Project Food Science and Technology in the Faculty of Applied Sciences Universiti Teknologi Mara Malaysia January 2012 Retrieved on July 4 2012 from httpeprintsptaruitmedumy49401MOHD_ASRUL_BIN_ABDULLAH_12_24pdf
56 Ma A A Peranakan favorite is ayam buah keluak Chicken stewed with black nuts at True Blue RestaurantWall Street Journal (Online) New York NY Dec 16 2010 Retrieved July 4 2012 from httpproquestumicompqdwebdid=2214039511ampsid=1ampFmt=3ampclientId=36305ampRQT=309ampVName=PQD
57 Fardiaz D Romlah S Antioxidant activity of picung (Pangium edule Reinw) seed In Development of Food Science and Technology in ASEAN Proceedings of the Fourth ASEAN Food Conference February 17ndash21 1992 ASEAN Jakarta Indonesia 1992 814ndash819
58 Food and Drugs Administration Food Additives Permitted for Direct Addition to Food for Human Consumption Code of Federal Regulations Title 21 pt 172190 2006
59 Kerler J Grosch W Character impact odorants of boiled chicken changes during refrigerated storage and reheating Zeitschrift Fur Lebensmittel-Untersuchung Und-Forschung A-Food Research and Technology 1997 205 232-238
60 Baggio S Vicente E Bragagnolo N Cholesterol oxides cholesterol total lipid and fatty acid composition in turkey meat J Agric Food Chem 2002 50 5981-5986
32
CHAPTER 3 MATERIALS AND METHODS
31 Keluak Antioxidant and Chemicals
Keluak (Kupas Wayang Brandreg Peeled Keluak Nuts PT Wira Aksara
Jakarta Indonesia was manufactured for Empire International East Chief
Privado Ontario CA 91761) Butylated hydroxytoluene (BHT) gallic acid (ACS
reagent) and 2-thiobarbituric acid were obtained from Sigma Chemical
Company St Louis MO USA Sodium chloride (crystal ARreg ACS) was obtained
from Mallinckrodt Baker Inc (Phillipsburg NJ USA)
The reagents used included acetone (Certified ACS) and chloroform (certified
ACS) obtained from Fisher Scientific Fair Lawn NJ USA Acetic acid (Glacial
ACS reagent) was purchased from J T Baker (Center Valley PA 18034 USA)
and Folin Ciocalteursquos phenol reagent (2 N) was purchased from Sigma-Aldrich
(St Louis MO USA)
311 Phenolic Extraction
Keluak seeds were ground into fine pieces using a coffee grinder (Braun
Inc Lynnfield MA USA) The fatty material from the ground seed was removed
first using a method modified from Wettasinghe and Shahidi (1) The ground seed
was washed with n-hexane (16 gg) and placed in a sonicator for 15 minutes
with occasional stirring The mixture was vortexed for 30 secs before it was
centrifuged at 2688 x g for 10 minutes (Sorvallreg Instrument RC-5B Du Pont
Company Wilmington DE USA) The upper fat-soluble layer was discarded
The solid was washed 2 ndash 3 additional times The solids remained at the bottom
after washing The defatted solids were then air-dried overnight under the hood
to remove any solvent residue
Forty grams of dried defatted Keluak seeds were extracted by stirring with
200 mL of solvent (acetone water acetic acid 90 95 05 vvv) at 60degC and
600 rpm for 2 hrs The mixture was then filtered through filter paper (Whatman
1 Buckinghamshire UK) The filtrate was collected and dried at 45degC using a
rotary evaporator until no further weight changes occurred The concentrated
extract was further dried using a vacuum oven at 45degC overnight The extract was
33
collected dissolved in 100 ethanol flushed with Argon gas and stored at -20degC
until further use
312 Total Phenolics content
The total phenolic content was measured using the Folin-Ciocalteu assay
as modified by Waterhouse (13) The phenolic extract was diluted with 100
ethanol to make several dilutions (1100 2100 and 10100) One milliliter of each
dilution was added to a test tube containing 5 mL of deionized water Then 05
mL of 50 Folin-Ciocalteu reagent was added to the test tube The solution was
mixed and allowed to stand for 8 mins at 22degC before adding 1 mL of 5 sodium
carbonate (wv) The mixture was vortexed using a touch mixer (model 231
Fisher Scientific Pittsburgh PA USA) and incubated in the dark for 1 hr The
solution was vortexed a second time before reading the absorption with a UV-
spectrophotometer (Spectronic Genesys 5 spectrophotometer Thermo Electron
Corporation Madison WI USA) at 725 nm against DI water A standard curve
was prepared at the same time with gallic acid at concentrations ranging from 0
to 100 mgL The quantity of total phenolic content in the sample was calculated
as gallic acid equivalents (GAE) from the standard curve using the formula
C = c times (V divide m) where
C is total phenolic content (mg GAEg extract)
c is the concentration of gallic acid obtained from the calibration curve (mgmL)
V is volume of sample (mL)
m is mass of the sample extract (g)
32 Sample Preparation
Ground turkey meat (15 fat Jennie-O Turkey Store Wilmar MN USA)
purchased from a local grocery store at day 0 and was immediately divided into 4
treatments according to the formulation (Table 31) (2 3)
(1) Control- No antioxidant
(2) Commercial antioxidant- 002 BHT (ww of lipid)
(3) Natural antioxidant- 002 Keluak extract (ww of lipid)
34
(4) Natural antioxidant ndash 004 Keluak extract (ww of lipid)
The level of Keluak extract antioxidant used was based on the amount of
fat in each formula Salt was dissolved in water prior to addition to the meat The
water addition was 5 of the ground meat (ww) The antioxidant and salt were
mixed in the liquid first before adding it to the meat by sprinkling while mixing
After the antioxidant salt and liquid addition mixing by hand (wearing gloves)
was continued for 5 mins The meat mixture was prepared into patties of uniform
size (using a cookie cutter diameter= 55 cm thickness= 15 cm) The patties
were cooked in an electrical skillet and temperature was monitored by Digi-
Sensereg Scanning Thermometer (Model 92000-00 Cole Parmer Instrument Co
Barrington IL) using copper-constantin thermocouple wires (Type T Omega
Engineering Inc Stamford CT) to an endpoint temperature of 74degC The cooked
patties were cooled and placed in a single layer on a tray and then overwrapped
in commercial PVC (water vapor transmission rate=15 g100 m224 h oxygen
transmission rate 880 cm3m224 h) and aluminum foil over the wrap The
patties were stored at 2degC in the dark and were assayed for the extent of oxidation
by odor sensory TBARS conjugated dienes and peroxide value analysis at days
0 1 3 5 7 for the first study (2)
In a second separate study a longer storage time study was completed to
examine the effect of antioxidants on the cooked ground turkey over a longer
time period The same procedure for antioxidant addition and meat sample
preparation was used However in the second study the samples were stored for
a total of 15 days (5 6) Samples were collected at days 0 1 3 5 7 10 13 15 for
TBARS conjugated dienes peroxide values and pH determinations
33 Thiobarbituric Acid Reactive Substances (TBARS)
Lipid oxidation was assessed by the 2-thiobarbituric acid (TBA) method of
Tarladgis and others (4) and Yu et al (5) Briefly 10 g of meat was homogenized
with 50 mL of deionized water using a homogenizer (IKAreg T25 digital Ultra-
Turrax Wilmington NC USA) The homogenate was filtered through 1
Whatman paper Five mL of the clear filtrate was mixed with 5 mL TBA reagent
35
containing 002 M TBA in 90 glacial acetic acid The mixture was capped
vortexed for 30 secs and incubated in the dark for 15-18 hrs at room temperature
After the color developed the mixture was measured for absorbance at 532 nm
against a blank (deionized water) The absorbance was converted to TBAR values
using 1133- tetraethoxypropane to prepare a standard curve Triplicates of 10 g
samples were prepared for each treatment TBA value is expressed as mg MDA
kg meat
34 Conjugated Dienes
Conjugated dienes (CD) were determined by the method described by
Juntachote and others (6) with slight modifications A cooked meat sample (05
g) was suspended in 5 mL of deionized water and homogenized using a digital
Ultra-Turrax T25 (IKAreg Wilmington NC USA) to obtain a smooth slurry A 05
mL aliquot of this suspension was mixed with 5 mL of extracting solution
containing hexane and isopropanol (31 vv) and mixed for 1 min using a vortex
mixer After centrifugation at 2000 g for 5 mins the supernatant was collected
and the absorbance of the supernatant was determined at 233 nm The
concentration of conjugated dienes was calculated using a molar extinction
coefficient of 25200 M-1cm-1 and the result were expressed as nmole of
conjugated dienes per mg meat sample
35 Peroxide Value
The peroxide value was determined according to the AOAC method 96533
(Association of Official Analytical Chemists) (13) with a few modifications The
lipids from meat samples were extracted by the method of Kim et al (7) First 5 g
of meat sample was broken into small pieces and placed in a water bath at 60˚C
to melt the fat for 30 mins The meat was extracted with a solution containing
acetic acid chloroform (32) and then filtered with Whatman 1 filter paper A
saturated solution of potassium iodide (KI 05 mL) was added to the filtrate The
solution color changed to yellow and then 30 mL of deionized water was added
The mixture was allowed to let stand at room temperature for at least 5 mins and
the color would turn to pale to bright yellow Before titrating with 001 N of
36
sodium thiosulfate (Na2SO3) 05 mL of 1 starch solution was added (a color
changed occurred - the color turned purple to blue-black) The PV is expressed as
meq O2kg lipid
36 pH value
To determine the pH of the meat samples cooked meat samples (10 g)
were blended with 50 mL deionized water for 15 seconds in a homogenizer
(Ultra-Turrax T25 IKAreg Wilmington NC USA) The pH was measured with a
pH meter (Accumet Basic model AB 15 Fisher Scientific Company) The pH
meter was calibrated daily with standard buffers of pH 40 and 70 at 25˚C
37 Sensory Evaluation
Trained panelists (n=15) were recruited from among University of Illinois
graduate students and staff The panelists were prepared using an extensive
training program During each training session panel members practiced and
discussed the techniques developed for sample presentation score sheet terms
and odor sensory evaluation method A panel leader led the panelists to develop
terms to describe the aroma characteristics of fresh cooked turkey meat including
the aroma characteristics of cooked poultry with or without the added Keluak
extract Panel members were trained regularly for 7 sessions for total of two
weeks to identify and discriminate aroma differences Some of the terms were
derived from reference standards including fresh boiled ground turkey meat
lard oxidized vegetable oil hard-boiled egg and wet cardboard (Table 32) The
panelists agreed on the following aroma descriptors for warm-over-flavor meaty
fatty rancid eggy and cardboardy These descriptors were judged for the
presence and overall intensity using a 15 cm-structured line scale (0 = none 15 =
extreme) along with an anchor value for each respective standard Table 2
showed the form used to evaluate the aroma descriptors described above
Cooked patties were uniformly cut into four pie-shaped wedges and placed
in a sniff bottle (Nalgene Teflon PTFE wash bottle Nalge Company Rochester
NY USA) covered with foil to hide the identity of the sample inside Each sample
represented a treatment labeled with three-digit random numbers and were
37
served at random order during each test session The samples were held in an
incubator (45degCplusmn 1degC) for 30 mins prior to presentation to the panelists The
panelists were asked to clean their palate by chewing a piece of unsalted saltine
crackers and rinse with water prior to evaluating the samples Samples were
sniffed Four samples were evaluated for each test session Roasted coffee beans
were presented for panelists to clear the palate between samples Standard
references were prepared daily The second session replicates of the first session
was conducted one week after the first session
38 Statistical Analysis
Statistical assessment was carried out with the program SAS Data were
analyzed as 4 (treatments) by 5 (days of storage) The results from the TBARs
analysis peroxide value analysis conjugated dienes analysis and the
odorsensory analysis were analyzed using one-way analysis of variance
(ANOVA) Differences were considered significant at the P lt 005 level
Comparison of treatment means was based on Fisherrsquos Least Significant
Difference (LSD)
38
39 Tables
Table 31 Formulation of Cooked Ground Turkey Meat for Each Treatment
TREATMENTS
Control BHT AO 200ppm AO 400ppm
INGREDIENTS
Jenny-O 15 fat Ground Turkey
(g) 650 650 650 650
Salt (2 ww) (g) 13 13 13 13
BHT (002 of total fat) (g) 002
Keluak extract (mL)
2487 (002 g
phenolics)
4974 (004 g
phenolics)
Cold water (mL)5 by sample wt
(ww) 325 325 325 325
Table 32 Descriptive Odor Standards for Refrigerated Ground Turkey Meat
Descriptive Odor term Standard Location on the 15-cm line
Rancid Oxidized vegetable oil in water (1100 vv) 7
Cardboard 1 cm2 cardboard in 15 mL water 85
Eggy Fresh hard-boiled egg white (01 g) 9
Meaty Fresh boiled ground turkey meat in water (15 gv) 8
Fatty Lard (02 g) 9
39
310 References
1 Wettasinghe M Shahidi F Antioxidant and free radical-scavenging properties of ethanolic extracts of defatted borage (Borago officinalis L) seeds Food Chem 1999 67 399-414
2 Vara-Ubol S Bowers J Effect of alpha-tocopherol beta-carotene and sodium tripolyphosphate on lipid oxidation of refrigerated cooked ground turkey and ground pork J Food Sci 2001 66 662-667
3 Hassan O Fan L The anti-oxidation potential of polyphenol extract from cocoa leaves on mechanically deboned chicken meat (MDCM) Lwt-Food Science and Technology 2005 38 315-321
4 Tarladgis B Dugan L Pearson A Chemistry of 2-Thiobarbituric Acid Test for Determination of Oxidative Rancidity in Foods 2 Formation of Tba-Malonaldehyde Complex without Acid-Heat Treatment J Sci Food Agric 1964 15 602-amp
5 Yu L Scanlin L Wilson J Schmidt G Rosemary extracts as inhibitors of lipid oxidation and color change in cooked turkey products during refrigerated storage J Food Sci 2002 67 582-585
6 Juntachote T Berghofer E Siebenhandl S Bauer F The antioxidative properties of Holy basil and Galangal in cooked ground pork Meat Sci 2006 72 446-456
7 Kim YJ Jin SK Park WY Kim BW Joo ST Yang HS The Effect of Garlic Or Onion Marinade on the Lipid Oxidation and Meat Quality of Pork during Cold Storage J Food Qual 2010 33 171-185
8 Chye FY Sim KY Antioxidative and Antibacterial Activities of Pangium edule Seed Extracts International Journal of Pharmacology 2009 5 285-297
9 Kahkonen M Hopia A Vuorela H Rauha J Pihlaja K Kujala T Heinonen M Antioxidant activity of plant extracts containing phenolic compounds J Agric Food Chem 1999 47 3954-3962
10 Jayaprakasha G Selvi T Sakariah K Antibacterial and antioxidant activities of grape (Vitis vinifera) seed extracts Food Res Int 2003 36 117-122
11 Fardiaz D Romlah S Antioxidant Activity of Picung (Pangium edule Reinw) Seed In Development of Food Science and Technology in ASEAN Proceedings of the 4th ASEAN Food Conference Feb 17-21 1992 ASEAN Jakarta Indonesia 1992 12 Waterhouse A L Determination of Total Phenolics Current Protocols in
Food Analytical Chemistry 2002 I111-I118
40
13 Association of Official Analytical Chemists (1995) Official methods of analysis (16th ed) Washington DC Association of Official Analytical Chemists
41
Chapter 4 RESULTS AND DISCUSSION
41 Phenolic Extraction Yield
The phenolic extract yield using acetone water acetic acid (90 95 05)
extraction was 503 plusmn 140 g of extract per 70 g of defatted ground Keluak seed or
007 g phenolic extract per gram of defatted Keluak The samples contained
approximately 719 phenolic compounds by weight the values are equal to the
average plusmn standard deviation of the three replicate analyses This value was
moderately greater than that reported by Chye and Sim (1) which reported a
548 yield The total phenolic content as determined using Folin-Ciocalteau
reagent was 1973 plusmn 203 mg GAEg extract which was also moderately greater
than the result reported by Chye and Sim which was 1639plusmn 004 mg GAEg
extract (1) It is possible that the difference is due to the Keluak source Chye and
Sim obtained their seeds material from local indigenous markets in Kota
Kinabalu Sabah Malaysia (1) while the seeds used in this study were grown in
from Indonesia The geographical and horticultural differences could affect the
phenolic content and concentration of the seed
According to Kahkonen et al (2) different phenolic compounds can have
different responses in the Folin Ciocalteau method depending on their chemical
structure Therefore the antioxidant activity of an extract cannot be predicted
solely on its total phenolic content (3 4)
42 Effect of Keluak Extract and storage time on TBARS values during
refrigerated storage of cooked ground turkey
The TBARS values represent the content of secondary lipid oxidation
products particularly malonaldehyde The carbonyls are primarily responsible
for the production of off-flavors in oxidized meat and meat products Aldehydes
are formed by the oxidation of unsaturated fatty acids They react with the TBA
reagent to form a pink complex (TBA chromogen) with a maximum absorbance
at 532 nm The intensity of this pink color is directly related to the concentration
of the TBA-reactive substances in the original sample The results of the TBARs
analysis for the preliminary study (7 days) and the extended storage study (15
days) are shown in Tables 41a b and Figures 41a b respectively Overall lipid
42
oxidation increased substantially as the refrigerated storage progressed due to
the effects of heating and in combination with storage under aerobic conditions
On the first day of analysis for both the 7 and 15 days storage study all the
antioxidant treated samples (BHT and both concentrations of the Keluak
extracts) the TBARS values were significantly lower than the control an
indication that the antioxidants had a positive effect in suppressing oxidation
Similar findings were observed by Juntachote et al and Teets et al (5 6) TBARS
values for both 7 and 15 days storage study ranges from 035- 475 mg MDA kg
meat which was comparable to other study by Juntachote (5) for 14 days of
storage study of pork meat There were examining the effect other natural
sources of antioxidants on oxidation during refrigerated storage of cooked meat
During the preliminary study (Table 41a) the control and BHT treatments
did not show significant differences (Pgt005) from day 1-7 However both of the
Keluak extract treatments showed a significant (Plt005) effect on the
suppression of the progression of lipid oxidation as compared to the control
(Figure 41a)
On the other hand during the 15 day study all the samples with added
antioxidants had significantly lower TBAR values compared to the control
throughout the entire storage period This indicates that both the commercial
treatment and the treatment with Keluak extracts provided substantial protection
to the meat with respect to lipid oxidation The efficacy of the Keluak extracts to
inhibit lipid oxidation is probably related to their phenolic content The results of
this study showed agreement with those obtained by Fardiaz and Romlah (14)
which stated that the addition of Keluak extract to palm oil lengthened the
oxidation induction period from 22 hours to 50 hours
Lipid oxidation was considerably greater with longer storage times due to
the exposure to oxygen TBARs measure the formation of secondary lipid
oxidation products which contribute to WOF in oxidized meat Heat increases the
release of non-heme iron from the heme pigments a major catalyst for lipid
oxidation in cooked meats (7) Cooking also alters cellular compartmentalization
and exposes membrane phospholipids to molecular oxygen and metal ions (8)
43
resulting in greater amounts of lipid oxidation (9) The addition of antioxidants
during processing cooking or packaging can be done to increase the oxidative
stability of cooked meat (10)
43 Effect of Keluak Extract and Storage Time on Conjugated Diene
Content during Refrigerated Storage of Cooked Ground Turkey
Meat
The development of conjugated dienes (CD) is related to the formation of
hydroperoxides found in the extracted lipids of the cooked ground turkey
Unsaturated fatty acid double bonds occur naturally in a methylene interrupted
structure As meat begins to oxidize the double bonds of these fatty acids are
altered creating conjugated systems which can be measured
spectrophotometrically (6) During lipid peroxidation non-conjugated double
bonds (C=CndashCndashC=C) which are present naturally in unsaturated lipids are
converted to conjugated double bonds (C=CndashC=C) with a large increased in
absorption at 232ndash234 nm (11) In the preliminary study there were no significant differences among the
antioxidant treated sample and the control (Pgt005) except on day 5 (Figure 42a
and Table 42a) The CD value for all the treatments peaked at day 5 and the
samples treated with antioxidants were significantly different that the control
(Plt005)
Meanwhile during the second storage study (Table 42b and Figure 42b)
when the CD values were compared to the control on day 0 and day 1 the 002
BHT and both of the Keluak extract treated samples were not significantly
different (Pgt005) However from day 3 on all the antioxidant-treated samples
had less CD formation than the control (Plt005) The CD content of the control
generally increased especially during the last 5 days (Day 10 13 and 15) of the
study Additionally cooked ground turkey treated with Keluak at 400 ppm had
slightly lower concentrations of conjugated dienes compared to cooked ground
turkey containing Keluak extract at 200 ppm and the commercial antioxidant
(BHT) The trend of CD formation was similar to several other studies (5 6 12
13) They generally observed that the CD concentration for most samples peaked
44
on Day 3 and decreased thereafter This phenomenon of decreased CD is likely
due to the decomposition of the conjugated diene hydroperoxides into secondary
oxidation products over time Conjugated dienes hydroperoxides are expected to
decompose into secondary products as was observed in this study According to
Frankel (15) the formation of conjugated dienes which is related to the
production of hydroperoxides occurs in the early stages of lipid oxidation According to Estevez et al (17) measurement of conjugated dienes (CD) in
meat products containing elevated levels of PUFA is limited depending on the
fatty acid composition of the sample as well as the presence of other non-
hydroperoxides CDs In agreement with Grau et al (18) the TBA test showed a
higher sensitivity with respect to lipid oxidation than did the CD determination
44 Effect of Keluak extract and storage time on peroxide value during
refrigerated storage of cooked ground turkey
Peroxide values (PV) were also used to assess the level of lipid oxidation in
cooked ground turkey during storage at 2˚C (Table 43 and Figure 43) However
while there were differences between the control and samples treated with AOs
on a few days the result of this study showed that treatments had no significant
effect (Pgt005) on the peroxide values compared to the control Generally based
on the results in Table 4 and Figure 4 the PVs increased during storage and
peaked on day 10 At the time it is possible that much of the polyunsaturated
membrane lipids may have been oxidized at that point so that further storage
and oxidation resulted in a decrease in the concentration of peroxides and thus
the PV
The PV differences among the samples did not provide proof that any of
the AOs were effective It is not clear why the PV analysis did not provide any
evidence of AO efficacy According to Estevez (17) the sensitivity of this method
is about 05 miliEquivalentkg of lipid Lower peroxide values cannot be
measured satisfactorily by the AOCS method because of the uncertainty with the
iodometric titration endpoint unless the iodine-starch end is determined
potentiometrically at levels as low as 006 Eqkg lipid The iodometric method is
highly empirical and very small procedural differences can cause variation in the
45
results (19) Two major sources of error in this test could be the liberation of
iodine by air oxidation of the KI and absorption of iodine by fatty acid double
bonds (17)
4 5 Effect of Keluak Extract and storage time on Odor of Refrigerated
Cooked Ground Turkey
No significant interaction (Pgt 005) occurred between antioxidant and
storage time for most of the odor characteristics (Tables and Figures 44-48)
For meaty odor characteristic (Figure and Table 44) the score of all the
treatments over the 7 days of storage did not show significant differences
(Pgt005) The scores ranged from 502 ndash 783 which was slightly below the
freshly boiled turkey meat standard for meaty (which was ranked 8 in the 15-cm
line scale) Therefore the panelists were unable to score and detect the cooked
meat aroma differences in the treated samples relative to the standard reference
The meaty aroma in this study was used to determine if there were possible
masking effects from the AO treatments
For the rancid odor (Figure and Table 45) both of the Keluak treated
samples were perceived as more rancid than both control and BHT after day 1
Overall both of the Keluak treated samples were ranked higher than the control
and BHT which disagrees with the results of TBA test However there was no
significant difference among the treatments between day 3-7 According to Ruth
(20) rancidity as a measure of lipid oxidation is usually best measured by the
concentration of TBARS
The minimum TBA values that corresponds to dark chicken meat samples
that were significantly different in rancid aroma was 1933 μg MDAkg of meat
(21) For consumer acceptability the TBA values must be less than 785 μg of
MDAkg (21) The results from Bou et al (21) were comparable to the results
reported by Gray and Pearson (22) showing that rancid flavor in meats is initially
detected between 500 and 2000 μg of MDAkg of meat In addition OrsquoNeill et
al (23) found that the threshold for WOF detection in cooked dark chicken meat
was at TBA values ge800 μg of MDAkg of meat Since chicken and turkey meat
46
have a comparable PUFA content those values were considered useful in this
experiment On the other hand the odor score for Eggy cardboard and fatty were
statistically not different (Pgt 005) Panelists were unable to detect differences
which could be to different reasons such as that Keluak extract has an aroma
masking effect that confuses the panelists with the ldquooff-odorrdquo The Keluak did
have a slight aroma and it is likely that it masked the effects of storage on lipid
oxidation The aroma of Keluak has been described as bitter dirt-like and
chocolate-like odor (16) This aroma masking could be perceived as undesirable
by the panelists and it might have been mistaken as an off-odor or as an oxidized
sample even though the TBARs and CD data showed otherwise
4 6 Effect of Keluak Extract and storage time on pH of Refrigerated
Cooked Ground Turkey
Table 49 shows the effect of antioxidant treatments in pork muscle on pH
values during storage at 2˚C The values of the pH ranged between 633-668
Generally there are no correlations of pH value among the treatments during
storage The trend for the pH value is inconclusive
47
47 Figures Figure 41a The profile of TBARS in cooked ground turkey treated with various
antioxidants during storage at 2˚C- A Preliminary Study
K200 and K400 represent treatments with Keluak extract at concentration of 200 and 400 ppm respectively
0000
1000
2000
3000
4000
5000
6000
0 2 4 6 8
TBA
RS
(mg
MD
Ak
g m
eat
)
Storage Days
Control
BHT
K200
K400
48
Figure 41b The profile of TBARS in Cooked Ground Turkey Treated with Various Antioxidants During Storage at 2˚C- Extended Storage Time
K200 and K400 represent Keluak extract at concentration of 200 and 400 ppm respectively
Figure 42a Conjugated dienes values of different antioxidant treatments over storage at
2˚C - A Preliminary Study
K200 and K400 represent treatments with Keluak extract at concentration of 200 and 400 ppm
respectively
000
100
200
300
400
500
600
0 5 10 15 20
TBA
RS
(mg
MD
Ak
g m
eat
)
Storage time (days)
Control
BHT 002
K200
K400
0000
0050
0100
0150
0200
0250
0300
0350
0400
0450
0 1 2 3 4 5 6 7 8
Co
nju
gate
d D
ien
es
(nm
ol
mg
me
at)
Days
Control
BHT
K200
K400
49
Figure 42b Conjugated dienes values of different antioxidant treatments over storage at
2˚C- Extended Storage Time
K200 and K400 represent treatments with Keluak extract at concentration of 200 and 400 ppm respectively
Figure 43 Peroxide Value (meq kg meat) of Different Antioxidant treatments over
Storage at 2˚C
K200 and K400 represent treatments with Keluak extract at concentration of 200 and 400 ppm
respectively
000
002
004
006
008
010
012
014
016
0 5 10 15 20
Co
nju
gate
d D
ien
es
(nm
ol
mg
me
at)
Storage (days)
Control
BHT 002
K200
K400
0
05
1
15
2
25
3
35
4
0 2 4 6 8 10 12 14 16
PV
(m
eq
kg
me
at)
Storage Time (Days)
Control
BHT 002
K200
K400
50
Figure 44 Intensity of Meaty Odor Descriptor in Cooked Ground Turkey Meat Treated
with Different Antioxidants Rated in a 15-cm Line Scale
K200 and K400 represent Treatment with Keluak extract at concentration of 200 and 400 ppm
respectively
Figure 45 Intensity of Rancid Odor Descriptor in Cooked Ground Turkey Meat Treated
with Different Antioxidants Rated in a 15-cm Line Scale
K200 and K400 represent Treatment with Keluak extract at concentrations of 200 and 400 ppm
respectively
000
200
400
600
800
1000
1200
0 2 4 6 8
15
cm
Lin
e s
cale
(av
era
ge)
Days
CONTROL
BHT
K200
K400
Linear (BHT)
-100
000
100
200
300
400
500
600
700
800
0 2 4 6 8
15
cm
Lin
e s
cale
(av
era
ge)
Days
Control
BHT
K200
K400
51
Figure 46 Intensity of Eggy Odor Descriptor in Cooked Ground Turkey Meat Treated
with Different Antioxidants Rated in a 15-cm Line Scale
K200 and K400 represent Treatment with Keluak extract at concentrations of 200 and 400 ppm
respectively
Figure 47 Intensity of Cardboard Odor Descriptor in Cooked Ground Turkey Meat
Treated with Different Antioxidants Rated in a 15-cm Line Scale
K200 and K400 represent Treatment with Keluak extract at concentrations of 200 and 400 ppm
respectively
000
100
200
300
400
500
600
700
800
900
1000
0 2 4 6 8
15
cm
Lin
e s
cale
(av
era
ge)
Days
Control
BHT
K200
K400
-1
0
1
2
3
4
5
6
7
0 2 4 6 8
15
cm
Lin
e s
cale
(av
era
ge)
Days
Control
BHT
K200
K400
52
Figure 48 Intensity of Fatty Odor Descriptor in Cooked Ground Turkey Meat Treated
with Different Antioxidants Rated in a 15-cm Line Scale
K200 and K400 represent Treatment with Keluak extract at concentrations of 200 and 400 ppm
respectively
000
100
200
300
400
500
600
700
800
900
0 2 4 6 8
15
cm
Lin
e s
cale
(av
era
ge)
Days
Control
BHT
K200
K400
53
48 Tables
Table 41a TBARS Value of Cooked Ground Turkey Meat Treated with Various Antioxidants during Storage at 2˚C- A Preliminary Study
TBARS (mg MDAkg meat) Average
Storage (Day) Control BHT 002 Keluak 200ppm Keluak 400ppm
0
131plusmn009Aa 094plusmn021Ba 050plusmn004Ca 037plusmn010Ca
1
189plusmn003Aab 161plusmn025Aab 080plusmn006Ba 057plusmn026Bab
3
243plusmn010Ac 236plusmn025Abc 111plusmn022Bab 055plusmn008Cab
5
397plusmn016Ad 319plusmn064Acd 170plusmn025Bbc 108plusmn023Bb
7
473plusmn076Ad 373plusmn074ABd 217plusmn040ACc 101plusmn044Cab
Different letters (A-D) within a row indicates that mean values are significantly different (Plt 005) Different letters within a column (a-d) within the same treatment are significantly different (Plt005)
Table 41b TBARS Value of Cooked Ground Turkey Meat Treated with Various Antioxidants during Storage at 2 ˚C- Extended Storage Time
TBARS (mg MDAkg meat) Average
Storage (day) Control BHT 002 K200 K400
0 129 plusmn 008Ae 091plusmn 004Bcd 065plusmn 015Be 101plusmn 003Cf
1 159plusmn 008Ade 076plusmn 005Cd 083plusmn 012Ce 127plusmn 006Bf
3 220plusmn 011Acd 074plusmn 004Dd 119plusmn 003Cd 160plusmn 004Be
5 258plusmn 014Ac 082plusmn 006Cd 076plusmn 014Ce 150plusmn 004Bd
7 377plusmn 001Ab 109plusmn 002Ccb 158plusmn 006Bc 160plusmn 006Bd
10 405plusmn 061Aab 121plusmn 009Bb 197plusmn 012Bb 195plusmn 009Bc
13 465plusmn 014Aa 151plusmn 004Ca 224plusmn 003Bab 218plusmn 003Bb
15 459plusmn 024Aa 154plusmn 013Da 231plusmn 014Ca 284plusmn 010Ba
Different letters (A-D) within a row indicates that mean values are significantly different (Plt 005) Different letters within a column (a-f) within the same treatment are significantly different (Plt005)
K200 and K400 represent treatments with Keluak extract at concentration of 200 and 400 ppm
respectively
54
Table 42a Conjugated Dienes Concentrations with Antioxidant Treatments and Storage
At 2˚C- A Preliminary Study
Conj Dienes (nmolemg meat)
Storage (Days) Control BHT 002 K200 K400
0 015plusmn003Abc 022plusmn001Aa 013plusmn001Ab 020plusmn008Aa
1 012plusmn001Abc 012plusmn003Ab 011plusmn001Ab 019plusmn001Bab
3 006plusmn000Ac 003plusmn002Ac 002plusmn002Ab 004plusmn002Ab
5 038plusmn000Aa 024plusmn001Ba 027plusmn007ABa 021plusmn001Ba
7 023plusmn008Ab 026plusmn001Aa 029plusmn003Aa 016plusmn001Aab
Different letters (A-C) within a row indicates that mean values are significantly different (Plt 005) Different letters within a column (a-d) within the same treatment are significantly different (Plt005)
K200 and K400 represent treatments with Keluak extract at concentration of 200 and 400 ppm
respectively
Table 42b Conjugated Dienes Concentrations After Antioxidant Treatments and
Storage At 2˚C- Extended Storage Time
Conjugated Dienes (nM mg meat)
Storage (Days) Control BHT 002 K200 K400
0 013plusmn 001Aab 009plusmn000Bab 010plusmn 000Ba 010plusmn 001Ba
1 008plusmn 001Ac 008plusmn 001Ab 008plusmn 000Abc 007plusmn 001Ab
3 011plusmn 000Ab 009plusmn 001Bab 008plusmn 000Bbc 006plusmn 000Cb
5 012plusmn001Ab 008plusmn 001B b 006plusmn 000Bd 006plusmn 000Bb
7 011plusmn001Abc 008plusmn 000B ab 006plusmn 001Bcd 007plusmn 000Bb
10 014plusmn 000Aa 009plusmn 000Bab 009plusmn 001Bab 007plusmn 000Cb
13 014plusmn 001Aa 009plusmn 000Bab 008plusmn 000Bbc 006plusmn 000Cb
15 014plusmn 000Aa 010plusmn 001Ba 008plusmn 001BCbcd 007plusmn 000Cb
Different letters (A-C) within a row indicates that mean values are significantly different (Plt 005) Different letters within a column (a-d) within the same treatment are significantly different (Plt005)
K200 and K400 represent treatments with Keluak extract at concentration of 200 and 400 ppm
respectively
55
Table 43 Peroxide Value (meq kg meat) of Different Antioxidant treatments during
Storage of cooked ground turkey meat at 2˚C
PV (meq kg meat)
Storage (Days) Control BHT 002 K200 K400
0 110plusmn 042Abc 070plusmn 014Ae 080plusmn 028Ad 130plusmn 014Acd
1 230plusmn 014Aab 130plusmn 014Bd 090plusmn 014BCd 070plusmn 014Cd
3 080plusmn 000Ac 070plusmn 014Ae 070plusmn 014Ad 070plusmn 014Ad
5 280plusmn 028Aa 140plusmn 000Bcd 110plusmn 014Bcd 080plusmn 028Bd
7 170plusmn 042Aabc 190plusmn 014Ac 195plusmn 021Abc 225plusmn 049Abc
10 310plusmn 042Aa 330plusmn 014Aa 290plusmn 042Aa 340plusmn 028Aa
13 255plusmn 007Aa 265plusmn 021Ab 240plusmn 028Aab 260plusmn 028Aab
15 255plusmn 064Aa 150plusmn 014ABcd 086plusmn 006Bd 100plusmn 028Bd
Different letters (A-C) within a row indicates that mean values are significantly different (Plt 005) Different letters within a column (a-e) within the same treatment are significantly different (Plt005)
K200 and K400 represent Treatment with Keluak extract at concentrations of 200 and 400 ppm
respectively
Table 44 Intensity of Meaty Odor Descriptor in Cooked Ground Turkey Meat Treated with Different Antioxidants Rated in a 15-cm Line Scale
Storage (Day) Control BHT 002 K200 K400
0 595plusmn250Aa 727plusmn144Aa 632plusmn202Aa 606plusmn189Aa
1 783plusmn208Aa 731plusmn174ABa 543plusmn220Ba 542plusmn294Ba
3 613plusmn201Aa 693plusmn143Aa 502plusmn266Aa 552plusmn228Aa
5 734plusmn277Aa 710plusmn290Aa 474plusmn253Aa 487plusmn263Aa
7 694plusmn296Aa 751plusmn265Aa 532plusmn259Aa 543plusmn236Aa
Different letters (A-C) within a row indicates that mean values are significantly different (Plt 005) Different letters within a column (a-b) within the same treatment are significantly different (Plt005)
K200 and K400 represent Treatment with Keluak extract at concentrations of 200 and 400 ppm
respectively
56
Table 45 Intensity of Rancid Odor Descriptor in Cooked Ground Turkey Meat Treated
with Different Antioxidants Rated in a 15-cm Line Scale
Storage (Day) Control BHT 002 K200 K400
0 228plusmn194Aa 193plusmn175Aa 334plusmn231Aa 350plusmn274Aa
1 177plusmn194Aa 172plusmn163Aa 392plusmn274ABa 426plusmn265Ba
3 260plusmn210Aa 272plusmn265Aa 419plusmn306Aa 337plusmn247Aa
5 344plusmn255Aa 329plusmn215Aa 427plusmn248Aa 395plusmn253Aa
7 408plusmn300Aa 289plusmn244Aa 448plusmn241Aa 385plusmn244Aa
Different letters (A-B) within a row indicates that mean values are significantly different (Plt 005) Different letters within a column (a-b) within the same treatment are significantly different (Plt005)
K200 and K400 represent Treatment with Keluak extract at concentrations of 200 and 400 ppm
respectively
Table 46 Intensity of Eggy Odor Descriptor in Cooked Ground Turkey Meat
Treated with Different Antioxidants Rated in a 15-cm Line Scale
Storage (Day) Control BHT 002 K200 K400
0 643plusmn242Aa 513plusmn244Aa 502plusmn324Aa 565plusmn287Aa
1 597plusmn248Aab 476plusmn321Aa 599plusmn332Aa 584plusmn360Aa
3 345plusmn258Ab 400plusmn270Aa 515plusmn335Aa 509plusmn425Aa
5 364plusmn303Aab 424plusmn320Aa 475plusmn269Aa 469plusmn180Aa
7 473plusmn306Aab 364plusmn210Aa 485plusmn268Aa 431plusmn305Aa
Different letters (A-C) within a row indicates that mean values are significantly different (Plt 005) Different letters within a column (a-e) within the same treatment are significantly different (Plt005)
K200 and K400 represent Treatment with Keluak extract at concentrations of 200 and 400 ppm
respectively
57
Table 47 Intensity of Cardboard Odor Descriptor in Cooked Ground Turkey Meat
Treated with Different Antioxidants Rated in a 15-cm Line Scale
Storage (Day) Control BHT 002 K200 K400
0 299plusmn222Aa 209plusmn182Aa 261plusmn198Aa 312plusmn157Aa
1 262plusmn249Aa 180plusmn192Aa 339plusmn238Aa 342plusmn229Aa
3 299plusmn203Aa 284plusmn254Aa 388plusmn235Aa 287plusmn185Aa
5 252plusmn243Aa 290plusmn190Aa 309plusmn193Aa 320plusmn204Aa
7 301plusmn210Aa 273plusmn253Aa 337plusmn195Aa 284plusmn205Aa
Different letters (A-C) within a row indicates that mean values are significantly different (Plt 005) Different letters within a column (a-e) within the same treatment are significantly different (Plt005)
K200 and K400 represent Treatment with Keluak extract at concentrations of 200 and 400 ppm
respectively
Table 48 Intensity of Fatty Odor Descriptor in Cooked Ground Turkey Meat Treated with Different Antioxidants Rated in a 15-cm Line Scale
Storage (Day) Control BHT 002 K200 K400
0 344plusmn226aA 350plusmn256aA 395plusmn309aA 395plusmn277aA
1 417plusmn285aA 389plusmn230aA 401plusmn345aA 438plusmn287aA
3 388plusmn220aA 378plusmn229aA 396plusmn328aA 403plusmn285aA
5 479plusmn252aA 461plusmn293aA 389plusmn255aA 428plusmn320aA
7 460plusmn288aA 492plusmn286aA 426plusmn281aA 428plusmn340aA
Different letters (A-C) within a row indicates that mean values are significantly different (Plt 005) Different letters within a column (a-e) within the same treatment are significantly different (Plt005)
K200 and K400 represent Treatment with Keluak extract at concentrations of 200 and 400 ppm
respectively
58
Table 49 pH Values of Cooked Ground Turkey Treated with Different
Antioxidants Stored at 2˚C
pH Value
Storage (Day) Control BHT 002 K200 K400
0 665plusmn 002Aab 644plusmn 003Bbc 646plusmn 004Bbc 658plusmn 003Aab
1 659plusmn 003Ab 643plusmn 003Cbc 651plusmn 001Babc 662plusmn 001Aab
3 645plusmn 003Bc 634plusmn 002Cd 643plusmn 004Bc 654plusmn 000Ab
5 663plusmn 002Aab 640plusmn 002Cc 645plusmn 004Cc 654plusmn 002Bb
7 647plusmn 001Ac 633plusmn 003Bc 648plusmn 004Aabc 646plusmn 006Ac
10 665plusmn 001Aab 646plusmn 002Dbc 654plusmn 001Cab 660plusmn 003Bab
13 665plusmn 002Aab 648plusmn 002Cab 655plusmn 002Ba 664plusmn 002Aa
15 668plusmn 001Aa 651plusmn 001Da 655plusmn 001Ca 663plusmn 001Ba
Different letters (A-D) within a row indicates that mean values are significantly different (Plt 005) Different letters within a column (a-c) within the same treatment are significantly different (Plt005)
K200 and K400 represent treatments with Keluak extract at concentrations of 200 and 400 ppm
respectively
59
49 References
1 Chye FY Sim KY Antioxidative and Antibacterial Activities of Pangium edule Seed Extracts International Journal of Pharmacology 2009 5 285-297
2 Kahkonen M Hopia A Vuorela H Rauha J Pihlaja K Kujala T Heinonen M Antioxidant activity of plant extracts containing phenolic compounds J Agric Food Chem 1999 47 3954-3962
3 Jayaprakasha G Selvi T Sakariah K Antibacterial and antioxidant activities of grape (Vitis vinifera) seed extracts Food Res Int 2003 36 117-122
4 Gray J Macdonald B Pearson A Morton I Role of Nitrite in Cured Meat Flavor - a Review J Food Prot 1981 44 302-amp
5 Juntachote T Berghofer E Siebenhandl S Bauer F The antioxidative properties of Holy basil and Galangal in cooked ground pork Meat Sci 2006 72 446-456
6 Teets AS Were LM Inhibition of lipid oxidation in refrigerated and frozen salted raw minced chicken breasts with electron beam irradiated almond skin powder Meat Sci 2008 80 1326-1332
7 Han D McMillin K Godber J Bidner T Younathan M Marshall D Hart L Iron Distribution in Heated Beef and Chicken Muscles J Food Sci 1993 58 697-700
8 Ahn D Wolfe F Sim J Prevention of Lipid Oxidation in Precooked Turkey Meat Patties with Hot Packaging and Antioxidant Combinations J Food Sci 1993 58 283-287
9 Asghar A Gray J Buckley D Pearson A Booren A Perspectives on Warmed-Over Flavor Food Technol 1988 42 102-108
10 Kingston E Monahan F Buckley D Lynch P Lipid oxidation in cooked pork as affected by vitamin E cooking and storage conditions J Food Sci 1998 63 386-389
11 Kulas E Ackman R Different tocopherols and the relationship between two methods for determination of primary oxidation products in fish oil J Agric Food Chem 2001 49 1724-1729
12 Srinivasan S Xiong Y Decker E Inhibition of protein and lipid oxidation in beef heart surimi-like material by antioxidants and combinations of pH NaCl and buffer type in the washing media J Agric Food Chem 1996 44 119-125
13 Lee M Choi J Choi Y Han D Kim H Shim S Chung H Kim C The antioxidative properties of mustard leaf (Brassica juncea) kimchi extracts on
60
refrigerated raw ground pork meat against lipid oxidation Meat Sci 2010 84 498-504
14 Fardiaz D Romlah S Antioxidant Activity of Picung (Pangium edule
Reinw) Seed In Development of Food Science and Technology in ASEAN
Proceedings of the 4th ASEAN Food Conference Feb 17-21 1992 ASEAN
Jakarta Indonesia 1992
15 Frankel E N Lipid oxidation Dundee Scotland The Oily Press Ltd 1998 Vol 10 pp 13ndash41 16 Ma Amy A Peranakan favorite is ayam buah keluak Chicken stewed with black nuts at True Blue Restaurant Wall Street Journal (Online) New York NY Dec 16 2010 Retrieved July 20 2011 from httpproquestumicompqdwebdid=2214039511ampsid=1ampFmt=3ampclientId=36305ampRQT=309ampVName=PQD
17 Esteacutevez M Morcuende D and Ventanas S Determination of Oxidation
Nollet Leo M LToldraacute Fidel (Eds) Handbook of Muscle Foods Analysis Boca
Raton CRC Press 2009 221-240
18 Grau A Codony R Rafecas M Barroeta A Guardiola F Lipid
hydroperoxide determination in dark chicken meat through a ferrous oxidation-
xylenol orange method J Agric Food Chem 2000 48 4136-4143
19 Shahidi F Janitha P Wanasundara P Phenolic Antioxidants Crit Rev Food Sci Nutr 1992 32 67-103
20 Ruth SM Techniques for sampling and identification of volatile compounds contributing to sensory perception In Nollet Leo M LToldraacute Fidel (Eds) Handbook of Muscle Foods Analysis Boca Raton CRC Press 2009 503-523
21 Bou R Guardiola F Grau A Grimpa S Manich A Barroeta A Codony R Influence of dietary fat source alpha-tocopherol and ascorbic acid supplementation on sensory quality of dark chicken meat Poult Sci 2001 80 800-807
22 Gray J I and A M Pearson Rancidity and warmed over flavour In Pearson A M and Dutson T R (Eds) Advances in Meat Research Vol 3 Nostrand-Reinbold Co New York NY 1987 221ndash269 23 OrsquoNeill L M K Galvin P A Morrissey and D J Buckley Comparison of effects of dietary olive oil tallow and vitamin E on the quality of broiler meat and meat products Br Poult Sci 1998 39 365ndash371
61
Chapter 5 CONCLUSION AND FUTURE WORK
The results of the present study indicated that the Keluak extract
incorporated into cooked ground turkey can reduce lipid oxidation The addition
of Keluak extracts at 200 and 400 ppm had a positive effect on reducing the
TBAR values and the conjugated dienes content compared to the control without
added AOs during storage at 2˚C for 15 days The Keluak extract used in this
study was comparable to BHT (002) in reducing lipid oxidation in meat
Peroxide value analysis did not differentiate between the control and the
treatments on the extent of lipid oxidation Due to confusion of the odor
components in the Keluak extracts by the panelists there were no significant
differences between the treatments in the odor sensory evaluation
Keluak seed is a culinary spice with no known toxic effect Its moderate
pungent aroma makes it valued as a traditional ethnic food flavorant in parts of
South East Asia With its substantial phenolic content and antioxidant properties
it could be an effective source of natural antioxidants However the application
of this natural antioxidant might be limited in Western cultures due to its effect
on the color and odor of meat products Further investigations are needed to
identify selective extraction and clean-up techniques that could be used to
eliminate the color and odor problem Other chemical analysis methods that
might provide better information on the extent of oxidation in meat products
include the p-anisidine value Food Oil Sensor (FOS) and Gas chromatography
techniques (GC analysis) of selected volatiles
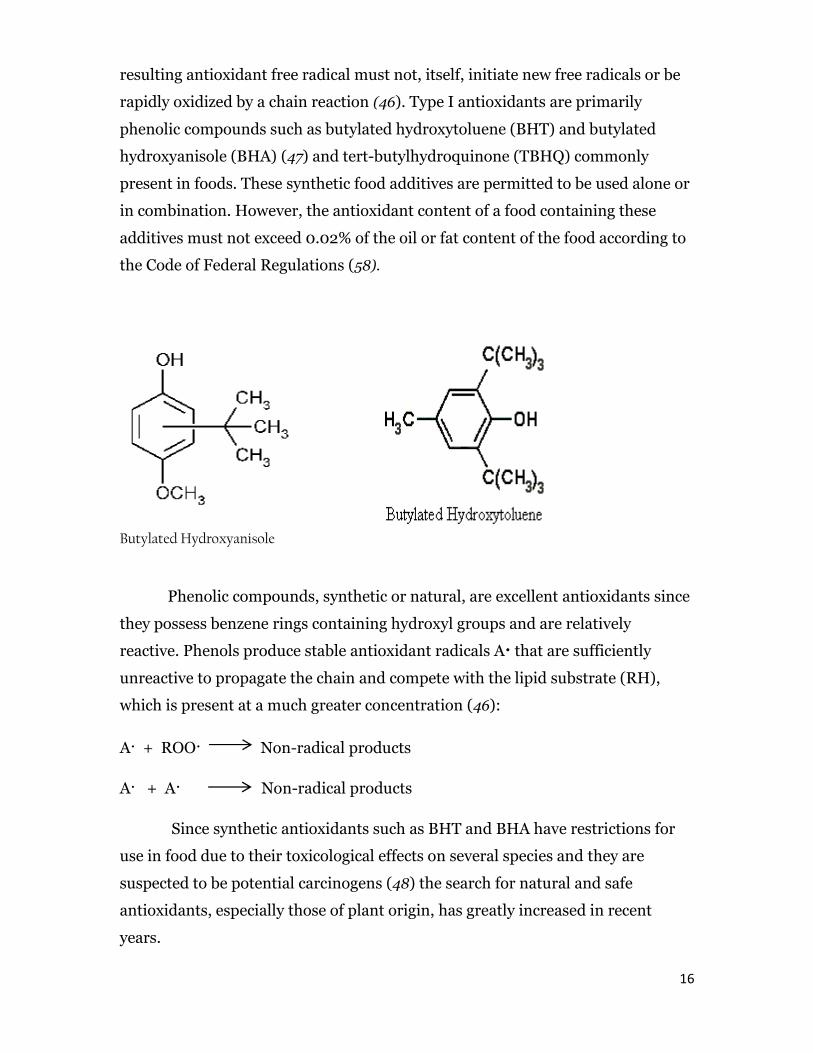
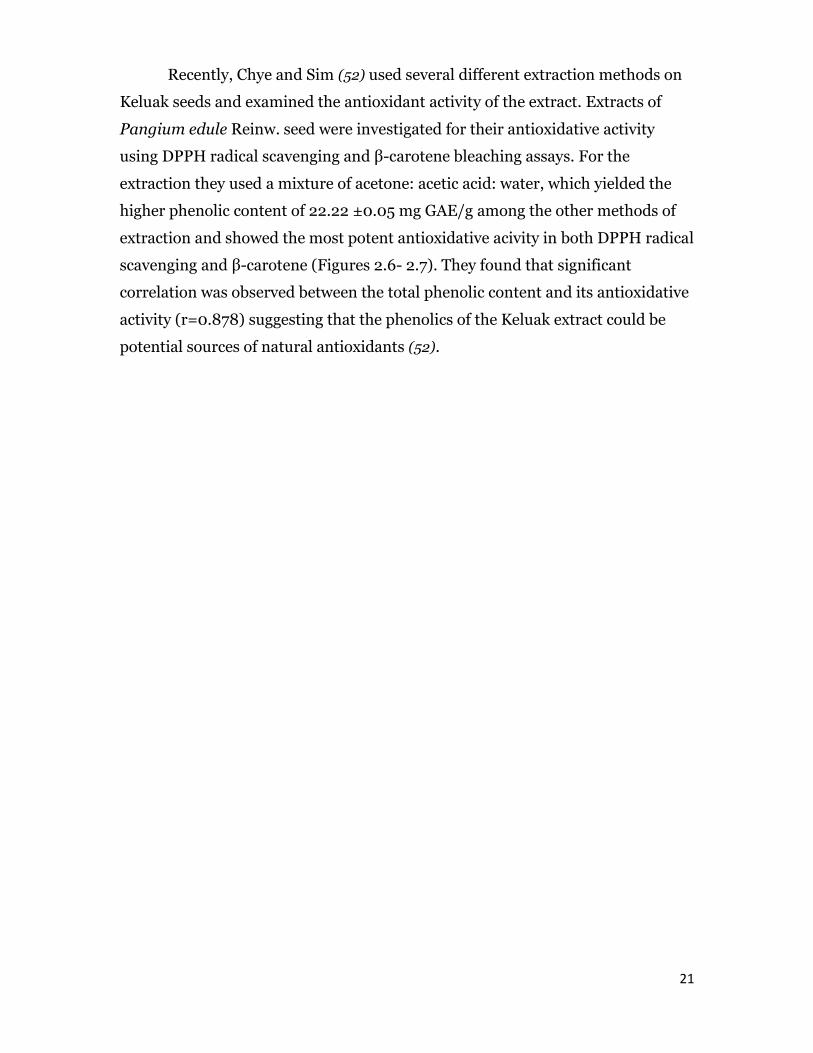
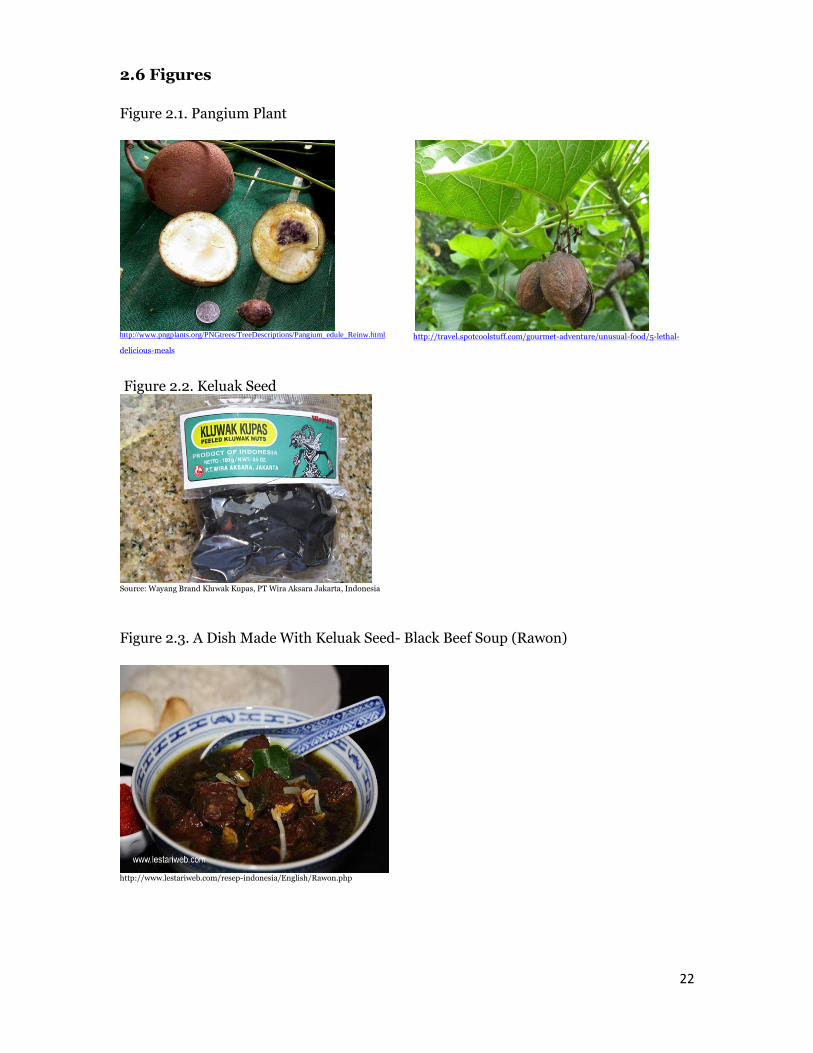
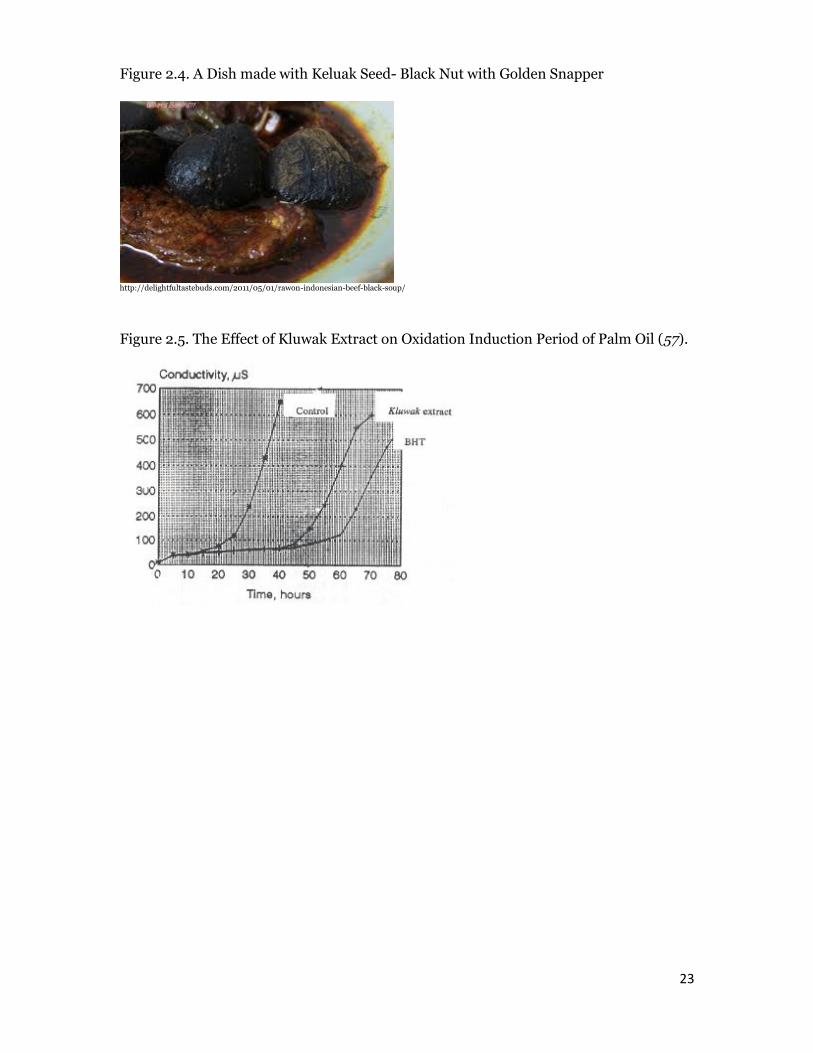
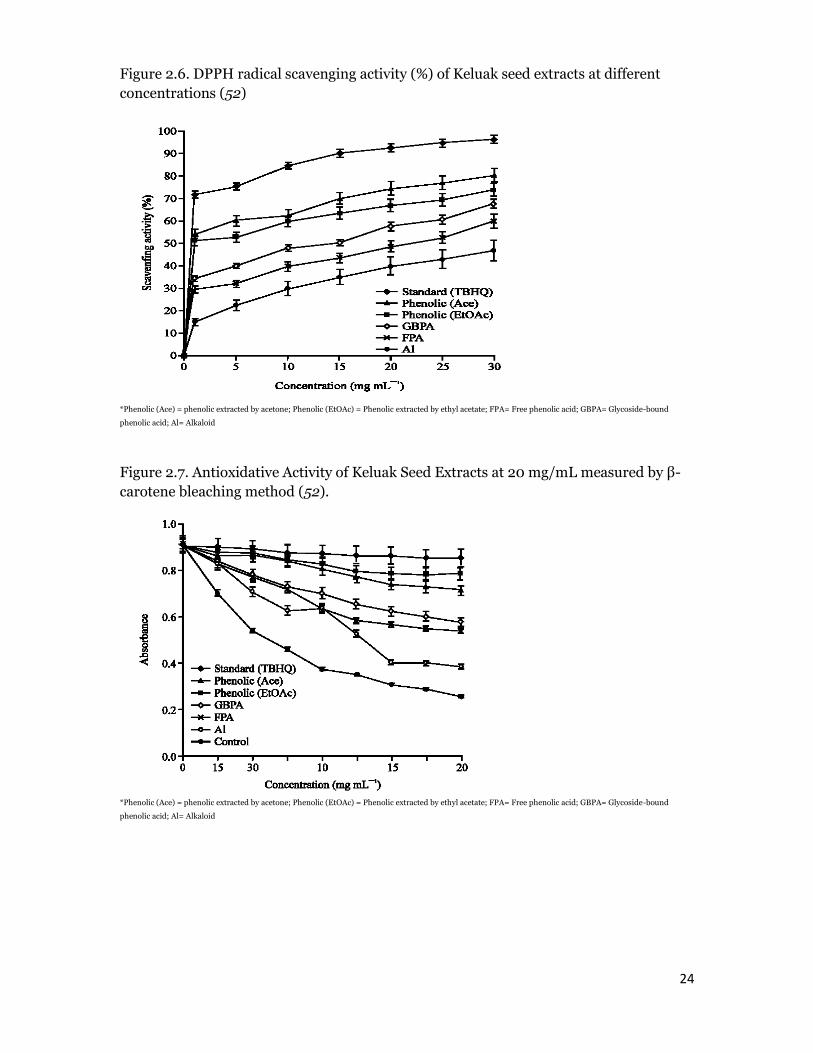
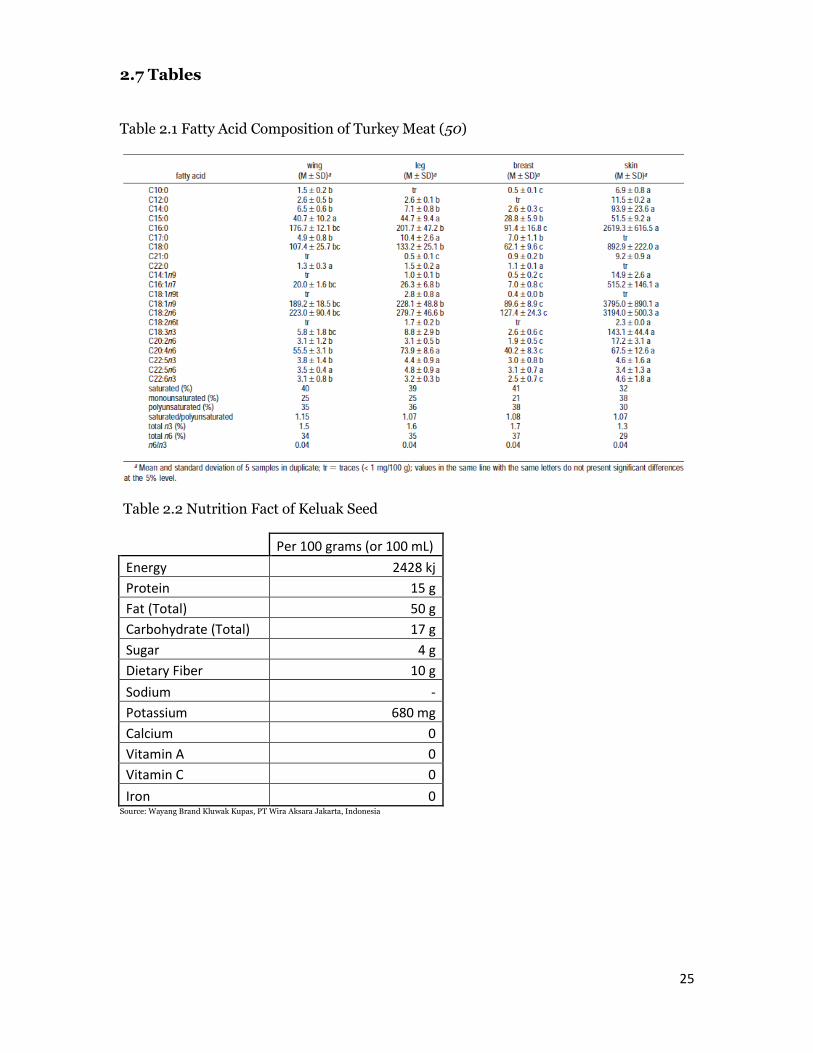
25
27 Tables
Table 21 Fatty Acid Composition of Turkey Meat (50)
Table 22 Nutrition Fact of Keluak Seed
Per 100 grams (or 100 mL)
Energy 2428 kj
Protein 15 g
Fat (Total) 50 g
Carbohydrate (Total) 17 g
Sugar 4 g
Dietary Fiber 10 g
Sodium -
Potassium 680 mg
Calcium 0
Vitamin A 0
Vitamin C 0
Iron 0 Source Wayang Brand Kluwak Kupas PT Wira Aksara Jakarta Indonesia
26
Table 23 Anti- Nutritional Factors of Pangium Seed (55)
Anti- Nutritional Factors Dry wt Basis (microgg)
Arsenic NA
Cyanide 1834
Lead 18
Phytic acid NA
Tannin 046
Alkaloid NA
Table 24 The Antioxidative Activity of Kluwak Expressed as Protective Factor (57)
27
28 References
1 Kanner J Rosenthal I An Assessment of Lipid Oxidation in Foods - Technical Report Pure and Applied Chemistry 1992 64 1959-1964
2 Skibsted LH Understanding oxidation processes in foods Woodhead Publ Food Sci Technol Nutr 2011 199 3-35
3 Yu L Scanlin L Wilson J Schmidt G Rosemary extracts as inhibitors of lipid oxidation and color change in cooked turkey products during refrigerated storage J Food Sci 2002 67 582-585
4 Rhee K Anderson L Sams A Lipid oxidation potential of beef chicken and pork J Food Sci 1996 61 8-12
5 Hernandez P Navarro J Toldra F Lipid composition and lipolytic enzyme activities in porcine skeletal muscles with different oxidative pattern Meat Sci 1998 49 1-10
6 Karakok SG Ozogul Y Saler M Ozogul F Proximate Analysis Fatty Acid Profiles and Mineral Contents of Meats a Comparative Study Journal of Muscle Foods 2010 21 210-223
7 Chan K Decker E Endogenous Skeletal-Muscle Antioxidants Crit Rev Food Sci Nutr 1994 34 403-426
8 Decker E Xu Z Minimizing rancidity in muscle foods Food Technol 1998 52 54-59
9 Rojas MC Brewer MS Effect of natural antioxidants on oxidative stability of cooked refrigerated beef and pork J Food Sci 2007 72 S282-S288
10 Gray J Macdonald B Pearson A Morton I Role of Nitrite in Cured Meat Flavor - a Review J Food Prot 1981 44 302-8
11 Brewer M Vega J Detectable Odor Thresholds of Selected Lipid Oxidation Compounds in a Meat Model System J Food Sci 1995 60 592-595
12 St Angelo A Crippen K Dupuy H James C Chemical and Sensory Studies of Antioxidant-Treated Beef J Food Sci 1990 55 1501-1508
13 Buckley D Gray J Asghar A Price J Crackel R Booren A Pearson A Miller E Effects of Dietary Antioxidants and Oxidized Oil on Membranal Lipid Stability and Pork Product Quality J Food Sci 1989 54 1193-1197
14 Guntensperger B Escher F Oxidative Changes of Heat-Sterilized Meat in Trays J Food Sci 1994 59 689-692
28
15 Bauernfeind JC Antioxidant function of L-ascorbic acid in food technology International journal for vitamin and nutrition researchSupplement = Internationale Zeitschrift fur Vitamin- und ErnahrungsforschungSupplement 1985 27 307-333
16 Georgantelis D Blekas G Katikou P Ambrosiadis I Fletouris DJ Effect of rosemary extract chitosan and alpha-tocopherol on lipid oxidation and colour stability during frozen storage of beef burgers Meat Sci 2007 75 256-264
17 Botsoglou NA Govaris A Giannenas I Botsoglou E Papageorgiou G The incorporation of dehydrated rosemary leaves in the rations of turkeys and their impact on the oxidative stability of the produced raw and cooked meat Int J Food Sci Nutr 2007 58 312-320
18 Karpinska-Tymoszczyk M Effect of the addition of ground rosemary on the quality and shelf-life of turkey meatballs during refrigerated storage Br Poult Sci 2008 49 742-750
19 Drumm T Spanier A Changes in the Content of Lipid Autoxidation and Sulfur-Containing-Compounds in Cooked Beef during Storage J Agric Food Chem 1991 39 336-343
20 Folch J Lees M Stanley GHS A Simple Method For The Isolation And Purification Of Total Lipides From Animal Tissues Journal of Biological Chemistry 1957 226 497-509
21 Grau A Codony R Rafecas M Barroeta A Guardiola F Lipid hydroperoxide determination in dark chicken meat through a ferrous oxidation-xylenol orange method J Agric Food Chem 2000 48 4136-4143
22 Dobarganes M Velasco J Analysis of lipid hydroperoxides European Journal of Lipid Science and Technology 2002 104 420-428
23 Juntachote T Berghofer E Siebenhandl S Bauer F The antioxidative properties of Holy basil and Galangal in cooked ground pork Meat Sci 2006 72 446-456
24 Lee M Choi J Choi Y Han D Kim H Shim S Chung H Kim C The antioxidative properties of mustard leaf (Brassica juncea) kimchi extracts on refrigerated raw ground pork meat against lipid oxidation Meat Sci 2010 84 498-504
25 Botsoglou N and Botsoglou E Oxidation in Foods and Beverages and Antioxidant Applications Vol 2 Management in Different Industry Sectors In Decker EA Elias RJ and McClements D J (eds) Oxidation in Foods and Beverages and Antioxidant Applications Vol 2 Management in Different Industry Sectors 2010 200 1-528
29
26 National Chicken Council Per Capita Consumption of Poultry Livestock 1965 to Estimated 2012 in Pounds 2012 Retrieved in January 23 2012 from httpwwwnationalchickencouncilorgabout-the-industrystatisticsper-capita-consumption-of-poultry-and-livestock-1965-to-estimated-2012-in-pounds
27 Bilgili SF Poultry meat processing and marketing- what does the future hold Poult Internat 2002 12-22
28 Nolan N L Bowers J A and Kropf D H Lipid Oxidation and Sensory Analysis of Cooked Pork and Turkey Stored under Modified Atmospheres Journal of Food Science 1989 54 846ndash849
29 Esteacutevez M Morcuende D and Ventanas S Determination of Oxidation Nollet Leo M LToldraacute Fidel (Eds) Handbook of Muscle Foods Analysis Boca Raton CRC Press 2009 221-240
30 Frankel E N Lipid oxidation Prog Lipid Res 1980 19 1ndash22
31 Frankel E N Volatile Lipid Oxidation Products Progress in lipid research 1983 221 1-33
32 Hsieh R J and J E Kinsella Oxidation of Polyunsaturated Fatty Acids Mechanisms Products and Inhibition with Emphasis on Fish Advances in Food and Nutrition Research 1989 Vol 33
33 McMillin K W Initiation of oxidative processes in muscle foods Annual Proceedings of the Reciprocal Meat Conference Am Meat Sci Assoc Chicago IL 1997 49th 53ndash64
34 Monahan FJ Oxidation of lipids in muscle foods fundamental and applied concerns In EA Decker C Faustman and CJ Lopez-Bote (Eds) Antioxidants in Muscle Foods Nutritional Strategies to Improve Quality New York John Wiley and Sons Inc 2000
35 Robinson M E Haemoglobin and methaemoglobin as oxidative catalysts Biochemical Journal 1924 18 255-264
36 Jadhav SJ Nimbalkar SS Kulkarni AD and MadhaviDL Lipid oxidation in biological and food systems In Marcel Dekker (Eds) Food Antioxidants Technological Toxicological and Health Perspectives New York 1996
37 Niki E Antioxidants and relation to lipid oxidation Chemistry and physics of lipids 1987 44 227-300
38 Gray J I and Monahan FJ Measurement of lipid oxidation in meat and meat products Trends Food Sci Technol 1992 3 315-9
30
39 Chang S S and Peterson R J The Basis of Quality in Muscle Foods Recent Developments In The Flavor of Meat Journal of Food Science 1977 42 298ndash305
40 Lea C H Methods for determining peroxide in lipids J Sci Food Agric 1952 3 586ndash594
41 White P J Conjugated diene anisidine value and carbonyl value analysis In Warner K and Eskin N A M (Eds) Methods to Access Quality and Stability of Oils and Fat-Containing Foods Champaign IL AOCS Publishing 1995 159-177
42 Coxon D Measurement of lipid oxidation Food Science and Technology Today 1987 1164-6
43 Warner K Sensory evaluation of oils and fat-containing foods In K Warner and N A M Eskin (Eds) Methods to Access Quality and Stability of Oils and Fat-Containing Foods AOCS Publishing 1995 49
44 AMSA Research Guidelines for cookery sensory evaluation and instrumental tenderness measurements of fresh meat American Meat Science Association-National Live Stock and Meat Board 1995
45 Association of Official Analytical Chemists Official methods of analysis (16th ed) Washington DC Association of Official Analytical Chemists 1995
46 Labuza T P and Dugan L R Kinetics of lipid oxidation in foods C R C Critical Reviews in Food Technology 1971 2 3
47 Gordon MF The mechanism of antioxidant action in vitro In Hudson BJF (Ed) Food Antioxidants London Elsevier Applied Science 1990 1-18
48 Shahidi F Janitha P Wanasundara P Phenolic Antioxidants Crit Rev Food Sci Nutr 1992 32 67-103
49 Roozen JP Effects of types I II and III antioxidants on phospholipid oxidation in a meat model for warmed over flavour Food Chem 1987 24 167-185
50 Pokornyacute J Natural antioxidants for food use Trends in Food Science and Technology 1991 2 223-227
51 Wong W H Buah Keluak National Parks 11 Jan 2007 Retrieved 02 July 2012 from httpenwikipediaorgwikiPangium_edule
52 Chye FY Sim KY Antioxidative and Antibacterial Activities of Pangium edule Seed Extracts International Journal of Pharmacology 2009 5 285-297
31
53 Andarwulan N Fardiaz D Wattimena GA Shetty K Antioxidant activity associated with lipid and phenolic mobilization during seed germination of Pangium edule Reinw J Agric Food Chem 1999 47 3158-3163
54 Andarwulan N Fardiaz S Apriyantono A Hariyadi P Shetty K Mobilization of primary metabolites and phenolics during natural fermentation in seeds of Pangium edule Reinw Process Biochemistry 1999 35 197-204
55 Abdullah Moh A B Phyochemical Composition of Fresh and Cooked of Chesnut (Castanopsis argentea) Pangium (Pangium edule) and Pra (Elateriospermum tapos) Seeds Final Year Project Food Science and Technology in the Faculty of Applied Sciences Universiti Teknologi Mara Malaysia January 2012 Retrieved on July 4 2012 from httpeprintsptaruitmedumy49401MOHD_ASRUL_BIN_ABDULLAH_12_24pdf
56 Ma A A Peranakan favorite is ayam buah keluak Chicken stewed with black nuts at True Blue RestaurantWall Street Journal (Online) New York NY Dec 16 2010 Retrieved July 4 2012 from httpproquestumicompqdwebdid=2214039511ampsid=1ampFmt=3ampclientId=36305ampRQT=309ampVName=PQD
57 Fardiaz D Romlah S Antioxidant activity of picung (Pangium edule Reinw) seed In Development of Food Science and Technology in ASEAN Proceedings of the Fourth ASEAN Food Conference February 17ndash21 1992 ASEAN Jakarta Indonesia 1992 814ndash819
58 Food and Drugs Administration Food Additives Permitted for Direct Addition to Food for Human Consumption Code of Federal Regulations Title 21 pt 172190 2006
59 Kerler J Grosch W Character impact odorants of boiled chicken changes during refrigerated storage and reheating Zeitschrift Fur Lebensmittel-Untersuchung Und-Forschung A-Food Research and Technology 1997 205 232-238
60 Baggio S Vicente E Bragagnolo N Cholesterol oxides cholesterol total lipid and fatty acid composition in turkey meat J Agric Food Chem 2002 50 5981-5986
32
CHAPTER 3 MATERIALS AND METHODS
31 Keluak Antioxidant and Chemicals
Keluak (Kupas Wayang Brandreg Peeled Keluak Nuts PT Wira Aksara
Jakarta Indonesia was manufactured for Empire International East Chief
Privado Ontario CA 91761) Butylated hydroxytoluene (BHT) gallic acid (ACS
reagent) and 2-thiobarbituric acid were obtained from Sigma Chemical
Company St Louis MO USA Sodium chloride (crystal ARreg ACS) was obtained
from Mallinckrodt Baker Inc (Phillipsburg NJ USA)
The reagents used included acetone (Certified ACS) and chloroform (certified
ACS) obtained from Fisher Scientific Fair Lawn NJ USA Acetic acid (Glacial
ACS reagent) was purchased from J T Baker (Center Valley PA 18034 USA)
and Folin Ciocalteursquos phenol reagent (2 N) was purchased from Sigma-Aldrich
(St Louis MO USA)
311 Phenolic Extraction
Keluak seeds were ground into fine pieces using a coffee grinder (Braun
Inc Lynnfield MA USA) The fatty material from the ground seed was removed
first using a method modified from Wettasinghe and Shahidi (1) The ground seed
was washed with n-hexane (16 gg) and placed in a sonicator for 15 minutes
with occasional stirring The mixture was vortexed for 30 secs before it was
centrifuged at 2688 x g for 10 minutes (Sorvallreg Instrument RC-5B Du Pont
Company Wilmington DE USA) The upper fat-soluble layer was discarded
The solid was washed 2 ndash 3 additional times The solids remained at the bottom
after washing The defatted solids were then air-dried overnight under the hood
to remove any solvent residue
Forty grams of dried defatted Keluak seeds were extracted by stirring with
200 mL of solvent (acetone water acetic acid 90 95 05 vvv) at 60degC and
600 rpm for 2 hrs The mixture was then filtered through filter paper (Whatman
1 Buckinghamshire UK) The filtrate was collected and dried at 45degC using a
rotary evaporator until no further weight changes occurred The concentrated
extract was further dried using a vacuum oven at 45degC overnight The extract was
33
collected dissolved in 100 ethanol flushed with Argon gas and stored at -20degC
until further use
312 Total Phenolics content
The total phenolic content was measured using the Folin-Ciocalteu assay
as modified by Waterhouse (13) The phenolic extract was diluted with 100
ethanol to make several dilutions (1100 2100 and 10100) One milliliter of each
dilution was added to a test tube containing 5 mL of deionized water Then 05
mL of 50 Folin-Ciocalteu reagent was added to the test tube The solution was
mixed and allowed to stand for 8 mins at 22degC before adding 1 mL of 5 sodium
carbonate (wv) The mixture was vortexed using a touch mixer (model 231
Fisher Scientific Pittsburgh PA USA) and incubated in the dark for 1 hr The
solution was vortexed a second time before reading the absorption with a UV-
spectrophotometer (Spectronic Genesys 5 spectrophotometer Thermo Electron
Corporation Madison WI USA) at 725 nm against DI water A standard curve
was prepared at the same time with gallic acid at concentrations ranging from 0
to 100 mgL The quantity of total phenolic content in the sample was calculated
as gallic acid equivalents (GAE) from the standard curve using the formula
C = c times (V divide m) where
C is total phenolic content (mg GAEg extract)
c is the concentration of gallic acid obtained from the calibration curve (mgmL)
V is volume of sample (mL)
m is mass of the sample extract (g)
32 Sample Preparation
Ground turkey meat (15 fat Jennie-O Turkey Store Wilmar MN USA)
purchased from a local grocery store at day 0 and was immediately divided into 4
treatments according to the formulation (Table 31) (2 3)
(1) Control- No antioxidant
(2) Commercial antioxidant- 002 BHT (ww of lipid)
(3) Natural antioxidant- 002 Keluak extract (ww of lipid)
34
(4) Natural antioxidant ndash 004 Keluak extract (ww of lipid)
The level of Keluak extract antioxidant used was based on the amount of
fat in each formula Salt was dissolved in water prior to addition to the meat The
water addition was 5 of the ground meat (ww) The antioxidant and salt were
mixed in the liquid first before adding it to the meat by sprinkling while mixing
After the antioxidant salt and liquid addition mixing by hand (wearing gloves)
was continued for 5 mins The meat mixture was prepared into patties of uniform
size (using a cookie cutter diameter= 55 cm thickness= 15 cm) The patties
were cooked in an electrical skillet and temperature was monitored by Digi-
Sensereg Scanning Thermometer (Model 92000-00 Cole Parmer Instrument Co
Barrington IL) using copper-constantin thermocouple wires (Type T Omega
Engineering Inc Stamford CT) to an endpoint temperature of 74degC The cooked
patties were cooled and placed in a single layer on a tray and then overwrapped
in commercial PVC (water vapor transmission rate=15 g100 m224 h oxygen
transmission rate 880 cm3m224 h) and aluminum foil over the wrap The
patties were stored at 2degC in the dark and were assayed for the extent of oxidation
by odor sensory TBARS conjugated dienes and peroxide value analysis at days
0 1 3 5 7 for the first study (2)
In a second separate study a longer storage time study was completed to
examine the effect of antioxidants on the cooked ground turkey over a longer
time period The same procedure for antioxidant addition and meat sample
preparation was used However in the second study the samples were stored for
a total of 15 days (5 6) Samples were collected at days 0 1 3 5 7 10 13 15 for
TBARS conjugated dienes peroxide values and pH determinations
33 Thiobarbituric Acid Reactive Substances (TBARS)
Lipid oxidation was assessed by the 2-thiobarbituric acid (TBA) method of
Tarladgis and others (4) and Yu et al (5) Briefly 10 g of meat was homogenized
with 50 mL of deionized water using a homogenizer (IKAreg T25 digital Ultra-
Turrax Wilmington NC USA) The homogenate was filtered through 1
Whatman paper Five mL of the clear filtrate was mixed with 5 mL TBA reagent
35
containing 002 M TBA in 90 glacial acetic acid The mixture was capped
vortexed for 30 secs and incubated in the dark for 15-18 hrs at room temperature
After the color developed the mixture was measured for absorbance at 532 nm
against a blank (deionized water) The absorbance was converted to TBAR values
using 1133- tetraethoxypropane to prepare a standard curve Triplicates of 10 g
samples were prepared for each treatment TBA value is expressed as mg MDA
kg meat
34 Conjugated Dienes
Conjugated dienes (CD) were determined by the method described by
Juntachote and others (6) with slight modifications A cooked meat sample (05
g) was suspended in 5 mL of deionized water and homogenized using a digital
Ultra-Turrax T25 (IKAreg Wilmington NC USA) to obtain a smooth slurry A 05
mL aliquot of this suspension was mixed with 5 mL of extracting solution
containing hexane and isopropanol (31 vv) and mixed for 1 min using a vortex
mixer After centrifugation at 2000 g for 5 mins the supernatant was collected
and the absorbance of the supernatant was determined at 233 nm The
concentration of conjugated dienes was calculated using a molar extinction
coefficient of 25200 M-1cm-1 and the result were expressed as nmole of
conjugated dienes per mg meat sample
35 Peroxide Value
The peroxide value was determined according to the AOAC method 96533
(Association of Official Analytical Chemists) (13) with a few modifications The
lipids from meat samples were extracted by the method of Kim et al (7) First 5 g
of meat sample was broken into small pieces and placed in a water bath at 60˚C
to melt the fat for 30 mins The meat was extracted with a solution containing
acetic acid chloroform (32) and then filtered with Whatman 1 filter paper A
saturated solution of potassium iodide (KI 05 mL) was added to the filtrate The
solution color changed to yellow and then 30 mL of deionized water was added
The mixture was allowed to let stand at room temperature for at least 5 mins and
the color would turn to pale to bright yellow Before titrating with 001 N of
36
sodium thiosulfate (Na2SO3) 05 mL of 1 starch solution was added (a color
changed occurred - the color turned purple to blue-black) The PV is expressed as
meq O2kg lipid
36 pH value
To determine the pH of the meat samples cooked meat samples (10 g)
were blended with 50 mL deionized water for 15 seconds in a homogenizer
(Ultra-Turrax T25 IKAreg Wilmington NC USA) The pH was measured with a
pH meter (Accumet Basic model AB 15 Fisher Scientific Company) The pH
meter was calibrated daily with standard buffers of pH 40 and 70 at 25˚C
37 Sensory Evaluation
Trained panelists (n=15) were recruited from among University of Illinois
graduate students and staff The panelists were prepared using an extensive
training program During each training session panel members practiced and
discussed the techniques developed for sample presentation score sheet terms
and odor sensory evaluation method A panel leader led the panelists to develop
terms to describe the aroma characteristics of fresh cooked turkey meat including
the aroma characteristics of cooked poultry with or without the added Keluak
extract Panel members were trained regularly for 7 sessions for total of two
weeks to identify and discriminate aroma differences Some of the terms were
derived from reference standards including fresh boiled ground turkey meat
lard oxidized vegetable oil hard-boiled egg and wet cardboard (Table 32) The
panelists agreed on the following aroma descriptors for warm-over-flavor meaty
fatty rancid eggy and cardboardy These descriptors were judged for the
presence and overall intensity using a 15 cm-structured line scale (0 = none 15 =
extreme) along with an anchor value for each respective standard Table 2
showed the form used to evaluate the aroma descriptors described above
Cooked patties were uniformly cut into four pie-shaped wedges and placed
in a sniff bottle (Nalgene Teflon PTFE wash bottle Nalge Company Rochester
NY USA) covered with foil to hide the identity of the sample inside Each sample
represented a treatment labeled with three-digit random numbers and were
37
served at random order during each test session The samples were held in an
incubator (45degCplusmn 1degC) for 30 mins prior to presentation to the panelists The
panelists were asked to clean their palate by chewing a piece of unsalted saltine
crackers and rinse with water prior to evaluating the samples Samples were
sniffed Four samples were evaluated for each test session Roasted coffee beans
were presented for panelists to clear the palate between samples Standard
references were prepared daily The second session replicates of the first session
was conducted one week after the first session
38 Statistical Analysis
Statistical assessment was carried out with the program SAS Data were
analyzed as 4 (treatments) by 5 (days of storage) The results from the TBARs
analysis peroxide value analysis conjugated dienes analysis and the
odorsensory analysis were analyzed using one-way analysis of variance
(ANOVA) Differences were considered significant at the P lt 005 level
Comparison of treatment means was based on Fisherrsquos Least Significant
Difference (LSD)
38
39 Tables
Table 31 Formulation of Cooked Ground Turkey Meat for Each Treatment
TREATMENTS
Control BHT AO 200ppm AO 400ppm
INGREDIENTS
Jenny-O 15 fat Ground Turkey
(g) 650 650 650 650
Salt (2 ww) (g) 13 13 13 13
BHT (002 of total fat) (g) 002
Keluak extract (mL)
2487 (002 g
phenolics)
4974 (004 g
phenolics)
Cold water (mL)5 by sample wt
(ww) 325 325 325 325
Table 32 Descriptive Odor Standards for Refrigerated Ground Turkey Meat
Descriptive Odor term Standard Location on the 15-cm line
Rancid Oxidized vegetable oil in water (1100 vv) 7
Cardboard 1 cm2 cardboard in 15 mL water 85
Eggy Fresh hard-boiled egg white (01 g) 9
Meaty Fresh boiled ground turkey meat in water (15 gv) 8
Fatty Lard (02 g) 9
39
310 References
1 Wettasinghe M Shahidi F Antioxidant and free radical-scavenging properties of ethanolic extracts of defatted borage (Borago officinalis L) seeds Food Chem 1999 67 399-414
2 Vara-Ubol S Bowers J Effect of alpha-tocopherol beta-carotene and sodium tripolyphosphate on lipid oxidation of refrigerated cooked ground turkey and ground pork J Food Sci 2001 66 662-667
3 Hassan O Fan L The anti-oxidation potential of polyphenol extract from cocoa leaves on mechanically deboned chicken meat (MDCM) Lwt-Food Science and Technology 2005 38 315-321
4 Tarladgis B Dugan L Pearson A Chemistry of 2-Thiobarbituric Acid Test for Determination of Oxidative Rancidity in Foods 2 Formation of Tba-Malonaldehyde Complex without Acid-Heat Treatment J Sci Food Agric 1964 15 602-amp
5 Yu L Scanlin L Wilson J Schmidt G Rosemary extracts as inhibitors of lipid oxidation and color change in cooked turkey products during refrigerated storage J Food Sci 2002 67 582-585
6 Juntachote T Berghofer E Siebenhandl S Bauer F The antioxidative properties of Holy basil and Galangal in cooked ground pork Meat Sci 2006 72 446-456
7 Kim YJ Jin SK Park WY Kim BW Joo ST Yang HS The Effect of Garlic Or Onion Marinade on the Lipid Oxidation and Meat Quality of Pork during Cold Storage J Food Qual 2010 33 171-185
8 Chye FY Sim KY Antioxidative and Antibacterial Activities of Pangium edule Seed Extracts International Journal of Pharmacology 2009 5 285-297
9 Kahkonen M Hopia A Vuorela H Rauha J Pihlaja K Kujala T Heinonen M Antioxidant activity of plant extracts containing phenolic compounds J Agric Food Chem 1999 47 3954-3962
10 Jayaprakasha G Selvi T Sakariah K Antibacterial and antioxidant activities of grape (Vitis vinifera) seed extracts Food Res Int 2003 36 117-122
11 Fardiaz D Romlah S Antioxidant Activity of Picung (Pangium edule Reinw) Seed In Development of Food Science and Technology in ASEAN Proceedings of the 4th ASEAN Food Conference Feb 17-21 1992 ASEAN Jakarta Indonesia 1992 12 Waterhouse A L Determination of Total Phenolics Current Protocols in
Food Analytical Chemistry 2002 I111-I118
40
13 Association of Official Analytical Chemists (1995) Official methods of analysis (16th ed) Washington DC Association of Official Analytical Chemists
41
Chapter 4 RESULTS AND DISCUSSION
41 Phenolic Extraction Yield
The phenolic extract yield using acetone water acetic acid (90 95 05)
extraction was 503 plusmn 140 g of extract per 70 g of defatted ground Keluak seed or
007 g phenolic extract per gram of defatted Keluak The samples contained
approximately 719 phenolic compounds by weight the values are equal to the
average plusmn standard deviation of the three replicate analyses This value was
moderately greater than that reported by Chye and Sim (1) which reported a
548 yield The total phenolic content as determined using Folin-Ciocalteau
reagent was 1973 plusmn 203 mg GAEg extract which was also moderately greater
than the result reported by Chye and Sim which was 1639plusmn 004 mg GAEg
extract (1) It is possible that the difference is due to the Keluak source Chye and
Sim obtained their seeds material from local indigenous markets in Kota
Kinabalu Sabah Malaysia (1) while the seeds used in this study were grown in
from Indonesia The geographical and horticultural differences could affect the
phenolic content and concentration of the seed
According to Kahkonen et al (2) different phenolic compounds can have
different responses in the Folin Ciocalteau method depending on their chemical
structure Therefore the antioxidant activity of an extract cannot be predicted
solely on its total phenolic content (3 4)
42 Effect of Keluak Extract and storage time on TBARS values during
refrigerated storage of cooked ground turkey
The TBARS values represent the content of secondary lipid oxidation
products particularly malonaldehyde The carbonyls are primarily responsible
for the production of off-flavors in oxidized meat and meat products Aldehydes
are formed by the oxidation of unsaturated fatty acids They react with the TBA
reagent to form a pink complex (TBA chromogen) with a maximum absorbance
at 532 nm The intensity of this pink color is directly related to the concentration
of the TBA-reactive substances in the original sample The results of the TBARs
analysis for the preliminary study (7 days) and the extended storage study (15
days) are shown in Tables 41a b and Figures 41a b respectively Overall lipid
42
oxidation increased substantially as the refrigerated storage progressed due to
the effects of heating and in combination with storage under aerobic conditions
On the first day of analysis for both the 7 and 15 days storage study all the
antioxidant treated samples (BHT and both concentrations of the Keluak
extracts) the TBARS values were significantly lower than the control an
indication that the antioxidants had a positive effect in suppressing oxidation
Similar findings were observed by Juntachote et al and Teets et al (5 6) TBARS
values for both 7 and 15 days storage study ranges from 035- 475 mg MDA kg
meat which was comparable to other study by Juntachote (5) for 14 days of
storage study of pork meat There were examining the effect other natural
sources of antioxidants on oxidation during refrigerated storage of cooked meat
During the preliminary study (Table 41a) the control and BHT treatments
did not show significant differences (Pgt005) from day 1-7 However both of the
Keluak extract treatments showed a significant (Plt005) effect on the
suppression of the progression of lipid oxidation as compared to the control
(Figure 41a)
On the other hand during the 15 day study all the samples with added
antioxidants had significantly lower TBAR values compared to the control
throughout the entire storage period This indicates that both the commercial
treatment and the treatment with Keluak extracts provided substantial protection
to the meat with respect to lipid oxidation The efficacy of the Keluak extracts to
inhibit lipid oxidation is probably related to their phenolic content The results of
this study showed agreement with those obtained by Fardiaz and Romlah (14)
which stated that the addition of Keluak extract to palm oil lengthened the
oxidation induction period from 22 hours to 50 hours
Lipid oxidation was considerably greater with longer storage times due to
the exposure to oxygen TBARs measure the formation of secondary lipid
oxidation products which contribute to WOF in oxidized meat Heat increases the
release of non-heme iron from the heme pigments a major catalyst for lipid
oxidation in cooked meats (7) Cooking also alters cellular compartmentalization
and exposes membrane phospholipids to molecular oxygen and metal ions (8)
43
resulting in greater amounts of lipid oxidation (9) The addition of antioxidants
during processing cooking or packaging can be done to increase the oxidative
stability of cooked meat (10)
43 Effect of Keluak Extract and Storage Time on Conjugated Diene
Content during Refrigerated Storage of Cooked Ground Turkey
Meat
The development of conjugated dienes (CD) is related to the formation of
hydroperoxides found in the extracted lipids of the cooked ground turkey
Unsaturated fatty acid double bonds occur naturally in a methylene interrupted
structure As meat begins to oxidize the double bonds of these fatty acids are
altered creating conjugated systems which can be measured
spectrophotometrically (6) During lipid peroxidation non-conjugated double
bonds (C=CndashCndashC=C) which are present naturally in unsaturated lipids are
converted to conjugated double bonds (C=CndashC=C) with a large increased in
absorption at 232ndash234 nm (11) In the preliminary study there were no significant differences among the
antioxidant treated sample and the control (Pgt005) except on day 5 (Figure 42a
and Table 42a) The CD value for all the treatments peaked at day 5 and the
samples treated with antioxidants were significantly different that the control
(Plt005)
Meanwhile during the second storage study (Table 42b and Figure 42b)
when the CD values were compared to the control on day 0 and day 1 the 002
BHT and both of the Keluak extract treated samples were not significantly
different (Pgt005) However from day 3 on all the antioxidant-treated samples
had less CD formation than the control (Plt005) The CD content of the control
generally increased especially during the last 5 days (Day 10 13 and 15) of the
study Additionally cooked ground turkey treated with Keluak at 400 ppm had
slightly lower concentrations of conjugated dienes compared to cooked ground
turkey containing Keluak extract at 200 ppm and the commercial antioxidant
(BHT) The trend of CD formation was similar to several other studies (5 6 12
13) They generally observed that the CD concentration for most samples peaked
44
on Day 3 and decreased thereafter This phenomenon of decreased CD is likely
due to the decomposition of the conjugated diene hydroperoxides into secondary
oxidation products over time Conjugated dienes hydroperoxides are expected to
decompose into secondary products as was observed in this study According to
Frankel (15) the formation of conjugated dienes which is related to the
production of hydroperoxides occurs in the early stages of lipid oxidation According to Estevez et al (17) measurement of conjugated dienes (CD) in
meat products containing elevated levels of PUFA is limited depending on the
fatty acid composition of the sample as well as the presence of other non-
hydroperoxides CDs In agreement with Grau et al (18) the TBA test showed a
higher sensitivity with respect to lipid oxidation than did the CD determination
44 Effect of Keluak extract and storage time on peroxide value during
refrigerated storage of cooked ground turkey
Peroxide values (PV) were also used to assess the level of lipid oxidation in
cooked ground turkey during storage at 2˚C (Table 43 and Figure 43) However
while there were differences between the control and samples treated with AOs
on a few days the result of this study showed that treatments had no significant
effect (Pgt005) on the peroxide values compared to the control Generally based
on the results in Table 4 and Figure 4 the PVs increased during storage and
peaked on day 10 At the time it is possible that much of the polyunsaturated
membrane lipids may have been oxidized at that point so that further storage
and oxidation resulted in a decrease in the concentration of peroxides and thus
the PV
The PV differences among the samples did not provide proof that any of
the AOs were effective It is not clear why the PV analysis did not provide any
evidence of AO efficacy According to Estevez (17) the sensitivity of this method
is about 05 miliEquivalentkg of lipid Lower peroxide values cannot be
measured satisfactorily by the AOCS method because of the uncertainty with the
iodometric titration endpoint unless the iodine-starch end is determined
potentiometrically at levels as low as 006 Eqkg lipid The iodometric method is
highly empirical and very small procedural differences can cause variation in the
45
results (19) Two major sources of error in this test could be the liberation of
iodine by air oxidation of the KI and absorption of iodine by fatty acid double
bonds (17)
4 5 Effect of Keluak Extract and storage time on Odor of Refrigerated
Cooked Ground Turkey
No significant interaction (Pgt 005) occurred between antioxidant and
storage time for most of the odor characteristics (Tables and Figures 44-48)
For meaty odor characteristic (Figure and Table 44) the score of all the
treatments over the 7 days of storage did not show significant differences
(Pgt005) The scores ranged from 502 ndash 783 which was slightly below the
freshly boiled turkey meat standard for meaty (which was ranked 8 in the 15-cm
line scale) Therefore the panelists were unable to score and detect the cooked
meat aroma differences in the treated samples relative to the standard reference
The meaty aroma in this study was used to determine if there were possible
masking effects from the AO treatments
For the rancid odor (Figure and Table 45) both of the Keluak treated
samples were perceived as more rancid than both control and BHT after day 1
Overall both of the Keluak treated samples were ranked higher than the control
and BHT which disagrees with the results of TBA test However there was no
significant difference among the treatments between day 3-7 According to Ruth
(20) rancidity as a measure of lipid oxidation is usually best measured by the
concentration of TBARS
The minimum TBA values that corresponds to dark chicken meat samples
that were significantly different in rancid aroma was 1933 μg MDAkg of meat
(21) For consumer acceptability the TBA values must be less than 785 μg of
MDAkg (21) The results from Bou et al (21) were comparable to the results
reported by Gray and Pearson (22) showing that rancid flavor in meats is initially
detected between 500 and 2000 μg of MDAkg of meat In addition OrsquoNeill et
al (23) found that the threshold for WOF detection in cooked dark chicken meat
was at TBA values ge800 μg of MDAkg of meat Since chicken and turkey meat
46
have a comparable PUFA content those values were considered useful in this
experiment On the other hand the odor score for Eggy cardboard and fatty were
statistically not different (Pgt 005) Panelists were unable to detect differences
which could be to different reasons such as that Keluak extract has an aroma
masking effect that confuses the panelists with the ldquooff-odorrdquo The Keluak did
have a slight aroma and it is likely that it masked the effects of storage on lipid
oxidation The aroma of Keluak has been described as bitter dirt-like and
chocolate-like odor (16) This aroma masking could be perceived as undesirable
by the panelists and it might have been mistaken as an off-odor or as an oxidized
sample even though the TBARs and CD data showed otherwise
4 6 Effect of Keluak Extract and storage time on pH of Refrigerated
Cooked Ground Turkey
Table 49 shows the effect of antioxidant treatments in pork muscle on pH
values during storage at 2˚C The values of the pH ranged between 633-668
Generally there are no correlations of pH value among the treatments during
storage The trend for the pH value is inconclusive
47
47 Figures Figure 41a The profile of TBARS in cooked ground turkey treated with various
antioxidants during storage at 2˚C- A Preliminary Study
K200 and K400 represent treatments with Keluak extract at concentration of 200 and 400 ppm respectively
0000
1000
2000
3000
4000
5000
6000
0 2 4 6 8
TBA
RS
(mg
MD
Ak
g m
eat
)
Storage Days
Control
BHT
K200
K400
48
Figure 41b The profile of TBARS in Cooked Ground Turkey Treated with Various Antioxidants During Storage at 2˚C- Extended Storage Time
K200 and K400 represent Keluak extract at concentration of 200 and 400 ppm respectively
Figure 42a Conjugated dienes values of different antioxidant treatments over storage at
2˚C - A Preliminary Study
K200 and K400 represent treatments with Keluak extract at concentration of 200 and 400 ppm
respectively
000
100
200
300
400
500
600
0 5 10 15 20
TBA
RS
(mg
MD
Ak
g m
eat
)
Storage time (days)
Control
BHT 002
K200
K400
0000
0050
0100
0150
0200
0250
0300
0350
0400
0450
0 1 2 3 4 5 6 7 8
Co
nju
gate
d D
ien
es
(nm
ol
mg
me
at)
Days
Control
BHT
K200
K400
49
Figure 42b Conjugated dienes values of different antioxidant treatments over storage at
2˚C- Extended Storage Time
K200 and K400 represent treatments with Keluak extract at concentration of 200 and 400 ppm respectively
Figure 43 Peroxide Value (meq kg meat) of Different Antioxidant treatments over
Storage at 2˚C
K200 and K400 represent treatments with Keluak extract at concentration of 200 and 400 ppm
respectively
000
002
004
006
008
010
012
014
016
0 5 10 15 20
Co
nju
gate
d D
ien
es
(nm
ol
mg
me
at)
Storage (days)
Control
BHT 002
K200
K400
0
05
1
15
2
25
3
35
4
0 2 4 6 8 10 12 14 16
PV
(m
eq
kg
me
at)
Storage Time (Days)
Control
BHT 002
K200
K400
50
Figure 44 Intensity of Meaty Odor Descriptor in Cooked Ground Turkey Meat Treated
with Different Antioxidants Rated in a 15-cm Line Scale
K200 and K400 represent Treatment with Keluak extract at concentration of 200 and 400 ppm
respectively
Figure 45 Intensity of Rancid Odor Descriptor in Cooked Ground Turkey Meat Treated
with Different Antioxidants Rated in a 15-cm Line Scale
K200 and K400 represent Treatment with Keluak extract at concentrations of 200 and 400 ppm
respectively
000
200
400
600
800
1000
1200
0 2 4 6 8
15
cm
Lin
e s
cale
(av
era
ge)
Days
CONTROL
BHT
K200
K400
Linear (BHT)
-100
000
100
200
300
400
500
600
700
800
0 2 4 6 8
15
cm
Lin
e s
cale
(av
era
ge)
Days
Control
BHT
K200
K400
51
Figure 46 Intensity of Eggy Odor Descriptor in Cooked Ground Turkey Meat Treated
with Different Antioxidants Rated in a 15-cm Line Scale
K200 and K400 represent Treatment with Keluak extract at concentrations of 200 and 400 ppm
respectively
Figure 47 Intensity of Cardboard Odor Descriptor in Cooked Ground Turkey Meat
Treated with Different Antioxidants Rated in a 15-cm Line Scale
K200 and K400 represent Treatment with Keluak extract at concentrations of 200 and 400 ppm
respectively
000
100
200
300
400
500
600
700
800
900
1000
0 2 4 6 8
15
cm
Lin
e s
cale
(av
era
ge)
Days
Control
BHT
K200
K400
-1
0
1
2
3
4
5
6
7
0 2 4 6 8
15
cm
Lin
e s
cale
(av
era
ge)
Days
Control
BHT
K200
K400
52
Figure 48 Intensity of Fatty Odor Descriptor in Cooked Ground Turkey Meat Treated
with Different Antioxidants Rated in a 15-cm Line Scale
K200 and K400 represent Treatment with Keluak extract at concentrations of 200 and 400 ppm
respectively
000
100
200
300
400
500
600
700
800
900
0 2 4 6 8
15
cm
Lin
e s
cale
(av
era
ge)
Days
Control
BHT
K200
K400
53
48 Tables
Table 41a TBARS Value of Cooked Ground Turkey Meat Treated with Various Antioxidants during Storage at 2˚C- A Preliminary Study
TBARS (mg MDAkg meat) Average
Storage (Day) Control BHT 002 Keluak 200ppm Keluak 400ppm
0
131plusmn009Aa 094plusmn021Ba 050plusmn004Ca 037plusmn010Ca
1
189plusmn003Aab 161plusmn025Aab 080plusmn006Ba 057plusmn026Bab
3
243plusmn010Ac 236plusmn025Abc 111plusmn022Bab 055plusmn008Cab
5
397plusmn016Ad 319plusmn064Acd 170plusmn025Bbc 108plusmn023Bb
7
473plusmn076Ad 373plusmn074ABd 217plusmn040ACc 101plusmn044Cab
Different letters (A-D) within a row indicates that mean values are significantly different (Plt 005) Different letters within a column (a-d) within the same treatment are significantly different (Plt005)
Table 41b TBARS Value of Cooked Ground Turkey Meat Treated with Various Antioxidants during Storage at 2 ˚C- Extended Storage Time
TBARS (mg MDAkg meat) Average
Storage (day) Control BHT 002 K200 K400
0 129 plusmn 008Ae 091plusmn 004Bcd 065plusmn 015Be 101plusmn 003Cf
1 159plusmn 008Ade 076plusmn 005Cd 083plusmn 012Ce 127plusmn 006Bf
3 220plusmn 011Acd 074plusmn 004Dd 119plusmn 003Cd 160plusmn 004Be
5 258plusmn 014Ac 082plusmn 006Cd 076plusmn 014Ce 150plusmn 004Bd
7 377plusmn 001Ab 109plusmn 002Ccb 158plusmn 006Bc 160plusmn 006Bd
10 405plusmn 061Aab 121plusmn 009Bb 197plusmn 012Bb 195plusmn 009Bc
13 465plusmn 014Aa 151plusmn 004Ca 224plusmn 003Bab 218plusmn 003Bb
15 459plusmn 024Aa 154plusmn 013Da 231plusmn 014Ca 284plusmn 010Ba
Different letters (A-D) within a row indicates that mean values are significantly different (Plt 005) Different letters within a column (a-f) within the same treatment are significantly different (Plt005)
K200 and K400 represent treatments with Keluak extract at concentration of 200 and 400 ppm
respectively
54
Table 42a Conjugated Dienes Concentrations with Antioxidant Treatments and Storage
At 2˚C- A Preliminary Study
Conj Dienes (nmolemg meat)
Storage (Days) Control BHT 002 K200 K400
0 015plusmn003Abc 022plusmn001Aa 013plusmn001Ab 020plusmn008Aa
1 012plusmn001Abc 012plusmn003Ab 011plusmn001Ab 019plusmn001Bab
3 006plusmn000Ac 003plusmn002Ac 002plusmn002Ab 004plusmn002Ab
5 038plusmn000Aa 024plusmn001Ba 027plusmn007ABa 021plusmn001Ba
7 023plusmn008Ab 026plusmn001Aa 029plusmn003Aa 016plusmn001Aab
Different letters (A-C) within a row indicates that mean values are significantly different (Plt 005) Different letters within a column (a-d) within the same treatment are significantly different (Plt005)
K200 and K400 represent treatments with Keluak extract at concentration of 200 and 400 ppm
respectively
Table 42b Conjugated Dienes Concentrations After Antioxidant Treatments and
Storage At 2˚C- Extended Storage Time
Conjugated Dienes (nM mg meat)
Storage (Days) Control BHT 002 K200 K400
0 013plusmn 001Aab 009plusmn000Bab 010plusmn 000Ba 010plusmn 001Ba
1 008plusmn 001Ac 008plusmn 001Ab 008plusmn 000Abc 007plusmn 001Ab
3 011plusmn 000Ab 009plusmn 001Bab 008plusmn 000Bbc 006plusmn 000Cb
5 012plusmn001Ab 008plusmn 001B b 006plusmn 000Bd 006plusmn 000Bb
7 011plusmn001Abc 008plusmn 000B ab 006plusmn 001Bcd 007plusmn 000Bb
10 014plusmn 000Aa 009plusmn 000Bab 009plusmn 001Bab 007plusmn 000Cb
13 014plusmn 001Aa 009plusmn 000Bab 008plusmn 000Bbc 006plusmn 000Cb
15 014plusmn 000Aa 010plusmn 001Ba 008plusmn 001BCbcd 007plusmn 000Cb
Different letters (A-C) within a row indicates that mean values are significantly different (Plt 005) Different letters within a column (a-d) within the same treatment are significantly different (Plt005)
K200 and K400 represent treatments with Keluak extract at concentration of 200 and 400 ppm
respectively
55
Table 43 Peroxide Value (meq kg meat) of Different Antioxidant treatments during
Storage of cooked ground turkey meat at 2˚C
PV (meq kg meat)
Storage (Days) Control BHT 002 K200 K400
0 110plusmn 042Abc 070plusmn 014Ae 080plusmn 028Ad 130plusmn 014Acd
1 230plusmn 014Aab 130plusmn 014Bd 090plusmn 014BCd 070plusmn 014Cd
3 080plusmn 000Ac 070plusmn 014Ae 070plusmn 014Ad 070plusmn 014Ad
5 280plusmn 028Aa 140plusmn 000Bcd 110plusmn 014Bcd 080plusmn 028Bd
7 170plusmn 042Aabc 190plusmn 014Ac 195plusmn 021Abc 225plusmn 049Abc
10 310plusmn 042Aa 330plusmn 014Aa 290plusmn 042Aa 340plusmn 028Aa
13 255plusmn 007Aa 265plusmn 021Ab 240plusmn 028Aab 260plusmn 028Aab
15 255plusmn 064Aa 150plusmn 014ABcd 086plusmn 006Bd 100plusmn 028Bd
Different letters (A-C) within a row indicates that mean values are significantly different (Plt 005) Different letters within a column (a-e) within the same treatment are significantly different (Plt005)
K200 and K400 represent Treatment with Keluak extract at concentrations of 200 and 400 ppm
respectively
Table 44 Intensity of Meaty Odor Descriptor in Cooked Ground Turkey Meat Treated with Different Antioxidants Rated in a 15-cm Line Scale
Storage (Day) Control BHT 002 K200 K400
0 595plusmn250Aa 727plusmn144Aa 632plusmn202Aa 606plusmn189Aa
1 783plusmn208Aa 731plusmn174ABa 543plusmn220Ba 542plusmn294Ba
3 613plusmn201Aa 693plusmn143Aa 502plusmn266Aa 552plusmn228Aa
5 734plusmn277Aa 710plusmn290Aa 474plusmn253Aa 487plusmn263Aa
7 694plusmn296Aa 751plusmn265Aa 532plusmn259Aa 543plusmn236Aa
Different letters (A-C) within a row indicates that mean values are significantly different (Plt 005) Different letters within a column (a-b) within the same treatment are significantly different (Plt005)
K200 and K400 represent Treatment with Keluak extract at concentrations of 200 and 400 ppm
respectively
56
Table 45 Intensity of Rancid Odor Descriptor in Cooked Ground Turkey Meat Treated
with Different Antioxidants Rated in a 15-cm Line Scale
Storage (Day) Control BHT 002 K200 K400
0 228plusmn194Aa 193plusmn175Aa 334plusmn231Aa 350plusmn274Aa
1 177plusmn194Aa 172plusmn163Aa 392plusmn274ABa 426plusmn265Ba
3 260plusmn210Aa 272plusmn265Aa 419plusmn306Aa 337plusmn247Aa
5 344plusmn255Aa 329plusmn215Aa 427plusmn248Aa 395plusmn253Aa
7 408plusmn300Aa 289plusmn244Aa 448plusmn241Aa 385plusmn244Aa
Different letters (A-B) within a row indicates that mean values are significantly different (Plt 005) Different letters within a column (a-b) within the same treatment are significantly different (Plt005)
K200 and K400 represent Treatment with Keluak extract at concentrations of 200 and 400 ppm
respectively
Table 46 Intensity of Eggy Odor Descriptor in Cooked Ground Turkey Meat
Treated with Different Antioxidants Rated in a 15-cm Line Scale
Storage (Day) Control BHT 002 K200 K400
0 643plusmn242Aa 513plusmn244Aa 502plusmn324Aa 565plusmn287Aa
1 597plusmn248Aab 476plusmn321Aa 599plusmn332Aa 584plusmn360Aa
3 345plusmn258Ab 400plusmn270Aa 515plusmn335Aa 509plusmn425Aa
5 364plusmn303Aab 424plusmn320Aa 475plusmn269Aa 469plusmn180Aa
7 473plusmn306Aab 364plusmn210Aa 485plusmn268Aa 431plusmn305Aa
Different letters (A-C) within a row indicates that mean values are significantly different (Plt 005) Different letters within a column (a-e) within the same treatment are significantly different (Plt005)
K200 and K400 represent Treatment with Keluak extract at concentrations of 200 and 400 ppm
respectively
57
Table 47 Intensity of Cardboard Odor Descriptor in Cooked Ground Turkey Meat
Treated with Different Antioxidants Rated in a 15-cm Line Scale
Storage (Day) Control BHT 002 K200 K400
0 299plusmn222Aa 209plusmn182Aa 261plusmn198Aa 312plusmn157Aa
1 262plusmn249Aa 180plusmn192Aa 339plusmn238Aa 342plusmn229Aa
3 299plusmn203Aa 284plusmn254Aa 388plusmn235Aa 287plusmn185Aa
5 252plusmn243Aa 290plusmn190Aa 309plusmn193Aa 320plusmn204Aa
7 301plusmn210Aa 273plusmn253Aa 337plusmn195Aa 284plusmn205Aa
Different letters (A-C) within a row indicates that mean values are significantly different (Plt 005) Different letters within a column (a-e) within the same treatment are significantly different (Plt005)
K200 and K400 represent Treatment with Keluak extract at concentrations of 200 and 400 ppm
respectively
Table 48 Intensity of Fatty Odor Descriptor in Cooked Ground Turkey Meat Treated with Different Antioxidants Rated in a 15-cm Line Scale
Storage (Day) Control BHT 002 K200 K400
0 344plusmn226aA 350plusmn256aA 395plusmn309aA 395plusmn277aA
1 417plusmn285aA 389plusmn230aA 401plusmn345aA 438plusmn287aA
3 388plusmn220aA 378plusmn229aA 396plusmn328aA 403plusmn285aA
5 479plusmn252aA 461plusmn293aA 389plusmn255aA 428plusmn320aA
7 460plusmn288aA 492plusmn286aA 426plusmn281aA 428plusmn340aA
Different letters (A-C) within a row indicates that mean values are significantly different (Plt 005) Different letters within a column (a-e) within the same treatment are significantly different (Plt005)
K200 and K400 represent Treatment with Keluak extract at concentrations of 200 and 400 ppm
respectively
58
Table 49 pH Values of Cooked Ground Turkey Treated with Different
Antioxidants Stored at 2˚C
pH Value
Storage (Day) Control BHT 002 K200 K400
0 665plusmn 002Aab 644plusmn 003Bbc 646plusmn 004Bbc 658plusmn 003Aab
1 659plusmn 003Ab 643plusmn 003Cbc 651plusmn 001Babc 662plusmn 001Aab
3 645plusmn 003Bc 634plusmn 002Cd 643plusmn 004Bc 654plusmn 000Ab
5 663plusmn 002Aab 640plusmn 002Cc 645plusmn 004Cc 654plusmn 002Bb
7 647plusmn 001Ac 633plusmn 003Bc 648plusmn 004Aabc 646plusmn 006Ac
10 665plusmn 001Aab 646plusmn 002Dbc 654plusmn 001Cab 660plusmn 003Bab
13 665plusmn 002Aab 648plusmn 002Cab 655plusmn 002Ba 664plusmn 002Aa
15 668plusmn 001Aa 651plusmn 001Da 655plusmn 001Ca 663plusmn 001Ba
Different letters (A-D) within a row indicates that mean values are significantly different (Plt 005) Different letters within a column (a-c) within the same treatment are significantly different (Plt005)
K200 and K400 represent treatments with Keluak extract at concentrations of 200 and 400 ppm
respectively
59
49 References
1 Chye FY Sim KY Antioxidative and Antibacterial Activities of Pangium edule Seed Extracts International Journal of Pharmacology 2009 5 285-297
2 Kahkonen M Hopia A Vuorela H Rauha J Pihlaja K Kujala T Heinonen M Antioxidant activity of plant extracts containing phenolic compounds J Agric Food Chem 1999 47 3954-3962
3 Jayaprakasha G Selvi T Sakariah K Antibacterial and antioxidant activities of grape (Vitis vinifera) seed extracts Food Res Int 2003 36 117-122
4 Gray J Macdonald B Pearson A Morton I Role of Nitrite in Cured Meat Flavor - a Review J Food Prot 1981 44 302-amp
5 Juntachote T Berghofer E Siebenhandl S Bauer F The antioxidative properties of Holy basil and Galangal in cooked ground pork Meat Sci 2006 72 446-456
6 Teets AS Were LM Inhibition of lipid oxidation in refrigerated and frozen salted raw minced chicken breasts with electron beam irradiated almond skin powder Meat Sci 2008 80 1326-1332
7 Han D McMillin K Godber J Bidner T Younathan M Marshall D Hart L Iron Distribution in Heated Beef and Chicken Muscles J Food Sci 1993 58 697-700
8 Ahn D Wolfe F Sim J Prevention of Lipid Oxidation in Precooked Turkey Meat Patties with Hot Packaging and Antioxidant Combinations J Food Sci 1993 58 283-287
9 Asghar A Gray J Buckley D Pearson A Booren A Perspectives on Warmed-Over Flavor Food Technol 1988 42 102-108
10 Kingston E Monahan F Buckley D Lynch P Lipid oxidation in cooked pork as affected by vitamin E cooking and storage conditions J Food Sci 1998 63 386-389
11 Kulas E Ackman R Different tocopherols and the relationship between two methods for determination of primary oxidation products in fish oil J Agric Food Chem 2001 49 1724-1729
12 Srinivasan S Xiong Y Decker E Inhibition of protein and lipid oxidation in beef heart surimi-like material by antioxidants and combinations of pH NaCl and buffer type in the washing media J Agric Food Chem 1996 44 119-125
13 Lee M Choi J Choi Y Han D Kim H Shim S Chung H Kim C The antioxidative properties of mustard leaf (Brassica juncea) kimchi extracts on
60
refrigerated raw ground pork meat against lipid oxidation Meat Sci 2010 84 498-504
14 Fardiaz D Romlah S Antioxidant Activity of Picung (Pangium edule
Reinw) Seed In Development of Food Science and Technology in ASEAN
Proceedings of the 4th ASEAN Food Conference Feb 17-21 1992 ASEAN
Jakarta Indonesia 1992
15 Frankel E N Lipid oxidation Dundee Scotland The Oily Press Ltd 1998 Vol 10 pp 13ndash41 16 Ma Amy A Peranakan favorite is ayam buah keluak Chicken stewed with black nuts at True Blue Restaurant Wall Street Journal (Online) New York NY Dec 16 2010 Retrieved July 20 2011 from httpproquestumicompqdwebdid=2214039511ampsid=1ampFmt=3ampclientId=36305ampRQT=309ampVName=PQD
17 Esteacutevez M Morcuende D and Ventanas S Determination of Oxidation
Nollet Leo M LToldraacute Fidel (Eds) Handbook of Muscle Foods Analysis Boca
Raton CRC Press 2009 221-240
18 Grau A Codony R Rafecas M Barroeta A Guardiola F Lipid
hydroperoxide determination in dark chicken meat through a ferrous oxidation-
xylenol orange method J Agric Food Chem 2000 48 4136-4143
19 Shahidi F Janitha P Wanasundara P Phenolic Antioxidants Crit Rev Food Sci Nutr 1992 32 67-103
20 Ruth SM Techniques for sampling and identification of volatile compounds contributing to sensory perception In Nollet Leo M LToldraacute Fidel (Eds) Handbook of Muscle Foods Analysis Boca Raton CRC Press 2009 503-523
21 Bou R Guardiola F Grau A Grimpa S Manich A Barroeta A Codony R Influence of dietary fat source alpha-tocopherol and ascorbic acid supplementation on sensory quality of dark chicken meat Poult Sci 2001 80 800-807
22 Gray J I and A M Pearson Rancidity and warmed over flavour In Pearson A M and Dutson T R (Eds) Advances in Meat Research Vol 3 Nostrand-Reinbold Co New York NY 1987 221ndash269 23 OrsquoNeill L M K Galvin P A Morrissey and D J Buckley Comparison of effects of dietary olive oil tallow and vitamin E on the quality of broiler meat and meat products Br Poult Sci 1998 39 365ndash371
61
Chapter 5 CONCLUSION AND FUTURE WORK
The results of the present study indicated that the Keluak extract
incorporated into cooked ground turkey can reduce lipid oxidation The addition
of Keluak extracts at 200 and 400 ppm had a positive effect on reducing the
TBAR values and the conjugated dienes content compared to the control without
added AOs during storage at 2˚C for 15 days The Keluak extract used in this
study was comparable to BHT (002) in reducing lipid oxidation in meat
Peroxide value analysis did not differentiate between the control and the
treatments on the extent of lipid oxidation Due to confusion of the odor
components in the Keluak extracts by the panelists there were no significant
differences between the treatments in the odor sensory evaluation
Keluak seed is a culinary spice with no known toxic effect Its moderate
pungent aroma makes it valued as a traditional ethnic food flavorant in parts of
South East Asia With its substantial phenolic content and antioxidant properties
it could be an effective source of natural antioxidants However the application
of this natural antioxidant might be limited in Western cultures due to its effect
on the color and odor of meat products Further investigations are needed to
identify selective extraction and clean-up techniques that could be used to
eliminate the color and odor problem Other chemical analysis methods that
might provide better information on the extent of oxidation in meat products
include the p-anisidine value Food Oil Sensor (FOS) and Gas chromatography
techniques (GC analysis) of selected volatiles
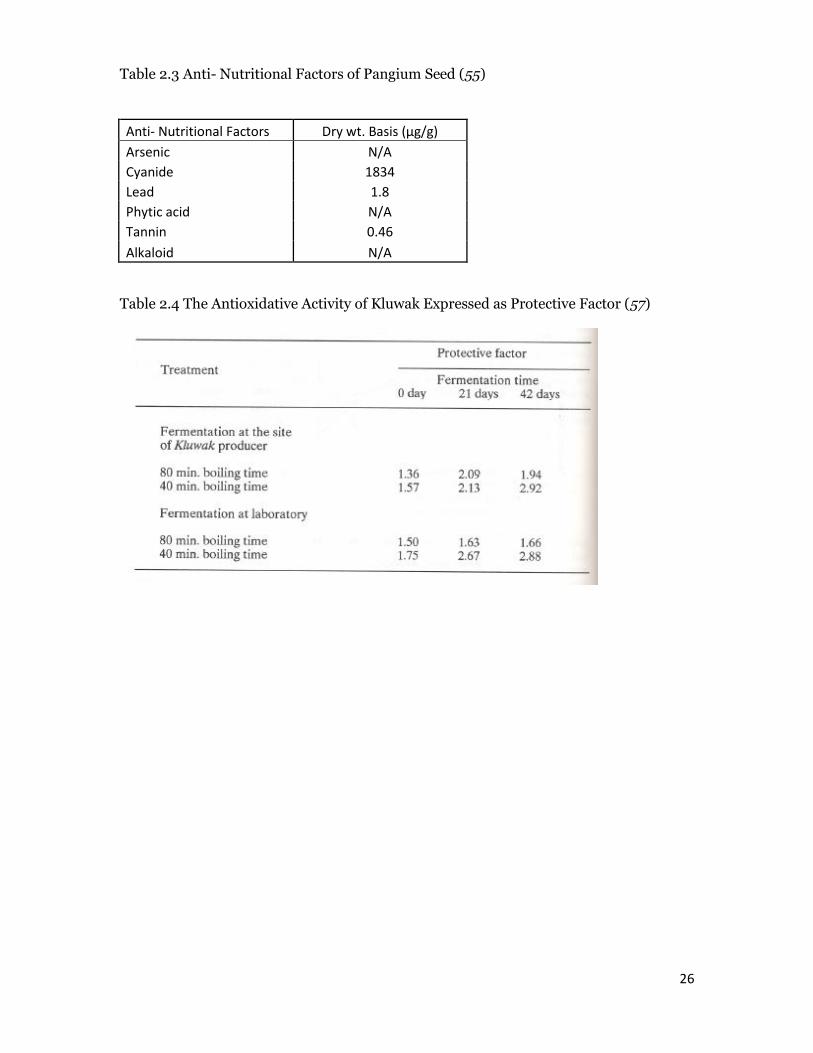
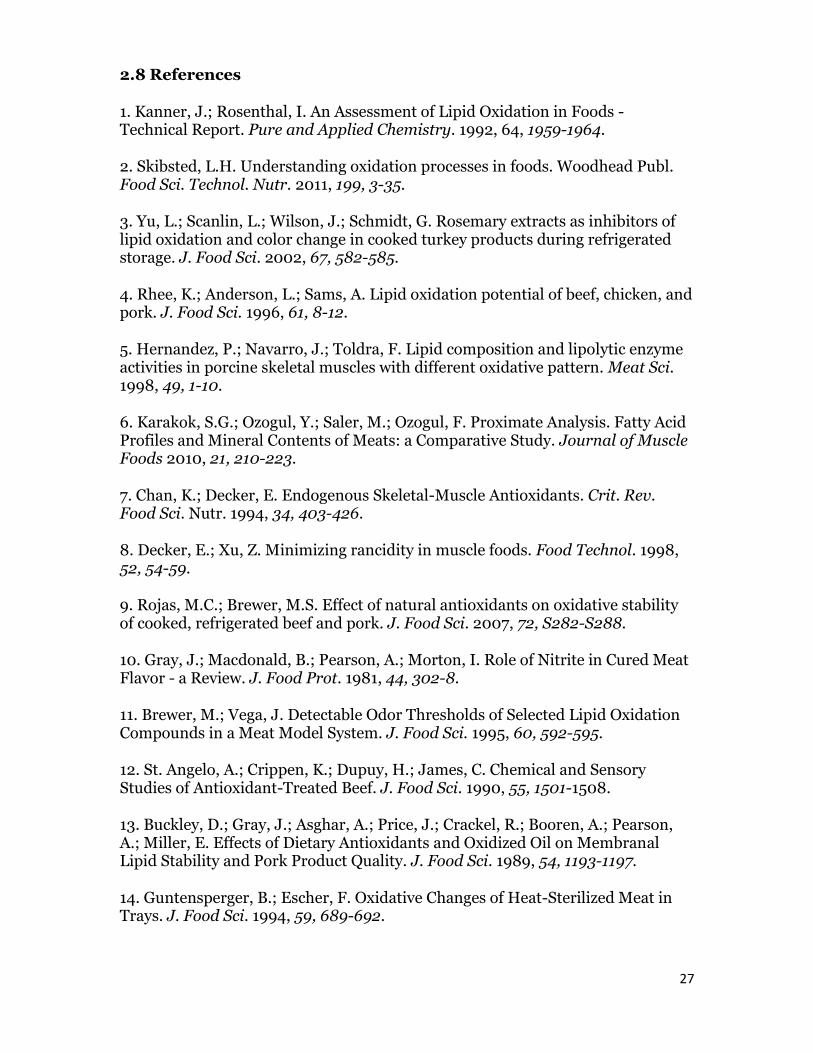
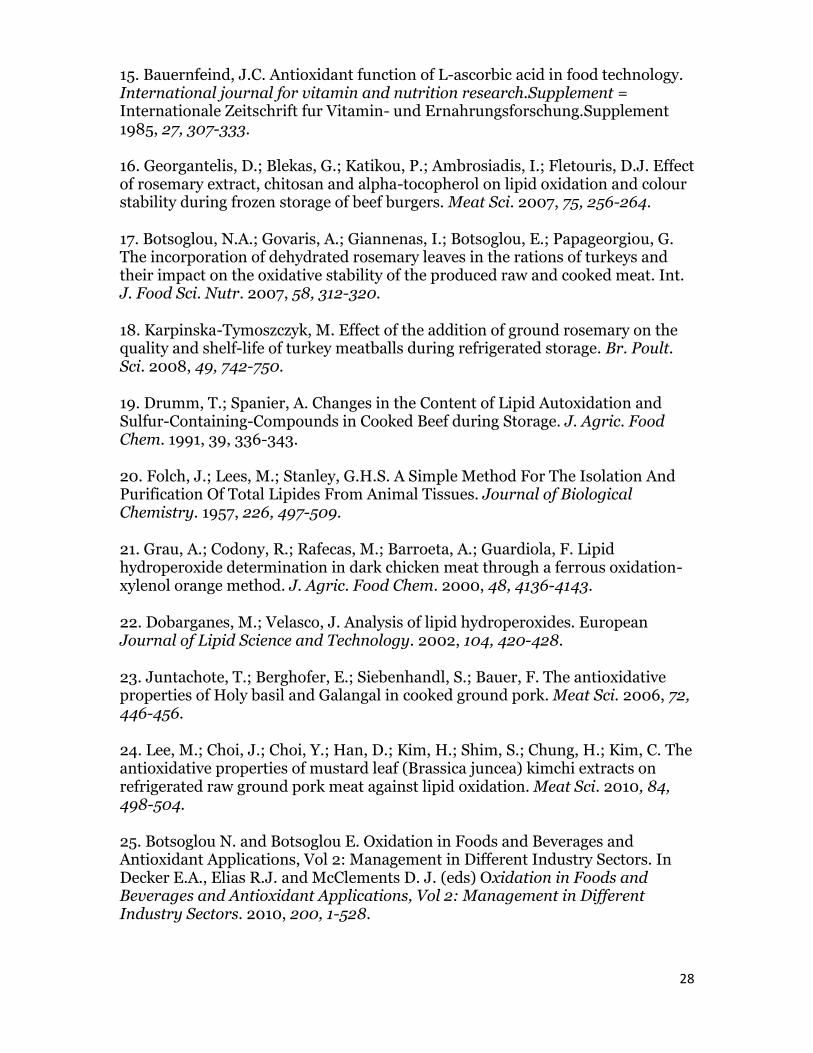
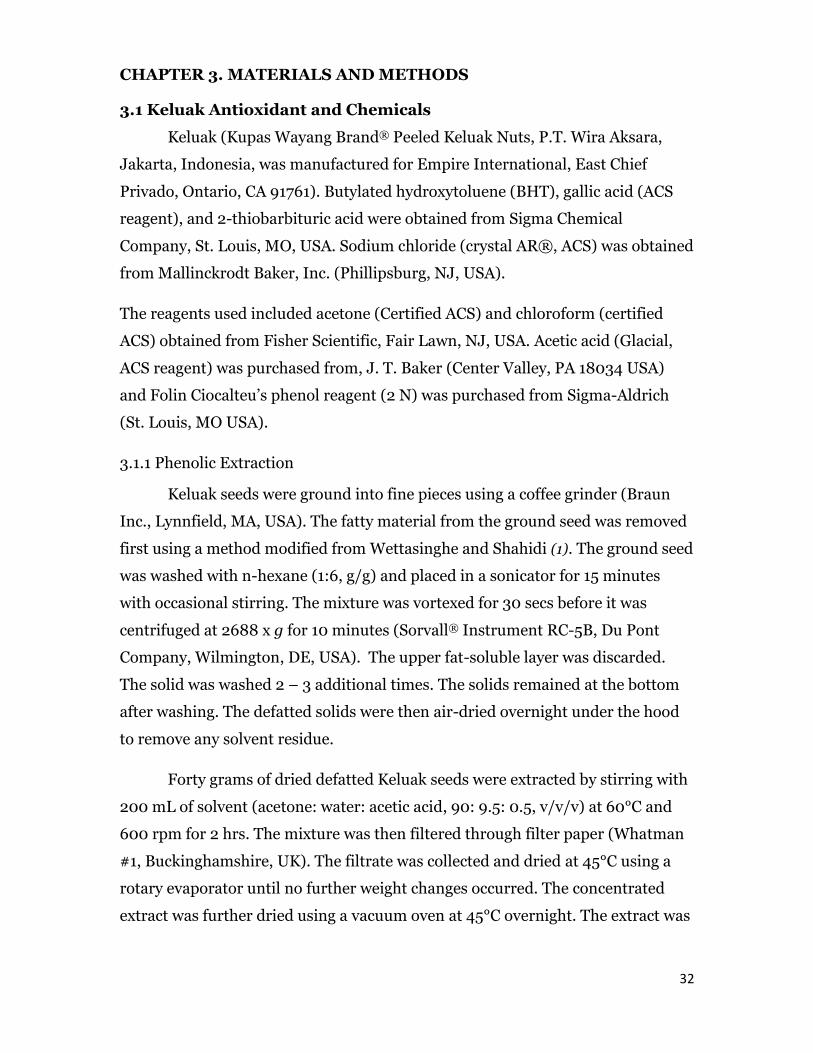
35
containing 002 M TBA in 90 glacial acetic acid The mixture was capped
vortexed for 30 secs and incubated in the dark for 15-18 hrs at room temperature
After the color developed the mixture was measured for absorbance at 532 nm
against a blank (deionized water) The absorbance was converted to TBAR values
using 1133- tetraethoxypropane to prepare a standard curve Triplicates of 10 g
samples were prepared for each treatment TBA value is expressed as mg MDA
kg meat
34 Conjugated Dienes
Conjugated dienes (CD) were determined by the method described by
Juntachote and others (6) with slight modifications A cooked meat sample (05
g) was suspended in 5 mL of deionized water and homogenized using a digital
Ultra-Turrax T25 (IKAreg Wilmington NC USA) to obtain a smooth slurry A 05
mL aliquot of this suspension was mixed with 5 mL of extracting solution
containing hexane and isopropanol (31 vv) and mixed for 1 min using a vortex
mixer After centrifugation at 2000 g for 5 mins the supernatant was collected
and the absorbance of the supernatant was determined at 233 nm The
concentration of conjugated dienes was calculated using a molar extinction
coefficient of 25200 M-1cm-1 and the result were expressed as nmole of
conjugated dienes per mg meat sample
35 Peroxide Value
The peroxide value was determined according to the AOAC method 96533
(Association of Official Analytical Chemists) (13) with a few modifications The
lipids from meat samples were extracted by the method of Kim et al (7) First 5 g
of meat sample was broken into small pieces and placed in a water bath at 60˚C
to melt the fat for 30 mins The meat was extracted with a solution containing
acetic acid chloroform (32) and then filtered with Whatman 1 filter paper A
saturated solution of potassium iodide (KI 05 mL) was added to the filtrate The
solution color changed to yellow and then 30 mL of deionized water was added
The mixture was allowed to let stand at room temperature for at least 5 mins and
the color would turn to pale to bright yellow Before titrating with 001 N of
36
sodium thiosulfate (Na2SO3) 05 mL of 1 starch solution was added (a color
changed occurred - the color turned purple to blue-black) The PV is expressed as
meq O2kg lipid
36 pH value
To determine the pH of the meat samples cooked meat samples (10 g)
were blended with 50 mL deionized water for 15 seconds in a homogenizer
(Ultra-Turrax T25 IKAreg Wilmington NC USA) The pH was measured with a
pH meter (Accumet Basic model AB 15 Fisher Scientific Company) The pH
meter was calibrated daily with standard buffers of pH 40 and 70 at 25˚C
37 Sensory Evaluation
Trained panelists (n=15) were recruited from among University of Illinois
graduate students and staff The panelists were prepared using an extensive
training program During each training session panel members practiced and
discussed the techniques developed for sample presentation score sheet terms
and odor sensory evaluation method A panel leader led the panelists to develop
terms to describe the aroma characteristics of fresh cooked turkey meat including
the aroma characteristics of cooked poultry with or without the added Keluak
extract Panel members were trained regularly for 7 sessions for total of two
weeks to identify and discriminate aroma differences Some of the terms were
derived from reference standards including fresh boiled ground turkey meat
lard oxidized vegetable oil hard-boiled egg and wet cardboard (Table 32) The
panelists agreed on the following aroma descriptors for warm-over-flavor meaty
fatty rancid eggy and cardboardy These descriptors were judged for the
presence and overall intensity using a 15 cm-structured line scale (0 = none 15 =
extreme) along with an anchor value for each respective standard Table 2
showed the form used to evaluate the aroma descriptors described above
Cooked patties were uniformly cut into four pie-shaped wedges and placed
in a sniff bottle (Nalgene Teflon PTFE wash bottle Nalge Company Rochester
NY USA) covered with foil to hide the identity of the sample inside Each sample
represented a treatment labeled with three-digit random numbers and were
37
served at random order during each test session The samples were held in an
incubator (45degCplusmn 1degC) for 30 mins prior to presentation to the panelists The
panelists were asked to clean their palate by chewing a piece of unsalted saltine
crackers and rinse with water prior to evaluating the samples Samples were
sniffed Four samples were evaluated for each test session Roasted coffee beans
were presented for panelists to clear the palate between samples Standard
references were prepared daily The second session replicates of the first session
was conducted one week after the first session
38 Statistical Analysis
Statistical assessment was carried out with the program SAS Data were
analyzed as 4 (treatments) by 5 (days of storage) The results from the TBARs
analysis peroxide value analysis conjugated dienes analysis and the
odorsensory analysis were analyzed using one-way analysis of variance
(ANOVA) Differences were considered significant at the P lt 005 level
Comparison of treatment means was based on Fisherrsquos Least Significant
Difference (LSD)
38
39 Tables
Table 31 Formulation of Cooked Ground Turkey Meat for Each Treatment
TREATMENTS
Control BHT AO 200ppm AO 400ppm
INGREDIENTS
Jenny-O 15 fat Ground Turkey
(g) 650 650 650 650
Salt (2 ww) (g) 13 13 13 13
BHT (002 of total fat) (g) 002
Keluak extract (mL)
2487 (002 g
phenolics)
4974 (004 g
phenolics)
Cold water (mL)5 by sample wt
(ww) 325 325 325 325
Table 32 Descriptive Odor Standards for Refrigerated Ground Turkey Meat
Descriptive Odor term Standard Location on the 15-cm line
Rancid Oxidized vegetable oil in water (1100 vv) 7
Cardboard 1 cm2 cardboard in 15 mL water 85
Eggy Fresh hard-boiled egg white (01 g) 9
Meaty Fresh boiled ground turkey meat in water (15 gv) 8
Fatty Lard (02 g) 9
39
310 References
1 Wettasinghe M Shahidi F Antioxidant and free radical-scavenging properties of ethanolic extracts of defatted borage (Borago officinalis L) seeds Food Chem 1999 67 399-414
2 Vara-Ubol S Bowers J Effect of alpha-tocopherol beta-carotene and sodium tripolyphosphate on lipid oxidation of refrigerated cooked ground turkey and ground pork J Food Sci 2001 66 662-667
3 Hassan O Fan L The anti-oxidation potential of polyphenol extract from cocoa leaves on mechanically deboned chicken meat (MDCM) Lwt-Food Science and Technology 2005 38 315-321
4 Tarladgis B Dugan L Pearson A Chemistry of 2-Thiobarbituric Acid Test for Determination of Oxidative Rancidity in Foods 2 Formation of Tba-Malonaldehyde Complex without Acid-Heat Treatment J Sci Food Agric 1964 15 602-amp
5 Yu L Scanlin L Wilson J Schmidt G Rosemary extracts as inhibitors of lipid oxidation and color change in cooked turkey products during refrigerated storage J Food Sci 2002 67 582-585
6 Juntachote T Berghofer E Siebenhandl S Bauer F The antioxidative properties of Holy basil and Galangal in cooked ground pork Meat Sci 2006 72 446-456
7 Kim YJ Jin SK Park WY Kim BW Joo ST Yang HS The Effect of Garlic Or Onion Marinade on the Lipid Oxidation and Meat Quality of Pork during Cold Storage J Food Qual 2010 33 171-185
8 Chye FY Sim KY Antioxidative and Antibacterial Activities of Pangium edule Seed Extracts International Journal of Pharmacology 2009 5 285-297
9 Kahkonen M Hopia A Vuorela H Rauha J Pihlaja K Kujala T Heinonen M Antioxidant activity of plant extracts containing phenolic compounds J Agric Food Chem 1999 47 3954-3962
10 Jayaprakasha G Selvi T Sakariah K Antibacterial and antioxidant activities of grape (Vitis vinifera) seed extracts Food Res Int 2003 36 117-122
11 Fardiaz D Romlah S Antioxidant Activity of Picung (Pangium edule Reinw) Seed In Development of Food Science and Technology in ASEAN Proceedings of the 4th ASEAN Food Conference Feb 17-21 1992 ASEAN Jakarta Indonesia 1992 12 Waterhouse A L Determination of Total Phenolics Current Protocols in
Food Analytical Chemistry 2002 I111-I118
40
13 Association of Official Analytical Chemists (1995) Official methods of analysis (16th ed) Washington DC Association of Official Analytical Chemists
41
Chapter 4 RESULTS AND DISCUSSION
41 Phenolic Extraction Yield
The phenolic extract yield using acetone water acetic acid (90 95 05)
extraction was 503 plusmn 140 g of extract per 70 g of defatted ground Keluak seed or
007 g phenolic extract per gram of defatted Keluak The samples contained
approximately 719 phenolic compounds by weight the values are equal to the
average plusmn standard deviation of the three replicate analyses This value was
moderately greater than that reported by Chye and Sim (1) which reported a
548 yield The total phenolic content as determined using Folin-Ciocalteau
reagent was 1973 plusmn 203 mg GAEg extract which was also moderately greater
than the result reported by Chye and Sim which was 1639plusmn 004 mg GAEg
extract (1) It is possible that the difference is due to the Keluak source Chye and
Sim obtained their seeds material from local indigenous markets in Kota
Kinabalu Sabah Malaysia (1) while the seeds used in this study were grown in
from Indonesia The geographical and horticultural differences could affect the
phenolic content and concentration of the seed
According to Kahkonen et al (2) different phenolic compounds can have
different responses in the Folin Ciocalteau method depending on their chemical
structure Therefore the antioxidant activity of an extract cannot be predicted
solely on its total phenolic content (3 4)
42 Effect of Keluak Extract and storage time on TBARS values during
refrigerated storage of cooked ground turkey
The TBARS values represent the content of secondary lipid oxidation
products particularly malonaldehyde The carbonyls are primarily responsible
for the production of off-flavors in oxidized meat and meat products Aldehydes
are formed by the oxidation of unsaturated fatty acids They react with the TBA
reagent to form a pink complex (TBA chromogen) with a maximum absorbance
at 532 nm The intensity of this pink color is directly related to the concentration
of the TBA-reactive substances in the original sample The results of the TBARs
analysis for the preliminary study (7 days) and the extended storage study (15
days) are shown in Tables 41a b and Figures 41a b respectively Overall lipid
42
oxidation increased substantially as the refrigerated storage progressed due to
the effects of heating and in combination with storage under aerobic conditions
On the first day of analysis for both the 7 and 15 days storage study all the
antioxidant treated samples (BHT and both concentrations of the Keluak
extracts) the TBARS values were significantly lower than the control an
indication that the antioxidants had a positive effect in suppressing oxidation
Similar findings were observed by Juntachote et al and Teets et al (5 6) TBARS
values for both 7 and 15 days storage study ranges from 035- 475 mg MDA kg
meat which was comparable to other study by Juntachote (5) for 14 days of
storage study of pork meat There were examining the effect other natural
sources of antioxidants on oxidation during refrigerated storage of cooked meat
During the preliminary study (Table 41a) the control and BHT treatments
did not show significant differences (Pgt005) from day 1-7 However both of the
Keluak extract treatments showed a significant (Plt005) effect on the
suppression of the progression of lipid oxidation as compared to the control
(Figure 41a)
On the other hand during the 15 day study all the samples with added
antioxidants had significantly lower TBAR values compared to the control
throughout the entire storage period This indicates that both the commercial
treatment and the treatment with Keluak extracts provided substantial protection
to the meat with respect to lipid oxidation The efficacy of the Keluak extracts to
inhibit lipid oxidation is probably related to their phenolic content The results of
this study showed agreement with those obtained by Fardiaz and Romlah (14)
which stated that the addition of Keluak extract to palm oil lengthened the
oxidation induction period from 22 hours to 50 hours
Lipid oxidation was considerably greater with longer storage times due to
the exposure to oxygen TBARs measure the formation of secondary lipid
oxidation products which contribute to WOF in oxidized meat Heat increases the
release of non-heme iron from the heme pigments a major catalyst for lipid
oxidation in cooked meats (7) Cooking also alters cellular compartmentalization
and exposes membrane phospholipids to molecular oxygen and metal ions (8)
43
resulting in greater amounts of lipid oxidation (9) The addition of antioxidants
during processing cooking or packaging can be done to increase the oxidative
stability of cooked meat (10)
43 Effect of Keluak Extract and Storage Time on Conjugated Diene
Content during Refrigerated Storage of Cooked Ground Turkey
Meat
The development of conjugated dienes (CD) is related to the formation of
hydroperoxides found in the extracted lipids of the cooked ground turkey
Unsaturated fatty acid double bonds occur naturally in a methylene interrupted
structure As meat begins to oxidize the double bonds of these fatty acids are
altered creating conjugated systems which can be measured
spectrophotometrically (6) During lipid peroxidation non-conjugated double
bonds (C=CndashCndashC=C) which are present naturally in unsaturated lipids are
converted to conjugated double bonds (C=CndashC=C) with a large increased in
absorption at 232ndash234 nm (11) In the preliminary study there were no significant differences among the
antioxidant treated sample and the control (Pgt005) except on day 5 (Figure 42a
and Table 42a) The CD value for all the treatments peaked at day 5 and the
samples treated with antioxidants were significantly different that the control
(Plt005)
Meanwhile during the second storage study (Table 42b and Figure 42b)
when the CD values were compared to the control on day 0 and day 1 the 002
BHT and both of the Keluak extract treated samples were not significantly
different (Pgt005) However from day 3 on all the antioxidant-treated samples
had less CD formation than the control (Plt005) The CD content of the control
generally increased especially during the last 5 days (Day 10 13 and 15) of the
study Additionally cooked ground turkey treated with Keluak at 400 ppm had
slightly lower concentrations of conjugated dienes compared to cooked ground
turkey containing Keluak extract at 200 ppm and the commercial antioxidant
(BHT) The trend of CD formation was similar to several other studies (5 6 12
13) They generally observed that the CD concentration for most samples peaked
44
on Day 3 and decreased thereafter This phenomenon of decreased CD is likely
due to the decomposition of the conjugated diene hydroperoxides into secondary
oxidation products over time Conjugated dienes hydroperoxides are expected to
decompose into secondary products as was observed in this study According to
Frankel (15) the formation of conjugated dienes which is related to the
production of hydroperoxides occurs in the early stages of lipid oxidation According to Estevez et al (17) measurement of conjugated dienes (CD) in
meat products containing elevated levels of PUFA is limited depending on the
fatty acid composition of the sample as well as the presence of other non-
hydroperoxides CDs In agreement with Grau et al (18) the TBA test showed a
higher sensitivity with respect to lipid oxidation than did the CD determination
44 Effect of Keluak extract and storage time on peroxide value during
refrigerated storage of cooked ground turkey
Peroxide values (PV) were also used to assess the level of lipid oxidation in
cooked ground turkey during storage at 2˚C (Table 43 and Figure 43) However
while there were differences between the control and samples treated with AOs
on a few days the result of this study showed that treatments had no significant
effect (Pgt005) on the peroxide values compared to the control Generally based
on the results in Table 4 and Figure 4 the PVs increased during storage and
peaked on day 10 At the time it is possible that much of the polyunsaturated
membrane lipids may have been oxidized at that point so that further storage
and oxidation resulted in a decrease in the concentration of peroxides and thus
the PV
The PV differences among the samples did not provide proof that any of
the AOs were effective It is not clear why the PV analysis did not provide any
evidence of AO efficacy According to Estevez (17) the sensitivity of this method
is about 05 miliEquivalentkg of lipid Lower peroxide values cannot be
measured satisfactorily by the AOCS method because of the uncertainty with the
iodometric titration endpoint unless the iodine-starch end is determined
potentiometrically at levels as low as 006 Eqkg lipid The iodometric method is
highly empirical and very small procedural differences can cause variation in the
45
results (19) Two major sources of error in this test could be the liberation of
iodine by air oxidation of the KI and absorption of iodine by fatty acid double
bonds (17)
4 5 Effect of Keluak Extract and storage time on Odor of Refrigerated
Cooked Ground Turkey
No significant interaction (Pgt 005) occurred between antioxidant and
storage time for most of the odor characteristics (Tables and Figures 44-48)
For meaty odor characteristic (Figure and Table 44) the score of all the
treatments over the 7 days of storage did not show significant differences
(Pgt005) The scores ranged from 502 ndash 783 which was slightly below the
freshly boiled turkey meat standard for meaty (which was ranked 8 in the 15-cm
line scale) Therefore the panelists were unable to score and detect the cooked
meat aroma differences in the treated samples relative to the standard reference
The meaty aroma in this study was used to determine if there were possible
masking effects from the AO treatments
For the rancid odor (Figure and Table 45) both of the Keluak treated
samples were perceived as more rancid than both control and BHT after day 1
Overall both of the Keluak treated samples were ranked higher than the control
and BHT which disagrees with the results of TBA test However there was no
significant difference among the treatments between day 3-7 According to Ruth
(20) rancidity as a measure of lipid oxidation is usually best measured by the
concentration of TBARS
The minimum TBA values that corresponds to dark chicken meat samples
that were significantly different in rancid aroma was 1933 μg MDAkg of meat
(21) For consumer acceptability the TBA values must be less than 785 μg of
MDAkg (21) The results from Bou et al (21) were comparable to the results
reported by Gray and Pearson (22) showing that rancid flavor in meats is initially
detected between 500 and 2000 μg of MDAkg of meat In addition OrsquoNeill et
al (23) found that the threshold for WOF detection in cooked dark chicken meat
was at TBA values ge800 μg of MDAkg of meat Since chicken and turkey meat
46
have a comparable PUFA content those values were considered useful in this
experiment On the other hand the odor score for Eggy cardboard and fatty were
statistically not different (Pgt 005) Panelists were unable to detect differences
which could be to different reasons such as that Keluak extract has an aroma
masking effect that confuses the panelists with the ldquooff-odorrdquo The Keluak did
have a slight aroma and it is likely that it masked the effects of storage on lipid
oxidation The aroma of Keluak has been described as bitter dirt-like and
chocolate-like odor (16) This aroma masking could be perceived as undesirable
by the panelists and it might have been mistaken as an off-odor or as an oxidized
sample even though the TBARs and CD data showed otherwise
4 6 Effect of Keluak Extract and storage time on pH of Refrigerated
Cooked Ground Turkey
Table 49 shows the effect of antioxidant treatments in pork muscle on pH
values during storage at 2˚C The values of the pH ranged between 633-668
Generally there are no correlations of pH value among the treatments during
storage The trend for the pH value is inconclusive
47
47 Figures Figure 41a The profile of TBARS in cooked ground turkey treated with various
antioxidants during storage at 2˚C- A Preliminary Study
K200 and K400 represent treatments with Keluak extract at concentration of 200 and 400 ppm respectively
0000
1000
2000
3000
4000
5000
6000
0 2 4 6 8
TBA
RS
(mg
MD
Ak
g m
eat
)
Storage Days
Control
BHT
K200
K400
48
Figure 41b The profile of TBARS in Cooked Ground Turkey Treated with Various Antioxidants During Storage at 2˚C- Extended Storage Time
K200 and K400 represent Keluak extract at concentration of 200 and 400 ppm respectively
Figure 42a Conjugated dienes values of different antioxidant treatments over storage at
2˚C - A Preliminary Study
K200 and K400 represent treatments with Keluak extract at concentration of 200 and 400 ppm
respectively
000
100
200
300
400
500
600
0 5 10 15 20
TBA
RS
(mg
MD
Ak
g m
eat
)
Storage time (days)
Control
BHT 002
K200
K400
0000
0050
0100
0150
0200
0250
0300
0350
0400
0450
0 1 2 3 4 5 6 7 8
Co
nju
gate
d D
ien
es
(nm
ol
mg
me
at)
Days
Control
BHT
K200
K400
49
Figure 42b Conjugated dienes values of different antioxidant treatments over storage at
2˚C- Extended Storage Time
K200 and K400 represent treatments with Keluak extract at concentration of 200 and 400 ppm respectively
Figure 43 Peroxide Value (meq kg meat) of Different Antioxidant treatments over
Storage at 2˚C
K200 and K400 represent treatments with Keluak extract at concentration of 200 and 400 ppm
respectively
000
002
004
006
008
010
012
014
016
0 5 10 15 20
Co
nju
gate
d D
ien
es
(nm
ol
mg
me
at)
Storage (days)
Control
BHT 002
K200
K400
0
05
1
15
2
25
3
35
4
0 2 4 6 8 10 12 14 16
PV
(m
eq
kg
me
at)
Storage Time (Days)
Control
BHT 002
K200
K400
50
Figure 44 Intensity of Meaty Odor Descriptor in Cooked Ground Turkey Meat Treated
with Different Antioxidants Rated in a 15-cm Line Scale
K200 and K400 represent Treatment with Keluak extract at concentration of 200 and 400 ppm
respectively
Figure 45 Intensity of Rancid Odor Descriptor in Cooked Ground Turkey Meat Treated
with Different Antioxidants Rated in a 15-cm Line Scale
K200 and K400 represent Treatment with Keluak extract at concentrations of 200 and 400 ppm
respectively
000
200
400
600
800
1000
1200
0 2 4 6 8
15
cm
Lin
e s
cale
(av
era
ge)
Days
CONTROL
BHT
K200
K400
Linear (BHT)
-100
000
100
200
300
400
500
600
700
800
0 2 4 6 8
15
cm
Lin
e s
cale
(av
era
ge)
Days
Control
BHT
K200
K400
51
Figure 46 Intensity of Eggy Odor Descriptor in Cooked Ground Turkey Meat Treated
with Different Antioxidants Rated in a 15-cm Line Scale
K200 and K400 represent Treatment with Keluak extract at concentrations of 200 and 400 ppm
respectively
Figure 47 Intensity of Cardboard Odor Descriptor in Cooked Ground Turkey Meat
Treated with Different Antioxidants Rated in a 15-cm Line Scale
K200 and K400 represent Treatment with Keluak extract at concentrations of 200 and 400 ppm
respectively
000
100
200
300
400
500
600
700
800
900
1000
0 2 4 6 8
15
cm
Lin
e s
cale
(av
era
ge)
Days
Control
BHT
K200
K400
-1
0
1
2
3
4
5
6
7
0 2 4 6 8
15
cm
Lin
e s
cale
(av
era
ge)
Days
Control
BHT
K200
K400
52
Figure 48 Intensity of Fatty Odor Descriptor in Cooked Ground Turkey Meat Treated
with Different Antioxidants Rated in a 15-cm Line Scale
K200 and K400 represent Treatment with Keluak extract at concentrations of 200 and 400 ppm
respectively
000
100
200
300
400
500
600
700
800
900
0 2 4 6 8
15
cm
Lin
e s
cale
(av
era
ge)
Days
Control
BHT
K200
K400
53
48 Tables
Table 41a TBARS Value of Cooked Ground Turkey Meat Treated with Various Antioxidants during Storage at 2˚C- A Preliminary Study
TBARS (mg MDAkg meat) Average
Storage (Day) Control BHT 002 Keluak 200ppm Keluak 400ppm
0
131plusmn009Aa 094plusmn021Ba 050plusmn004Ca 037plusmn010Ca
1
189plusmn003Aab 161plusmn025Aab 080plusmn006Ba 057plusmn026Bab
3
243plusmn010Ac 236plusmn025Abc 111plusmn022Bab 055plusmn008Cab
5
397plusmn016Ad 319plusmn064Acd 170plusmn025Bbc 108plusmn023Bb
7
473plusmn076Ad 373plusmn074ABd 217plusmn040ACc 101plusmn044Cab
Different letters (A-D) within a row indicates that mean values are significantly different (Plt 005) Different letters within a column (a-d) within the same treatment are significantly different (Plt005)
Table 41b TBARS Value of Cooked Ground Turkey Meat Treated with Various Antioxidants during Storage at 2 ˚C- Extended Storage Time
TBARS (mg MDAkg meat) Average
Storage (day) Control BHT 002 K200 K400
0 129 plusmn 008Ae 091plusmn 004Bcd 065plusmn 015Be 101plusmn 003Cf
1 159plusmn 008Ade 076plusmn 005Cd 083plusmn 012Ce 127plusmn 006Bf
3 220plusmn 011Acd 074plusmn 004Dd 119plusmn 003Cd 160plusmn 004Be
5 258plusmn 014Ac 082plusmn 006Cd 076plusmn 014Ce 150plusmn 004Bd
7 377plusmn 001Ab 109plusmn 002Ccb 158plusmn 006Bc 160plusmn 006Bd
10 405plusmn 061Aab 121plusmn 009Bb 197plusmn 012Bb 195plusmn 009Bc
13 465plusmn 014Aa 151plusmn 004Ca 224plusmn 003Bab 218plusmn 003Bb
15 459plusmn 024Aa 154plusmn 013Da 231plusmn 014Ca 284plusmn 010Ba
Different letters (A-D) within a row indicates that mean values are significantly different (Plt 005) Different letters within a column (a-f) within the same treatment are significantly different (Plt005)
K200 and K400 represent treatments with Keluak extract at concentration of 200 and 400 ppm
respectively
54
Table 42a Conjugated Dienes Concentrations with Antioxidant Treatments and Storage
At 2˚C- A Preliminary Study
Conj Dienes (nmolemg meat)
Storage (Days) Control BHT 002 K200 K400
0 015plusmn003Abc 022plusmn001Aa 013plusmn001Ab 020plusmn008Aa
1 012plusmn001Abc 012plusmn003Ab 011plusmn001Ab 019plusmn001Bab
3 006plusmn000Ac 003plusmn002Ac 002plusmn002Ab 004plusmn002Ab
5 038plusmn000Aa 024plusmn001Ba 027plusmn007ABa 021plusmn001Ba
7 023plusmn008Ab 026plusmn001Aa 029plusmn003Aa 016plusmn001Aab
Different letters (A-C) within a row indicates that mean values are significantly different (Plt 005) Different letters within a column (a-d) within the same treatment are significantly different (Plt005)
K200 and K400 represent treatments with Keluak extract at concentration of 200 and 400 ppm
respectively
Table 42b Conjugated Dienes Concentrations After Antioxidant Treatments and
Storage At 2˚C- Extended Storage Time
Conjugated Dienes (nM mg meat)
Storage (Days) Control BHT 002 K200 K400
0 013plusmn 001Aab 009plusmn000Bab 010plusmn 000Ba 010plusmn 001Ba
1 008plusmn 001Ac 008plusmn 001Ab 008plusmn 000Abc 007plusmn 001Ab
3 011plusmn 000Ab 009plusmn 001Bab 008plusmn 000Bbc 006plusmn 000Cb
5 012plusmn001Ab 008plusmn 001B b 006plusmn 000Bd 006plusmn 000Bb
7 011plusmn001Abc 008plusmn 000B ab 006plusmn 001Bcd 007plusmn 000Bb
10 014plusmn 000Aa 009plusmn 000Bab 009plusmn 001Bab 007plusmn 000Cb
13 014plusmn 001Aa 009plusmn 000Bab 008plusmn 000Bbc 006plusmn 000Cb
15 014plusmn 000Aa 010plusmn 001Ba 008plusmn 001BCbcd 007plusmn 000Cb
Different letters (A-C) within a row indicates that mean values are significantly different (Plt 005) Different letters within a column (a-d) within the same treatment are significantly different (Plt005)
K200 and K400 represent treatments with Keluak extract at concentration of 200 and 400 ppm
respectively
55
Table 43 Peroxide Value (meq kg meat) of Different Antioxidant treatments during
Storage of cooked ground turkey meat at 2˚C
PV (meq kg meat)
Storage (Days) Control BHT 002 K200 K400
0 110plusmn 042Abc 070plusmn 014Ae 080plusmn 028Ad 130plusmn 014Acd
1 230plusmn 014Aab 130plusmn 014Bd 090plusmn 014BCd 070plusmn 014Cd
3 080plusmn 000Ac 070plusmn 014Ae 070plusmn 014Ad 070plusmn 014Ad
5 280plusmn 028Aa 140plusmn 000Bcd 110plusmn 014Bcd 080plusmn 028Bd
7 170plusmn 042Aabc 190plusmn 014Ac 195plusmn 021Abc 225plusmn 049Abc
10 310plusmn 042Aa 330plusmn 014Aa 290plusmn 042Aa 340plusmn 028Aa
13 255plusmn 007Aa 265plusmn 021Ab 240plusmn 028Aab 260plusmn 028Aab
15 255plusmn 064Aa 150plusmn 014ABcd 086plusmn 006Bd 100plusmn 028Bd
Different letters (A-C) within a row indicates that mean values are significantly different (Plt 005) Different letters within a column (a-e) within the same treatment are significantly different (Plt005)
K200 and K400 represent Treatment with Keluak extract at concentrations of 200 and 400 ppm
respectively
Table 44 Intensity of Meaty Odor Descriptor in Cooked Ground Turkey Meat Treated with Different Antioxidants Rated in a 15-cm Line Scale
Storage (Day) Control BHT 002 K200 K400
0 595plusmn250Aa 727plusmn144Aa 632plusmn202Aa 606plusmn189Aa
1 783plusmn208Aa 731plusmn174ABa 543plusmn220Ba 542plusmn294Ba
3 613plusmn201Aa 693plusmn143Aa 502plusmn266Aa 552plusmn228Aa
5 734plusmn277Aa 710plusmn290Aa 474plusmn253Aa 487plusmn263Aa
7 694plusmn296Aa 751plusmn265Aa 532plusmn259Aa 543plusmn236Aa
Different letters (A-C) within a row indicates that mean values are significantly different (Plt 005) Different letters within a column (a-b) within the same treatment are significantly different (Plt005)
K200 and K400 represent Treatment with Keluak extract at concentrations of 200 and 400 ppm
respectively
56
Table 45 Intensity of Rancid Odor Descriptor in Cooked Ground Turkey Meat Treated
with Different Antioxidants Rated in a 15-cm Line Scale
Storage (Day) Control BHT 002 K200 K400
0 228plusmn194Aa 193plusmn175Aa 334plusmn231Aa 350plusmn274Aa
1 177plusmn194Aa 172plusmn163Aa 392plusmn274ABa 426plusmn265Ba
3 260plusmn210Aa 272plusmn265Aa 419plusmn306Aa 337plusmn247Aa
5 344plusmn255Aa 329plusmn215Aa 427plusmn248Aa 395plusmn253Aa
7 408plusmn300Aa 289plusmn244Aa 448plusmn241Aa 385plusmn244Aa
Different letters (A-B) within a row indicates that mean values are significantly different (Plt 005) Different letters within a column (a-b) within the same treatment are significantly different (Plt005)
K200 and K400 represent Treatment with Keluak extract at concentrations of 200 and 400 ppm
respectively
Table 46 Intensity of Eggy Odor Descriptor in Cooked Ground Turkey Meat
Treated with Different Antioxidants Rated in a 15-cm Line Scale
Storage (Day) Control BHT 002 K200 K400
0 643plusmn242Aa 513plusmn244Aa 502plusmn324Aa 565plusmn287Aa
1 597plusmn248Aab 476plusmn321Aa 599plusmn332Aa 584plusmn360Aa
3 345plusmn258Ab 400plusmn270Aa 515plusmn335Aa 509plusmn425Aa
5 364plusmn303Aab 424plusmn320Aa 475plusmn269Aa 469plusmn180Aa
7 473plusmn306Aab 364plusmn210Aa 485plusmn268Aa 431plusmn305Aa
Different letters (A-C) within a row indicates that mean values are significantly different (Plt 005) Different letters within a column (a-e) within the same treatment are significantly different (Plt005)
K200 and K400 represent Treatment with Keluak extract at concentrations of 200 and 400 ppm
respectively
57
Table 47 Intensity of Cardboard Odor Descriptor in Cooked Ground Turkey Meat
Treated with Different Antioxidants Rated in a 15-cm Line Scale
Storage (Day) Control BHT 002 K200 K400
0 299plusmn222Aa 209plusmn182Aa 261plusmn198Aa 312plusmn157Aa
1 262plusmn249Aa 180plusmn192Aa 339plusmn238Aa 342plusmn229Aa
3 299plusmn203Aa 284plusmn254Aa 388plusmn235Aa 287plusmn185Aa
5 252plusmn243Aa 290plusmn190Aa 309plusmn193Aa 320plusmn204Aa
7 301plusmn210Aa 273plusmn253Aa 337plusmn195Aa 284plusmn205Aa
Different letters (A-C) within a row indicates that mean values are significantly different (Plt 005) Different letters within a column (a-e) within the same treatment are significantly different (Plt005)
K200 and K400 represent Treatment with Keluak extract at concentrations of 200 and 400 ppm
respectively
Table 48 Intensity of Fatty Odor Descriptor in Cooked Ground Turkey Meat Treated with Different Antioxidants Rated in a 15-cm Line Scale
Storage (Day) Control BHT 002 K200 K400
0 344plusmn226aA 350plusmn256aA 395plusmn309aA 395plusmn277aA
1 417plusmn285aA 389plusmn230aA 401plusmn345aA 438plusmn287aA
3 388plusmn220aA 378plusmn229aA 396plusmn328aA 403plusmn285aA
5 479plusmn252aA 461plusmn293aA 389plusmn255aA 428plusmn320aA
7 460plusmn288aA 492plusmn286aA 426plusmn281aA 428plusmn340aA
Different letters (A-C) within a row indicates that mean values are significantly different (Plt 005) Different letters within a column (a-e) within the same treatment are significantly different (Plt005)
K200 and K400 represent Treatment with Keluak extract at concentrations of 200 and 400 ppm
respectively
58
Table 49 pH Values of Cooked Ground Turkey Treated with Different
Antioxidants Stored at 2˚C
pH Value
Storage (Day) Control BHT 002 K200 K400
0 665plusmn 002Aab 644plusmn 003Bbc 646plusmn 004Bbc 658plusmn 003Aab
1 659plusmn 003Ab 643plusmn 003Cbc 651plusmn 001Babc 662plusmn 001Aab
3 645plusmn 003Bc 634plusmn 002Cd 643plusmn 004Bc 654plusmn 000Ab
5 663plusmn 002Aab 640plusmn 002Cc 645plusmn 004Cc 654plusmn 002Bb
7 647plusmn 001Ac 633plusmn 003Bc 648plusmn 004Aabc 646plusmn 006Ac
10 665plusmn 001Aab 646plusmn 002Dbc 654plusmn 001Cab 660plusmn 003Bab
13 665plusmn 002Aab 648plusmn 002Cab 655plusmn 002Ba 664plusmn 002Aa
15 668plusmn 001Aa 651plusmn 001Da 655plusmn 001Ca 663plusmn 001Ba
Different letters (A-D) within a row indicates that mean values are significantly different (Plt 005) Different letters within a column (a-c) within the same treatment are significantly different (Plt005)
K200 and K400 represent treatments with Keluak extract at concentrations of 200 and 400 ppm
respectively
59
49 References
1 Chye FY Sim KY Antioxidative and Antibacterial Activities of Pangium edule Seed Extracts International Journal of Pharmacology 2009 5 285-297
2 Kahkonen M Hopia A Vuorela H Rauha J Pihlaja K Kujala T Heinonen M Antioxidant activity of plant extracts containing phenolic compounds J Agric Food Chem 1999 47 3954-3962
3 Jayaprakasha G Selvi T Sakariah K Antibacterial and antioxidant activities of grape (Vitis vinifera) seed extracts Food Res Int 2003 36 117-122
4 Gray J Macdonald B Pearson A Morton I Role of Nitrite in Cured Meat Flavor - a Review J Food Prot 1981 44 302-amp
5 Juntachote T Berghofer E Siebenhandl S Bauer F The antioxidative properties of Holy basil and Galangal in cooked ground pork Meat Sci 2006 72 446-456
6 Teets AS Were LM Inhibition of lipid oxidation in refrigerated and frozen salted raw minced chicken breasts with electron beam irradiated almond skin powder Meat Sci 2008 80 1326-1332
7 Han D McMillin K Godber J Bidner T Younathan M Marshall D Hart L Iron Distribution in Heated Beef and Chicken Muscles J Food Sci 1993 58 697-700
8 Ahn D Wolfe F Sim J Prevention of Lipid Oxidation in Precooked Turkey Meat Patties with Hot Packaging and Antioxidant Combinations J Food Sci 1993 58 283-287
9 Asghar A Gray J Buckley D Pearson A Booren A Perspectives on Warmed-Over Flavor Food Technol 1988 42 102-108
10 Kingston E Monahan F Buckley D Lynch P Lipid oxidation in cooked pork as affected by vitamin E cooking and storage conditions J Food Sci 1998 63 386-389
11 Kulas E Ackman R Different tocopherols and the relationship between two methods for determination of primary oxidation products in fish oil J Agric Food Chem 2001 49 1724-1729
12 Srinivasan S Xiong Y Decker E Inhibition of protein and lipid oxidation in beef heart surimi-like material by antioxidants and combinations of pH NaCl and buffer type in the washing media J Agric Food Chem 1996 44 119-125
13 Lee M Choi J Choi Y Han D Kim H Shim S Chung H Kim C The antioxidative properties of mustard leaf (Brassica juncea) kimchi extracts on
60
refrigerated raw ground pork meat against lipid oxidation Meat Sci 2010 84 498-504
14 Fardiaz D Romlah S Antioxidant Activity of Picung (Pangium edule
Reinw) Seed In Development of Food Science and Technology in ASEAN
Proceedings of the 4th ASEAN Food Conference Feb 17-21 1992 ASEAN
Jakarta Indonesia 1992
15 Frankel E N Lipid oxidation Dundee Scotland The Oily Press Ltd 1998 Vol 10 pp 13ndash41 16 Ma Amy A Peranakan favorite is ayam buah keluak Chicken stewed with black nuts at True Blue Restaurant Wall Street Journal (Online) New York NY Dec 16 2010 Retrieved July 20 2011 from httpproquestumicompqdwebdid=2214039511ampsid=1ampFmt=3ampclientId=36305ampRQT=309ampVName=PQD
17 Esteacutevez M Morcuende D and Ventanas S Determination of Oxidation
Nollet Leo M LToldraacute Fidel (Eds) Handbook of Muscle Foods Analysis Boca
Raton CRC Press 2009 221-240
18 Grau A Codony R Rafecas M Barroeta A Guardiola F Lipid
hydroperoxide determination in dark chicken meat through a ferrous oxidation-
xylenol orange method J Agric Food Chem 2000 48 4136-4143
19 Shahidi F Janitha P Wanasundara P Phenolic Antioxidants Crit Rev Food Sci Nutr 1992 32 67-103
20 Ruth SM Techniques for sampling and identification of volatile compounds contributing to sensory perception In Nollet Leo M LToldraacute Fidel (Eds) Handbook of Muscle Foods Analysis Boca Raton CRC Press 2009 503-523
21 Bou R Guardiola F Grau A Grimpa S Manich A Barroeta A Codony R Influence of dietary fat source alpha-tocopherol and ascorbic acid supplementation on sensory quality of dark chicken meat Poult Sci 2001 80 800-807
22 Gray J I and A M Pearson Rancidity and warmed over flavour In Pearson A M and Dutson T R (Eds) Advances in Meat Research Vol 3 Nostrand-Reinbold Co New York NY 1987 221ndash269 23 OrsquoNeill L M K Galvin P A Morrissey and D J Buckley Comparison of effects of dietary olive oil tallow and vitamin E on the quality of broiler meat and meat products Br Poult Sci 1998 39 365ndash371
61
Chapter 5 CONCLUSION AND FUTURE WORK
The results of the present study indicated that the Keluak extract
incorporated into cooked ground turkey can reduce lipid oxidation The addition
of Keluak extracts at 200 and 400 ppm had a positive effect on reducing the
TBAR values and the conjugated dienes content compared to the control without
added AOs during storage at 2˚C for 15 days The Keluak extract used in this
study was comparable to BHT (002) in reducing lipid oxidation in meat
Peroxide value analysis did not differentiate between the control and the
treatments on the extent of lipid oxidation Due to confusion of the odor
components in the Keluak extracts by the panelists there were no significant
differences between the treatments in the odor sensory evaluation
Keluak seed is a culinary spice with no known toxic effect Its moderate
pungent aroma makes it valued as a traditional ethnic food flavorant in parts of
South East Asia With its substantial phenolic content and antioxidant properties
it could be an effective source of natural antioxidants However the application
of this natural antioxidant might be limited in Western cultures due to its effect
on the color and odor of meat products Further investigations are needed to
identify selective extraction and clean-up techniques that could be used to
eliminate the color and odor problem Other chemical analysis methods that
might provide better information on the extent of oxidation in meat products
include the p-anisidine value Food Oil Sensor (FOS) and Gas chromatography
techniques (GC analysis) of selected volatiles
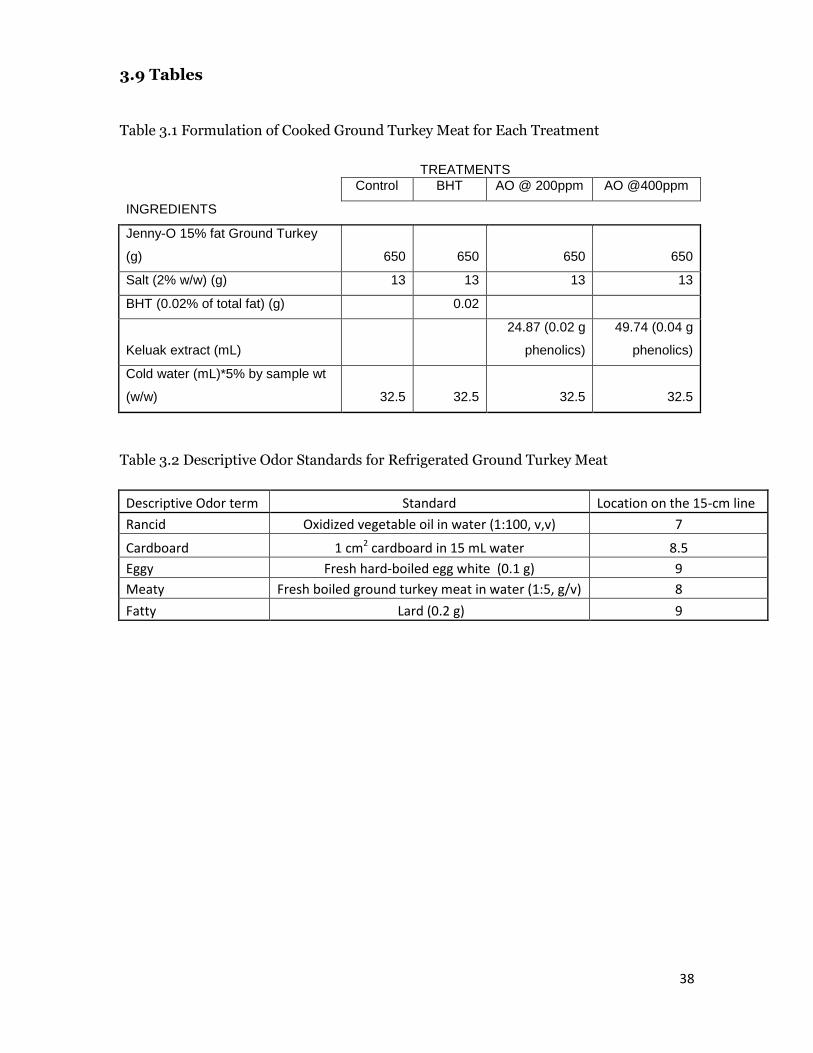
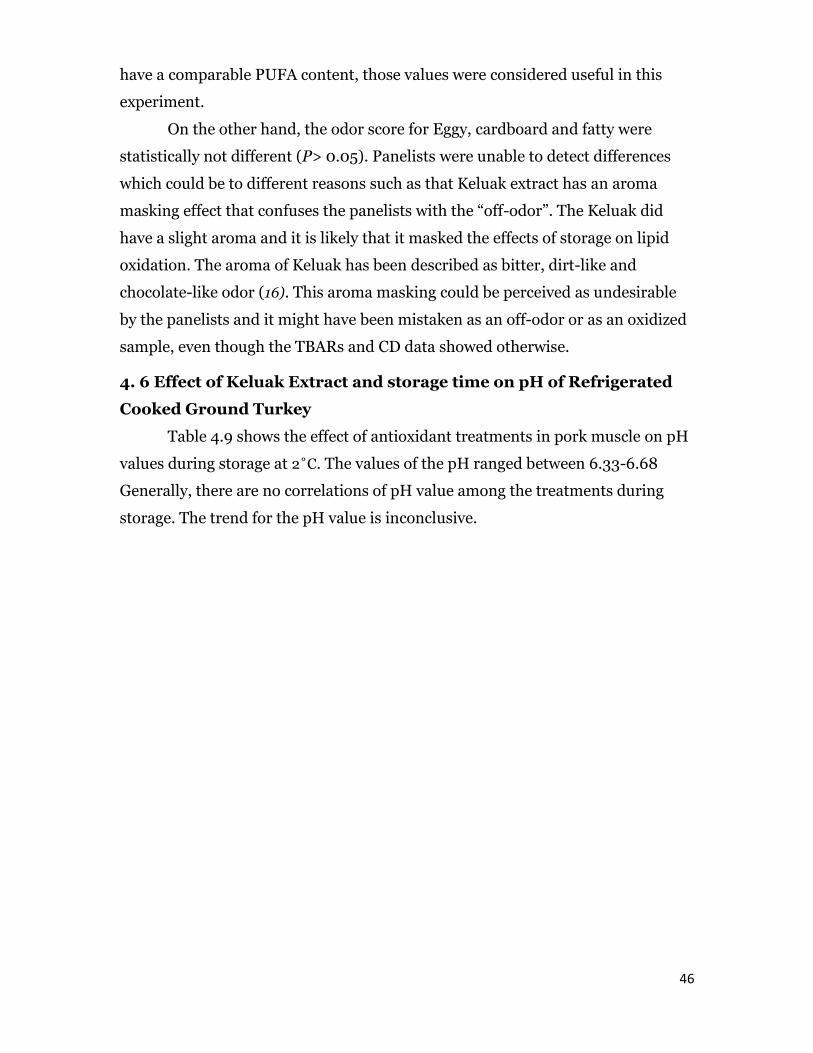
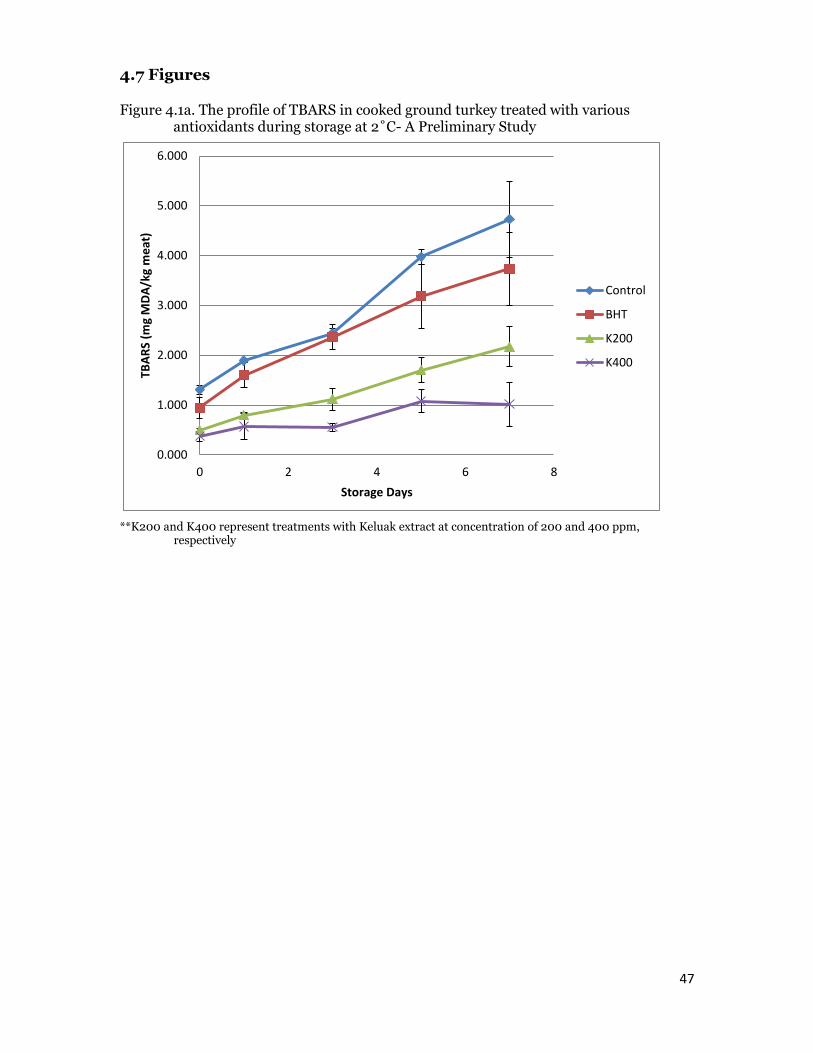
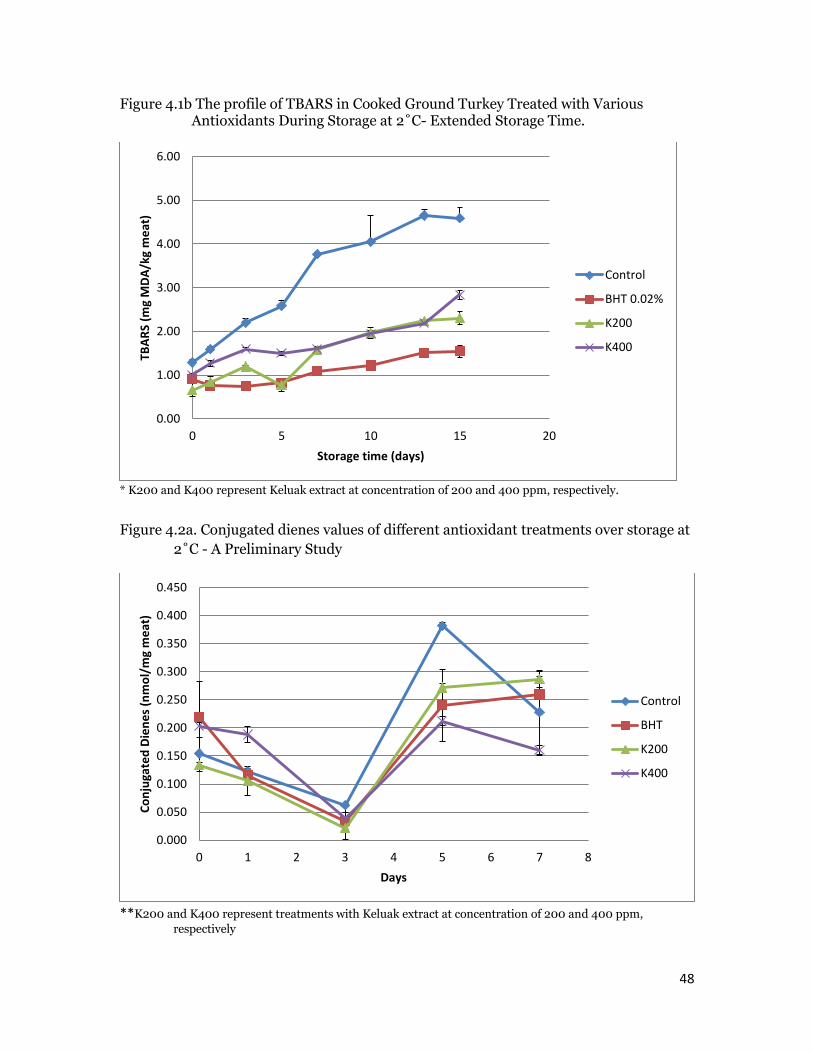
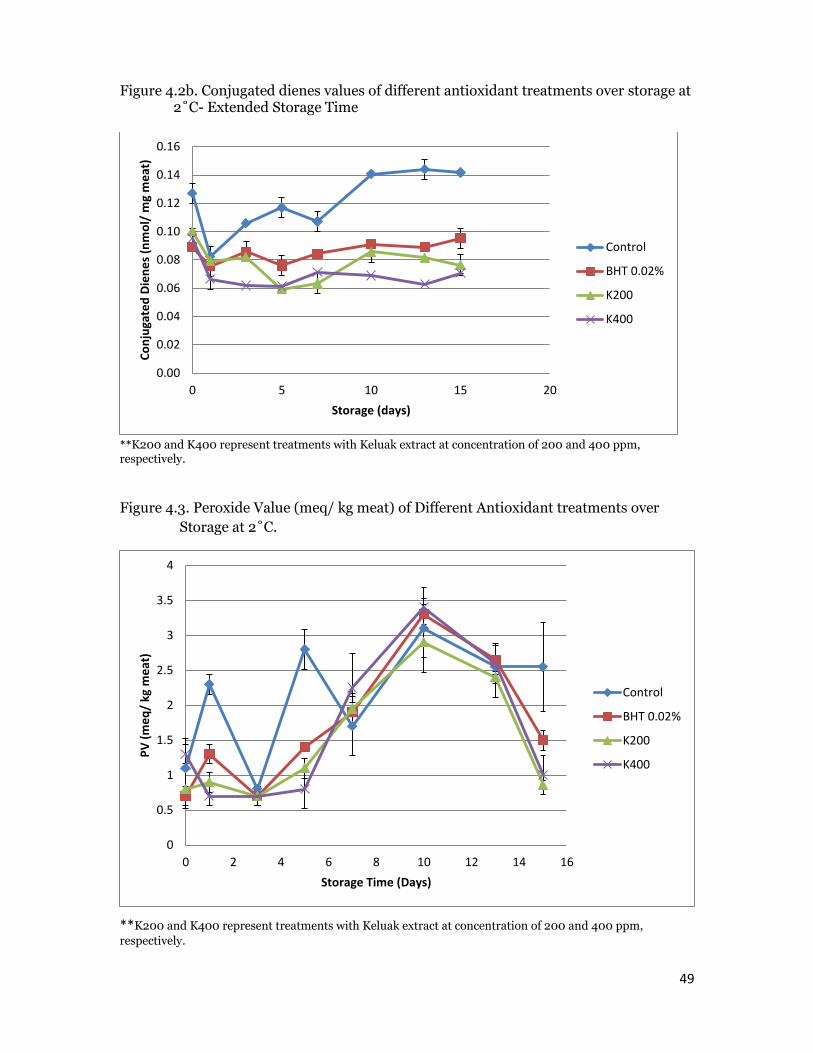
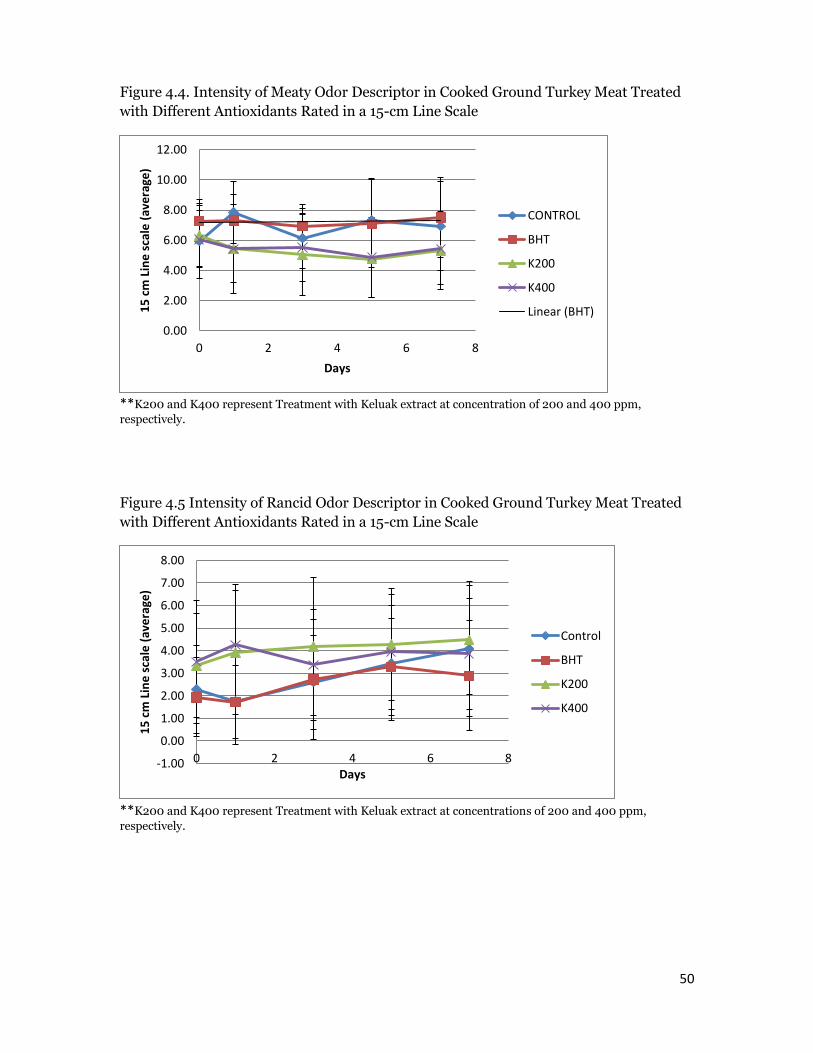
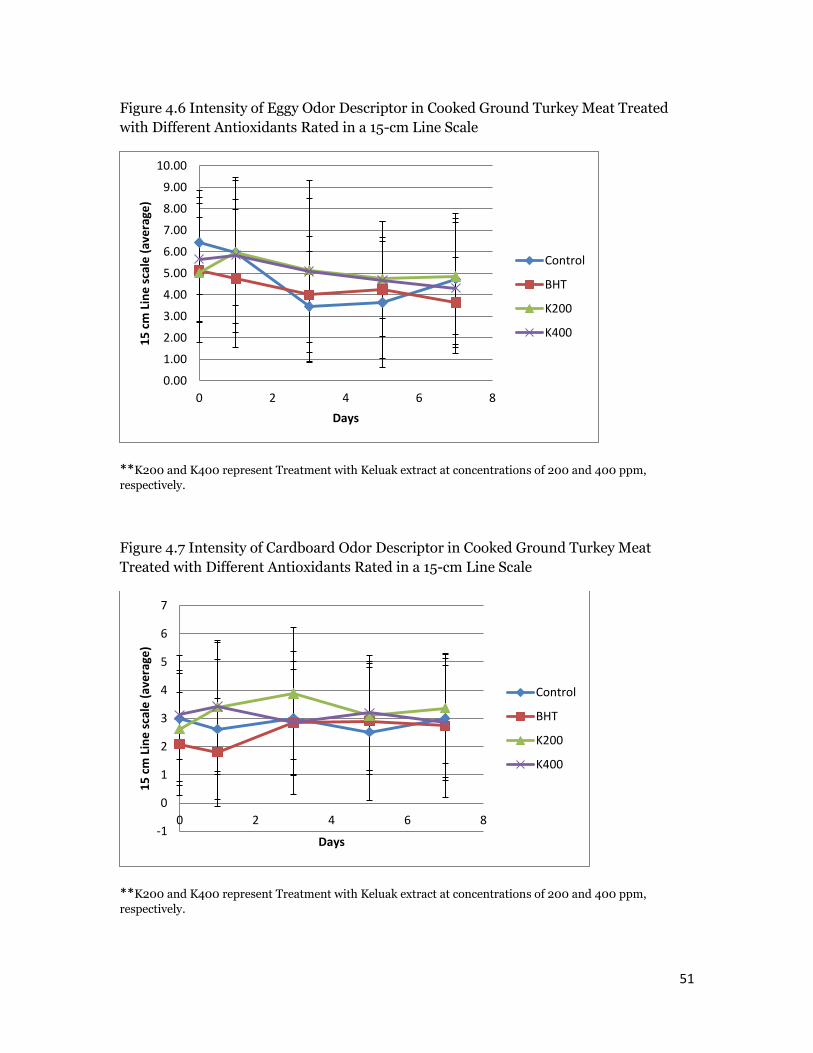
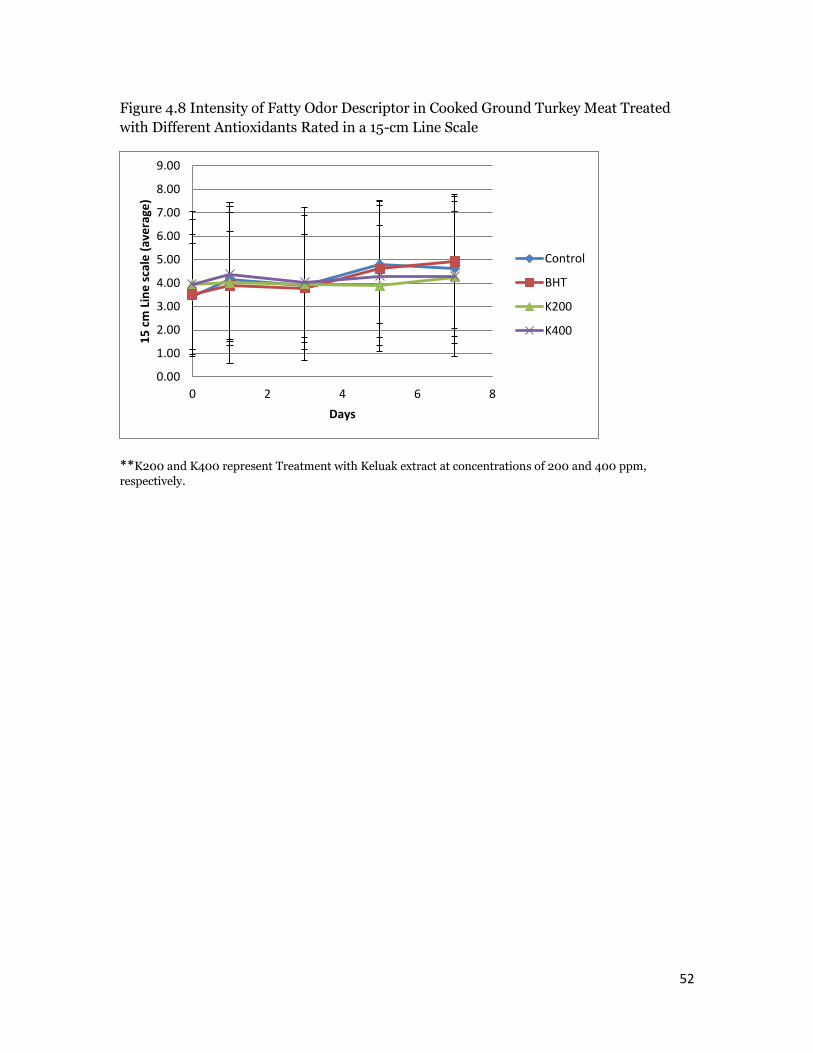
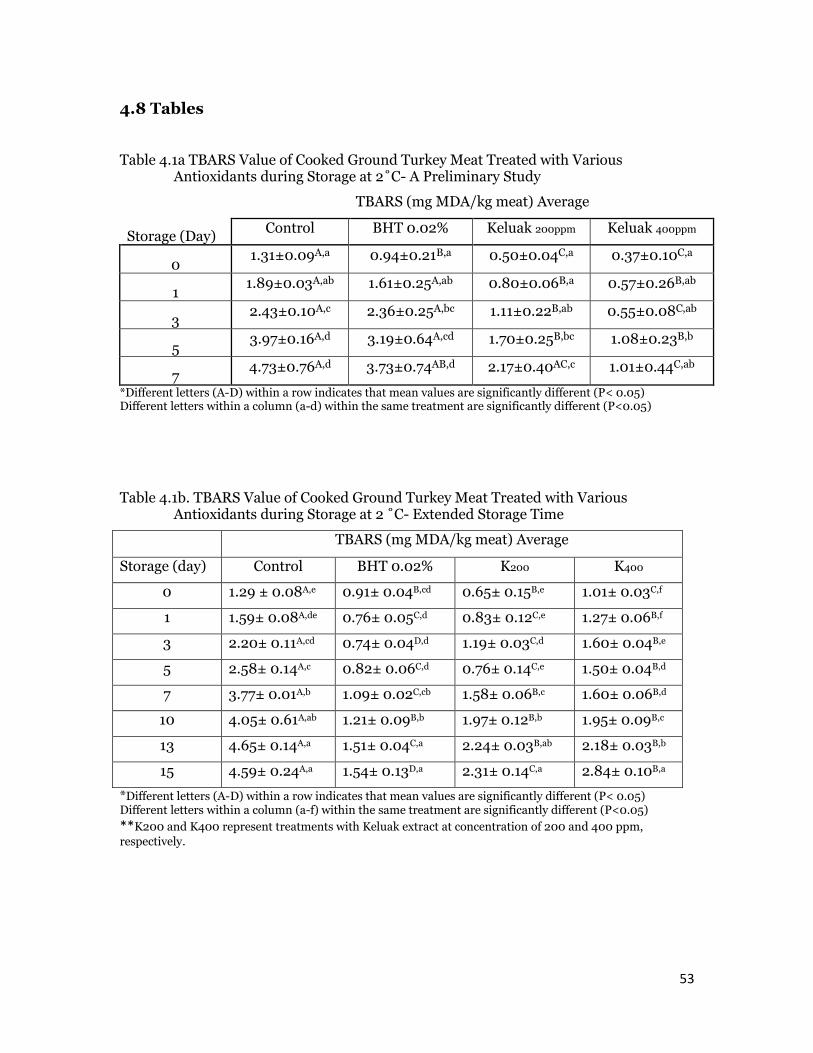
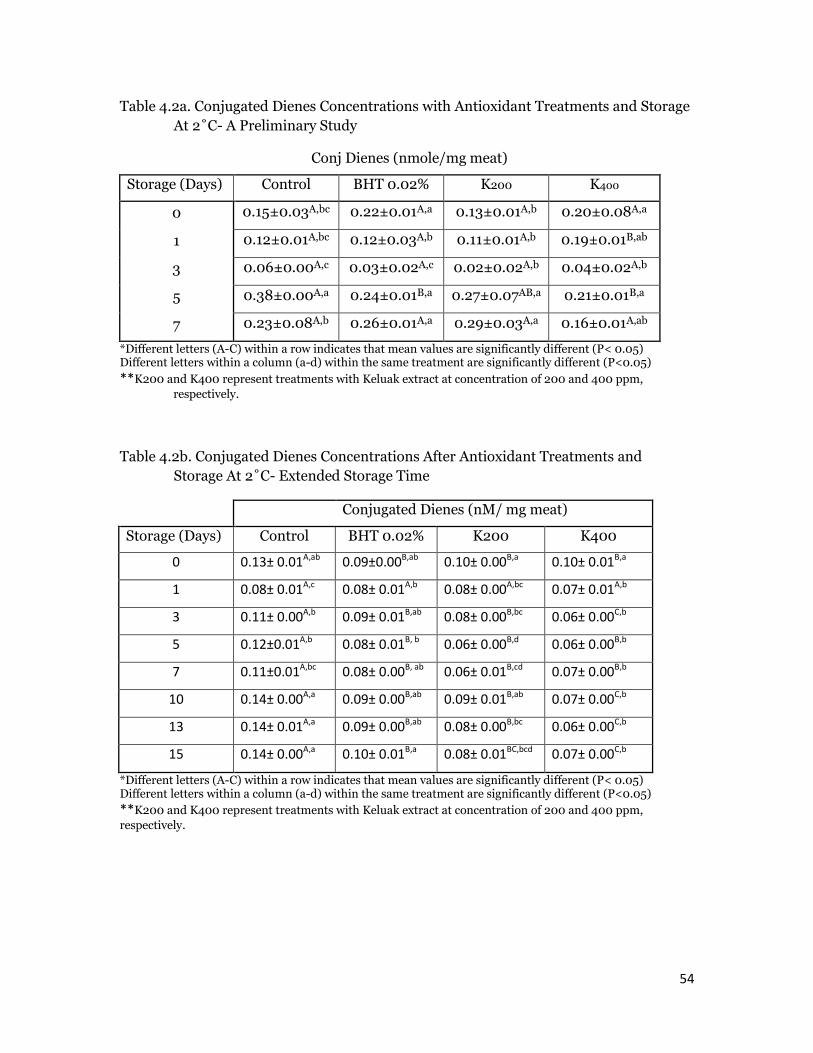
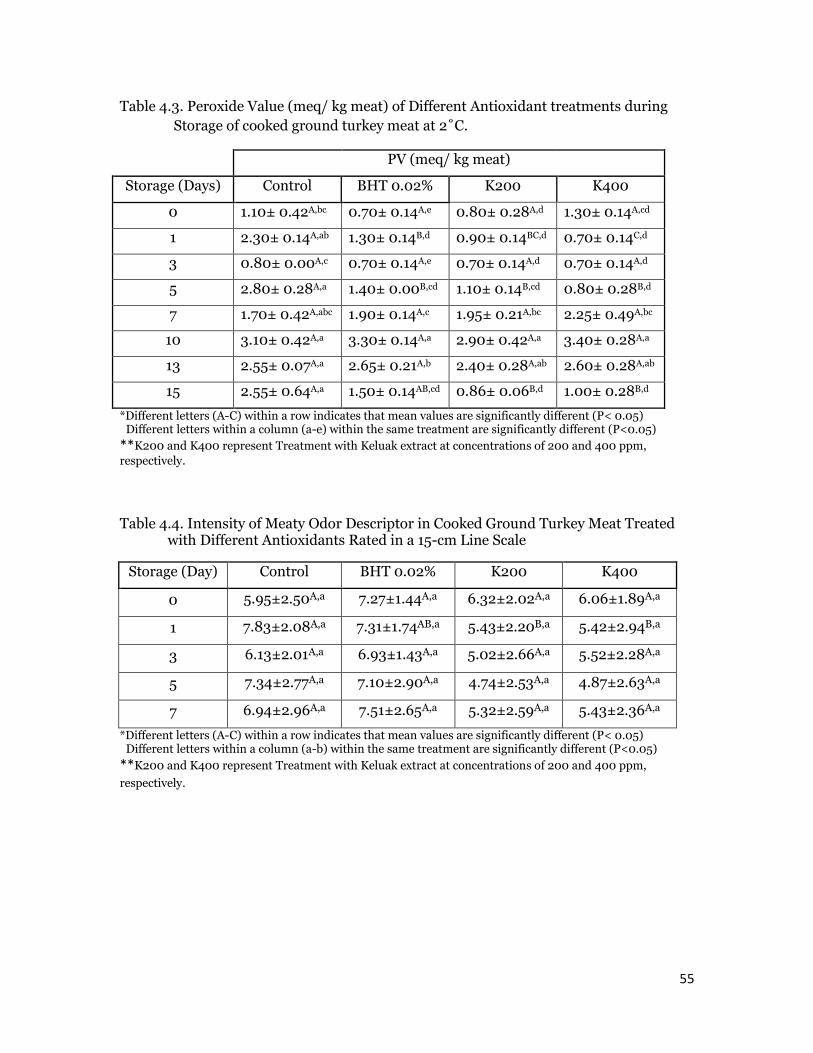
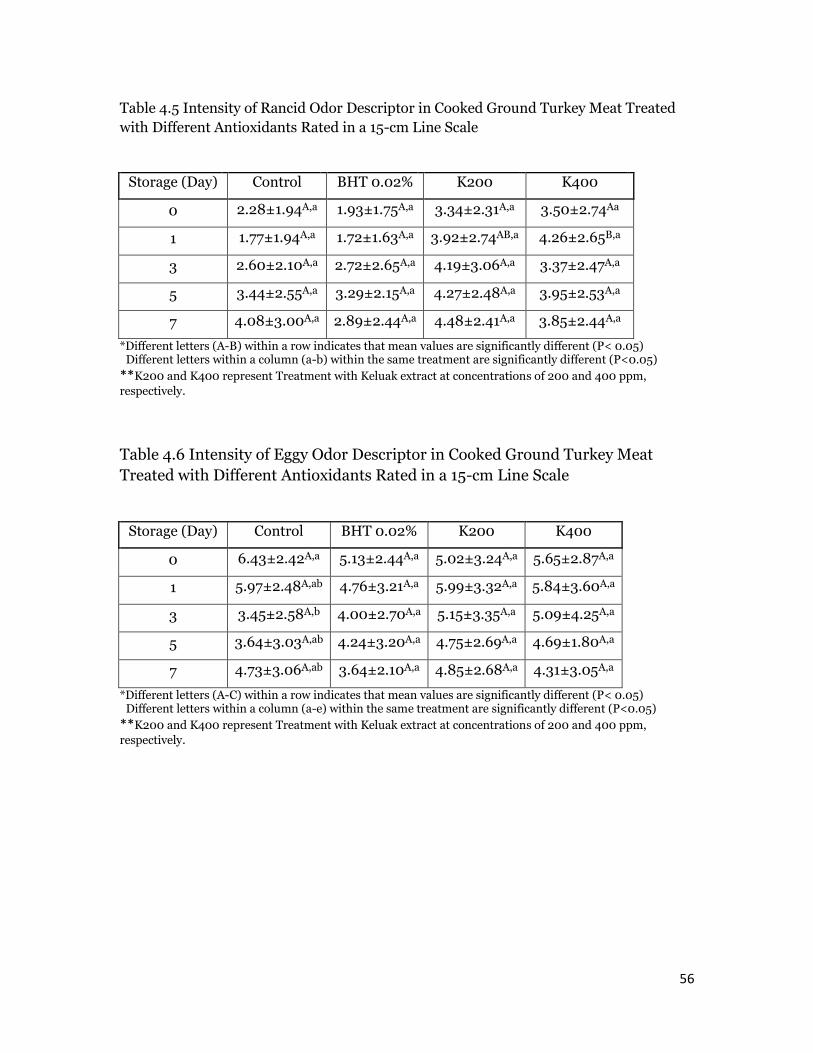
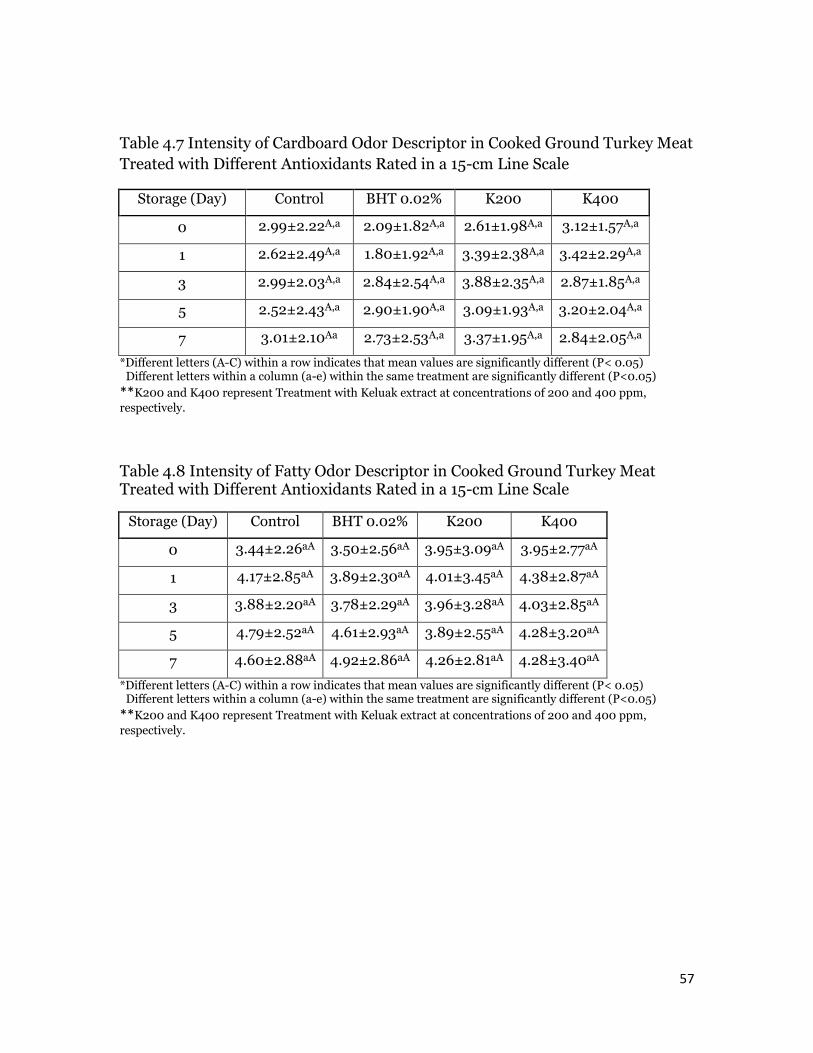
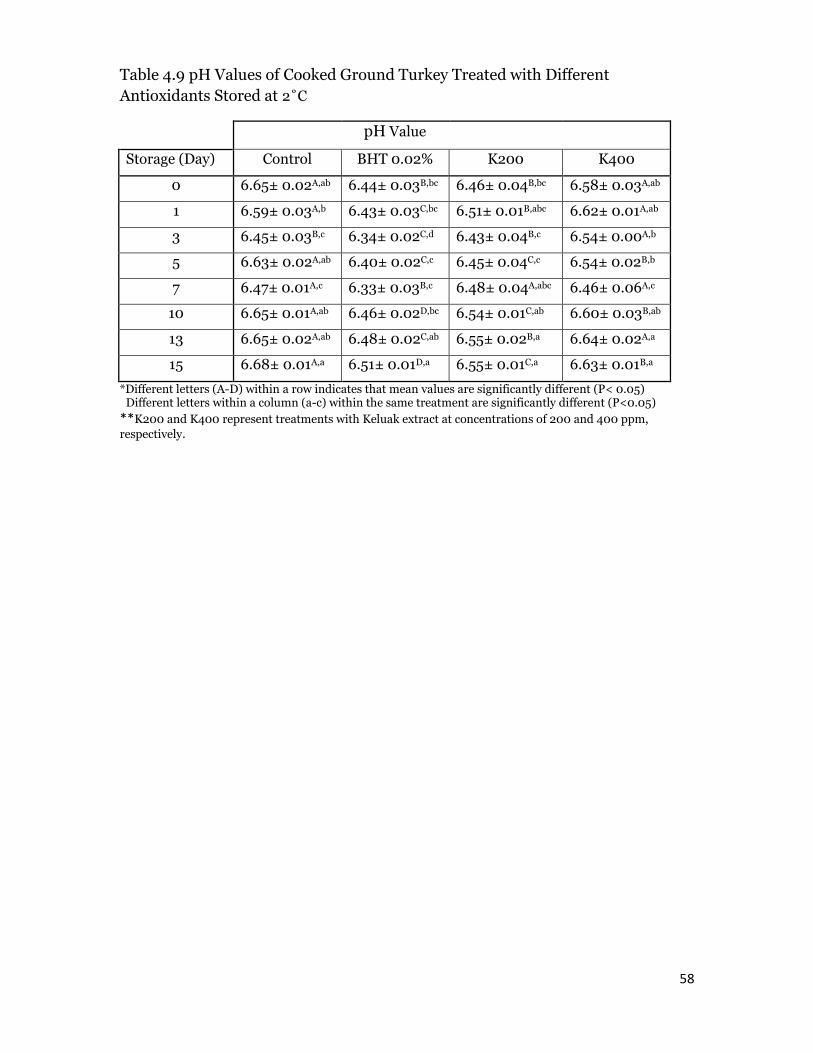


![Two Parasites of the Common Cockle {]ardium edule ... · commensal, but Patterson (1912, pp. 174-5) concluded that it lived chiefly in the kidney. Ball (1916, pp. 462-3), however,](https://img.pdfslide.us/doc/110x75/6061f16e24d3bb698c7660c1/two-parasites-of-the-common-cockle-ardium-edule-commensal-but-patterson-1912.jpg)


![Protective effect of Cupressus macrocarpa and Dioon edule ...[Efecto protector de Cupressus macrocarpa y Dioon edule contra la nefrotoxicidad inducida por gentamicina en ratas] Ghada](https://img.pdfslide.us/doc/110x75/614201612035ff3bc76264f9/protective-effect-of-cupressus-macrocarpa-and-dioon-edule-efecto-protector.jpg)