Embed Size (px)
Citation preview
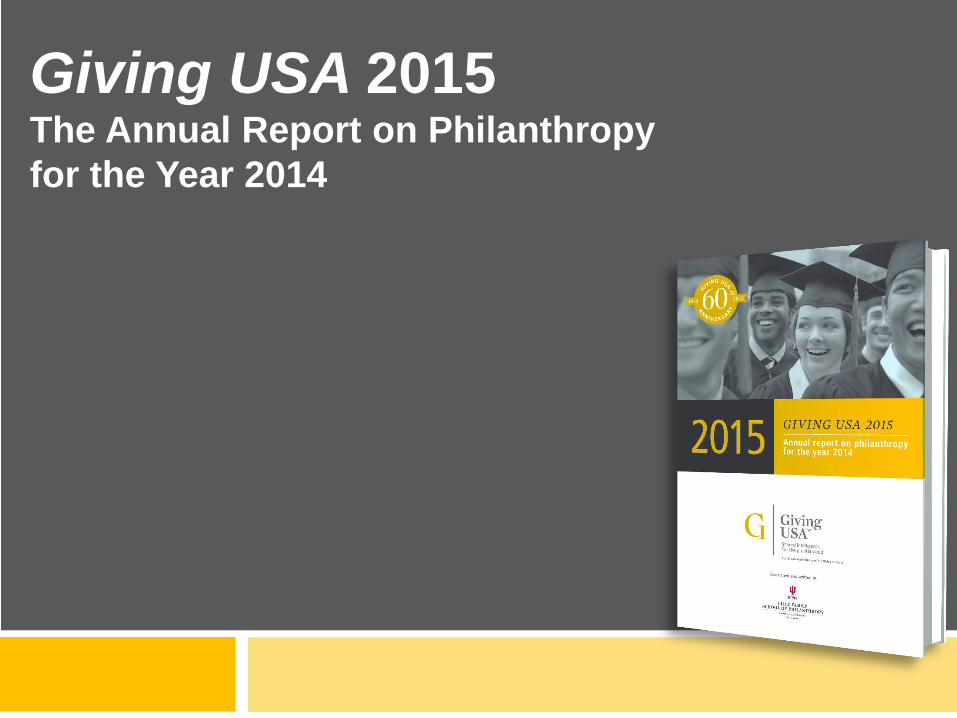
Giving USA 2015 The Annual Report on Philanthropy
for the Year 2014

Giving USA 2015 PowerPoint Presentation User’s Guide
Graphs in this PowerPoint presentation are developed
for use in presentations only.
Purchasers do not have the right to prepare handouts
using these materials, and this PowerPoint cannot be
shared or distributed, for free or for profit.
Please ask members of your audience to download the
free Giving USA 2015 report Highlights at
www.GivingUSA.org in order to have material for their
own use.

Giving USA 2015 PowerPoint Presentation User’s Guide
This 2015 Giving USA PowerPoint is a full replica of
Giving USA’s “The Numbers” section in
presentation form. This PowerPoint is ideal for use
in the classroom, for educating nonprofit boards,
and for comprehensive presentations on the U.S.
charitable landscape.
Giving USA 2015 PowerPoint Presentation User’s Guide
To maintain the integrity of Giving USA data and the way
in which it is presented, Giving USA asks that this
presentation not be modified in any way.
Images should not be cut out and pasted for use in other
materials. The Giving USA Graph Pack allows for images
to be cut out and pasted for use in other materials. The
Graph Pack is included for free this year when customers
buy either of the two available Annual Report packages.
5
Giving USA 2015 The Annual Report on Philanthropy for the Year 2014
Researched and written by
SOURCE: Giving USA Foundation | GIVING USA 2015
7
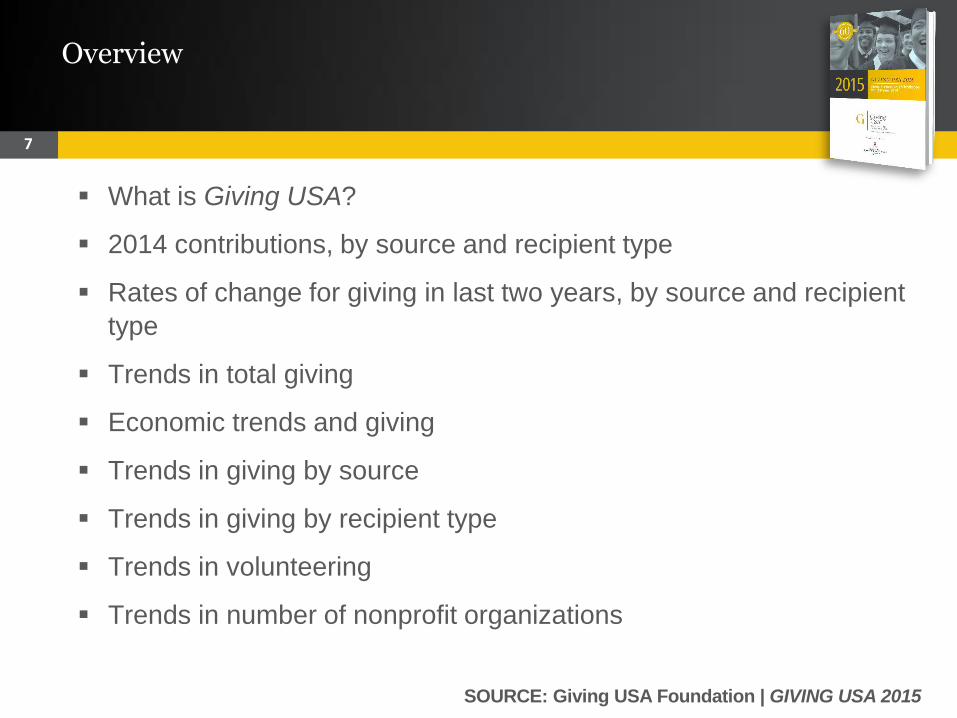
What is Giving USA?
2014 contributions, by source and recipient type
Rates of change for giving in last two years, by source and recipient
type
Trends in total giving
Economic trends and giving
Trends in giving by source
Trends in giving by recipient type
Trends in volunteering
Trends in number of nonprofit organizations
Overview
SOURCE: Giving USA Foundation | GIVING USA 2015
8
The longest running, annual report on U.S. charitable giving
Estimates for:
– Sources of giving
– Amounts received by type of organization
Published by Giving USA FoundationTM
Begun in 1956 by the American Association of Fundraising Counsel,
now The Giving Institute
Made possible by contributions from The Giving Institute member
firms, foundations, and other donors
Researched and written by the Indiana University Lilly Family School
of Philanthropy
What is Giving USA?
SOURCE: Giving USA Foundation | GIVING USA 2015
9
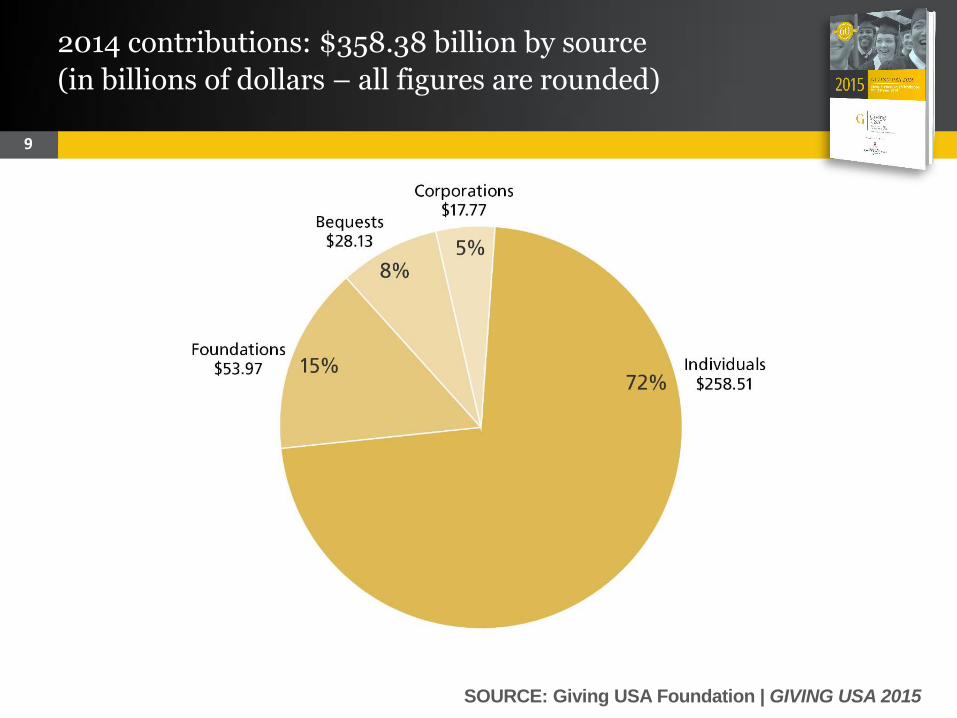
2014 contributions: $358.38 billion by source
(in billions of dollars – all figures are rounded)
SOURCE: Giving USA Foundation | GIVING USA 2015
10
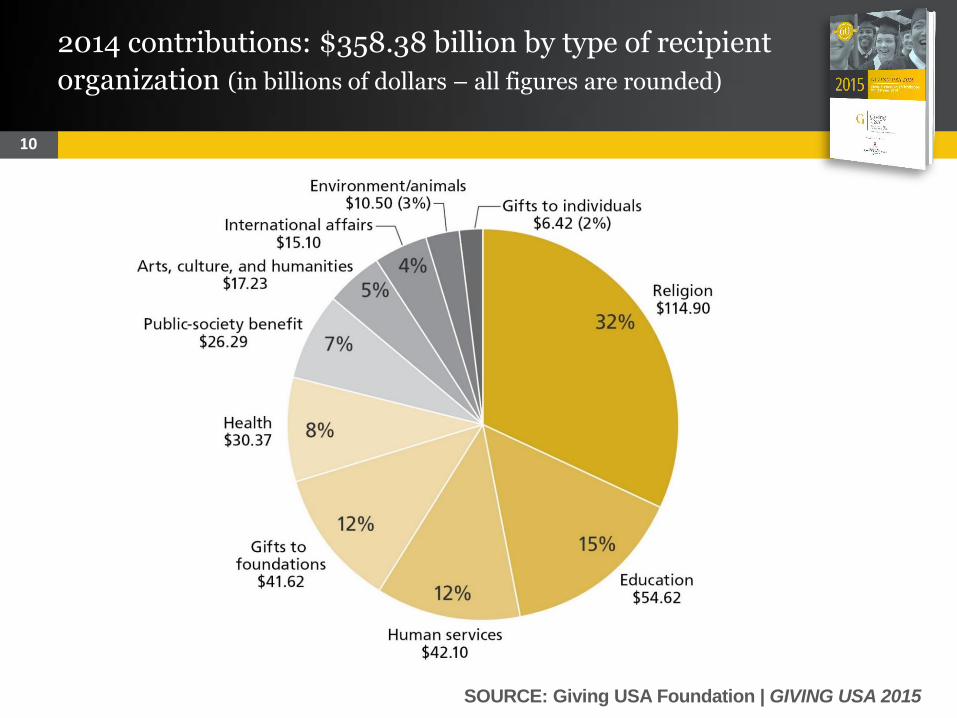
2014 contributions: $358.38 billion by type of recipient
organization (in billions of dollars – all figures are rounded)
SOURCE: Giving USA Foundation | GIVING USA 2015
11
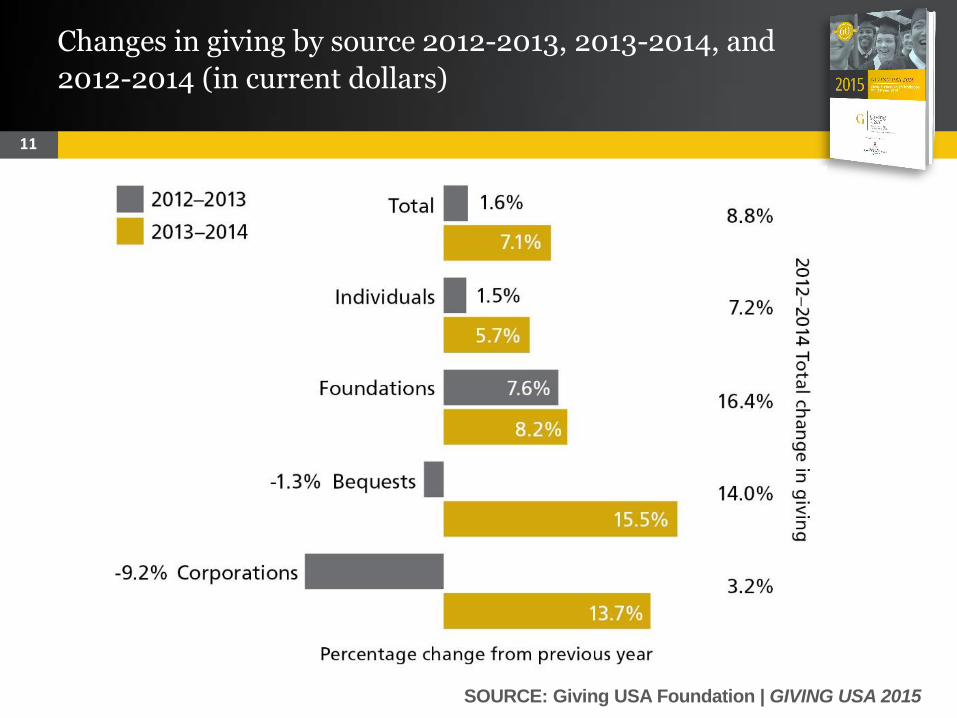
Changes in giving by source 2012-2013, 2013-2014, and
2012-2014 (in current dollars)
SOURCE: Giving USA Foundation | GIVING USA 2015
12
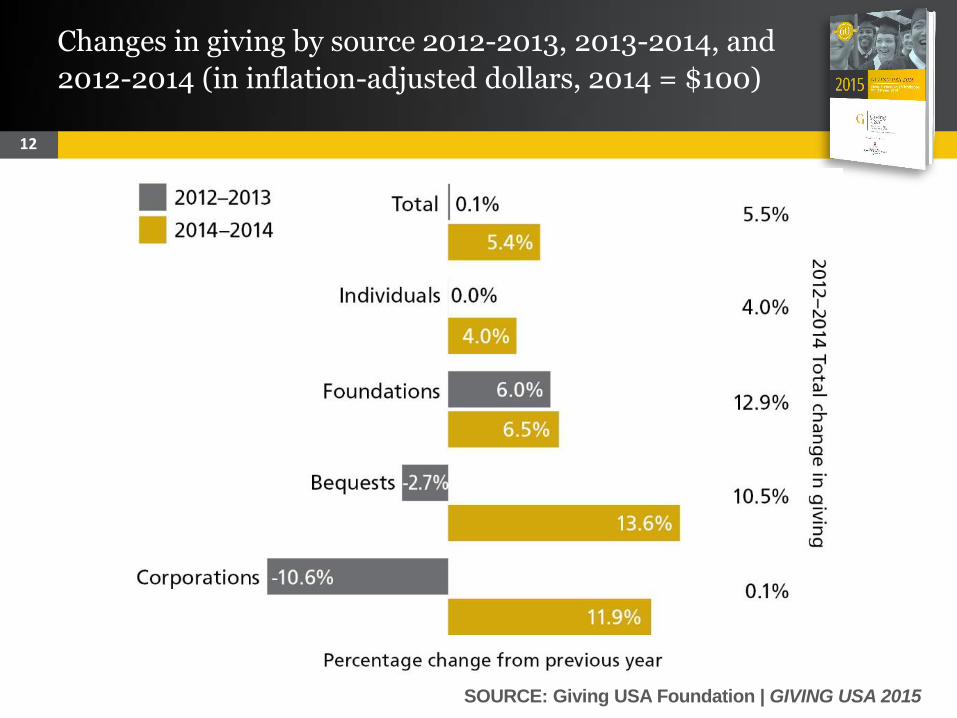
Changes in giving by source 2012-2013, 2013-2014, and
2012-2014 (in inflation-adjusted dollars, 2014 = $100)
SOURCE: Giving USA Foundation | GIVING USA 2015
13
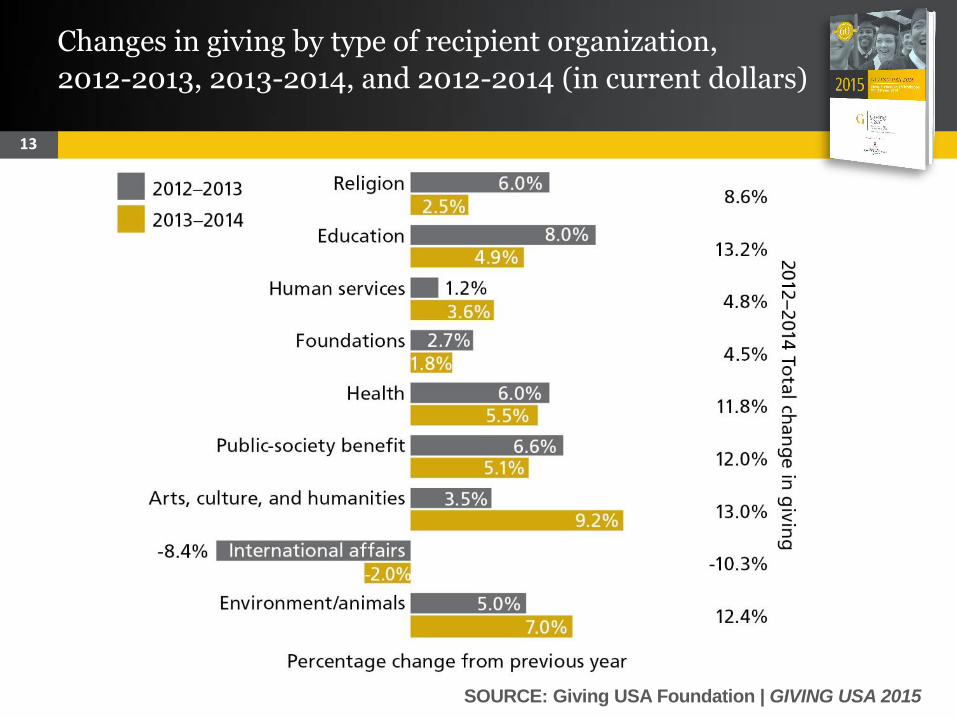
Changes in giving by type of recipient organization,
2012-2013, 2013-2014, and 2012-2014 (in current dollars)
SOURCE: Giving USA Foundation | GIVING USA 2015
14
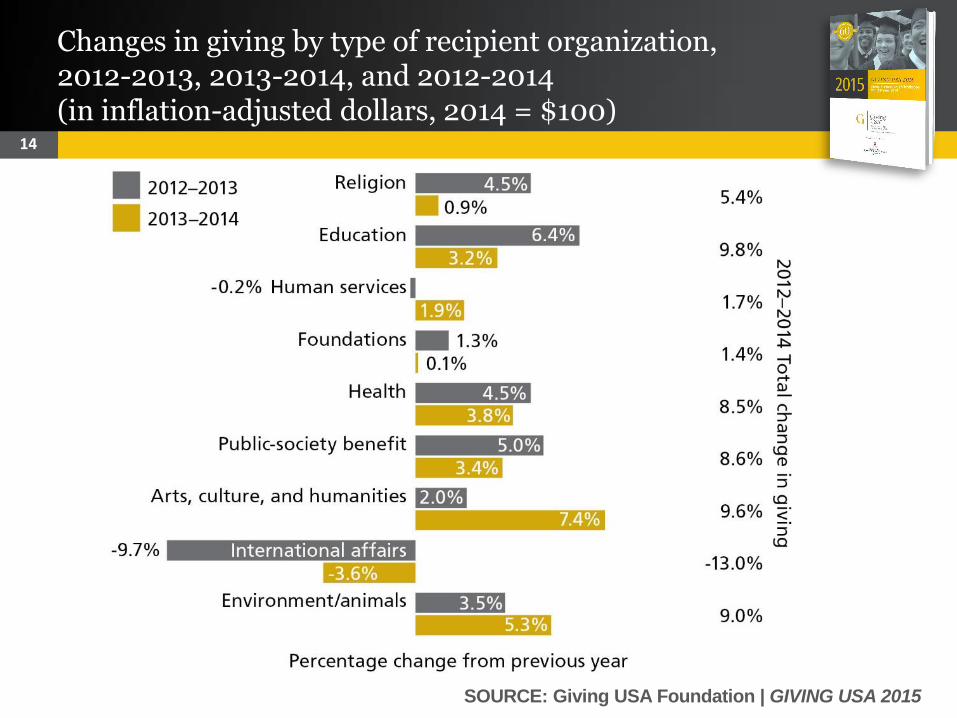
Changes in giving by type of recipient organization, 2012-2013, 2013-2014, and 2012-2014 (in inflation-adjusted dollars, 2014 = $100)
SOURCE: Giving USA Foundation | GIVING USA 2015
15
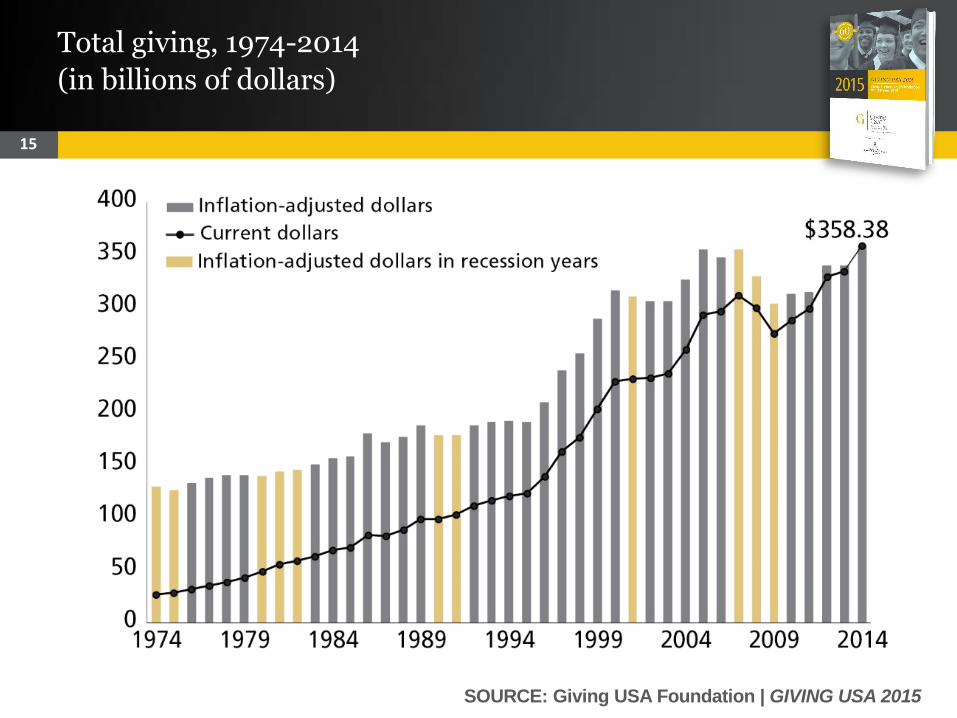
Total giving, 1974-2014
(in billions of dollars)
SOURCE: Giving USA Foundation | GIVING USA 2015
16
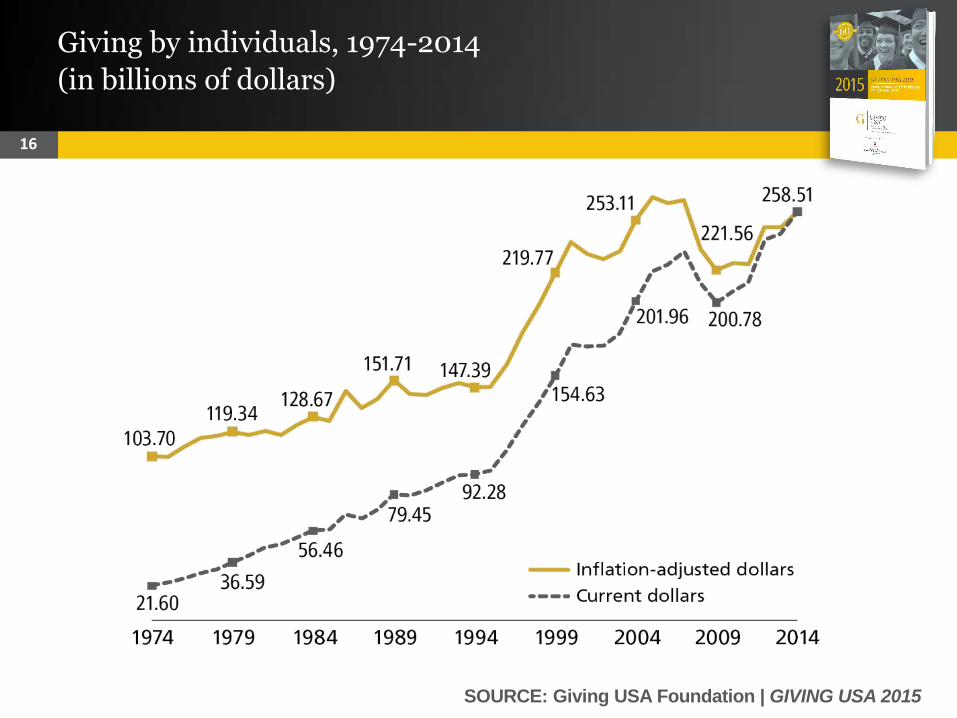
Giving by individuals, 1974-2014
(in billions of dollars)
SOURCE: Giving USA Foundation | GIVING USA 2015
17
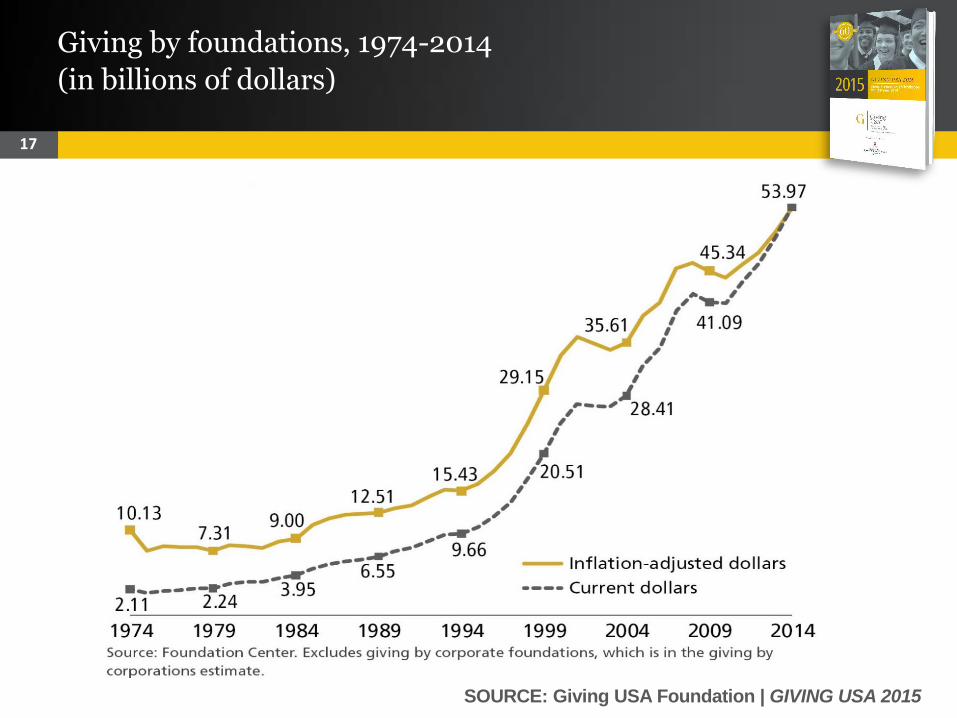
Giving by foundations, 1974-2014
(in billions of dollars)

SOURCE: Giving USA Foundation | GIVING USA 2015
18
Giving by bequest, 1974-2014
(in billions of dollars)
SOURCE: Giving USA Foundation | GIVING USA 2015
19
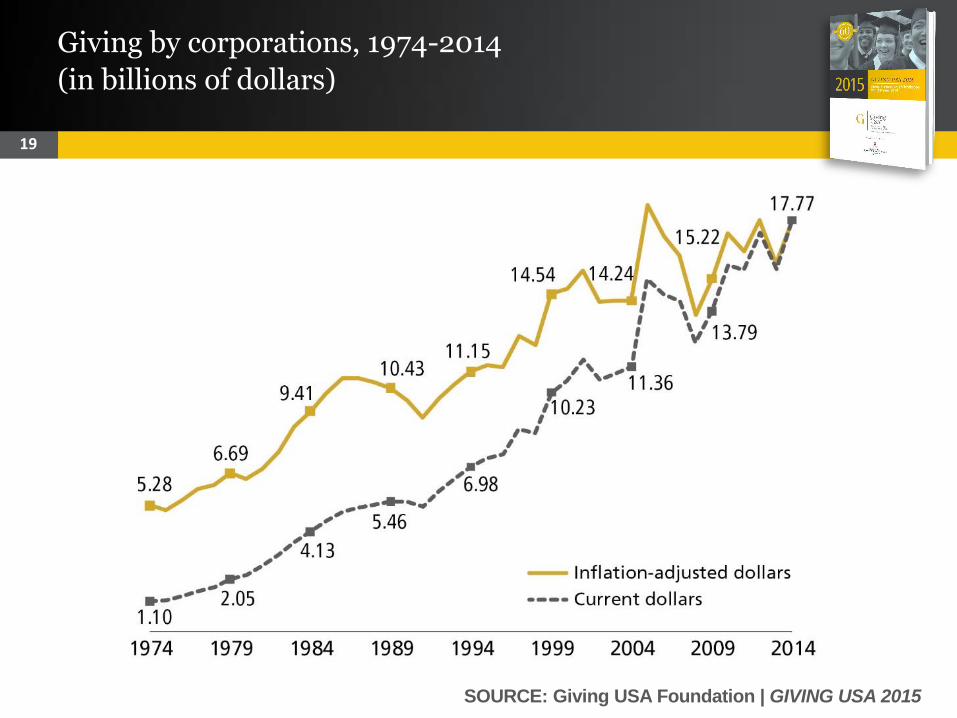
Giving by corporations, 1974-2014
(in billions of dollars)
SOURCE: Giving USA Foundation | GIVING USA 2015
20
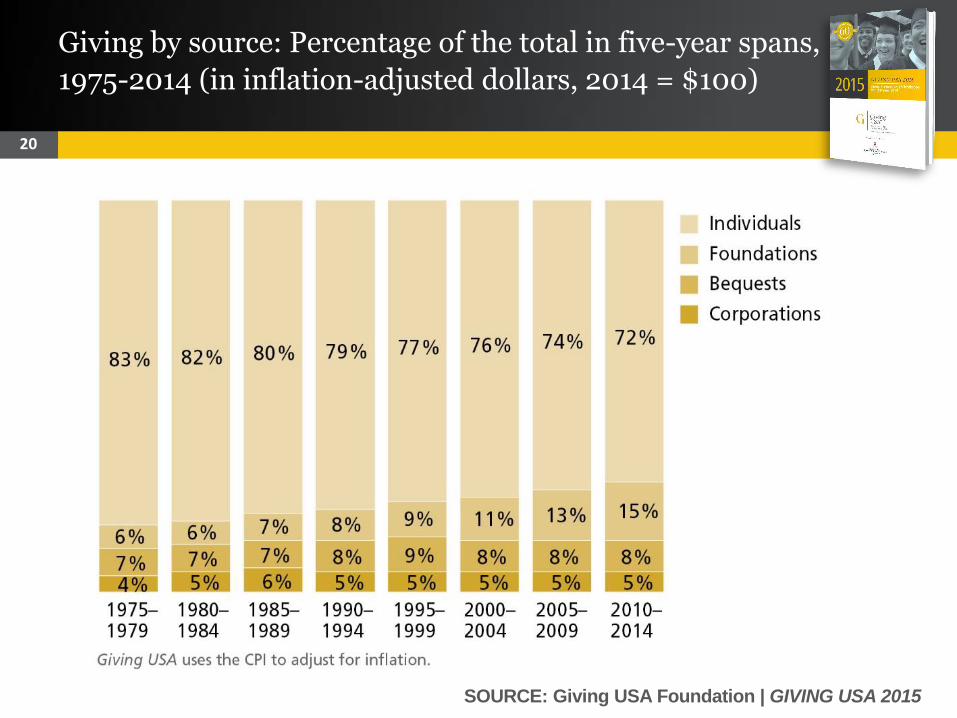
Giving by source: Percentage of the total in five-year spans,
1975-2014 (in inflation-adjusted dollars, 2014 = $100)
SOURCE: Giving USA Foundation | GIVING USA 2015
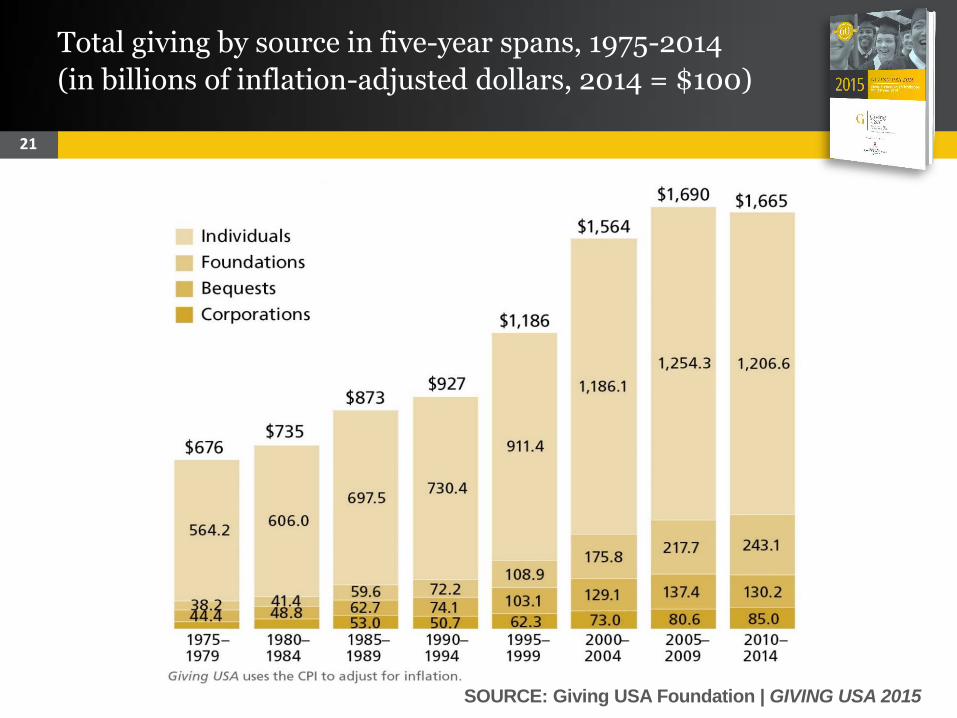
21
Total giving by source in five-year spans, 1975-2014
(in billions of inflation-adjusted dollars, 2014 = $100)
SOURCE: Giving USA Foundation | GIVING USA 2015
22
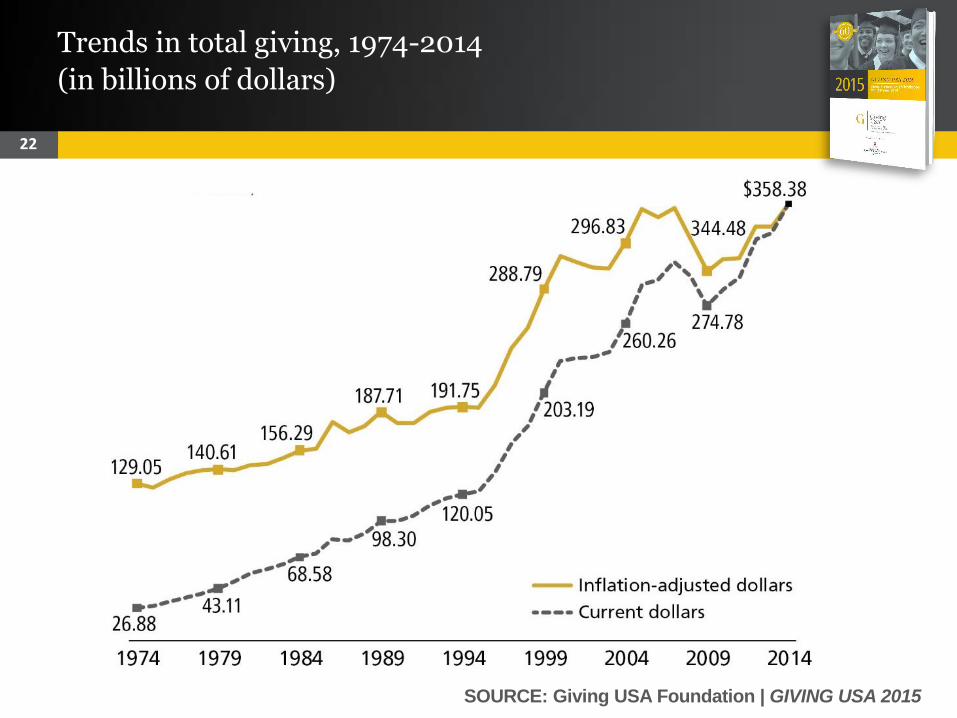
Trends in total giving, 1974-2014
(in billions of dollars)
SOURCE: Giving USA Foundation | GIVING USA 2015
23
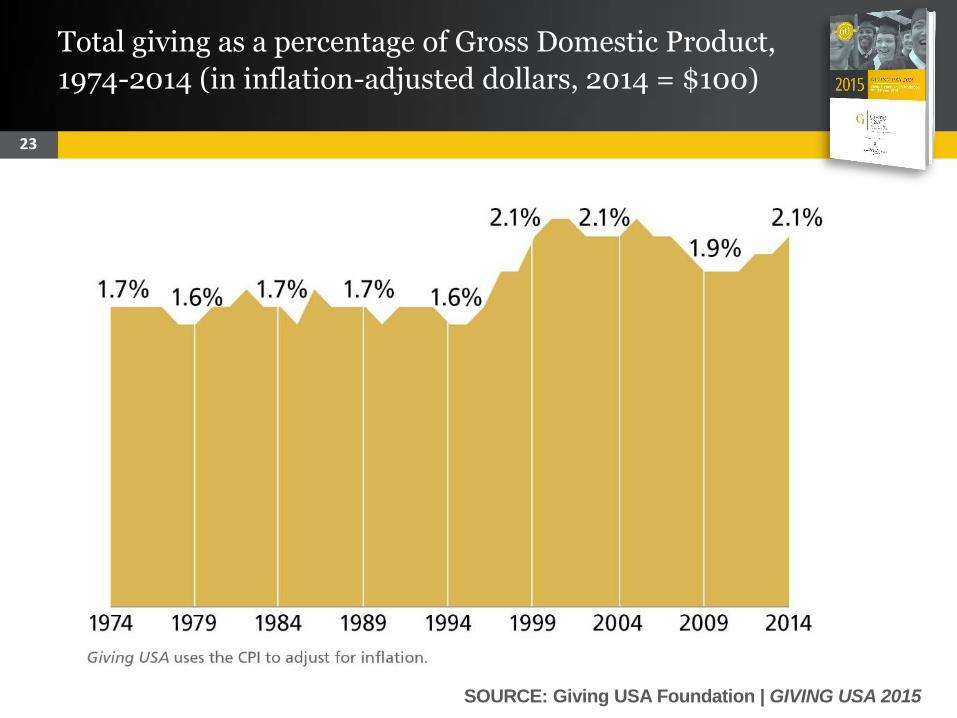
Total giving as a percentage of Gross Domestic Product,
1974-2014 (in inflation-adjusted dollars, 2014 = $100)
SOURCE: Giving USA Foundation | GIVING USA 2015
24
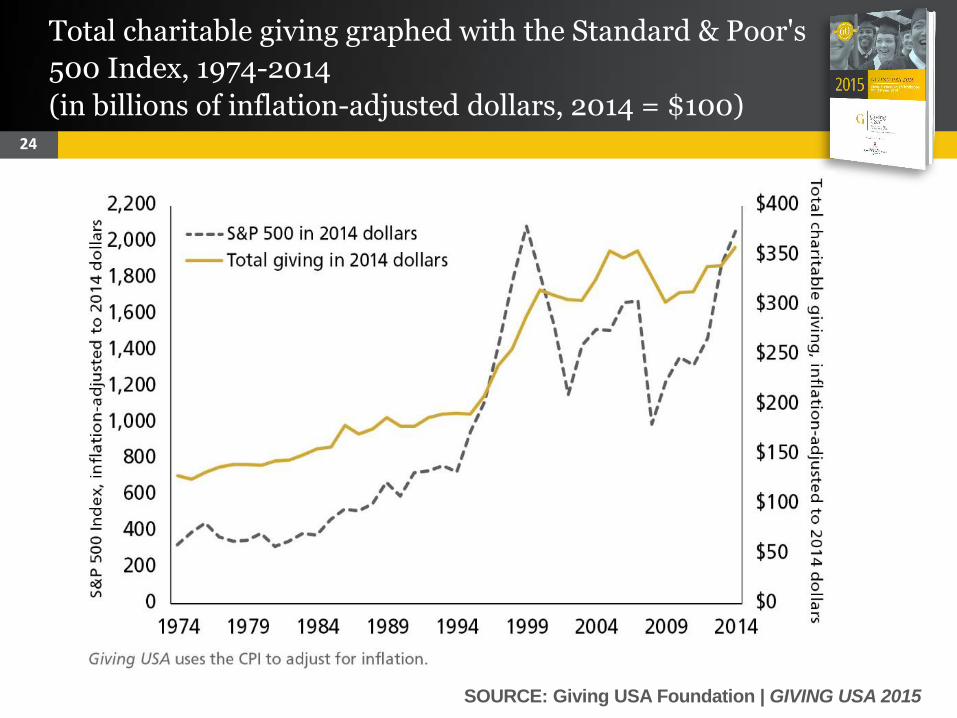
Total charitable giving graphed with the Standard & Poor's
500 Index, 1974-2014
(in billions of inflation-adjusted dollars, 2014 = $100)
SOURCE: Giving USA Foundation | GIVING USA 2015
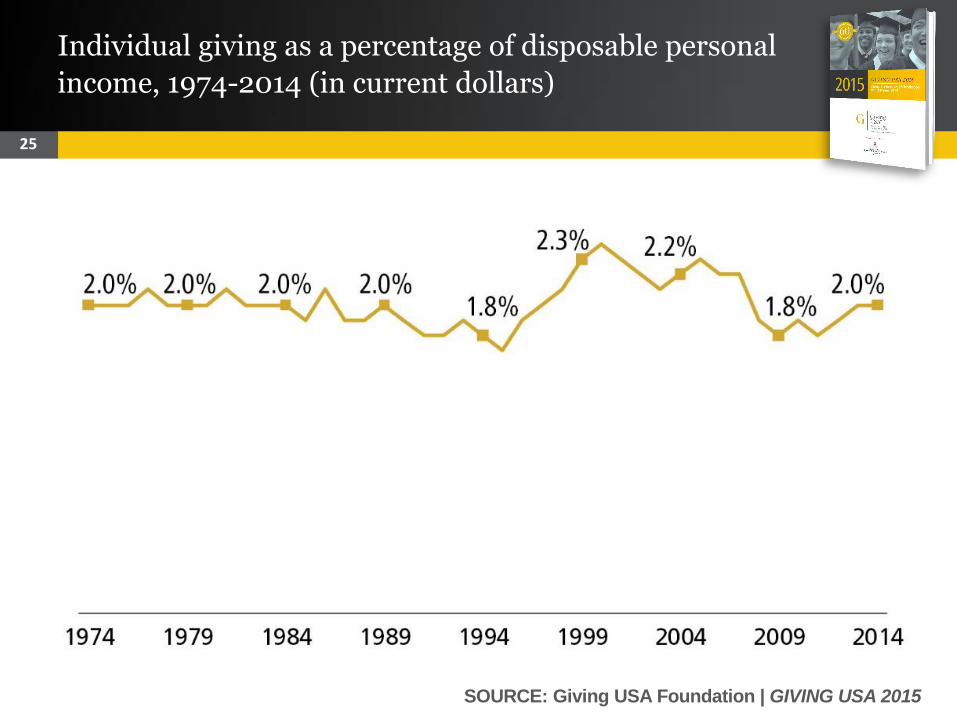
25
Individual giving as a percentage of disposable personal
income, 1974-2014 (in current dollars)
SOURCE: Giving USA Foundation | GIVING USA 2015
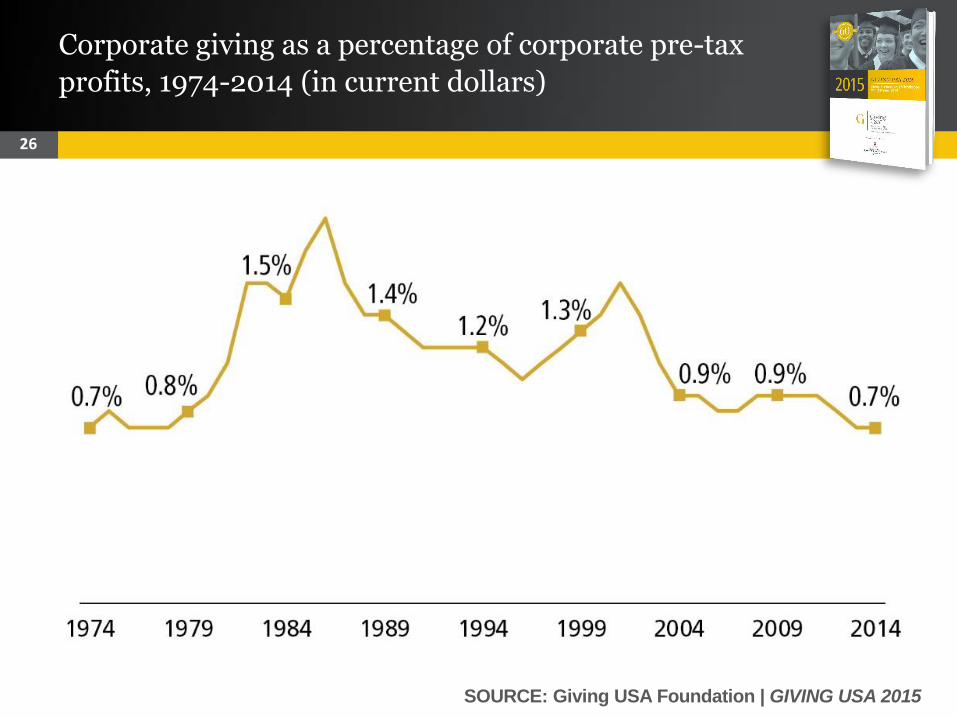
26
Corporate giving as a percentage of corporate pre-tax
profits, 1974-2014 (in current dollars)
SOURCE: Giving USA Foundation | GIVING USA 2015
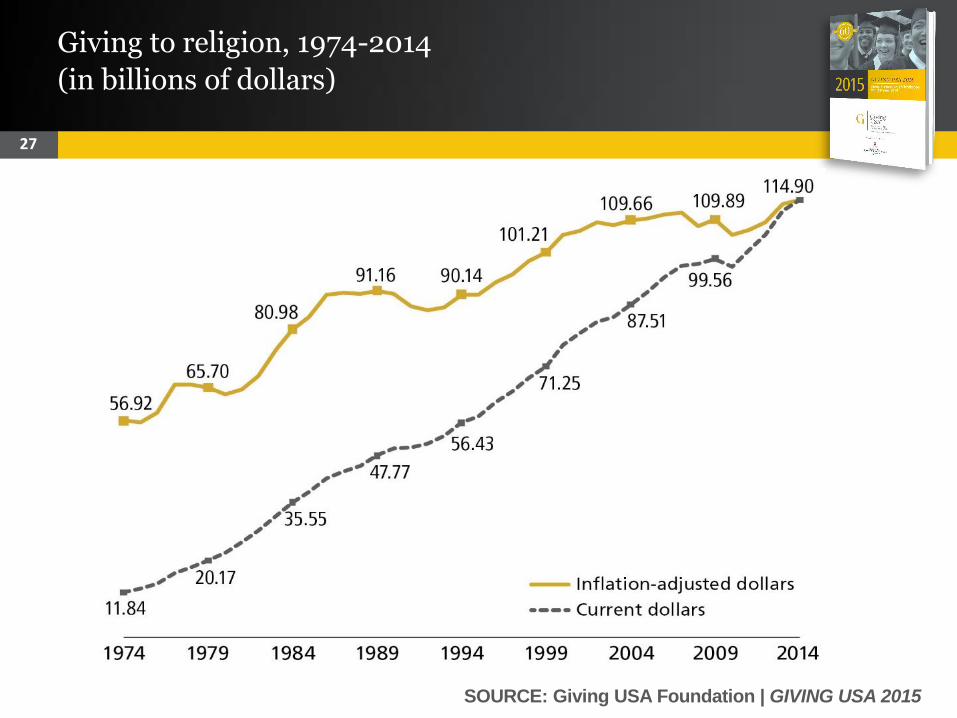
27
Giving to religion, 1974-2014
(in billions of dollars)
SOURCE: Giving USA Foundation | GIVING USA 2015
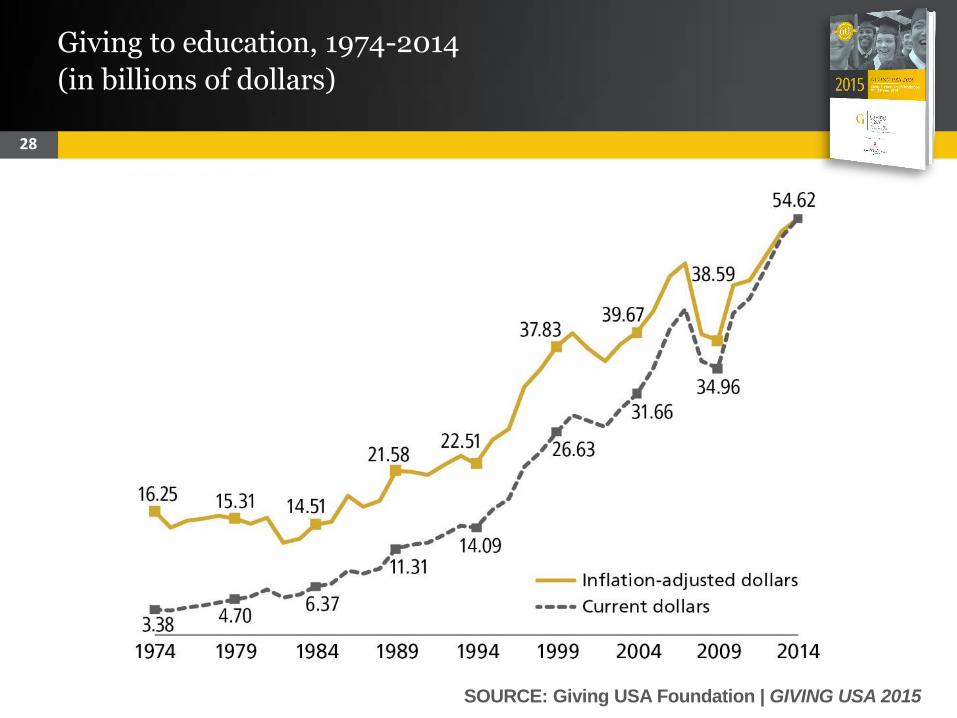
28
Giving to education, 1974-2014
(in billions of dollars)
SOURCE: Giving USA Foundation | GIVING USA 2015
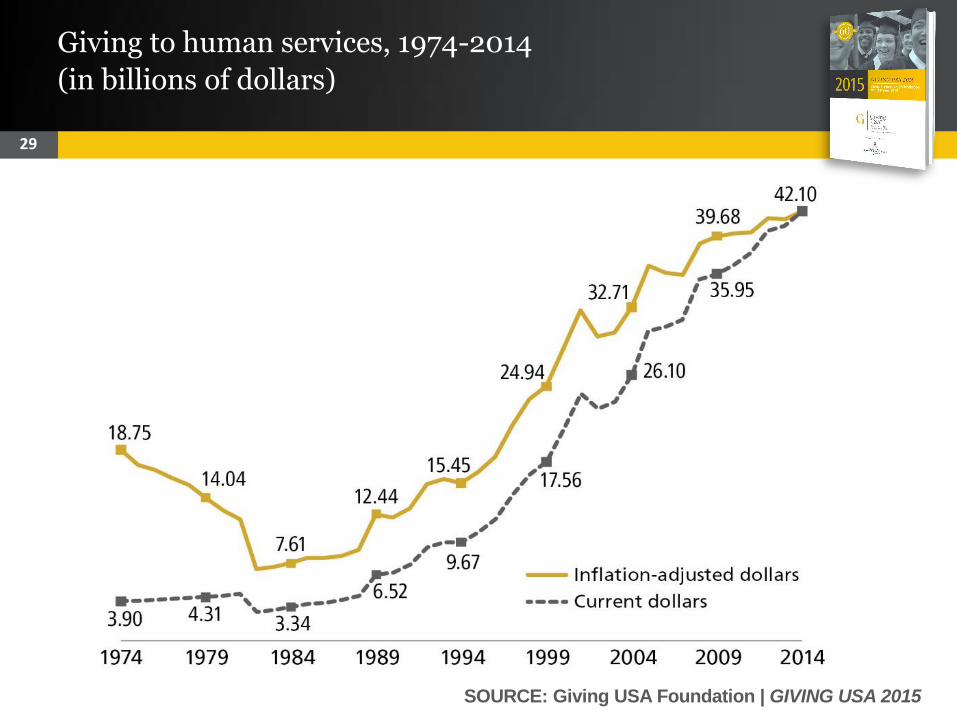
29
Giving to human services, 1974-2014
(in billions of dollars)
SOURCE: Giving USA Foundation | GIVING USA 2015
30
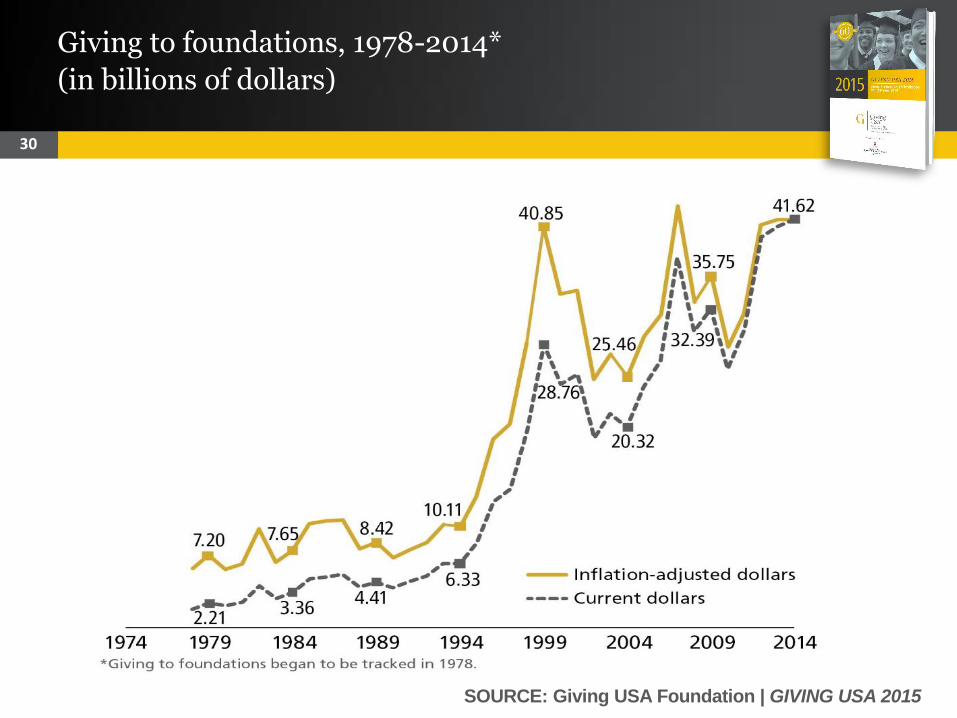
Giving to foundations, 1978-2014*
(in billions of dollars)
SOURCE: Giving USA Foundation | GIVING USA 2015
31
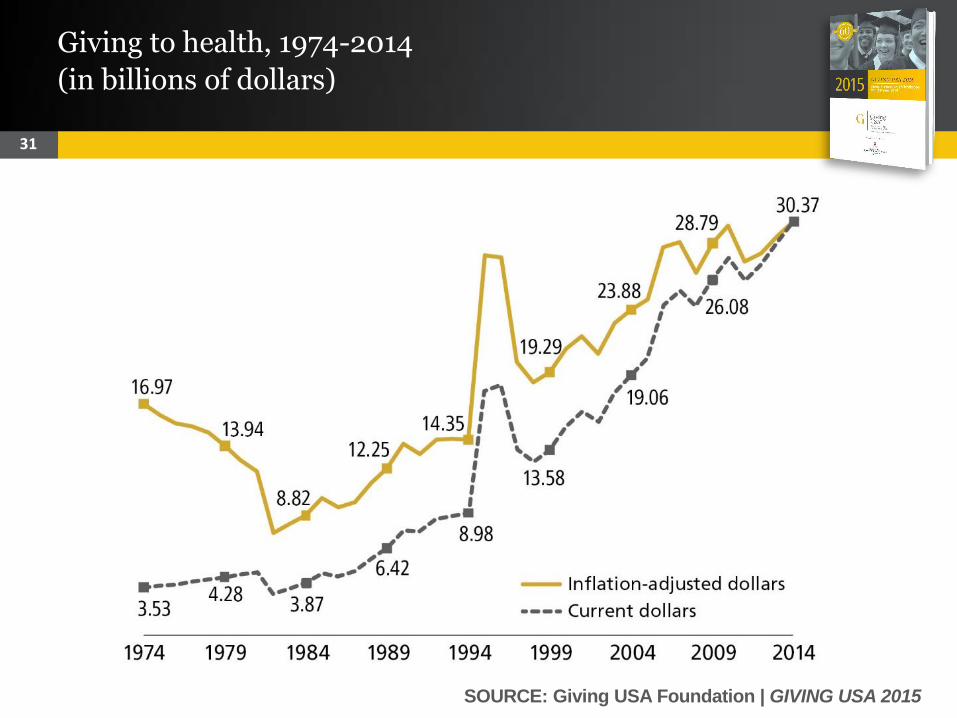
Giving to health, 1974-2014
(in billions of dollars)
SOURCE: Giving USA Foundation | GIVING USA 2015
32
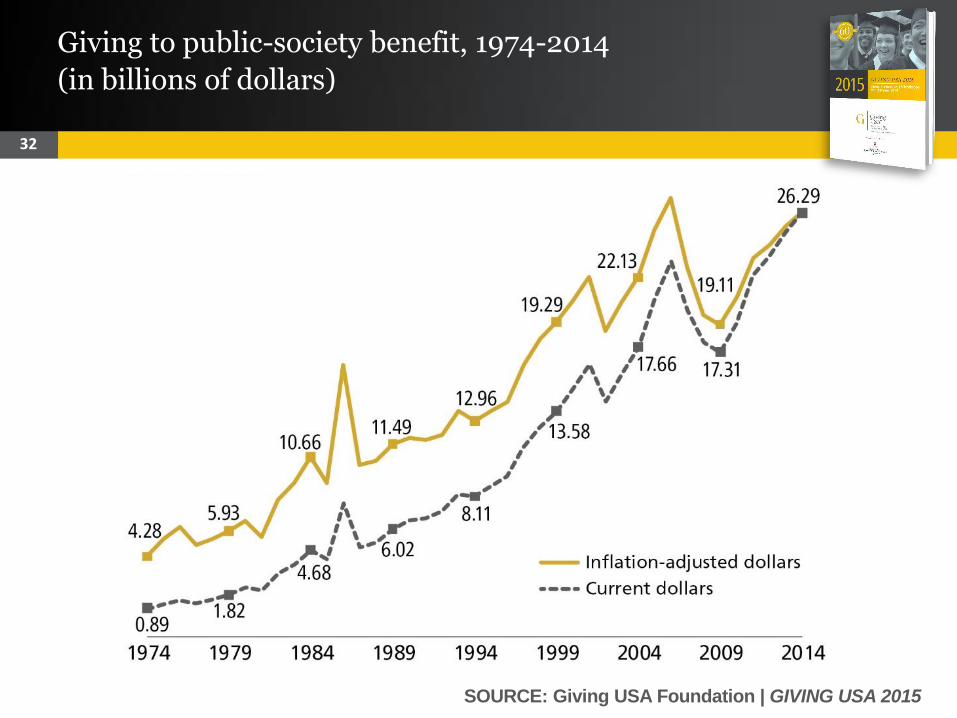
Giving to public-society benefit, 1974-2014
(in billions of dollars)
SOURCE: Giving USA Foundation | GIVING USA 2015
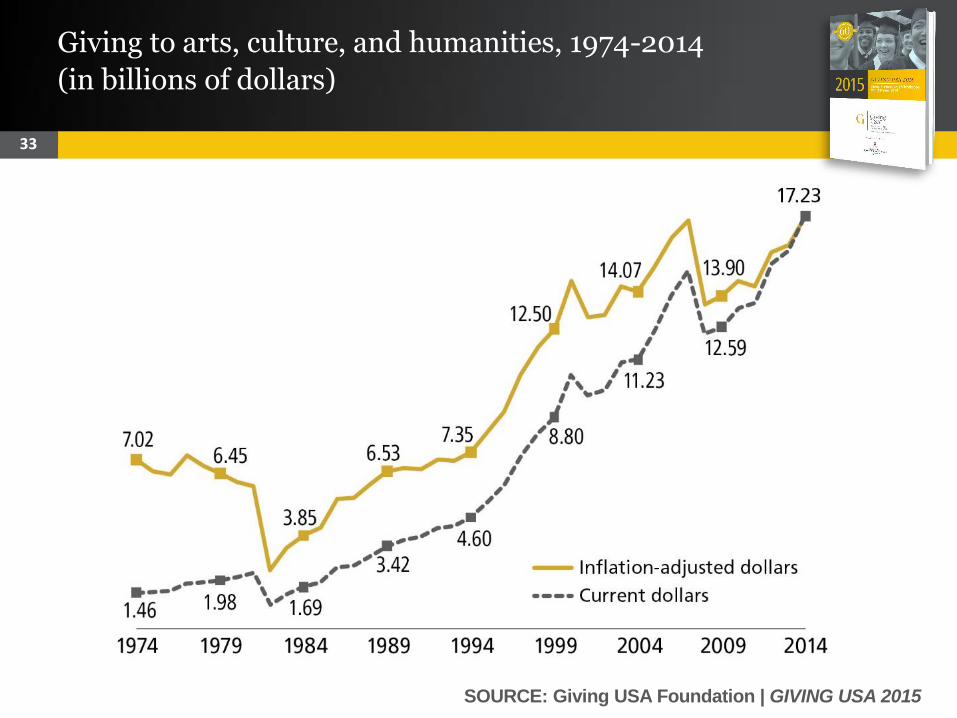
33
Giving to arts, culture, and humanities, 1974-2014
(in billions of dollars)
SOURCE: Giving USA Foundation | GIVING USA 2015
34
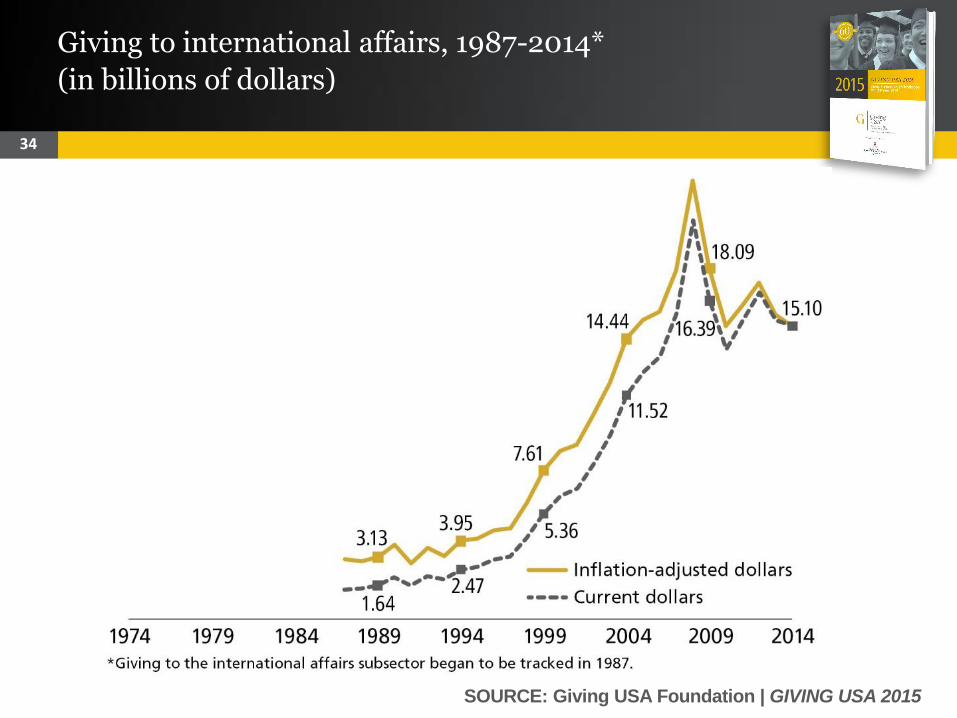
Giving to international affairs, 1987-2014*
(in billions of dollars)
SOURCE: Giving USA Foundation | GIVING USA 2015
35
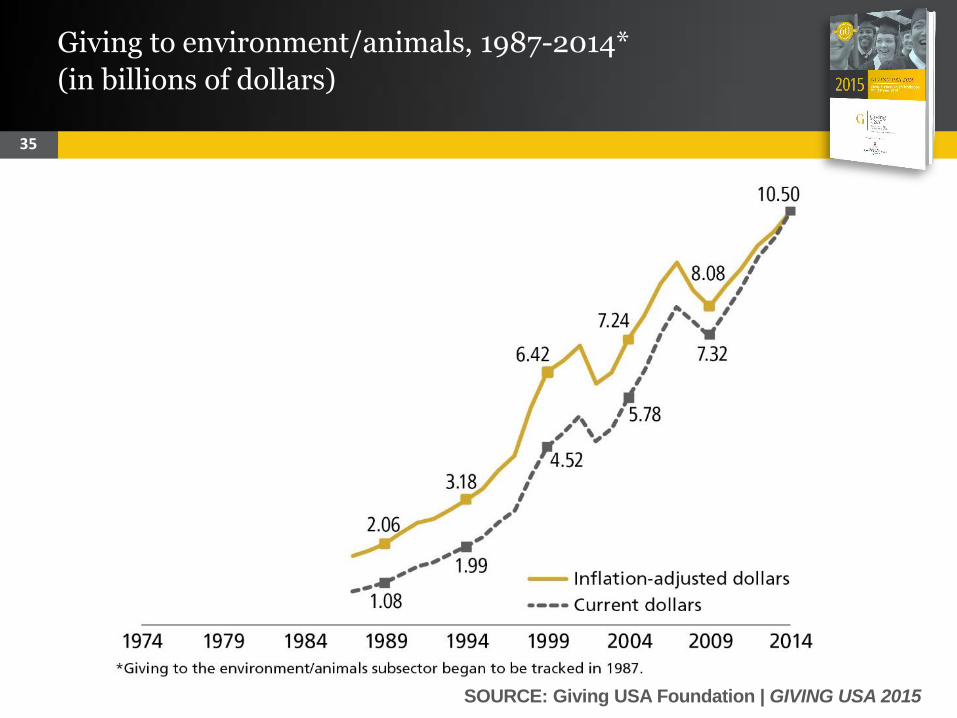
Giving to environment/animals, 1987-2014*
(in billions of dollars)
SOURCE: Giving USA Foundation | GIVING USA 2015
36
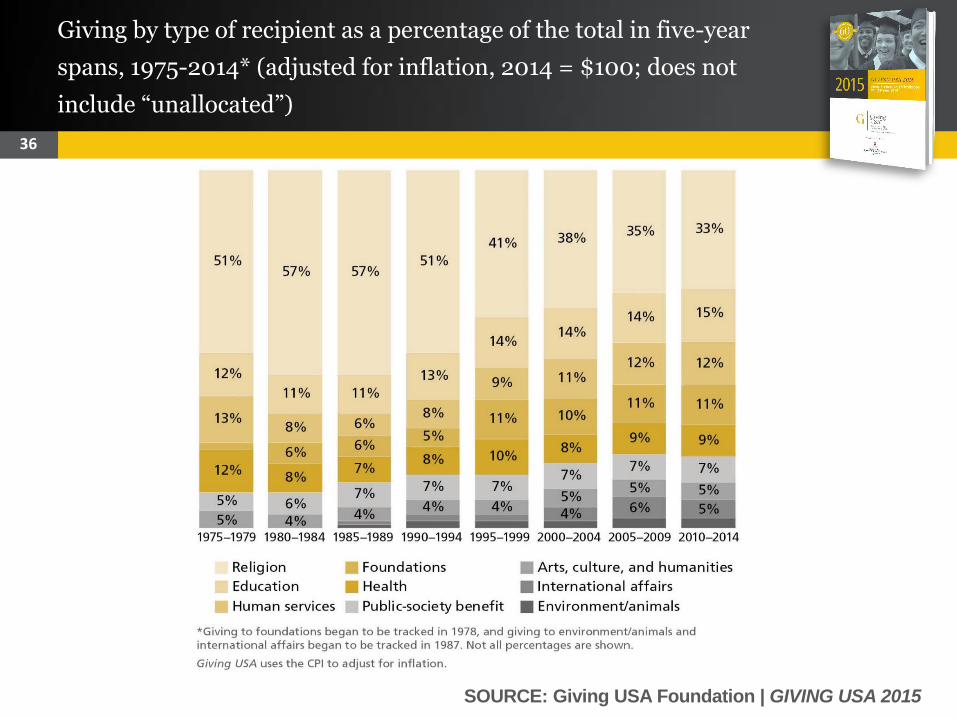
Giving by type of recipient as a percentage of the total in five-year
spans, 1975-2014* (adjusted for inflation, 2014 = $100; does not
include “unallocated”)
SOURCE: Giving USA Foundation | GIVING USA 2015
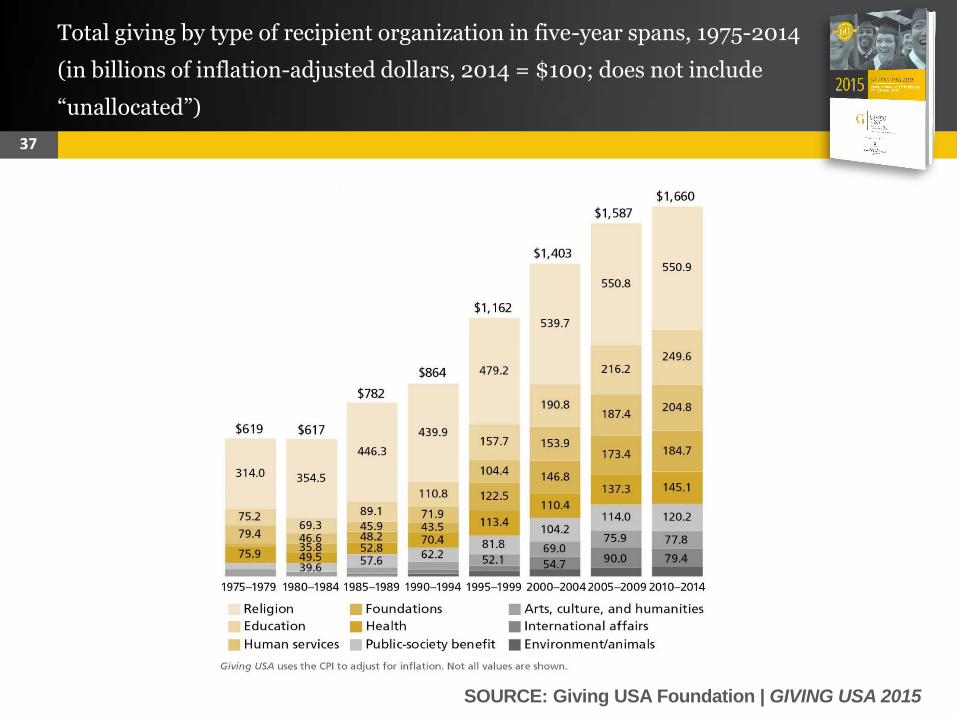
37
Total giving by type of recipient organization in five-year spans, 1975-2014
(in billions of inflation-adjusted dollars, 2014 = $100; does not include
“unallocated”)
SOURCE: Giving USA Foundation | GIVING USA 2015
38
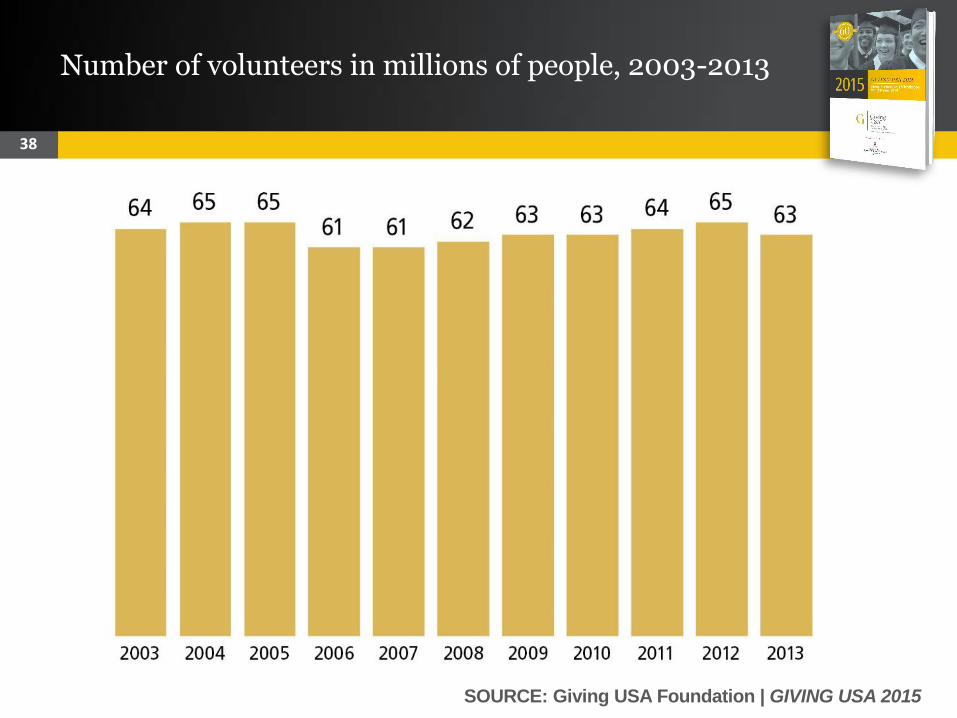
Number of volunteers in millions of people, 2003-2013
SOURCE: Giving USA Foundation | GIVING USA 2015
39
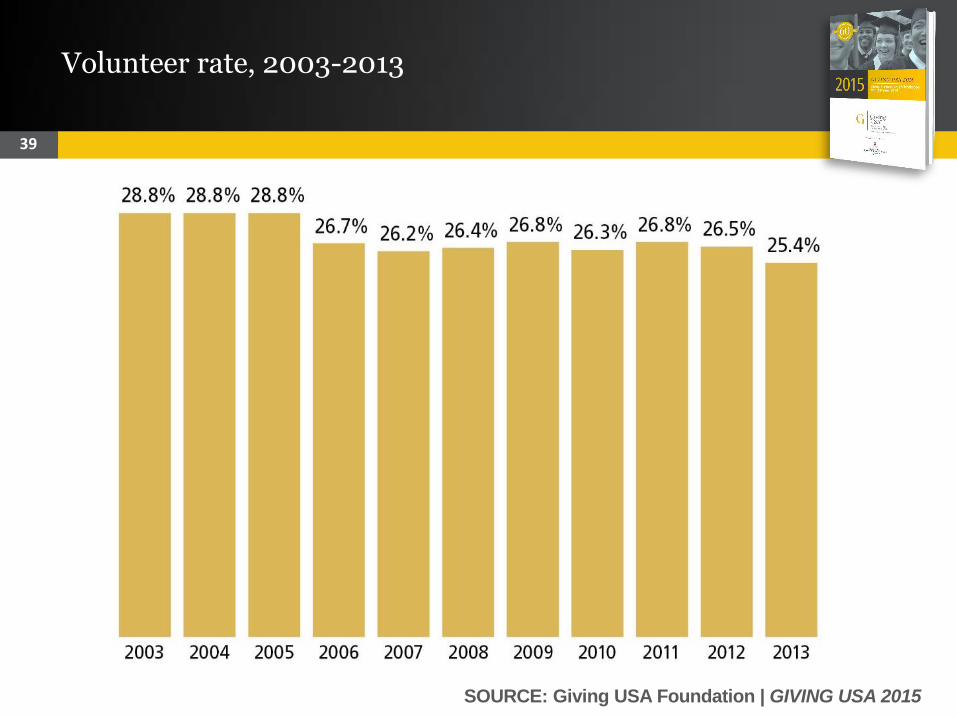
Volunteer rate, 2003-2013
SOURCE: Giving USA Foundation | GIVING USA 2015
40
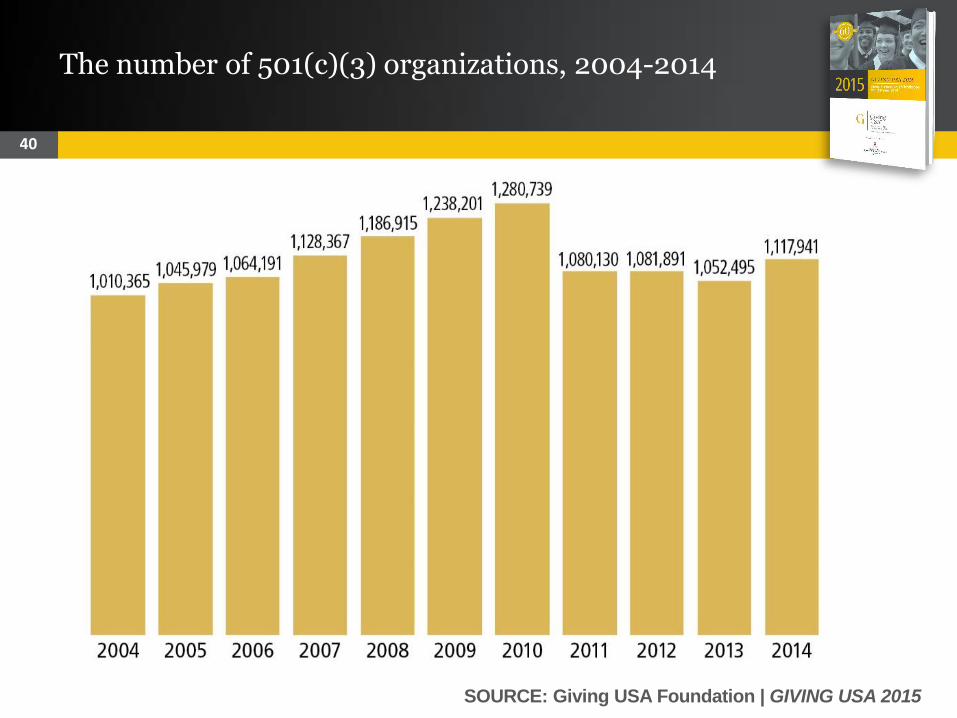
The number of 501(c)(3) organizations, 2004-2014

SOURCE: Giving USA Foundation | GIVING USA 2015
41
1. All data in this section are reported as estimates, which are subject to
revision. The estimates for total charitable giving for the years 2012 and 2013
were revised in this edition from estimates reported in Giving USA 2014. To
provide the most accurate estimates for charitable giving, as new data become
available, Giving USA revises its estimates for at least the last two years. See
more about how Giving USA calculates charitable giving by sources and uses
in the “Brief summary of methods used” section of this report.
2. Data were provided by the Foundation Center in April 2015 and are subject
to revision. Data on giving by and to foundations are available in the
Foundation Center’s Key Facts on U.S. Foundations reports, available at the
Foundation Center’s website at www.foundationcenter.org.
3. See the Foundation Center’s Key Facts on Family Foundations reports at
www.foundationcenter.org.
4. Same as note 1.
5. Same as note 1.
References
SOURCE: Giving USA Foundation | GIVING USA 2015
42
6. Same as note 2.
7. Same as note 1.
8. Same as note 2.
9. Same as note 1.
10. Same as note 1.
11. Same as note 1.
12. Same as note 1.
13. The source of this data is: Maria Di Mento, “The Philanthropy 50,” The
Chronicle of Philanthropy, 2015, www.philanthropy.com
14. Same as note 2.
15. Same as note 3.
References
SOURCE: Giving USA Foundation | GIVING USA 2015
43
16. Same as note 1.
17. Same as note 1.
18. Same as note 2.
19. This data is in current dollars. “Gross Domestic Product,” Bureau of
Economic Analysis, U.S. Department of Commerce, 2015, Table 1.1.5,
retrieved April 2015, www.bea.gov; “Corporate Profits Before Tax by Industry,”
Bureau of Economic Analysis, U.S. Department of Commerce, 2015, Table
6.17D, retrieved April 2015, www.bea.gov
20. Same as note 1.
21. Same as note 1.
22. Same as note 2.
23. Same as note 1.
References
SOURCE: Giving USA Foundation | GIVING USA 2015
44
24. “Gross Domestic Product,” Bureau of Economic Analysis, U.S. Department
of Commerce, 2015, Table 1.1.5, retrieved April 2015, www.bea.gov
25. “S&P 500 Stock Price Index (S&P 500),” Federal Reserve Bank of St.
Louis, FRED® Economic Data, retrieved April 2015,
http://research.stlouisfed.org
26. “Personal Income and Its Disposition,” Bureau of Economic Analysis, U.S.
Department of Commerce, Table 2.1, retrieved April 2015, www.bea.gov
27. These data is in current dollars. Data about corporate pre-tax profits comes
from: “Corporate Profits Before Tax by Industry,” Bureau of Economic Analysis,
U.S. Department of Commerce, 2015, Table 6.17D, retrieved April 2015,
www.bea.gov
28. Same as note 1.
References
SOURCE: Giving USA Foundation | GIVING USA 2015
45
29. Winter 2015 Nonprofit Fundraising Survey, Nonprofit Research
Collaborative, 2015, www.npresearch.org. This report includes a convenience
sample of more than 1,200 respondents, 187 of them Canadian.
30. 2014 Charitable Giving Report, Blackbaud, February 2015,
https://www.blackbaud.com/files/ corpmar/cgr/how-nonprofit-fundraising-
performed-in-2014.pdf
31. Same as note 1.
32. The sources of this data are: Maria Di Mento, “The Philanthropy 50,” The
Chronicle of Philanthropy, 2015, www.philanthropy.com and “Colleges and
Universities Raise $37.45 Billion in 2014,” Council for Aid to Education, press
release, January 28, 2015, www.cae.org
33. Same as note 1.
References
SOURCE: Giving USA Foundation | GIVING USA 2015
46
34. 2015 State of the Nonprofit Sector Survey, Nonprofit Finance Fund, 2015,
http://nonprofitfinancefund. org/files/docs/2015/2015survey_natl_summary.pdf
35. Same as note 29.
36. Same as note 1.
37. Same as note 13.
38. Same as note 1.
39. Same as note 29.
40. Same as note 30.
41. Same as note 1.
42. Same as note 1.
43. Same as note 29.
References
SOURCE: Giving USA Foundation | GIVING USA 2015
47
44. Same as note 30.
45. Same as note 1.
46. Same as note 1.
47. Same as note 29.
48. Same as note 30.
49. Same as note 1.
50. Same as note 1.
51. Volunteering and Civic Engagement in the United States, Corporation for
National and Community Service, retrieved May 2015,
www.volunteeringinamerica.gov
52. Same as note 51.
References
SOURCE: Giving USA Foundation | GIVING USA 2015
48
53. Table 25: “Tax Exempt Activities,” 2014 Data Book, IRS, retrieved May
2015, http://www.irs.gov/uac/ SOI-Tax-Stats-IRS-Data-Book
54. “Pension Protection Act,” United States Department of Labor, Retrieved
May 2015, www.dol.gov/EBSA/pensionreform.html
References


![HIGen HIGeneralInformationandAdjustments 2018 HI1 · $5Children'sTrust,DomesticViolence,andAbuseSpecialAccounts.....(T=Taxpayer,S=Spouse,B=Both) [11] 2018 ExacTax,Inc. HI1 HI1](https://img.pdfslide.us/doc/110x75/5e749bee97352f17b44d7aef/higen-higeneralinformationandadjustments-2018-hi1-5childrenstrustdomesticviolenceandabusespecialaccountsttaxpayersspousebboth.jpg)