Embed Size (px)
Citation preview
The Annual Report on Philanthropy for the Year 2007

Giving USA 2008 is published by the
Giving USA Foundation™
and has been researched and written by

Source: Giving USA Foundation™ / Giving USA 2008
Overview
What is Giving USA?
Sources of giving
Types of recipients
Rates of change
Trends in total giving
Trends in sources of giving
Trends in types of recipients
Trends in number of nonprofit organizations
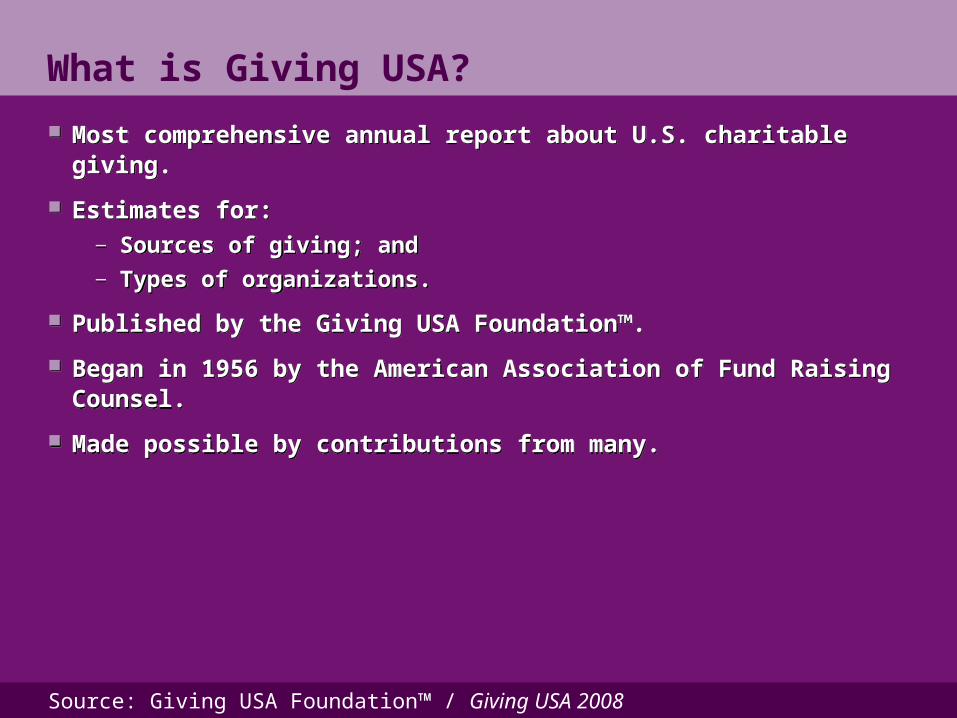
What is Giving USA?
Sources of giving
Types of recipients
Rates of change
Trends in total giving
Trends in sources of giving
Trends in types of recipients
Trends in number of nonprofit organizations
Source: Giving USA Foundation™ / Giving USA 2008
Most comprehensive annual report about U.S. charitable giving.
Estimates for:— Sources of giving; and — Types of organizations.
Published by the Giving USA Foundation™.
Began in 1956 by the American Association of Fund Raising Counsel.
Made possible by contributions from many.
Most comprehensive annual report about U.S. charitable giving.
Estimates for:— Sources of giving; and — Types of organizations.
Published by the Giving USA Foundation™.
Began in 1956 by the American Association of Fund Raising Counsel.
Made possible by contributions from many.
What is Giving USA?
Source: Giving USA Foundation™ / Giving USA 2008
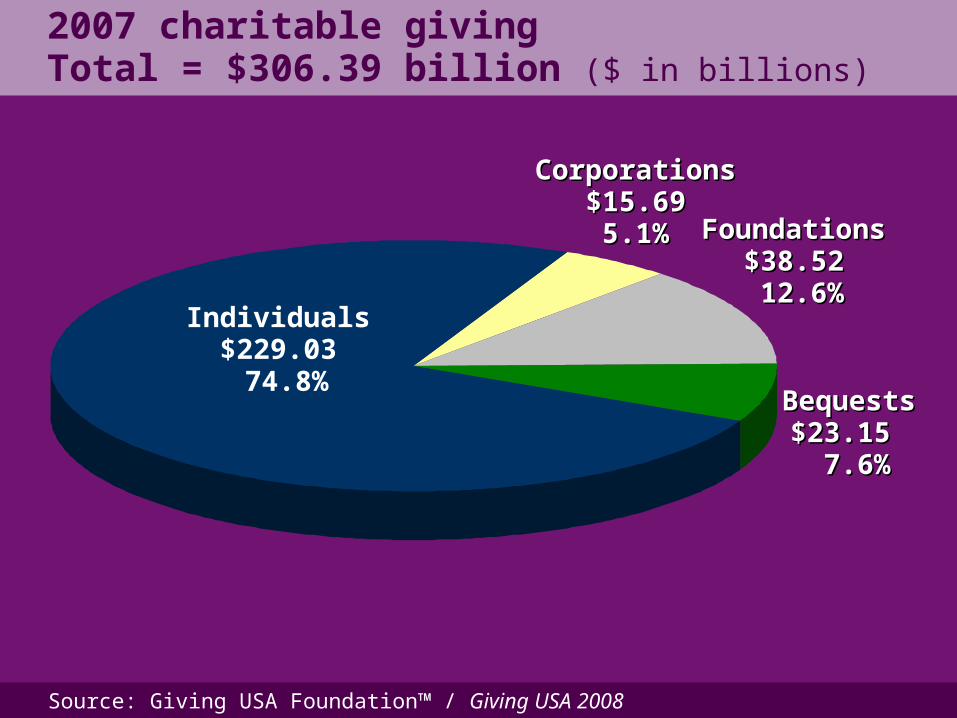
Individuals$229.03 74.8%
FoundationsFoundations$38.52$38.52 12.6% 12.6%
BequestsBequests$23.15 $23.15 7.6% 7.6%
CorporationsCorporations$15.69$15.695.1%5.1%
2007 charitable giving Total = $306.39 billion ($ in billions)
Source: Giving USA Foundation™ / Giving USA 2008
Sources of contributions, 2007
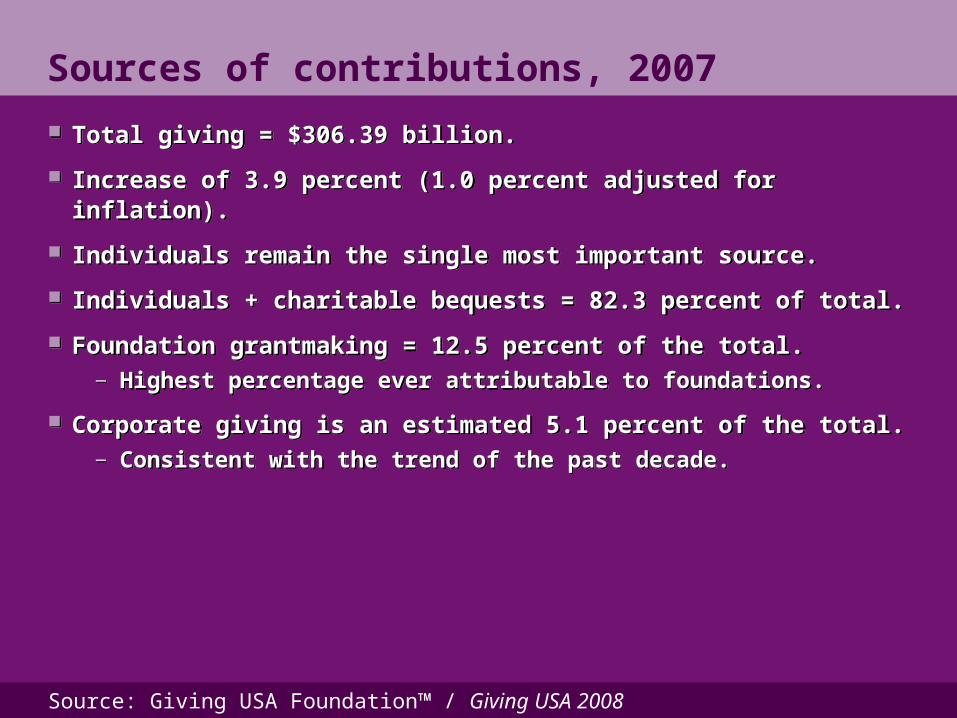
Total giving = $306.39 billion.
Increase of 3.9 percent (1.0 percent adjusted for inflation).
Individuals remain the single most important source.
Individuals + charitable bequests = 82.3 percent of total.
Foundation grantmaking = 12.5 percent of the total. — Highest percentage ever attributable to foundations.
Corporate giving is an estimated 5.1 percent of the total.— Consistent with the trend of the past decade.
Source: Giving USA Foundation™ / Giving USA 2008
EnvironmentEnvironmentand Animalsand Animals
$6.96$6.962.3%2.3%
FoundationsFoundations$27.73$27.73 9.1% 9.1%
HumanHumanServicesServices$29.64$29.64 9.7% 9.7%
InternationalInternationalAffairsAffairs$13.22$13.224.3%4.3%
Arts, Culture, Arts, Culture, and Humanitiesand Humanities
$13.67$13.674.5%4.5%Public-Society Public-Society
BenefitBenefit$22.65$22.657.4%7.4%
UnallocatedUnallocatedgivinggiving$23.67$23.677.7%7.7%
Health Health $23.15$23.157.6%7.6%
Religion $102.32 33.4%
EducationEducation$43.32$43.32 14.1% 14.1%
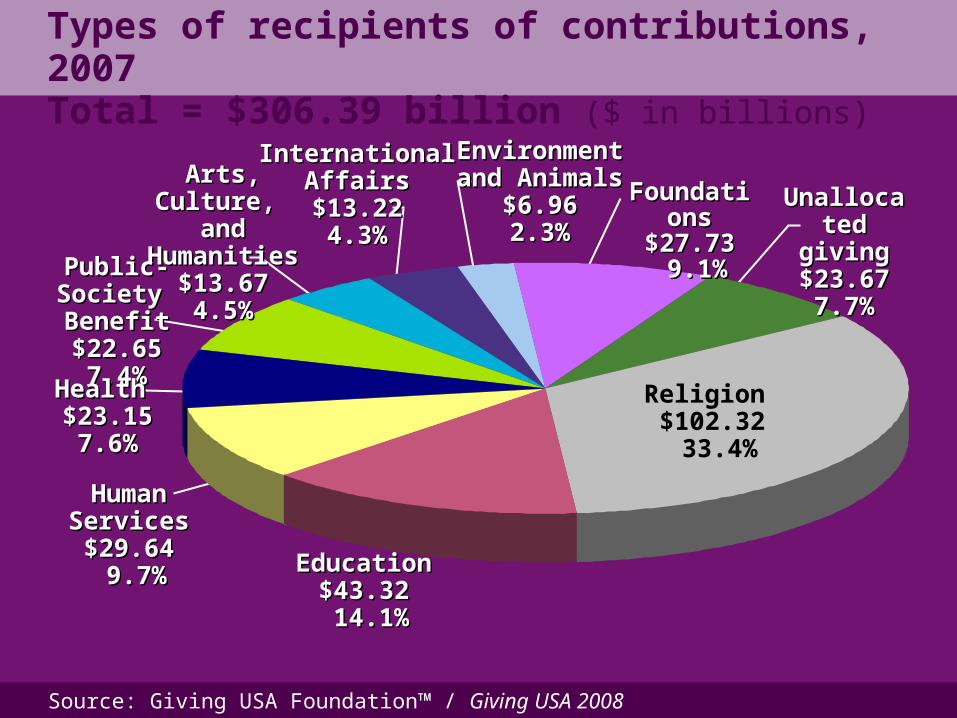
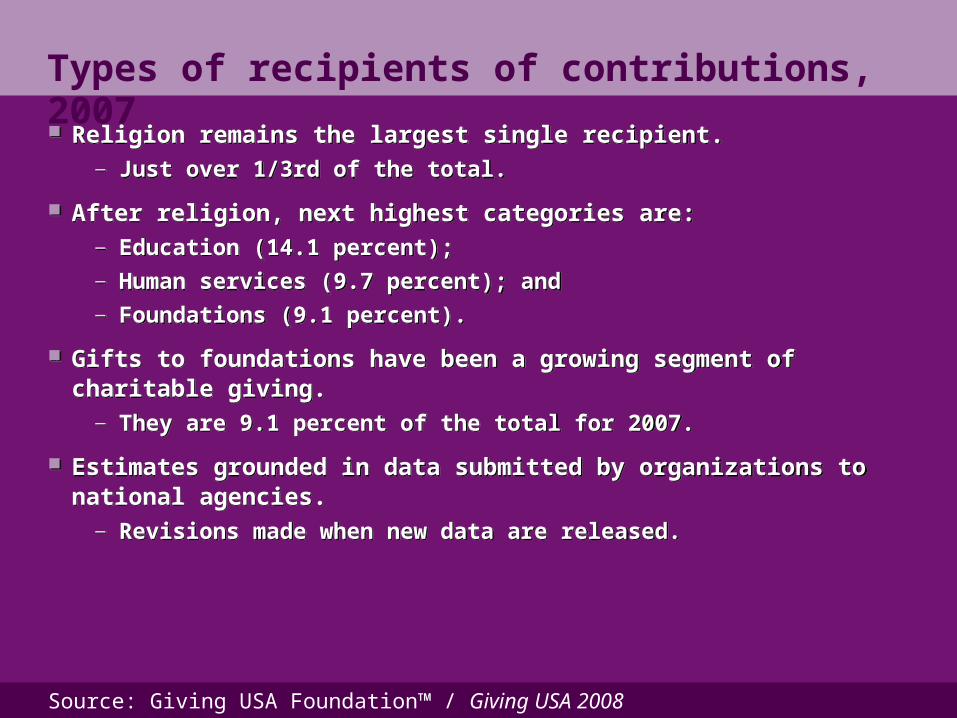
Types of recipients of contributions, 2007
Total = $306.39 billion ($ in billions)
Source: Giving USA Foundation™ / Giving USA 2008
Types of recipients of contributions, 2007
Religion remains the largest single recipient.— Just over 1/3rd of the total.
After religion, next highest categories are:— Education (14.1 percent);— Human services (9.7 percent); and — Foundations (9.1 percent).
Gifts to foundations have been a growing segment of charitable giving. — They are 9.1 percent of the total for 2007.
Estimates grounded in data submitted by organizations to national agencies.— Revisions made when new data are released.
Source: Giving USA Foundation™ / Giving USA 2008
-7.2%1.9%
7.7%10.3%
-7.7%6.9%
0.7%2.7%
0.4%3.9%
Corporate
Foundation
Bequest
Individual
Total
-7.2%1.9%
7.7%10.3%
-7.7%6.9%
0.7%2.7%
0.4%3.9%
Corporate
Foundation
Bequest
Individual
Total
Percentage change from previous yearPercentage change from previous year
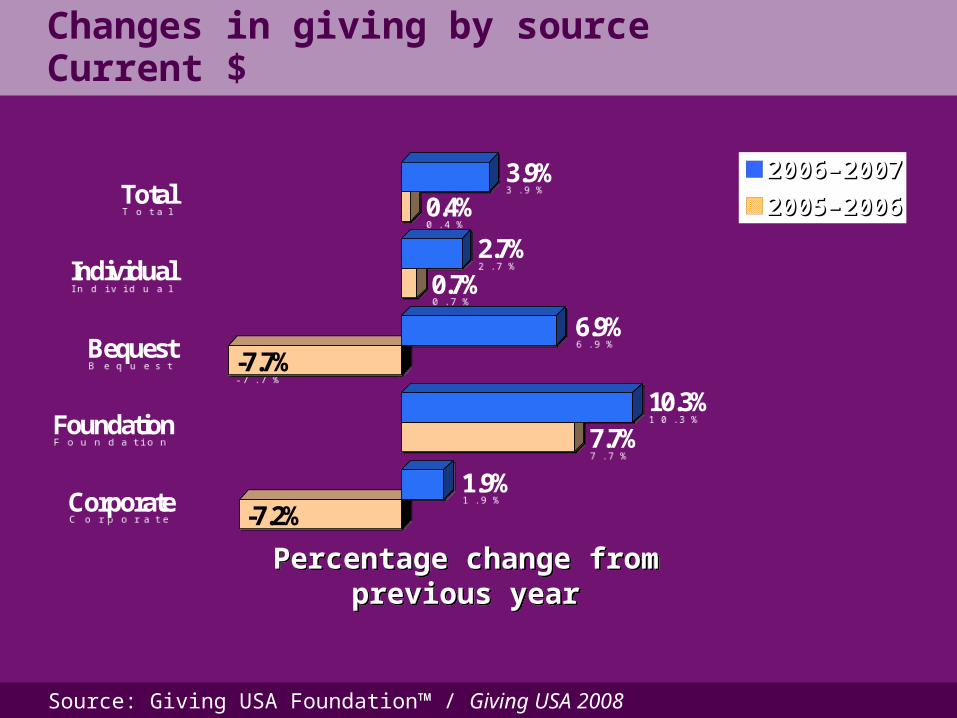
Changes in giving by sourceCurrent $
2006–20072006–2007
2005–20062005–2006
Source: Giving USA Foundation™ / Giving USA 2008
Changes in giving by sourceCurrent $
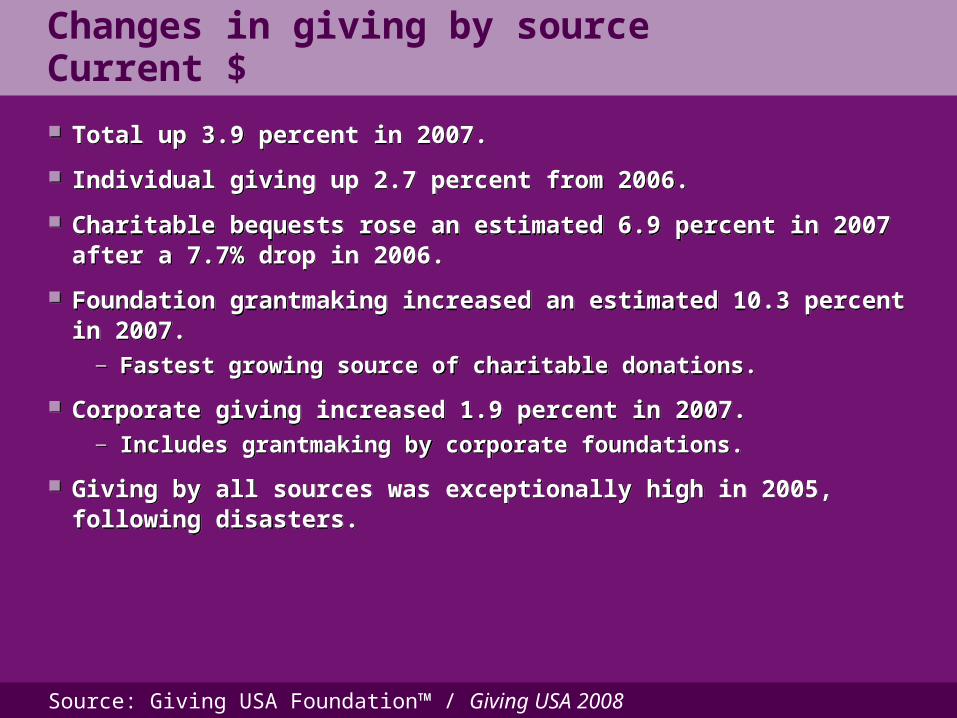
Total up 3.9 percent in 2007.
Individual giving up 2.7 percent from 2006.
Charitable bequests rose an estimated 6.9 percent in 2007 after a 7.7% drop in 2006.
Foundation grantmaking increased an estimated 10.3 percent in 2007. — Fastest growing source of charitable donations.
Corporate giving increased 1.9 percent in 2007. — Includes grantmaking by corporate foundations.
Giving by all sources was exceptionally high in 2005, following disasters.
Source: Giving USA Foundation™ / Giving USA 2008
-10.1%
-0.9%
4.3%7.3%
-10.6%4.0%
-2.4%
-0.1%
-2.8%
1.0%
Corporate
Foundation
Bequest
Individual
Total
-10.1%
-0.9%
4.3%7.3%
-10.6%4.0%
-2.4%
-0.1%
-2.8%
1.0%
Corporate
Foundation
Bequest
Individual
Total
Percentage change from previous yearPercentage change from previous year
Changes in giving by sourceInflation-adjusted $
2006–20072006–2007
2005–20062005–2006
Source: Giving USA Foundation™ / Giving USA 2008
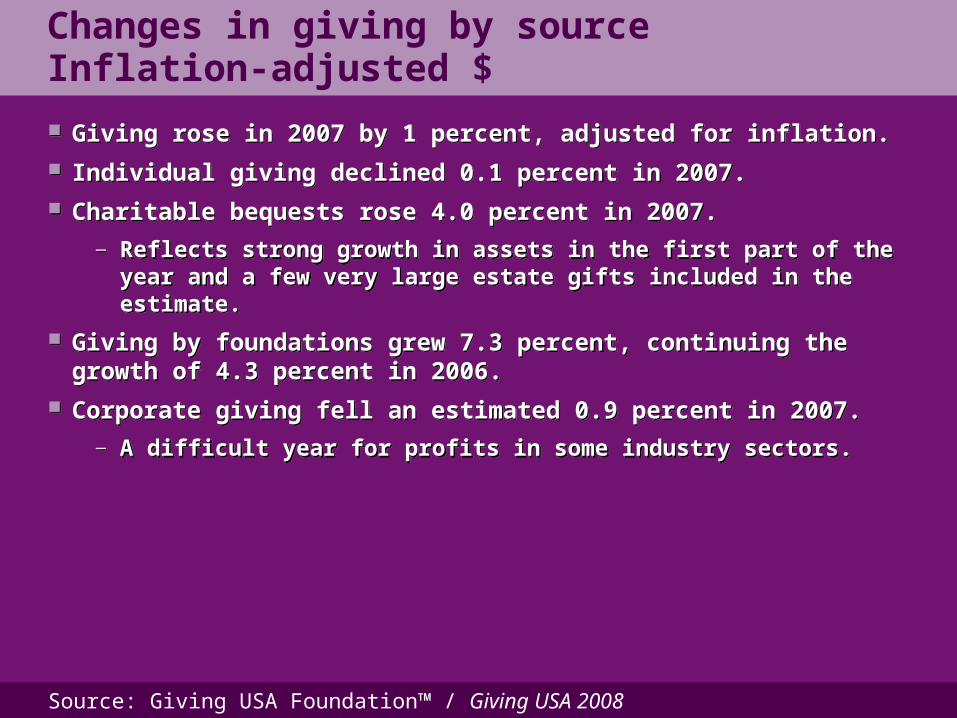
Changes in giving by sourceInflation-adjusted $
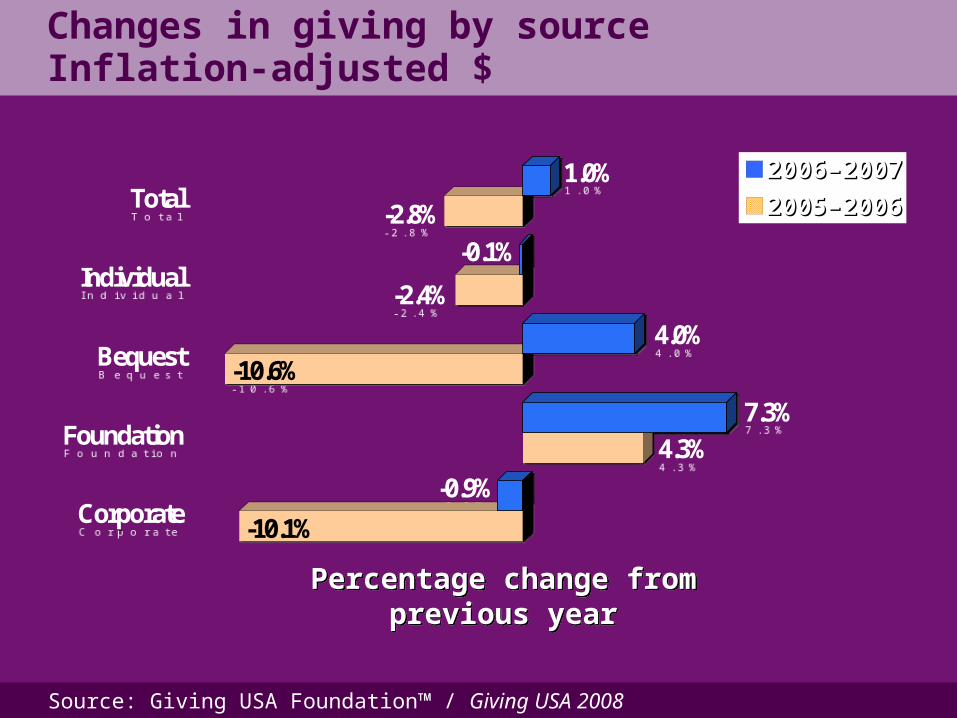
Giving rose in 2007 by 1 percent, adjusted for inflation. Individual giving declined 0.1 percent in 2007. Charitable bequests rose 4.0 percent in 2007.
— Reflects strong growth in assets in the first part of the year and a few very large estate gifts included in the estimate.
Giving by foundations grew 7.3 percent, continuing the growth of 4.3 percent in 2006.
Corporate giving fell an estimated 0.9 percent in 2007.— A difficult year for profits in some industry sectors.
Source: Giving USA Foundation™ / Giving USA 2008
4.8%10.8%
-25.0%16.1%
7.8%7.8%
0.6%5.8%
-2.3%5.4%
4.8%8.4%
9.2%6.4%
5.1%4.7%
Environment/animals
International affairs
Arts, culture, & humanities
Public-society benefit
Health
Human services
Education
Religion
4.8%10.8%
-25.0%16.1%
7.8%7.8%
0.6%5.8%
-2.3%5.4%
4.8%8.4%
9.2%6.4%
5.1%4.7%
Environment/animals
International affairs
Arts, culture, & humanities
Public-society benefit
Health
Human services
Education
Religion
Percentage change from previous yearPercentage change from previous year
Changes in giving by recipient organizationCurrent $
2006–20072006–2007
2005–20062005–2006
Source: Giving USA Foundation™ / Giving USA 2008
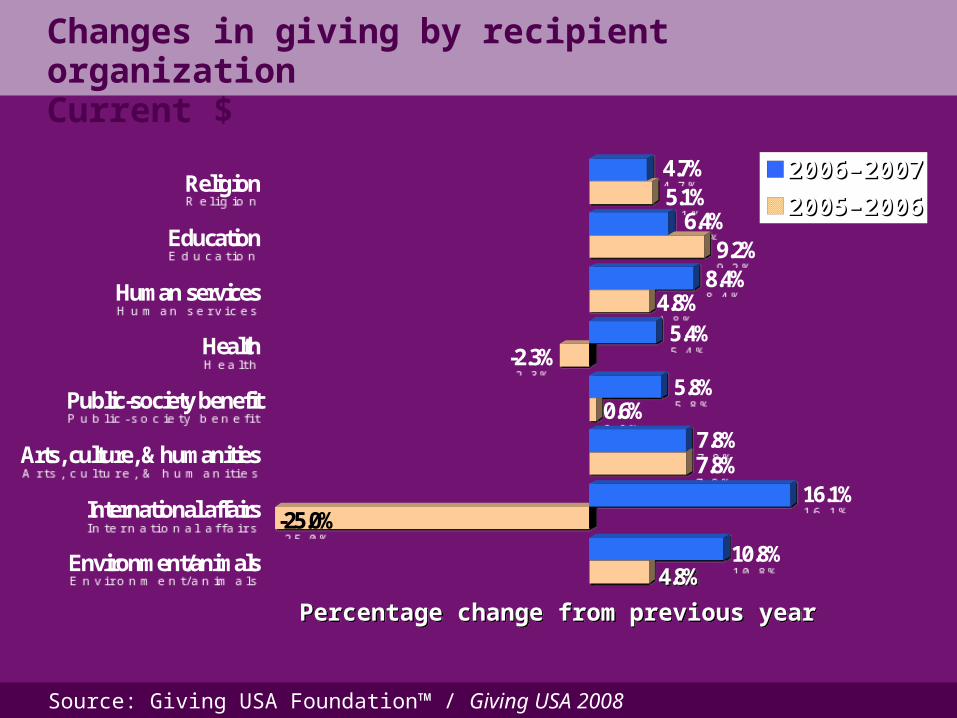
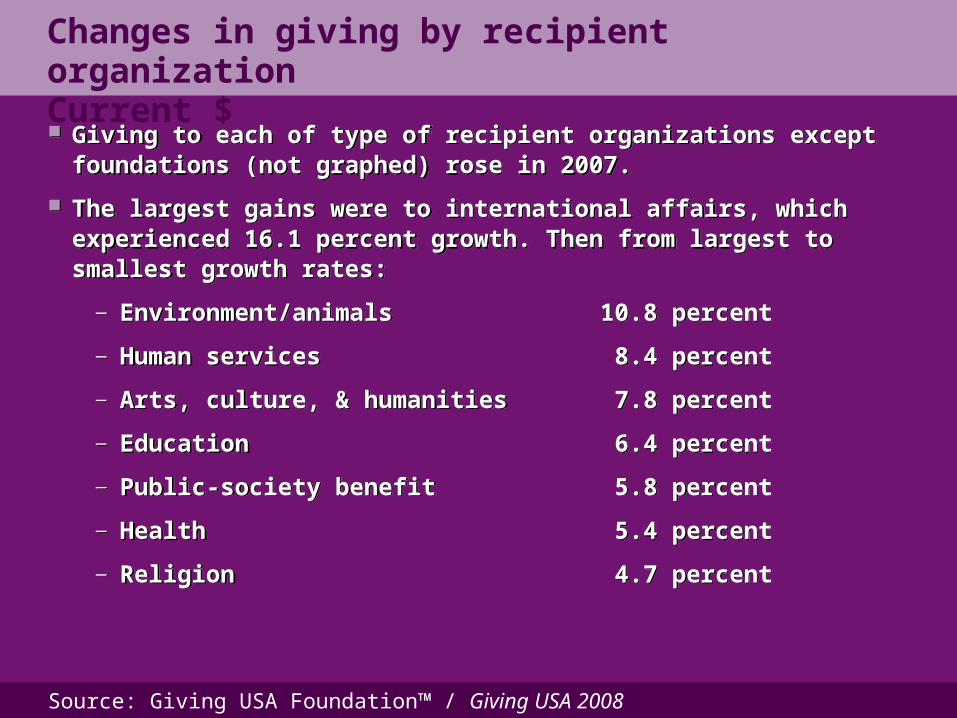
Giving to each of type of recipient organizations except foundations (not graphed) rose in 2007.
The largest gains were to international affairs, which experienced 16.1 percent growth. Then from largest to smallest growth rates:
— Environment/animals 10.8 percent
— Human services 8.4 percent
— Arts, culture, & humanities 7.8 percent
— Education 6.4 percent
— Public-society benefit 5.8 percent
— Health 5.4 percent
— Religion 4.7 percent
Changes in giving by recipient organizationCurrent $
Source: Giving USA Foundation™ / Giving USA 2008
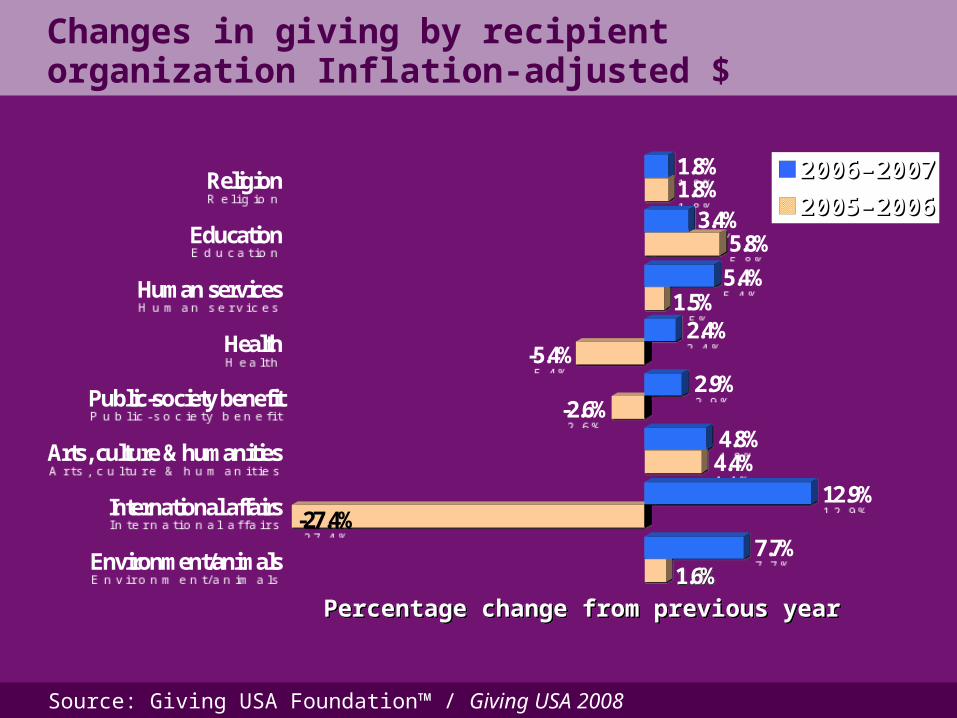
Percentage change from previous yearPercentage change from previous year
Changes in giving by recipient organization Inflation-adjusted $
1.6%7.7%
-27.4%12.9%
4.4%4.8%
-2.6%2.9%
-5.4%2.4%
1.5%5.4%
5.8%3.4%
1.8%1.8%
Environment/animals
International affairs
Arts, culture & humanities
Public-society benefit
Health
Human services
Education
Religion
1.6%7.7%
-27.4%12.9%
4.4%4.8%
-2.6%2.9%
-5.4%2.4%
1.5%5.4%
5.8%3.4%
1.8%1.8%
Environment/animals
International affairs
Arts, culture & humanities
Public-society benefit
Health
Human services
Education
Religion 2006–20072006–2007
2005–20062005–2006
Source: Giving USA Foundation™ / Giving USA 2008
Even after adjusting for inflation, all subsectors (except foundations—not graphed) saw growth in giving in 2007.
Religion saw about same rate of growth as in 2006.
Education slowed rate of growth compared with 2006.
Other subsectors saw giving increase more in 2007 than in 2006.
2007’s fastest growth, 12.9 percent, was in the international affairs subsector.
Changes in giving by recipient organization Inflation-adjusted $
Source: Giving USA Foundation™ / Giving USA 2008
0
50
100
150
200
250
300
350
1967 1972 1977 1982 1987 1992 1997 2002 20070
50
100
150
200
250
300
350
1967 1972 1977 1982 1987 1992 1997 2002 2007
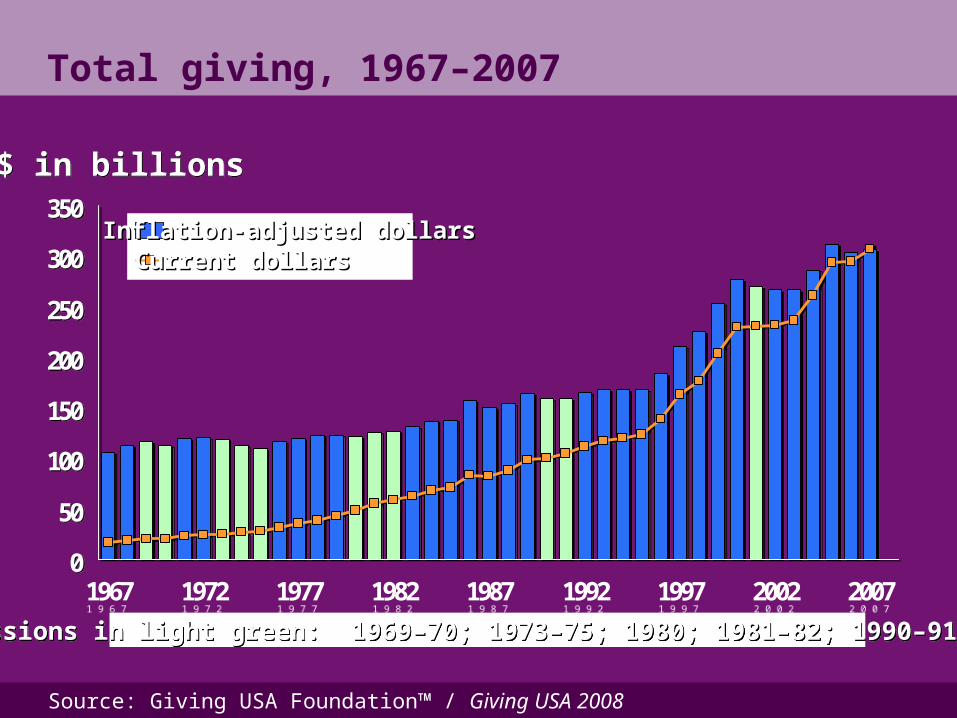
Recessions in light green: 1969–70; 1973–75; 1980; 1981–82; 1990–91; 2001Recessions in light green: 1969–70; 1973–75; 1980; 1981–82; 1990–91; 2001
Inflation-adjusted dollarsInflation-adjusted dollarsCurrent dollarsCurrent dollars
Total giving, 1967–2007
$ in billions$ in billions
Source: Giving USA Foundation™ / Giving USA 2008
Total giving, 1967–2007
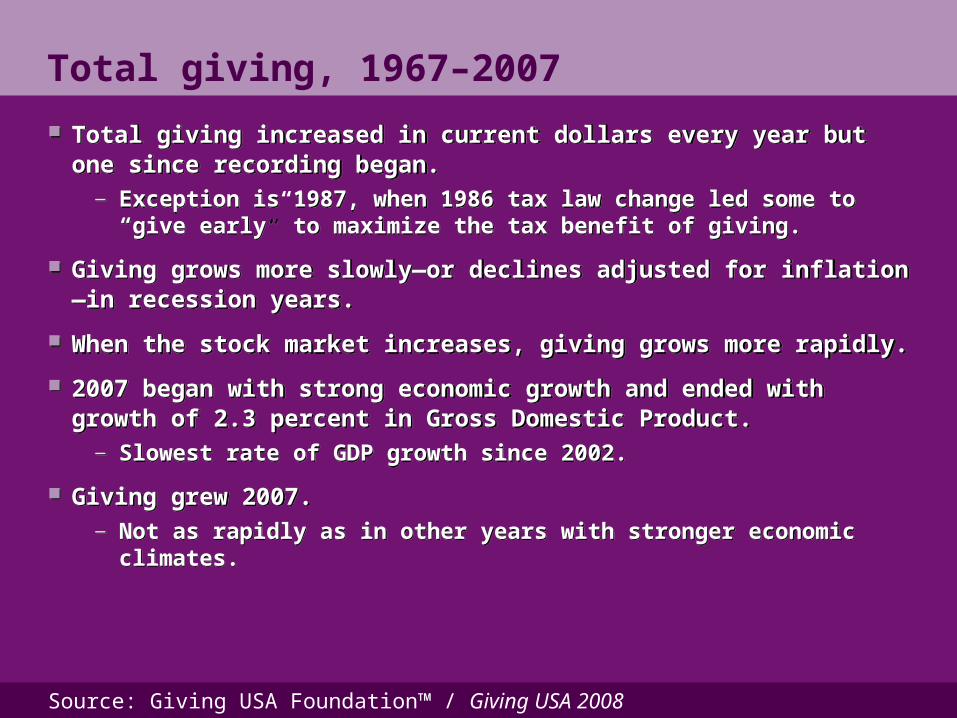
Total giving increased in current dollars every year but one since recording began. — Exception is 1987, when 1986 tax law change led some to
“give early” to maximize the tax benefit of giving.
Giving grows more slowly—or declines adjusted for inflation—in recession years.
When the stock market increases, giving grows more rapidly.
2007 began with strong economic growth and ended with growth of 2.3 percent in Gross Domestic Product.— Slowest rate of GDP growth since 2002.
Giving grew 2007.— Not as rapidly as in other years with stronger economic
climates.
Source: Giving USA Foundation™ / Giving USA 2008
306.39
172.40
24.44
162.99111.79
17.0335.21
59.1182.20
266.88
210.55
165.20
120.45150.03
127.00105.71
121.23
1967 1972 1977 1982 1987 1992 1997 2002 2007
306.39
172.40
24.44
162.99111.79
17.0335.21
59.1182.20
266.88
210.55
165.20
120.45150.03
127.00105.71
121.23
1967 1972 1977 1982 1987 1992 1997 2002 2007
Total giving and trends for total giving: 1967–2007
Current dollarsCurrent dollarsInflation-adjusted dollarsInflation-adjusted dollars
Real rate of growthReal rate of growth
$ in billions$ in billions
Source: Giving USA Foundation™ / Giving USA 2008
Total giving and trends for total giving: 1967–2007
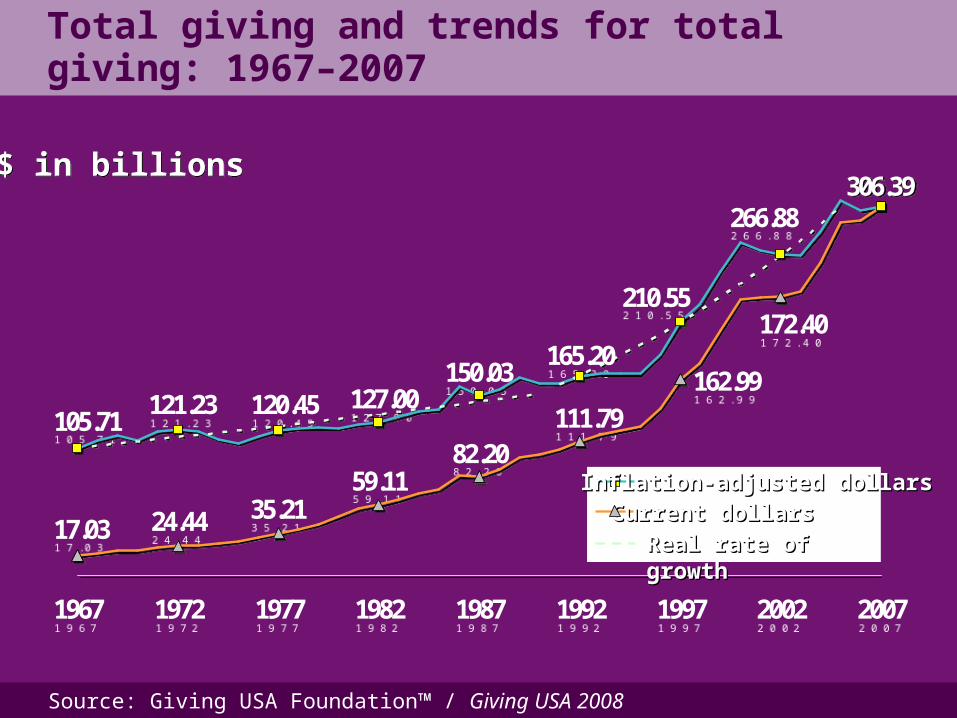
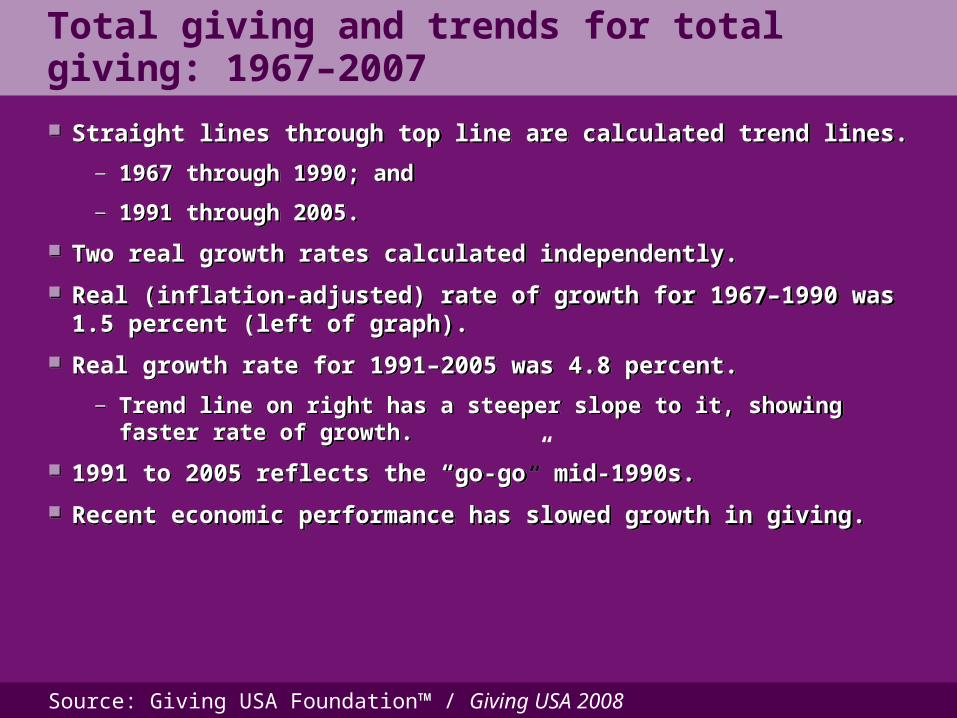
Straight lines through top line are calculated trend lines.
— 1967 through 1990; and
— 1991 through 2005.
Two real growth rates calculated independently.
Real (inflation-adjusted) rate of growth for 1967–1990 was 1.5 percent (left of graph).
Real growth rate for 1991–2005 was 4.8 percent.
— Trend line on right has a steeper slope to it, showing faster rate of growth.
1991 to 2005 reflects the “go-go” mid-1990s.
Recent economic performance has slowed growth in giving.
Source: Giving USA Foundation™ / Giving USA 2008
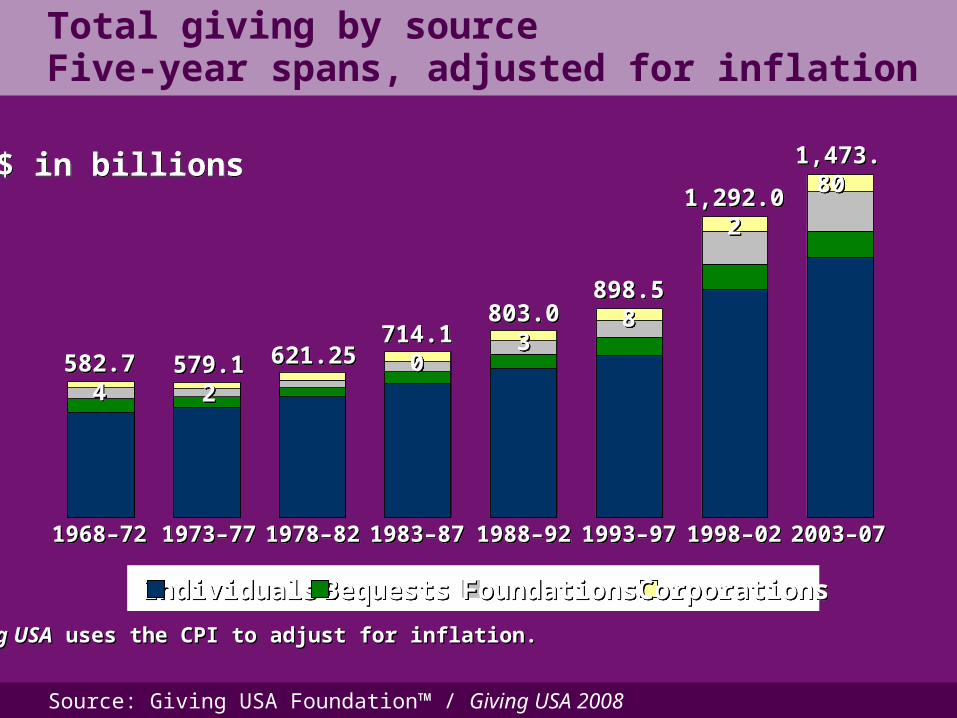
Giving USAGiving USA uses the CPI to adjust for inflation. uses the CPI to adjust for inflation.
IndividualsIndividuals BequestsBequests FoundationsFoundations CorporationsCorporations
1968–721968–72 2003–072003–071998–021998–021993–971993–971988–921988–921983–871983–871978–821978–821973–771973–77
582.74582.74 579.12579.12 621.25621.25714.10714.10
803.03803.03898.58898.58
1,292.021,292.02
1,473.80 1,473.80
Total giving by sourceFive-year spans, adjusted for inflation
$ in billions$ in billions
Source: Giving USA Foundation™ / Giving USA 2008
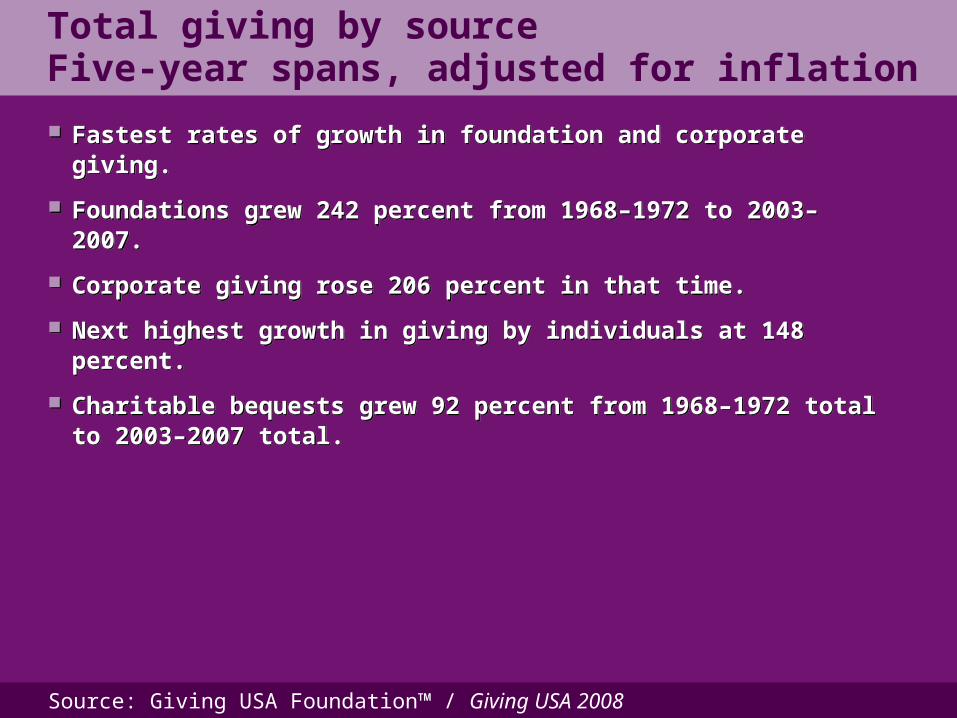
Total giving by sourceFive-year spans, adjusted for inflation
Fastest rates of growth in foundation and corporate giving.
Foundations grew 242 percent from 1968–1972 to 2003–2007.
Corporate giving rose 206 percent in that time.
Next highest growth in giving by individuals at 148 percent.
Charitable bequests grew 92 percent from 1968–1972 total to 2003–2007 total.
Source: Giving USA Foundation™ / Giving USA 2008
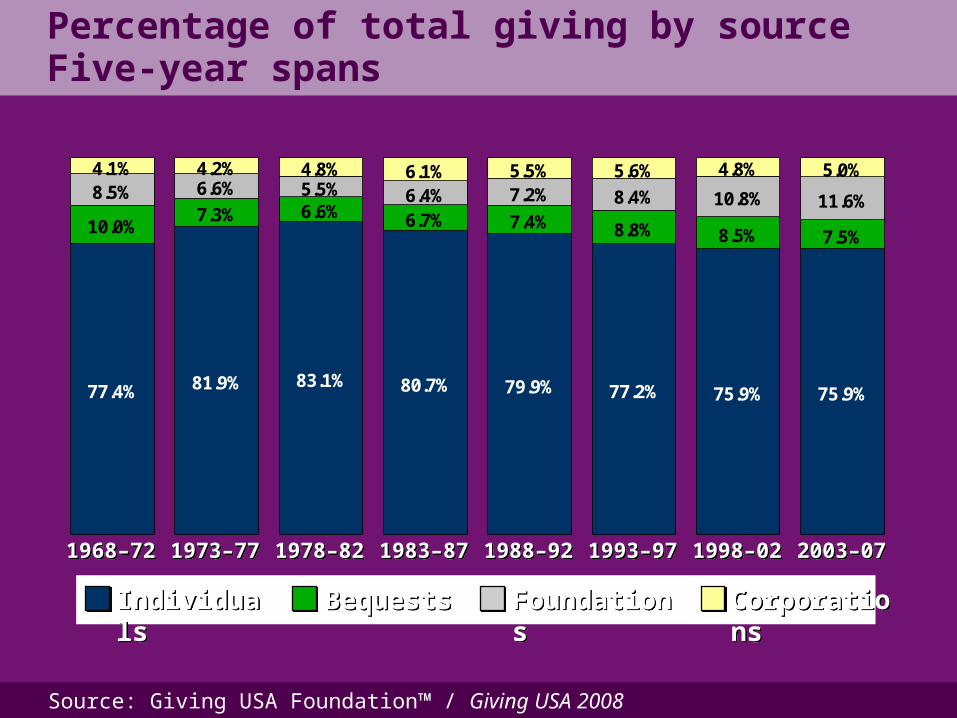
77.4% 81.9% 83.1% 80.7% 79.9% 77.2% 75.9% 75.9%
10.0%7.3% 6.6% 6.7% 7.4% 8.8% 8.5% 7.5%
8.5% 6.6% 5.5% 6.4% 7.2% 8.4% 10.8% 11.6%
4.1% 4.2% 4.8% 6.1% 5.5% 5.6% 4.8% 5.0%
IndividualsIndividuals BequestsBequests FoundationsFoundations CorporationsCorporations
Percentage of total giving by sourceFive-year spans
1968–721968–72 2003–072003–071998–021998–021993–971993–971988–921988–921983–871983–871978–821978–821973–771973–77
Source: Giving USA Foundation™ / Giving USA 2008
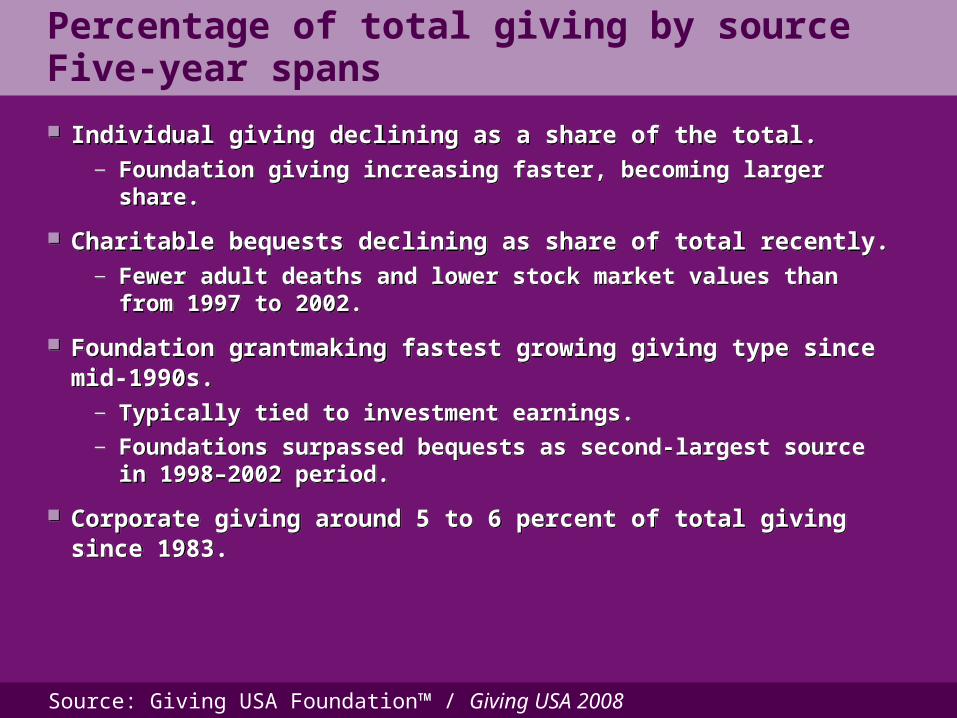
Percentage of total giving by sourceFive-year spans
Individual giving declining as a share of the total. — Foundation giving increasing faster, becoming larger share.
Charitable bequests declining as share of total recently.— Fewer adult deaths and lower stock market values than
from 1997 to 2002.
Foundation grantmaking fastest growing giving type since mid-1990s. — Typically tied to investment earnings.— Foundations surpassed bequests as second-largest source
in 1998–2002 period.
Corporate giving around 5 to 6 percent of total giving since 1983.
Source: Giving USA Foundation™ / Giving USA 2008
Giving by individuals, 1967–2007
$ in billions$ in billions
64.5347.63
29.5513.41
87.7124.20
19.37
172.40
229.03
96.0883.24
102.34117.78
101.09
129.60
160.44
199.25
1967 1972 1977 1982 1987 1992 1997 2002 2007
64.5347.63
29.5513.41
87.7124.20
19.37
172.40
229.03
96.0883.24
102.34117.78
101.09
129.60
160.44
199.25
1967 1972 1977 1982 1987 1992 1997 2002 2007
Current dollarsCurrent dollarsInflation-adjusted dollarsInflation-adjusted dollars
Real rate of growthReal rate of growth
Source: Giving USA Foundation™ / Giving USA 2008
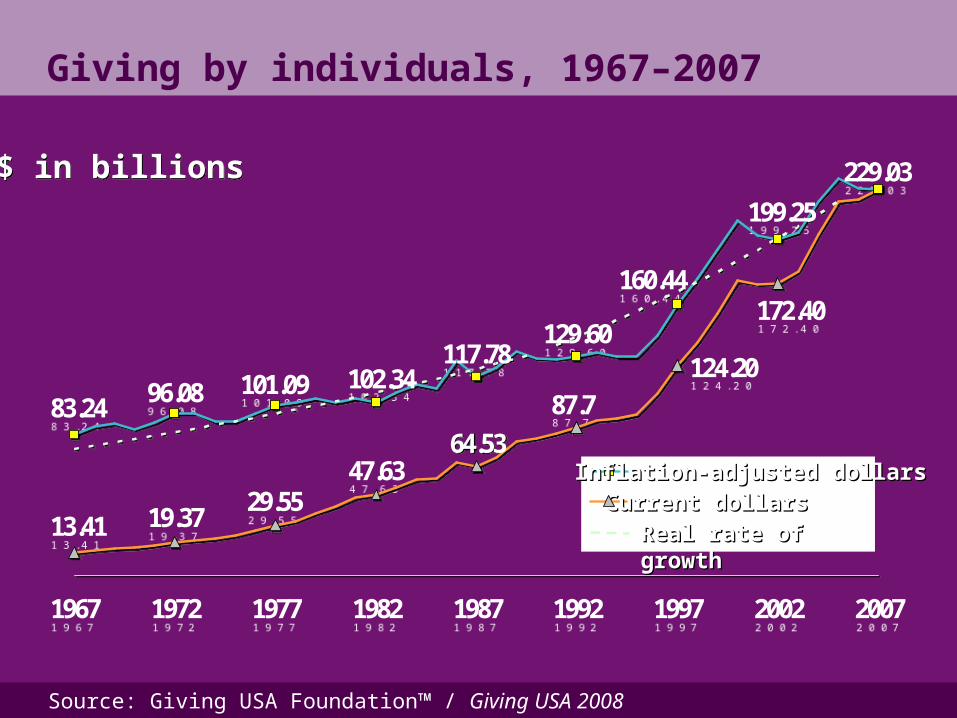
Giving by individuals, 1967–2007
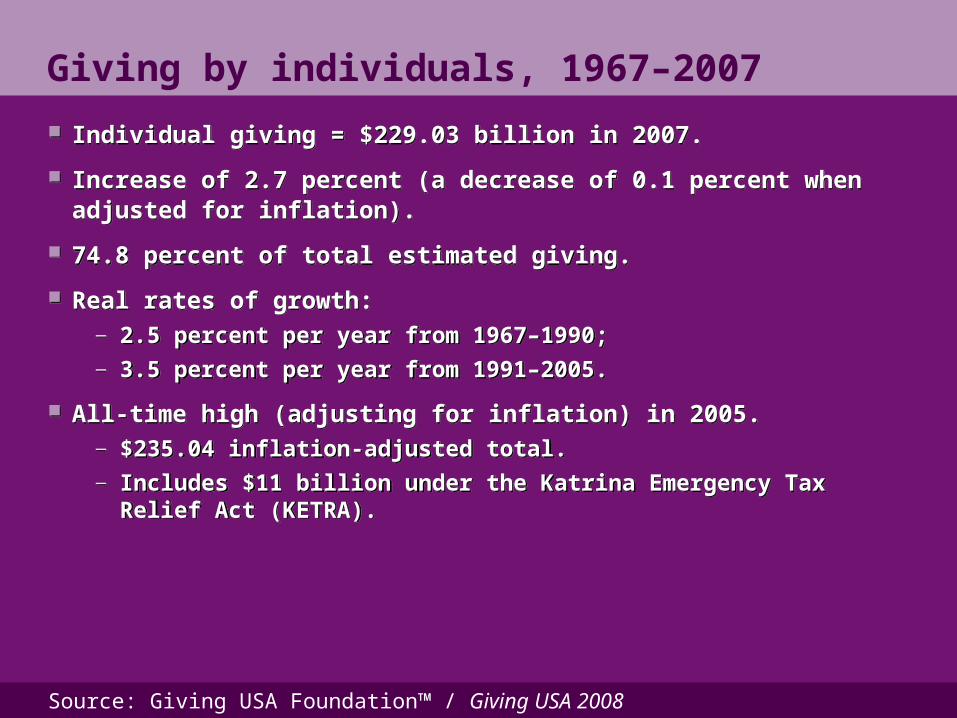
Individual giving = $229.03 billion in 2007.
Increase of 2.7 percent (a decrease of 0.1 percent when adjusted for inflation).
74.8 percent of total estimated giving.
Real rates of growth:— 2.5 percent per year from 1967–1990;— 3.5 percent per year from 1991–2005.
All-time high (adjusting for inflation) in 2005.— $235.04 inflation-adjusted total.— Includes $11 billion under the Katrina Emergency Tax
Relief Act (KETRA).
Source: Giving USA Foundation™ / Giving USA 2008
Giving by bequest, 1967–2007
$ in billions$ in billions
23.15
20.90
2.10
16.25
9.54
1.40 2.125.21
6.58
24.09
20.99
14.10
7.25
12.0111.198.69
10.42
1967 1972 1977 1982 1987 1992 1997 2002 2007
23.15
20.90
2.10
16.25
9.54
1.40 2.125.21
6.58
24.09
20.99
14.10
7.25
12.0111.198.69
10.42
1967 1972 1977 1982 1987 1992 1997 2002 2007
Current dollarsCurrent dollarsInflation-adjusted dollarsInflation-adjusted dollars
Real rate of growthReal rate of growth
Source: Giving USA Foundation™ / Giving USA 2008
Giving by bequest, 1967–2007
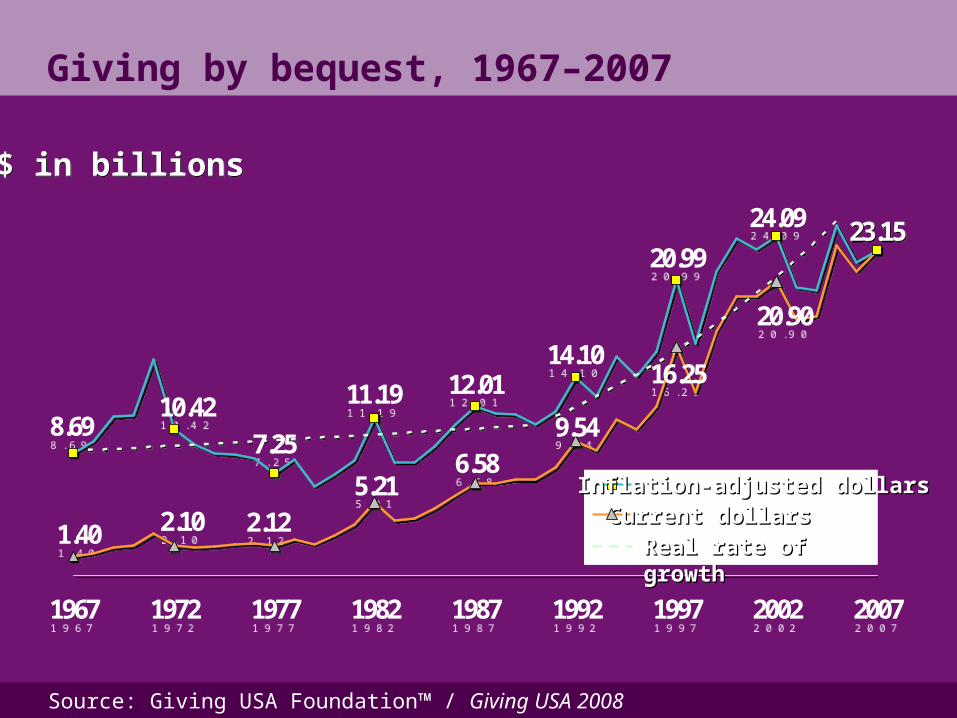
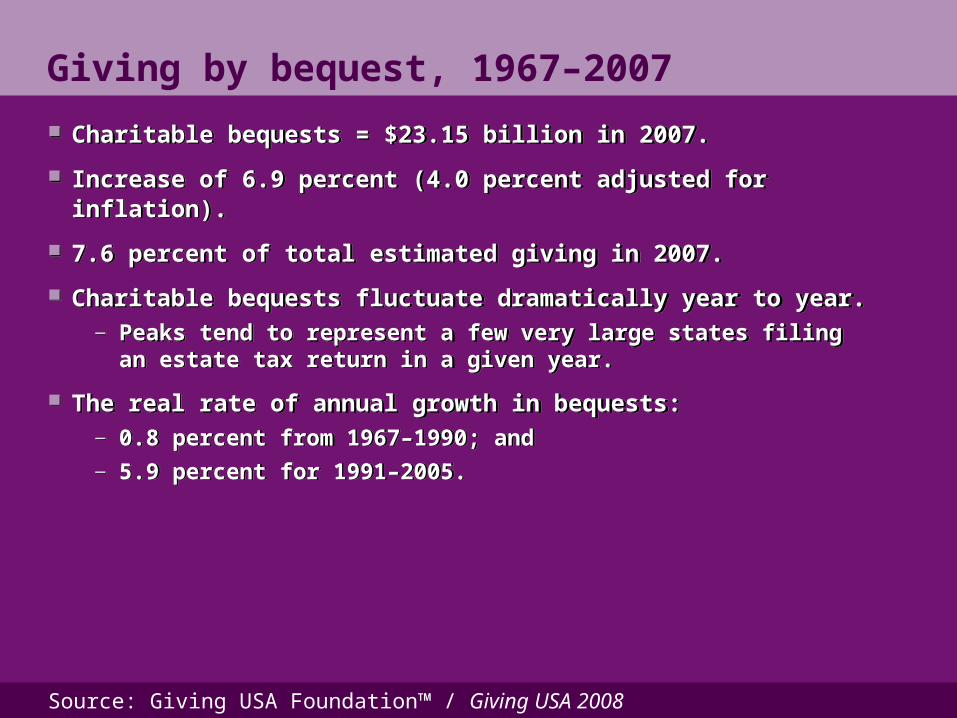
Charitable bequests = $23.15 billion in 2007.
Increase of 6.9 percent (4.0 percent adjusted for inflation).
7.6 percent of total estimated giving in 2007.
Charitable bequests fluctuate dramatically year to year.— Peaks tend to represent a few very large states filing
an estate tax return in a given year.
The real rate of annual growth in bequests:— 0.8 percent from 1967–1990; and — 5.9 percent for 1991–2005.
Source: Giving USA Foundation™ / Giving USA 2008
Data: The Foundation CenterData: The Foundation Center
Giving by foundations, 1967–2007
$ in billions$ in billions
5.883.162.001.40
8.6413.92
2.00
26.98
38.52
9.928.696.79
10.736.84
12.77
17.98
31.10
1967 1972 1977 1982 1987 1992 1997 2002 2007
5.883.162.001.40
8.6413.92
2.00
26.98
38.52
9.928.696.79
10.736.84
12.77
17.98
31.10
1967 1972 1977 1982 1987 1992 1997 2002 2007
Current dollarsCurrent dollarsInflation-adjusted dollarsInflation-adjusted dollars
Real rate of growthReal rate of growth
Source: Giving USA Foundation™ / Giving USA 2008
Giving by foundations, 1967–2007
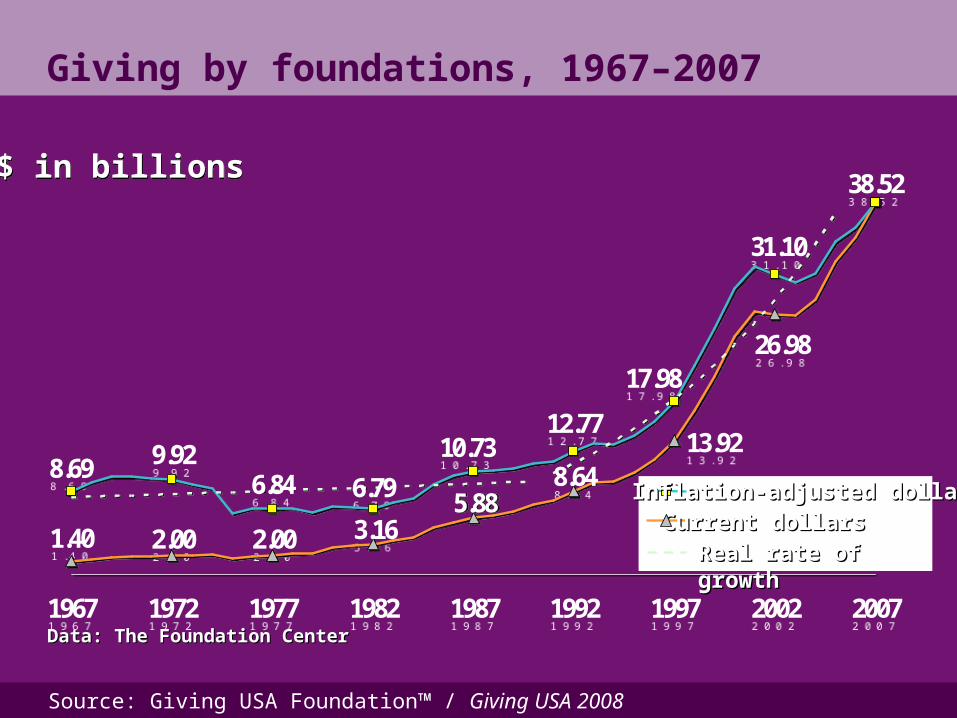
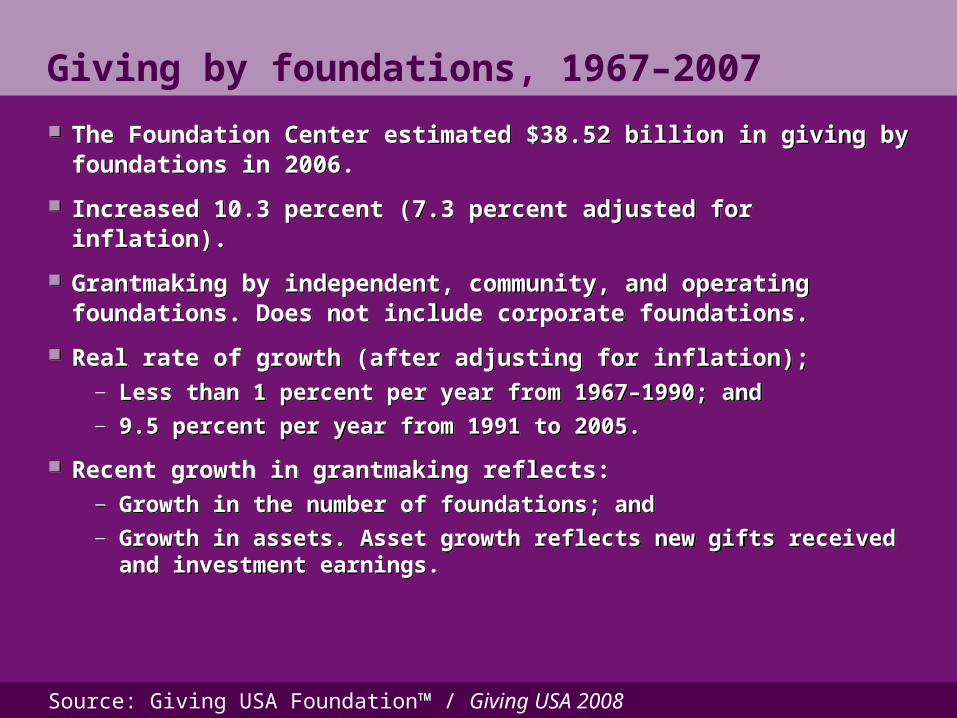
The Foundation Center estimated $38.52 billion in giving by foundations in 2006.
Increased 10.3 percent (7.3 percent adjusted for inflation).
Grantmaking by independent, community, and operating foundations. Does not include corporate foundations.
Real rate of growth (after adjusting for inflation);— Less than 1 percent per year from 1967–1990; and — 9.5 percent per year from 1991 to 2005.
Recent growth in grantmaking reflects: — Growth in the number of foundations; and — Growth in assets. Asset growth reflects new gifts received
and investment earnings.
Source: Giving USA Foundation™ / Giving USA 2008
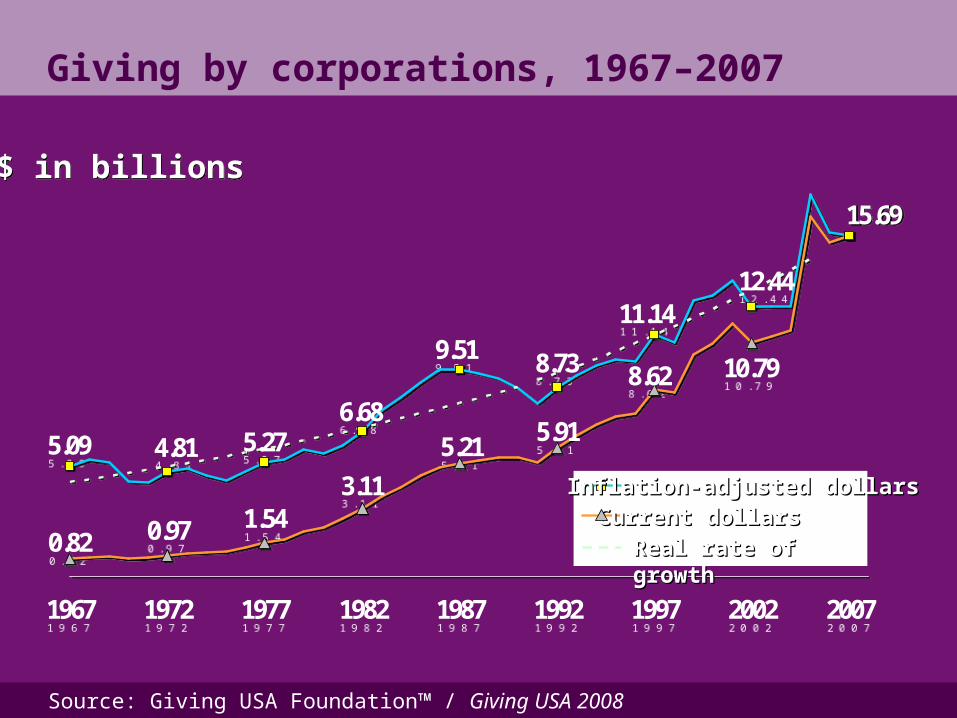
15.69
10.79
0.97
8.62
5.91
0.821.54
3.11
5.21
12.4411.14
8.73
5.27
9.51
6.685.09 4.81
1967 1972 1977 1982 1987 1992 1997 2002 2007
15.69
10.79
0.97
8.62
5.91
0.821.54
3.11
5.21
12.4411.14
8.73
5.27
9.51
6.685.09 4.81
1967 1972 1977 1982 1987 1992 1997 2002 2007
Giving by corporations, 1967–2007
$ in billions$ in billions
Current dollarsCurrent dollarsInflation-adjusted dollarsInflation-adjusted dollars
Real rate of growthReal rate of growth
Source: Giving USA Foundation™ / Giving USA 2008
Giving by corporations, 1967–2007
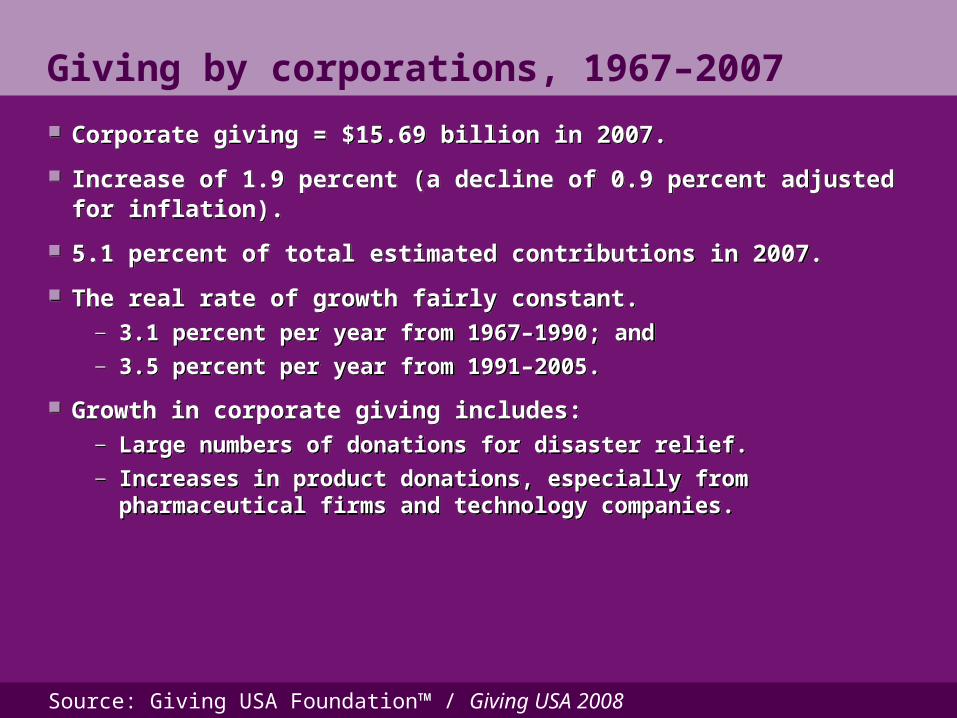
Corporate giving = $15.69 billion in 2007.
Increase of 1.9 percent (a decline of 0.9 percent adjusted for inflation).
5.1 percent of total estimated contributions in 2007.
The real rate of growth fairly constant. — 3.1 percent per year from 1967–1990; and — 3.5 percent per year from 1991–2005.
Growth in corporate giving includes: — Large numbers of donations for disaster relief.— Increases in product donations, especially from
pharmaceutical firms and technology companies.
Source: Giving USA Foundation™ / Giving USA 2008
Data are rounded.Data are rounded.
1967 1972 1977 1982 1987 1992 1997 2002 20071967 1972 1977 1982 1987 1992 1997 2002 2007
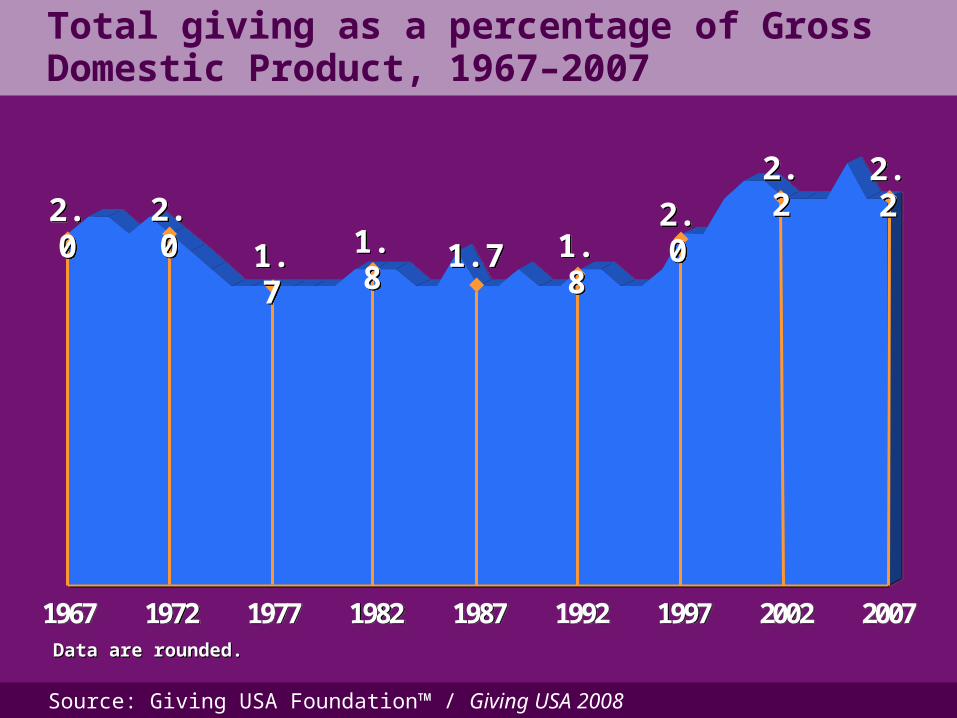
2.22.22.22.2
2.02.01.81.81.71.71.81.81.71.7
2.02.02.02.0
Total giving as a percentage of Gross Domestic Product, 1967–2007
Source: Giving USA Foundation™ / Giving USA 2008
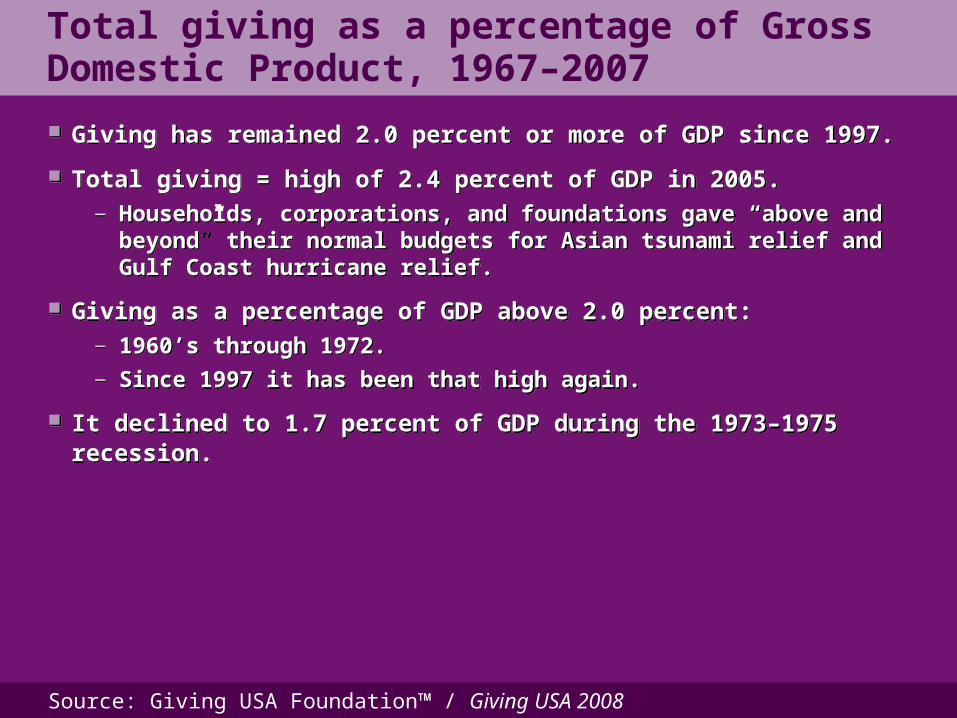
Total giving as a percentage of Gross Domestic Product, 1967–2007
Giving has remained 2.0 percent or more of GDP since 1997.
Total giving = high of 2.4 percent of GDP in 2005. — Households, corporations, and foundations gave “above and
beyond” their normal budgets for Asian tsunami relief and Gulf Coast hurricane relief.
Giving as a percentage of GDP above 2.0 percent:— 1960’s through 1972. — Since 1997 it has been that high again.
It declined to 1.7 percent of GDP during the 1973–1975 recession.
Source: Giving USA Foundation™ / Giving USA 2008
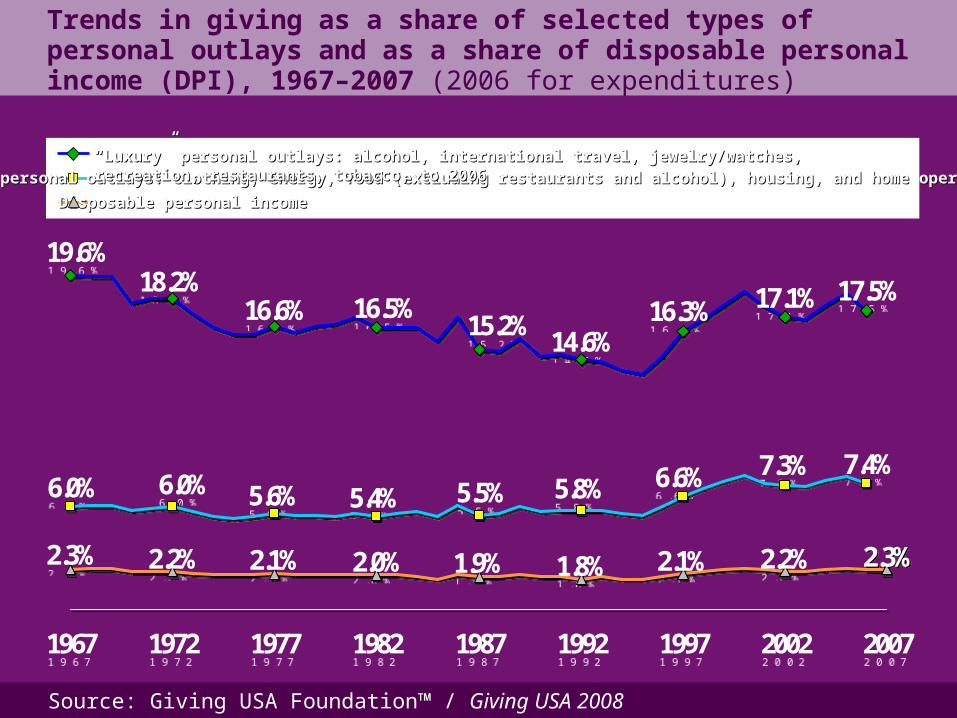
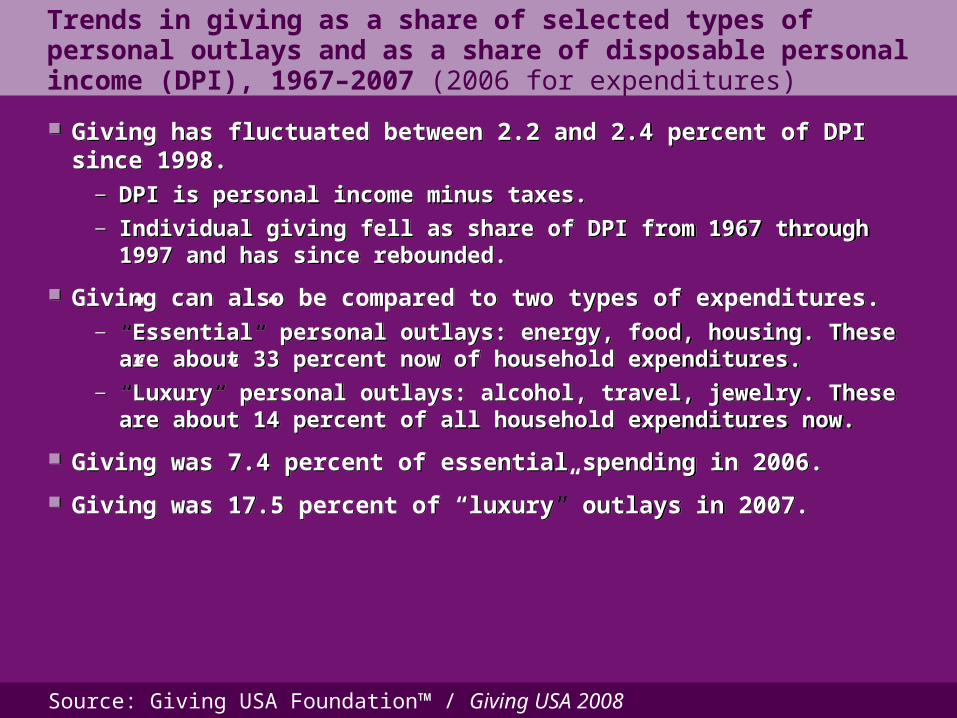
Trends in giving as a share of selected types of personal outlays and as a share of disposable personal income (DPI), 1967–2007 (2006 for expenditures)
Disposable personal incomeDisposable personal income
““Essential” personal outlays: clothing, energy, food (excluding restaurants and alcohol), housing, and home operations, to 2006Essential” personal outlays: clothing, energy, food (excluding restaurants and alcohol), housing, and home operations, to 2006““Luxury” personal outlays: alcohol, international travel, jewelry/watches, recreation, restaurants, tobacco, to 2006Luxury” personal outlays: alcohol, international travel, jewelry/watches, recreation, restaurants, tobacco, to 2006
2.3%2.2%2.2% 2.1%1.8%2.3% 2.1% 2.0% 1.9%
7.4%7.3%6.6%5.8%5.6% 5.5%5.4%6.0% 6.0%
19.6%18.2%
16.6% 16.5%15.2%
14.6%16.3% 17.1% 17.5%
1967 1972 1977 1982 1987 1992 1997 2002 2007
2.3%2.2%2.2% 2.1%1.8%2.3% 2.1% 2.0% 1.9%
7.4%7.3%6.6%5.8%5.6% 5.5%5.4%6.0% 6.0%
19.6%18.2%
16.6% 16.5%15.2%
14.6%16.3% 17.1% 17.5%
1967 1972 1977 1982 1987 1992 1997 2002 2007
Source: Giving USA Foundation™ / Giving USA 2008
Giving has fluctuated between 2.2 and 2.4 percent of DPI since 1998. — DPI is personal income minus taxes. — Individual giving fell as share of DPI from 1967 through 1997
and has since rebounded.
Giving can also be compared to two types of expenditures.— ”Essential” personal outlays: energy, food, housing. These
are about 33 percent now of household expenditures.— ”Luxury” personal outlays: alcohol, travel, jewelry. These are
about 14 percent of all household expenditures now.
Giving was 7.4 percent of essential spending in 2006.
Giving was 17.5 percent of “luxury” outlays in 2007.
Trends in giving as a share of selected types of personal outlays and as a share of disposable personal income (DPI), 1967–2007 (2006 for expenditures)
Source: Giving USA Foundation™ / Giving USA 2008
1967 1972 1977 1982 1987 1992 1997 2002 20071967 1972 1977 1982 1987 1992 1997 2002 2007 Data are rounded.Data are rounded.
1.00.90.9
0.70.7
1.61.6 1.61.6
1.31.31.11.1
1.41.4
0.80.8
Corporate giving as a percentage of corporate pretax profits, 1967–2007
Source: Giving USA Foundation™ / Giving USA 2008
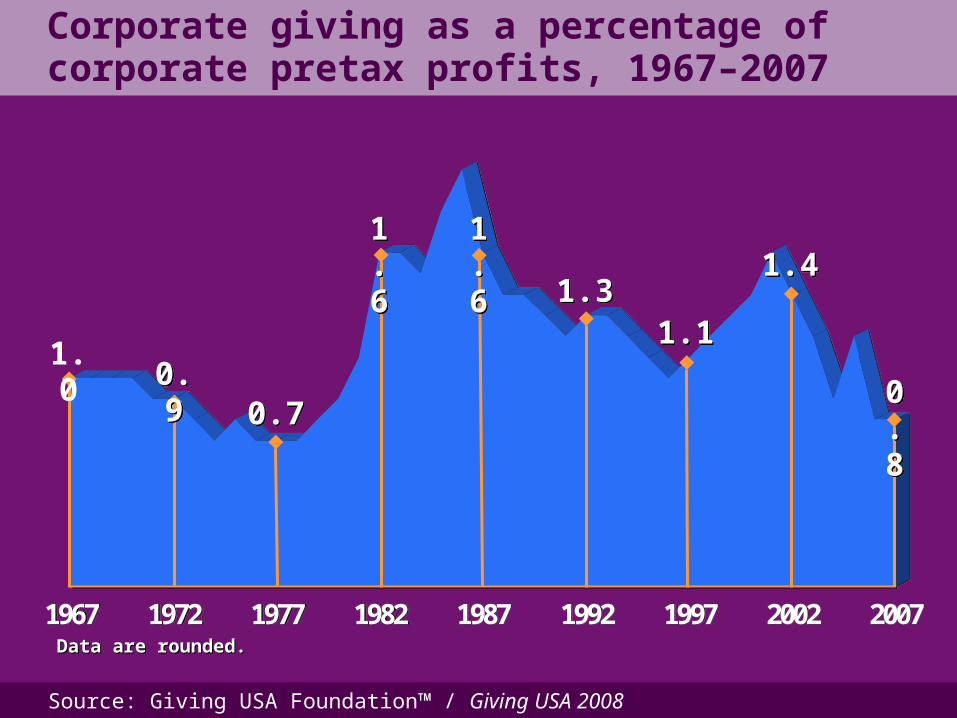
Corporate giving as a percentage of corporate pretax profits, 1967–2007
Corporate giving includes cash, corporate foundation grantmaking, and in-kind donations.
Giving as a percentage of corporate pre-tax profits has fluctuated over time. This is from movement in BOTH parts of the calculation:— Profits sometimes change faster than giving changes.— Giving sometimes changes faster than profits change.
From 1993 through 1999 and 2004 through 2005, giving and profits both increased at similar rates.
Source: Giving USA Foundation™ / Giving USA 2008
Giving by type of recipientFive-year spans, adjusted for inflation
1968–72 1973–77 1978–82 1983–87 1988–92 1993–97 1998–2002 2003–071968–72 1973–77 1978–82 1983–87 1988–92 1993–97 1998–2002 2003–07
Data in Data in Giving USAGiving USA book. book.
ReligionReligion EducationEducation FoundationsFoundations
Human ServicesHuman Services HealthHealth Public-Society BenefitPublic-Society Benefit
Arts, Culture and HumanitiesArts, Culture and Humanities International AffairsInternational Affairs Environment/AnimalsEnvironment/Animals
502.8502.8 522.5522.5 555.3555.3655.7655.7
744.8744.8873.3873.3
1,216.01,216.01,344.9 1,344.9 $ in billions$ in billions
Source: Giving USA Foundation™ / Giving USA 2008
Giving by type of recipientFive-year spans, adjusted for inflation
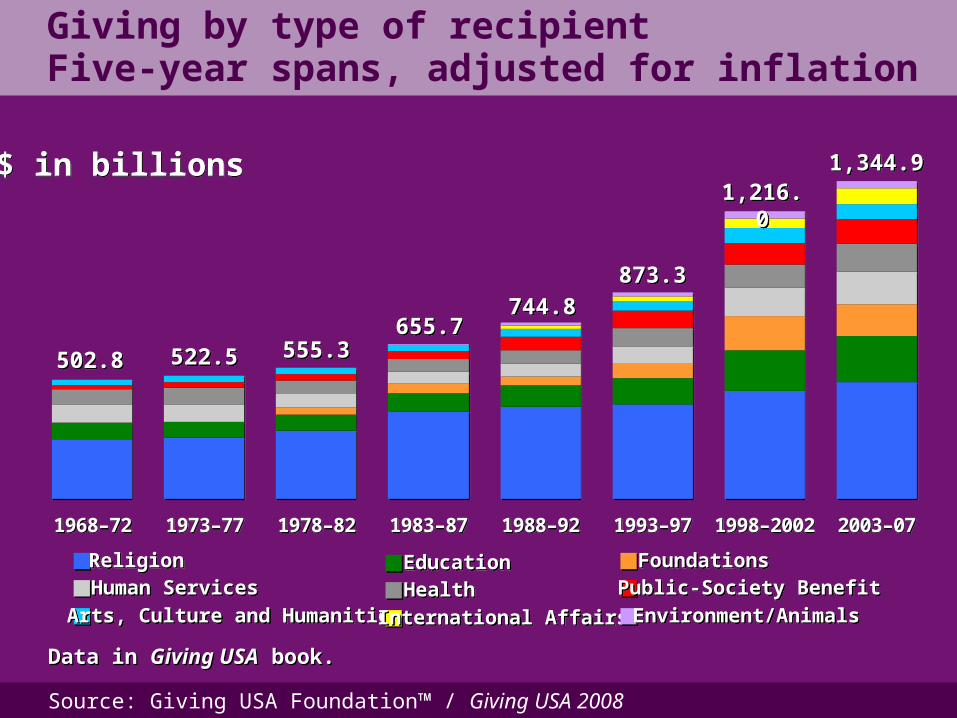
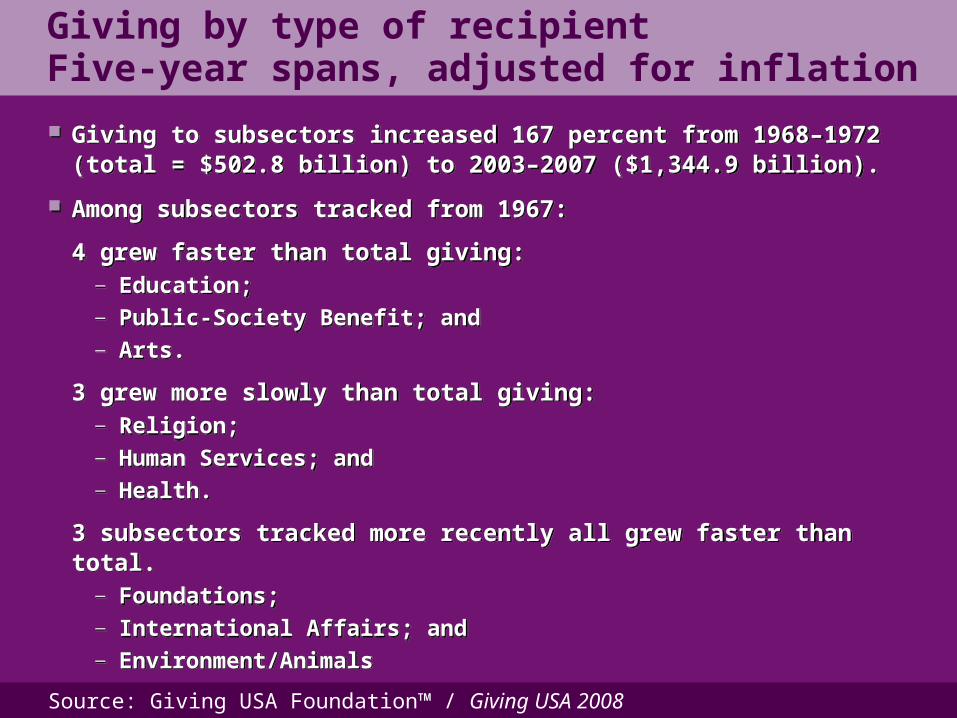
Giving to subsectors increased 167 percent from 1968–1972 (total = $502.8 billion) to 2003–2007 ($1,344.9 billion).
Among subsectors tracked from 1967:
4 grew faster than total giving:— Education;— Public-Society Benefit; and — Arts.
3 grew more slowly than total giving:— Religion; — Human Services; and — Health.
3 subsectors tracked more recently all grew faster than total.— Foundations;— International Affairs; and — Environment/Animals
Source: Giving USA Foundation™ / Giving USA 2008
Data begin in 1978 for foundations and in 1987 for environment/animals and international affairs.Data begin in 1978 for foundations and in 1987 for environment/animals and international affairs.
50.3% 49.4% 52.1% 56.3% 52.3%45.7%
37.6% 36.7%
14.2% 13.1% 12.0%12.1%
12.5%12.8%
14.2% 14.5%
5.5%6.1%
4.6%7.3%
11.8% 10.0%
15.1% 14.3%10.4%
7.6%7.3%
7.8% 9.8% 10.3%
13.0% 13.5% 10.4% 8.3%7.8% 9.1% 8.0% 8.5%
3.1% 4.0% 4.6% 4.9%7.7% 8.4% 7.6% 7.9%
4.2% 4.5% 5.1% 4.8%5.7% 5.0% 4.1%4.3%
1968–72 1973–77 1978–82 1983–87 1988–92 1993–97 1998–2002 2003–07
ReligionReligion EducationEducation FoundationsFoundationsHealthHealthHuman ServicesHuman Services
Arts, Culture, and HumanitiesArts, Culture, and HumanitiesPublic-Society BenefitPublic-Society BenefitEnvironment/AnimalsEnvironment/AnimalsInternationalInternational
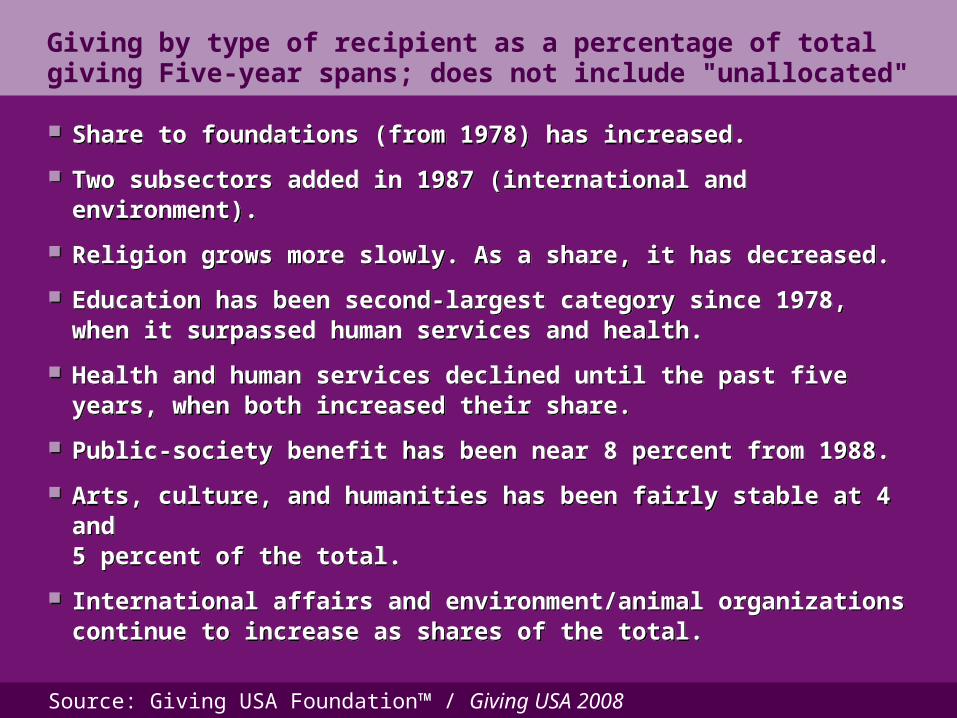
Giving by type of recipient as a percentage of total giving Five-year spans; does not include "unallocated"
Source: Giving USA Foundation™ / Giving USA 2008
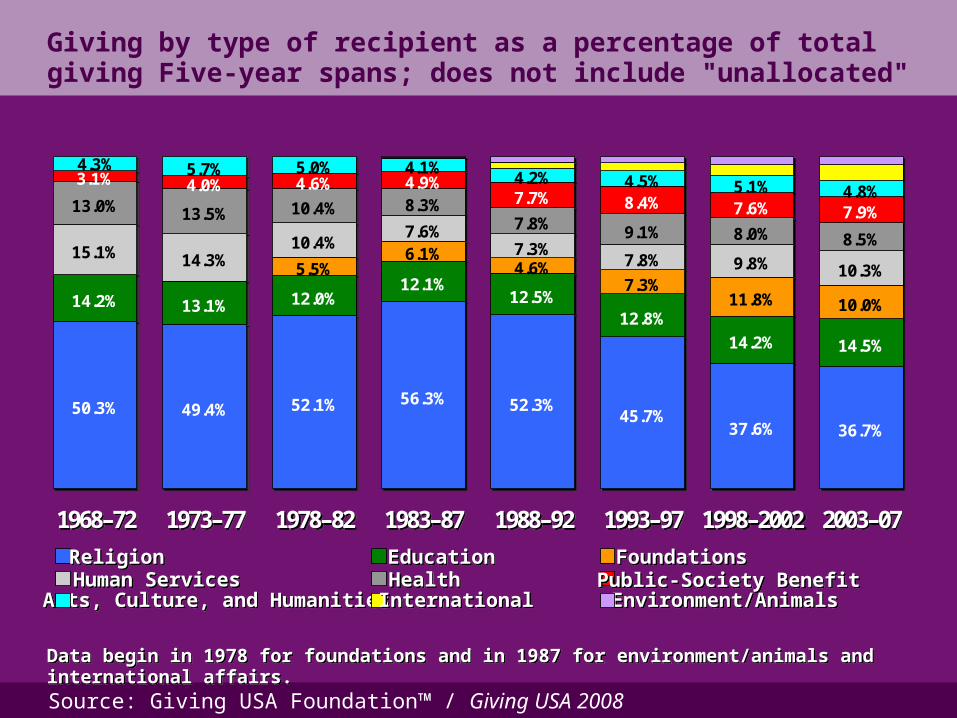
Share to foundations (from 1978) has increased.
Two subsectors added in 1987 (international and environment).
Religion grows more slowly. As a share, it has decreased.
Education has been second-largest category since 1978, when it surpassed human services and health.
Health and human services declined until the past five years, when both increased their share.
Public-society benefit has been near 8 percent from 1988.
Arts, culture, and humanities has been fairly stable at 4 and 5 percent of the total.
International affairs and environment/animal organizations continue to increase as shares of the total.
Giving by type of recipient as a percentage of total giving Five-year spans; does not include "unallocated"
Source: Giving USA Foundation™ / Giving USA 2008
102.32
82.91
10.10
64.69
50.95
7.5816.98
28.06
43.51
95.56
83.5775.29
58.09
79.41
60.29
47.05 50.10
1967 1972 1977 1982 1987 1992 1997 2002 2007
102.32
82.91
10.10
64.69
50.95
7.5816.98
28.06
43.51
95.56
83.5775.29
58.09
79.41
60.29
47.05 50.10
1967 1972 1977 1982 1987 1992 1997 2002 2007
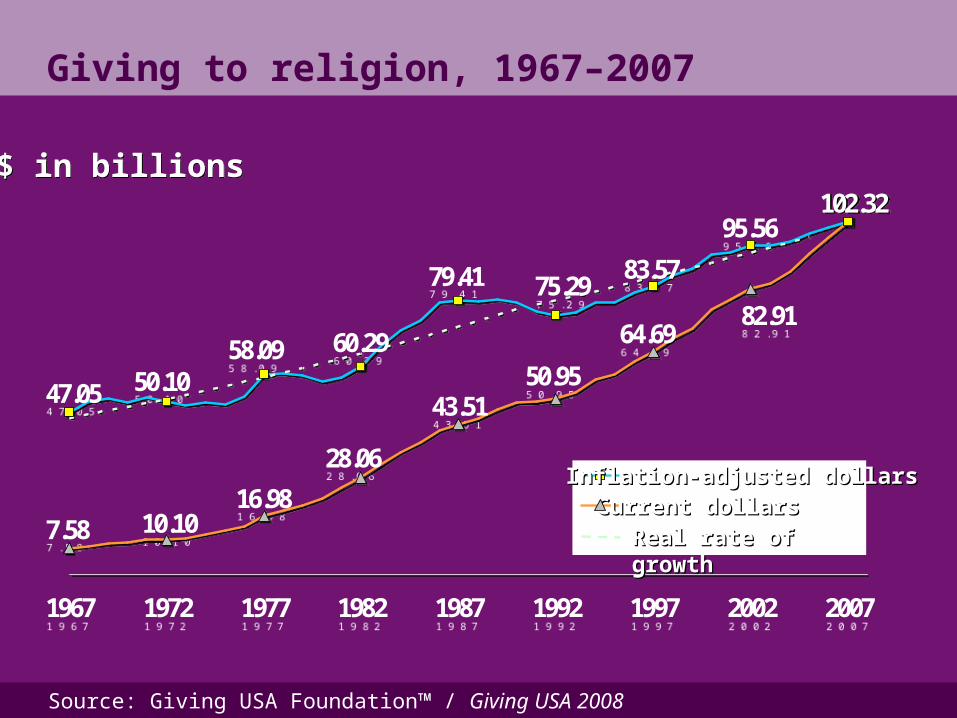
Giving to religion, 1967–2007
$ in billions$ in billions
Current dollarsCurrent dollarsInflation-adjusted dollarsInflation-adjusted dollars
Real rate of growthReal rate of growth
Source: Giving USA Foundation™ / Giving USA 2008
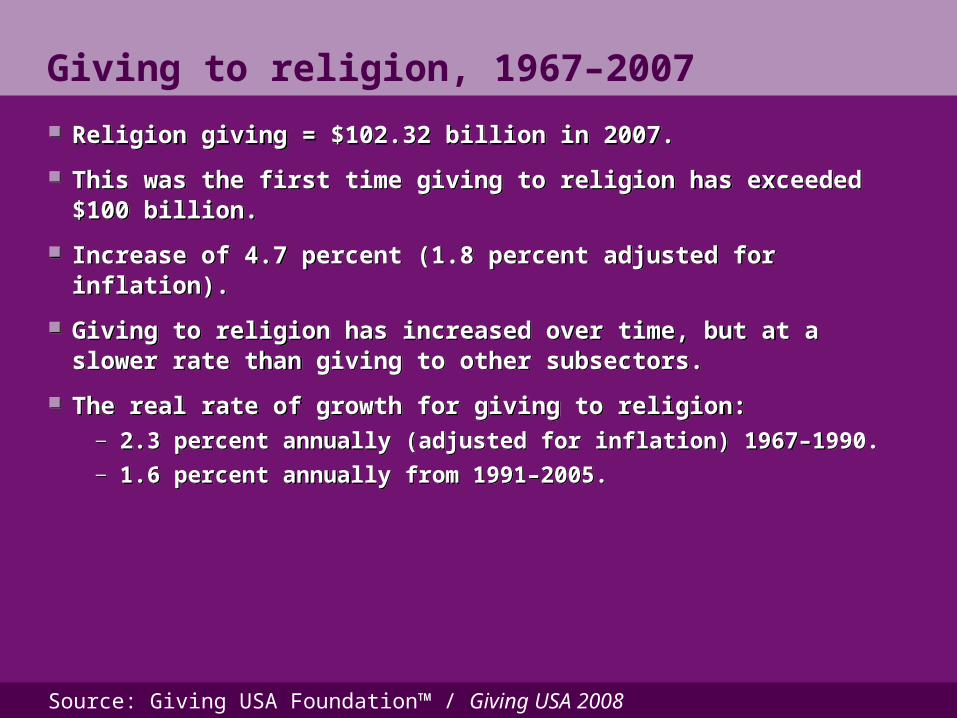
Giving to religion, 1967–2007
Religion giving = $102.32 billion in 2007.
This was the first time giving to religion has exceeded $100 billion.
Increase of 4.7 percent (1.8 percent adjusted for inflation).
Giving to religion has increased over time, but at a slower rate than giving to other subsectors.
The real rate of growth for giving to religion: — 2.3 percent annually (adjusted for inflation) 1967–1990. — 1.6 percent annually from 1991–2005.
Source: Giving USA Foundation™ / Giving USA 2008
9.786.14
3.892.13
13.00
20.35
2.98
29.96
43.32
14.7813.22 13.19
17.85
13.31
19.21
26.29
34.53
1967 1972 1977 1982 1987 1992 1997 2002 2007
9.786.14
3.892.13
13.00
20.35
2.98
29.96
43.32
14.7813.22 13.19
17.85
13.31
19.21
26.29
34.53
1967 1972 1977 1982 1987 1992 1997 2002 2007
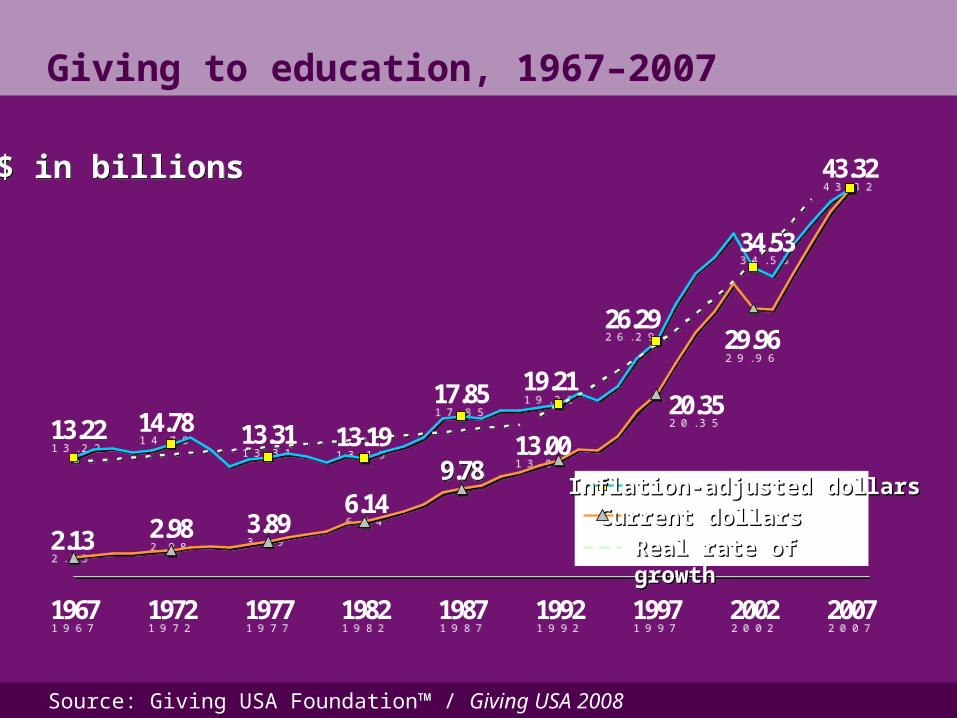
Giving to education, 1967–2007
$ in billions$ in billions
Current dollarsCurrent dollarsInflation-adjusted dollarsInflation-adjusted dollars
Real rate of growthReal rate of growth
Source: Giving USA Foundation™ / Giving USA 2008
Giving to education, 1967–2007
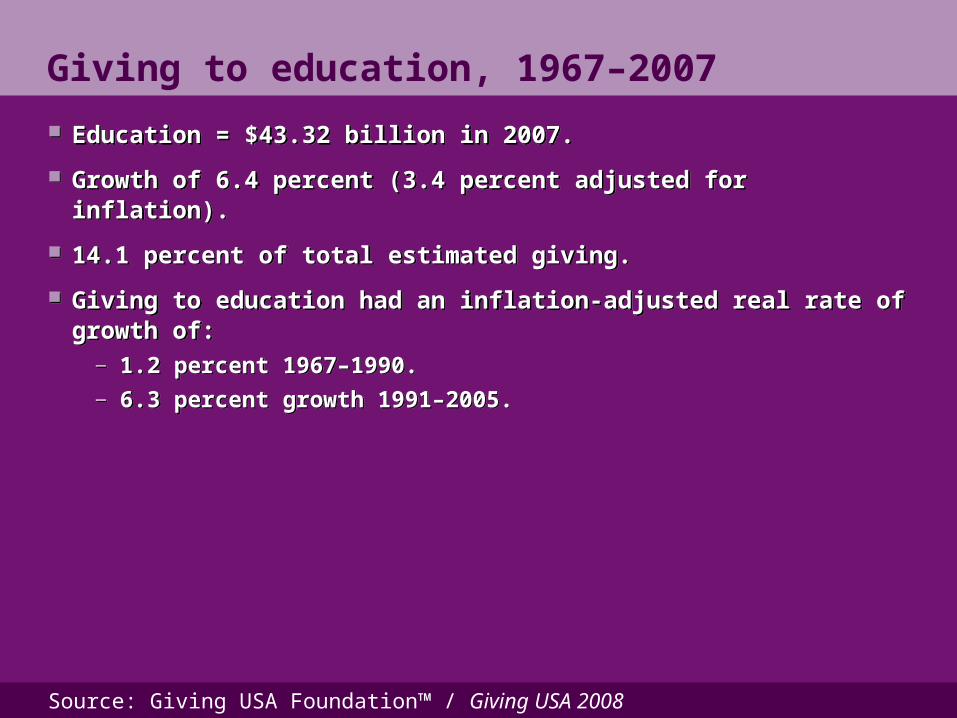
Education = $43.32 billion in 2007.
Growth of 6.4 percent (3.4 percent adjusted for inflation).
14.1 percent of total estimated giving.
Giving to education had an inflation-adjusted real rate of growth of:— 1.2 percent 1967–1990. — 6.3 percent growth 1991–2005.
Education = $43.32 billion in 2007.
Growth of 6.4 percent (3.4 percent adjusted for inflation).
14.1 percent of total estimated giving.
Giving to education had an inflation-adjusted real rate of growth of:— 1.2 percent 1967–1990. — 6.3 percent growth 1991–2005.
Source: Giving USA Foundation™ / Giving USA 2008
Data: The Foundation CenterData: The Foundation Center
19781978 19871987 19921992 19971997 20022002 20072007
1.611.611.611.61
5.125.125.125.129.429.429.429.42
19821982
8.598.598.598.59 7.407.407.407.40
18.0318.0318.0318.03
22.0822.0822.0822.08
27.7327.7327.7327.73
19.1619.1619.1619.16
13.9613.9613.9613.96
5.015.015.015.015.165.165.165.16
4.004.004.004.00
$ in billions$ in billions
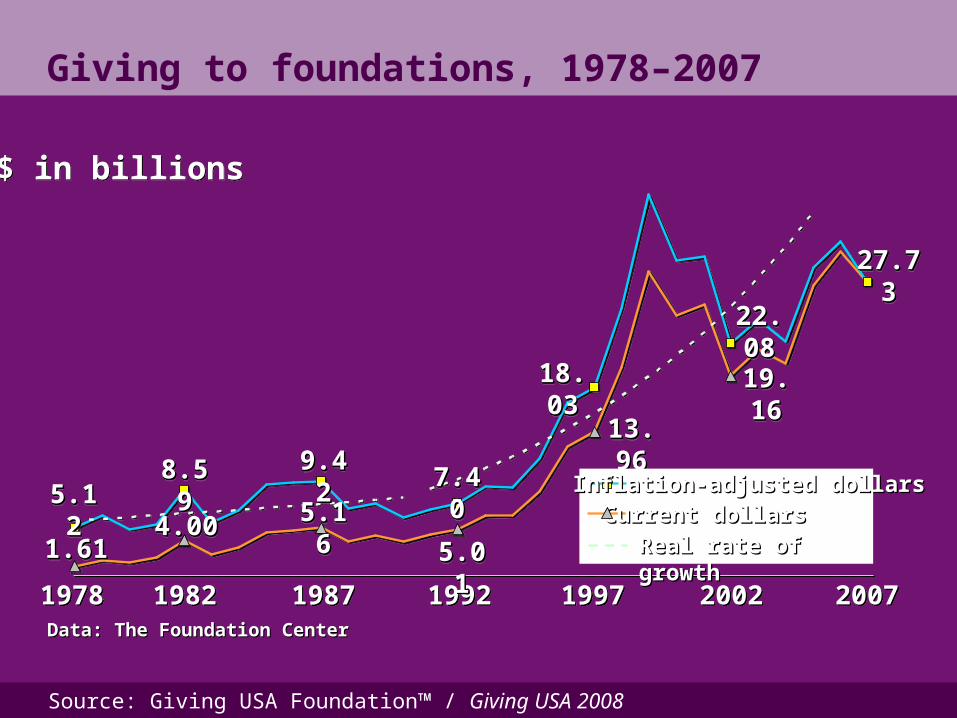
Giving to foundations, 1978–2007
Current dollarsCurrent dollarsInflation-adjusted dollarsInflation-adjusted dollars
Real rate of growthReal rate of growth
Source: Giving USA Foundation™ / Giving USA 2008
Giving to foundations, 1978–2007
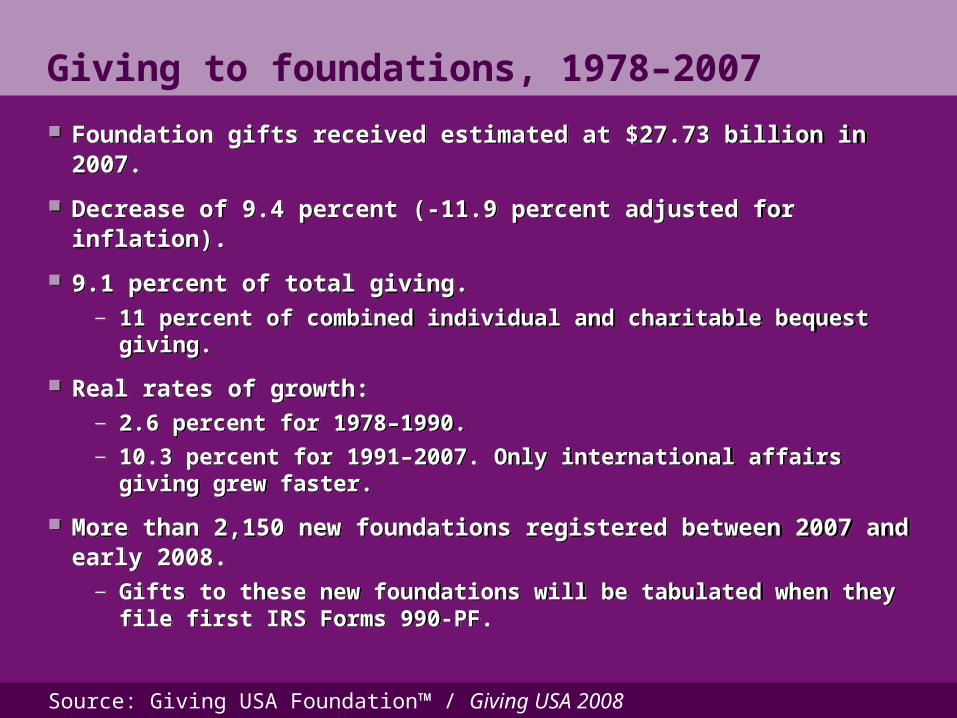
Foundation gifts received estimated at $27.73 billion in 2007.
Decrease of 9.4 percent (-11.9 percent adjusted for inflation).
9.1 percent of total giving.— 11 percent of combined individual and charitable bequest
giving.
Real rates of growth:— 2.6 percent for 1978–1990. — 10.3 percent for 1991–2007. Only international affairs giving
grew faster.
More than 2,150 new foundations registered between 2007 and early 2008. — Gifts to these new foundations will be tabulated when they
file first IRS Forms 990-PF.
Source: Giving USA Foundation™ / Giving USA 2008
Giving to human services, 1967–2007
$ in billions$ in billions
5.424.764.102.07
8.44
12.62
3.16
24.40
29.64
15.6712.85
10.23 9.89
14.0312.47
16.30
28.12
1967 1972 1977 1982 1987 1992 1997 2002 2007
5.424.764.102.07
8.44
12.62
3.16
24.40
29.64
15.6712.85
10.23 9.89
14.0312.47
16.30
28.12
1967 1972 1977 1982 1987 1992 1997 2002 2007
Current dollarsCurrent dollarsInflation-adjusted dollarsInflation-adjusted dollars
Real rate of growthReal rate of growth
Source: Giving USA Foundation™ / Giving USA 2008
Giving to human services, 1967–2007
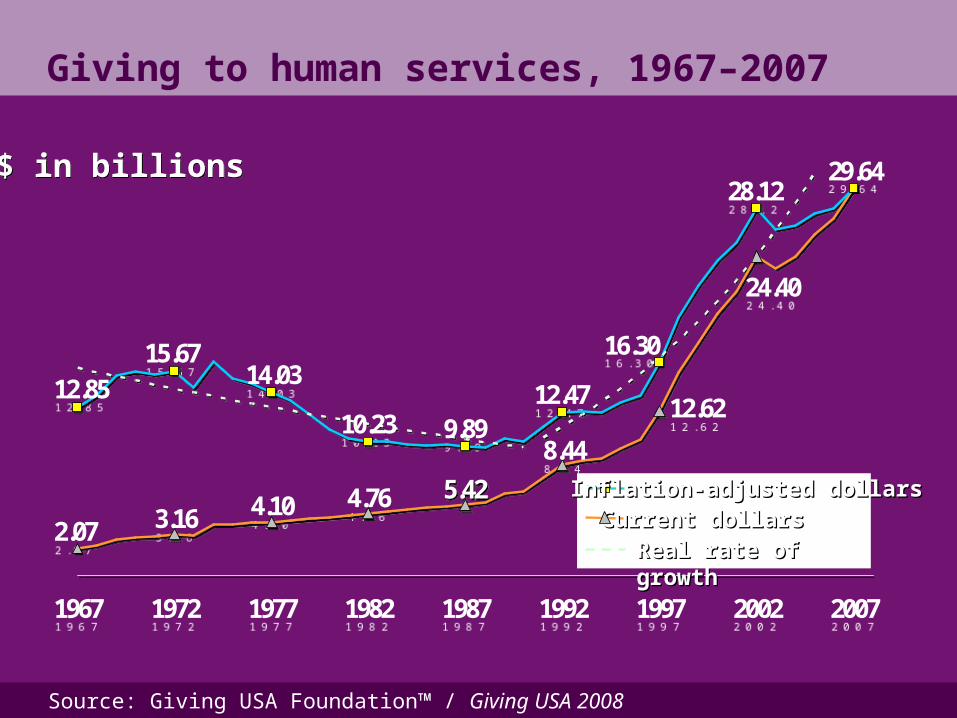
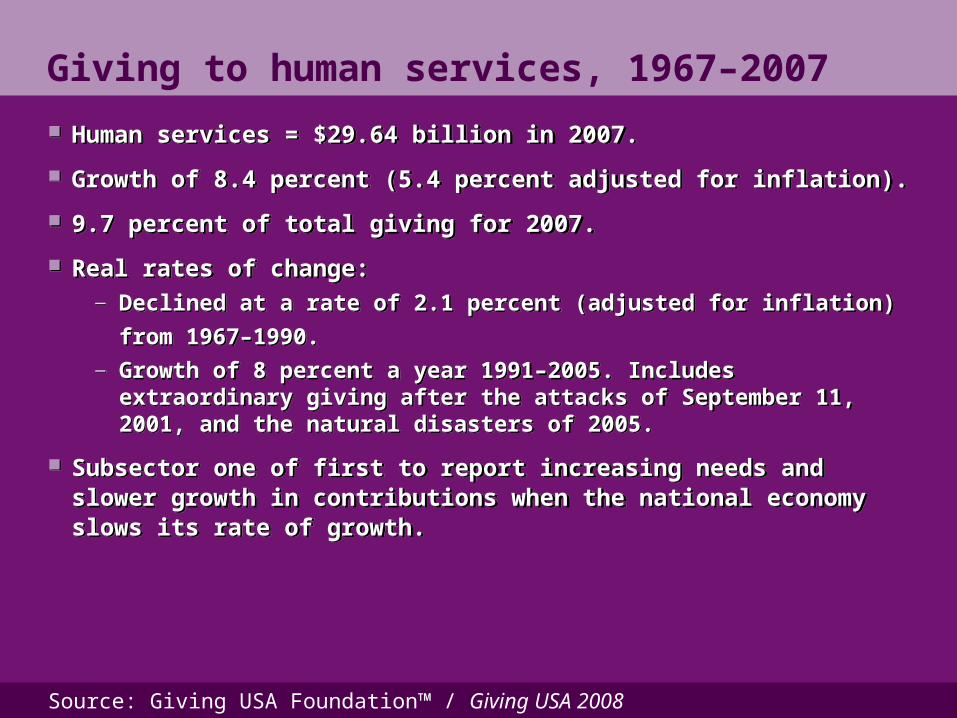
Human services = $29.64 billion in 2007.
Growth of 8.4 percent (5.4 percent adjusted for inflation).
9.7 percent of total giving for 2007.
Real rates of change:— Declined at a rate of 2.1 percent (adjusted for inflation)
from 1967–1990. — Growth of 8 percent a year 1991–2005. Includes
extraordinary giving after the attacks of September 11, 2001, and the natural disasters of 2005.
Subsector one of first to report increasing needs and slower growth in contributions when the national economy slows its rate of growth.
Source: Giving USA Foundation™ / Giving USA 2008
6.124.873.93
1.91
8.46
12.76
2.80
17.76
23.15
13.8911.86
10.46 11.1713.45 12.50
16.48
20.47
1967 1972 1977 1982 1987 1992 1997 2002 2007
6.124.873.93
1.91
8.46
12.76
2.80
17.76
23.15
13.8911.86
10.46 11.1713.45 12.50
16.48
20.47
1967 1972 1977 1982 1987 1992 1997 2002 2007
Giving to health, 1967–2007
$ in billions$ in billions
Current dollarsCurrent dollarsInflation-adjusted dollarsInflation-adjusted dollars
Real rate of growthReal rate of growth
Source: Giving USA Foundation™ / Giving USA 2008
Giving to health, 1967–2007
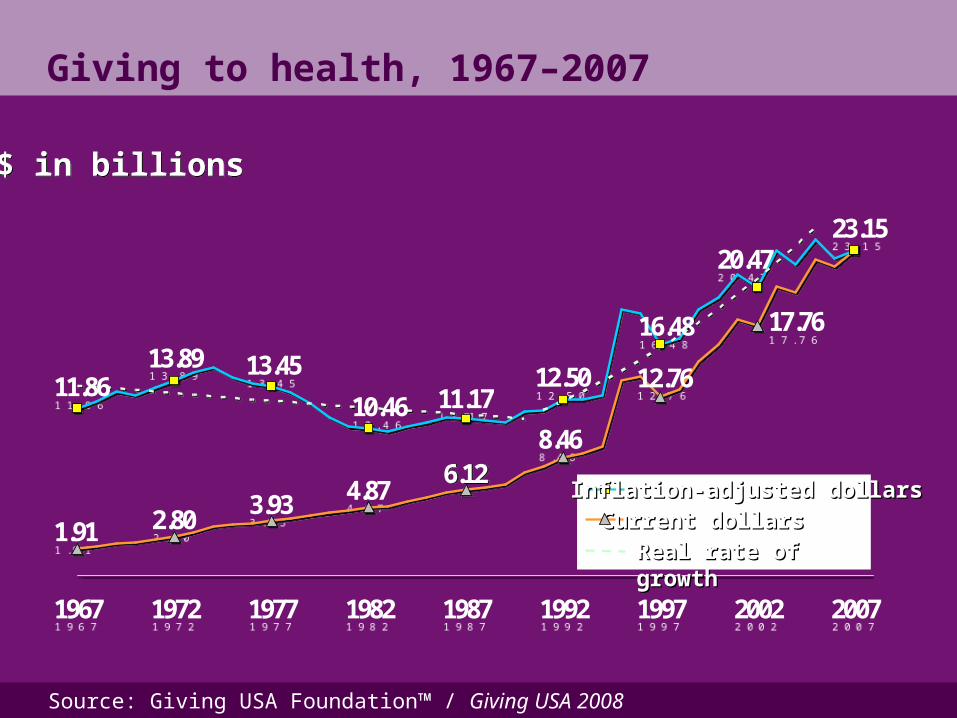
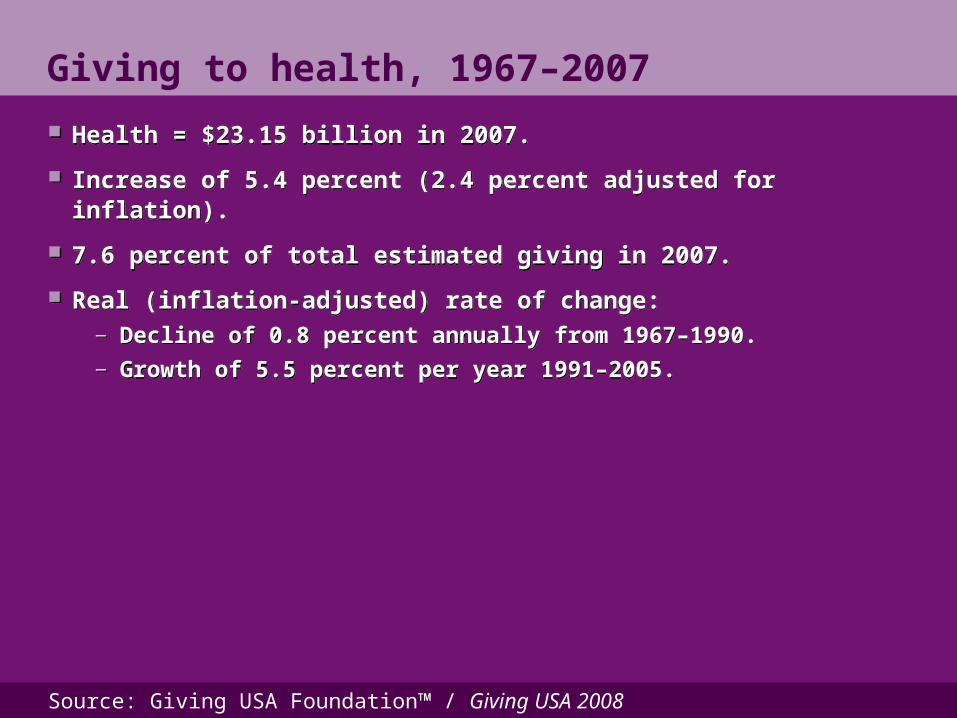
Health = $23.15 billion in 2007.
Increase of 5.4 percent (2.4 percent adjusted for inflation).
7.6 percent of total estimated giving in 2007.
Real (inflation-adjusted) rate of change: — Decline of 0.8 percent annually from 1967–1990. — Growth of 5.5 percent per year 1991–2005.
Health = $23.15 billion in 2007.
Increase of 5.4 percent (2.4 percent adjusted for inflation).
7.6 percent of total estimated giving in 2007.
Real (inflation-adjusted) rate of change: — Decline of 0.8 percent annually from 1967–1990. — Growth of 5.5 percent per year 1991–2005.
Source: Giving USA Foundation™ / Giving USA 2008
4.262.42
1.290.41
8.51
12.94
0.82
17.97
22.65
4.072.55
5.20
7.78
4.41
12.58
16.72
20.71
1967 1972 1977 1982 1987 1992 1997 2002 2007
4.262.42
1.290.41
8.51
12.94
0.82
17.97
22.65
4.072.55
5.20
7.78
4.41
12.58
16.72
20.71
1967 1972 1977 1982 1987 1992 1997 2002 2007
Giving to public-society benefit,1967–2007
$ in billions$ in billions
Current dollarsCurrent dollarsInflation-adjusted dollarsInflation-adjusted dollars
Real rate of growthReal rate of growth
Source: Giving USA Foundation™ / Giving USA 2008
Giving to public-society benefit,1967–2007
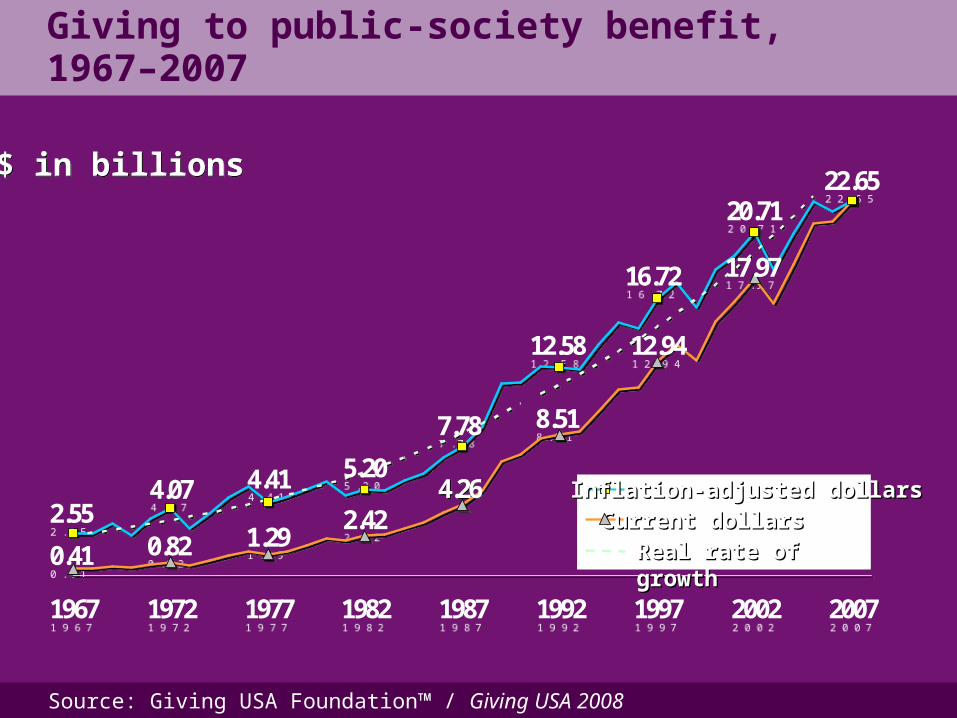
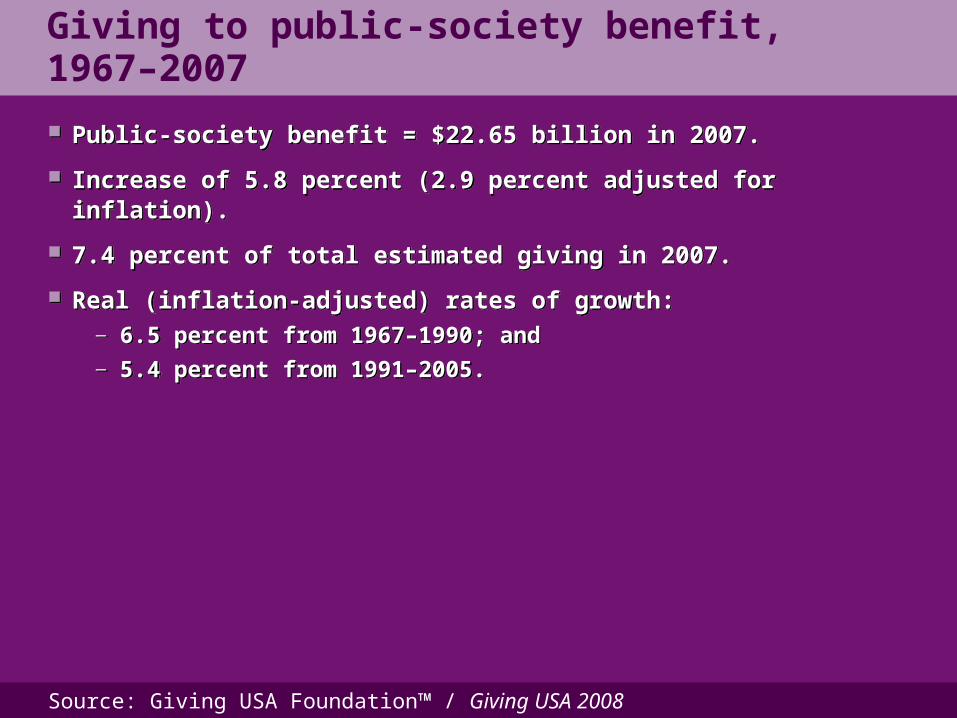
Public-society benefit = $22.65 billion in 2007.
Increase of 5.8 percent (2.9 percent adjusted for inflation).
7.4 percent of total estimated giving in 2007.
Real (inflation-adjusted) rates of growth: — 6.5 percent from 1967–1990; and — 5.4 percent from 1991–2005.
Public-society benefit = $22.65 billion in 2007.
Increase of 5.8 percent (2.9 percent adjusted for inflation).
7.4 percent of total estimated giving in 2007.
Real (inflation-adjusted) rates of growth: — 6.5 percent from 1967–1990; and — 5.4 percent from 1991–2005.
Source: Giving USA Foundation™ / Giving USA 2008
3.152.711.84
0.56
4.52
7.34
1.10
10.83
13.67
5.46
3.48
5.82 5.756.29 6.68
9.48
12.48
1967 1972 1977 1982 1987 1992 1997 2002 2007
3.152.711.84
0.56
4.52
7.34
1.10
10.83
13.67
5.46
3.48
5.82 5.756.29 6.68
9.48
12.48
1967 1972 1977 1982 1987 1992 1997 2002 2007
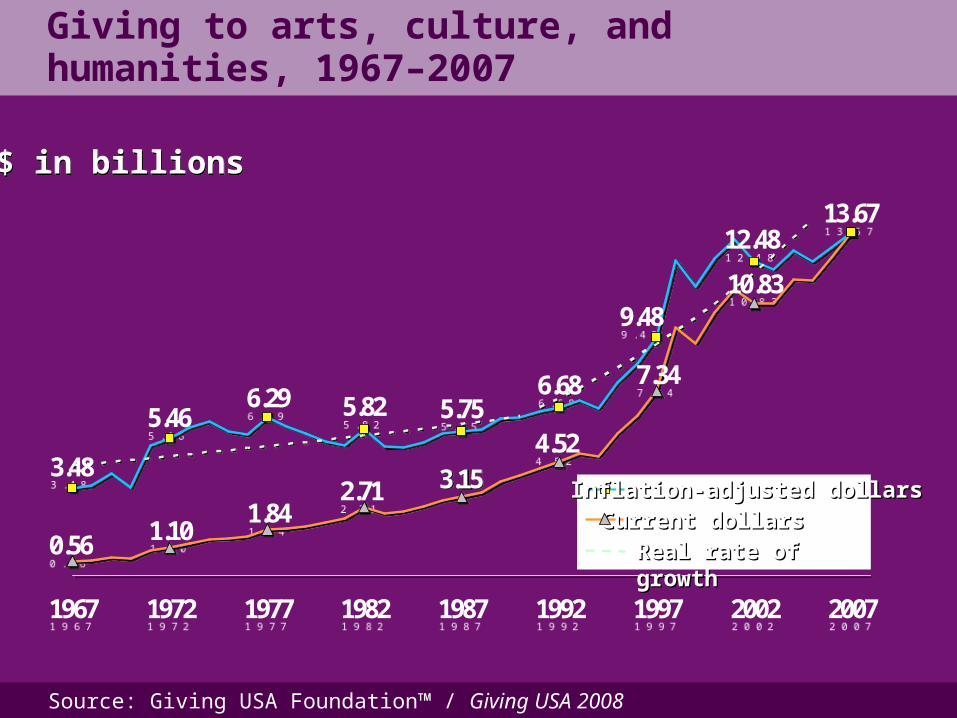
Giving to arts, culture, and humanities, 1967–2007
$ in billions$ in billions
Current dollarsCurrent dollarsInflation-adjusted dollarsInflation-adjusted dollars
Real rate of growthReal rate of growth
Source: Giving USA Foundation™ / Giving USA 2008
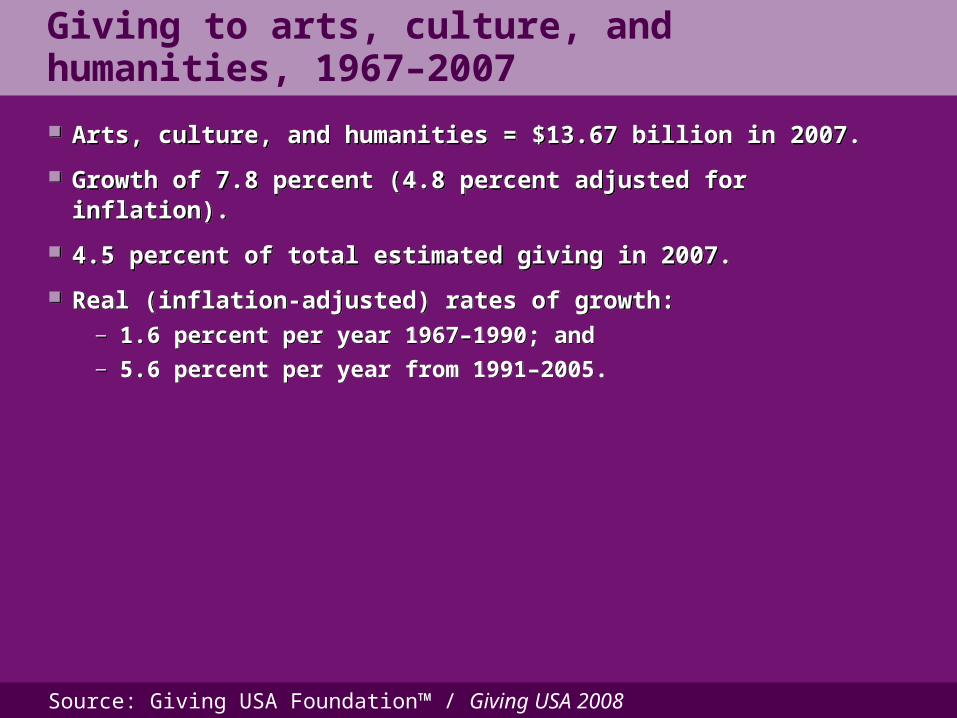
Giving to arts, culture, and humanities, 1967–2007
Arts, culture, and humanities = $13.67 billion in 2007.
Growth of 7.8 percent (4.8 percent adjusted for inflation).
4.5 percent of total estimated giving in 2007.
Real (inflation-adjusted) rates of growth:— 1.6 percent per year 1967–1990; and— 5.6 percent per year from 1991–2005.
Arts, culture, and humanities = $13.67 billion in 2007.
Growth of 7.8 percent (4.8 percent adjusted for inflation).
4.5 percent of total estimated giving in 2007.
Real (inflation-adjusted) rates of growth:— 1.6 percent per year 1967–1990; and— 5.6 percent per year from 1991–2005.
Source: Giving USA Foundation™ / Giving USA 2008
8.70
2.38
4.21
13.22
10.03
3.52
5.448.70
2.38
4.21
13.22
10.03
3.52
5.44
19871987 19921992 19971997 20022002 20072007
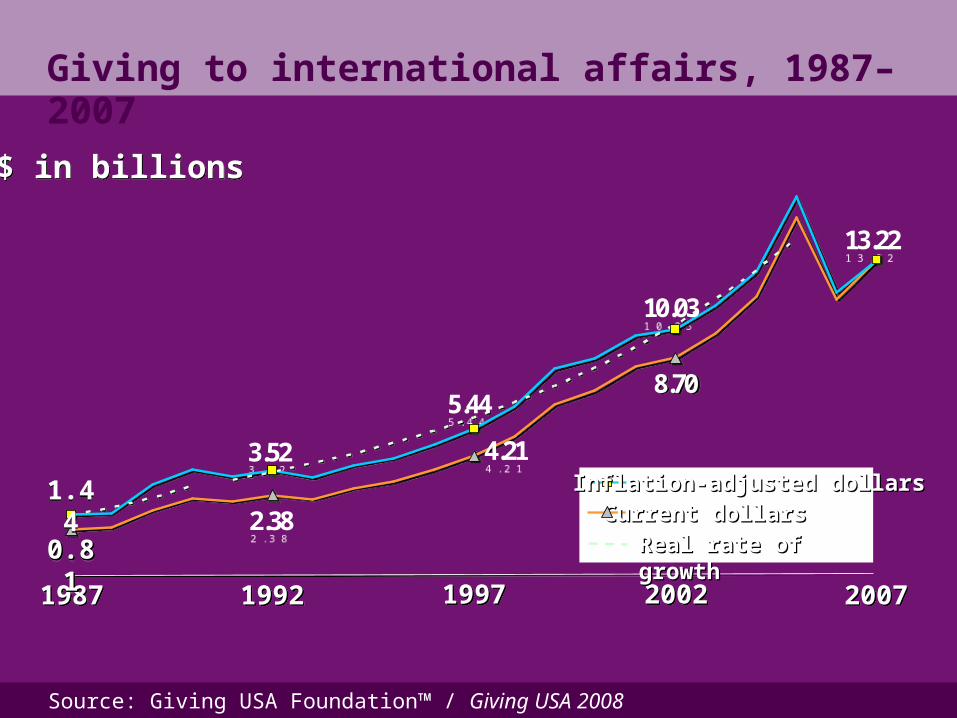
Giving to international affairs, 1987–2007
1.441.44
0.810.810.810.81
$ in billions$ in billions
Current dollarsCurrent dollarsInflation-adjusted dollarsInflation-adjusted dollars
Real rate of growthReal rate of growth
Source: Giving USA Foundation™ / Giving USA 2008
Giving to international affairs, 1987–2007
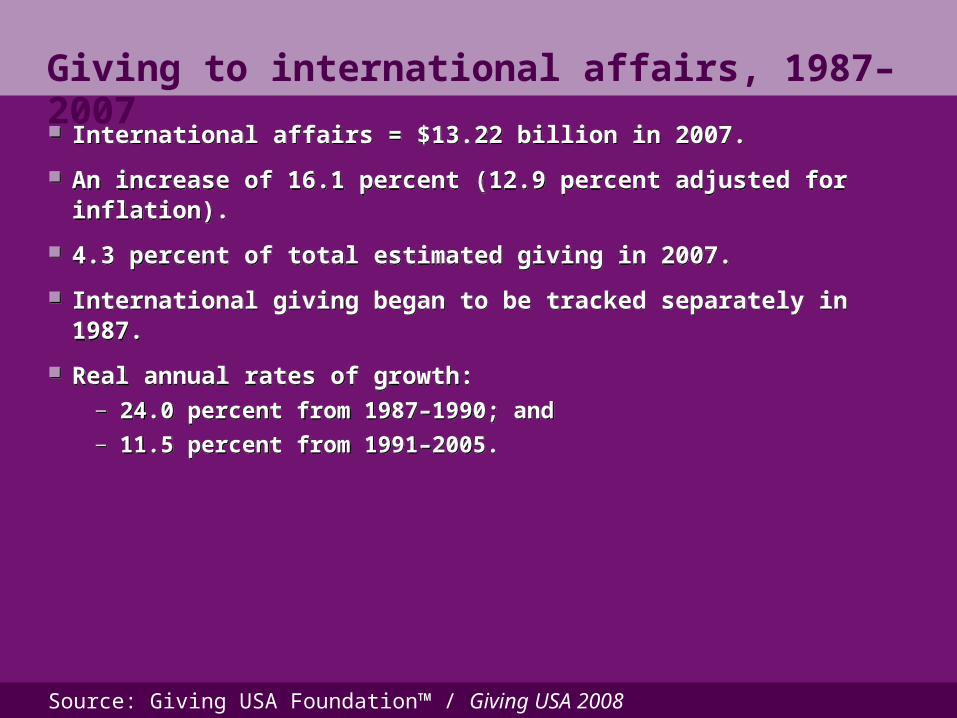
International affairs = $13.22 billion in 2007.
An increase of 16.1 percent (12.9 percent adjusted for inflation).
4.3 percent of total estimated giving in 2007.
International giving began to be tracked separately in 1987.
Real annual rates of growth: — 24.0 percent from 1987–1990; and — 11.5 percent from 1991–2005.
Source: Giving USA Foundation™ / Giving USA 2008
5.29
1.72
3.09
6.96
6.10
2.54
3.995.29
1.72
3.09
6.96
6.10
2.54
3.99
Giving to environment and animals,1987–2007
$ in billions$ in billions
19871987 19921992 19971997 20022002 20072007
1.961.96
1.081.081.081.08Current dollarsCurrent dollarsInflation-adjusted dollarsInflation-adjusted dollars
Real rate of growthReal rate of growth
Source: Giving USA Foundation™ / Giving USA 2008
Giving to environment and animals,1987–2007
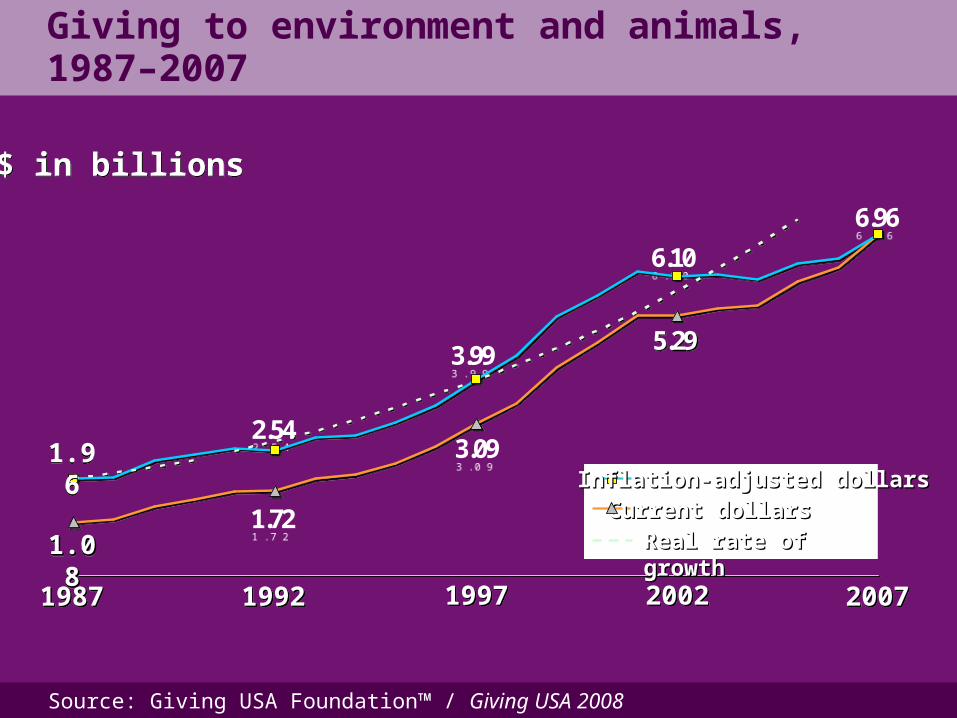
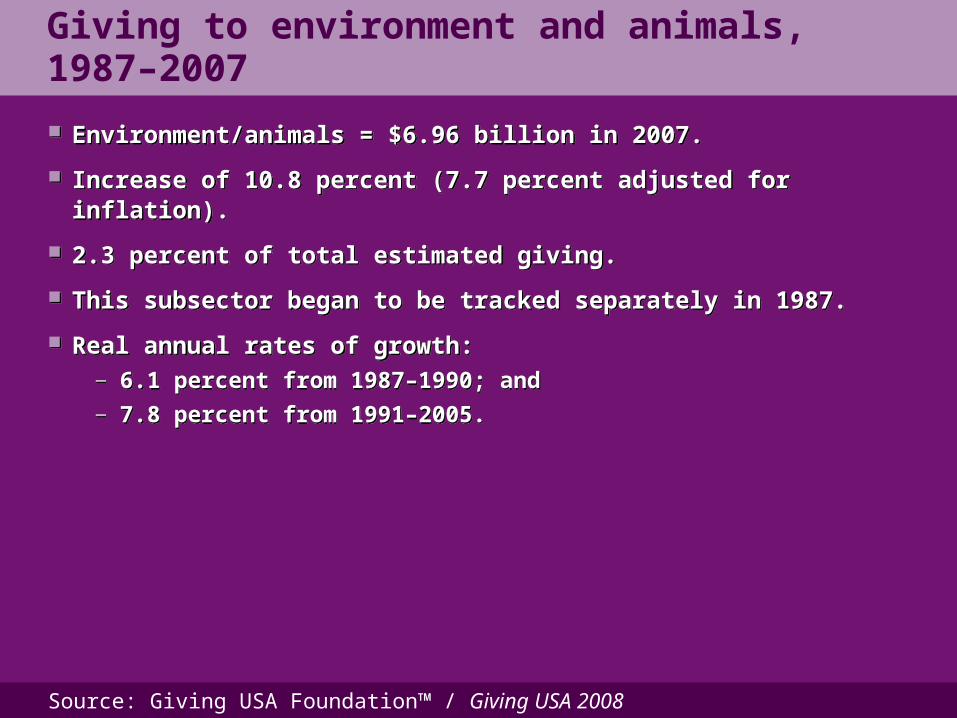
Environment/animals = $6.96 billion in 2007.
Increase of 10.8 percent (7.7 percent adjusted for inflation).
2.3 percent of total estimated giving.
This subsector began to be tracked separately in 1987.
Real annual rates of growth: — 6.1 percent from 1987–1990; and— 7.8 percent from 1991–2005.
Environment/animals = $6.96 billion in 2007.
Increase of 10.8 percent (7.7 percent adjusted for inflation).
2.3 percent of total estimated giving.
This subsector began to be tracked separately in 1987.
Real annual rates of growth: — 6.1 percent from 1987–1990; and— 7.8 percent from 1991–2005.
Source: Giving USA Foundation™ / Giving USA 2008
733,790773,934
819,008865,096
909,574964,418
1,010,3951,045,979 1,064,191
1,128,367
1998 1999 2000 2001 2002 2003 2004 2005 2006 2007
733,790773,934
819,008865,096
909,574964,418
1,010,3951,045,979 1,064,191
1,128,367
1998 1999 2000 2001 2002 2003 2004 2005 2006 2007
The number of 501(c)(3) organizations, 1998–2007
Source: Giving USA Foundation™ / Giving USA 2008
The number of 501(c)(3) organizations, 1998–2007
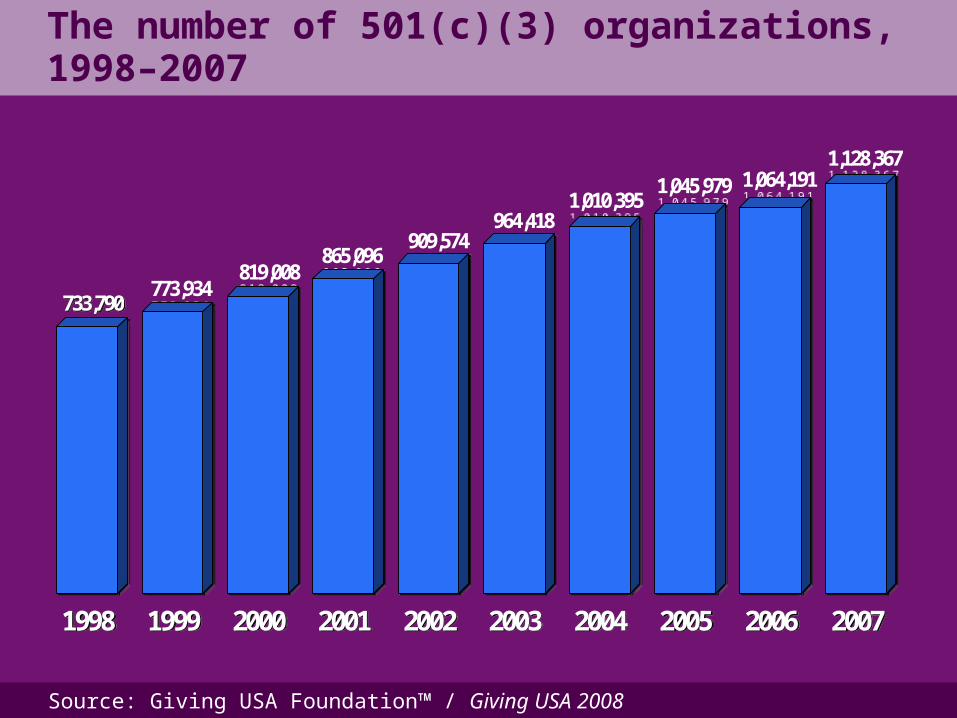
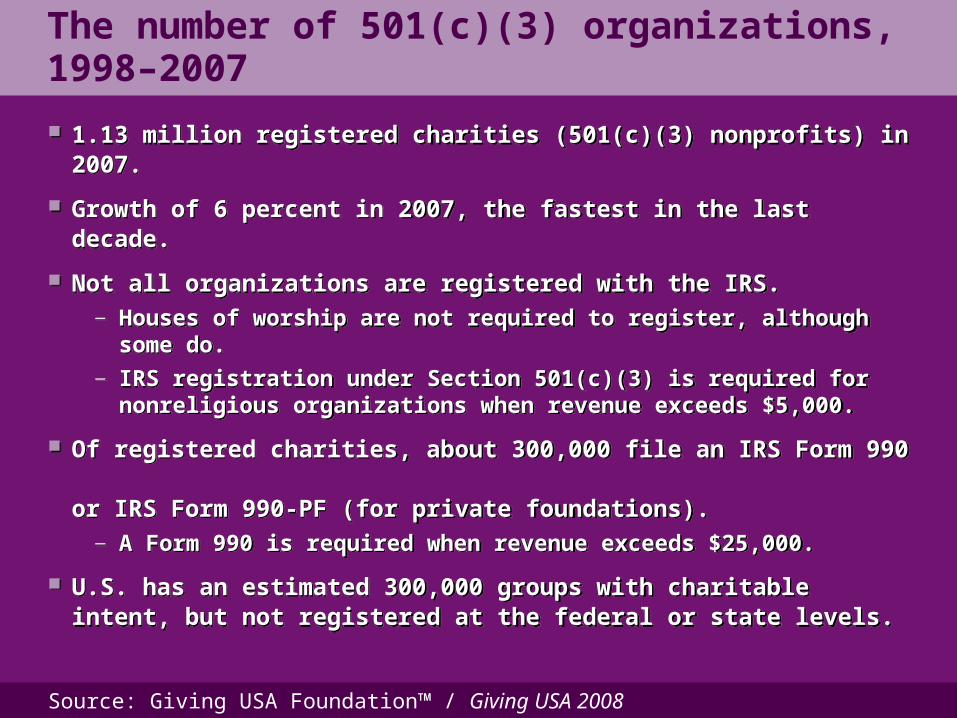
1.13 million registered charities (501(c)(3) nonprofits) in 2007.
Growth of 6 percent in 2007, the fastest in the last decade.
Not all organizations are registered with the IRS. — Houses of worship are not required to register, although
some do. — IRS registration under Section 501(c)(3) is required for
nonreligious organizations when revenue exceeds $5,000.
Of registered charities, about 300,000 file an IRS Form 990 or IRS Form 990-PF (for private foundations). — A Form 990 is required when revenue exceeds $25,000.
U.S. has an estimated 300,000 groups with charitable intent, but not registered at the federal or state levels.

END OF PRESENTATIONPressing the “Esc” or “Page Down” key will exit the presentationPressing the “Esc” or “Page Down” key will exit the presentation
and return you to Microsoft Windows.and return you to Microsoft Windows.