Embed Size (px)
Citation preview

“The Michigan Model”
Research Seminar in Quantitative Economics University of Michigan Ann Arbor, MI 48109
734-764-2567
Gabriel M. Ehrlich, Director lsa.umich.edu/econ/rsqe
George A. Fulton & Saul H. Hymans Directors Emeriti
THE U.S. AND MICHIGAN OUTLOOK FOR 2018-2020
PREPARED FOR PRESENTATION AT THE CONSENSUS REVENUE ESTIMATING CONFERENCE
LANSING, MICHIGAN JANUARY 11, 2018
BY
GABRIEL EHRLICH GEORGE FULTON
DANIIL MANAENKOV MICHAEL MCWILLIAMS
ADITI THAPAR
Research Seminar in Quantitative Economics
The U.S. and Michigan Outlook for 2018–2020Consensus Revenue Estimating Conference
Lansing, MichiganJanuary 11, 2018
Current State of the Economy

RSQE: January 2018
Real Output GrowthSteady But Not Spectacular
Percent
RSQE: January 2018
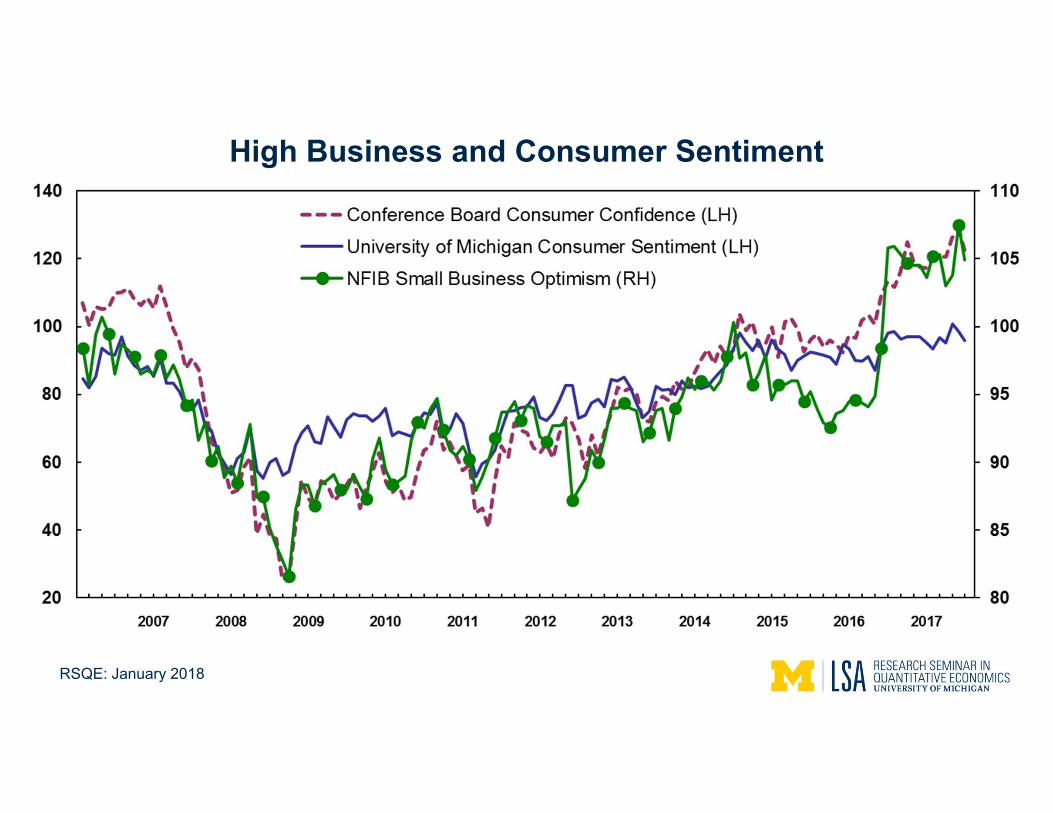
High Business and Consumer Sentiment
RSQE: January 2018
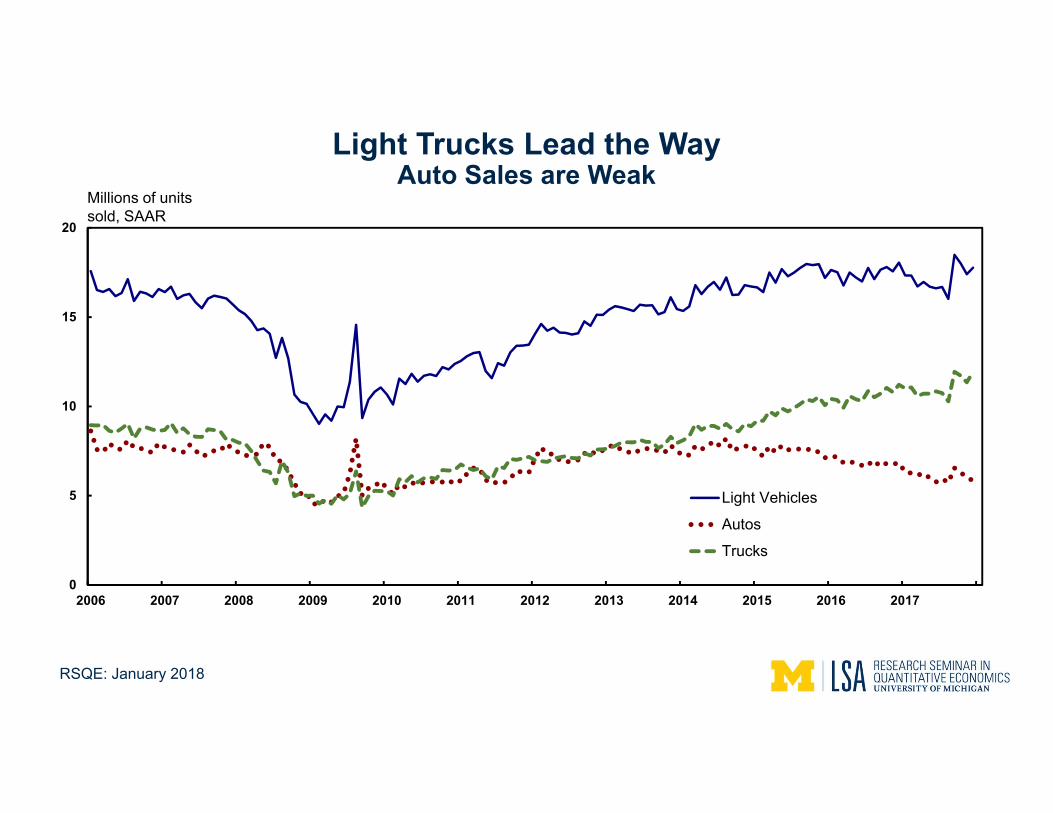
Light Trucks Lead the WayAuto Sales are Weak
Millions of units sold, SAAR
0
5
10
15
20
2006 2007 2008 2009 2010 2011 2012 2013 2014 2015 2016 2017
Light Vehicles
Autos
Trucks

RSQE: January 2018
Unemployment RateTrending Down Since Around 2010
Percent
0
2
4
6
8
10
12
14
16
18
20
2007 2008 2009 2010 2011 2012 2013 2014 2015 2016 2017
U-3 (headline) unemployment rate U-6 unemployment rate

RSQE: January 2018
Monthly Payroll Job GainsSlow Deceleration as Labor Market Tightens
Thousands
-1000
-800
-600
-400
-200
0
200
400
600
2007 2008 2009 2010 2011 2012 2013 2014 2015 2016 2017

RSQE: January 2018
Healthy and Tightening Labor marketsPercent
RSQE: January 2018
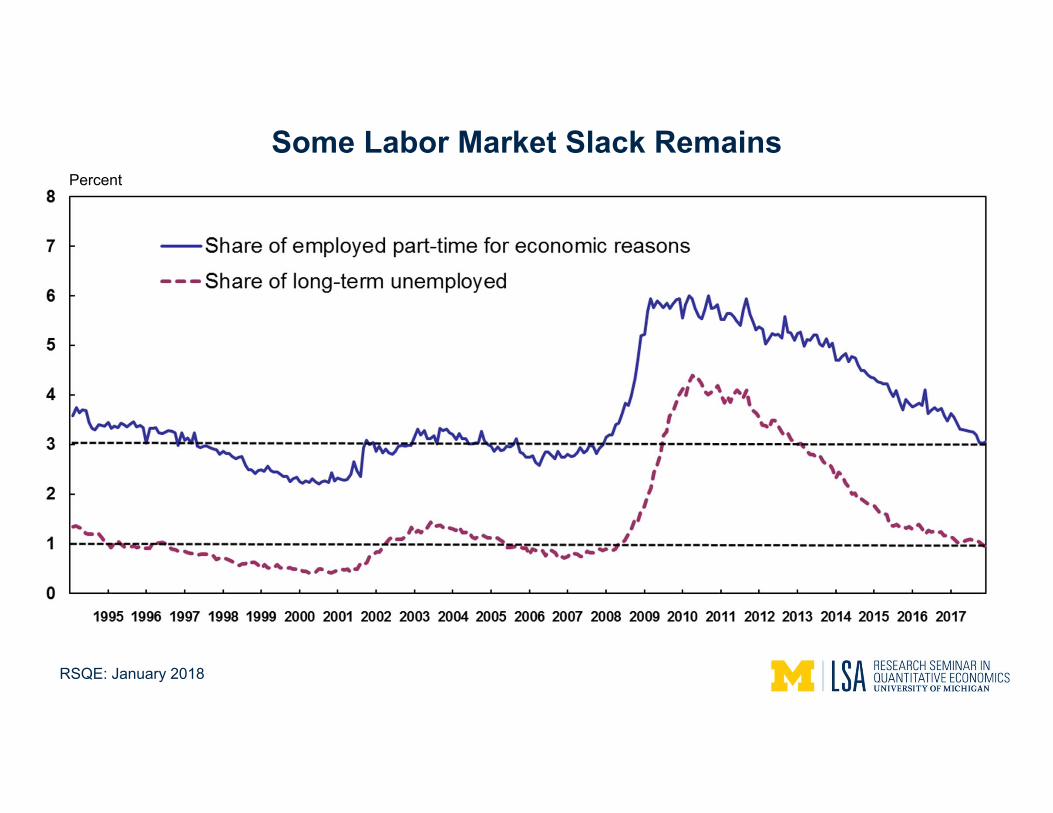
Some Labor Market Slack RemainsPercent

RSQE: January 2018
Unspectacular Nominal Earnings Growth Even As Labor Markets Tighten
Percent
1
1.5
2
2.5
3
3.5
4
4.5
5
2007 2008 2009 2010 2011 2012 2013 2014 2015 2016 2017
Growth of hourly earning of production and nonsupervisory private sectoremployees
Growth of hourly earning of all private sector employees
Percent
RSQE: January 2018
Percent
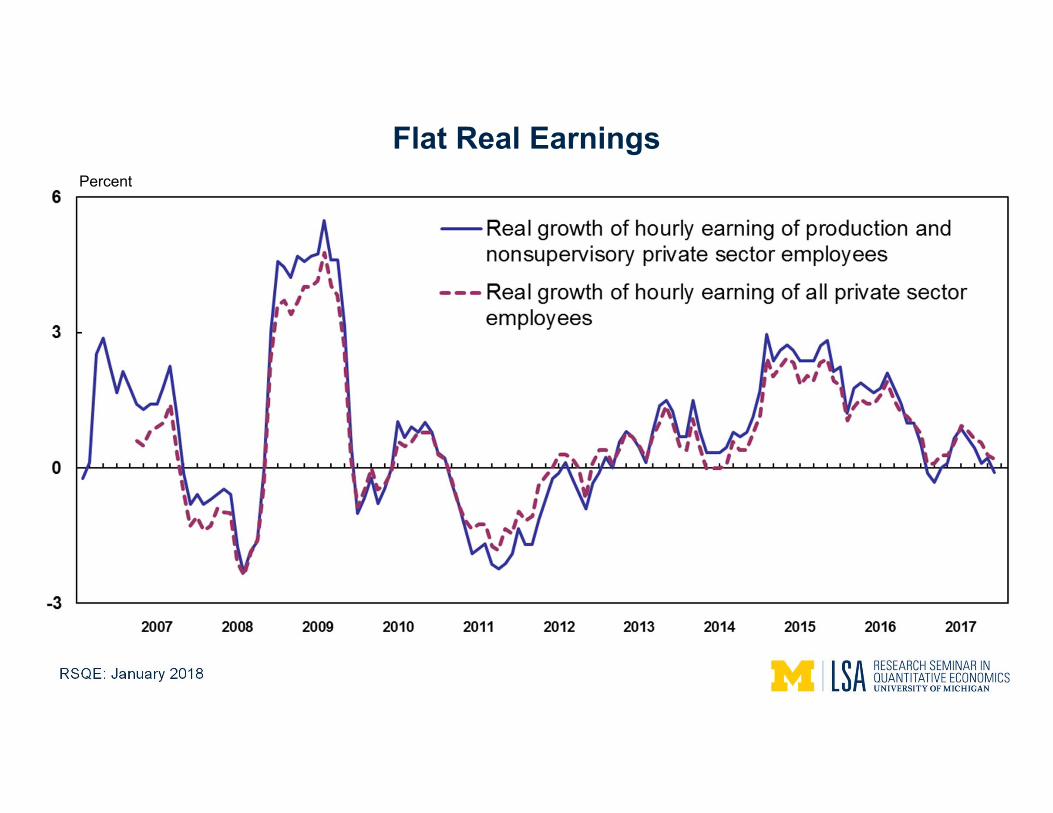
Flat Real Earnings
RSQE: January 2018
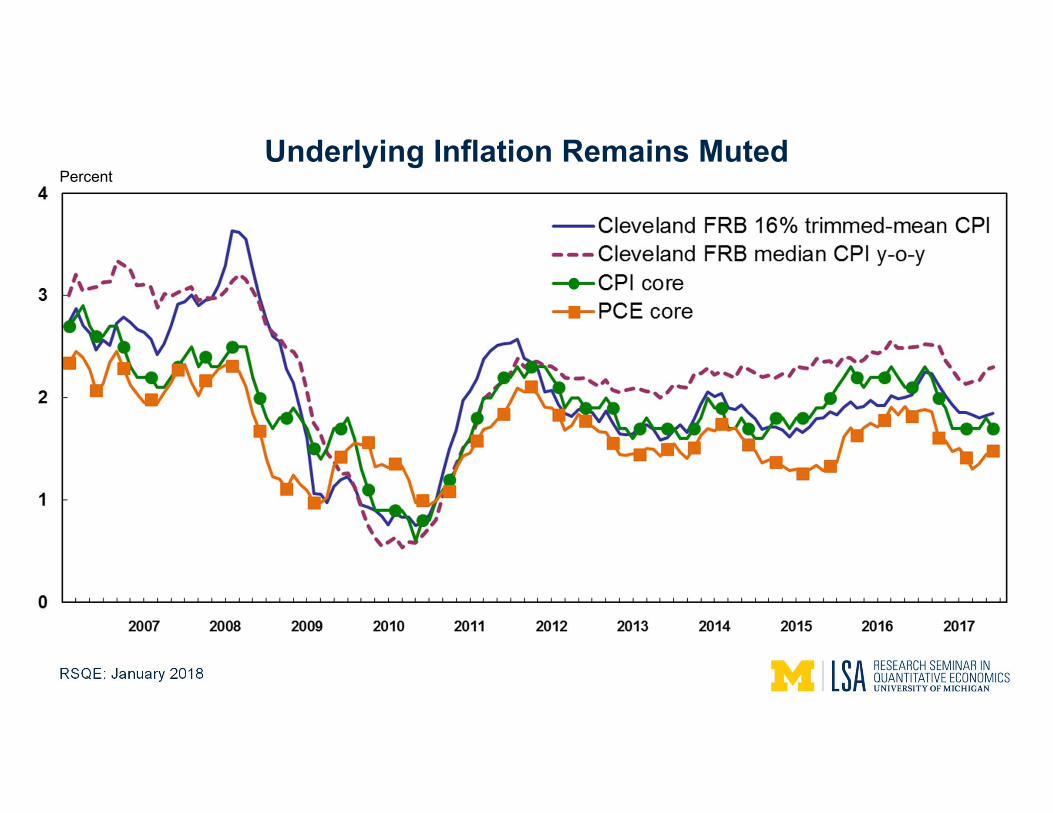
Underlying Inflation Remains MutedPercent

Key Inputs into the Forecast
RSQE: January 2018
Federal funds rate path
• Latest rate hike in December, 2017
• Three 25 basis point hikes in 2018, two in 2019
New leadership at the Fed in 2017
• Jerome Powell is widely expected to be confirmed by the Senate as the next Fed chair
• We expect continuity in conduct of monetary policy
Monetary Policy

RSQE: January 2018
Market Interest Rates
0.4
1.21.5
2.0
2.5
3.0
2.12.4
2.5
3.03.3
3.53.8 3.9
4.1
4.64.9
5.1
0
2
4
6
2016 2017 2018 2019 2020
Forecast
Percent
3-Month T-bill
10 Year T-Note
Conv. Mortgage

RSQE: January 2018
Estimated $1.456 trillion in deficit increases over 2018-27• Using a “dynamic” score lowers the cost by about $385 billion
• Including extra interest payments adds $314 billion
• Growth impact likely front-loaded
Key business tax provisions, most are permanent:• Sharply lower corporate rate: to 21% down from 35%
• 100% investment expensing for 5 years
• International tax reform – significant revenue raiser
• Several common deductions are limited, also raising some revenue
Fiscal PolicyTax Cuts and Jobs Act (TCJA) Enacted

RSQE: January 2018
Personal tax provisions, most sunsetting in 2026:• Somewhat lower rates in most income brackets
• Lower rate on pass-through business income
• Expanded child tax credit
• ACA individual mandate penalty set to $0
By fiscal year 2019, budget deficit widens by over $200 billion
Busy January for Congress. We do not expect a shutdown
Infrastructure spending deal possible in 2018
Fiscal PolicyTax Cuts and Jobs Act (TCJA) Enacted

RSQE: January 2018
Federal Budget, NIPA Basis(Billions of Dollars)
FY’16 FY’17 FY’18 FY’19 FY’20Current receipts 3455.9 3557.3 3592.4 3708.2 3892.8 % change 1.8 2.9 1.0 3.2 5.0
Current expenditures 4116.7 4217.3 4398.0 4593.7 4792.7 % change 3.1 2.4 4.3 4.4 4.3 Consumption 963.9 971.4 992.2 1009.7 1026.6 % change 0.8 0.8 2.1 1.8 1.7 Transfer payments 2630.8 2693.5 2808.2 2920.7 3040.5 % change 3.4 2.4 4.3 4.0 4.1
Surplus (+) or deficit (-) -660.8 -660.0 -805.6 -885.5 -899.8 Percent of GDP -3.6 -3.4 -4.0 -4.2 -4.1
Forecast

RSQE: January 2018
Price of Oil(West Texas Intermediate Crude)
49.355.3
58.0 59.0 61.0 63.0
20
30
40
50
60
70
80
90
2016 2017 2018 2019 2020
Forecast
Dollars/Barrel
43.3
52.6
54.5
*Implicit deflator for petroleum & products
50.2
WTIImports*
16.95.1
12.221.8
6.712.7
3.42.0
3.31.8
4th Quarter to 4th Quarter % Change
56.5

RSQE: January 2018
2.22.6
2.1 1.8 1.7
6.7 6.8 6.5 6.3 6.2
0
2
4
6
8
10
2016 2017 2018 2019 2020
Five Foreign Economies* China
Percent
Foreign GDP Growth Rates
*Weighted Real GDP: Canada, Mexico, Japan, UK, Germany

RSQE: January 2018
Single-Family Home Prices(National Case-Shiller Index)
184.4
136.7
197.8
157.2
102.4
136.0
60
80
100
120
140
160
180
200
220
240
60
80
100
120
140
160
180
200
220
240
2000 2005 2010 2015 2020
Forecast
Index, 2000q1 = 100, SA
Nominal Index
Real Index

RSQE U.S. Forecast for 2018-20
RSQE: January 2018
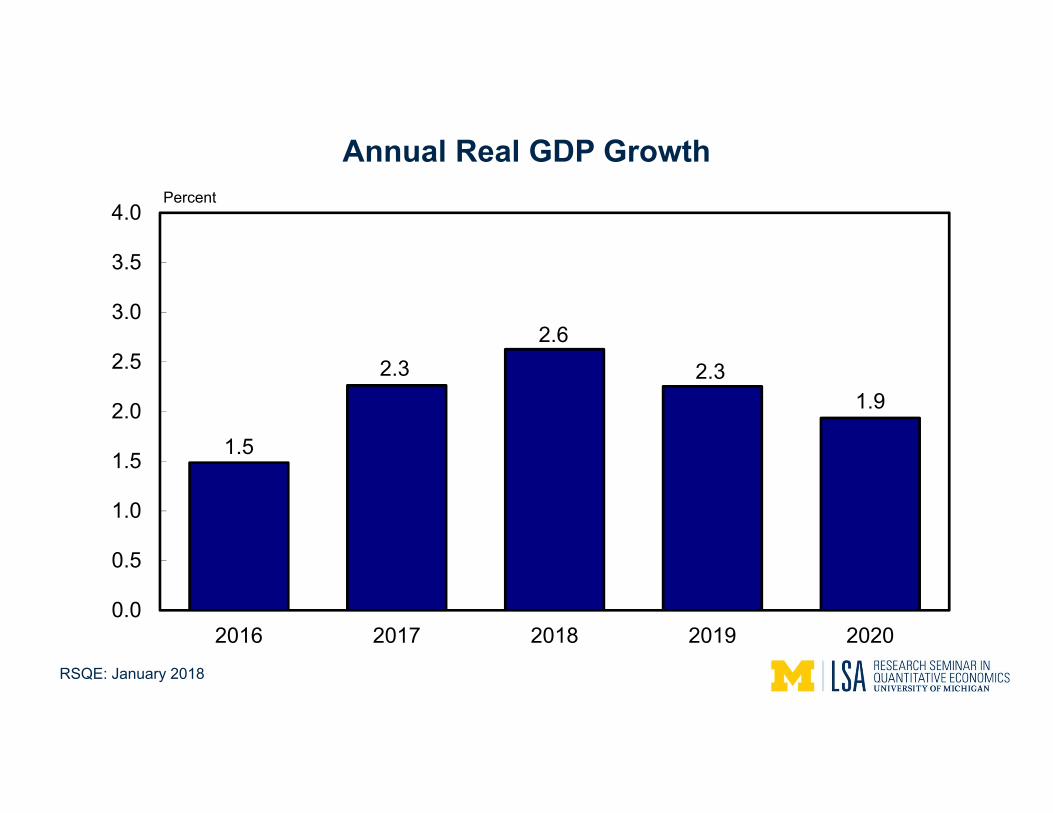
Annual Real GDP Growth
1.5
2.32.6
2.31.9
0.0
0.5
1.0
1.5
2.0
2.5
3.0
3.5
4.0
2016 2017 2018 2019 2020
Percent
RSQE: January 2018
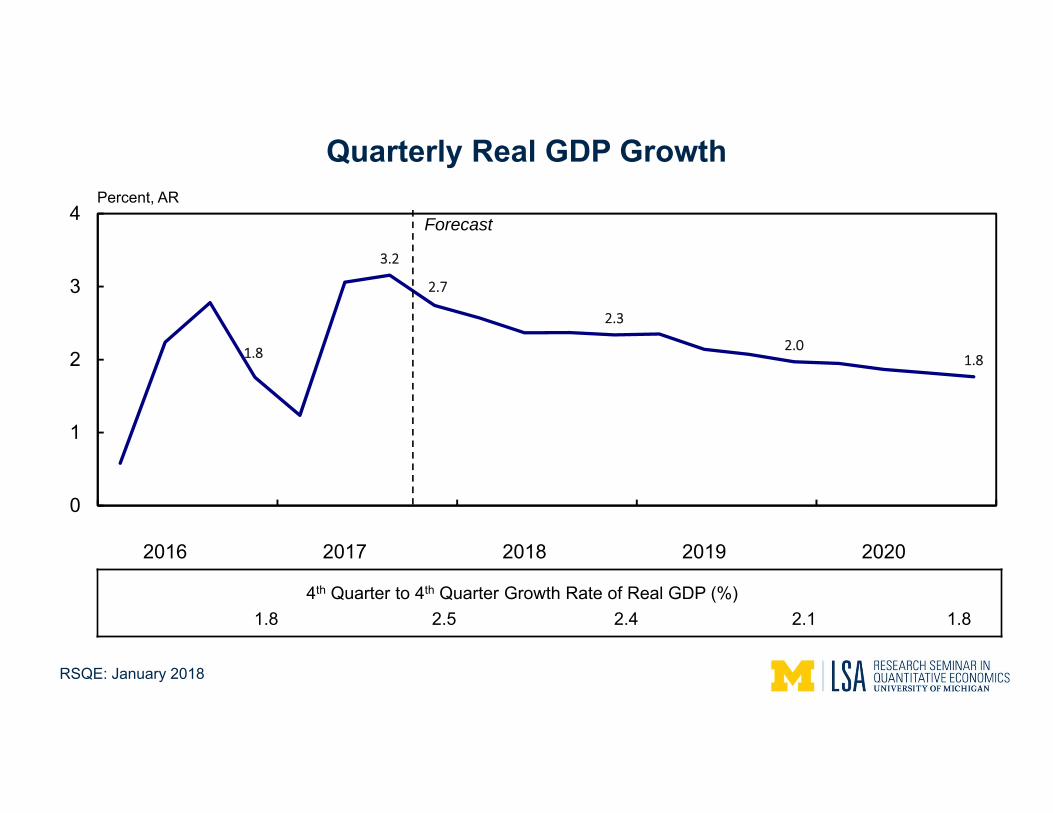
Quarterly Real GDP Growth
1.8
3.2
2.7
2.3
2.01.8
0
1
2
3
4
2016 2017 2018 2019 2020
Forecast
1.8 2.5 2.4 2.1 1.84th Quarter to 4th Quarter Growth Rate of Real GDP (%)
Percent, AR
RSQE: January 2018
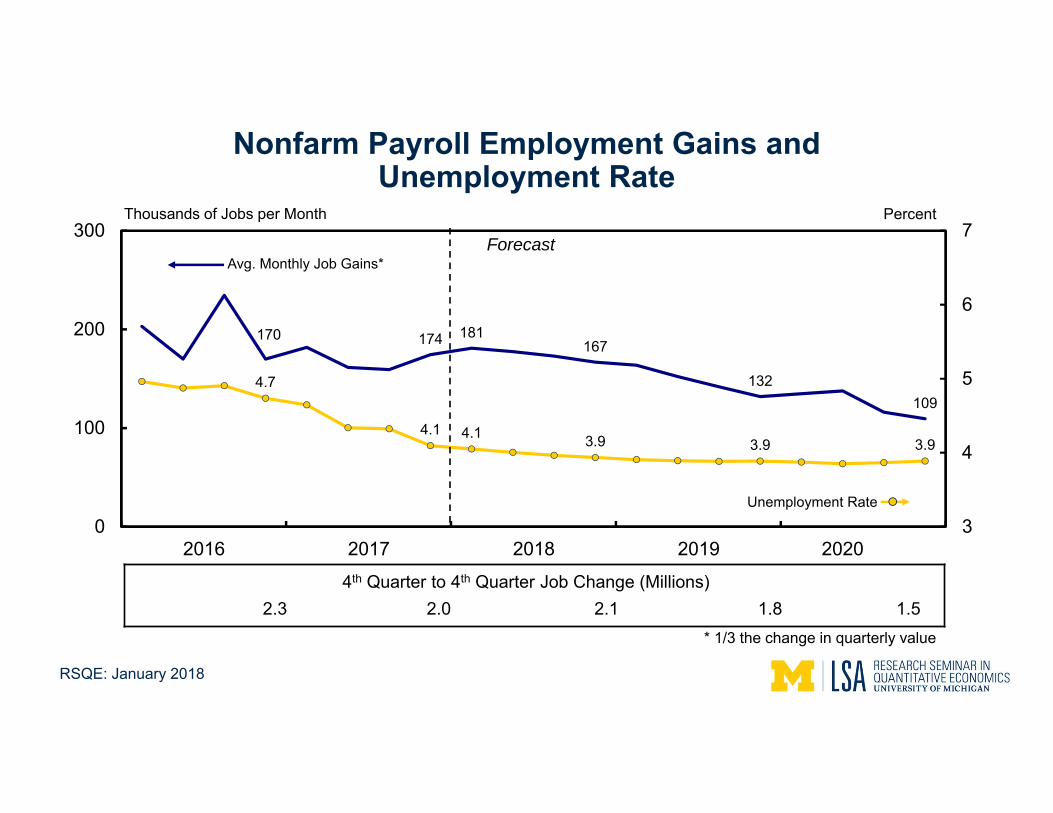
Nonfarm Payroll Employment Gains and Unemployment Rate
170 174 181167
132109
4.7
4.1 4.1 3.9 3.9 3.9
3
4
5
6
7
0
100
200
300
2016 2017 2018 2019 2020
Forecast
PercentThousands of Jobs per Month
2.3 2.0 2.1 1.8 1.54th Quarter to 4th Quarter Job Change (Millions)
Unemployment Rate
Avg. Monthly Job Gains*
* 1/3 the change in quarterly value

RSQE: January 2018
2.2
1.8 1.82.1 2.2
1.3
2.1 2.2
1.92.0
0
1
2
3
2016 2017 2018 2019 2020
Core All ItemsPercent
Consumer Price Inflation (CPI-U)
RSQE: January 2018
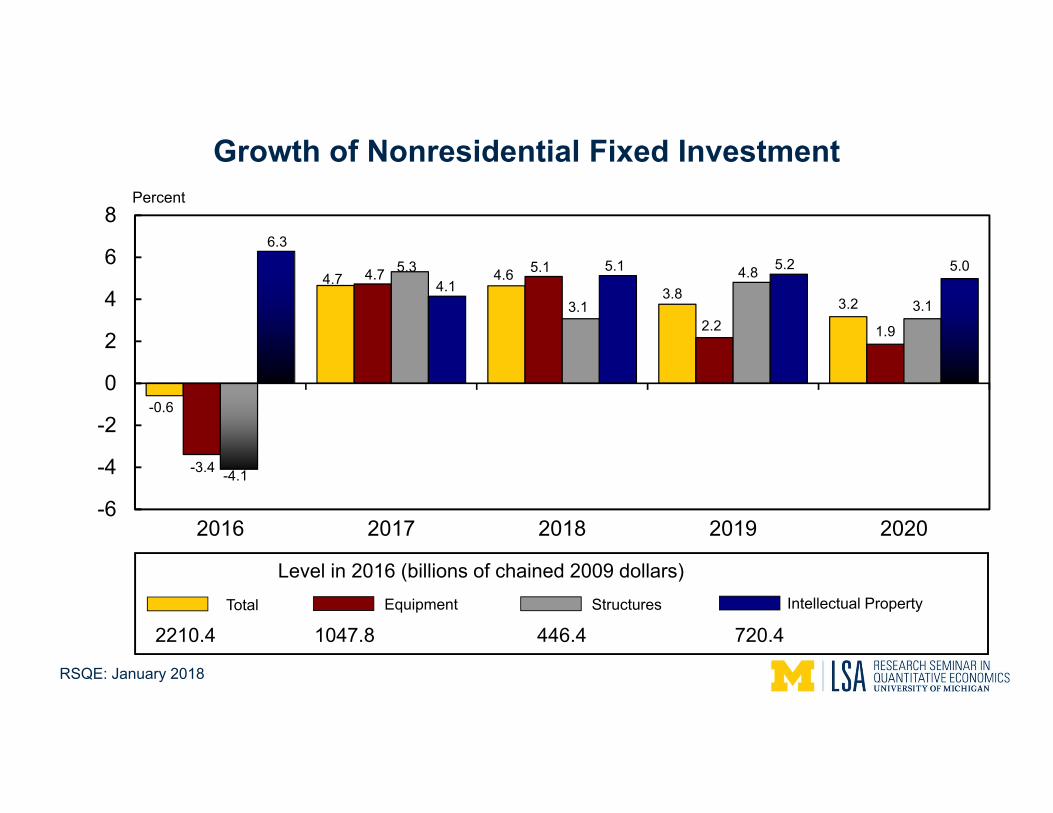
Level in 2016 (billions of chained 2009 dollars)EquipmentTotal Structures Intellectual Property
Growth of Nonresidential Fixed Investment
-0.6
4.7 4.63.8
3.2
-3.4
4.7 5.1
2.2 1.9
-4.1
5.3
3.1
4.8
3.1
6.3
4.15.1 5.2 5.0
-6
-4
-2
0
2
4
6
8
2016 2017 2018 2019 2020
Percent
2210.4 1047.8 446.4 720.4

RSQE: January 2018
Housing Market
0.710.85
0.92 0.96 0.97
0.39 0.36 0.37 0.35 0.34
1.11 1.211.29 1.31 1.32
0.0
0.5
1.0
1.5
2016 2017 2018 2019 2020
Singles Multis Total
4.83 4.91 4.93 4.97 5.03
0
2
4
6
2016 2017 2018 2019 2020
A. Housing StartsUnits (Millions) Units (Millions)
B. Existing Home Sales*
*Single-family homes
RSQE: January 2018
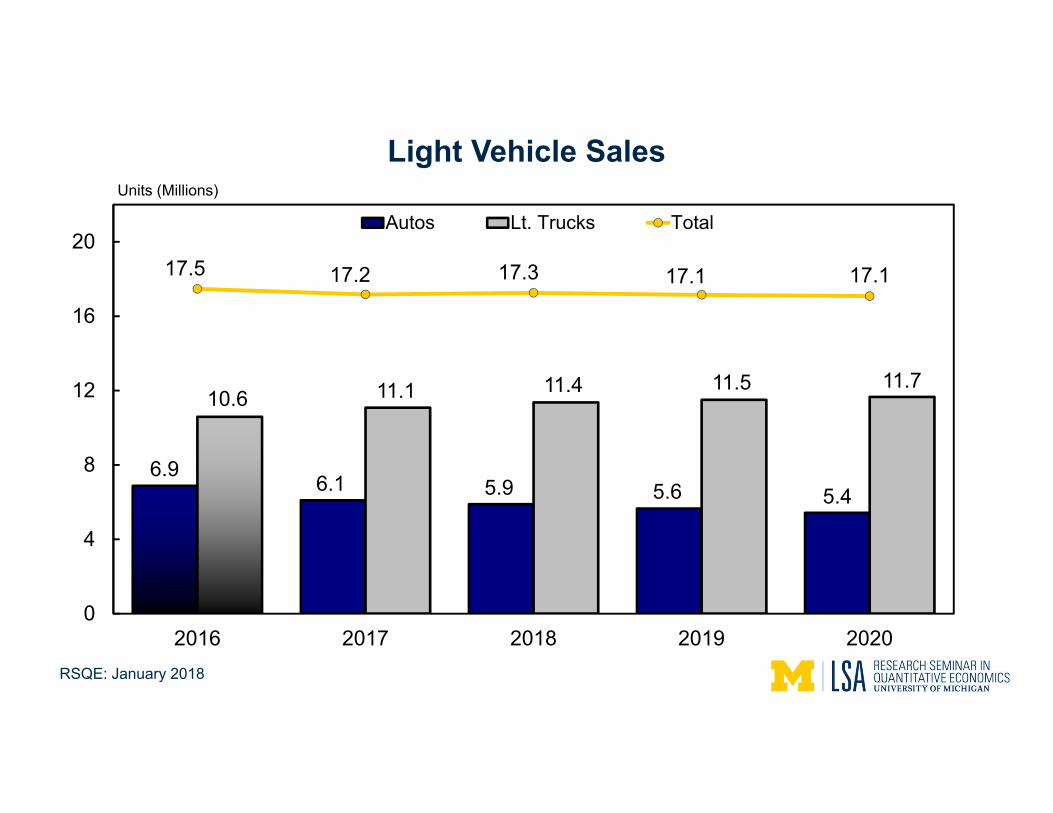
6.96.1 5.9 5.6 5.4
10.6 11.1 11.4 11.5 11.7
17.5 17.2 17.3 17.1 17.1
0
4
8
12
16
20
2016 2017 2018 2019 2020
Autos Lt. Trucks Total
Units (Millions)
Light Vehicle Sales

RSQE: January 2018
Oil Prices and Geopolitical Risks
Fiscal Policy
Monetary Policy
Trade Policy
Abnormal weather
Risks to Our Outlook
Research Seminar in Quantitative Economics
The Michigan Economic Outlook For 2018–20
Consensus Revenue Estimating Conference
January 11, 2018

Motor Vehicle Industry Revisited

0
5
10
15
20
'90 '92 '94 '96 '98 '00 '02 '04 '06 '08 '10 '12 '14 '16 '18 '20
U.S. Light Vehicle Sales, 1990–2020Millions of Units
17
'91 '93 '95 '97 '99 '01 '03 '05 '07 '09 '11 '13 '15 '17 '19
RSQE: January 2018
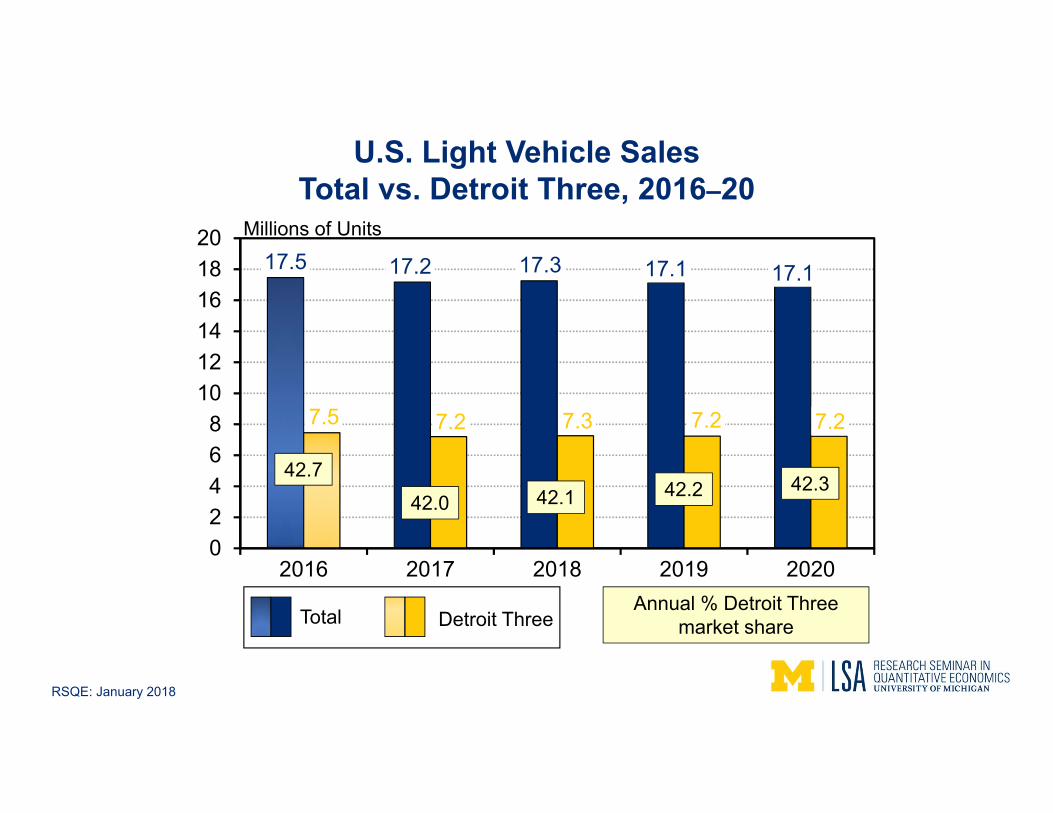
17.5 17.2 17.3 17.1 17.1
7.5 7.2 7.3 7.2 7.2
02468
101214161820
2016 2017 2018 2019 2020
U.S. Light Vehicle SalesTotal vs. Detroit Three, 2016–20
Millions of Units
Total Detroit ThreeAnnual % Detroit Three
market share
42.742.1
42.342.0
42.2
RSQE: January 2018

Michigan Outlook

1.9
3.0
1.01.01.3
1.0 1.1 0.9
0
1
2
3
4
4 1 2 3 4 1 2 3 4 1 2 3 4 1 2 3 4 1 2 3 42016 2017 2018’15 2019 2020
1.5 2.3 1.0 0.9 1.1
62.1 96.8 44.1 41.6 51.7
4th Quarter to 4th Quarter Growth Rate (%)
4th Quarter to 4th Quarter Change (Thousands)1.1
49.8
Michigan Wage and Salary Employment GrowthAnnual Rate (%)
Forecast
RSQE: January 2018
2020 Census
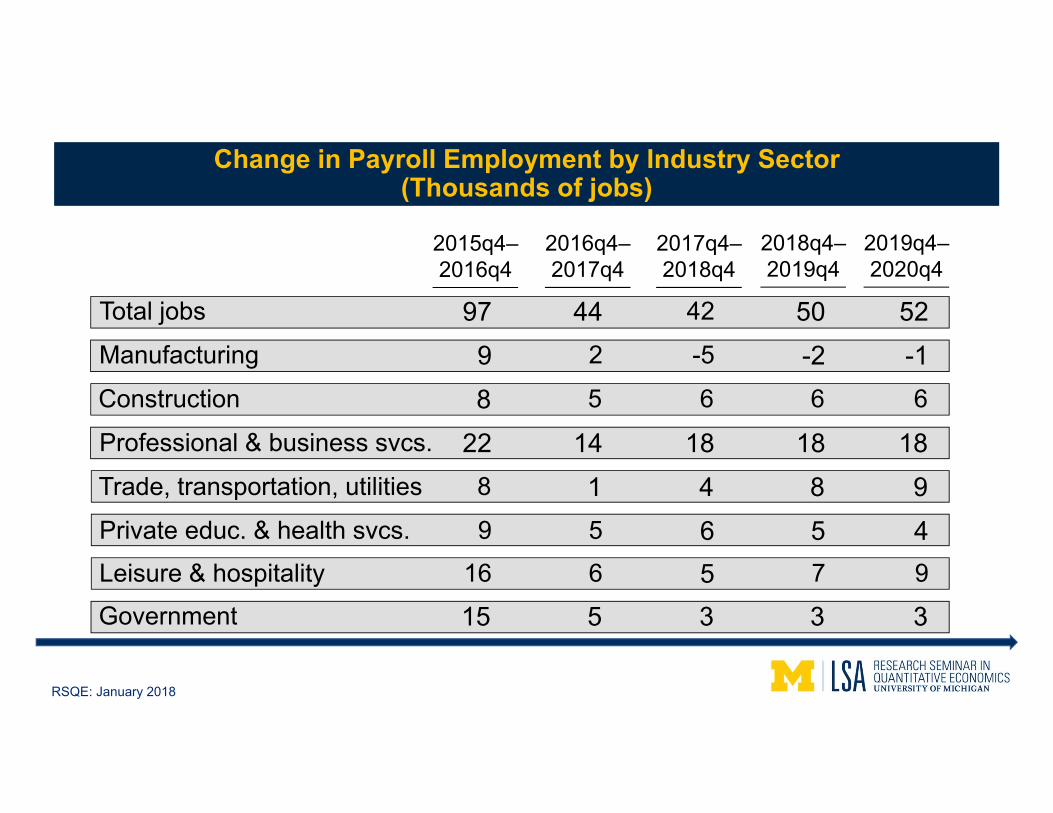
Change in Payroll Employment by Industry Sector(Thousands of jobs)
Change in Payroll Employment by Industry Sector(Thousands of jobs)
2015q4–2016q4
2016q4–2017q4
2017q4–2018q4
2018q4–2019q4
Total jobs 97 44 42 50 52Manufacturing 9 2 -5 -2 -1
Trade, transportation, utilities 8 1 4 8 9Professional & business svcs. 22 14 18 18 18Construction 8 5 6 6 6
Leisure & hospitality 16 6 5 7 9Government 5 3 315 3
Private educ. & health svcs. 9 5 6 5 4
2019q4–2020q4
RSQE: January 2018

3
4
5
6
7
8
9
10
11
12
3,500
4,000
4,500
5,000
'91 '93 '95 '97 '99 '01 '03 '05 '07 '09 '11 '13 '15 '17 '19
Total Jobs(Thousands)
Sales(Millions of Units)
Michigan Total Jobs andDetroit Three Sales of Light Vehicles
1991 to 2020
Total jobsSales
Forecast
RSQE: January 2018

3,8003,9004,0004,1004,2004,3004,4004,5004,6004,7004,800
'00 '01 '02 '03 '04 '05 '06 '07 '08 '09 '10 '11 '12 '13 '14 '15 '16 '17 '18 '19 '20
Michigan Wage and Salary EmploymentFirst Quarter of 2000 to Fourth Quarter of 2020
Thousands of jobsForecastPeak ’00q2
Loss: ’00q2–’09q3 = 858,100
Trough ’09q3
’20q4
’17q3
Gain:’09q3–’20q4 = 722,700(84% of jobs lost)
RSQE: January 2018

4.94.5 4.5 4.3 4.1
0
1
2
3
4
5
6
2016 2017 2018 2019 2020
Michigan Unemployment Rate2016–20Percent
5.1
61.4
4.6
61.3
4.5
61.4
4.1
61.6
4th Quarter Unemployment Rate
4th Quarter Labor Force Participation Rate4.3
61.5
RSQE: January 2018
Percent
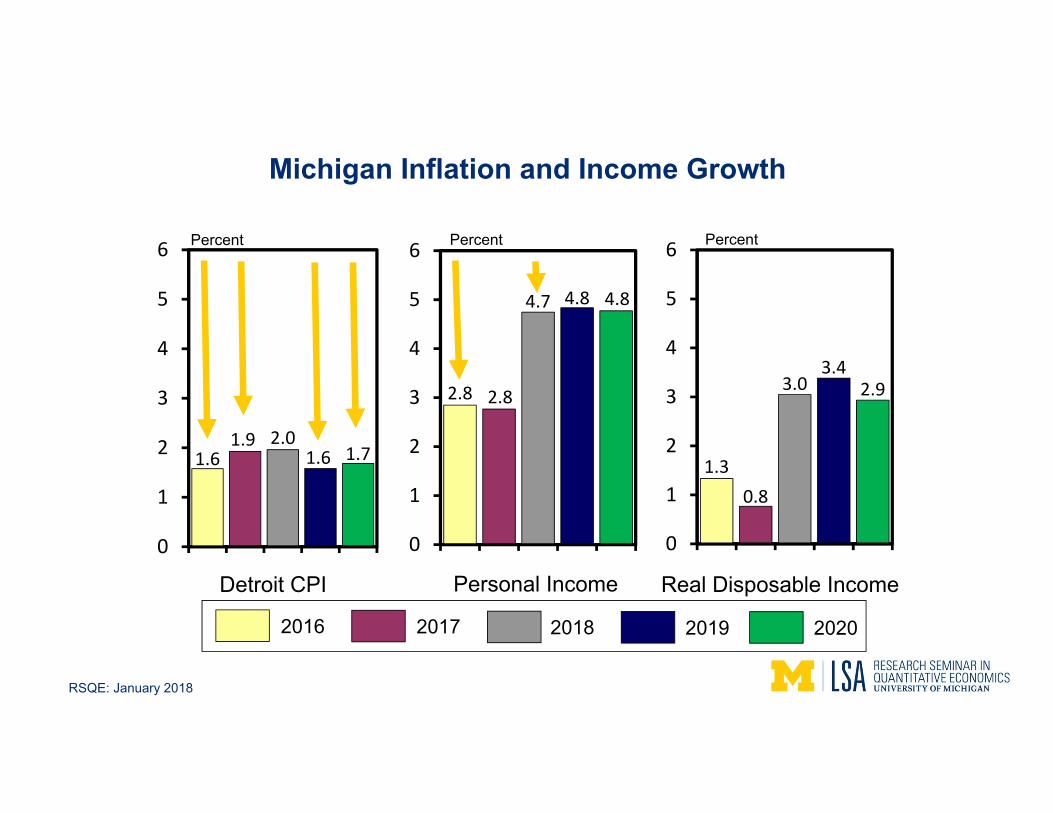
Real Disposable Income
1.30.8
3.03.4
2.9
0
1
2
3
4
5
6
1.61.9 2.0
1.6 1.7
0
1
2
3
4
5
6
Michigan Inflation and Income Growth
Detroit CPI
Percent
2.8 2.8
4.7 4.8 4.8
0
1
2
3
4
5
6 Percent
Personal Income
2016 2017 2018 2019 2020
RSQE: January 2018

State Revenue Outlook

Actual Forecast2017P 2018 2019 2020
GFGP revenue
(% change)
10,296
(2.8)
10,478
(1.8)
10,677
(1.9)
10,850
(1.6)
Earmarked stateSAF revenue(% change)
12,675
(4.6)
13,116
(3.5)
13,563
(3.4)
14,001
(3.2)
PPreliminary
RSQE Forecast – State Revenues by Fiscal Year(Millions of dollars)
RSQE Forecast – State Revenues by Fiscal Year(Millions of dollars)
RSQE: January 2018

• Uncertainty about federal monetary & fiscal policy
• Risks associated with oil prices & the auto industry
• Potential effects of NAFTA withdrawal
Risks to the ForecastRisks to the Forecast
RSQE: January 2018

Simulating the Effects of Potential NAFTA Withdrawal

NAFTA Withdrawal AssumptionsNAFTA Withdrawal Assumptions
• Two scenarios: “soft” withdrawal and “hard” withdrawal
Soft HardTariffs Mexican and U.S. tariffs on
each other’s imports go to MFN levels
Retaliatory tariffs of 25% on imports of automobiles and parts;15% tariff on all other US exports
Effect on assemblies 520,000 light truck assemblies leave Mexico
600,000 light truck and 900,000‐1,000,000 auto assemblies leave Mexico
Peso Depreciates by 4% Depreciates by 10%Detroit Three Share Falls 0.6 percentage points Falls 1.8 percentage points
RSQE: January 2018

6.4
1.32.9 2.2
-7.0
-3.9
0.7
-3.8
-9-7-5-3-113579
Total Manufacturing Prof. & Bus.Svcs.
Other
Michigan Payroll Employment Effects of NAFTA Withdrawal Scenarios – 2020
Soft Withdrawal Hard Withdrawal
Thousands of Jobs
RSQE: January 2018

0.08
0.18
0.09
0.20
0.11
-0.24
-0.34
-0.25
-0.4
-0.3
-0.2
-0.1
0.0
0.1
0.2
0.3
Detroit CPI PersonalIncome
Real DisposableIncome
GFGP & SAFTaxes
Michigan Price, Income, and Tax Effects of NAFTA Withdrawal Scenarios – 2020
Percent
Soft Withdrawal Hard Withdrawal
RSQE: January 2018

lsa.umich.edu/econ/rsqelsa.umich.edu/econ/rsqe