Embed Size (px)
Citation preview
Hymans Robertson LLP and Hymans Robertson Financial Services LLP are authorised and regulated by the Financial Services Authority
Leicestershire Pension FundAnnual General Meeting
• John Wright
• Barry McKay
• 15 January 2013
LGPS up-date
2
Some topical issues
2013 Valuation
Pensions Reform:
LGPS 2014, Governance, Cost Control
Auto-enrolment
New flat-rate state pension
Other issues:
Infrastructure and local investment
2013 Valuation
4
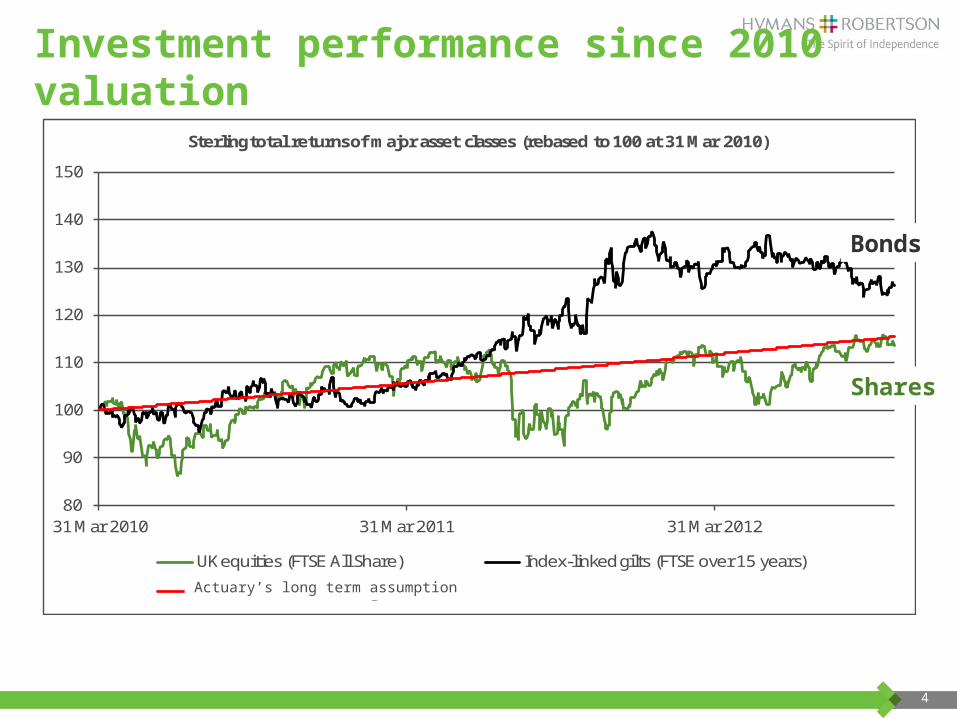
Investment performance since 2010 valuation
80
90
100
110
120
130
140
150
31 Mar 2010 31 Mar 2011 31 Mar 2012
Sterling total returns of major asset classes (rebased to 100 at 31 Mar 2010)
UK equities (FTSE All Share) Index-linked gilts (FTSE over 15 years)
Discount rate unwindingActuary’s long term assumption
Bonds
Shares
5
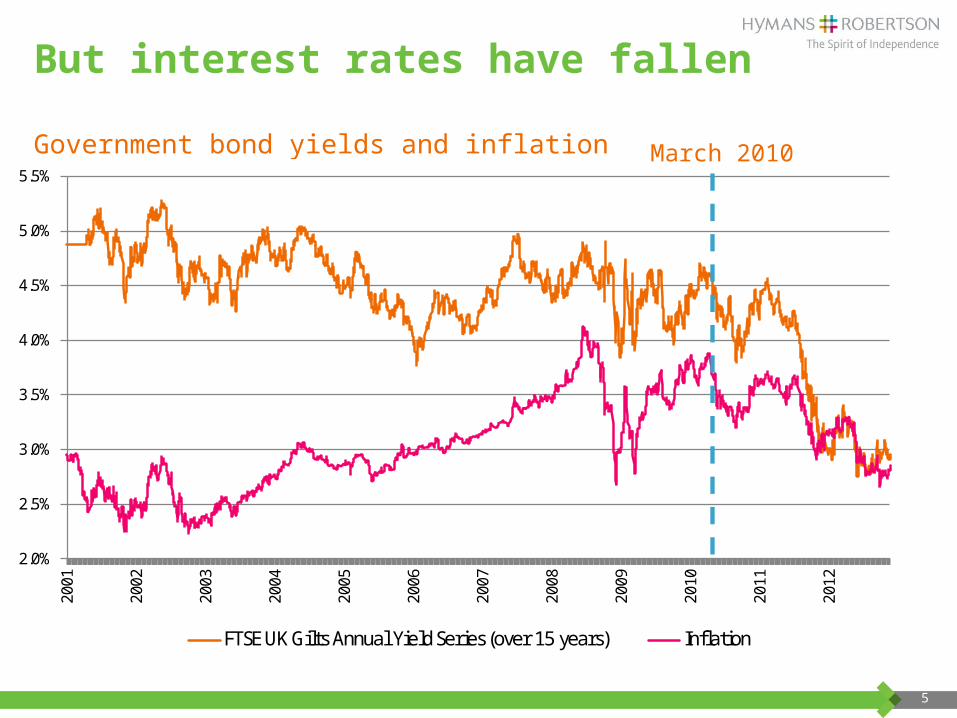
But interest rates have fallen
Government bond yields and inflation
2.0%
2.5%
3.0%
3.5%
4.0%
4.5%
5.0%
5.5%
2001
2002
2003
2004
2005
2006
2007
2008
2009
2010
2011
2012
FTSE UK Gilts Annual Yield Series (over 15 years) Inflation
March 2010
6
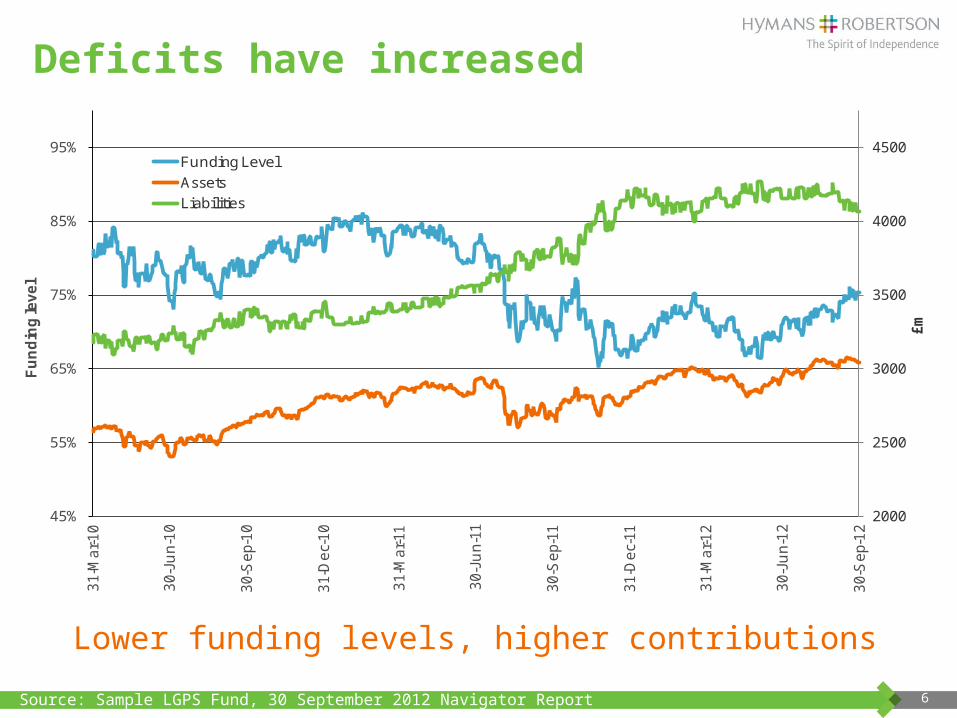
Deficits have increased
Lower funding levels, higher contributions
2000
2500
3000
3500
4000
4500
45%
55%
65%
75%
85%
95%
31-
Ma
r-1
0
30-
Jun-1
0
30-
Se
p-1
0
31-
De
c-1
0
31-
Ma
r-11
30-
Jun-1
1
30-
Se
p-11
31-
De
c-11
31-
Ma
r-1
2
30-
Jun-1
2
30-
Se
p-1
2
£m
Fu
nd
ing
lev
el
Funding Level
Assets
Liabilities
Source: Sample LGPS Fund, 30 September 2012 Navigator Report
7
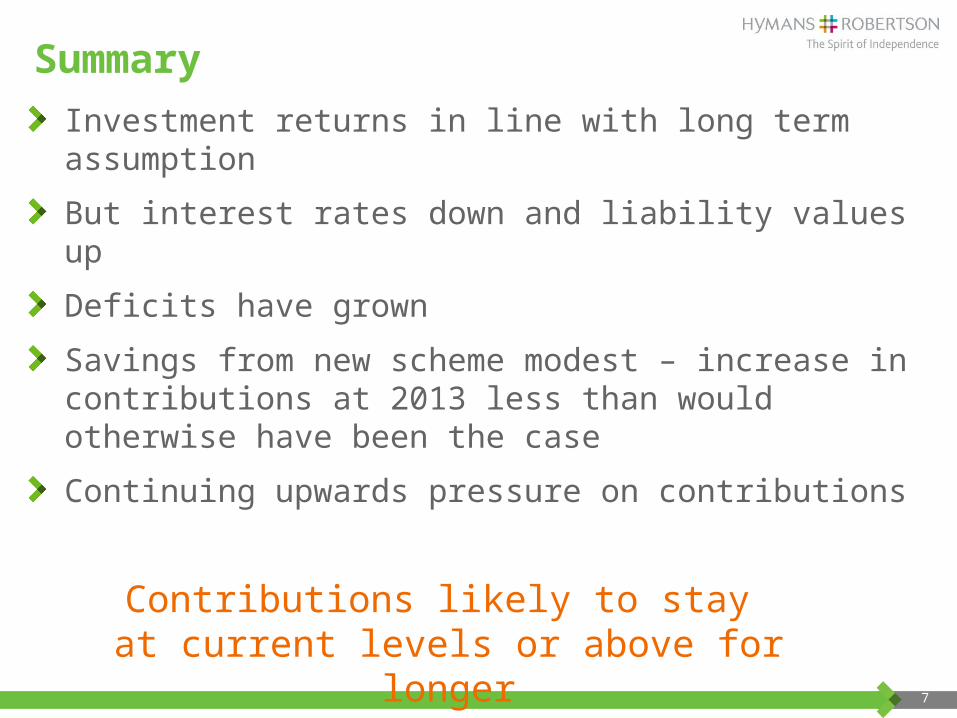
Summary
Investment returns in line with long term assumption
But interest rates down and liability values up
Deficits have grown
Savings from new scheme modest – increase in contributions at 2013 less than would otherwise have been the case
Continuing upwards pressure on contributions
Contributions likely to stay at current levels or above for longer
8
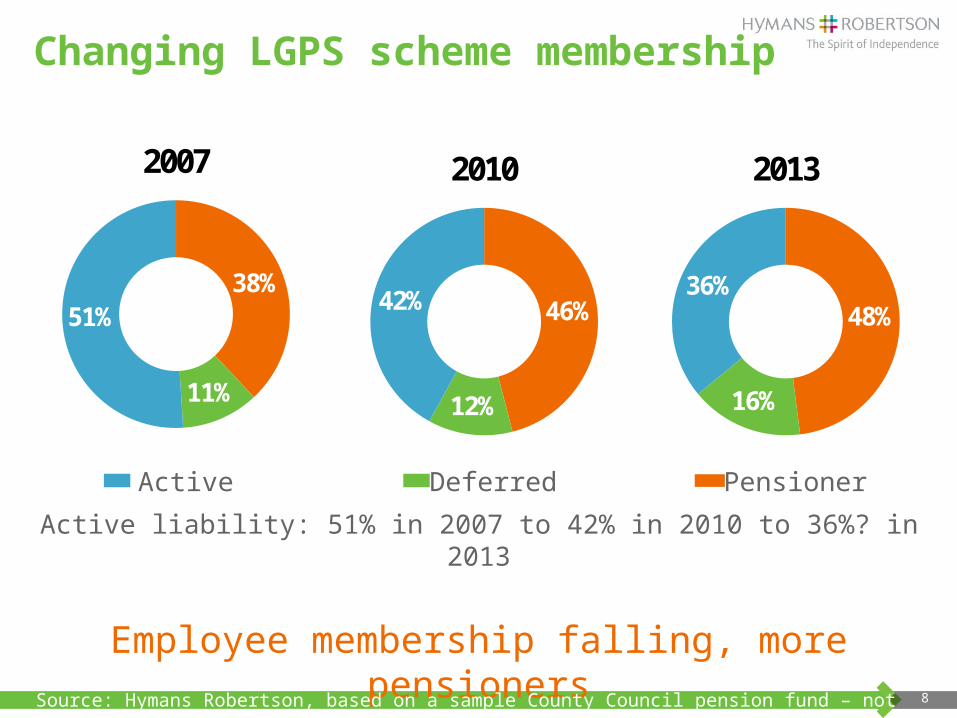
Changing LGPS scheme membership
Active liability: 51% in 2007 to 42% in 2010 to 36%? in 2013
Employee membership falling, more pensioners
Active Deferred Pensioner
38%
11%
51%
2007
46%
12%
42%
2010
48%
16%
36%
2013
Source: Hymans Robertson, based on a sample County Council pension fund – not Leicestershire.

9
Why is LGPS scheme membership changing?
Redundancies
Early retirements
Fewer new recruits
More outsourcing
Council payroll shrinking
e.g. transfers of staff to academies
Admission agreements often closed to new recruits
50/50 option in LGPS 2014
What impact will auto-enrolment have?
10
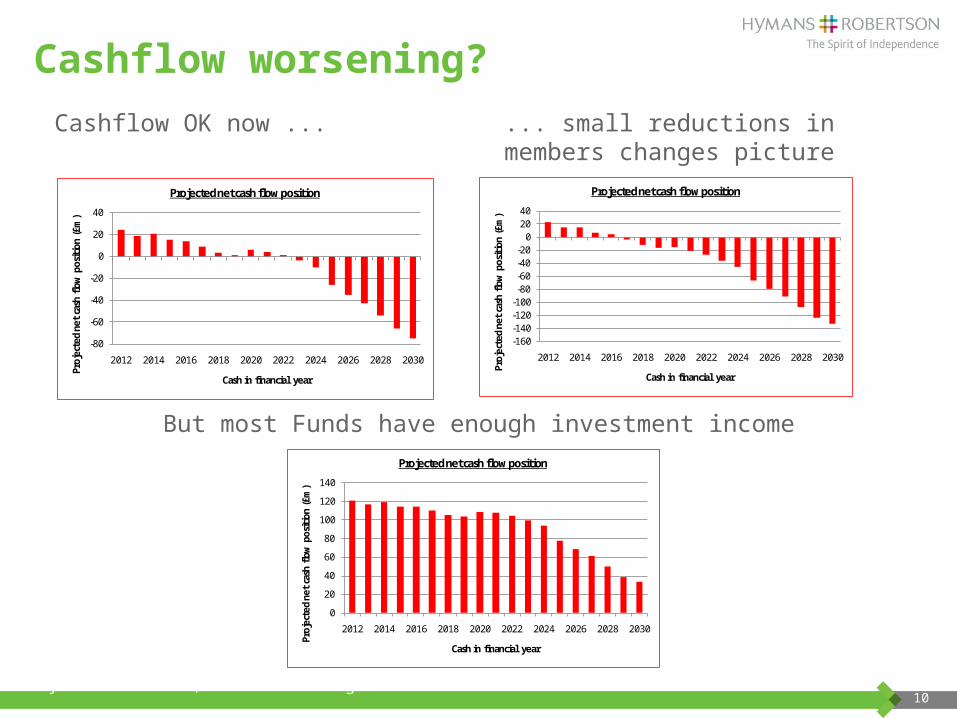
Cashflow worsening?
-80
-60
-40
-20
0
20
40
2012 2014 2016 2018 2020 2022 2024 2026 2028 2030
Proj
ecte
d ne
t ca
sh fl
ow p
ositi
on (
£m)
Cash in financial year
Projected net cash flow position
-160-140-120-100
-80-60-40-20
02040
2012 2014 2016 2018 2020 2022 2024 2026 2028 2030
Proj
ecte
d ne
t ca
sh fl
ow p
ositi
on (
£m)
Cash in financial year
Projected net cash flow position
0
20
40
60
80
100
120
140
2012 2014 2016 2018 2020 2022 2024 2026 2028 2030
Proj
ecte
d ne
t ca
sh fl
ow p
ositi
on (
£m)
Cash in financial year
Projected net cash flow position
Cashflow OK now ... ... small reductions inmembers changes picture
But most Funds have enough investment income
Source: Hymans Robertson, based on a large LGPS fund.
Reform: LGPS 2014
12
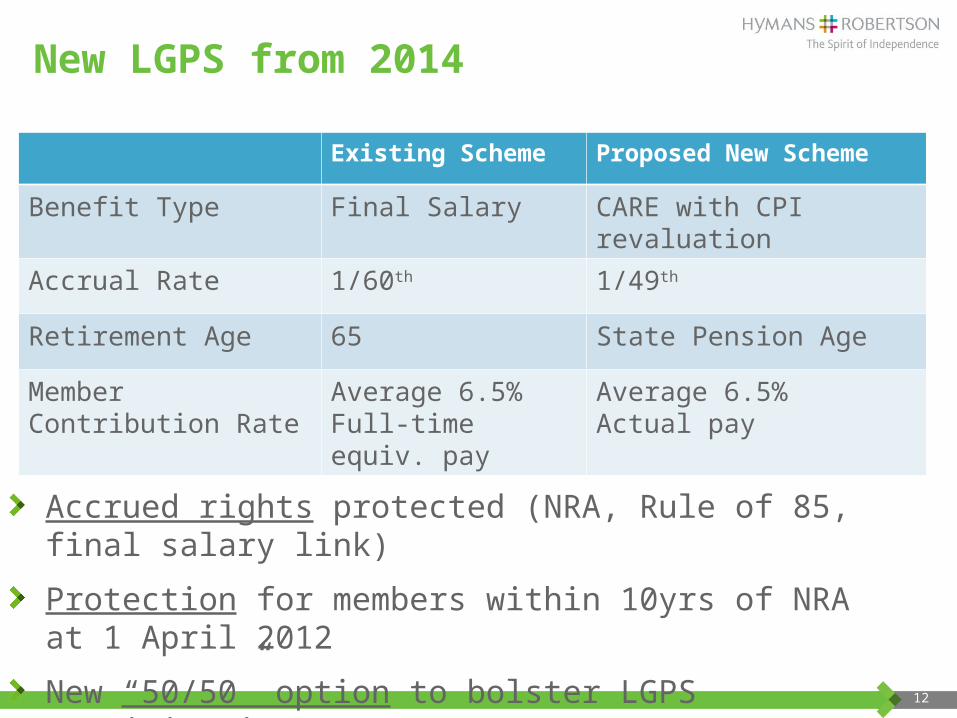
New LGPS from 2014
Existing Scheme Proposed New Scheme
Benefit Type Final Salary CARE with CPI revaluation
Accrual Rate 1/60th 1/49th
Retirement Age 65 State Pension Age
Member Contribution Rate
Average 6.5%Full-time equiv. pay
Average 6.5%Actual pay
Accrued rights protected (NRA, Rule of 85, final salary link)
Protection for members within 10yrs of NRA at 1 April 2012
New “50/50” option to bolster LGPS participation
13
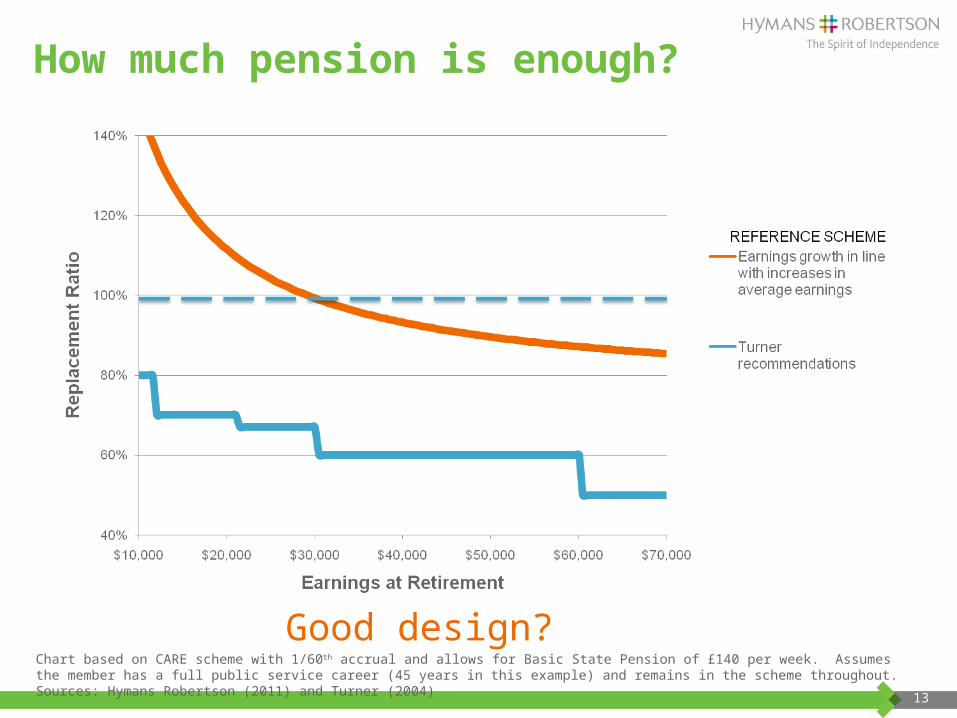
How much pension is enough?
Good design?Chart based on CARE scheme with 1/60th accrual and allows for Basic State Pension of £140 per week. Assumes the member has a full public service career (45 years in this example) and remains in the scheme throughout. Sources: Hymans Robertson (2011) and Turner (2004)
14
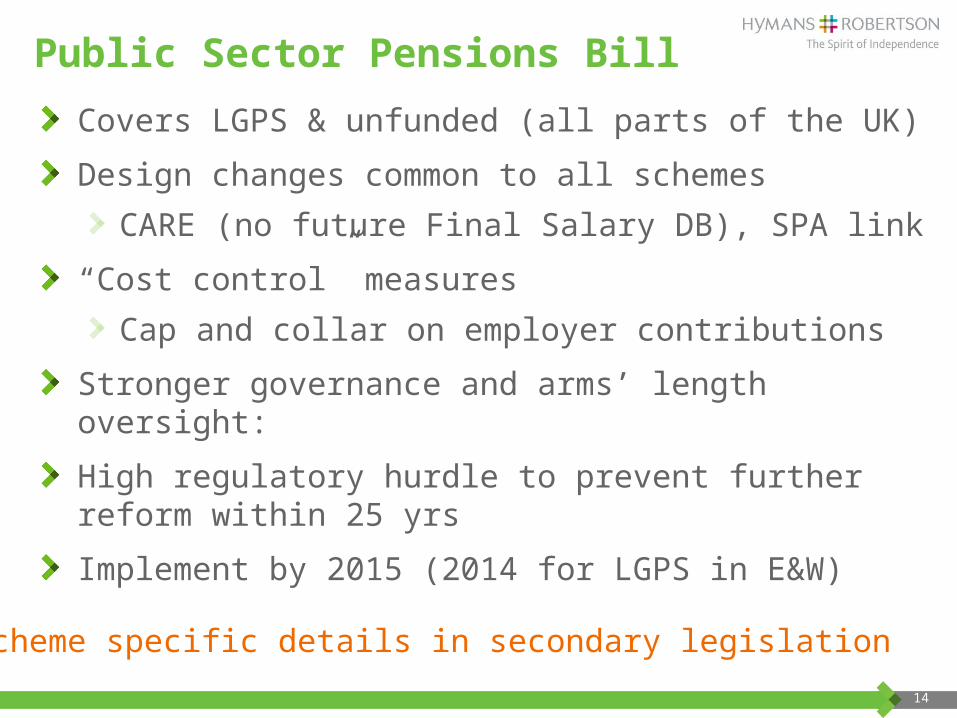
Public Sector Pensions Bill
Covers LGPS & unfunded (all parts of the UK)
Design changes common to all schemes
CARE (no future Final Salary DB), SPA link
“Cost control” measures
Cap and collar on employer contributions
Stronger governance and arms’ length oversight:
High regulatory hurdle to prevent further reform within 25 yrs
Implement by 2015 (2014 for LGPS in E&W)
Scheme specific details in secondary legislation
LGPS cost control
16
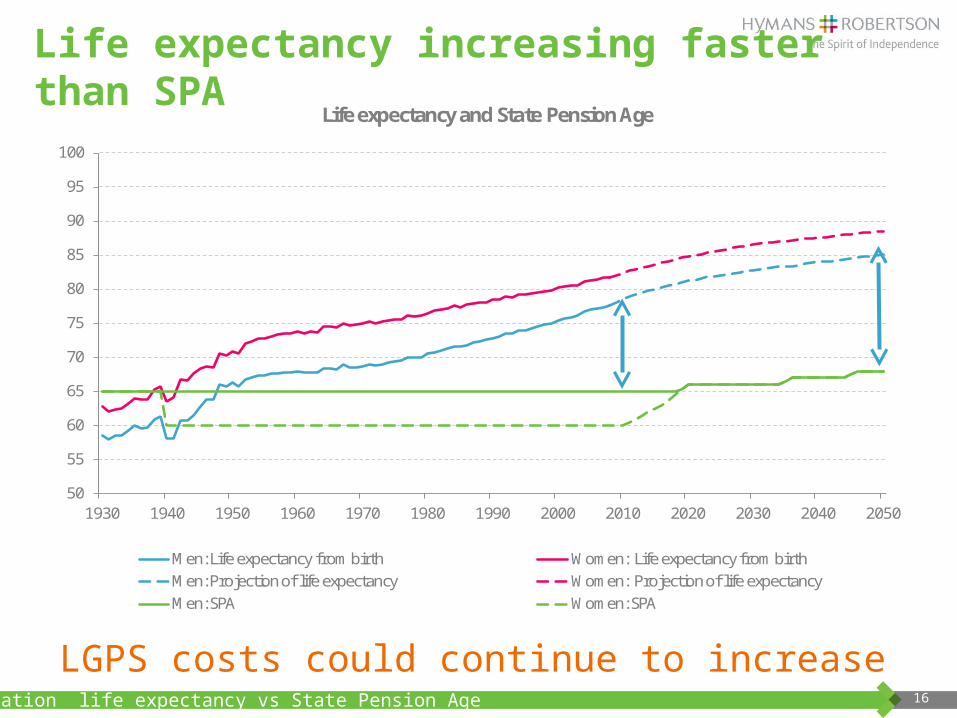
Life expectancy increasing faster than SPA
50
55
60
65
70
75
80
85
90
95
100
1930 1940 1950 1960 1970 1980 1990 2000 2010 2020 2030 2040 2050
Life expectancy and State Pension Age
Men: Life expectancy from birth Women: Life expectancy from birthMen: Projection of life expectancy Women: Projection of life expectancyMen: SPA Women: SPA
Population life expectancy vs State Pension Age
LGPS costs could continue to increase
17
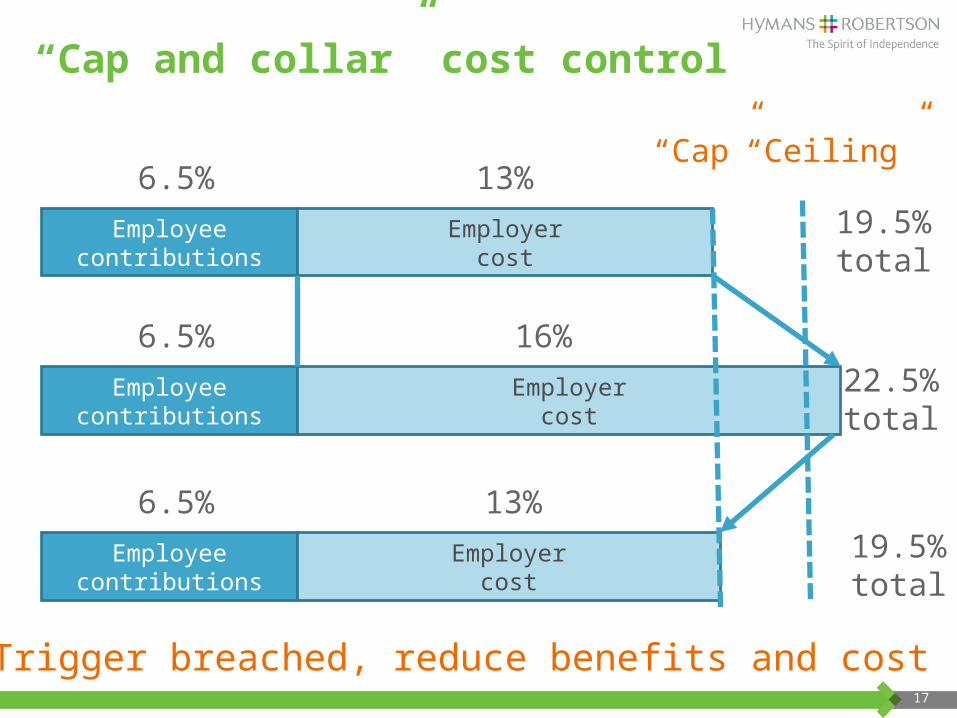
“Cap and collar” cost control
Employee contributions
Employercost
6.5% 13%19.5%total
Employee contributions
Employercost
6.5% 16%22.5%total
Trigger breached, reduce benefits and cost
Employee contributions
Employercost
6.5% 13%19.5%total
“Ceiling”“Cap”
18
Threats to sustainability
Benefits still generous and savings modest?
Will SPA keep up with life expectancy?
Cost management (caps/collars etc) effective?
Envy (continuing decline in private sector pensions)
Economy underperforming over long term
Politics (either lack of will or too much interference)

Auto-enrolment
20
Workers confused?
“Thousands baffled over compulsory pensions”
Express, 10 December 2012
Need for good communication

21
Auto-enrolment and LGPS employers
Many have staging dates in first half of 2013
Many employers will defer until 2018?
To save money?
To avoid implementation cost and effort?
Still need to comply for new joiners, birthdays, pay changes

Other topical issues
23
Other topical issues
Local investment & infrastructure but ...
Responsibilities of pensions committee
Sufficient diversification?
Best available investment of its type?
Availability of suitable investments?
Riskiness of currently available investment opportunities?
Excessive fees?
Consultation on investment regulations (LLPs)
Fund mergers and shared services

Any questions?
Thank you