Embed Size (px)
Citation preview
Key Words
• AAS
• Environmental
• AtomicAbsorptionSpectrometry
• Overview
The Analysis of Environmental Materials byAtomic Absorption Spectrometry
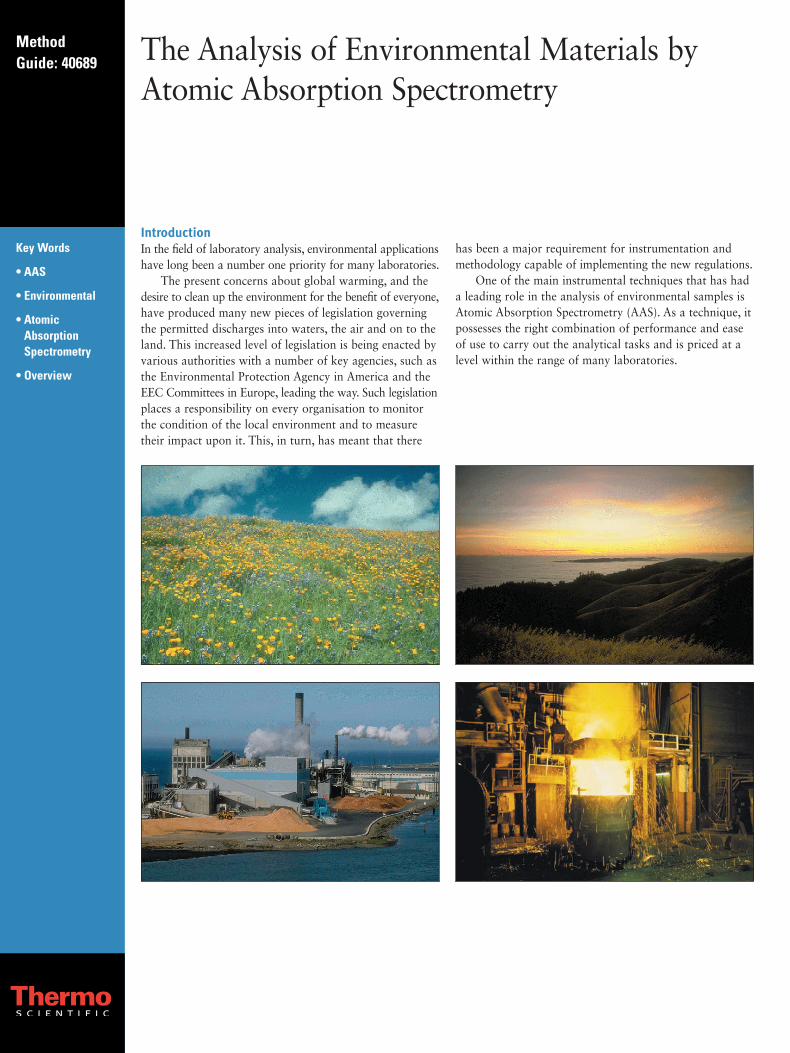
IntroductionIn the field of laboratory analysis, environmental applicationshave long been a number one priority for many laboratories.The present concerns about global warming, and the
desire to clean up the environment for the benefit of everyone,have produced many new pieces of legislation governingthe permitted discharges into waters, the air and on to theland. This increased level of legislation is being enacted byvarious authorities with a number of key agencies, such asthe Environmental Protection Agency in America and theEEC Committees in Europe, leading the way. Such legislationplaces a responsibility on every organisation to monitorthe condition of the local environment and to measuretheir impact upon it. This, in turn, has meant that there
has been a major requirement for instrumentation andmethodology capable of implementing the new regulations.One of the main instrumental techniques that has had
a leading role in the analysis of environmental samples isAtomic Absorption Spectrometry (AAS). As a technique, itpossesses the right combination of performance and easeof use to carry out the analytical tasks and is priced at alevel within the range of many laboratories.
1) Introduction:Major sources of pollution come from many of our day-today activities, such as Farming, Industry, Transportationand Urban sites. The effects of these activities impact onthe three main areas of our environment; the land, thewater and the air. For example, consider the mining andmetal processing industry. The mining activity can addpollution to the air (in the form of dust), to the water (inthe form of washings from ore processing) and the land(in the form of mining waste heaps). Metals productionintroduces fumes and particulate to the air and land andproduces waste water which flows into the surface waterlayers.Environmental pollution is monitored in a number of
ways and this has resulted in a wide variety of sample typesbeing supplied for analysis. This list shows the main types:
Biological - serum, urine, tissue.Waters - sea, fresh, waste.Plant materialsSoils, sludges and sedimentsAirborne particulates
As a result of this variety of sample types, a number ofdifferent sampling and preparation techniques have to beused.Pollution legislation generally specifies certain element
concentration levels which it considers to be representativeof pollution in the different sample types.This means that any analytical technique must possess
a sensitivity at least equal to, but preferably better than,these levels before it is suitable for use in environmentalanalysis. As legislation changes it is more often the casethat these limits are further reduced. Tables 1 and 2 shownhere indicate the applicability of AAS for the differentchemical elements and the main sample types characteristicof environmental applications.
ELEMENT EEC MAC TECHNIQUE
Magnesium 50,000 FAAS (2.2)
Sodium 150,000 FAAS (3.7)
Potassium 12,000 FAAS (0.9)
Aluminium 200 GFAAS (0.21)
Iron 200 FAAS (4.3)
Manganese 50 GFAAS (0.06)
Copper 3,000 FAAS (4.5)
Zinc 5,000 FAAS (3.3)
Silver 10 GFAAS (0.04)
Arsenic 50 HGAAS (0.05)
Cadmium 5 GFAAS (0.02)
Chromium 50 GFAAS (0.025)
Mercury 1 HGAAS (0.15)
Nickel 50 GFAAS (0.16)
Lead 50 GFAAS (0.07)
Antimony 10 HGAAS (0.27)
Selenium 10 HGAAS (0.27)
Barium 1,000 FAAS (3.0)
Table 1: List of Maximum Allowable Concentrations for drinking water inµg/L, (Council for European Communities Journal), showing the technique(and its detection limit in µg/L in parentheses). FAAS = Flame AAS,GFAAS = Graphite Furnace AAS, HGAAS = Hydride Generation AAS.
From these lists it can be seen that Atomic Absorptioncan measure the legal limits for toxic metals such as As,Cd, Pb and Hg in most sample types. The use of Hydridetechniques can improve the performance for hydride formingelements such as As and Se.
ELEMENT CLP D.L. GFAAS D.L.
Aluminium 200 0.21
Antimony 60 0.4
Arsenic 10 0.53
Beryllium 5 0.003
Cadmium 5 0.02
Chromium 10 0.025
Cobalt 50 0.17
Copper 25 0.29
Iron 100 0.18
Lead 3 0.07
Manganese 15 0.06
Nickel 40 0.16
Selenium 5 0.8
Silver 10 0.04
Thallium 10 0.5
Table 2: Comparison of the EPA Method 200.9 required detection limits(µg/L) and the Zeeman GFAAS detection limits (3 σ µg/L) for water analysis
2) Features of the AA Series System:The Thermo Scientific iCE 3000 Series range of AAspectrometers includes configurations which can be usedspecifically for environmental use.(1) Dual atomiser system, consisting of a combination
of the VP100 Continuous Flow Vapour system and EC90Electrically Heated Vapour cell, together with a GFS35ZZeeman Furnace System.(2) When equipped with the Furnace Autosampler and
the appropriate vapour autosampler, the system is capableof fully automated analysis for both vapour and furnaceelements. This includes overnight, unattended analyses.(3) Auto change-over between vapour and furnace
analysis carried out by software means only, no manualintervention required.
(4) Easy to use, Wizard-driven software to simplifyoperation and including comprehensive QC facilities andprintout options.(5) Optional high sensitivity mercury accessories permit
mercury perfomance down to µg/L levels.(6) Validator and Validatorplus accessories enable systems
to be validated as part of a regulatory compliance programme.
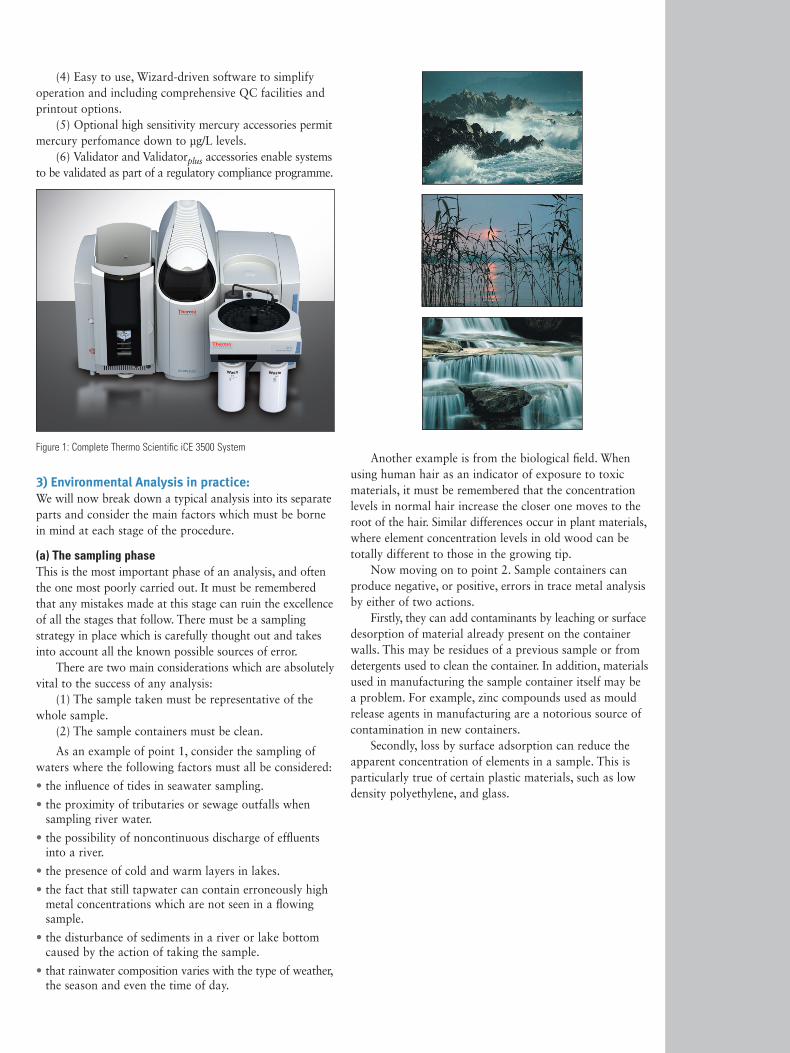
Figure 1: Complete Thermo Scientific iCE 3500 System
3) Environmental Analysis in practice:We will now break down a typical analysis into its separateparts and consider the main factors which must be bornein mind at each stage of the procedure.
(a) The sampling phaseThis is the most important phase of an analysis, and oftenthe one most poorly carried out. It must be rememberedthat any mistakes made at this stage can ruin the excellenceof all the stages that follow. There must be a samplingstrategy in place which is carefully thought out and takesinto account all the known possible sources of error.There are two main considerations which are absolutely
vital to the success of any analysis:(1) The sample taken must be representative of the
whole sample.(2) The sample containers must be clean.
As an example of point 1, consider the sampling ofwaters where the following factors must all be considered:
• the influence of tides in seawater sampling.
• the proximity of tributaries or sewage outfalls whensampling river water.
• the possibility of noncontinuous discharge of effluentsinto a river.
• the presence of cold and warm layers in lakes.
• the fact that still tapwater can contain erroneously highmetal concentrations which are not seen in a flowingsample.
• the disturbance of sediments in a river or lake bottomcaused by the action of taking the sample.
• that rainwater composition varies with the type of weather,the season and even the time of day.
Another example is from the biological field. Whenusing human hair as an indicator of exposure to toxicmaterials, it must be remembered that the concentrationlevels in normal hair increase the closer one moves to theroot of the hair. Similar differences occur in plant materials,where element concentration levels in old wood can betotally different to those in the growing tip.Now moving on to point 2. Sample containers can
produce negative, or positive, errors in trace metal analysisby either of two actions.Firstly, they can add contaminants by leaching or surface
desorption of material already present on the containerwalls. This may be residues of a previous sample or fromdetergents used to clean the container. In addition, materialsused in manufacturing the sample container itself may bea problem. For example, zinc compounds used as mouldrelease agents in manufacturing are a notorious source ofcontamination in new containers.Secondly, loss by surface adsorption can reduce the
apparent concentration of elements in a sample. This isparticularly true of certain plastic materials, such as lowdensity polyethylene, and glass.
Laboratory containers, whether glass or plastic (thisincludes polyethylene, polypropylene or fluorocarbon)should always be washed first with a detergent solutionthat does not contain high levels of metal compounds. It isimportant to remember that certain detergents can containhigh levels of metals, such as zinc and sodium, which remainbound to container walls even after flushing with cleandistilled or deionised water. Glassware is often cleaned witha chromic acid wash because it is a powerful cleaningagent for removing organic material. However, the chromiumpersists in glassware for a long time, even after thoroughwashing with water, and is a major source of contamination.After the detergent wash, the containers should then
be rinsed thoroughly in distilled or deionised water, followedby rinsing with a (1 + 1) solution of nitric acid. The acid isused to strip any metals adhering to the walls of thecontainer. Another distilled water wash should be followedby a (1 + 1) solution of hydrochloric acid. A final distilledwash is made before the container is hot-air dried.We will now consider some of the more important
analyses. The single most important analysis concernswater - there are currently more water samples analysedthan any other single type.This is a very convenient samplefor AAS because it is already liquid. Solid samples cannot,in general, be analysed directly by AAS.
(b) Water analysis : The pre-treatment phaseBefore a sample is collected, the kind of data required atthe end of the analysis must be defined. For instance, inwater analysis, is it the soluble metals or the suspendedsolids or a total analysis that is required? When analyzingsoil samples, is it the available metals that are to beanalysed or the total.Taking water analysis as an example and with soluble
metals to be measured, the following procedure is used.The water must be filtered through a 0.45µm membrane
filter as soon as possible after collection. It is normal touse the first 50 - 100 mL of sample to rinse the apparatusand discard the filtrate. The required sample volume isthen collected. Acidification with (1 + 1) nitric acid to pH2 or less is used to stabilise the metal content. Normally3 mL of (1 + 1) nitric acid per litre of sample should besufficient.If the suspended solids content is required, basically
the same initial procedure is used. The difference is thatthe filter containing the suspended solids is retained andstored in a suitable container. No preservation is needed.For a total analysis, the whole sample is acidified with
(1 + 1) nitric acid to pH 2 or less, preferably at the time ofcollection. The sample is not filtered. A relatively new technique that shows great promise
for water analysis is on-line pre-concentration. The basisof the method involves the preparation of small mini-columns containing an ion-exchange material. These aretaken to the sampling site where known volumes of thesample are drawn through the column, trapping the requiredelements. The columns are sealed and taken back to thelaboratory where the trapped metals are eluted using a
small volume of eluent. Concentration factors of 10 – 20times can be achieved, an added benefit which improvesthe ultimate detection limits attainable. Columns can bestored for several weeks before carrying out the analysis.
(c) Water analysis : Treatment and analysisFor soluble metals analysis, the filtered and acid-preservedsamples can often be analysed as received. If a precipitateforms during storage, it must be re-dissolved by addingacid and/or heating. It is normal practice to analyse samplesagainst matrix matched standards.The suspended solids held on the filter paper must be
solubilised before analysis. This is carried out in the followingmanner. Place the filter membrane in a suitable clean beakerand add 4 mL concentrated nitric acid. A cover is placedover the beaker and it is heated gently to dissolve themembrane. The temperature is raised to digest the material,continuing until the contents are reduced to low volume.After cooling, another 3 mL of concentrated nitric acid isadded and the beaker covered again. Heating is continueduntil digestion is completed and the contents are thenreduced to about 2 mL. The contents are cooled and 10 mLof (1 + 1) hydrochloric acid plus 15 mL of distilled waterare added for every 100 mL in the final sample volume.The metals are re-solubilised by heating for 15 minutes,then the contents are cooled and washed into a volumetricflask. Any remaining insoluble material is filtered off, ifnecessary, and the contents of the flask are made up tovolume.In the case of the total analysis, the preserved sample
is heated with an additional 3 mL. of concentrated nitricacid and evaporated to near dryness. It is important thatthe sample is not boiled or heated to dryness. After cooling,a further 5 mL of concentrated nitric acid is added and thesample re-heated to reflux the acid. The sample is heated,with the addition of more acid as necessary, until thedigestion is complete. From this point onwards the finishis the same as for the suspended solids.
(d) Water analysis : ResultsWater analysis is carried out and measured against a numberof criteria, which tend to be different in different parts ofthe world. There is presently no universally accepted listof limits but the most commonly used values for naturalwaters are those published by the USEPA in America.Table 3 shows the guide figures for the different types ofnatural waters and the typical detection limits which canbe obtained when using the appropriate AA technique.
ELEMENT RIVER SEA RAIN AA D.L.
As 2 3 < 0.3 0.05*
Ba 20 30 70 0.5
Cd 0.1 0.1 0.5 0.02
Cr 1 0.05 7 0.025
Cu 3 3 30 0.3
Fe 100 10 1000 0.18
Hg 0.07 0.03 0.01 0.15*
Mn 15 2 60 0.06
Ni 10 2 10 0.16
Pb 3 0.03 50 0.07
Sb 1 0.5 2 0.26*
Se 0.2 0.4 < 1 0.27*
Table 3: Natural levels of elements in natural waters. All figures are in µg/L.AA detection limits are for the graphite furnace, apart from those shownwith a * which are hydride performance figures.
The same situation largely applies for drinking waterbut Tables 1 and 2 (shown earlier) represent the figurescurrently used within Europe and the USA.Moving on to other types of environmental samples,
we will consider their main characteristics.
4) Airborne particulate analysis:There are many sources of airborne particulate, such aswaste incineration and welding activities to name but afew. Waste incineration has caused a much higher awarenessof the problems caused to the environment, on the onehand solid wastes are reduced by up to 90 % but on theother hand new waste products like dust are created.Samples are commonly collected by sucking known
volumes of air through a glass fibre or membrane filter.The volume of air used depends on the level of contaminationand the elements being measured. A high volume set-upwith a 20 - 25 cm wide filter typically has collection times(for a flow rate of 75 m3h-1) of 1 hour for contaminatedurban air and up to 12 hours for clean rural atmospheres.A number of portable, battery-powered samplers areavailable for personal monitoring at the workplace. Using25 mm glass fibre filters, a flow rate of about 2 litres/minis used. This type of sampler is also used for sampling atsites where no mains electricity is available. An alternativefor use at large installations, such as power stations orincinerator chimneys, is the cascade impactor or electrostaticfilter. Two types of sample are, therefore, generally available- particles held on a membrane filter or loose powdertaken from a cascade impactor or the like.
Where samples are mainly metals, as in welding fume,and collected using personal samplers, the usual dissolutionprocedure is to use simple acid digestion. The metals involveddefine the procedure used. For Cr, Cu, Fe, Mn, Ni, Zn,Ag, Cd, Pb, Au, B, Ba, Bi, Ca, Mg, Sr and V the filters aresimply digested in 10 mL of concentrated nitric acid. ForAl, Be, Co, Mo and Ti the filters are digested in 10 mL ofa 50:50 mixture of nitric and hydrochloric acids. Afterdigestion the samples are heated at 140 ºC to near drynessand then re-solubilised to a final volume of 10 mL with0.1 % nitric acid.
METAL EXPOSURE LIMIT AIR VOLUME(8 HOURS) MG.M3 SAMPLED (LITRES)
Al 5.0 180
B 10.0 60
Be 0.002 500
Cd 0.025 280
Cu 0.2 90
Cr 0.5 90
Fe 5.0 150
Mn 1.0 22
Ni 1.0 90
Pb 0.15 180
Ti 5.0 100
Zn 5.0 100
Table 4: List of airborne particulate exposure limits (according to 91/332/EECand 96/94/EC
Table 4 shows the current limits for exposure measuredover an 8-hour working day, together with the approximatevolume of air which needs to be sampled in order to get ameasureable signal.For samples containing a high ash content, dissolution
schemes developed for the analysis of siliceous materialsare generally used. Increasingly the use of microwavedigestion is becoming the preferred technique. By using asealed vessel and heating it in a microwave oven, it ispossible to considerably shorten the dissolution time. Thereare a number of commercially available laboratory microwavesystems which are specifically designed for use with thecorrosive chemicals used in dissolution procedures. Typicallya sample treated by the traditional pressure digestion methodrequires about 50 minutes of heating whereas the microwavetakes about 6 minutes. The USEPA has certified some ofits methods (often these become the standard methodselsewhere in the world) with microwave dissolution.The results shown below in Table 5 are for an Urban
particulate, NBS SRM1648, prepared using microwavedissolution.
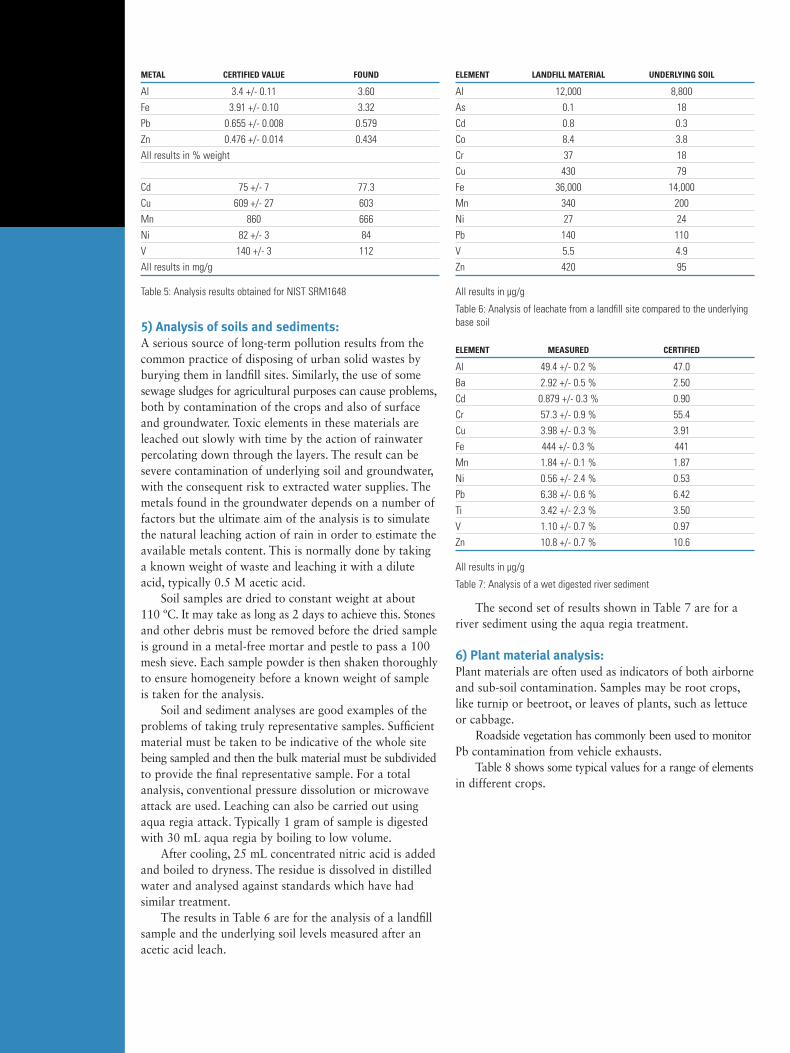
METAL CERTIFIED VALUE FOUND
Al 3.4 +/- 0.11 3.60
Fe 3.91 +/- 0.10 3.32
Pb 0.655 +/- 0.008 0.579
Zn 0.476 +/- 0.014 0.434
All results in % weight
Cd 75 +/- 7 77.3
Cu 609 +/- 27 603
Mn 860 666
Ni 82 +/- 3 84
V 140 +/- 3 112
All results in mg/g
Table 5: Analysis results obtained for NIST SRM1648
5) Analysis of soils and sediments:A serious source of long-term pollution results from thecommon practice of disposing of urban solid wastes byburying them in landfill sites. Similarly, the use of somesewage sludges for agricultural purposes can cause problems,both by contamination of the crops and also of surfaceand groundwater. Toxic elements in these materials areleached out slowly with time by the action of rainwaterpercolating down through the layers. The result can besevere contamination of underlying soil and groundwater,with the consequent risk to extracted water supplies. Themetals found in the groundwater depends on a number offactors but the ultimate aim of the analysis is to simulatethe natural leaching action of rain in order to estimate theavailable metals content. This is normally done by takinga known weight of waste and leaching it with a diluteacid, typically 0.5 M acetic acid.Soil samples are dried to constant weight at about
110 ºC. It may take as long as 2 days to achieve this. Stonesand other debris must be removed before the dried sampleis ground in a metal-free mortar and pestle to pass a 100mesh sieve. Each sample powder is then shaken thoroughlyto ensure homogeneity before a known weight of sampleis taken for the analysis.Soil and sediment analyses are good examples of the
problems of taking truly representative samples. Sufficientmaterial must be taken to be indicative of the whole sitebeing sampled and then the bulk material must be subdividedto provide the final representative sample. For a totalanalysis, conventional pressure dissolution or microwaveattack are used. Leaching can also be carried out usingaqua regia attack. Typically 1 gram of sample is digestedwith 30 mL aqua regia by boiling to low volume.After cooling, 25 mL concentrated nitric acid is added
and boiled to dryness. The residue is dissolved in distilledwater and analysed against standards which have hadsimilar treatment.The results in Table 6 are for the analysis of a landfill
sample and the underlying soil levels measured after anacetic acid leach.
ELEMENT LANDFILL MATERIAL UNDERLYING SOIL
Al 12,000 8,800
As 0.1 18
Cd 0.8 0.3
Co 8.4 3.8
Cr 37 18
Cu 430 79
Fe 36,000 14,000
Mn 340 200
Ni 27 24
Pb 140 110
V 5.5 4.9
Zn 420 95
All results in µg/g
Table 6: Analysis of leachate from a landfill site compared to the underlyingbase soil
ELEMENT MEASURED CERTIFIED
Al 49.4 +/- 0.2 % 47.0
Ba 2.92 +/- 0.5 % 2.50
Cd 0.879 +/- 0.3 % 0.90
Cr 57.3 +/- 0.9 % 55.4
Cu 3.98 +/- 0.3 % 3.91
Fe 444 +/- 0.3 % 441
Mn 1.84 +/- 0.1 % 1.87
Ni 0.56 +/- 2.4 % 0.53
Pb 6.38 +/- 0.6 % 6.42
Ti 3.42 +/- 2.3 % 3.50
V 1.10 +/- 0.7 % 0.97
Zn 10.8 +/- 0.7 % 10.6
All results in µg/g
Table 7: Analysis of a wet digested river sediment
The second set of results shown in Table 7 are for ariver sediment using the aqua regia treatment.
6) Plant material analysis:Plant materials are often used as indicators of both airborneand sub-soil contamination. Samples may be root crops,like turnip or beetroot, or leaves of plants, such as lettuceor cabbage.Roadside vegetation has commonly been used to monitor
Pb contamination from vehicle exhausts.Table 8 shows some typical values for a range of elements
in different crops.
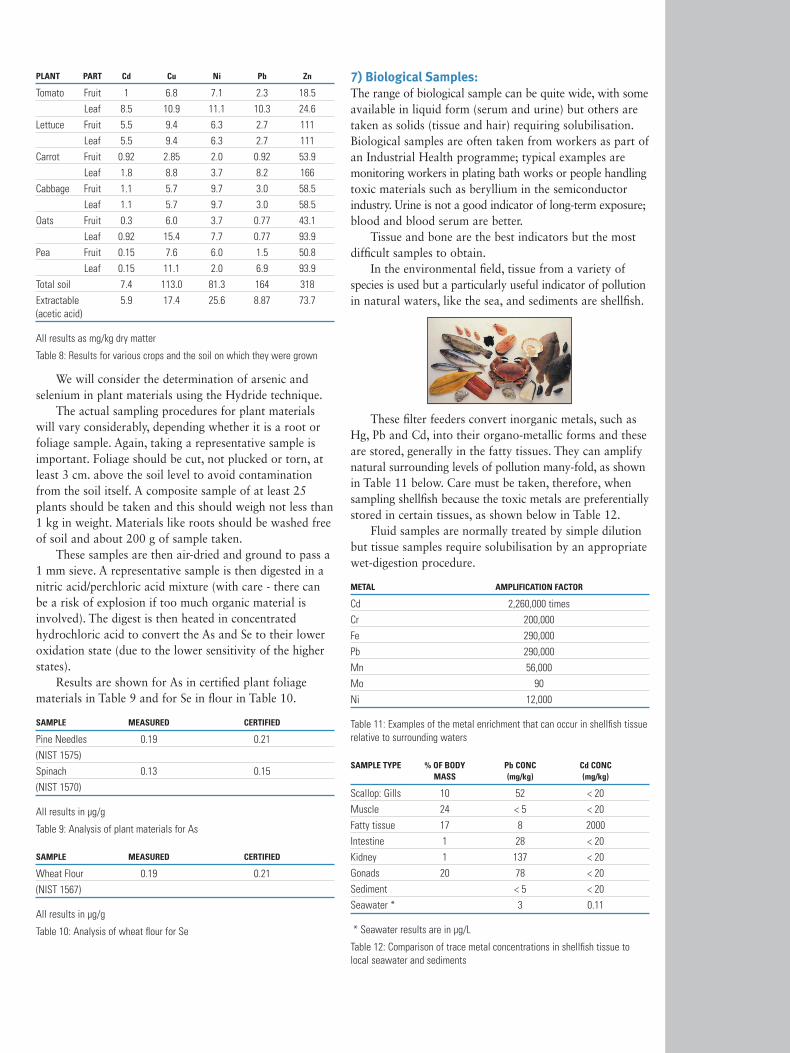
PLANT PART Cd Cu Ni Pb Zn
Tomato Fruit 1 6.8 7.1 2.3 18.5
Leaf 8.5 10.9 11.1 10.3 24.6
Lettuce Fruit 5.5 9.4 6.3 2.7 111
Leaf 5.5 9.4 6.3 2.7 111
Carrot Fruit 0.92 2.85 2.0 0.92 53.9
Leaf 1.8 8.8 3.7 8.2 166
Cabbage Fruit 1.1 5.7 9.7 3.0 58.5
Leaf 1.1 5.7 9.7 3.0 58.5
Oats Fruit 0.3 6.0 3.7 0.77 43.1
Leaf 0.92 15.4 7.7 0.77 93.9
Pea Fruit 0.15 7.6 6.0 1.5 50.8
Leaf 0.15 11.1 2.0 6.9 93.9
Total soil 7.4 113.0 81.3 164 318
Extractable 5.9 17.4 25.6 8.87 73.7(acetic acid)
All results as mg/kg dry matter
Table 8: Results for various crops and the soil on which they were grown
We will consider the determination of arsenic andselenium in plant materials using the Hydride technique.The actual sampling procedures for plant materials
will vary considerably, depending whether it is a root orfoliage sample. Again, taking a representative sample isimportant. Foliage should be cut, not plucked or torn, atleast 3 cm. above the soil level to avoid contaminationfrom the soil itself. A composite sample of at least 25plants should be taken and this should weigh not less than1 kg in weight. Materials like roots should be washed freeof soil and about 200 g of sample taken.These samples are then air-dried and ground to pass a
1 mm sieve. A representative sample is then digested in anitric acid/perchloric acid mixture (with care - there canbe a risk of explosion if too much organic material isinvolved). The digest is then heated in concentratedhydrochloric acid to convert the As and Se to their loweroxidation state (due to the lower sensitivity of the higherstates).Results are shown for As in certified plant foliage
materials in Table 9 and for Se in flour in Table 10.
SAMPLE MEASURED CERTIFIED
Pine Needles 0.19 0.21
(NIST 1575)
Spinach 0.13 0.15
(NIST 1570)
All results in µg/g
Table 9: Analysis of plant materials for As
SAMPLE MEASURED CERTIFIED
Wheat Flour 0.19 0.21
(NIST 1567)
All results in µg/g
Table 10: Analysis of wheat flour for Se
7) Biological Samples:The range of biological sample can be quite wide, with someavailable in liquid form (serum and urine) but others aretaken as solids (tissue and hair) requiring solubilisation.Biological samples are often taken from workers as part ofan Industrial Health programme; typical examples aremonitoring workers in plating bath works or people handlingtoxic materials such as beryllium in the semiconductorindustry. Urine is not a good indicator of long-term exposure;blood and blood serum are better.Tissue and bone are the best indicators but the most
difficult samples to obtain.In the environmental field, tissue from a variety of
species is used but a particularly useful indicator of pollutionin natural waters, like the sea, and sediments are shellfish.
These filter feeders convert inorganic metals, such asHg, Pb and Cd, into their organo-metallic forms and theseare stored, generally in the fatty tissues. They can amplifynatural surrounding levels of pollution many-fold, as shownin Table 11 below. Care must be taken, therefore, whensampling shellfish because the toxic metals are preferentiallystored in certain tissues, as shown below in Table 12.Fluid samples are normally treated by simple dilution
but tissue samples require solubilisation by an appropriatewet-digestion procedure.
METAL AMPLIFICATION FACTOR
Cd 2,260,000 times
Cr 200,000
Fe 290,000
Pb 290,000
Mn 56,000
Mo 90
Ni 12,000
Table 11: Examples of the metal enrichment that can occur in shellfish tissuerelative to surrounding waters
SAMPLE TYPE % OF BODY Pb CONC Cd CONCMASS (mg/kg) (mg/kg)
Scallop: Gills 10 52 < 20
Muscle 24 < 5 < 20
Fatty tissue 17 8 2000
Intestine 1 28 < 20
Kidney 1 137 < 20
Gonads 20 78 < 20
Sediment < 5 < 20
Seawater * 3 0.11
* Seawater results are in µg/L
Table 12: Comparison of trace metal concentrations in shellfish tissue tolocal seawater and sediments
The method of sample treatment described in this publication should be performed onlyby a competent chemist or technician trained in the use of safe techniques in analyticalchemistry. Users should acquaint themselves with particular hazards which may beincurred when toxic materials are being analysed and handled in the instruments, and theinstrument must be used in accordance with the operating and safety instructions givenin the Operators manual.
The exact model of instrument on which this analysis was performed may differ from thatstated. Although the contents have been checked and tested, this document is suppliedfor guidance on the strict understanding that neither Thermo Fisher Scientific, nor anyother person, firm, or company shall be responsible for the accuracy or reliability of thecontents thereof, nor shall they be liable for any loss or damage to property or any injuryto persons whatsoever arising out of the use or application of this method.
AN40689-EN 0416C
Part of Thermo Fisher Scientific
9) Conclusions:At the present time, AAS has a leading role in environmentalanalysis because of its sensitivity for a large selection ofelements typically determined by environmentalists. Graphitefurnace-AAS continues to be the preferred technique forppb level determinations of the heavy, toxic metals like Pband Cd. In addition, hydride techniques provide excellentperformance for the semimetals like As, Se and Sb. Finally,a range of specific accessories provide detection limits forHg down to the ppt level.The Thermo Scientific iCE 3000 Series has the capability
of providing a turn-key solution to many of the analyticalproblems in this applications field. Its unique combinationof Zeeman correction graphite furnace and vapour analysiswith electrically heated atomisation cell, all in a very compactdual atomisation spectrometer, can satisfy the requirementsof many laboratories in the most cost-effective way.