Embed Size (px)
Citation preview

____________________________________________________________________________________________
*Corresponding author: E-mail: [email protected];
British Journal of Applied Science & Technology4(8): 1171-1197, 2014
SCIENCEDOMAIN internationalwww.sciencedomain.org
The Analysis of Coal Mining Impacts on WestVirginia’s Environment
C. Edmund Merem1*, Peter Isokpehi1, Joan Wesley1,Emmanuel Nwagboso2, Chandra Richardson1, Siddig Fageir1,
Samu Iwehabura1 and Marshand Crisler1
1Department of Urban and Regional Planning, Jackson State University, 3825 Ridgewood,Jackson MS, 39211, USA.
2Departmentof Political Science, Jackson State University, 1400 Lynch, Jackson MS, 39217,USA.
Authors’ contributions
This work was carried out in collaboration between all authors. Author CEM designed thestudy, performed the statistical analysis, wrote the protocol and wrote the first draft of the
manuscript. Authors PI, JW and EN managed the analyses of the study. Authors CR and SFmanaged the literature searches. Authors SI and MC assisted with library searches. All
authors read and approved the final manuscript.
Received 23rd September 2013Accepted 3rd January 2014
Published 15th January 2014
ABSTRACT
Aims: The paper analyzes the impacts of coal mining activities on West Virginia’senvironment using GIS.Study Design: Adopted a mixscale appoach.Methodology: The aproach is applied to GIS and primary data connected to descriptivestatistics by analyzing the impacts of mining with data collected at the state, county andwatershed level.Place and Duration of Study: The coal producing counties of West Virginia May 2010-December 2012.Results: The study shows changes in coal production, and widespread degradationresulting in land loss and open space, impacts on mountain ecosystem and water qualitydecline in the head waters and human casualities.The spatial analysis revealed thedispersion of mining activities onto senstive environments comprising of streams andmountain ecosystems.
Original Research Article

British Journal of Applied Science & Technology, 4(8): 1171-1197, 2014
1172
Conclusions: The assessment of these trends and the capability of GIS in pinpointingthem enhanced our research and understanding of ecosystem vulnerability in the face ofrecurrent degradation induced by mining. GIS also provided a framework for assessingecosystem decline. To remedy the problems, the paper offered suggestions ranging fromcorporate code of ethics to improved data infrastructure and more use of GIS inenvironmental decision making.
Keywords: West virginia; coal mining impacts; environmental degradation; GIS; factors;mountain top clearance.
ABBREVIATIONS
WVMHST: West Virginia office of Mines’ Health, Safety and Training.NASA: National Aeronautics and Space Administration.SMCRA: Surface Mining Control and Reclamation Act of 1997.EPA: Environmental Protection Agency.US: United States.GIS: Geographic Information Systems.MTR: Mountain Top Removal.Geospatial Analysis: A comprehensive guide to principles, tools and techniques, including thefull spectrum of spatial analysis techniques and GIS software.Spatial Analysis: A study in depth of the patterns, lines, areas, and surfaces depicted on mapsof some sort.
1. INTRODUCTION
1.1 Background
For over a century, coal stood as the major resource driiving the economy of West Virginia [1].In the process coal mining generated jobs and a large part of the state’s revenue [2,3]. Beinga center piece of West Virginia’s economy, in the 2010 fiscal year alone, the coal industrypayed about $1.6 billion in salaries [4]. With its history, mining operations in the stateaccounted for the production of approximately13.4 billion tons of coal between 1880 to 2009.However, coal deposit in the state is now in constant decline with reccurent ecosystemdegradation [4,5,6].These impacts on the ecosystem must be analyzed with GIS.
With 2,636 mountain top removal (MTR) permits distributed in the state between 1986 to2001[7]. MTR and other types of mining built on machines and explosives continue todemolish mountainsides and the environment [8]. In 2007 alone in West Virginia, theyaccounted for 42 percent of all coal extracted. With much of the mining activities occurringadjacent to sensitive habitats for rare species, ecological externalities from mining degradewater quality and the surrounding ecosystem. Given the continual destruction of biodiversityrich Appalachian mountain peaks in the state by explosives and giant machines used by theindustry. State officials in 2009 reported more than 16,000 safety violations that impacted theenvironment [6]. Consequently, West Virginia has about 4,391 abandoned mines with 1,180 ofthem linked with water degradation [2].
Notwithstanding the gravity of the issue, very little has been done to track the problems withGeographic Information Systems (GIS) in West Virginia. However,GIS has found widespread

British Journal of Applied Science & Technology, 4(8): 1171-1197, 2014
1173
appeal in other studies on watershed degradation and landscape change over the years[9,10,11,12,13,14,15,16,17,18,19,20,21,22,23]. Similar studies along those lines by Bisaws[24], Prakash [25], Usery [26] and Khawlie [27] reinforce the essence of these themes.Seeingthe benefits in the analysis of water quality issues, managers are using GIS to monitor variousland uses in a watershed [28]. In realizing these benefits, scholars are channelling their GISdata management expertise towards the calibration of watershed and water quality models[26].
Many studies exist in the literature with focus on watershed protection using GIS. Inimplementing a framework for modelling the impact of land use practices on groundwater inwatersheds, Almasri and Kaluarachichi used GIS to identify spatial dispersion of groundnitrogen sources and the resultant loadings [29]. Russell examined the role of GIS in selectingsites for riparian restoration based on hydrology and land use [30]. Elsewhere Liu developed aGIS interface that integrates soil and water assessment tool for estimating water qualitybenefits in watersheds [31]. Philippe combined cartographic modelling tool using GIS andstatistics to measure the links between water quality, land use, and distance from stream on awatershed [32]. Furthermore, Davis focused on water issues and GIS analysis of land usecomposition in catchment areas [33]. Despite this array of studies, there is very little on theecological impact analysis of coal mining in West Virginia using GIS.
With this void in the litterature, mining operations remain active in various areas of the statewith growing threats that could be pinpointed for effective management using GIS (Fig. 1).This has generated concerns on the impacts of mining from the coal field sites of WestVirginia. The effects ranged from non-point sources of pollution, impairment of stream andwatershed quality, land loss and environmental health threats [34,35,36,37,38]. The problemsof mining hazards do not operate in a vacuum; they emanate from many socio-economicelements. In light of current impacts of mining, this paper will fill that void inresearch.Accordingly, this paper analyzes the impacts of coal mining activities on WestVirginia’s environment using GIS. The emphasis is on the issues, factors fuelling theproblems, environmental analysis, mitigation efforts and future actions. The paper has twoobjectives. The first aim focuses on the use of spatial technology in analyzing the effects ofcoal mining activities on the environemnt, while the second objective is to generate a tool forenvironmental management researchand decision making.The sections in the paper consistof the introduction, the materials and methods, the results, discussions and the conclusion.
Fig. 1. The Study Area

British Journal of Applied Science & Technology, 4(8): 1171-1197, 2014
1174
2. MATERIALS AND METHODS
2.1The Study Area
West Virginia is located in the Applachian region of southern US with over 55 counties as wellas many watersheds and wetlands Figs. 1-5. The state had a population of 1.8 million in 2009and boosts of immense sceneries of sparkling water, fresh air and opulent green mountainsand streams. West Virginia's northern panhandle contains the most diverse temperatehardwood forest. The hillsides provide habitats to many species in the southern Appalachianthan any other area [35] but, biodiversity is being threatened by the impacts of coal miningFig. 2 [38,39]. Being one of the major resources in West Virginia's economy [2,3] coal occursin 53 of West Virginia’s 55 counties [6]. The economic benefits of the industry stems from taxrevenue generation which stood at $684 million or 10 percent of the total in 2008 [4]. For moreon the economic benefits of coal in the state, see Table 1.
Fig. 2. Image of Moutaintop Removal Mining.Source: SOCM.org, 2013
Fig. 3. Watersheds of West Virginia. Source: West Virginia GIS technical Center, 2009

British Journal of Applied Science & Technology, 4(8): 1171-1197, 2014
1175
In the last decades, mining safety and ecological concerns have emerged among thechallenges facing the state. The environmental impacts of coal production has become sopronounced that there are now large presence of heavy metals in surface and ground wateras well as watersheds adjacent to mining fields Fig. 3 [34]. To understand the impacts ofmining on water bodies in West Virginia, let us not forget the presence of mining sites close tostreams and the vulnerability of wetlands. From the geographic distribution of the mine sites inFig. 4. It is evident they are visible in the northern and southern part of the state. Theirpresence alongside sensitive water bodies imply risks to stream ecology than the areas wheremining activities are less diffused.
Table 1. The Economic Importance of Coal in West Virginia in 2008
Economic Impact of Coal Mining NAICIS 2121 In The West Virginia Economy 2008.(2008 Dollars)Variables Direct Indirect and Induced TotalBest Volume sales,Billions $
$7.45 $12,30 $19.78
Total Value Addedbillions $
$4.06 $1.87 $5.93
Employee Compensation $1.95 $0.87 $2.82Employment jobs 20,500 25,600 46,000
Source: The Bureau of Business and Economics Research, 2010. West Virginia University
Fig. 4. The Locations of West Virginia’s Mining Sites. Source: EPA 2009
Notwithstanding their sensitivity to degradation, wetlands locations as shown in Fig. 5. areessentail in the life of most communities.Over the years in West Virginia, these ecologicalfeatures are being degraded regularly due to the by-products of mining including heavy metalsand others. With very little understanding of the gravity of accumulated impacts, GIS anlysisprovides a tool for understanding the spatial patterns of mining impacts on fragile waterbodiesincluding watersheds and the environment.

British Journal of Applied Science & Technology, 4(8): 1171-1197, 2014
1176
Fig. 5. Wetlands of West Virginia. Source: West Virginia GIS technical Center, 2009
2.2 Methodology
The paper uses a mix scale approach involving descriptive statistics and primary dataconnected to GIS. The spatial information for the research was obtained from the WestVirginia On line Technical Data, the National Aeronautic and Space Administration (NASA),West Virginia GIS Clearing House, The Governemnt of West Virginia, the West VirginiaDepartment of Natural Resources office and the EPA. The West Virgina office of Mines’Health, Safety and Training (WVMHST) provided coal data for the periods of 1996-2010.Federal geographic identifier codes for the counties were used to geo-code the informationcontained in the data sets. This information was analyzed with basic descriptive statistics, andGIS, with particular attention to the temporal-spatial trends at the county and watershed level.The relevant procedures consist of two stages.
2.2.1 Stage 1: Identification of variables, data gathering and study design
The first step involves the identification of variables needed to assess degradation in areasadjacent to coal mines. The variables consist of number of mining sites, number ofwatersheds, impaired water bodies, cathegories of pollutants like biological elements, pH,metals, and percentages of pollutants. Others are coal shipment and consumption, land,acres of MTR, species richness, degraded habitats and deaths from mining. Additionally,access to databases that are available within the Federal and state archives in West Virginiaand other agancies quickened the search process see Tables 1-4. The process continuedwith the design of data matrices for socio-economic and land use (environmental) variablescovering the periods from 1980, 1996 to 2010, 1950 and 1976, 1969 and 2009 to 2012. Thedesign of spatial data for the GIS analysis required the delineation of county and watershedboundary lines and species habitats. With boundary lines unchanged, a common geographicidentifier code was assigned to each of the units to ensure analytical coherency.

British Journal of Applied Science & Technology, 4(8): 1171-1197, 2014
1177
2.2.2 Stage 2: Step 2: data analysis and gis mapping
In the second stage, descriptive statistics and spatial analysis were employed to transform theoriginal socio-economic and land-use data into relative measures (percentages/ratios). Thisprocess generated the parameters for establishing degradation and change on the landscapein areas devoted to mining. This was facilitated by measurements and comparisons of thetrends over time. While this approach allows for change detection, the tables highlightstressors, indicators of degradation, coal use and deaths. The remaining steps involve spatialanalysis and output (maps-tables-text) covering the study period, using ARCVIEW 9. Thespatial units of analysis consist of coal mining counties of the state and their watersheds. Thegeographic data for West Virginia which covered its watersheds and counties, also includespollution and ecological data of land cover files of wetlands, watersheds, paper and digitalmaps from 1996-2004 as well as NASA Satelite images of 1984 to 2012. These Sateliteimages are only for an abbreviated analysis and illustration of change in Hobet 21 mines.There is no attempt here to describe the processing of the photo images. The outputs of thespatial data were mapped and compared to see the dispersion of stressors and the socio-economic factors fuelling environmental degradation.
3. RESULTS AND DISCUSSIONS
This section presents the results and discussions. There is an initial focus on the analysis ofcoal use, land use impacts, percentage of change and pollution analysis. This is followed bythe human hazards of mining, factors, efforts and spatial analysis.
3.1 Results
3.2.1 Coal use 1996 to 2010
The temporal profile of coal use based on total tonnage, total shipments, local consumptionand the rates of declines over the years is provided herein. In looking at the table, one noticesthat all three cathegories from total tonnage to used tonnage declined in West Virgina from1996 to 2010. During that period, the state saw its quantity of coal production, the amountdistributed and the tonnages consumed change from 174, 008, 217 to 172, 762, 769 and 356,852 to 158, 835, 504, 147, 719, 307 and 342, 1054. This represents a change of 75%, 87%,to 54% repectively. From the period of 2008, note that the production of coal dropped from1996 levelts to 162, 750, 817 Table 2.
Another important point worthy of note in 2010 touches on the reccurent drops in coalproduction, the amount distributed and those consumed internally in West Virginia. During the2010 period, the declines in the tonnages of coal produced, distributed and cosumed wentfrom 142, 944, 106, 122, 880, 676 to 886, 867 tons. Notwitstanding the fact that the state’sproduction levels and export totals of 180, 794, 012 to 169, 918, 795 in 1998 exceeded theother years, the people of West Virginia only used 22, 460 tons of coal, the lowest in theentire periods. While this is lower than the 2002 period when local use reached its highestlevel of 12, 503, 110 tones, coal demand in West Virginia fluctuated regularly Table 2.
British Journal of Applied Science & Technology, 4(8): 1171-1197, 2014
1178
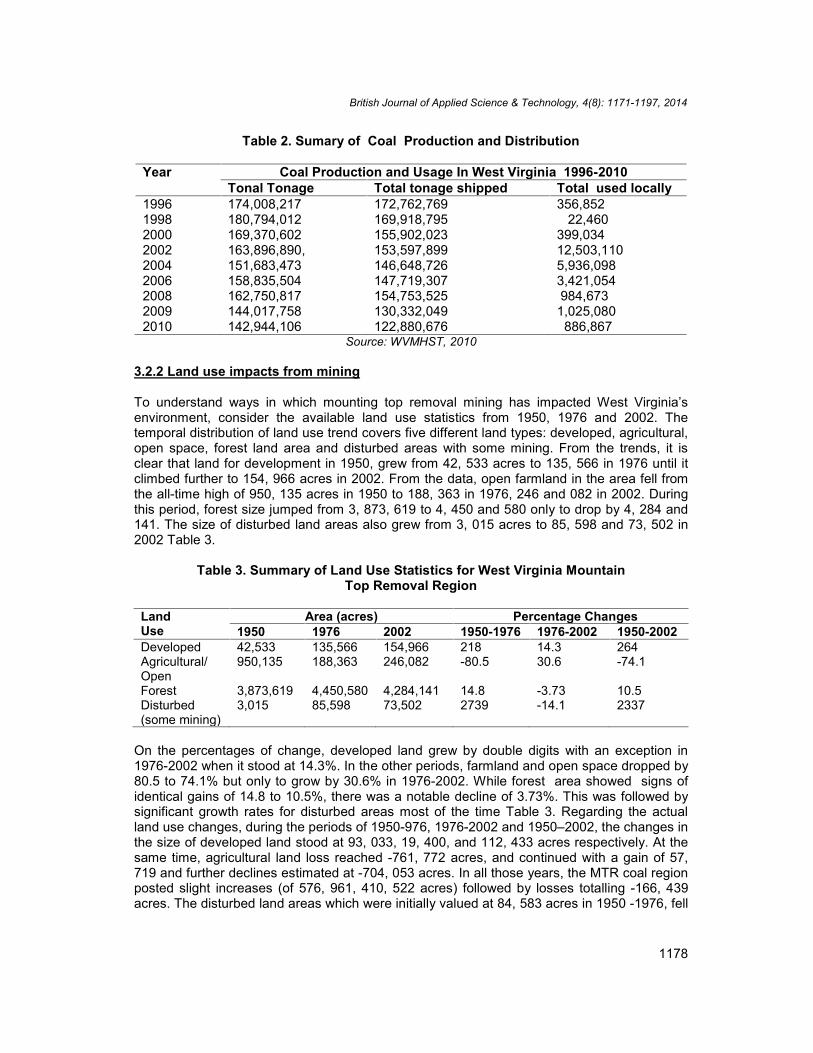
Table 2. Sumary of Coal Production and Distribution
Year Coal Production and Usage In West Virginia 1996-2010Tonal Tonage Total tonage shipped Total used locally
1996 174,008,217 172,762,769 356,8521998 180,794,012 169,918,795 22,4602000 169,370,602 155,902,023 399,0342002 163,896,890, 153,597,899 12,503,1102004 151,683,473 146,648,726 5,936,0982006 158,835,504 147,719,307 3,421,0542008 162,750,817 154,753,525 984,6732009 144,017,758 130,332,049 1,025,0802010 142,944,106 122,880,676 886,867
Source: WVMHST, 2010
3.2.2 Land use impacts from mining
To understand ways in which mounting top removal mining has impacted West Virginia’senvironment, consider the available land use statistics from 1950, 1976 and 2002. Thetemporal distribution of land use trend covers five different land types: developed, agricultural,open space, forest land area and disturbed areas with some mining. From the trends, it isclear that land for development in 1950, grew from 42, 533 acres to 135, 566 in 1976 until itclimbed further to 154, 966 acres in 2002. From the data, open farmland in the area fell fromthe all-time high of 950, 135 acres in 1950 to 188, 363 in 1976, 246 and 082 in 2002. Duringthis period, forest size jumped from 3, 873, 619 to 4, 450 and 580 only to drop by 4, 284 and141. The size of disturbed land areas also grew from 3, 015 acres to 85, 598 and 73, 502 in2002 Table 3.
Table 3. Summary of Land Use Statistics for West Virginia MountainTop Removal Region
LandUse
Area (acres) Percentage Changes1950 1976 2002 1950-1976 1976-2002 1950-2002
Developed 42,533 135,566 154,966 218 14.3 264Agricultural/Open
950,135 188,363 246,082 -80.5 30.6 -74.1
Forest 3,873,619 4,450,580 4,284,141 14.8 -3.73 10.5Disturbed(some mining)
3,015 85,598 73,502 2739 -14.1 2337
On the percentages of change, developed land grew by double digits with an exception in1976-2002 when it stood at 14.3%. In the other periods, farmland and open space dropped by80.5 to 74.1% but only to grow by 30.6% in 1976-2002. While forest area showed signs ofidentical gains of 14.8 to 10.5%, there was a notable decline of 3.73%. This was followed bysignificant growth rates for disturbed areas most of the time Table 3. Regarding the actualland use changes, during the periods of 1950-976, 1976-2002 and 1950–2002, the changes inthe size of developed land stood at 93, 033, 19, 400, and 112, 433 acres respectively. At thesame time, agricultural land loss reached -761, 772 acres, and continued with a gain of 57,719 and further declines estimated at -704, 053 acres. In all those years, the MTR coal regionposted slight increases (of 576, 961, 410, 522 acres) followed by losses totalling -166, 439acres. The disturbed land areas which were initially valued at 84, 583 acres in 1950 -1976, fell

British Journal of Applied Science & Technology, 4(8): 1171-1197, 2014
1179
to -12, 096 in 1976 –2002. Between 1950 to 2002, the size of disturbed land areas climbed to70,487 acres Table 4.
Table 4. The Land Use Changes In West Virginia
Land Use Changes Area (acres)1950-1976 1976- 2002 1950-2002
Developed 93,033 19,400 112,433Agricultural Open -761,772 57,719 -704,053Forest 576,961 -166,439 410,522Disturbed (some mining) 82,583 -12,096 70,487
3.2.3 Mountain top removal mining and impacts
The impact of MTR among the four coal producing states in the Appalachian region addsanother dimension to the analysis herein. The table containing three ecological indicators ofsize, number of mountains impacted and the percentages shows a troubling trend on thehealth of mountain top ecosystem and the threats to biodiversity found in the area. The totalsize of disturbed areas based on the table indicates Kentucky and West Virginia had 574,000to 352,000 acres. The fact that these numbers surpassed the 156,000 to 78,000 acres clearedin Virginia and Tennessee shows the first two states as the most active places in MTRpractice in the region. In the context of the study area, the entire region alone lost 1,160,000acres covering about 501 mountains Table 5. Of the overall acres of mountain tops removed,the states of West Virginia and Kentucky accounted for almost 80% percent combinedcompared to 20% for both Tennessee and Virginia. The interesting point is that West Virginiaranked second in every statistical category of MTR practices in the region.
Table 5. The Distribution of Mountain Top Removal Acreage
Mountaintop removal mining impact study results by stateRank State Size Number of
Mountains ImpactedThe Percentages
1 Kentucky 574,000 acres 293 mountains 49.512 West Virginia 352,000 acres 135 mountains 30.343 Virginia 156,000 acres 67 mountains 13.444 Tennessee 78,000 acres 6 mountains 6.72
Total 1,160,000 acres 501 mountains 100.00Source: Appalachian Voices. 2012 c
Considering the risks to adjoining ecosystems, there are problems with air pollution resultingfrom the airborne movement of dusts, exposure to radioactive contaminants and geologicalresidues. Other threats come from the damage to natural areas providing the life supportsystem essential for the survival of different species. The vast clearance of mountain tophabitats and forests also trigger biodiversity loss and the disppearance of rare species of floraand fauna. It has been estimated that since 2003, about 1.2 million hectares of land were lostto MTR [36]. In fact in May 2009, Mingo county and communities adjacent to south WestVirginia coal mines witnessed one of the most deadliest floods.In the absence of trees inthese circumstances to hold water and to act as a barrier, flash flooding in the adjoiningcommunities becomes very life threatening [35]. With MTR mining waste known to holdchemical compounds usually found in coal and rock. Runoffs containing heavy metals such aslead, aluminum, chromium, manganese, selenium and inpure water from the slurry pools thatwound up downstream, inflict further damage by polluting aquatic environments. This is

British Journal of Applied Science & Technology, 4(8): 1171-1197, 2014
1180
compunded by the presence of abandoned mines and fragile impoundments containing toxicresidues on MTR sites.
3.2.4 The pollution impacts on the watersheds
To understand pollution among the watersheds, one must consider the totals, the number ofmining sites, the main pollutants and the number of impaired streams over time from 1996-2004. The most common types of pollutants in the area consists of biological, pH and metalsTable 6. Their presence as indicated in the table are in the order of 9 for biological pollutants,7 for pH and 4 for metals. Seeing that the total number of mining sites from which thepollutants originate stood at 65 during the periods of 1996, 1998, 2002 and 2004. The casesof impaired streams rose from the initial value of 1586, in 1996 to 2676 in 1998. Between2002 to 2004, the numbers jumped further to 5389 and 4924 Table 6. The breakdown of thetrends point to the presence of biological pollutants along the upper Monogahele watershed.Being the area with major mining sites estimated at 13, Monogahele saw its number ofimpaired streams from biological pollutants which stood at 56 in 1996 grow to 128 in 1998,and 182 in 2002 to 2004. At the same time, metals remained quite rampant in four otherwatersheds (the Upper Kanwaha, Coal, Upper Guyandatte and Twelvepole). The estimatednumber of mining sites in these watersheds were in the order of 7, 11, 1 and 7 respectively.Along the Upper Kanwaha watershed, the number of impaired streams between 1996 to1998 grew from 250 to 319 and continued in the next periods. At Coal watershed, the numberof impaired streams with metals remained high Table 6. See Appendix A for more onwatershed impairments.
Table 6. Environnmetal Pollution of Watersheds From Mining
Watershed MiningsitesNumber
Pollutanat Impairedstreams2004
Impairedstreams2002
Impairedstreams1998
Impairedstreams1996
Conocochegue 1 Biological 226 226 30 0Northbranch 2 Biological 109 115 98 53South branch 1 pH 191 191 128 27LowerMonogahele 2 Biological 146 146 37 36UpperMonogahele 13 Biological 182 182 128 56West fork 2 pH 333 375 284 258Upper ohio-wheeling 2 pH 287 287 112 37Little Musringummiddle island 1 Biological 118 118 16 14Little Kanawha 1 pH 303 308 235 66Upper Ohio-shade 2 pH 287 287 112 37Elk 3 Biological 358 383 199 96Gauley 4 pH 162 200 141 112Upper Kanawha 7 Metals 402 417 319 250Coal 11 Metals 671 729 133 80Twelve pole 1 Metals 67 77 19 10Tug 3 Biological 222 307 184 148Upper Guyandatte 7 Metals 286 427 328 242Middle New 1 Biological 292 310 38 29Lower new 1 pH 228 228 94 28Lower Kanawha 1 pH 67 89 65 33

British Journal of Applied Science & Technology, 4(8): 1171-1197, 2014
1181
3.2.5 Pollution analysis
Another dimension to the analysis is that of the 21 watersheds in the study area, metallicelements from 26 mining sites are discharged into adjacent stream habitats (Table 7). Asmentioned before, such practices have far reaching consequences on the surroundingecosystem. From the table, these numbers represent about 40% of all mining activities in thedesignated watersheds in the area. In terms of the percentage distribution of streamimpairment, the four watersheds where metallic effluents are rampant accounted for 36.69%to 29.85% of impairment cases between 1996 to 1998. In other years, the percentage ofimpaired streams attributed to metals went from 30.61% in 2002 to 28.96% in 2004. Of all thewatersheds Coal, Upper Kanwaha, and Upper Guyandatte emerged as the hotbeds of streampollutions attributed to coal mining than the Twelve pole watershed. Their levels of toxicity arehigh enough to damage stream quality and habitats for marine organisms. With suchfrequency of pollution, iron and manganese concentration in water exceeded drinking waterstandards in 40% of wells in the Appalachian plateua and in 70% of wells adjacent toreclaimed surface mines [36]).The same can be said of nearby downstream waters whereconductivity levels remained high due to cases of hardness and selenium presence as well.
Table 7. Comparative Pollution Aanalysis Metal Vs Other Pollutants
Watershed Sites Pollutant Impairedstream2004
Impairedstream2002
Impairestream1998
Impairedstream1996
Upper Kanawha 7 Metals 402 417 319 250Coal 11 Metals 671 729 133 80Twelve pole 1 Metals 67 77 19 10UpperGuyandatte 7 Metals 286 427 328 242Total 26 Metal
pollutants1426 1650 799 582
Overall Total 65 All pollutants 4924 5389 2676 1536Total % 40 NA 28.96 30.61 29.85 36.69
3.2.6 The human hazzards of mining 1980-2010
The human costs of mining is a recurrent trend in West Virgina. This can be buttresed fromthe data on Table 8. Since the 1980s, West Virginia’s coal producing counties haveexperinced reccurent hazards attributed to mining. This has resulted in the death of about 61people in different locations of the state. Being incidents originating from coal producingcompanies, they involve gas explosions and other hazards leading to loss of lives. Aside fromthe single digit number of fatalities during the 1980s to the early 2000s, the state experienceddouble digit casualties numbering 12 to 29 deaths between January the 2nd in 2006 to Aprilthe 5th of 2010. No matter the size of these accidents, they impacted the natural and builtenvironment through the emission of toxic chemicals and the loss of lives.

British Journal of Applied Science & Technology, 4(8): 1171-1197, 2014
1182
Table 8. The Hazzards From Mining In West Virginia 1980-2010
Date Company Mine Location Nature ofAccident
Nube ofVictims
Nov.07, 1980
Westmoreland CoalCo.
Ferrell Uneeda Gas Explosion 5
Dec 03,1981
Elk River Sewell Sill House No. 1 Bergoo Roof Fall 3
Feb 06,1986
Consolidation Co Love ridge No. 22 Fairview Coal storageentrapment .
5
Mar 19,1992
Consolidation Co Blacksville No. 1 Wana Explosion inShaft
4
Jan 22,2003
Central CambriaDrillling
Mcelroy Mine Graysville Explosion inShaft
3
Jan 2,2006
Anker WV MinningCO
Sago Mine Tallmansville Explosion andEntrapment
12
Apr 5,2010
Performance UbbmcMontcoalEagle
Noama Explosion 29
Total Mining Accidents from Various Locations In West Virginia 61Source: WVOMHST, 2010
3.3 Factors Influencing Degradation
The incidence of degradation from mining and the threats to watersheds do not operate in avacuum. They emanate from socio-economic elements. This section identifies the factorsfuelling degradation (See Appendix B). Notwithstanding the problems of degradation from coalmining in West Virginia, there are concerted efforts to minimize the impacts. Several initiativesranging from the mobilization of environmental groups to land reclamation efforts aredescribed briefly in Appendix C. For more on the factors and the efforts see sub sections 3.3-3.4 in Appendix B and C.
3.4 The Spatial Analysis
Aside from scatterd patches of impaired areas vissible from the northern to southern part ofthe state in 1996. The emergence of a broader thread of impaired streams at a muchvisiblescale compared to the north east and north west areas of the map raffirms currentconcerns. The spatial dispersion as shown in the map stretcthed through West Folk andTygart Valley. Further along the lower and south central parts, one notices a gradualconcentration of impaired streams on Upper Guyandatte and Upper Kanawha. Consideringthat the levels of impairment from mining are toxic enough to degrade water quality,watersheds in those areas are pushed beyond their carrying capacity Fig. 6. Knowing thenature of runoffs from their sources and the pace at which coal related pollution occur in themining counties of West Virginia, the study area experienced a slight dispersion of impairedstreams in 1998.

British Journal of Applied Science & Technology, 4(8): 1171-1197, 2014
1183
Fig. 6. Impaired Streams In West Virginia In 1996. Source: EPA 2009
With stream impairment apparent in areas where they were known to occur in the previousperiod of 1996, it is clear, degradation continued into areas where they did not occurpreviously. As a new entrant, Little Kanawha saw its share of impairment stretched deeperinto the adjacent boundaries. The same can be said of Upper Kanawha and the northernareas including Upper Ohio, Upper Wheeling and Shenandoah where the head waters andstreams experienced degradation from coal mining Fig. 7.
Fig. 7. Impaired Streams In West Virginia In 1998. Source: EPA 2009
As we move towards the 2002 period, there began to emerge a slightly different kind ofpattern in the geographic diffusion of stream impairment linked to coal mining activities Fig. 8.The frequency of these patterns, did have profound effects on stream quality in the affectedareas. From the 2002 map, there are four major clusters of streams with notable cases ofimpairment from mining. The waterbodies in question are in the high section of Upper Ohio,the North East Shenandoah and the adjoining streams and watersheds. Others in thatcathegory include the upper north central streams of West Fork, Little Kanawha and the

British Journal of Applied Science & Technology, 4(8): 1171-1197, 2014
1184
Upper Ohio Shade and Elk. Stepping onto the deep southern part of the map, note thegradual manifestion of hightened impairment in lower Guyandotte, Coal, and Tug, Greenbrie,Middle new, and the Twelvepole streams. The presence of impairment cases in the studyarea occurred at levels much higher than the 1996 period Fig. 8.
Fig. 8. Impaired Streams In West Virginia’s In 2002. Source: EPA 2009
The details in Fig. 9 outlines the spatial dispersion of impaired streams in West Virginia.Despite some convergence in the patterns of degraded streams in 2002 and 2004, there areslight differences in the dispersion of impaired streams’locations in the study area. The minordivergence in patterns is evident in the lower south and central part of the map along Tug andTygot valley. With impaired streams seemingly visible on many spots in a way similar to theprevious period of 2002, a common trend in 2004 stems from the gradual disappreance ofdegradation in the two areas under a different pattern from the previous year. With thepresence of impaired streams in space in 2004, let us not forget that most run-offs frommining sites empty into fragile streams and watersheds of the state Fig. 9
Fig. 9. Impaired Streams In West Virginia In 2004, Source: EPA 2009
From the maps, there seem to be a large scale stream impairment along the surroundingecology of fragile watersheds adjacent to mining sites in the state between 1996 to 2004.Comparing the 1996 and 1998 maps, one notices slight diffusion of impairment into adjoining

British Journal of Applied Science & Technology, 4(8): 1171-1197, 2014
1185
water systems in a manner not seen in the ensuing periods. Water impairment as a recurrenttrend in the state assumed a much bigger scale as the years went by. During 2002-2004, thestate experienced large scale levels of degradation. In this period, the extent of pollutionknown to threaten streams reached enormous proportions in the lower and upper part of thestate. These impairments continue to threaten watersheds in the state.
Regarding the vulnerability of biodiversity, Fig. 10. Shows the distribution of habitats fordiverse species in various areas of the state where mining activities are quite active. The datarepresents also the circulation and conservation status of biodiversity in the state. Theseareas contain different life forms made up of butterflies, amphibians, reptiles, birds andmammals. Inadequate safety measures during mining activities not only pose enormousthreats to ecosystem health in these areas, but sensitive habitats for different life forms arealso vulnerable. The species richness index calibrated at high and medium scales of red andyellow colors maintained a large presence in different areas adjacent to mining activities. Withthe proliferation of MTR, surface mining and the problems posed by abandoned andunderground mine fires. It is evident that species richness across different areas on the mapremained at risk all these years.
Fig. 10. Species Richness Source: Natural Resource Analysis Center, WV, 2002
3.5 Analysis of Green Space Degradation from Mountain Top Removal
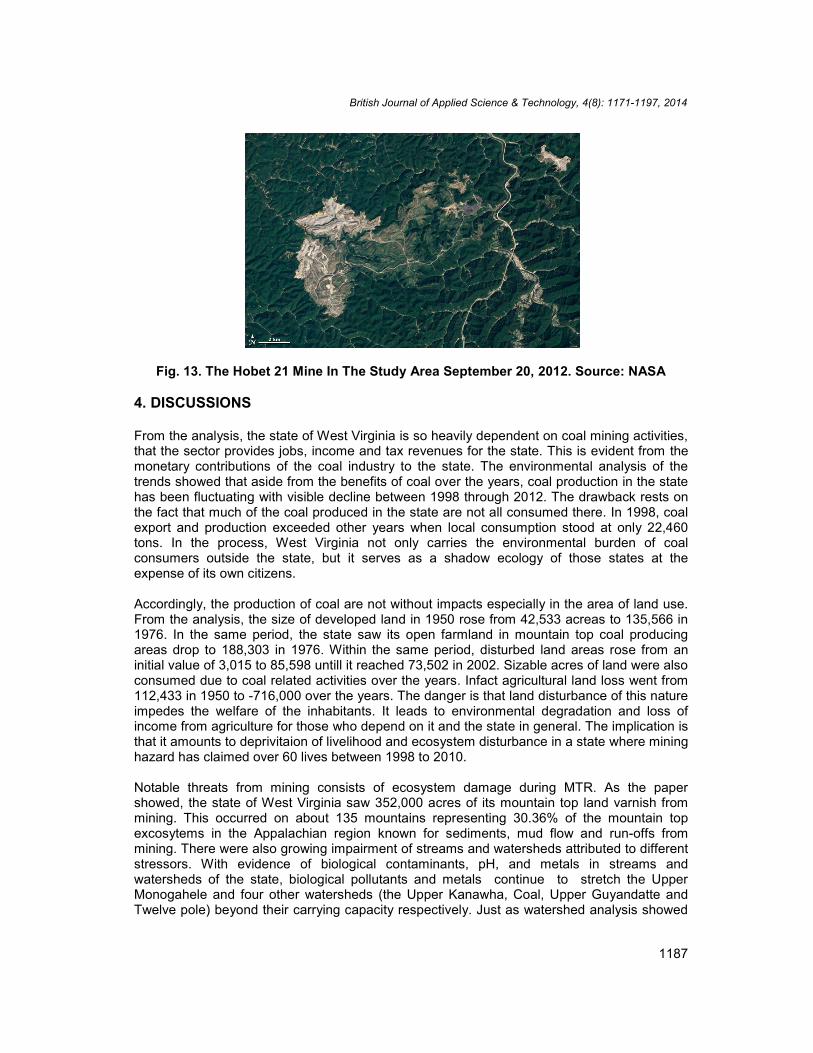
Another evidence of degradation stems from the spatial dispersion of MTR impacts on Hobet21 mine sites in West Virginia along the Mud River watershed. Analyzing these patterns ofdegradation on Hobet 21 mountain top mine requires multi temporal LANDSAT Satelliteimages from 1984, 1992 to 2012. The green and milky white colors on the maps representindicators and stressors on the mountain top ecosystem. The green depicts open space in amountain ecosystem, along with pipelines carrying mining residues into the tributaries,disturbed and restored areas and mining operations.
A close analysis of the images show the progression of the Hobet - 21 Mountain top minealong the Mud Rriver watershed of West Virginia Figs. 11-13. The images represent the

British Journal of Applied Science & Technology, 4(8): 1171-1197, 2014
1186
expansion of the Hobet mine during the periods of 1984-2012. The usual background of thearea showed shadowy green forested mountain containing tributaries and basins. At that time,the mountain features looked rancid-white, while areas under restoration with vegetation weredefined by bright green colors.
Beginning in 1984, one notices partial presence of mining operations along the westernportion of the Coal River. This was followed by more stretches on the south west of themountain top Fig. 11. In 1992, mining activity extended onto the north side with vast presenceof debris deposits evident with valley fills and earth dams. This is apparent with the flatteningof the landscape and the development of mining areas in the northwest Fig. 12. While thearea experienced a gradual emergence of green spaces and a reclaimed landscape in 2012,the images still point to the presence of mining activities in both the south west and northwestFig. 13. Consequently, in almost three decades of MTR activities, landscape disturbance notonly grew, but it impacted over 10,000 acres of land, the equivalent of 15.6 square miles.
Fig. 11. The Hobet Mine 21 In The Study Area, September 21 1984. Source: NASA
Fig. 12. The Hobet 21 Mine In The Study Area August 1992. Source: NASA
British Journal of Applied Science & Technology, 4(8): 1171-1197, 2014
1187
Fig. 13. The Hobet 21 Mine In The Study Area September 20, 2012. Source: NASA
4. DISCUSSIONS
From the analysis, the state of West Virginia is so heavily dependent on coal mining activities,that the sector provides jobs, income and tax revenues for the state. This is evident from themonetary contributions of the coal industry to the state. The environmental analysis of thetrends showed that aside from the benefits of coal over the years, coal production in the statehas been fluctuating with visible decline between 1998 through 2012. The drawback rests onthe fact that much of the coal produced in the state are not all consumed there. In 1998, coalexport and production exceeded other years when local consumption stood at only 22,460tons. In the process, West Virginia not only carries the environmental burden of coalconsumers outside the state, but it serves as a shadow ecology of those states at theexpense of its own citizens.
Accordingly, the production of coal are not without impacts especially in the area of land use.From the analysis, the size of developed land in 1950 rose from 42,533 acreas to 135,566 in1976. In the same period, the state saw its open farmland in mountain top coal producingareas drop to 188,303 in 1976. Within the same period, disturbed land areas rose from aninitial value of 3,015 to 85,598 untill it reached 73,502 in 2002. Sizable acres of land were alsoconsumed due to coal related activities over the years. Infact agricultural land loss went from112,433 in 1950 to -716,000 over the years. The danger is that land disturbance of this natureimpedes the welfare of the inhabitants. It leads to environmental degradation and loss ofincome from agriculture for those who depend on it and the state in general. The implication isthat it amounts to deprivitaion of livelihood and ecosystem disturbance in a state where mininghazard has claimed over 60 lives between 1998 to 2010.
Notable threats from mining consists of ecosystem damage during MTR. As the papershowed, the state of West Virginia saw 352,000 acres of its mountain top land varnish frommining. This occurred on about 135 mountains representing 30.36% of the mountain topexcosytems in the Appalachian region known for sediments, mud flow and run-offs frommining. There were also growing impairment of streams and watersheds attributed to differentstressors. With evidence of biological contaminants, pH, and metals in streams andwatersheds of the state, biological pollutants and metals continue to stretch the UpperMonogahele and four other watersheds (the Upper Kanawha, Coal, Upper Guyandatte andTwelve pole) beyond their carrying capacity respectively. Just as watershed analysis showed

British Journal of Applied Science & Technology, 4(8): 1171-1197, 2014
1188
large concentration of stressors, MTR assessment identified landscape disturbance andecosystem damages linked to mining. Seeing the vulnerability of natural areas, GIS as a toolpinpointed the enormity of risks faced by waterbodies and species’ habitats adjacent to thecoal fields of West Virginia. With socio-economic elements linked to degradation, mitigationefforts still have not adressed current concerns completely.
5. CONCLUSIONS
This part of the paper focuses on the closure with future lines of actions ranging from the needfor corporate code of ethics to data infrastructure upgrade. See Appendix D for details of therecommendations. Essentially, this paper has explored the environmental impacts of miningusing GIS with focus on West Virginia. The paper presented the issues with a profile of thestudy area and environmental analysis. The research also focused on the factors and effortsto stem degradation. With intense mining and the growing demands over the years, it isevident that coal production in West Virginia showed visible declines with impacts on thesurrounding ecology and areas known for MTR activities. To analyze these issues, the paperused a mix-scale method of temporal-spatial analysis involving descriptive statistics and GIS.From the analysis, West Virginia boosts of substantial deposits of coal with economic benefitsand growing impacts. While the techniques of mining (surface, underground, and MTR)threatens the ecosystem and the adjascent headwaters, between 1998-2010, mining hazardsresulted in the death of 60 people in West Virginia.
Accordingly, the environmental impacts of mining continue to be felt in West Virginia with thedisappearance of green cover, land loss, threats to mountain top biodiversity and water qualityimpairment. This is partly attributed to socio-economic variables of population, political factors,policy defects and favorable terrain for the industry. Notwithstanding the continual decline inthe tonnage of coal over the years and the linkages between some socio-economic elementsand environmental degradation, combined efforts among various entities to minimizedegradation showed some promise. However, those initiatives have not eradicateddegradation from mining completely. Compounding the matter is the absence of a mix scaleanalysis of mining of impacts on West Virginia’s environment using GIS.
Of great importance is the mix-scale research approach of descriptive statistics and GIS inhighlighting the severity of change induced by mining. In the geospatial analysis, the papershows that while mining offers various benefits to West Virginia, it continues to impact naturewith multiple cases of watershed impairment with greater concentration in different areas ofthe state. There were large spatial concentration of biological effluents, pH and metals inecologically sensitive streams and the watersheds. Using GIS in that setting to trackwatershed impairment and the dispersion of pollutants, improves ourresearch and knowledgeof the scale of ecosystem stress. This inturn provides a framework for analyzing ecosystemsat risk. The usefulness of GIS in that circumstance stems from its capacity as a research andpolicy tool for pinpointing the threats of degradation across space.
Furthermore, the spatial analysis using GIS identified a cluster of areas in West Virginia wherecoal mining activities and the resulting run offs threaten stream habitat quality. From theanalysis, the ecosystem was not only threatened, but there were a growing number ofimpaired water bodies. The assessment of these trends and the capability of GIS inpinpointing them enhanced our research and understanding of ecosystem vulnerability in theface of recurrent degradation induced by mining. GIS also provided a framework for assessingecosystem declines attributed to coal mining activities and the mechanisms for mitigation.Finally, in the last decades the spatial dispersion of pollutants triggered by mining continues to

British Journal of Applied Science & Technology, 4(8): 1171-1197, 2014
1189
erode sensitive environments adjacent to the coal fields of West Virginia. To remedy theproblem, the paper offered suggestions ranging from the need to formulate a corporate codeof ethics for the industry, the upgrade of data infrastructure and the continuity of GIS tosustain environmental decision making.
ACKNOWLEDGEMENTS
We would like to thank the founding Dean of the College of Public Service at Jackson StateUniversity for approving a request for conference travel and participation and the variousgovernment agencies for making environmental and geospatial data available for theresearch.
COMPETING INTERESTS
Authors have declared that no competing interests exist.
REFERENCES
1. Bureau of Business and Economic Research. The West Virginia Coal EconomyCenterFor economic Research, West Virginia University, Morgantown; 2010.
2. Mcllmoil R. Coal and Renewables in Central Appalachia the Impact of Coal on the WestVirginia State Budget. Morgantown, West Virginia Center for Budget and Policy; 2010.
3. Mcllmoil R. The Impacts of Coal on West Virginia State Budget. Morgantown,Downstream Strategies; 2012.
4. O’Leary S. Booms and Burst the Impact of West Virginia’s Energy Economy.Charleston, West Virginia Center on Budget and Policy; 2011.
5. EPA. EPA Issues Final Guidelines to Protect Water Quality in AppalachianCommunities From Impacts of Mountaintop Mining. 2011. Retrieved 18th February;2013. Available: http://yosemite.epa.gov/opa/admpress.nsf/le5ab112/.
6. West Virginia Office of Miners Health, Safety and Training. West Virginia Coal MiningFacts Annual Reports, Charleston, WVOMHST; 2012.
7. West Virginia Rivers coalition Stop it MTR Retrieved 18th February; 2013. Available:http://www.wvrivers.org/issues/mountaintopremoval/mtrrevealed.html.
8. Yan S. In West Virginia, a Battle over Mountaintop Mining. Science and Space, Time2010. Retrieved. 18th February; 2013. Available: http://www.time.com.
9. Merem EC, Twumasi YA. GIS Applications in Land Management the Loss of HighQuality Land to Land Development in Central Mississippi. The International Journal ofEnvironmental Research and Public Health. 2005;2(2)234-244.
10. Merem EC, Twumasi YA. GIS Based Analysis of Growth Management andEnvironmental Decline of Central Mississippi Region. Geographic Information Sciences.2005;11(2)130-137.
11. Merem EC, Twumasi. YA. GIS Based Analysis of Growth Management andenvironmental decline of the Central Mississippi Region. Annals of GIS. 2005;11:201:130-138.
12. Merem EC, Twumasi YA. GIS and Remote Sensing Applications in the Assessment ofChange within a Coastal Environment in the Niger Delta Region of Nigeria. TheInternational Journal of Environmental Health and Public Health. 2006;3:(1)98-106.
13. Merem EC, Twumasi YA. Using Spatial Information Technology as a Monitoring DeviceIn Internatioonal Watershed Conservation Along The Senegal River Basin of WestAfrica. International Journal of Environmental Health. 2008;5:464-476.

British Journal of Applied Science & Technology, 4(8): 1171-1197, 2014
1190
14. Merem EC, Twumasi YA. Hydro-politics, a Case of The Niger River Basin. GISDevelopment Africa. 2006;24-28.
15. Merem EC, Twumasi YA. Using GIS in Environmental Management Green Assessmentof the Impacts of Petroleum Activities in the State of Texas. The International Journal ofEnvironmental Research and Public Health. 2010;7(5)2101-2130.
16. Merem EC. Using Geospatial Information Systems in Analyzing Urbanization Impactson Stream Habitats in Southern Mississippi Coastal Ecosystem. Journal ofEnvironmental Science and Engineering. 2011;5(12):1624-1641.
17. Merem EC. Geospatial information analysis of land use impacts in Southern AlabamaJournal of Environmental Monitoring and Restoration. 2011;7:01-25.
18. Merem EC, Twumasi YA. Relationships between Climate Parameters and ForestVegetation at and Near Digya National Park, Ghana. The British Journal of Environmentand Climate Change. 2011;1:(4)2011-2115.
19. Merem EC, Twumasi YA. The Applications of GIS in the Analysis of the Impacts ofHuman Activities on South Texas Watersheds International Journal of EnvironmentalResearch and Public Health. 2011;8(6)2418-2446.
20. Merem EC, Twumasi YA. Geospatial Analysis of the Changing Agricultural LandscapeofNorthern Mississippi a Proceedings of AEHS conference, San Diego, California; 2012.
21. Merem EC, Twumasi YA. Using GIS and Climate Risk Information Systems to Analyzethe Vulnerability of Coastal Counties in Louisiana and Mississippi. Resources andEnvironment. 2012;1:(1)1-18.
22. Merem EC, Twumasi YA. Using GIS and Climate Risk Information Systems to Analyzethe Vulnerability of Coastal Areas in the South East. 2012 Proceedings of theUniversity Florida Climate Change Conference, Orlando, Florida; 2011.
23. Merem EC. Geospatial Assessment of the Impacts of Changing Agricultural Landscapein Louisiana. The Journal of Marine Science. 2013;3:1.
24. Biswass S. Remote Sensing and GIS Based Approach for Watershed Conservation.Journal of Survey Engineering. 3;108-124.
25. Prakash AK. Deciding Alternative Land Use Options in a Watershed Using GIS. Journalof Irrigation Drainage Engineering. 2007;133:162-174.
26. Usery EL. Geophysical Data Resampling and Resolution Effects On WatershedModelling a Case study Using Agricultural Non-Point Source Pollution Model. Journal ofGeophysical Sysystems. 2004;6:289-306.
27. Kwalie M. Watershed Characristics, and Fabrics. The Application of Remote Sensingand Geographic Informations Systems. Lakes and Reserviors Resource Management.2005;10:85-92.
28. Lovejoy S. Watershed management for water quality protection is GIS and SimulationModels the Answer? Journal of Soil and Water Conservation. 1997;103.
29. Almasri M, Kaluarachchi J. Nitrate Contamination of Groundwater in AgriculturalWatersheds. Journal of Hydrology. 2007;211-229
30. Russell G. The Role of GIS in Selecting Site For Riparian Restoration Based onHydrology and Land Use. Restoration Ecology. 2007;56-68.
31. Liu Y. GIS Based Integration of SWAT and REMN for Estimating Water Quality Benefitsof Riparian Buffers in Agricultural Watersheds. Transactions of the ASABE. 2007;56-68.
32. Phillippe M. A Spatio-Statistical Approach For Modeling The Effect of Non- Point ounceOn Different Water Quality Parameters in the Vehas River Watershed Brazil. Journal ofEnvironmental Management. 2008;158-170.
33. Davies BR. A Comparison of the Catchments Sizes of Rivers, Streams, Ponds, Ditchesand Lakes. Implications for Protecting Aquatic Biodiversity in an Agricultural Landscape.Hydrobiologia. 2008;597:7-17.

British Journal of Applied Science & Technology, 4(8): 1171-1197, 2014
1191
34. Appalachian Voices. Community Impacts of Mountain Top Removal. 2012, Retrieved18th February; 2013. Available: http://appvoices.org/end-mountain-removal/community.
35. Appalachian Voices. Ecological Impacts of Mountain Top Removal. 2012. Retrieved18th February, 2013, from http://appvoices.org./end-mountaintop-removal/ecology/.
36. Appalachian Voices. Mountain Top Removal 101. 2012c. Retrieved 18th February;2013. Available: http://appvoices.org/end- mointaintop-removal/mtr1001/.
37. Chhotray S. Mountain Top Removal: Effects on Human Health and the Environment.2008. Retrieved 18th February; 2013.Available: http://www.law.sc.edu/environmental/papers/200841/eas/chhotray.
38. Lindberg T. Cumulative Impacts of Mountain Top Mining on Appalachian Watershed.PNAS Early Edition. 2008;1-6.
39. Wiscombe W. Controversy in the Appalachia. NASA Goodland Space Center; 2013.40. McQuaid J. Science, Nature and Mining. Smithsonian Magazine. 2009. Retrieved 18th
February; 2013. Available: http://www.smithosianmag.com/scence-nature/mining – the-miuntain.htmlGssG41h.
41. EPA. Obama Administration Takes Unprecedented Steps to Reduce EnvironmentalImpacts of Mountaintop Coal Mining. 2009. Retrieved 18th February; 2013. Available:http://yosemite.epa.gov/opa/admpress.nsf/bd4379a92.
42. US Bureau of Census. The Economic Census Profiles US National and LocalEconomies Every 5 Years. DC Washington; 2007.

British Journal of Applied Science & Technology, 4(8): 1171-1197, 2014
1192
APPENDIX- A
3.2.4 Watershed Impairments (Continued)
Among the watersheds adjacent to 1 to 2 mining sites, Conocochegue, South Branch, WestFork and North Branch seem to stand out. Of this group of watersheds most notablyConocochegue and North Branch, biological contaminants stood out as the core stressorswith impairments numbering 226, 109, to 155 from 2002 through 2004. Looking at the otherclass of watersheds like Upper Ohio wheeling and Little Kanawha, pH impairements weredistributed over the periods of 1996,1998 and 2002-2004 with numbers totalling 37, 112, 287and 66, 235, 308 to 303 cases. Of the other set of lower tier watersheds (Middle new, Lowernew, and Lower Kanawha) an interesting scenario emerges. At middle new watereshed,cases of biological impairment occurred in 29 to 38 streams between 1996 and 1998. Thetrend extended further into the 2002-2004 periods with 310 to 296 water bodies classified asimpaired. This was a bit similar to the Lower new watershed, already dealing with high pHcontent reported in 28 to 94 streams and additional cases numbering 228 between 1996 to2004. At Lower Kanawha, stream degradation from coal mining stayed on the rise with 33 to65 incidents from 1996-1998. The trend continued in 2002 to 2004 with more cases.
APPENDIX- B
3.3 Factors Responsible For the Problems
As mentioned earlier, the prevalence of ecological degradation from mining does not operatein a vacuum. They are linked to socio-economic elements of politics, policy defects anddemography.These factors are listed in detail on the following paragraphs.
3.3.1 Economic factors
West Virginia would not be in the current ecological morass without the lust for coal products.The demand for mountain top coal has grown the past years due to rising costs of fossil fueland the demand for non-renewable extractive resources. This is attributed to the essence ofcoal as the economic engine driving the daily lives of US citizens and the emergingeconomies of China and India. Accordingly, the cost of coal products in the mid Appalachianregion in serving those needs has increased threefold above the 2006 levels. In takingadvantage of such a turn around, Virginia-based Massey Energy, in charge of several of theAppalachian's MTR activities, is committed to coal exports to China. Growing requests in thiscase lead to MTR which the industry views as the most gainful method. In the state whereMTR and other kinds of mining represented 42% of coal production in 2007, the gains fromglobal market access trigger externalities that disrupt ecosystems hence the linkage.
3.3.2 Political factors
From what transpired in West Virginia where coal is intertwined with politics, one notices adisregard for human lives and the ecosystem by the industry. Such inter-linkage is anindication of the power of coal industry in the political economy of the state in whichdegradations from coal happen while elected officials looked elsewhere. While this stems fromthe political and economic influence of the coal lobby. It reinforces the deep entrenchment ofpolitics into the nature-economy interface debate in the state. Given the significance, it ispolitical suicide for office holders to denounce safety violations. West Virginia's political elite

British Journal of Applied Science & Technology, 4(8): 1171-1197, 2014
1193
has been firm in its backing of the coal sector. This mutual rapport is displayed yearly duringthe state’s coal symposium, when elected officials and the coal sector socialize. This iscompounded by the state government and congressional delegates who prefer softerregulations to accountability. In the absence of that support, MTR might not be permissible[40].
3.3.3 Policy defects
Stronger policies supported by the executive branch and the other regulatory agencies arecrucial for attaining compliance in the mining sector [41]. Under a command and controlmechanism in those rules and the “polluter pay” sanctions, violators who pay hefty fines wouldnot want to be repeat offenders. However, in the case of West Virginia, the mining industrywas offered a safe haven in 2002 when the Bush administration amended the regulationcentral to MTR waste in a ploy to circumvent the lawful ban on valley fills [40]. In fact,sanctions against clean water act violations prompts criticism by industry insiders who oftendecry stringent regulations as a hindrance to free enterprise. This is because much of WestVirginia’s land belongs to private landholding operators who rent the land and the rights tominerals to the coal industry. While this stifles public oversight on mountain top projects inprivate hands, it is hard to regulate in those circumstances.
3.3.4 Favorable terrain for the mining sector
The socio-cultural setting of West Virginia favors the industry. The state has the 2nd to lowestGDP per capita and 2nd lowest median household income. It also ranks 6th among stateswhere citizens live below the poverty level [42]. Seeing that the state ranks poorly in mostsocio-economic indicators, it comes as no surprise that only a small number of businesseswith the exception of coal mining are attracted to towns lacking basic necessities whereinfrastructures are under the worst conditions. Without steady revenues to provide services,impoverished counties turn to revenues generated from MTR. Mining operators, whocapitalize on public misery, exploit those conditions at the expense of clean environment. Insuch a terrain, it is hard to survive politically in mining counties where those who back it thriveat the ballot box with huge rewards in campaign donations compared to challengers.
3.3.5 Geographic dimensions of economic elements
In terms of other economic factors, the geography of over dependence on revenues frommining in a fiscally challenged state such as West Virginia should not be overlooked. This canbe buttressed from Fig. 14. where a few counties account for the largest concentration ofincome.Tougher regulations in those settings, could be seen as taking jobs away ineconomically depressed areas where citizens need jobs for survival, hence the tendency inthe state to soften regulations in favour of the mining industry. The other thing is that being aless affluent state, there is a minor concentration of higher income brackets in a few areas ofthe state compared to the other cathegories in yellow and brown. Under that scenario, there isa always a tendency in space to support mining activities at every cost in order to generatewealth no matter the impacts on the surrounding ecology of the area.

British Journal of Applied Science & Technology, 4(8): 1171-1197, 2014
1194
Fig. 14. Percapita Income Distribution. Source: US Census.gov, 2000
3.3.6 The spatial distribution of population
The distribution of populations in West Virginia from the map shows multiple classes with thehighest identified as the blue and the medium ones in light blue and light green Fig. 15. This isfollowed by the low classes of population presence in orange and red. The problem is thatregardless of location, size and the the number of people, built and natural environments inhigh and low density areas are always at risk. The severity of air and water pollution frommining would equally be damaging in counties represented in red and orange. The concernhere centers on the vicinity of these communities to the mining sites of the state. Looking atthese sites and the adjacent streams, one notices their vicinity to built environments. Suchproximity raises the level of risks to built and natural areas.
Fig. 15. Total population in the WV counties. Source: US Census.gov, 2006

British Journal of Applied Science & Technology, 4(8): 1171-1197, 2014
1195
APPENDIX- C
3.4 Efforts to Deal with the Problems
Within the study area, there are ongoing efforts to contain the environmental impacts of coalmining. Those initiatives ranging from the mobilization of environmental groups to landreclamation efforts are described briefly below.
3.4.1The active mobilization of environmental groups and legal actions
The impact of mining helped mobilize green groups in their support of communities faced withecosystem damages in the state. Different forms of support made up of capacity building,trainings, legal and financial assistance were instrumental in acquainting impactedcommunities with their rights under existing policies. Since the late 1990s, environmentalNGOs and residents of coalfield communities have initiated lawsuits against coal operatorsand regulatory agencies over these mines. The cases involved the illegality of streams aslandfill for mining waste in accordance with the Clean Water Act and the use of valley fills inviolation of the 1977 Surface Mining Control and Reclamation Act which require miningoperators to return sites to their pre-land use form.
3.4.2 Federal guidance on mining
To deal with the problems associated with mining, the U.S. EPA has been active in the past incharting a new course towards effective monitoring. In the process, the agency devised a pathon Appalachian mining aimed at a more reliable assessment of surface mining permits in linewith the Clean Water Act and other laws. The proposed guideline drew heavily from thecurrent advances in research and development that integrates feedback from the public. Infurnishing EPA’s local branches with up-to-date data on the present standards, the policyassists them to collaborate with states, the U.S. Army Corps of Engineers, mining companies,and the citizens in arriving at an acceptable method that shields communities from thehazards originating from coal mining. The expectation is that the EPA will enforce the policyamenably, in line with the common experience of individual sites.
3.4.3 Growing coordination among federal agencies
Recently the Obama Administration officials stated they are taking measures to diminish theimpacts of MTR in the six Appalachian states including West Virginia under a synchronizedmodel with the EPA, Department of Interior and Army Corps of Engineers. Building on a jointagreement reached by the agencies and the US Interior Department, the Administrationimplemented an Interagency Action Plan focused on MTR to minimize the negative impactsthrough interim measures finalized in 2009. Other aspects of the plan involved long rangeinitiatives to strengthen guidelines on MTR and collaborations among agencies with tougherenvironmental assessments and rigorous scrutiny of permit requests in line with the CleanWater Act (CWA) and the Surface Mining Control and Reclamation Act (SMCRA) of 1997.
3.4.4 Reclamation and reforestation initiatives involving the private sector
Having seen the role of mining in degrading areas adjacent to coal fields, elements in theindustry have taken it upon themselves to restore and reclaim degraded ecosystems.Knowing the complex process involved, coal entities are now restoring previously degraded

British Journal of Applied Science & Technology, 4(8): 1171-1197, 2014
1196
MRT sites. Being a difficult initiative requiring a decade for implementation, the processinvolves valley fills and new hilltops of crushed rock covered with topsoil to hold tree roots.Just as the recovery demands effective land management which coalfields lack, the lastingbenefits remain unclear due to the sheer number of policy obstacles out there to overcome.
APPENDIX- D
4.1 Recommendations
4.1.1 Institute a corporate environmental code of ethics for the mining sector
There is a mutual relationship between humans and nature, yet industry critics forget thatdoing away with the ecosystem in any form under the pretext of development does more harmthan good to communities facing the daily ordeal of degradation. Seeing that every decisionmade in the corporate board rooms of mining in West Virginia impacts nature and thewellbeing of communities, there is an ethical obligation which must be addressed throughstrict adherence to a corporate code of ethics by the sector. Because there is somethingintrinsically good about people and the different life forms in counties close to coal fields, it ispertinent that those values be observed by the industry. Thus there is an urgent need for acorporate body of norms to hold the industry accountable for the good stewardship of nature.
4.1.2 Subject the mining sector to tougher reviews
The regulation of MTR practices need not be grounded solely on the belief that the laws arealways functional when crafted. In the case of water pollution from mining, the scantyoversight of its ecological impacts may not always solve it. Environmental policy withouteffective enforcement mechanisms like reviews not only risks losing its appeal, but there is adanger of being branded out of touch with the very issue it ought to be addressing. Rollingback laws in this way diminishes the use of federal regulators in addressing the impacts ofmining. Seeing the degradation of natural areas adjacent to West Virginia coal fields knownfor MTR, stringent assessments with standards are indispensable in ensuring the quality ofsensitive streams and for bringing the industry in compliance with the Clean Water Act.
4.1.3 Support reforestation and reclamation
The need for reclamation of degraded landscape in the study area after many years of miningis central to ecological regeneration of communities known to have experienced disturbance.This is vital considering the gravity of accumulated degradation in counties near WestVirginia’s coal fields. Even though the regulation requires MTR site be restored to its pre- landuse form at the end of activities, most landscapes remain in ruins. Accordingly, reforestation isbarely given a serious thought. Knowing the abundance of biodiversity in the study area,abandoned mines and habitats which should have been reclaimed to ensure species richnesslanguish. In that light, the paper calls for the reforestation and reclamation of degraded areasin order to restore landscapes to their previous forms in affected counties.
4.1.4Improve data infrastructure and design regional ecological information system
During this study, there was no centralized data clearing house on the impacts of mining inWest Virginia. The available facts on mining impacts were scatterred in diffferent places. Toimprove the situation, it is suggested that West Virginia improve existing environmental

British Journal of Applied Science & Technology, 4(8): 1171-1197, 2014
1197
technologies and strengthen public access to data on degradation. This would enhance theability to carry out impact assessment and reviews of coal fields activities in the state. There isalso a need for more geospatial data on mining impacts. Without access to a spatiallyreferenced system, decision makers and mining operations would not know the location andseverity of degradation in the ecosystem. This would sharpen the readiness of regulators inreviewing policy violations while ensuring compliance with GIS as a tool in future endeavors.__________________________________________________________________________
© 2014 Merem et al.; This is an Open Access article distributed under the terms of the Creative Commons AttributionLicense (http://creativecommons.org/licenses/by/3.0), which permits unrestricted use, distribution, and reproduction inany medium, provided the original work is properly cited.
Peer-review history:The peer review history for this paper can be accessed here:
http://www.sciencedomain.org/review-history.php?iid=408&id=5&aid=3356