Embed Size (px)
Citation preview
The Alchemy of “Costing Out” an Adequate Education
By Eric A. Hanushek
October 2005
Paper prepared for:
Adequacy Lawsuits: Their Growing Impact on American Education
October 13-14, 2005
Kennedy School of Government
Harvard University
The Alchemy of “Costing Out” an Adequate Education By Eric A. Hanushek1
The recent movement to hold schools accountable for student performance has
highlighted a simple fact: Many students are not achieving at desired levels. Moreover, it takes
little additional evidence to realize that a substantial number of schools are not on an obvious path
toward eliminating the gaps. These simple facts have led people with widely varying reform
perspectives to enter into the fray with plans and solutions. And, a natural follow-on question is
invariably ‘what will it cost?’ In order to answer this important question, a series of very
misleading methods for estimating the costs of an improved education have evolved, but the
problems with these methods are generally unrecognized (or ignored) in the public and judicial
debate.
“Costing out studies” should be interpreted as political documents, not as scientific
studies. They are most frequently contracted for by parties interested in increasing the level of
spending for education (including teachers unions, state departments of education, and litigants),
although they sometimes involve defensive reactions of parties trying to neutralize a rival costing
out study that calls for large increases in spending. They are seldom used as analytical tools to
aid in policy deliberations.
The greatest premium seems to be placed on finding “a number,” because – regardless of
its validity – a number for total “required” state spending can be used easily in a public relations
campaign.2 Any discussion of the underlying basis for the number is typically relegated to the
status of arcane academic debate, while the number itself frames the discussion. The debate
about the basis for the number is not news, but the number is.
1 Hoover Institution/Stanford University, University of Texas at Dallas, and National Bureau of Economic Research. This analysis benefited from the research assistance of Brent Faville. This work has benefited from comments by Alfred Lindseth and Michael Wolkoff. 2 This explains why the websites for advocacy organizations give top-billing to costing out studies. For example, see the ACCESS Project at http://www.schoolfunding.info.
2
The following discussion sets out the myriad of problems and interpretative issues with
these studies. The simple conclusion is that these studies do not and cannot provide a scientific
solution to the governmental decision process. Deciding on the right balance among different
government programs and between public and private spending along with structuring the schools
and their incentives is rightfully the province of the democratic appropriations process and not
consultants hired by interested parties.
The Context
School policy discussions have gone in several different, but related, directions. In
current national debates, federal legislation on accountability – No Child Left Behind Act
(NCLB) of 2001 – has reinforced and extended the movement of individual states to set academic
standards for students and to enforce the achievement of these. This attention has focused
spotlight directly on the performance of students and has identified gaps between desired and
actual performance of students.
The accountability concerns dovetail with a longer running concern about the financing
of schools. From the beginning of the 20th century, states and local governments shared the
responsibility for funding local schools. The pattern has changed throughout the century. The
local share went from over 80 percent of financing around World War I to half around World
War II to close to 40 percent today. The federal share was less than two percent until the mid-
1960s when a federal program of compensatory education under the War on Poverty began and
elevated federal spending to 7-9 percent. (The federal program under the Elementary and
Secondary Education Act morphed into NCLB, which itself has a strong emphasis on
disadvantaged students).
While each state differs to some extent, the general pattern has been that local
governments raise funds with local property taxes, and the state distributes funds to localities in a
3
way to compensate for the varying ability of localities to raise funds. As the state share has risen,
regulation and control of local schools has also tended to rise.
Perhaps the most significant change in policy discussions about school finance was the
introduction of court decision making into the determination of funding schemes. Following the
California court case of Serrano v. Priest, begun in the late 1960s, a majority of states had legal
actions designed to change the method of funding local schools. From the outset, these cases
stressed equity considerations, arguing that some localities – by virtue of a low property tax base,
poverty, or unwillingness to support school funding – spent significantly less than other, more
advantaged districts. This situation presented an equity concern, because children growing up in
the wrong jurisdiction could receive an inferior education and be harmed over the long run.
The focus of these lawsuits was funding disparities across different school districts. The
outcomes of these suits, argued under the separate state constitutions, were mixed with some state
courts finding disparities to be unconstitutional and others not.3 The lawsuits tended to increase
the state share of funding, whether successful or not because many state legislatures acted without
being pressured to do so by a court judgment, and they tended to bring about more equalized
funding within states (Murray, Evans, and Schwab (1998)).
Interestingly, although these suits were motivated by the possibility of an inferior
education for disadvantaged students, until recently virtually no subsequent analysis investigated
whether or not student outcomes tended to be more equal after spending was equalized. In fact,
the few investigations of this have not supported equalization in student outcomes (Downes
(1992), Hanushek and Somers (2001), Flanagan and Murray (2004), Downes (2004), Cullen and
Loeb (2004), Duncombe and Johnston (2004)).
3 An early suit in federal court, Rodriguez v. San Antonio, was brought under the 14th Amendment to the U.S. Constitution, but the U.S. Supreme Court ruled in 1973 that state funding arrangements were not a federal constitutional violation.
4
The early court decisions about spending equity changed, however, in the 1990s.4 Even
with equal spending across a state, some argue that the children may not be getting sufficient
education. Alabama (ACE v. Hunt, 1993) epitomized this situation, where the spending across
districts was quite equal but students were performing at the bottom of the nation in terms of
achievement levels.5 This juxtaposition of an equitable system performing poorly led to a new
legal and policy view, now described as “adequacy.”
Adequacy dovetails directly with accountability. The standards and accountability
movement focuses on how well students are achieving relative to the standards, or goals, for the
students. A regular outcome is an explicit statement of the performance deficit – i.e., how many
students have not reached proficiency on the state’s standards.
The opposite side of this finding of insufficient student performance is an assessment of
why this might be. And, the answer as asserted in the new round of court cases dealing with
adequacy is that resources are insufficient to support the achievement standards. Thus, a variety
of parties have sued states to compel that they provide adequate funding so that all students can
achieve the state standards.6
This backdrop has led courts and legislatures to look for a scientific determination of the
amount of spending by schools that would be adequate to achieve the state standards. Indeed
there has been no shortage of consultants who are prepared to provide an analytical answer to
what level of spending is required. This activity, dubbed costing out studies, has been conducted
4 A number of court cases also argued “tax equity,” that some jurisdictions had to maintain a higher tax rate than others in order to have comparable spending. In general, state constitutions discuss educational requirements but do not focus on such taxpayer equity. 5 For example, Alabama was in the bottom 20 percent of the nation in 4th grade reading in 1992. 6 Related discussions and suits have been leveled at the federal government, claiming that NCLB is an unfunded mandate and that the federal government should fully fund the schools at a level sufficient to meet the requirements of NCLB. On April 20, 2005, the National Education Association (NEA) filed suit against the U.S. Department of Education (Pontiac v Spellings) to obtain the greater funding for schools that the NEA thought necessary to meet the accountability standards. See Munich and Testani (2005) and Peyser and Costrell (2004).
5
in over 33 states, and the demand for such analyses has only increased.7 Courts are willing to
write the specific numbers of costing out studies into judgments,8 and legislatures come back
repeatedly to these studies to guide their appropriations.
This paper considers the available methodologies of the costing out studies. The studies,
it turns out, are more politics than science. They are incapable of providing the guidance that is
sought, because they do not provide an objective and reliable answer of the cost of meeting
educational standards. But, they do serve the purposes of the interested parties that tend to
contract to have the studies done.
Much of the persuasiveness of the existing studies appears to derive from their
commonsensical and logical approaches to analysis, all wrapped in a patina of science. These
perceived traits benefit, however, from misconceptions about the underlying analyses. They do
not meet the most basic standards of scientific inquiry.
The Ambiguity of Terms
School finance discussions are punctuated by a series of words that have evolved into
having very particular meanings that differ from the generally accepted concepts. The evolution
of meaning largely reflects the existence of political movements that argue for very specific
positions and use the dual meaning of the terms for the purpose of gaining political and public
support. It is important to discuss these at the very beginning, because many of the issues of
school finance discussions revolve around the misuse of these terms.
7 A review of past costing out studies can be found in Education Week (2005). See also the ACCESS Project website, a project of the Campaign for Fiscal Equity (CFE), the plaintiffs in the New York City adequacy case, Campaign for Fiscal Equity v State of New York, 100 N.Y.2d 893 (N.Y. 2003). CFE states that its primary mission is to “promote better education by conducting research, developing effective strategies for litigation and remedies (including cost studies), and providing tools for public engagement.” The count of prior costing out studies comes from (http://www.schoolfunding.info/index.php3), accessed on October 7, 2005. 8 See, for example, Campaign for Fiscal Equity v State of New York and Montoy. v. State of Kansas, No. 92032 (Kan. S.Ct. June 3, 2005).
6
The key terms in the debate indeed capture appropriate goals of public policy. The
essence of the dual meanings is that the support for the goals is translated into political backing
for the substitute concepts, frequently without participants in the discussions even recognizing it.
The discussion of costing out methodology below is helped by clarifying these terms.
Cost
Amazingly, the first term the needs clarification is cost itself. Legislatures and courts
frequently ask, in an imprecise way, what does it cost to provide a given education? Cost can be
considered from the viewpoint of consumers (or demanders) and of producers (or suppliers), and
both are relevant for our consideration of schooling costs.
A natural definition of cost from the consumer perspective is the minimum expenditure
needed to purchase something. Why the emphasis on minimum? The reason is obvious. Think
of advising somebody about what it would cost to buy a new car with a certain set of
specifications (size, quality, options, etc.). There is some minimum cost for which it could be
purchased, but one could also pay considerably more. It would not make sense to tell anybody
that the cost of the car is the highest price anybody paid for such a car. Nor would the average
some group spent make sense, if it were possible to buy it for less. Indeed, any cost other than
the minimum price would be arbitrary.
Economists reserve the term cost for the minimum necessary expenditure, because it has
a clear meaning and provides a useful benchmark. But the prices observed, say in the automobile
market, are not always the cost of a given car. If there are many companies competing to sell the
car, the price consumers tend to pay will be close to the cost.9 When there is a single firm selling
the car or when a small number of dealerships collude with each other and agree not to compete,
9 Note in this simple example, part of the cost of the car is the amount of profit to the dealership that is necessary to compensate for the showroom and sales costs.
7
the prices paid for cars will tend to rise above the cost. Thus, the transactions prices for cars do
not always reflect the cost of the car but can be above cost.
In the case of automobiles, we know that there are a variety of companies that produce
the same kind of car – say, a four door midsized sedan of a given quality level. There are
different ways to produce this car. For example, one firm might use a lot of workers with little
capital equipment, while the other one might employ an entirely robotic production line. The
firm with the technology employing lots of labor may not be able to make the car as cheaply as
the robotic firm (or, equivalently, may produce a lower quality car for the cost of production at
the robotic firm). If the cars end up being equivalent in all of the dimensions that the consumers
care about, it would not make sense to say that the cost of buying the car was the production costs
of the expensive producer.
Now think of costs in the context of schooling. If some schools produce a given amount
of learning cheaper than others – say, because they have better teachers and use learning
technology better than others, what is the appropriate cost of schooling? Just as with the auto
example, the amount spent by the different schools is not the same as the cost that would be
required. Some schools spend more than others, but their spending does not reflect the necessary
costs. Nor does the average spending of existing schools reflect necessary costs unless all are
using their resources in the best possible manner. The general lack of competition for the existing
schools removes any presumption that spending reflects the necessary costs.
Efficiency
The possibility that production costs of some firms is more than others immediately
suggestions that some firms are more efficient at production than others. Efficiency is a simple
concept: producing some good – a car or a given amount of learning – at minimum cost.
8
In education discussions, efficiency often is a bad name, in part because it is taken to
mean least cost without regard to the outcome.10 In the example of cars, comparing the cost of a
Honda Civic with that of a Jaguar S-Class would not say anything about the efficiency of the two
manufacturers, because the cars are not comparable. Similarly, the spending of two schools that
are producing very different amounts of learning does not, by itself, say anything about the
efficiency of the two schools.
Equity
From the beginning, much of the discussion of school finance has been closely related to
equity. The issues are serious ones. Substantial achievement gaps by race and income exist and
have persisted for long period of time. For example, the black-white and Hispanic-white
achievement gaps for 17-year-olds on the National Assessment of Educational Progress (NAEP)
have exceeded three-fourths of a standard deviation, implying that the average minority student
falls within the bottom quartile of the white distribution. This enters directly into the school
finance and school policy debates because minority students tend to be concentrated within urban
centers. Similar differences in NAEP scores arise with low income students, although low income
students are not as concentrated in terms of the school districts they attend.
Thus, the educational problems of disadvantaged students are real, and the severity of the
problems falls disproportionately on some districts. Importantly, however, there is a low
correlation between the magnitude of the problems and the spending on schools, local tax bases,
or tax rates of school districts. Several factors intervene. First, all states have policies that
compensate to varying degrees for local taxing ability, and most have direct supplemental
financing for disadvantaged students. Second, the majority of federal spending (currently over
seven percent of national expenditure) goes almost exclusively for compensatory programs for
10 The classic misstatement of efficiency in education is found in Callahan (1962), which like many subsequent considerations failed to hold outcomes constant but instead looked at pure minimization of spending.
9
disadvantaged students. Thirdly, some districts are much more efficient in their spending, and
their educational efforts alter the distribution of outcomes from the distribution of spending.
Fourth, the tax base generally includes both residential property (which will be directly related to
incomes) and commercial and industrial property (which may or may not be correlated with
family incomes).11 Finally, the tax base of a community depends itself on the state funding
formula and on the effectiveness of the schools, since home shoppers are willing to pay extra to
be in a good school district and thus bid up the price of housing.12
Defining equity in terms of spending differences yields a very different picture than
would occur if equity is defined in terms of student outcomes and educational needs.
Adequacy
The motivation of adequacy is that equity studies, concentrating just on the distribution of
spending, ignore shortfalls in student achievement compared to state goals. As NCLB makes
clear, the proportion of proficient students (i.e., meeting the state performance standards) is
currently quite low in some states. Thus, adequacy is an effort to go beyond the distribution of
spending and to say something about the overall level of funding.
This is where costing out studies enter. If this logic is to affect school funding formula, it
is necessary to know how any level of spending translates into a desired outcome. Just how this
is done is the subject of the following analysis.
Proficiency
When put into an accountability framework or the associated adequacy calculations, the
level of proficiency becomes a matter of serious concern, because it states how far students are
11 To see this, contrast Manhattan with large numbers of poor students and considerable property wealth with Newark which has high poverty and low property wealth. 12 The fact that housing prices tend to reflect the value of neighborhood amenities – including the taxes on homes and the quality of schools and other governmental services – is referred to as “capitalization.” An example in the school finance case can be found in Hoxby and Kuziemko (2004).
10
expected to progress at each grade. The level deemed to be “proficient” is, however, a political
choice that almost certainly changes over time and across different uses.
The introduction of federal accountability standards in NCLB has also introduced new
confusion. Before NCLB, states pursued varying strategies in the development of their standards.
Some choose to establish very high achievement standards – what might be termed aspirational
goals. Others chose much more modest standards that were not a large stretch from what many
students were already achieving. But NCLB required all states to ensure that every student was
proficient by 2014, where the definition of proficiency is left to the states to decide. This
requirement changed the nature of state standards. States that chose lofty standards suddenly
found themselves with much more ambitious requirements.
The differences across the states are easiest to see in Figure 1. This figure, reproduced
from McCombs and Carroll (2005), uses the NAEP definition of proficient (which itself is
generally judged to be a high standard) to provide a uniform performance standard across the
states. It then compares the proportion of students meeting NAEP proficiency with the
proportion meeting the state-defined level of proficiency. The simple fact is that the state
standards vary widely in their stringency as seen by the randomness of state proficiency outcomes
in the figure.13
The process of defining state standards varies across the states, but they seldom involve
legislative action and never involve any state constitutional language about what is required.
Thus, when adequacy suits are pinned to the state proficiency levels, it is important to consider
where the standards came from and how to interpret them.
13 Peterson and Hess (2005) conduct a similar exercise for the different grades and subjects in NAEP. While the states differ some on the individual tests, they are generally quite consistent across tests.
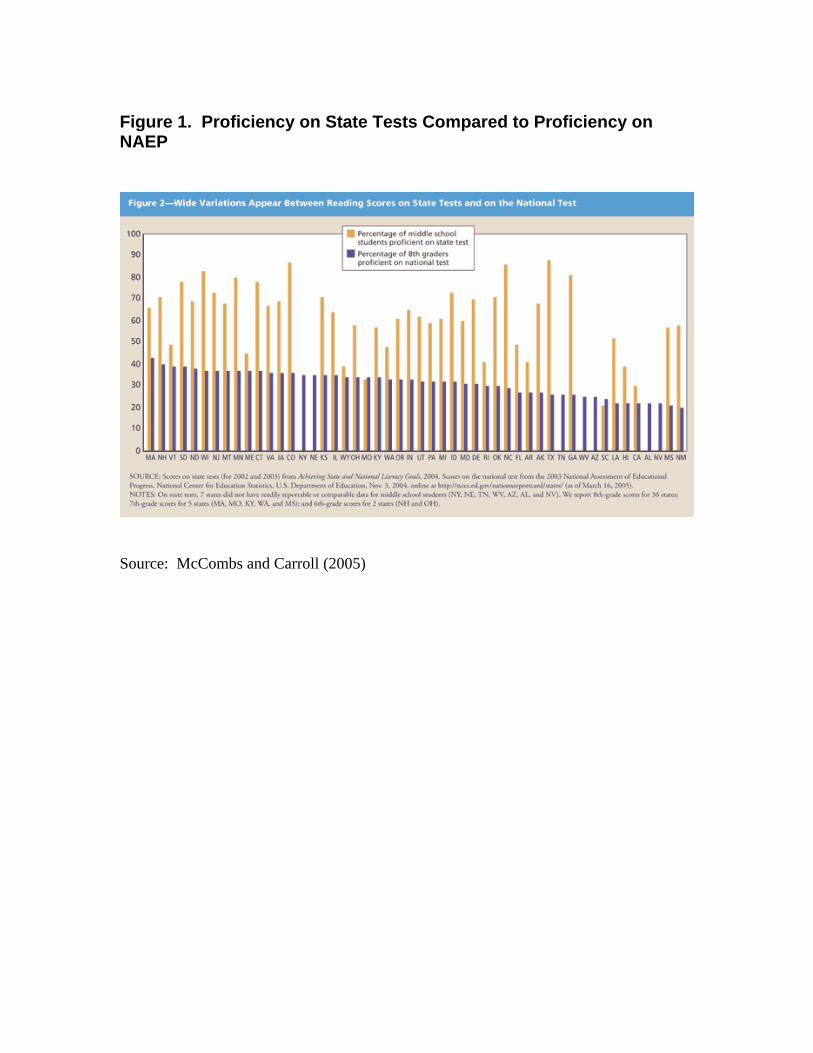
Figure 1. Proficiency on State Tests Compared to Proficiency on NAEP
Source: McCombs and Carroll (2005)
11
Costing Out Approaches
Several different approaches have been developed to answer the question, ‘how much
would it cost to make all students achieve proficiency?’ These approaches differ in significant
ways, but they share one common feature – none can provide a valid and reliable answer to this
question.
There is little scholarly research on these analyses. A small number of firms have
conducted contract work with organizations in specific states. These analyses are, however, very
similar across states and across firms applying a common approach. In each case, it is also true
that the common nomenclature for each is itself misleading and does not accurately reflect the
underlying approach to obtaining a cost estimate.
Perhaps the most commonly applied approach is the “professional judgment” method.14
With a few nuances, the underlying method involves convening a panel of educators – teachers,
principals, superintendents, and other education personnel – and asking them to develop an
educational program that would meet certain specified outcome standards. Their efforts typically
produce “model schools” defined in terms of class sizes, guidance and support personnel, and
other programs that might be necessary. The analysts running the process then provide elements
missing from the model schools (e.g., central administration costs or computers and materials)
and employ externally derived cost factors (e.g., average teacher or principal salaries) to the
model schools. Depending on the details of the panel activities, the panels may or may not
provide guidance on the extra resources for disadvantaged children, special education, or the like.
An alternative but similar approach directly substitutes the judgment of the analysts
themselves for the judgments of the professional panels. This approach has been immodestly
14 Examples of this (coupled with the leading groups applying the methodology) include Augenblick & Myers (2002), Augenblick et al. (2002), Augenblick Palaich and Associates (2003), AIR/MAP (2004), Picus, Odden, and Fermanich (2003), and Verstegen and Associates (2003).
12
called the “state of the art” approach by the primary firm associated with it.15 At other times,
building on the mantra of educational policy, the consultants refer to it as the “evidence-based”
method. The consultants sort through available research, select specific studies that relate to
elements of a model school, and translate these studies into precise implications for resources in
schools. It is advertised as applying research evidence to develop a set of model schools that are
subsequently costed out in the same manner as the professional judgment model schools.
Neither of the previous methods makes any use of the actual spending and achievement
experiences of districts in the specific state. The remaining two approaches rely on data from the
schools and districts in a state.
The “successful schools” model begins by identifying a subset of the schools in a state
that are effective at meeting educational goals. (Note that this is also conducted at the district
rather than the school level). The identification of successful schools may use differing
methodologies but typically concentrates on student achievement, possibly but infrequently with
some allowance for the background of students.16 Spending on special programs – say, remedial
education or special education – is stripped out of budgets in the successful schools in order to
obtain a “base cost” figure for each district. Typically, then, the base costs for a portion of these
schools – derived from excluding some number of schools in the tail of the distribution that are
presumed to be outliers – are averaged to develop a level of spending that can feasibly yield
effective performance. To get the full costs of the school, expenditures on special programs are
then added back, based on the distribution of students with such special needs for each school.
The “cost function” approach, sometimes referred to as the “econometric” approach, also
uses the experiences of the state’s schools in terms of spending and achievement to derive what
different levels of achievement would cost according to the available observations on the current
practices of schools. The exact methodology, while invariably involving a series of complicated
15 See Odden, Fermanich, and Picus (2003). 16 See, for example, Augenblick and Myers (1997), Myers and Silverstein (2005) and Standard & Poor’s School Evaluation Service (2004).
13
statistical steps, differs in its application across states but has similarities to the successful schools
analysis in terms of attempting to characterize districts that are meeting desired achievement
standards. Through statistical methods, the approach estimates how spending is affected by
different student outcome levels and different student characteristics – which in turn can be used
to derive the spending for different districts attempting to meet different performance levels. This
approach may or may not attempt to distinguish between efficient and inefficient producers of
outcomes, i.e., between districts that spend more for some given level of achievement than
others.17
As explained below, each name is but a nom de guerre, employed to market methods as
serious scientific approaches to costing out adequacy. In reality, each method suffers from very
serious shortcomings, and each fails to provide a reliable or scientific way to estimate the
necessary expenditures for achieving prescribed levels of outcomes.
Matching Analytical Requirements with Application
Each of the approaches to determining the costs of an adequate education has some
surface appeal, but their validity and reliability depends on their treatment of a number of key
steps. Here we match methods with their treatment of issues.
Definition of Outcome Standards. The outcome standards that are considered clearly
should have a significant impact on the analysis of costs. For example, bringing all New York
State students up to the level of having an elite diploma (a New York State Regents Diploma) is
one of the loftiest goals of any state in the nation.18 This standard is clearly different from the
constitutional requirement which, by the interpretation of the Court of Appeals, was a sound basic 17 Gronberg et al. (2004) explicitly analyzed efficiency of districts, but this analysis was not well-received in the courtroom; see the decision of Judge John Dietz in West Orange-Cove Consolidated Independent School District et al. v Neeley et al., No. GV100528 (Dist. Ct. Travis County, Texas, Nov. 30, 2004). 18 New York State traditionally had two different diplomas with varying requirements. In 1996, the New York Regents determined that all students would have to qualify for a Regents Diploma (the previously optional high standard undertaken by roughly half of the students in New York State). This requirement has had a long phase-in period with altered testing requirements.
14
education – a standard explicitly below the Regents Diploma. The difficulty is that different
outcome standards frequently co-exist and in fact have proliferated since the movement of states
to more comprehensive accountability systems.
The choice of standards is a political decision, reflecting a variety of factors. In many
instances, the state department of education or the state board of education promulgates its
standards, but they are not necessarily the views of the elected officials in the executive or
legislative branches of the state. More importantly, these standards rarely bear any relationship to
constitutional standards, which are often phrased in broad generalities. Nor are they the same as
the mandatory standards that might exist under state or federal accountability standards.
Quite clearly, decisions about the standards that should be applied are not within the
purview of hired researchers who are doing the costing out studies. But, given that many costing
out studies are commissioned and paid for by parties with a position on what they would like the
answer to be and an understanding of the political import of the results, neither should the
definition of outcome be left to the organization that contracts for the study to be done.
None of the extant methods for costing out adequacy avoids this issue. Each must
explicitly or implicitly base estimation on a definition of outcomes, but this definition requires
political judgments that are seldom introduced.
Let’s take some examples. The New York City adequacy suit, after a full round of legal
decisions, was remanded to the lower court to determine a final judgment on actions to deal with
the constitutional failure of the extant system. The plaintiff in the case, the Campaign for Fiscal
Equity, hired two consulting firms (AIR/MAP (2004)) to cost out an adequate education in New
York City under the New York State constitutional requirement for providing a “sound basic
education.”19 This group of consultants chose to evaluate the costs of meeting the Regents
Learning Standards that all children in New York should get a Regents Diploma. The Governor’s
commission adopted a lower standard in its estimation of costs, conducted with Standard & 19 Details of the costing out exercises in the CFE case can be found in Hanushek (2005).
15
Poor’s School Evaluation Service (2004). The judicial referees, who were appointed by the court
to advise it on the appropriate decision, simply ignored differences in the standards for cost
estimation and were pleased by the consistency of the estimates – even though they used different
outcome standards and should not have been the same according to by the logic costing out
(Hanushek (2005)). They even went on subsequently to recognize that the highest court said that
the Regents Learning Standards were inappropriate, even as they ignored this in terms of the cost
estimates.20
Take the studies commissioned in Kentucky. Three separate studies were conducted by
two firms: Verstagen and Associates and Picus and Associates (who conducted parallel studies
using a professional judgment and a “state of the art” approach). Picus and Associates (Picus,
Odden, and Fermanich (2003)) are generally willing to let their professional judgment panels
define what the vague seven constitutional requirements of education laid down by the Kentucky
Supreme Court meant as long as fully met by 2014.21 Verstegen and Associates (2003), on the
other hand, call for these along with an extensive set of input and process requirements included
in the current Kentucky school regulations.
Or take Augenblick et al. (2002) in Kansas. This analysis, which was subsequently
written into the judgment of the Kansas State Supreme Court, provides the following insight into
the consultant’s role:
20 John D. Feerick, E. Leo Milonas, and William C. Thompson, Report and Recommendations of the Judical Referees” (CFE, Nov. 30, 2004). 21 The instructions of what is needed given to the panelists were: Sufficient oral and written communication skills to enable students to function in a complex and rapidly changing civilization; Sufficient knowledge of economic, social and political systems to enable the student to make informed choices; Sufficient understanding of governmental processes to enable the student to understand the issues that affect his or her community, state, and nation; Sufficient self-knowledge and knowledge of his or her mental and physical wellness; Sufficient grounding in the arts to enable each student to appreciate his or her cultural and historical heritage; Sufficient training or preparation for advanced training in either academic or vocational fields so as to enable each child to choose and pursue life work intelligently; and Sufficient levels of academic or vocational skills to enable public school students to compete favorably with their counterparts in surrounding states, in academics or in the job market.
16
A&M worked with the LEPC [Legislative Education Planning Committee] to develop a more specific definition of a suitable education. We suggested using a combination of both input and output measures. For the input measures, it was decided that the current QPA [Quality Performance Accreditation] requirements would be used, along with some added language provided by the LEPC. This additional language included vocational education as a required course offering, and identified other programs and services that might be provided as part of a suitable education. Next we set the performance measures that would be used. Again, A&M worked with the LEPC. Together we determined which content areas and grade levels would be used. The math and reading tests are given in the same grade levels every year, the writing, science and social studies tests are given in alternating years. A&M felt that the reading and math tests, which are given every year, gave us the most flexibility in setting the output measures.
Perhaps more interestingly, the definition of adequacy is not always related to outcomes.
In North Dakota, Augenblick Palaich and Associates (2003), the successor firm to Augenblick
and Myers, noted that the state did not have explicit outcome standards but instead had input
requirements. For their analysis, however, they layered on a set of outcomes that were related to
state goals under No Child Left Behind. (Of course, if one were just interested in providing a
well-defined set of inputs and did not have to worry about the relationship with student outcomes,
it would be easy to calculate the level of “adequate” funding).
Duncombe, Lukemeyer, and Yinger (2004) analyze the impacts of different goals on the
estimated costs under alternative estimation approaches. They demonstrate that reasonable
differences in the loftiness of the educational goal can lead to 25 percent differences in estimated
costs within their own estimation approach and 50 percent differences across alternative
estimation approaches including the professional judgment approach.
The organizations commissioning different costing out studies appear to recognize the
importance of the standard chosen. The application of any standard, particularly in the
professional judgment approach, is typically left vague and up to the interpretation of the
individual panel members. Clearly, arbitrary choices of objectives yield arbitrary estimates of
costs. The courts on the other hand seldom focus on the standard employed by the consultant and
instead tend to grasp onto the cost identified.
17
The appropriate outcome standard clearly differs by purpose, and a variety of people
enter into the definition in varying circumstances. But in the judicial adequacy deliberations, it is
simply inappropriate to divorce these definitions from the democratic policy process and to deed
it over to consultants and interested parties.
Empirical Basis. The school systems in each state generate information about the
relationship between current spending and achievement, but this is seldom easy to interpret.
Different school districts have different advantages in terms of the clientele that they serve, and
different districts make different choices about curriculum, programs, and personnel. These
interact with spending decisions, often leading to little obvious relationship between resources
and achievement.
The interaction between actually observations and the costing out methodology is
best seen in a candid statement in Augenblick & Myers (2002) that is also repeated in
most of their other studies:
The effort to develop these approaches stems from the fact that no existing research demonstrates a straightforward relationship between how much is spent to provide education services and performance, whether of student, school, or school district.
In the absence of such a simple relationship, and in light of the fact that
some people believe that there is no clear association between spending and performance, four rational approaches have emerged as ways to determine a base cost level: (1) the professional judgment approach; (2) the successful school (district) approach; (3) the comprehensive school reform approach; and (4) the statistical approach.
In other words, the beauty of the various methods is that they do not require any basis in the
empirical reality of the specific state or, more generally, any state. The professional judgment
panels or the state-of-the-art researchers are free to declare anything without worry about being
contradicted by the data.
The professional judgment panels employ professional educators to develop programs
and model schools, but there is never any indication given that the members of these panels have
18
any particular relevant expertise in terms of a knowledge of the extant research base, of an
understanding of outcomes either inside or outside of their own locality, or of the impacts of
varying amounts of resources, particularly when outside of their own experiences. Indeed, no
indication is generally given of the selection criteria for panelists. Were they chosen because they
came from particularly innovative or high quality districts? Were they chosen because of
previously expressed views on programs or resources? Or were they just the subset of a larger
invited group representing those willing to attend a weekend session in exchange for some added
pay?
The consultants seldom know any of the education personnel in the state, so they
obviously need to solicit nominations – generally from the organization commissioning the study.
But, since these organizations generally have a direct interest in the outcomes of the study, it
seems unlikely that they will produce a random selection of educators to serve on the professional
judgment panels. The nature of the selection process ensures that the judgments of any panel
cannot be replicated (a fundamental concern of any truly scientific inquiry).
But reality is worse than that. The educators recognize by the nature of the exercise that
their input to the process may have an impact on their future well-being. This bias and conflict of
interest is most apparent in the case of highly publicized court cases, such as that in New York
City where the professional judgment panels were employed to suggest a remedy to an already
decided liability (Hanushek (2005)). It is nonetheless also generally present when educators are
asked to develop a wish list of what they might like in their schools and districts. As noted in
Massachusetts, “A review of the study (ex. 35[the professional judgment study by Dr.
Verstegen]) suggests that the resource needs identified represent to some extent a wish
19
list of resources that teachers and administrators would like to have if they were creating
an ideal school with no need to think about cost at all.”22
The lack of any empirical linkage described in Augenblick & Myers (2002) is precisely
true for the professional judgment work and close to true for the state-of-the-art work. The
empirical basis of the state-of-the-art analyses is a small number of selected research studies that
relate to some schooling experiences, although not the experiences in the individual state. And,
most importantly, because these are highly selective studies from the research base, there is no
reason to believe that they reflect the empirical reality anywhere.
The successful schools analysis uses information on a selected subset of the schools and
performance in the state. The identification and selection of the successful schools is obviously
an important step. Simply taking high performing schools defined by the level of student test
scores and other outcomes is inappropriate, because performance is affected by a host of
nonschool factors including family background, peers, and prior schooling experiences. If these
other factors are ignored, the interpretation of the observed spending-achievement relationships in
the successful schools or successful districts is entirely unclear, because there is no sense that the
relationship is causal or could be reproduced by simply altering the spending of a district.
The various cost function estimation approaches explicitly rely on the spending and
achievement of the schools in a state, thus appearing to be closer to actual schooling experiences.
But, the key to interpreting these remains whether or not they have adequately identified the
causal relationship between student performance and spending.
22 Exhibit 35 is the professional judgment study of Dr. Verstegen. The judgment goes on to note: In this regard, as the defendants’ witness Dr. Robert Costrell pointed out, if Dr. Verstegen’s professional judgment model is applied to the comparison districts of Brookline, Concord/ Concord-Carlisle, and Wellesley, it appears that none of the three is spending enough to provide an adequate education. Dr. Costrell could identify only five school districts in the Commonwealth that are spending at a level that would be considered appropriate according to the Verstegen model (see ex. 5449), and none of the five is included in Myers’ 75 “successful school” districts.” This latter point reappears elsewhere, as noted in the analysis below. See trial record in Hancock , et al v. Commissioner of Education, et al, 882 N.E.2d 1134 (2005).
20
A simple way to understand these cost function estimates is to begin with the closely
related estimation contained in the extensive educational production function literature. A wide
range of past studies – as underscored by Augenblick & Myers (2002) above – have looked for a
relationship between resources and achievement. This work involves estimating the statistical
relationship between achievement and a series of individual characteristics along with various
measures of the resources available. This research has generally found little in the way of a
consistent relationship between spending and student outcomes, and moreover almost all
estimates that suggest such a resource-achievement relationship typically show a very small
impact of resources on student outcomes (Hanushek (2003)). If one were to take the estimates of
the impact of resources from these, there would be the immediate implication that large amounts
of resources were needed to obtain a noticeable achievement gain (again, because resources have
a very small impact on achievement).
But now consider cost function estimates, which generally involve a statistical
relationship between spending as the dependent variable and achievement and characteristics of
the student population as the explanatory variables.23 This analysis essentially moves spending
from the right hand side of the equation to the left, and achievement to the right.24 If the
estimated impact of spending on achievement is small, this simply reverses it to indicate that it
takes a lot of spending to obtain a little more achievement. But, they have not necessarily
identified the cost, or expenditure that is required, to obtain any outcome. They have only
indicated that the current pattern of spending is not very productive, exactly like the more
extensive production function estimation.
23 Note that these estimates bear little relationship to classic cost functions in microeconomic theory that would use an underlying assumption of optimal firm behavior to translate the production function (achievement as related to various inputs) into a cost function that describes how cost relates to the prices of inputs. None of the work in education observes any variations in input prices (e.g., teacher wages, textbook costs, and the like). The empirical work in education described here relates spending to outputs and inputs such as the number or type of teachers, the poverty rate, and so forth. 24 Some approaches to cost estimation are not done in this way but instead use various optimization methods to obtain the minimum cost of achieving some outcomes. They are nonetheless subject to the same interpretative issues about causation.
21
This estimation is directly related to the production function estimation. It is given new
clothing of being a “cost function,” but it simply describes the existing spending patterns across
districts with different achievement levels.25 The expenditure function does not indicate the
minimum expenditure (or cost) of achieving any achievement level but instead identifies average
spending behavior.
Treatment of Inefficiency. It seems quite clear, and the evidence supports the case, that
not all school systems use their funds as effectively as others. This fact raises a serious problem
if one studies spending to get at the cost of an adequate education. Should the starting point
simply be the current spending, accepting whatever is being done, or should there be some
attempt to deal with the inefficiency issue?
The idea of inefficiency was bizarrely addressed by the referees in the New York City
case. The plaintiffs offered the estimates of AIR/MAP (2004), while the State, using the much
lower estimates of Standard & Poor’s School Evaluation Service (2004), had suggested that it
was reasonable to concentrate on the spending patterns of the most efficient of the successful
schools – those that did well in student performance terms with lower expenditure. They thus
excluded the top half of the spending distribution by successful districts in their calculations. But
when the Referees attempted to reconcile the State’s recommendation of $1.9 billion with the
AIR/MAP estimates of over five billion dollars, they insisted on adding in all the high-spending
districts, even when such districts did not produce better academic outcomes. After all, the
Referees reasoned, “there was no evidence whatsoever indicating that the higher spending
25 There are some serious statistical complications in this work. The econometric methodology places requirements on the modeling that are almost certainly violated in this estimation. The cost function estimation essentially assumes that districts first specify the outputs they will obtain and that this chosen achievement level and the characteristics of the student body determine the spending that would be required (i.e., achievement is exogenous in statistical parlance). This approach, while summarizing the average spending patterns of different districts, is inconsistent with the interpretation that the level of resources available to a district determines student outcomes. The specific data and modeling are also very important. As Gronberg et al. (2004) state, “The measurement of efficiency in producing a set of outcomes is directly linked to the particular set of performance measures that are included in the cost model and the particular set of input measures.”
22
districts . . . were in fact inefficient.”26 In other words, spending more to achieve the same
outcomes should not be construed as being inefficient. One might then ask ‘what would indicate
inefficiency?’
The importance of this is immediately obvious. If spending must be sufficient to bring up
achievement regardless of how efficiently resources are used, the answer is likely to be a very
large number.
The deeper conundrum is that the courts cannot simply rule that districts should spend
money well, particularly when the districts have no past experience with using resources well.
Thus, if courts are restricted just to dictating spending levels, they are confronted with having to
decide how to treat the inefficiency that is built into the conclusions built on the empirical
evidence for a state. Dealing with such issues is generally far beyond the expertise of the courts.
Minimum costs and trade-offs. As noted, the cost concept that is applied for policy
decisions should give minimum cost necessary to achieve any given outcome. This precept
would require that cost estimation be built on the joint consideration both of program
effectiveness and of costs. But, return to the professional judgment or the state-of-the-art
approach. Each takes the view that only effectiveness should be considered, assuming that
anything that is effective will be funded at whatever it takes. This specifically violates any notion
that there are alternatives that might have different costs.
The professional judgment panels are generally instructed at the beginning of the process
not to consider where the revenues would come from or any restrictions on spending. In other
words, dream big – unfettered by any sense of realism or trade-offs. (Indeed, one motivation for
taking adequacy cases to the courts is that the democratic appropriations process necessarily takes
these matters into account – and the courts might be induced to avoid them). But those
instructions to the panels apparently do not always work to the satisfaction of consultants and
26 John D. Feerick, E. Leo Milonas, and William C. Thompson, Report and Recommendations of the Judical Referees” (CFE, Nov. 30, 2004).
23
clients. As Augenblick Palaich and Associates (2003) state about the operation of the
professional judgment panels in North Dakota, “Finally, we should say that the members of all of
the panels behaved in a way that can best be described as parsimonious. . . . . We worked hard to
push people to identify resources they thought were needed to help students meet state and
federal standards in spite of their natural tendency to exclude items because local voters might not
approve of them or schools could “get by” without them.” This process, more openly
acknowledged in this case than in others, hardly suggests a quest for the minimum expenditure
needed to achieve an outcome.
Similarly, AIR/MAP (2004) used a two stage panel process where a super-panel was
given the various inputs of the separate panels and could, input-by-input, aggregate across the
panels. This process ensures that any trade-offs between programs and resources of the
individual panels are lost, and the process essentially arrives at the maximum resource usage
sketched by the panels and not the minimum resource usage.
But perhaps none is as clear as that apparent in an oft-repeated discussion in the state-of-
the-art analyses. Allan Odden, before he began consulting on costing out studies, wrote that
educational policy should recognize that improved performance could be obtained by redirecting
existing expenditures and did not have to rely on added expenditure. Such an answer does not
square with the orientation of many organizations purchasing costing out studies, which are
uninterested in an answer that current resources are sufficient. (If so, they would be unlikely to
incur the expense of a costing out study). This incongruence of past perspectives and funders’
objectives apparently leads to their standard disclaimer (Odden, Fermanich, and Picus (2003)):
Odden (1997) identified the costs of seven school wide designs that were created by the New American Schools. In subsequent analyses he showed how via resource reallocation, they were affordable at schools spending at the average or median level of expenditure per pupil in the United States (Odden & Busch, 1998; Odden & Picus, 2000). His analysis, however, did not include adequate planning and preparation time for teachers and did not standardize costs across various designs, so his 1997 cost figures are underestimated.
24
The standardization across designs refers specifically to the fact that some whole school models
require less expenditure than others. The state-of-the-art costing out studies proclaim that in such
a case one should use the maximum expenditure level for any of the models.
The expenditure function approach with few exceptions simply traces out the past
spending of districts. Thus, unless one can assume that all districts are spending money wisely –
an assumption broadly contradicted by existing research – these estimates cannot be interpreted
as tracing out the minimum costs.27
Currently Feasible Outcomes. States have developed, as noted in Figure 1, varying
goals, but many of the goals have not been thoroughly tested in the sense that it is known how to
reach them. Indeed, as mentioned previously, it is popular to link costing out studies to achieving
the goals of No Child Left Behind, even if NCLB is generally not an obvious constitutional
requirement. Do any of the estimates indicate that these standards can be met with the programs
they are investigating?
The professional judgment approaches assumes that, because the goal was given to the
panel at its inception, the panelists have in fact come up with a model school that will produce the
desired results. None of the reports ever discusses this or evaluates that possibility. In fact, just
the opposite. When the reports are produced, there is generally a disclaimer that indicates there is
little reason to expect that students will actually achieve at these levels. Take, for example, the
statement in the New York City study (AIR/MAP (2004)):
It must be recognized that the success of schools also depends on other individuals and institutions to provide the health, intellectual stimulus, and family support upon which public school systems can build. Schools cannot and do not perform their role in a vacuum, and this is an important qualification of conclusions reached in any study of adequacy in education. Also, success of schools depends on effective allocation of resources and implementation of programs in school districts.
27 Other techniques found in the scholarly literature have been developed to consider cost minimization (see Hanushek (2002)). Even when considered, the problem is that it is generally impossible to describe how efficiency is achieved (see Gronberg et al. (2004)).
25
This “warning label” contrasts sharply with the extraordinary claim in the November
2002 AIR/MAP proposal that their study would answer the question, “What does it
actually cost to provide the resources that each school needs to allow its students to meet
the achievement levels specified in the Regents Learning Standards?”
The state-of-the-art approach purportedly relies on evidence about effectiveness
of different approaches. The research basis is generally whether the authors can find a
study that shows a statistically significant impact of some resource on some outcome
(see, for example, Odden, Fermanich, and Picus (2003)). No apparent consideration is
given to the magnitude of the estimated relationship or the expense involved. In reality,
little evidence is directly cited or included in their report, with considerable weight being
placed on unrefereed research. Where there are citations, they demonstrate a highly
selective choice of studies and evidence, generally picking a particular study and
estimated effect from a much larger range of estimates. None of this process meets
scientific standards.
But, even within that group of selective analyses, there is no attempt to provide
estimates of the quantitative effect on outcomes of the changes in inputs and programs
that they propose. For example, the recommendation of across-the-board reductions in
class size at different grades that pervade the state-of-the-art reports rely on analyses that
estimate the impact such reductions might be expected to have – and these impacts do not
come close to taking the systems they analyze to fully meeting the NCLB standards
(Hanushek (1999)). Many of the other “research-based” recommendations lack any
credible estimates of the impacts of the programs. This lack of evidence perhaps explains
that total absence of any effort to relate the specific “state-of-the-art” recommendations to
outcomes.
The successful schools approach is fully rooted in the current operations of a
state’s schools. Therefore, it can at best say something about meeting the generally high
26
goals of NCLB that tend to motivate court arguments only if some subset of schools is
currently achieving the full standards. But that appears to be unlikely. And, there is no
way to extrapolate from the currently observed outcomes of schools to a new level that is
outside the range of observations on outcomes. Specifically, assume for illustration that
the set of schools identified as successful has 70-80 percent of students reaching
proficiency (which is perhaps well within current standards), there is no way to
extrapolate these results to a 95 percent proficient standard.28
The cost, or expenditure function approach relates spending to student
performance and student characteristics. Two factors are relevant. First, it interpolates
the spending differences among very disparate districts. Thus, when there are large
differences in the proportions of disadvantaged students as there are in New York State
(the site of analyses by Duncombe, Lukemeyer, and Yinger (2004)), it relies strongly on
the functional form of the underlying statistical relationship that connects the
observations of districts. Second, and more important, it does not observe districts that
achieve the levels of success that are considered in the evaluation of adequacy, leading to
reliance on a simple linear extrapolation of the current observations of schools with no
reason to believe that this will achieve the given ends. This problem is exactly analogous
to the situation above with the successful schools analysis. The problems with
extrapolation for success in lower-SES schools, identified for the successful schools
approach, also hold in the cost function work.
Arbitrariness of Estimates. The choice of approach for costing out is generally
determined by the party requesting the work to be done. It appears that it might be a quite
28 A second extrapolation problem frequently occurs. When successful schools are identified by just proficiency levels on state tests, the schools identified as successful tend to be higher-SES schools where the parents have provided considerable education to the students. The methodology concentrates on base spending for a typical successful school but then must indicate how much remedial spending would be necessary to bring schools with students of lower-SES backgrounds up to the proficiency of the higher-SES schools. The appropriate way to do this is entirely unclear, because again the situation is largely outside of the observations going into the successful schools analysis.
27
purposeful strategic choice, given that many costing out studies are funded by parties with an
interest in the outcome of the study (e.g., see Hanushek (2005)). For example, a review of the
prior analyses of Augenblick and associates in four other states where they applied both
professional judgment and successful schools methods found that the professional judgment
method yielded systematically higher estimates of “adequate” expenditure (Education Week
(2005)). This apparently has influenced the choice of methodology by clients.29
A compilation of the estimated per pupil expenditure for an adequate education across
states and studies provides a clear indication of the arbitrariness of the estimates ((Education
Week (2005)). Even after adjusting for geographic cost differences across states and putting the
estimates in real terms for 2004, the estimates differ by more than a factor of three. It is difficult
to imagine what true underlying differences across states could drive such differences, given that
schools across the states look as similar as they do and use similar curricula, approaches and the
like. But, it is consistent with providing politically palatable estimates for the different state
deliberations.
If the methods systematically produce very different results when addressing the same
question, they obviously cannot be taken as a reliable and unbiased estimate of the resource
requirements.
Developing costs. An integral part of all of the approaches in arriving at a cost number is
employing the current average spending of schools – generally with important modifications – to
figure out what resources a new configuration would require. The average spending gives little to
no information about key elements of what true costs might be for quality improvements in
29 For example, Thomas Decker describes the choice of professional judgment model for the costing out study to be commissioned by the North Dakota Department of Public Instruction: “The professional judgment approach we were aware would probably produce a higher cost estimate for achieving adequacy than successful schools.” Williston Public School District No. 1, et al v. State of North Dakota, et al, Civil No. 03-C-507 (Dist. Ct., N.W. Jud. Cir. 2003 (Transcript of Deposition of Thomas G. Decker, August 17-18, 2005, p. 312).
28
student outcomes. While some of the choices sound reasonable, they clearly introduce an
arbitrariness that has truly significant impacts on the resulting cost estimates.
If one wished to raise teacher quality, what would it cost? Clearly, the average salary that
is determined by the distribution of teachers of different experience levels and different amounts
of academic training cannot answer that question. What it would cost to improve teacher quality
also depends markedly on whether one reproduces the current single salary schedule that does not
recognize differences in quality or whether one contemplates a different pay and incentive
scheme.
It also depends on whether currently ineffective teachers can be replaced or whether it is
necessary to wait until ineffective teachers decide to leave teaching. By considering just policies
that involve adding resources to the current spending, the situation could in reality get worse. If
all teachers, regardless of quality, are paid more, all teachers – including low quality teachers –
will have an incentive to remain teaching, and the ability to improve overall quality through
replacement could become more difficult.
Such delineations of policy alternatives make it clear why the current typical behavior of
a school district may not accurately indicate what improvements would cost if resources were
used more effectively. It also underscores the difficulties of considering what can be done by
only adjusting the funding of schools, and not considering other, more structural reforms.
The calculation of salaries is then a particularly interesting point of comparison across
different studies. Sometimes the consultants simply use the average salaries for existing teachers
(e.g., Odden, Fermanich, and Picus (2003)); other times they arbitrarily increase them by some
amount (e.g., 10 percent in North Dakota in Augenblick Palaich and Associates (2003) and 18
percent in Arkansas in Odden, Picus, and Fermanich (2003)), vaguely arguing in terms of what
other states spend; other times the bonus gets very high such as the 54 percent advocated for New
York City by Duncombe, Lukemeyer, and Yinger (2003) based on a regression comparison for
29
New York districts in which New York City is a clear outlier in many of the dimensions of
“uncontrollable” things such as density, poverty, and juvenile crime rates.
While the widely varying teacher salary factor has obvious and powerful effects on any
cost estimates, none of these studies provides any evidence about the current quality of the
teachers. Nor is there any research that relates teacher salary to quality in terms of ability to raise
student achievement. So this becomes a whimsical adjustment based on the consultant’s vague
sense of whether average salaries are high enough or not (for some unspecified quality level).
And, if they say they want to improve teacher quality, they simply increase the average salary by
some arbitrary percentage.
Staying with existing structures and incentives – pervasive in all of the methodologies –
makes the reliance on average spending for the components not specifically identified particularly
dubious. For example, it is common to take existing central office and administrative expenditure
as given and necessary.
The logic of developing estimates of the minimum cost of providing an adequate
education calls for making decisions with an understanding both the cost and the effectiveness of
various inputs. The protocols of the costing out studies ensure that such decisions are never
considered.
More Accurately Naming the Approaches As with many of the concepts and ideas in school finance deliberations, the nom de
guerre for each of the methodologies engenders confidence in the work but it is a misplaced
confidence. None of the names is accurate.
The professional judgment model relies on professional educators but they generally lack
any expertise in designing programs to meet objectives outside of their experiences. While they
may have experience making trade-offs within current budgets, they do not have the research
knowledge or personal experience to know how resources will change if they design a program
30
for much higher student outcomes or of student body compositions that are outside their
experiences. But, most importantly, they are asked to participate in a study where the outcomes
of the study might directly affect their own pay, working conditions, and school situation, thus
providing an incentive for them to distort whatever answers they might have. Thus, a much more
accurate name of this approach is the educators’ wish list model.
The state-of-the-art, or evidenced-based, model makes little effort to assess the
accumulated evidence on different aspects of schooling. Instead, the highly selected evidence
leads not to a scientifically grounded model but instead to the consultants’ choice model.
The successful schools model begins with the identification of schools that are meeting
some performance standard and then calculates the costs in an efficient subset of these successful
schools. However, when the basis for judging school performance is the level of student
achievement, the resulting subset of schools conflates the various reasons why achievement may
be high including family background and other peers in the schools. By relying on the observed
performance for the “successful” set of schools, it has no way to project the results to any higher
performance level. This approach is better labeled the successful students model, because it does
not separate the success or failure of the school from other factors.
The cost function approach is designed to trace out the minimum costs for obtaining
given outcomes. Unfortunately, this is true only if all school districts are operating efficiently – a
situation that is known not to exist. These approaches capture the expenditure function for
schools by identifying the average spending of districts with different achievement levels and
student characteristics. They do not trace out the necessary cost of given performance levels, and
thus cannot show the costs of an adequate education.
Evidence on the Results
The approaches to costing out produce an estimate of the resources required to achieve an
adequate education. For a variety of reasons, it is difficult to link these efforts to any results.

31
First, courts and legislatures seldom faithfully enact the consultants’ dreams. Second, the
consultants generally counsel not to take the results too seriously (see the AIR/MAP disclaimer
above).30
Augenblick Palaich and Associates (2003), p. II-3, go further in their analysis of North
Dakota schools to discuss a lack of empirical validation of the professional judgment work. “The
advantages of the approach [professional judgment] are that it reflects the views of actual service
providers and its results are easy to understand; the disadvantages are that resource allocation
tends to reflect current practice and there is only an assumption, with little evidence, that the
provision of money at the designated level will produce the anticipated outcomes.” [italics added]
While they did not look at the evidence, it is clearly possible to do so in this case and in
many other such costing out exercises. The authors use the professional judgment results to
prescribe the spending for each of the K-12 districts in North Dakota in 2002. Two points are
important. First, there is a wide variation in the calculated needs of districts. Second, a number
of districts were spending more in 2002 than the consultants (through their professional judgment
panels) thought needed to achieve the full 2014 performance levels.
Because we have student performance information in North Dakota for 2002, we can see
how performance is related to the fiscal deficits and surpluses that they calculate. It seems
natural to think that districts with surplus expenditures are indeed performing above their
achievement goals. It is also plausible to think that districts with smaller fiscal deficits are closer
to achievement goals than those with larger fiscal deficits. (Note that the methodology and its
application are designed to account for any different resource demands arising from the
concentration of a disadvantaged population, school size, and the like – implying that
consideration of simple, bivariate relationships of deficits and performance are appropriate).
30 This admonition is particularly strange in the state-of-the-art approach, however. They claim to have chosen best methods based on research and evidence. If that is the case, shouldn’t it be mandated for all districts?
32
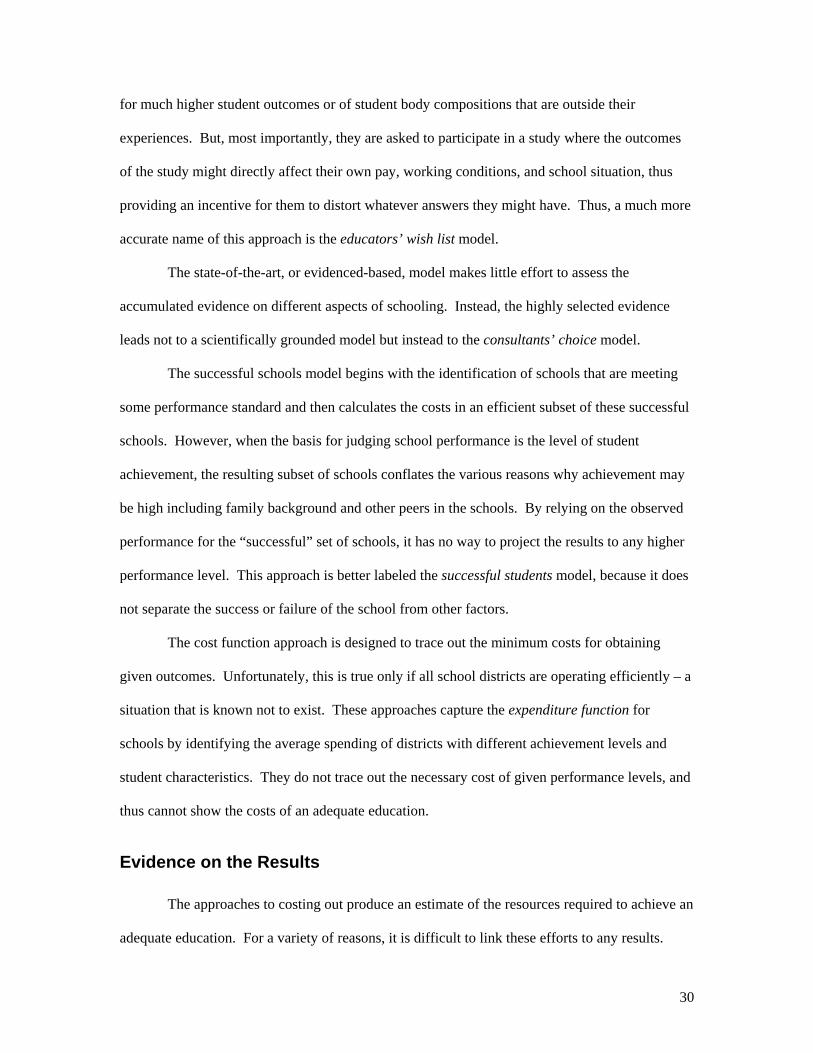
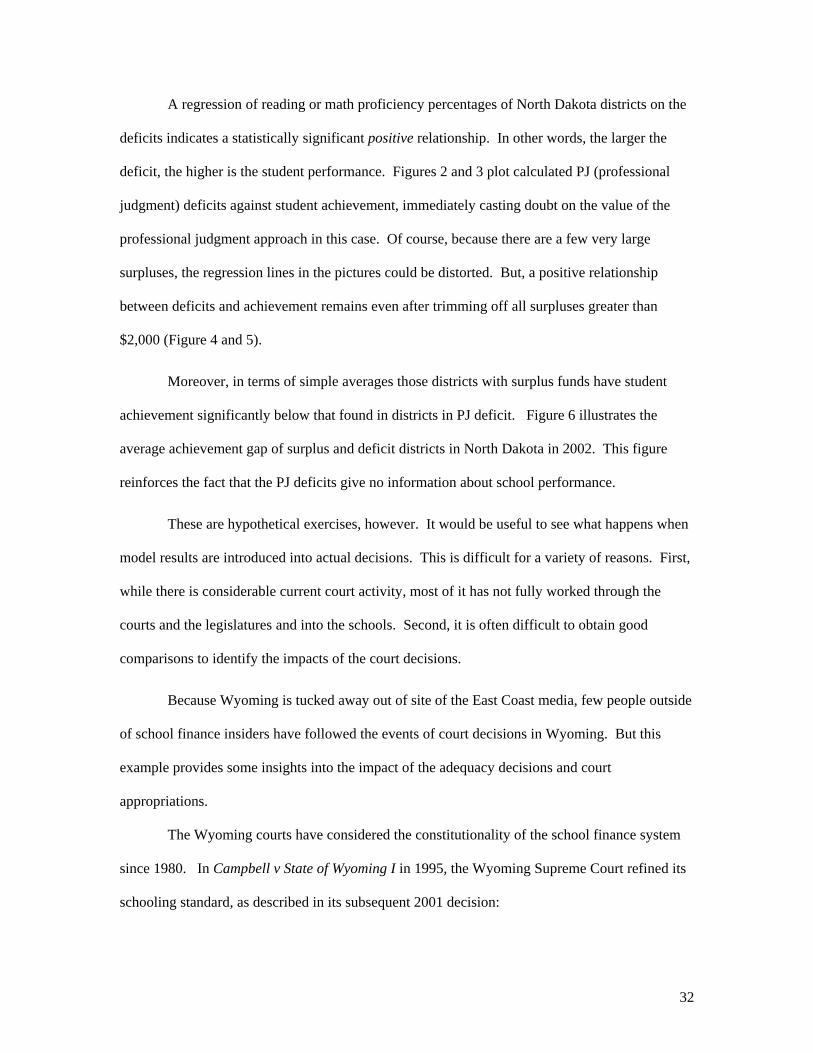
A regression of reading or math proficiency percentages of North Dakota districts on the
deficits indicates a statistically significant positive relationship. In other words, the larger the
deficit, the higher is the student performance. Figures 2 and 3 plot calculated PJ (professional
judgment) deficits against student achievement, immediately casting doubt on the value of the
professional judgment approach in this case. Of course, because there are a few very large
surpluses, the regression lines in the pictures could be distorted. But, a positive relationship
between deficits and achievement remains even after trimming off all surpluses greater than
$2,000 (Figure 4 and 5).
Moreover, in terms of simple averages those districts with surplus funds have student
achievement significantly below that found in districts in PJ deficit. Figure 6 illustrates the
average achievement gap of surplus and deficit districts in North Dakota in 2002. This figure
reinforces the fact that the PJ deficits give no information about school performance.
These are hypothetical exercises, however. It would be useful to see what happens when
model results are introduced into actual decisions. This is difficult for a variety of reasons. First,
while there is considerable current court activity, most of it has not fully worked through the
courts and the legislatures and into the schools. Second, it is often difficult to obtain good
comparisons to identify the impacts of the court decisions.
Because Wyoming is tucked away out of site of the East Coast media, few people outside
of school finance insiders have followed the events of court decisions in Wyoming. But this
example provides some insights into the impact of the adequacy decisions and court
appropriations.
The Wyoming courts have considered the constitutionality of the school finance system
since 1980. In Campbell v State of Wyoming I in 1995, the Wyoming Supreme Court refined its
schooling standard, as described in its subsequent 2001 decision:
Figure 2. North Dakota Professional Judgment Results
0.2
.4.6
.8%
pro
ficie
nt
-10 -5 0 5PJ spending shortage ($1000)
proficient reading Fitted values
Reading Proficiency and PJ Shortage
Figure 3. North Dakota Professional Judgment Results
0
.2.4
.6.8
% p
rofic
ient
-10 -5 0 5PJ spending shortage ($1000)
proficient math Fitted values
Math Proficiency and PJ Shortage
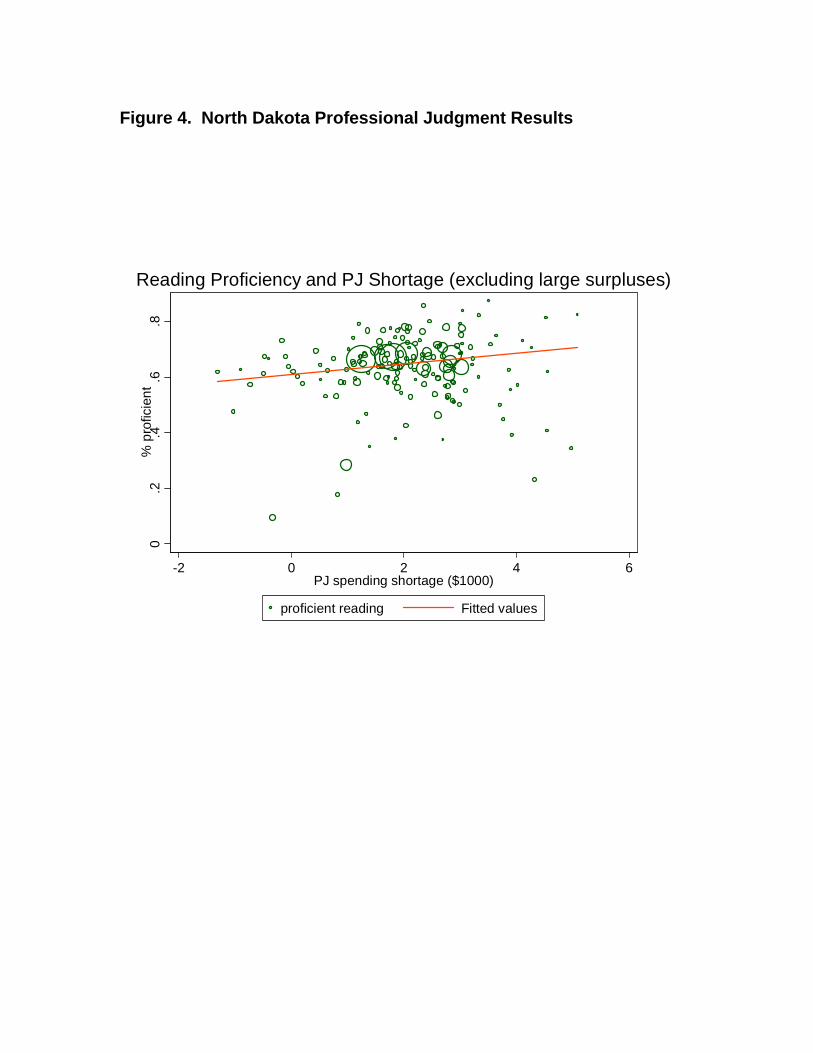
Figure 4. North Dakota Professional Judgment Results
0.2
.4.6
.8%
pro
ficie
nt
-2 0 2 4 6PJ spending shortage ($1000)
proficient reading Fitted values
Reading Proficiency and PJ Shortage (excluding large surpluses)
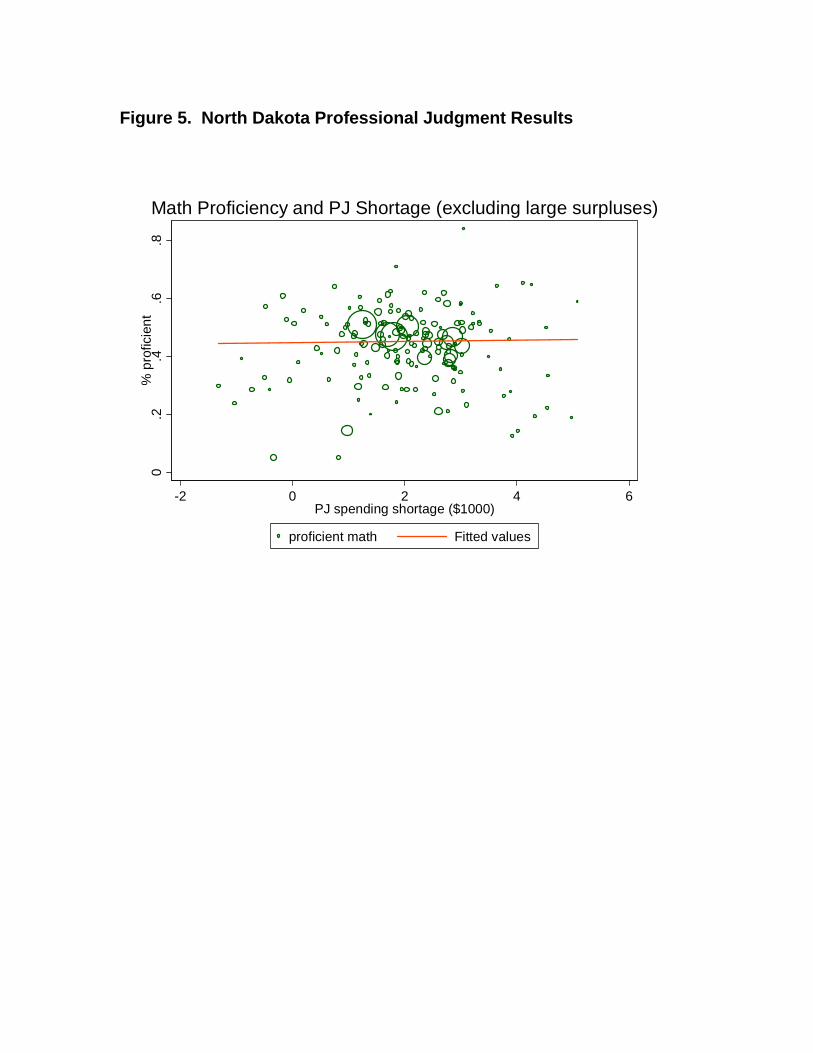
Figure 5. North Dakota Professional Judgment Results
0
.2.4
.6.8
% p
rofic
ient
-2 0 2 4 6PJ spending shortage ($1000)
proficient math Fitted values
Math Proficiency and PJ Shortage (excluding large surpluses)
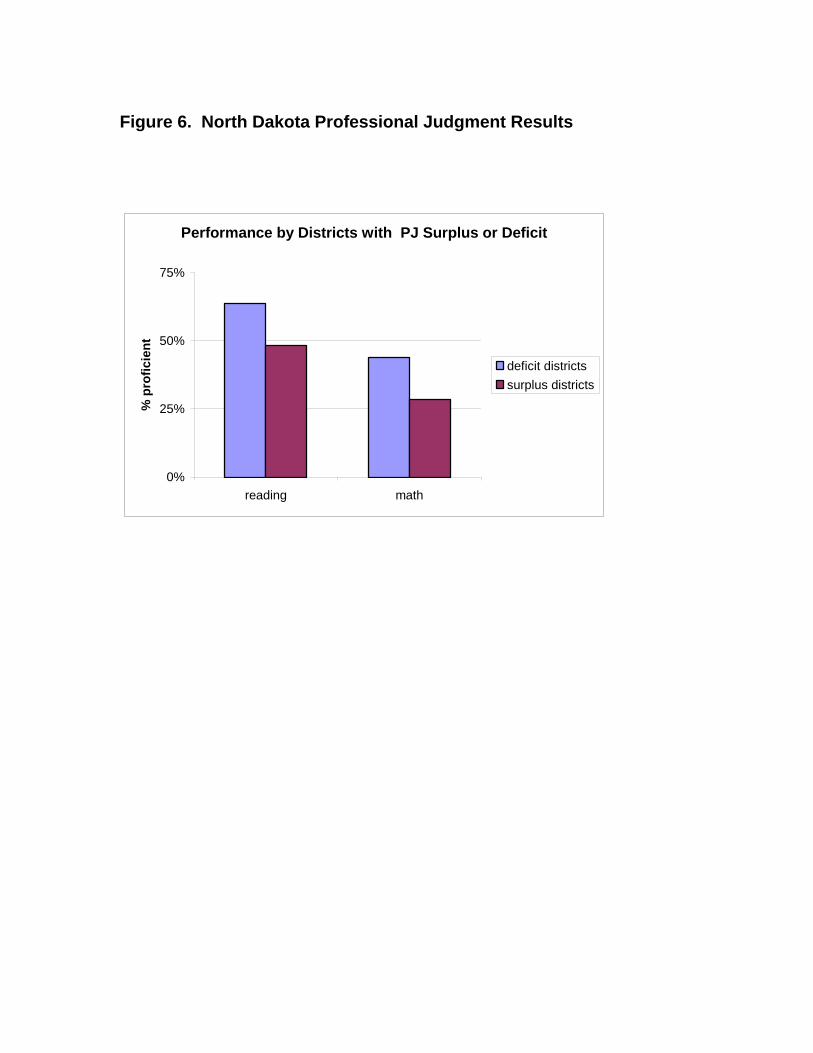
Figure 6. North Dakota Professional Judgment Results
Performance by Districts with PJ Surplus or Deficit
0%
25%
50%
75%
reading math
% p
rofic
ient
deficit districtssurplus districts
33
This court made it clear it is the job of the legislature to “design the best educational system by identifying the ‘proper’ educational package each Wyoming student is entitled to have.” . . . Unlike the majority of states which emphasized additional funding, equalized funding, or basic education, Wyoming views its state constitution as mandating legislative action to provide a thorough and uniform education of a quality that is both visionary and unsurpassed. (Campbell II, p. 18) 31
This ruling presents a license for school districts to shop for virtually any program or idea that is
arguably better than what they are currently doing.32
As might be imagined, this process of developing a visionary system – based on input
criteria – leads to spending increases. Figure 7 compares Wyoming spending to a set of adjoining
north central states (Montana, North Dakota, and South Dakota). and to the U.S. average.33
Clearly Wyoming began to pull away after the nation with the Campbell I decision in 1995. The
spending patterns of the other states have not been dictated by judicial actions but instead have
been the result of the democratic appropriations process. They are significantly below that in
Wyoming and follow roughly with the national pattern.
The interesting thing is to observe the outcomes of Wyoming’s court supervised spending
and how they compare to the other states. As described in Table 1, the comparison states have
similar demographics, although Wyoming has some advantages in terms of income and education 31 Campbell County School District v. State, 907 P. 2d 1238 (Wyo. 1995); Campbell County School District v. State, 19 P.3d 518, 538 (Wyo. 2001). 32 An element of this that is important, however, is that the court has ruled that the school finance system must be cost based. The legislature attacked this problem by asking MAP to develop a basic funding model, which it did based on an underlying professional judgment model. The basic model has been used in developing a series of block grants to districts in order to meet differences in circumstances (disadvantaged populations, school size, etc.). 33 The other comparison states followed the normal democratic appropriations process and were not driven by court intervention in fiscal and policy decisions. Montana’s future may be very different, however. In Spring 2005, the Montana Supreme Court upheld a lower court decision that the state was in constitutional violation of its requirement to “provide a basic system of free quality public elementary and secondary schools.” Columbia Falls Elem. School Dist. No 6 et al v. the State of Montana, No. 04-390 (Mont. S. Ct. Mar. 22, 2005). The District Court had identified the “major problems” in existing funding legislation as: “it provided no mechanism to deal with inflation; it did not base its numbers on costs such as teacher pay, meeting accreditation standards, fixed costs, or costs of special education; increases in allowable spending were not tied to costs of increased accreditation standards or content and performance standards; relevant data was already two years old when the bill was passed; and no study was undertaken to justify the disparity in ANB dollars [the ‘average number belonging’ entitlement] dispensed to high schools as compared to elementary schools. From these credible findings we must conclude that the Legislature did not endeavor to create a school funding system with quality in mind.” (p. 10) This reliance on input criteria could place Montana in a situation similar to Wyoming.
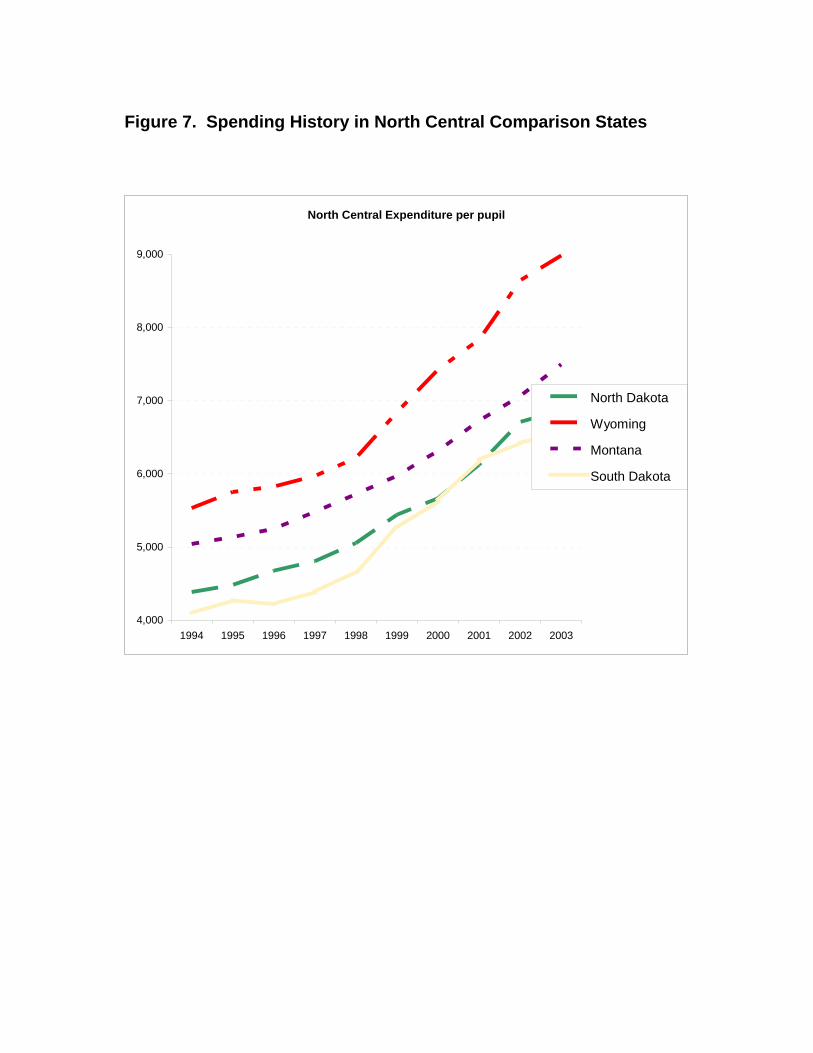
Figure 7. Spending History in North Central Comparison States
North Central Expenditure per pupil
4,000
5,000
6,000
7,000
8,000
9,000
1994 1995 1996 1997 1998 1999 2000 2001 2002 2003
North Dakota
Wyoming
Montana
South Dakota
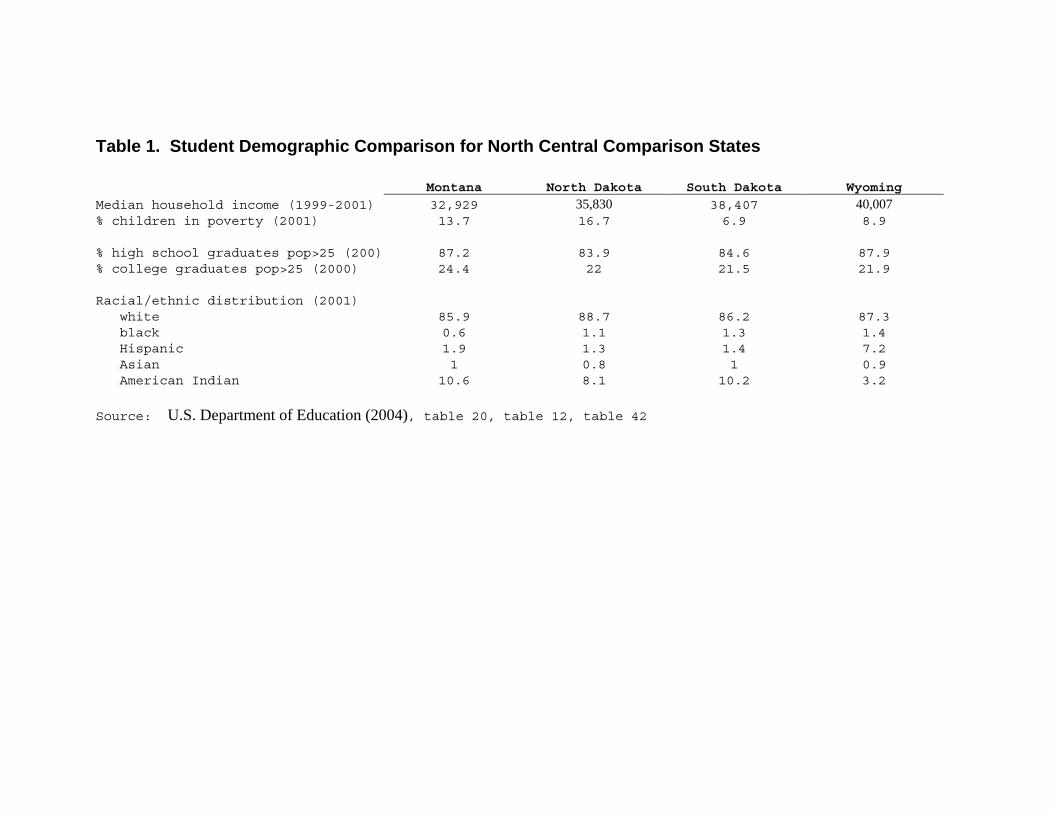
Table 1. Student Demographic Comparison for North Central Comparison States Montana North Dakota South Dakota Wyoming
Median household income (1999-2001) 32,929 35,830 38,407 40,007 % children in poverty (2001) 13.7 16.7 6.9 8.9 % high school graduates pop>25 (200) 87.2 83.9 84.6 87.9 % college graduates pop>25 (2000) 24.4 22 21.5 21.9 Racial/ethnic distribution (2001) white 85.9 88.7 86.2 87.3 black 0.6 1.1 1.3 1.4 Hispanic 1.9 1.3 1.4 7.2 Asian 1 0.8 1 0.9 American Indian 10.6 8.1 10.2 3.2 Source: U.S. Department of Education (2004), table 20, table 12, table 42
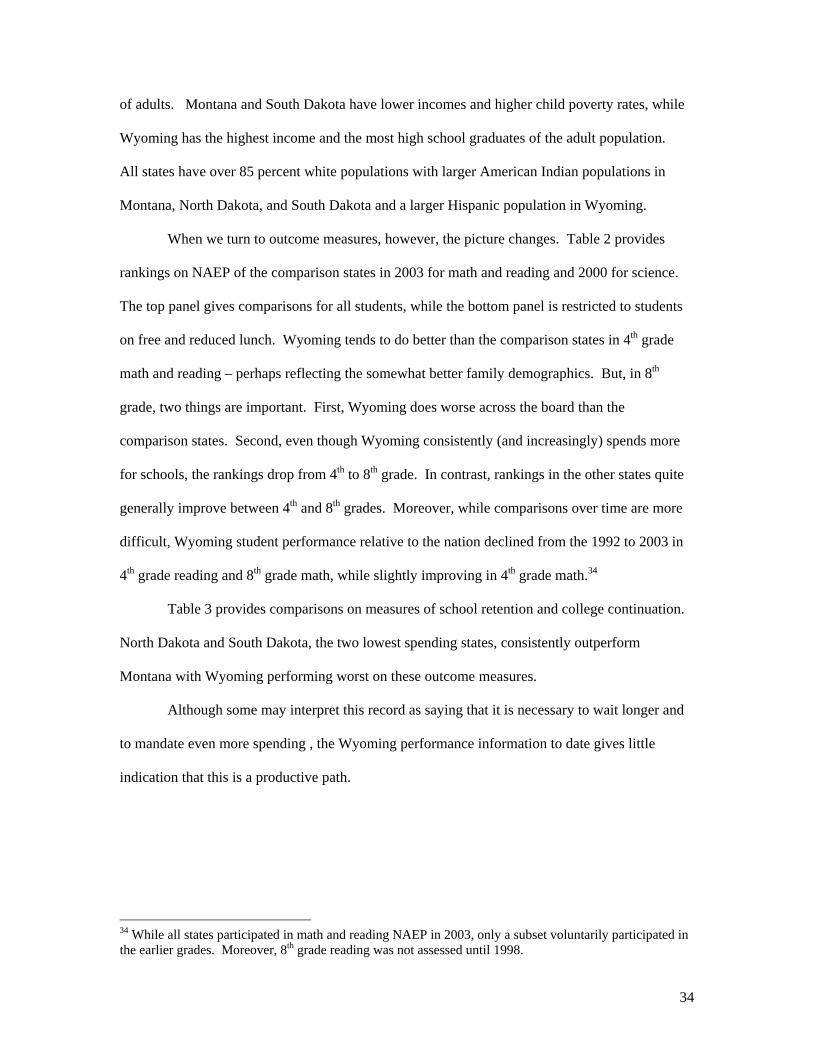
34
of adults. Montana and South Dakota have lower incomes and higher child poverty rates, while
Wyoming has the highest income and the most high school graduates of the adult population.
All states have over 85 percent white populations with larger American Indian populations in
Montana, North Dakota, and South Dakota and a larger Hispanic population in Wyoming.
When we turn to outcome measures, however, the picture changes. Table 2 provides
rankings on NAEP of the comparison states in 2003 for math and reading and 2000 for science.
The top panel gives comparisons for all students, while the bottom panel is restricted to students
on free and reduced lunch. Wyoming tends to do better than the comparison states in 4th grade
math and reading – perhaps reflecting the somewhat better family demographics. But, in 8th
grade, two things are important. First, Wyoming does worse across the board than the
comparison states. Second, even though Wyoming consistently (and increasingly) spends more
for schools, the rankings drop from 4th to 8th grade. In contrast, rankings in the other states quite
generally improve between 4th and 8th grades. Moreover, while comparisons over time are more
difficult, Wyoming student performance relative to the nation declined from the 1992 to 2003 in
4th grade reading and 8th grade math, while slightly improving in 4th grade math.34
Table 3 provides comparisons on measures of school retention and college continuation.
North Dakota and South Dakota, the two lowest spending states, consistently outperform
Montana with Wyoming performing worst on these outcome measures.
Although some may interpret this record as saying that it is necessary to wait longer and
to mandate even more spending , the Wyoming performance information to date gives little
indication that this is a productive path.
34 While all states participated in math and reading NAEP in 2003, only a subset voluntarily participated in the earlier grades. Moreover, 8th grade reading was not assessed until 1998.
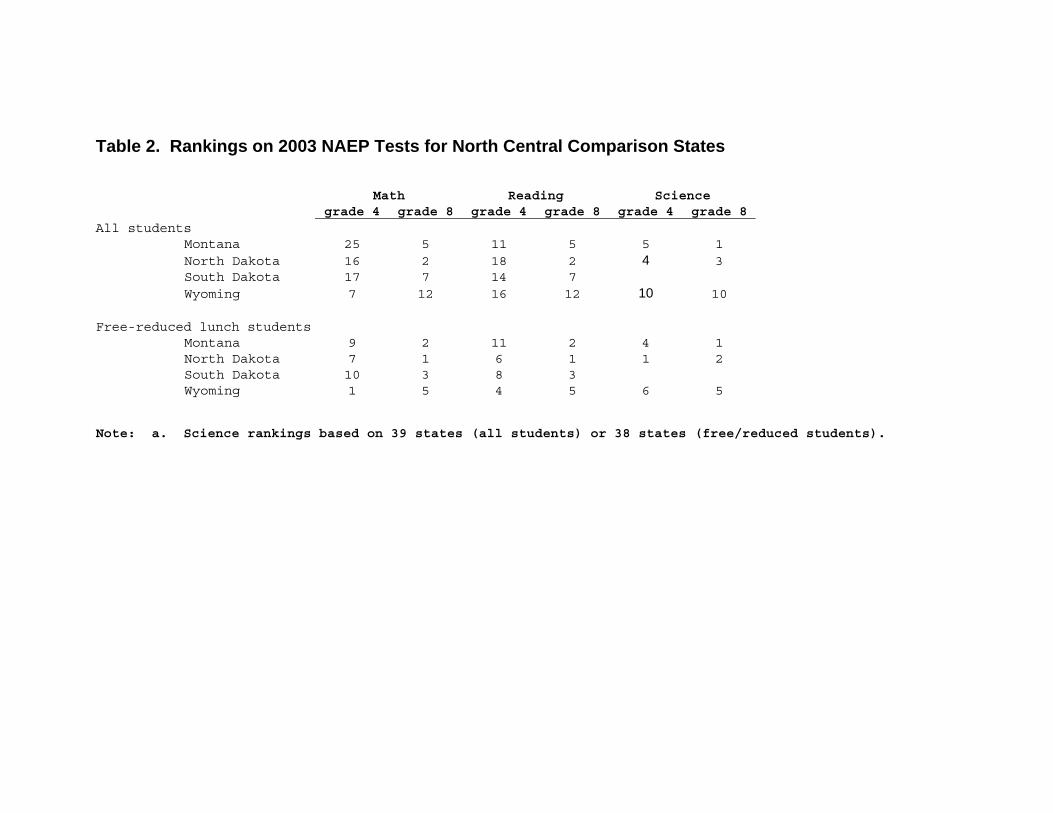
Table 2. Rankings on 2003 NAEP Tests for North Central Comparison States Math Reading Science grade 4 grade 8 grade 4 grade 8 grade 4 grade 8 All students Montana 25 5 11 5 5 1 North Dakota 16 2 18 2 4 3 South Dakota 17 7 14 7 Wyoming 7 12 16 12 10 10 Free-reduced lunch students Montana 9 2 11 2 4 1 North Dakota 7 1 6 1 1 2 South Dakota 10 3 8 3 Wyoming 1 5 4 5 6 5
Note: a. Science rankings based on 39 states (all students) or 38 states (free/reduced students).
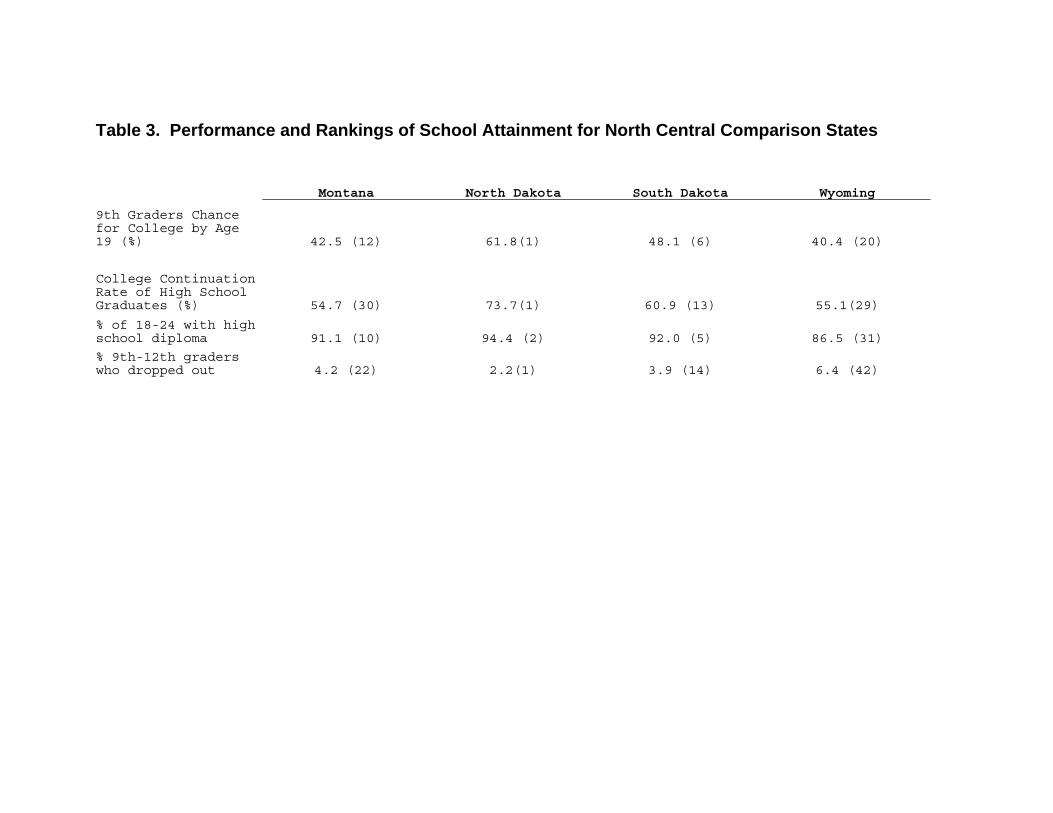
Table 3. Performance and Rankings of School Attainment for North Central Comparison States Montana North Dakota South Dakota Wyoming
9th Graders Chance for College by Age 19 (%) 42.5 (12) 61.8(1) 48.1 (6) 40.4 (20)
College Continuation Rate of High School Graduates (%) 54.7 (30) 73.7(1) 60.9 (13) 55.1(29)
% of 18-24 with high school diploma 91.1 (10) 94.4 (2) 92.0 (5) 86.5 (31)
% 9th-12th graders who dropped out 4.2 (22) 2.2(1) 3.9 (14) 6.4 (42)
35
Conclusions
All state constitutions prescribe a democratic appropriations process that is designed to
determine the appropriate level and nature of state spending. All states (with the wording
differing across states) also mandate an educational system.
Over an extended period of time a coalition of people genuinely interested in improving
the performance and equity of schools and of people who have a clear self-interested position
have gone to the state courts to alter the democratic appropriations of legislatures. The courts
with their obligation to interpret the state constitutions have intervened in some states but not
others.
The traditional focus on equity, defined simply in terms of funding for schools, has given
way to one on outcomes and adequacy. And this has moved the courts into areas in which they
are completely unprepared. Specifically, if one wants to improve outcomes or change the
distribution of outcomes, how can the court do it? After all, even if they want to do so, they
cannot simply mandate a given level of student achievement. Instead they must define any
judgments in terms of instruments that will lead to their desired outcomes but that can be
monitored by the court. This necessity returns the decision making to a focus on money and
resources.
But how much money translates into the desired schooling outcomes? For this, the courts
have come to rely on outside consultants (frequently hired by interested parties) to provide the
answers.
These consultants, and the people who hire them, suggest that the subsequent “costing
out” exercises provide a scientific answer to the disarmingly simple question, “how much does it
cost to provide an adequate education?” Nothing could be farther from the truth. The
methodologies that have been developed are not just inaccurate. They are quite generally
unscientific. They do not provide reliable and unbiased estimates of the necessary costs. In a
36
variety of cases, they cannot be replicated by others. And they obfuscate the fact that they are
unlikely to provide a path to the desired outcome results.
As Augenblick et al. (2002) eloquently state in their study that was the basis of the
Kansas judgment, “None of these approaches are immune to manipulation; that is, each is subject
to tinkering on the part of users that might change results. In addition, it is not known at this point
whether they would produce similar results if used under the same circumstances (in the same
state, at the same time, with similar data).” This possibility gives considerable latitude to the
courts to pick whatever number they want. Judge Bullock in his Kansas decision speaks
favorably of the Augenblick & Myers cost estimates (with the above caution), while justifying his
choice in part by noting that a parallel ruling in Montana opined:
The testimony of Dr. Lawrence Picus of the University of Southern California (who also testified for Defendants in the instant action) was found to lack credibility in that, while testifying for the defense in Kansas and Massachusetts he had opined those systems were equitable and thus constitutional, but in Montana (while testifying for the plaintiffs) he opined Montana’s funding was inadequate and violative of constitutional requirements- - -both opinions being based astonishingly on undisputed numbers showing Montana’s system more equitable in virtually every measurement than either Kansas or Massachusetts. In other words, Dr. Picus “danced with the girls that brought him.” 35 Again, costing out studies are political documents, almost always purchased by clients
with an agenda. When there are no accepted scientific standards for their conduct, when there are
few empirical restraints, when they cannot be replicated by others, and when there is no
requirement for consistency across applications, it should come as little surprise that the estimates
please the party who has purchased them.
Courts surely need guidance if they are to enter into the adequacy arena, because they
have no relevant expertise in the funding, institutions, and incentives of schools. They are
generally quite eager to have somebody tell them the answer, so they are willing jump on “the
number” even while recognizing that it might have problems.
35 Montoy v. State, Case No. 99-C-1738 (Dist. Ct. Shawnee County, Kan., Dec. 2, 2003).
37
The message here is that the existing costing out methodologies do not and cannot
support such judicial decision making. There is also the distinct possibility that pursuing such a
policy will actually worsen rather than help students and their achievement.
All of the methods rely crucially on existing educational approaches, existing incentive
structures, and existing hiring and retention policies for teachers. Essentially each calls for doing
more the same – reducing pupil-teacher ratios, paying existing teachers more, retaining the same
administrative structure and expense. Thus, they reinforce and solidify the existing structure,
almost certainly to the detriment of students while offering no hope of bringing about the kinds of
improvements that they purport to cost out.
References AIR/MAP. 2004. The New York Adequacy Study: Determining the Cost of Providing All Children
in New York an Adequate Education. American Institutes for Research and Management Analysis and Planning (March).
Augenblick & Myers, Inc. 2002. Calculation of the cost of an adequate education in Indiana in
2001-2002 using the professional judgment approach, Prepared for Indiana State Teachers Association. Augenblick & Myers, Inc., (September).
Augenblick, John, and John Myers. 1997. Recommendations for a Base Figure and Pupil-
Weighted Adjustments to the Base Figure for Use in a New School Finance System in Ohio. Augenblick & Myers, Inc., (July).
Augenblick, John, John Myers, Justin Silverstein, and Anne Barkis. 2002. Calculation of the cost
of a suitable education in Kansas in 2000-2001 using two different analytical approaches: Prepared for Legislative Coordinating Council. Denver, CO: Augenblick & Myers, Inc., (March).
Augenblick Palaich and Associates, Inc. 2003. Calculation of the cost of an adequate education
in North Dakota in 2002-2003 using the professional judgement approach. Bismarck, ND: North Dakota Department of Public Instruction (September).
Callahan, Raymond E. 1962. Education and the cult of efficiency. Chicago: University of Chicago
Press.
38
Cullen, Julie B., and Susanna Loeb. 2004. "School finance reform in Michigan: Evaluating Proposal A." In Helping children left behind: State aid and the pursuit of educational equity, edited by John Yinger. Cambridge, MA: MIT Press:215-249251-281.
Downes, Thomas A. 1992. "Evaluating the impact of school finance reform on the provision of
public education: The California case." National Tax Journal 45,no.4 (December):405-419.
———. 2004. "School finance reform and school quality: Lessons from Vermont." In Helping
children left behind: State aid and the pursuit of educational equity, edited by John Yinger. Cambridge, MA: MIT Press:284-313.
Duncombe, William, and Jocelyn M. Johnston. 2004. "The impacts of school finance reform in
Kansas: Equity is in the eye of the beholder." In Helping children left behind: State aid and the pursuit of educational equity, edited by John Yinger. Cambridge, MA: MIT Press:148-193.
Duncombe, William, Anna Lukemeyer, and John Yinger. 2003. "Financing an Adequate
Education: A Case Study of New York." In Developments in School Finance: 2001-02, edited by William J. Fowler, Jr. Washington: National Center for Education Statistics:127-154.
———. 2004. "Education Finance Reform in New York: Calculating the Cost of a “Sound Basic
Education” in New York City." CPR Policy Brief, No. 28/2004, Center for Policy Research, Syracuse University (March).
Education Week. 2005. Quality counts 2005: No small change -- targeting money toward student
performance. January 6 ed. Washington, DC: Education Week. Flanagan, Ann E., and Sheila E. Murray. 2004. "A decade of reform: The impact of school reform
in Kentucky." In Helping children left behind: Stae aid and the pursuit of educational equity, edited by John Yinger. Cambridge, MA: MIT Press:195-214.
Gronberg, Timothy J., Dennis W. Jansen, Lori L. Taylor, and Kevin Booker. 2004. School
Outcomes and School Costs: The Cost Function Approach. Texas A&M University Hanushek, Eric A. 1999. "The evidence on class size." In Earning and learning: How schools
matter, edited by Susan E. Mayer and Paul E. Peterson. Washington, DC: Brookings Institution:131-168.
———. 2002. "Publicly provided education." In Handbook of Public Economics, edited by Alan
J. Auerbach and Martin Feldstein. Amsterdam: Elsevier:2045-2141. ———. 2003. "The failure of input-based schooling policies." Economic Journal 113,no.485
(February):F64-F98. ———. 2005. "Pseudo-science and a sound basic education: Voodoo statistics in New York."
Education Next 5,no.4 (Fall):67-73.
39
Hanushek, Eric A., and Julie A. Somers. 2001. "Schooling, inequality, and the impact of government." In The causes and consequences of increasing inequality, edited by Finis Welch. Chicago: University of Chicago Press:169-199.
Hoxby, Caroline Minter, and Ilyana Kuziemko. 2004. "Robin Hood and His Not-So-Merry Plan:
Capitalization and the Self-Destruction of Texas' School Finance Equalization Plan." National Bureau of Economic Research, Working Paper No. 10722, (September).
McCombs, Jennifer Sloan, and Stephen J. Carroll. 2005. "Ultimate Test: Who Is Accountable for
EducationIf Everybody Fails?" RAND Review 29,no.1 (Spring):10-15. Munich, John R., and Rocco E. Testani. 2005. "NEA sues over NCLB: The bucks are big, but the
case is weak." Education Next 5,no.4 (Fall):10. Murray, Sheila E., William N. Evans, and Robert M. Schwab. 1998. "Education-finance reform
and the distribution of education resources." American Economic Review 88,no.4 (September):789-812.
Myers, John L., and Justin Silverstein. 2005. Successful school districts study for North Dakota.
Augenblick, Palaich and Associates, Inc. (August 15). Odden, Allan, Mark Fermanich, and Lawrence O. Picus. 2003. A State-of-the-Art Approach to
School Finance Adequacy in Kentucky. Lawrence O. Picus and Associates, (February). Odden, Allan, Lawrence O. Picus, and Mark Fermanich. 2003. A Evidence-Based Approach to
School Finance Adequacy in Arkansas. Lawrence O. Picus and Associates, (September). Peterson, Paul E., and Frederick M. Hess. 2005. "Johnny can read. in some states." Education
Next 5,no.3 (Summer):52-53. Peyser, James, and Robert M. Costrell. 2004. "Exploring the costs of accountability." Education
Next 4,no.2 (Spring):23-29. Picus, Lawrence O., Allan Odden, and Mark Fermanich. 2003. A professional judgment approach
to school finance adequacy in Kentucky. Lawrence O. Picus and Associates, (May). Standard & Poor’s School Evaluation Service. 2004. Resource Adequacy Study for the New York
State Commission on Education Reform. (March). Verstegen and Associates. 2003. Calculation of the Cost of an Adequate Education in Kentucky:
Prepared for The Council for Better Education. (February).