Embed Size (px)
Citation preview

The Alberta Health Services Patient/Care–Based Funding Model for Long Term Care A Review and Analysis
September 2013
Jason M. Sutherland, PhD
Nadya Repin, MA
R. Trafford Crump, PhD
This report includes references and analysis of non-public documentation and summary data provided by Alberta Health Services.

The Alberta Health Services Patient Care Based Funding Model for Long Term Care: A Review and Analysis was produced by:
Centre for Health Services and Policy ResearchUniversity of British Columbia201–2206 East MallVancouver, BC V6T 1Z3Phone: 604-822-4969Email: [email protected]

1
Contents2 ListofFiguresandTables
3 AboutCHSPR
4 ListofAcronyms
5 ExecutiveSummary
7 Introduction7 Long-TermCareinAlberta
10 1.ResidentAssessmentInstrument10 Strengths
12 Weaknesses
13 ProviderFeedback
14 SummaryofRAI-MDS2.0
14 OtherInstruments
17 Assessment:OngoingChallenges
19 2.Case-mixMethods20 ContrastingCase-mixMethods
21 Case-mixIndices
22 ApplicationofCase-mixtoProvider’sRAI-MDS2.0Data
23 AlbertaLTCCase-mix
25 UnmeasuredCase-Mix
26 AlbertaLTCandtheHealthcareSystem
29 3:DataIntegrity29 FrequencyofAssessment
29 TimelinessofReporting
30 Reporting
31 AuditingandAccuracy
33 4:PCBFforLTCinAlberta33 EvidencefromAbroad
33 ProviderFeedback
34 ImplementationandStaffing
36 Governance
38 Communication
39 AlbertaLTCQualityIncentiveFunding
41 Summary
U B C C e n t r e f o r h e a lt h s e r v i C e s a n d p o l i C y r e s e a r C h

t h e a l B e r t a h e a lt h s e r v i C e s p C B f M o d e l f o r lt C : a r e v i e W a n d a n a ly s i s
2
List of Figures and Tables
43 5.SummaryofRecommendations43 RAI-MDS2.0andData
43 RUG-IIIandCMI
44 DataIntegrity
45 PCBFinAlberta
46 Acknowledgements
47 References
53 AppendixA:34GroupRUG-III34
9 Figure1.SummaryofcharacteristicsofLTCresidentsinAlbertafrom2009/10to2012/13.
13 Table1.SummaryofqualitativefeedbackregardinglimitationsofRAI-MDS2.0byTopicArea
13 Table2.SummaryoftheevidencebyTopicArea
17 Figure2.AdjustedratioofplacementtoLTCforhospitalizedmedicalpatients,Alberta
20 Figure3.PercentageofresidentsineachRUGhierarchicalgroup,2012/13.
24 Table3.ProportionofresidentdaysineachRUGhierarchicalgroup,byfiscalyear
24 Figure4.AveragequarterlyCMIforAlbertaLTCbyzone
24 Figure5.QuarterlypercentchangesinaverageCMIforLTCinAlberta,byzone
27 Figure6.Rateofinpatientadmissionsper1,000residentdaysandaverageCMIperLTCfacility,byzone
28 Figure7.RateofEDvisitsper1,000residentdaysandaverageCMIperLTCfacility,byzone
40 Table4.DistributionofqualityincentivefundingforAlbertaLTC

U B C C e n t r e f o r h e a lt h s e r v i C e s a n d p o l i C y r e s e a r C h
3
About CHSPRThe Centre for Health Services and Policy Research (CHSPR) is an independent research centre based at the University of British Columbia. CHSPR’s mission is to advance scientific enquiry into issues of health in population groups, and ways in which health services can best be organized, funded and delivered. Our researchers carry out a diverse program of applied health services and population health research under this agenda. The Centre’s work is:
• Independent• Population-based• Policy relevant• Interdisciplinary• Privacy sensitive
CHSPR aims to contribute to the improvement of population health by ensuring our research is relevant to contemporary health policy concerns and by working closely with decision makers to actively translate research findings into policy options. Our researchers are active participants in many policy-making forums and provide advice and assistance to both government and non-gov-ernment organizations in British Columbia (BC), Canada and abroad.
For more information about CHSPR, please visit www.chspr.ubc.ca.

t h e a l B e r t a h e a lt h s e r v i C e s p C B f M o d e l f o r lt C : a r e v i e W a n d a n a ly s i s
4
List of AcronymsABF Activity-Based FundingACCA Alberta Continuing Care AssociationADL Activities of Daily LivingAH Alberta HealthAHS Alberta Health ServicesCARE Continuity Assessment Record and EvaluationCCRS Continuing Care Reporting System CIHI Canadian Institute for Health Information CMI Case-mix Index CMS Centers for Medicare and Medicaid ServicesDRG Diagnosis Related GroupIADL Instrumental Activities of Daily LivingLTC Long-Term Care MDS Minimum Data Set MOHLTC Ministry of Health and Long-Term Care (Ontario)P4P Pay-for-PerformancePAC-PRD Post-Acute Care Payment Reform Demonstration ProjectPCBF Patient/Care-Based FundingPPS Prospective Payment SystemRAI-MDS Resident Assessment Instrument Minimum DatasetRIW Resource Intensity WeightRN Registered NurseRUG Resource Utilization Groups SMAF Functional Autonomy Measurement SystemSTM Staff Time MeasureSTRIVE Staff Time and Resource Intensity VerificationWRD Weighted Resident Day

U B C C e n t r e f o r h e a lt h s e r v i C e s a n d p o l i C y r e s e a r C h
5
Long term care (LTC) plays a critical role in provid-ing medical, physical and psychosocial services to a vulnerable element of the Albertan population. Cur-rently, LTC spending accounts for approximately 7% of total Alberta Health Services (AHS) expenditures, an amount exceeding $900 million. This amount of spending provides skilled nursing, therapies, equip-ment, supplies and drugs for thousands of Albertans residing in over 14,000 LTC beds. Ensuring that this funding is well spent is an important function of AHS.
Creating an environment that provides cost-efficient, accessible and high quality LTC is a key objective for the AHS. The province’s single payer healthcare system must balance the demands for healthcare with being a responsible guardian of taxpayer’s monies. Analyses of weighted cost per day in 2009 revealed previous LTC funding mechanisms in Alberta were disconnected from resident’s needs and reforms were deemed necessary.
The development and implementation of the Patient/Care-Based Funding (PCBF) represents a monu-mental multi-year undertaking by a large number of individuals across the healthcare system.
The objective of the PCBF model is to provide a transparent, stable and equitable approach to funding LTC across the province that creates incentives for cost efficiency, maintaining or improving access, and improving quality.
In function, the PCBF model is a stand-alone output-based allocation method which ‘splits the pie’ of total LTC funding among providers based on aligning the funding per resident with the intensity of caring for each resident, including the scope of expected services.
This report was commissioned by AHS in order to provide an independent review of the PCBF model used to allocate public funding for LTC in Alberta. This report is intended for AHS and will identify strengths and weaknesses of the LTC funding model and will provide specific feedback to AHS regarding possible actions to mitigate actual or perceived weak-nesses of the LTC funding model. This report is based on a range of input information, including analysis of documentation provided by AHS, an extensive review of the international and scientific literature underlying measurement and funding for post-acute care, quan-titative analysis of facility-level data provided by AHS and qualitative interviews of a number of stakeholders in the LTC sector of Alberta.
Many of the technical decisions made by AHS during the development of PCBF have a solid foundation. Like any complex system, there are opportunities for improvement. Changes to the PCBF can take a range of forms; AHS can make minor modifications to achieve significant progress on communication and education. Other issues, for instance stale input data for cost weights, will require additional time and effort. Broader issues, such as AHS’s allocation of funds between sectors, affecting the ‘size of the pie,’ require system-level approaches to balance pressures for investing elsewhere in the healthcare system.
Executive Summary

t h e a l B e r t a h e a lt h s e r v i C e s p C B f M o d e l f o r lt C : a r e v i e W a n d a n a ly s i s
6
Limitations in the assessment data leave AHS open to criticisms that changes in clinical practice or resident characteristics are not being recognized by PCBF and that AHS is not staying abreast of the science of assessment. There is a basis for these concerns, as AHS is relying entirely on external researchers to update the foundation upon which the PCBF model is based.
Wide swings in provider’s quarterly CMI suggest a system in transition, during which time access to LTC, quality of care to residents and equity in funding between providers should be ensured by AHS. While a number of steps have been taken to address vulner-abilities in data accuracy, AHS should be proactively reinforcing safeguards in provider-collected data.
Stakeholders in the system have expressed uncertainty and unease with a number of factors in the PCBF model which are perceived to threaten the stability of their clinical operations. The lack of clear policies regarding differences in seniority levels and union penetration on the part of AHS has led providers to lay-off staff and jeopardizes the stability of the LTC workforce.
Education and communication have been variable over the multi-year phase-in; when twinned with transition-based stressors, these gaps have led to misinformation and significant confusion among providers. This gap has left AHS struggling to catch up to a number of providers that are ill-prepared for the implementation of PCBF.
There are a number of opportunities to amend the PCBF governance structure. Clear lines of account-ability between the Steering Committee and working groups would improve decision-making. Meaning-fully engaging providers in strategic decision-making, while retaining AHS oversight, is much more likely to produce a robust and equitable approach to funding LTC in Alberta that is supported by providers.
Leaning on the experiences in other countries, the transition between funding approaches is challenging for both funder and provider. Both AHS and the community of providers need each other—it is in their interests to find common ground.
Designing and implementing the PCBF model is a significant achievement by AHS, made more challeng-ing by the current tightening fiscal environment. As the PCBF initiative continues to move forward, AHS must balance the tensions for improving transparency, stability and equitability with its desire to push ahead with reforms and providers’ ability to adapt.

U B C C e n t r e f o r h e a lt h s e r v i C e s a n d p o l i C y r e s e a r C h
7
IntroductionThis report was commissioned by Alberta Health Services (AHS) in order to provide independent commentary regarding the model used to allocate public funding for long-term care (LTC) in Alberta. Intended for AHS, this report will identify strengths and weaknesses of the LTC funding model and will provide specific feedback to AHS regarding possible actions to mitigate perceived weaknesses of the LTC funding model. This review is focused on the portion of LTC funding that is affected by AHS, and as such, this report provides limited insight on revenues generated by providers for accommodation fees or funding capital.
The methods being used to fund the staff time portion of LTC in Alberta are based on the principals of activity-based funding (ABF). The objective of ABF is to align the funding per resident with that resident’s medical, physical, mental and psychosocial needs. The principal behind ABF is similar to the objectives of the Alberta Resident Classification system, align-ing funding with the intensity and scope of services required for resident needs. Both of these approaches, discussed in detail below, are common in other coun-tries and in Ontario.
This report is based on a range of input information, including analysis of documentation provided by AHS, an extensive review of the international and scientific literature underlying measurement and funding for post-acute care, quantitative analysis of facility-level data provided by AHS and qualitative interviews of a number of key stakeholders in the LTC sector in Alberta. In the latter instance, semi-struc-tured interviews were conducted with a number of stakeholders, including five AHS and Alberta Health (AH) staff and 11 public, private for-profit and not-for-profit LTC providers.
There are four components of the report. The first section of the report examines the scope and appro-priateness of clinical data collected to support funding LTC. The second section of the report reviews the case-mix methods for categorizing LTC residents and the cost weights synonymous with funding. The third section looks at the integrity of data collected, methods to ensure data accuracy and other reporting and compliance concerns. The last section reviews the main aspects of the Alberta LTC funding model, including the Quality Incentive Funding.
This report was commissioned by Alberta Health Ser-vices with the University of British Columbia the first week of June, 2013. This project was approved by the University of British Columbia Research Ethics Board. This report was completed in draft form on August 1, 2013 and submitted in final form September 11, 2013.
Long-Term Care in AlbertaEven though Alberta has the youngest population in Canada, the province still faces an increasingly aging population. This expanding cohort of seniors, while overall healthier than previous generations, will need access to LTC. LTC is provided as part of continuing care services in Alberta to residents that have complex and unpredictable medical needs requiring 24 hour on-site registered nursing care (1). LTC facilities in Alberta include nursing homes and auxiliary hospitals (1).
In 2013/14, facility-based continuing care services are expected to account for 7% of total AHS expenditures, at $919 million. AHS expects to spend $969 million in 2015 and $1,005 million in 2016 on facility-based care (2). A 2008 report by AHS identified that AHS sought to keep the number of beds stable, instead concentrat-ing resources on other care options for seniors (3). As

t h e a l B e r t a h e a lt h s e r v i C e s p C B f M o d e l f o r lt C : a r e v i e W a n d a n a ly s i s
8
of March 2012 there were 14,731 LTC beds in Alberta and the number is forecasted to drop to 13,751 beds by 2016.
In 2010, Alberta began implementing Patient/Care-Based Funding (PCBF) for LTC. PCBF is not intended to reflect the entirety of the cost associated with pro-viding accessible, safe and high quality LTC. PCBF is only intended to represent the staff, equip-ment and supply costs associated with resident care. PCBF consists of approximately 85% of total LTC costs. The balance of LTC costs are remunerated by accommodation fees, capital funding or other AHS funding programs.
The PCBF model is an output based allocation model, which ‘splits the pie’ of total LTC funding based on weighted resident days (WRD). The total-ity of LTC funding is determined before the PCBF model is applied to distributing the amount among LTC providers. The PCBF model provides an objec-tive approach to funding LTC across the province, intended to improve equity for providers, creates incentives for cost efficiency and for improving quality (1).
The PCBF model will be phased in over seven years, beginning in 2010/11 and ending with the final reduc-tions to overfunded sites in 2016/17. One important aspect of the implementation of PCBF was a no-loss protection policy, which meant that LTC providers would not receive immediate reductions in funding. This policy began in 2010/11 and has been extended to 2012/13 with separate timelines for public and private facilities. In April 2012, no-loss funding was removed for public facilities, in March 2013 it was removed for Covenant Health and its subsidiaries and in April 2013 the no-loss provision was removed for
contracted providers. In 2013/14, AHS will introduce accountabilities and recoveries for over and under-funded facilities.
A resident’s intensity of care needs are assessed when they are admitted to an LTC facility using the resident assessment instrument minimum data set (RAI-MDS) 2.0 (1). Assessment is an integral component of resident care which supports care planning, holding providers accountable for the intensity and quality of care provided and giving AHS a basis to equitably allocate LTC funding.
After assessment, Alberta then applies the 44 category resources utilization group (RUG)-III to case-mix adjust residents based on the RAI-MDS 2.0. The RAI-MDS 2.0 is also collected every 90 days for the duration of the stay and after any significant change in health status (1). Funding amounts for the staffing of facilities, supplies and equipment are arrived at based on the case-mix index (CMI), which is the weighted average value for the third quarter of the previous fiscal year. Funding for accommodation and capital are funded separately.
The medical care needs of residents in LTC in Alberta are also changing over time. One study that looked at patient acuity from 1988 to 1999 determined that there were less residents with low care needs and a significant increase in residents with high care needs (4). Care needs for residents in LTC experienced a substantial increase over ten years, and may have kept increasing since 1999 (4). These reports are consistent with the clinical profile of LTC residents observed in the data; recent trends in Alberta’s LTC resident’s data indicate a significant increase in clinically complex residents (see Figure 1).

U B C C e n t r e f o r h e a lt h s e r v i C e s a n d p o l i C y r e s e a r C h
9
Figure1.SummaryofcharacteristicsofLTCresidentsinAlbertafrom2009/10to2012/13.
0
5
6
4
3
2
1
8
7One acute care facility
LTC
pla
cem
ent
ratio
80
100
120
80
100
120
0 25 50
0 25 50 0 25
One LTC facility
One LTC facility
50
0 25 50 0 25 50
Calgary Central Edmonton
North SouthAve
rage
CM
IPe
rcen
t of
LTC
res
iden
tsA
vera
ge C
MI
Rate of inpatient admissions per 1,000 resident days
80
100
120
80
100
120
0 150 300
0 150 300 0 150 300
0 150 300 0 150 300
Calgary Central Edmonton
North SouthAve
rage
CM
I
Rate of emergency room visits per 1,000 resident days
South
North
Edmonton
Central
Calgary
90
92
94
96
98
100
102
Q8Q7Q6Q5Q4Q3Q2Q1
Perc
ent
chan
ge in
CM
I
Q8Q7Q6Q5Q4Q3Q2Q1-2.0
-1.5
-1.0
-0.5
0.0
0.5
1.0
1.5
2.0
2.5
South
North
Edmonton
Central
Calgary
0%
5%
10%
15%
20%
25%
30%
35%
40%
2009/10
2010/11
2011/12
2012/13
Behavioralproblems
RUG categories
Extensiveservices
Specialrehab
Specialcare
Impairedcognition
Clinicallycomplex
Reducedphysicalfunction
Behavioural problems 2%Extensive services 3%
Special rehab 3%
Specialcare 10%
Impairedcognition
12%
Clinicallycomplex
28%
Reducedphysicalfunction
38%
The PCBF model is one approach to allocating AHS funding for LTC. PCBF has been refined at many points over the past several years to reflect new and emerging information regarding LTC organization and delivery. The following sections of this report examine key aspects of the AHS PCBF model in terms of its ability to equitably distribute LTC funding among LTC providers, where equity is considered from the perspectives of LTC residents and families, geography, access and healthcare providers.
Note:Missingorotherwiseinvalidcategoriesarenotshown.

t h e a l B e r t a h e a lt h s e r v i C e s p C B f M o d e l f o r lt C : a r e v i e W a n d a n a ly s i s
1 0
The collection of patient-level information from Medicare and Medicaid funded nursing homes was mandated in the US in 1987 with the passage of the Omnibus Budget Reconciliation Act (OBRA) (5)(6). One of the key provisions of the Act was to mandate a comprehensive assessment of the medical, physi-cal and behavioral characteristics of all nursing home residents in order to provide care plans on a uniform basis and to reduce variations in the cost and quality of nursing home care.
Assessment of the resident was collected in the Minimum Data Set (MDS), an assessment instrument that records information at the resident level. The MDS was designed by a group of experts that would later form the InterRAI organization under contract to the Centers for Medicare and Medicaid Services (CMS) (7). The initial version of the MDS was imple-mented in 1990, with a revised version replacing it in 1996 (RAI-MDS 2.0). The RAI-MDS 2.0 has grown to include 400 standardized data elements and measures resident characteristics more reliably than the original MDS (5)(8).
The terms MDS 2.0, RAI-MDS 2.0 and InterRAI (or, simply RAI) are often used synonymously by clini-cians and care givers; however, RAI-MDS 2.0 refers to the clinical assessment instrument used in Alberta for LTC funding, while InterRAI is an organization that has developed a number of clinical assessment instruments used in a variety of care settings. In this report, we will use the term RAI-MDS 2.0 to refer to the assessment instrument.
During the writing of this report, no empirical analyses could be found which compared the physical
and mental function of residents in long-term care facilities in Canada, specifically Alberta, and the populations in Skilled Nursing Facilities (SNFs) in the US for whom the RAI-MDS 2.0 was primarily targeted. Nonetheless, the RAI-MDS 2.0 is used to some degree in all provinces to assess long-term care residents except New Brunswick and Quebec (9)(10).1 Its adoption across Canada over the past decade has been aided by the Canadian Institute for Health Infor-mation’s (CIHI) development of the Continuing Care Reporting System (CCRS), an electronic reporting system designed to support the collection and analysis of RAI-MDS 2.0 (11).
As of 2011/12, eight Canadian provinces and territo-ries2 were participating partially or fully in the CCRS by submitting RAI-MDS 2.0 data on their long-term care residents (11)(12). Ontario mandates the collec-tion and reporting of RAI-MDS 2.0 assessments for LTC residents (13).
The RAI-MDS 2.0 is also used extensively interna-tionally. At either the regional or national level, the RAI-MDS 2.0 is mandated for collecting data on long-term care residents (or their equivalent) across several European countries, including France, the United Kingdom, Denmark, Finland, Norway, Italy, Germany, Switzerland and Austria (10)(9). The RAI-MDS 2.0 is in use or in testing in Belgium, the Czech Republic, Poland, the Netherlands, Australia and New Zealand (10)(9).
StrengthsThe RAI-MDS 2.0 has been tested extensively in the United States for validity and reliability for the SNF population (14)(15)(16). The instrument is strong
1. Resident Assessment Instrument
1 Used only within Winnipeg in the province of Manitoba.2 BC, Saskatchewan, Manitoba, Ontario, Nova Scotia, Newfoundland and Labrador and the Yukon.

U B C C e n t r e f o r h e a lt h s e r v i C e s a n d p o l i C y r e s e a r C h
1 1
at measuring activities of daily living (ADLs) and the cognitive performance scale based on items of memory impairment, level of consciousness and executive functions (17).
Implementation of the RAI-MDS 2.0 is associ-ated with improved outcomes, including improved comprehensiveness and use of care planning, while reducing functional declines in patients for certain conditions, problematic interventions and SNF resi-dent hospitalization rates (15)(18)(5). Implementing the RAI-MDS 2.0 has reportedly had positive effects on the cognitive and physical functions of SNF resi-dents (19).
The RAI-MDS 2.0 has also been evaluated in coun-tries outside of the United States. The reliability of the majority of RAI-MDS 2.0 items used in Denmark, Iceland, Italy, Japan, Sweden and Switzerland all show adequate to excellent reliability (20). The European Union-funded project Services and Health for Elderly in Long TERm care (SHELTER) has evaluated the RAI-MDS 2.0 for use in assessing and compar-ing long-term care residents (called nursing home residents in most European countries) across different health systems (21). The study found the RAI-MDS 2.0 to be a reliable instrument that facilitated nursing home residents comparability across countries, including England, France, Germany, Italy, Finland, the Netherlands, the Czech Republic and Israel (21).
In addition, the RAI-MDS 2.0 is the basis for a number of Resident Assessment Protocols (RAPs) or Care Area Triggers (CATs). RAPs and CATs sum-marize specific aspects of resident’s care and have become an important element of identifying resident’s potential problems or risks. An example of a CAP is a resident’s risk of falls. Depending on the scope of Alberta’s InterRAI use, there may be opportunities
to leverage InterRAI’s standardization of data ele-ments across sectors. The application of RAI-MDS 2.0 to objectives other than funding LTC is outside of the scope of this report but should be weighed in an evaluation of RAI-MDS 2.0.
Reliability
Reliability refers to the consistency with which the same resident is assessed by different assessors. When reliability is measured using kappa statistics, a measure of inter-rater reliability, the reliability of most items in the RAI-MDS 2.0 is considered to be good or acceptable (5)(6)(14)(22)(23)(20)(24). When reliability is measured using percentage of agreement, it is less acceptable (5). Studies linking administrative databases (i.e. hospital discharge diagnosis immedi-ately preceding LTC admission) and pharmaceutical use to RAI-MDS 2.0 diagnosis have also found that the tool is reliable in this context (5).
Validity
Data is valid if it accurately reflects the condition and impairment of the resident. The RAI-MDS 2.0 is generally considered to be a valid instrument (6)(25)(26)(27)(28)(29)(24). The discriminant validity of the MDS has been assessed in the US SNF population, both in terms of overall health and in specific clinical categories (5). For example, mental health seems to be discriminately valid (i.e. it accurately distinguishes between residents with clinically significant differ-ences in their mental health) and may even have some predictive validity (5).
Consistency
The RAI-MDS 2.0 is consistent with other resident classification systems. For example, a study linking the RAI-MDS 2.0 to hospital discharge records for the Medicare population in the US compared the discharge diagnoses and statuses to the RAI-MDS 2.0

t h e a l B e r t a h e a lt h s e r v i C e s p C B f M o d e l f o r lt C : a r e v i e W a n d a n a ly s i s
1 2
admission report (28). This study found a high degree of positive predictive value and a high rate of internal consistency across the two settings (28). Within Canada, CIHI reports that the CCRS data items tend to have patterns of consistency similar to US results (11).
WeaknessesMost of the published research that evaluates the RAI-MDS 2.0 has been conducted by the group that originally developed the tool and now forms the membership of the InterRAI group. Although the RAI-MDS 2.0 has overall good validity and reliability, it is better in some domains than others. Reliability is reported on a scale of 0 to 1, with scores of 0.7 and higher indicating excellent reliability, 0.6 and higher average reliability and below 0.4 considered to be unreliable (14). For example, the ADL scale is highly reliable (0.92) but the pain scale is of adequate reliabil-ity, bordering on unreliable (0.46) (5) (14).
Pain frequency and intensity as assessed by the RAI-MDS 2.0 is weakly correlated to clinical rating scales of pain (5). Several studies have documented the unreliability and variable validity of the pain measures in the RAI-MDS 2.0 and noted that it underestimates pain for residents with cognitive impairments (30).
While the RAI-MDS 2.0 can accurately distinguish clinically significant differences in mental health, many mental health conditions do not have clear clini-cal guidelines and are difficult to diagnose, including mental health conditions such as delirium and dementia. Owing to these challenges, the RAI-MDS 2.0’s largest weakness is its poor measurement of indi-cators of mood and behavioral problems, particularly
delirium or dementia; which holds true in the US and internationally (20)(19)(31)(14)(5). The RAI-MDS 2.0 uses five items to indicate the presence of delirium, often referred to as acute confusional state, none of which have strong reliability (14). Reliability for indi-cators of delirium is 0.09 (14).
According to literature from the US, the RAI-MDS 2.0 is also weak at identifying depression in older nursing home residents (30). The items used in the RAI-MDS 2.0 to identify depression have not been well corre-lated to existing validated instruments of depression. Studies of the validity of the RAI-MDS 2.0 depression measures have been contradictory and inconclusive (30). Under-reporting of behavioral problems, visual acuity and incontinence has also been demonstrated in regards to the RAI-MDS 2.0 (5). Behavioral items in general on the RAI-MDS 2.0 range from low to moderate validity (0.24 to 0.5) (30). The instrument has lower validity for measurements of discharge potential, pain, prevention and skin conditions (32)(14)(23). One of the limitations of the RAI-MDS 2.0 is that it is not used as a basis for clinical communication between providers when residents are transferred from one site to another (5). The RAI-MDS 2.0 does not collect any data regarding the quality of life of residents, their autonomy or their satisfaction (5). The RAI-MDS 2.0 relies on data collected from the clinical team; it does not involve any direct resident inter-views. It has been argued that this lack of interaction between a provider and the resident in the assessment process disenfranchises residents and may contribute to providers missing critical information regarding a resident’s condition (33).

U B C C e n t r e f o r h e a lt h s e r v i C e s a n d p o l i C y r e s e a r C h
1 3
Provider FeedbackSemi-structured interviews identified a number of clinical areas in the RAI-MDS 2.0 where assessment and measurement were perceived by providers to be lacking. A summary of the themes identified in the interviews is presented in Table 1. Table 2 connects the themes to the available evidence from the literature.
The most commonly reported weakness of RAI-MDS 2.0 was measurement of dementia and behavioral health. There is evidence in the literature to substanti-ate these comments. Specifically, a number of findings report that the RAI-MDS 2.0 poorly measures indica-tors of mood and behavioral problems, particularly delirium or dementia (20)(19)(31)(14)(5).
Approximately one half of the stakeholders identi-fied that specific RAI-MDS 2.0 measures did not reflect the needs of bariatric residents. Another half
Table1.SummaryofqualitativefeedbackregardinglimitationsofRAI-MDS2.0byTopicArea
Table2.SummaryoftheevidencebyTopicArea
Topic
Number of respondents noting limitation (n=11 providers) Nature of concern
Dementia 10 Notmeasuredforhighneeds
Behavioralproblemsandaggressivebehaviors 9 Notmeasuredforhighneeds
Bariatricresidents 6 Notreflected
Youngerresidents 3 Notreflected
Lengthofcompletion 3 Toolongtocomplete
Topic Summary of evidence
Dementia Someevidence
Behavioralproblemsandaggressivebehaviors Someevidence
Bariatricresidents Absenceofresearch
Youngerresidents Absenceofresearch
of stakeholders identified that young patients, such as those with traumatic brain injuries, were poorly mea-sured in their social needs. For both of these resident populations, we could find no literature linking these characteristics with weaknesses in RAI-MDS 2.0. This lack of finding could be partially attributable to an emerging phenomenon of bariatric patients and low numbers of young patients being admitted into LTC, whereas previously, these patients were cared for in hospital-based chronic care beds.
An issue emerged from the semi-structured inter-views regarding a perceived lack of resources to properly assess residents (e.g. care staff conducting assessments without proper training). Averaging approximately 90 minutes and with over 400 ques-tions, the RAI-MDS 2.0 is a substantial investment in resident assessment, an investment which a number of stakeholders identified as taking too long to complete.

t h e a l B e r t a h e a lt h s e r v i C e s p C B f M o d e l f o r lt C : a r e v i e W a n d a n a ly s i s
1 4
In addition, a number of providers mention that the RAI-MDS 2.0 assessments require additional staff time that they are not directly compensated for—time that takes away from direct resident care.
Summary of RAI-MDS 2.0There are significant strengths to the RAI-MDS 2.0. The instrument has a strong body of evidence under-lying many aspects of its measurement. While there is literature that substantiates providers concerns regard-ing the RAI-MDS 2.0’s lack of ability to measure dementia and behavior problems, every assessment tool is likely to have some weaknesses.
AHS does not engage with providers regarding real or perceived weaknesses in the RAI-MDS 2.0. It is not clear whether this approach is attributable to lack of resources required to maintain excellence in assess-ment science. Regardless of the cause, AHS’s lack of engagement with providers is a source of frustration for providers.
AHS should take an active role in addressing provider concerns regarding RAI-MDS 2.0. AHS can do so by monitoring the assessment science literature, dissemi-nating summaries of related research and supporting Alberta-based research on care needs of the sub-pop-ulations in LTC. Given the absence of data regarding the directionality, magnitude or distribution of effects across these sub-populations, proposing changes to the PCBF model to address these issues is guesswork. In this gap, AHS should take a deliberative approach.
Other InstrumentsWhile the RAI-MDS 2.0 is the most common and widely used assessment instrument for LTC residents, several other instruments have been developed in attempts to address the shortcomings identified above.
Recommendation 1AHS should take an active role in addressing provider’s concerns regarding RAI-MDS 2.0 to measure dementia, behavioral problems, bariatric and needs of younger residents in the following ways:
a. Pursue research to examine the dis-criminate validity of RAI-MDS 2.0 for behavioral conditions and dementia.
b. Explore adjustments to the funding model for bariatric and younger resi-dent’s unmet social needs using targeted additional data collection.
MDS3.0
Nursing home residents are now older and are living longer, with more complex conditions that were previ-ously treated in acute or palliative facilities. In parallel, there have also been advancements in clinical assess-ment methods.
The MDS 3.0 was developed in response to changes in SNF resident characteristics since the implementation of the RAI-MDS 2.0 (34). The RAND Corporation developed the MDS 3.0 under contract to CMS. CMS owns the copyright for the MDS 3.0 and makes it publicly available. In developing the MDS 3.0 for CMS, RAND’s goals were to introduce advancements in assessment; increase the clinical relevance of assess-ment items; improve the accuracy and validity of the instrument; introduce the perspective of the resident through interview items; develop a shorter instrument that maintains quality indicators, quality measure-ment, payment through RUG-III and improve user satisfaction (34).

U B C C e n t r e f o r h e a lt h s e r v i C e s a n d p o l i C y r e s e a r C h
1 5
Recommendation 2AHS should weigh the costs and benefits of implementing the MDS 3.0.
Recommendation 3AHS should pursue discussions with Dr. Debra Saliba to gain a thorough understand-ing of the MDS 3.0.
During the development process for the MDS 3.0, content experts and stakeholder groups were con-sulted to determine which areas of the RAI-MDS 2.0 were thought to need revisions or replacement. Items identified included mood, behaviors disorders, mental status, delirium, falls and balance, pain, quality of life or preferences and diagnostic coding (35). These items have also been identified in the literature as being less valid and reliable than many other items in the RAI-MDS 2.0. The MDS 3.0 requires a full assess-ment at discharge, unlike the RAI-MDS 2.0, which only requires the completion of a tracking form. This change is expected to allow for a more comprehensive assessment of changes in the health of residents (28).
Minimizing the resource burden was one of the motivating factors behind developing and imple-menting the MDS 3.0 (36). The original aim of the interRAI researchers was for a full assessment with the RAI-MDS 2.0 to take no longer than 60 minutes and a re-assessment no longer than 45 minutes (37). Testing of the RAI-MDS 2.0 in the US revealed that the median time for a full assessment was 95 minutes, compared to 60 minutes for the MDS 3.0 (36).
MDS 3.0 also supports the derivation of Care Area Triggers (CATs) which summarize specific aspects of care that represent potential problems or risks to residents and can form the basis of care plan develop-ment. Items in MDS 3.0 serve as triggers in CATs.
MDS 3.0 has replaced the RAI-MDS 2.0 as the assessment instrument for Medicare’s prospective payment system (PPS) for SNFs since October 2010. CMS decided that the benefits of MDS 3.0 outweigh the costs of implementing a new assessment instru-ment. In other countries, the RAI-MDS 2.0 continues to be the instrument of choice for the collection of
assessment data in LTC settings, including nursing homes. It is expected that all Canadian provinces cur-rently using the RAI-MDS 2.0 will continue to do so for at least the next five years (8).
MDS 3.0 represents a potential alternative to the RAI-MDS 2.0 that addresses provider concerns regarding length of assessment and assessing resi-dents with mood and behavioral problems, especially dementia. Implementing a new assessment tool would be a costly undertaking for AHS and providers. The costs of implementing MDS 3.0 would include retraining assessors and modifying provincial data systems. Thus, Alberta must weigh the benefits of a more sensitive assessment tool, which is also faster to complete and involves the resident in a meaningful manner, with the costs of implementing a new tool.
To further the discussion regarding potential benefits and limitations of the MDS 3.0 assessment instru-ment, AHS should initiate a discussion with Dr. Debra Saliba, the Chair in Geriatrics and Gerontology at University of California, Los Angeles, who played an instrumental role in the development of the MDS 3.0 ([email protected]).

t h e a l B e r t a h e a lt h s e r v i C e s p C B f M o d e l f o r lt C : a r e v i e W a n d a n a ly s i s
1 6
ContinuityAssessmentRecordandEvaluation(CARE)
A known limitation of the RAI-MDS 2.0 is that it is generally incompatible with clinical, functional and behavioral data collected in acute or other post-acute care settings due to different points of assessment, different assessment windows, clinical items, time frames for data collection and measurement scales (38). These factors make it difficult for providers to transmit data from one care setting to another. It also makes it difficult to compare patient and/or resident characteristics such as severity, care plans, outcomes and costs across healthcare settings. To address the lack of continuity in assessment between settings, CMS launched the Post-Acute Care Payment Reform Demonstration (PAC-PRD) as part of the Deficit Reduction Act of 2005 (38).
The purpose of the PAC-PRD is to collect information on post-acute care populations using a standardized assessment instrument that uniformly collects data on patients being discharged from acute hospitals to one of four settings: long-term care hospitals, inpatient rehabilitation facilities, skilled nursing facilities and home health agencies (38). The goal of the project is to provide information that will support the creation of payment methods for clinically similar patients regardless of their care setting (38).
The PAC-PRD project resulted in the development of the Continuity Assessment Record and Evaluation (CARE) assessment instrument, developed by RTI International under contract to CMS. The CARE tool is designed to assess patients’ medical, functional and cognitive status at discharge from an acute care hospi-tal and at admission (within two days) and discharge (two days prior) from each post-acute care setting (38).
CARE is comprised of four clinical domains, includ-ing medical status/clinical complexity, functional status, cognitive status and social support factors (38). The instrument has a reduced duration of assessment, averaging 30 minutes for a healthy patients and 60 minutes for more complex patients (38).
CARE has demonstrated a high degree of reliability regardless of setting (38). The resource intensity com-ponent of CARE demonstrates that case-mix items explain variations in resource use and that patient characteristics can be used to explain costliness (38). CARE has demonstrated a greater sensitivity to patient changes than the RAI-MDS 2.0 (38). CARE is also mandated by CMS to be collected for the bundled payments initiative in the US, where it is referred to as B-CARE (38).3
SMAF
In some regions of Quebec, an integrated measure called the Functional Autonomy Measurement System (Système de mesure de l’autonomie fonctionnelle) or SMAF for long-term care is collected (39). The SMAF is a 29 item scale based on the WHO classifica-tion of disabilities and measured functional ability in five areas: ADL, mobility, communication, mental functions and instrumental activities of daily living (IADLs) (40). The SMAF was developed with the university and university hospital of Sherbrooke (41). It is up to each individual region within the province of Quebec to implement the SMAF, or not.
The assessment is used to generate 14 mutually exclusive ISO-SMAF profiles associated with costs of nursing care (40). The profiles do not currently include specialized rehabilitation services (42). This tool has been developed for use in home care,
3 http://www.econometricainc.com/markets/health_cms_caretool.html

U B C C e n t r e f o r h e a lt h s e r v i C e s a n d p o l i C y r e s e a r C h
1 7
intermediate facilities and long-term care in Quebec and can generate chronological reports about a patient’s functional autonomy over time, regardless of setting (43). The SMAF has been integrated into the Multi Client Assessment Tool since its acceptance for use by the Quebec Ministry of Health and Social Services in 2002 (42)(41).
The care profiles developed by the SMAF explained 82% of variations in nursing care time (compared to 57% explained by the RUGs in the US), 80% of varia-tions in skilled and unskilled nursing care costs and 57% of variations in total costs of LTC services (39). The SMAF is used to establish admission criteria for each different institution in Quebec (as it is developed for use in multiple facilities) and in some regions (i.e. Estrie and CLSCs in Montérégie) it is used to calculate budget requirements of different institutions, although this is not mandatory (43).
Assessment: Ongoing ChallengesIn post-acute care there is often a lack of clinical evidence to support the most effective treatment modalities. In the absence of such evidence, clinical judgment and local capacity often prevail, a factor
which often leads to wide variations in healthcare utilization, outcomes and spending.
This finding is true in Alberta, where the rate at which acute hospitals place patients in LTC varies consid-erably, even after adjusting for sex, age and health status differences. These variations in LTC placement suggest that there are factors associated with clinical practice or local capacity that affect where hospitalized patients are discharged to (referral patterns).
Using Alberta data, we calculated the age, sex and health status adjusted rate of admission into LTC for hospitalized patients from 107 hospitals. The rate is based on community admissions to hospital and excludes patients hospitalized in the previous six months. The results are presented as ratios, for each hospital, of LTC admissions relative to adjusted number of hospitalizations. The results in Figure 2 illustrate the variations in hospitals discharging patients to LTC.
The results of the analysis, shown in Figure 2, dem-onstrate a six-fold variation in hospital’s propensity to discharge medical patients to LTC, adjusting for age,
Figure2.AdjustedratioofplacementtoLTCforhospitalizedmedicalpatients,Alberta
0
5
6
4
3
2
1
8
7One acute care facility
LTC
pla
cem
ent
ratio
80
100
120
80
100
120
0 25 50
0 25 50 0 25
One LTC facility
One LTC facility
50
0 25 50 0 25 50
Calgary Central Edmonton
North SouthAve
rage
CM
IPe
rcen
t of
LTC
res
iden
tsA
vera
ge C
MI
Rate of inpatient admissions per 1,000 resident days
80
100
120
80
100
120
0 150 300
0 150 300 0 150 300
0 150 300 0 150 300
Calgary Central Edmonton
North SouthAve
rage
CM
I
Rate of emergency room visits per 1,000 resident days
South
North
Edmonton
Central
Calgary
90
92
94
96
98
100
102
Q8Q7Q6Q5Q4Q3Q2Q1
Perc
ent
chan
ge in
CM
I
Q8Q7Q6Q5Q4Q3Q2Q1-2.0
-1.5
-1.0
-0.5
0.0
0.5
1.0
1.5
2.0
2.5
South
North
Edmonton
Central
Calgary
0%
5%
10%
15%
20%
25%
30%
35%
40%
2009/10
2010/11
2011/12
2012/13
Behavioralproblems
RUG categories
Extensiveservices
Specialrehab
Specialcare
Impairedcognition
Clinicallycomplex
Reducedphysicalfunction
Behavioural problems 2%Extensive services 3%
Special rehab 3%
Specialcare 10%
Impairedcognition
12%
Clinicallycomplex
28%
Reducedphysicalfunction
38%

t h e a l B e r t a h e a lt h s e r v i C e s p C B f M o d e l f o r lt C : a r e v i e W a n d a n a ly s i s
1 8
sex and health status among patients not previously hospitalized in the preceding six months. If there were consistency between hospitals in the rate at which they discharged their patients to LTC, controlling for age, sex and health status, the hospital’s ratios would be expected to be similar.
Analysis of Alberta data indicates wide variation in the propensity to discharge hospitalized patients to LTC. Some portion of hospital discharges to LTC is unwarranted and is influenced by local LTC capacity, availability of assisted living space and community supports, and treatment style. These wide variations point to opportunities for streamlining care processes for common conditions in order to improve equitable distribution of LTC funding by improving the effec-tiveness of acute and post-acute care delivery and spending.
Recommendation 4AHS should reduce hospital’s variation in pro-pensity to discharge to LTC by standardizing care processes for common conditions.
Recommendation 5AHS should assess the benefits of standard-ized patient assessments starting in the hospital, across settings and over time.

U B C C e n t r e f o r h e a lt h s e r v i C e s a n d p o l i C y r e s e a r C h
1 9
2. Case-mix MethodsCase-mix methods consist of two steps. Algorithms are first used for assigning residents to discrete groups. Then, each resident assigned to the same group is assigned a numerical value which represents their relative expected costliness for a day of care. This approach to defining and valuing the intensity of care needs and costs is used across sectors. In the acute care sector, diagnosis related groups (DRGs) have been used for over 30 years for prospectively funding hospital care in the US. This approach has since pro-liferated across Europe. A similar approach has also been used in ambulatory, rehabilitation and mental health settings in different countries. In Canada, British Columbia and Ontario are currently adapting similar methods to fund a portion of the acute care demands of their residents.
The RUG-III is a widely used methodology for clas-sifying long-term care residents into categories using data collected through the RAI-MDS 2.0 (44)(45). The 44 category RUG-III system was developed from data describing costs of providing care to SNF residents in the US (45). There are seven major clinical categories, in order of clinical costs, beginning with special reha-bilitation, extensive services, special care, clinically complex, impaired cognition, behavior problems and ending with reduced physical functions (45). Within these seven categories, there are further subdivisions based on the assessment of a resident.
The RUG-III is a good predictor of the costliness of care for LTC residents, describing 56% of the varia-tion in total per diem costs of SNF residents in the US (45)(46). The RUG-III system successfully identi-fies residents with high technology (and thus high cost) procedures, such as ventilators, as well as those residents with cognitive impairments and low ADL scores, such as coma patients (45).
Studies show that the RUG-III system tends to distribute nursing home funding in alignment with resident care costs and that nursing homes in the US are paid more equitably under PPS than the previous cost-based system (47)(48). One study concludes that access to long-term care for residents that need it most improves under the RUG-III system (48).
Research has found that program administration costs typically increase with the introduction of RUG-III and prospective funding, though there is limited evidence to substantiate the claims regarding adminis-tration costs (47)(48).
The RUG-III is used for funding some portion of long-term care in Sweden, Italy, Japan, the UK, the Netherlands, Finland, Korea and the Czech Repub-lic (49)(46)(50)(51). These countries have since adjusted the RUG-III categories to suit the needs of their approach to funding LTC. In Finland, several groups in the 44-group RUG-III are relatively rare in established patterns of long-term care, so a 22-group model was tested (25). This number was arrived at by collapsing a number of groups deemed inessential including the number of rehabilitation groups col-lapsing to three from 12, due to established patterns of care which saw few heavy rehabilitation residents (25). The 22-group RUG-III was found to be both reliable and valid in the Finnish LTC sector.
In Ontario, implementation of funding reforms for LTC based on the RUG-III groupings is well underway. Ontario uses a version of RUG-III with 34 categories. The 34 group RUG-III methodology adjusts the nursing and personal care (NPC) envelope funding for LTC providers (13). Funding changes based on the new categories have been phased in for providers from April 2010 until March 2013 (13). In

t h e a l B e r t a h e a lt h s e r v i C e s p C B f M o d e l f o r lt C : a r e v i e W a n d a n a ly s i s
2 0
Quebec, the RUG-III system was seen as problematic for use because it was developed for SNFs and its suit-ability for use in a population of primarily long-stay patients has not been adequately determined (39).
With the implementation of MDS 3.0 for SNF-based care beginning in October 2010, a new case-mix algorithm was also developed, named RUG-IV. CMS contracted with Iowa Foundation for Medical Care to develop RUG-IV (52). The implementation of RUG-IV for prospectively funding SNFs began in October 2011 (52). There are 66 categories in the RUG-IV, most of which are an expansion of rehabili-tation and extensive services categories (53). There are also two new major RUG-IV categories, “special care high” and “special care low” (53). The RUG-IV has been adopted by several state Medicaid programs, for example, Minnesota adopted a 50 group RUG-IV effective January 1, 2012, moving from the 34 group RUG-III.
Contrasting Case-mix MethodsThere are a significant number of algorithms that cat-egorize LTC patients into groups for AHS to choose from. As the primary payer of LTC, AHS should align the number and type of groups with the services AHS is seeking from Alberta’s LTC sector.
For example, prospective payment of SNF-based care in the US has led to a significant number of additional groups associated with intense rehabilitation. In con-trast, Ontario has significantly decreased the number of groups associated with intense rehabilitation by applying the RUG-III with 34 groups.
Semi-structured interviews of providers shed light on the number of RUG-III groups applicable in Alberta. Nine of the 11 stakeholders interviewed reported that
they offered little or no intensive rehabilitation at their sites. The distribution of resident days among RUG-III groups substantiates the stakeholder’s comments, as Figure 3 shows; there are a small proportion of resi-dents categorized in Special Rehabilitation in Alberta.
Figure3.PercentageofresidentsineachRUGhierarchicalgroup,2012/13.
0
5
6
4
3
2
1
8
7One acute care facility
LTC
pla
cem
ent
ratio
80
100
120
80
100
120
0 25 50
0 25 50 0 25
One LTC facility
One LTC facility
50
0 25 50 0 25 50
Calgary Central Edmonton
North SouthAve
rage
CM
IPe
rcen
t of
LTC
res
iden
tsA
vera
ge C
MI
Rate of inpatient admissions per 1,000 resident days
80
100
120
80
100
120
0 150 300
0 150 300 0 150 300
0 150 300 0 150 300
Calgary Central Edmonton
North SouthAve
rage
CM
I
Rate of emergency room visits per 1,000 resident days
South
North
Edmonton
Central
Calgary
90
92
94
96
98
100
102
Q8Q7Q6Q5Q4Q3Q2Q1
Perc
ent
chan
ge in
CM
I
Q8Q7Q6Q5Q4Q3Q2Q1-2.0
-1.5
-1.0
-0.5
0.0
0.5
1.0
1.5
2.0
2.5
South
North
Edmonton
Central
Calgary
0%
5%
10%
15%
20%
25%
30%
35%
40%
2009/10
2010/11
2011/12
2012/13
Behavioralproblems
RUG categories
Extensiveservices
Specialrehab
Specialcare
Impairedcognition
Clinicallycomplex
Reducedphysicalfunction
Behavioural problems 2%Extensive services 3%
Special rehab 3%
Specialcare 10%
Impairedcognition
12%
Clinicallycomplex
28%
Reducedphysicalfunction
38%
The number and type of groups that AHS should use is a policy decision that takes into account the type and intensity of clinical services AHS wants residents to be provided in LTC. For example, increasing thera-pies may be a desirable outcome, but with little clinical evidence to point to the optimal amount of rehabilita-tion for many types of LTC residents, including a large number of rehabilitation-based groups, will lead to wide variations between providers in the amount of therapies provided.
Recommendation 6Align the number of RUG-III groups with the clinical services AHS wants residents to be provided in LTC and reduce RUG-III to 34 groups.

U B C C e n t r e f o r h e a lt h s e r v i C e s a n d p o l i C y r e s e a r C h
2 1
Case-mix IndicesCMIs are relative value weights that accompany the RUG-III case-mix system. Each RUG-III category has an associated CMI, a number which represents the average of expected daily costs of caring for residents in the same group (44). CMIs are applied to each day a resident is in a bed. When applied in this manner, the weighted days are referred to as resident-weighted patient days.
The CMI is important since it represents the expected relative cost of caring for any resident in the same RUG-III group and determines the proportional amount of funding for each day of a resident’s stay. The value serves as an important benchmark for LTC providers, who have an economic incentive for their costs to be less than the revenue associated with each resident.
In many case-mix based funding systems, relative value weights are based on the average of a sample of patients/residents costs of healthcare services. That the average may not represent best practices, high quality, or potentially inappropriate care is ignored. In contrast, work is being done in some healthcare systems to align best practices with funding, such as Ontario’s Quality Based Procedures (54) or Medicare’s Value-Based Purchasing (55). Alberta’s PBCF for LTC follows international convention by using averages.
The CMIs are based on two inputs, staff time measures (STM) and wage rates. The STM represent the number of minutes of care provided by each type of care-giver to each resident. STM are obtained by having trained personnel follow a select sample of caregivers with a stopwatch and measuring how long they spend with
each resident (non-resident time, such as completing assessments was not included). This process provides a very accurate reflection of the direct staff time (labor inputs) used to care for LTC residents (52). The categories of labor inputs measured for CMIs are registered nurses (RNs), licensed vocational nurses and care aides.
Wage rates for each provider type are the second input. For each RUG-III group, the number of minutes of care provided by each caregiver is calcu-lated by multiplying the relative average wage rate by the STM to derive the salary weighted minutes for each caregiver type. The salary weighted minutes for each caregiver type are summed together to calculate the total salary of weighted minutes of care. In a final step, the CMI are calculated as the quotient of the RUG-III group’s total salary weighted minutes of care and the overall average total salary weighted minutes of care. The salary weighted approach is the approach used in Ontario to derived CMI and is also recom-mended for AHS4 by CIHI (56).
When CMI values are recalculated annually by AHS, current wage rates are input; however, there are a number of limitations with the use of STM data by AHS. The STM data is very stale; it is based on data from 1997. Since STM data is the anchor of the CMI, a key concern is whether there have been changes in clinical practices or scope of practice since 1997 that have changed the proportional distribution of staff time measures between the staff time categories. The sample of staff time measures is quite small for some RUG-III categories. For example, the BB (behavior problems) RUG-III groups all have less than 100 staff time measures.
4 Gordon Kramer, Alberta Health Services, personal communications, June 2013.

t h e a l B e r t a h e a lt h s e r v i C e s p C B f M o d e l f o r lt C : a r e v i e W a n d a n a ly s i s
2 2
The perspective of stakeholders on the CMI is mixed. All providers interviewed were supportive of including the most recent wage rate data for annu-ally updating CMIs. Two LTC providers expressed concerns regarding stale STM data in their interviews. The remaining LTC providers were unaware of the methods used to derive CMIs.
While it is common for new users of case-mix systems to adopt algorithms and CMIs from other jurisdic-tions, most countries move towards developing data or information systems based on local data. This is done partly to address local variations in patterns and costs of care, but also to respond to local stakeholder concerns regarding representativeness.
As providers learn the inner workings of the methods used to calculate CMI over time, they are likely to become increasingly critical of the underlying STM data; already a number of stakeholders have identified that CMI are not aligned with their current resource needs. An example that underscores the potential discrepancy between resource intensity and the 1997 STM data is the mandated minimum of two baths per week per resident. When the STM data was collected, the collection did not include Alberta-specific man-dates for minimum activity levels.
With the absence of provincial data indicating otherwise, AHS has no evidence to refute criticisms of CMIs, nor is AHS taking steps to create the data or information to create CMIs reflective of patterns or costs of care in Alberta. The mixed perspectives articulated by provider and non-providers suggest that there is a window of opportunity for AHS to develop the systems and data to calculate CMI based on local data.
CMIs are constructed to represent two elements: direct staff time to provide resident care and wage rates of various types of providers. As mentioned above, the proportion of resident’s cost described by RUG-III CMIs is 56%. Two providers noted that there is some portion of resident’s costs not reflected in CMIs that is expected to be incorporated into facility’s PCBF funding. Supplies and nursing admin-istration fall into this category. If the intensity of these non-direct staff time expenses is not uniform across RUG-III groups the CMIs represent a distorted picture of resident’s costs.
The magnitude of the effect of using direct staff time measures as the sole basis of RUG-III CMIs, when other expenses are expected to be incorporated into facility’s PCBF funding, is unknown. Since reviewing the financial data of providers was out of scope of this review, this report cannot identify specific strategies for using MIS data to evaluate non-direct staff time expenses, and the effect on CMIs, was not pursued.
Application of Case-mix to Provider’s RAI-MDS 2.0 DataCase-mix adjustment of LTC funding refers to the multi-step process of using each resident’s RAI-MDS 2.0 clinical data to categorize patients into one of 44 (or other numeric combinations) RUG-III groups. Then, the RUG-III group’s CMI value is applied to weighting the resident’s days. A provider’s weighted resident days (WRD) is the sum of their resident’s
Recommendation 7AHS should update the CMI to reflect current standards of care in Alberta.

U B C C e n t r e f o r h e a lt h s e r v i C e s a n d p o l i C y r e s e a r C h
2 3
Recommendation 8Give each provider retrospectively re-weighted activity data with revised CMI values for the previous two years.
WRD, while a provider’s CMI is the quotient of the facility’s WRD and the number of resident days times one hundred. In application, there are adjustments to this process to reflect special circumstances, such as patient turnover.
A facility’s CMI is used to compare the relative resource intensity between providers based on their resident’s characteristics. For example, if one facil-ity’s CMI is 100 while another’s is 110, the expected costliness of the second facility is 10% higher than the former facility.
Updating CMIs on an annual basis is typical prac-tice in countries that use case-mix methods to fund healthcare. Three providers indicated during their interviews that their CMI drops from year to year using new CMI values in spite of resident acuity increasing over time. This change in CMI values is a function of reweighting the wage weighted minutes of care using new input wage rates to the average wage weight minutes of care plus underlying actual changes in resident’s case-mix.
From the LTC provider’s perspective, a drop in CMI is counterintuitive unless accompanied by a compelling clinical rationale. The provider’s confusion between perception of increasing acuity and fall in CMI is natural and undermines the credibility in updated CMI values and WRD.
Alberta LTC Case-mixAccording to an international review, case-mix based funding programs impact quality of care in both positive and negative ways, and any funding system should be designed to mitigate negative consequences (48). The sections below address positive and nega-tive aspects of the LTC funding approach using the methods described above.
The distribution of resident days has changed over time in Alberta’s LTC sector. There are remarkable increases in residents being categorized as “Extensive Services” over the past four years. Table 3 provides more details regarding the changes in hierarchi-cal RUG groups between 2009/10 and 2012/13. The changes in groups across these two years are sta-tistically significant (Pearson Chi-square=361.58, p<0.001).
Regional variations in CMI are also observed. Figure 4 illustrates the CMI by zone, where Q1 to Q4 represent 2011/12 and Q5 to Q8 represent 2012/13. Calgary and Edmonton have the highest CMI, but the North zone experiences the largest increase in CMI, moving from approximately 91 to over 96 over the two year period. These increases may be partially attributable to improving RAI-MDS 2.0 coding practices which result in increased CMI (and portion of CMI-based funding).
Quarterly CMI values demonstrate significant percentage change in CMI for LTC. Figure 5 shows the percent change in CMI over time by zone, where Q1 to Q4 represent 2011/12 and Q5 to Q8 represent 2012/13. The most dramatic changes were observed in the North zone, where a 3 point change in CMI was experienced from Q1 to Q3, which subsequently fell by nearly 4.5 points in Q4.

t h e a l B e r t a h e a lt h s e r v i C e s p C B f M o d e l f o r lt C : a r e v i e W a n d a n a ly s i s
2 4
Table3.ProportionofresidentdaysineachRUGhierarchicalgroup,byfiscalyear
Figure4.AveragequarterlyCMIforAlbertaLTCbyzone
Figure5.QuarterlypercentchangesinaverageCMIforLTCinAlberta,byzone
RUG hierarchyFiscal 2009/10(n) %
Fiscal 2012/13(n) %
Specialrehabilitation 1,895 5% 1,855 5%
Extensiveservices 13,987 38% 15,795 43%
Specialcare 4,377 12% 3,940 11%
Clinicallycomplex 2,003 5% 1,697 5%
Impairedcognition 10,182 28% 9,703 27%
Novalidassessment(AHScode) 1,657 5% 951 3%
Withintwoweeks(AHScode) 1,879 5% 1,828 5%
Missing 603 2% 578 2%
0
5
6
4
3
2
1
8
7One acute care facility
LTC
pla
cem
ent
ratio
80
100
120
80
100
120
0 25 50
0 25 50 0 25
One LTC facility
One LTC facility
50
0 25 50 0 25 50
Calgary Central Edmonton
North SouthAve
rage
CM
IPe
rcen
t of
LTC
res
iden
tsA
vera
ge C
MI
Rate of inpatient admissions per 1,000 resident days
80
100
120
80
100
120
0 150 300
0 150 300 0 150 300
0 150 300 0 150 300
Calgary Central Edmonton
North SouthAve
rage
CM
I
Rate of emergency room visits per 1,000 resident days
South
North
Edmonton
Central
Calgary
90
92
94
96
98
100
102
Q8Q7Q6Q5Q4Q3Q2Q1
Perc
ent
chan
ge in
CM
I
Q8Q7Q6Q5Q4Q3Q2Q1-2.0
-1.5
-1.0
-0.5
0.0
0.5
1.0
1.5
2.0
2.5
South
North
Edmonton
Central
Calgary
0%
5%
10%
15%
20%
25%
30%
35%
40%
2009/10
2010/11
2011/12
2012/13
Behavioralproblems
RUG categories
Extensiveservices
Specialrehab
Specialcare
Impairedcognition
Clinicallycomplex
Reducedphysicalfunction
Behavioural problems 2%Extensive services 3%
Special rehab 3%
Specialcare 10%
Impairedcognition
12%
Clinicallycomplex
28%
Reducedphysicalfunction
38%

U B C C e n t r e f o r h e a lt h s e r v i C e s a n d p o l i C y r e s e a r C h
2 5
The significant variation in CMI demonstrated above is mirrored by individual LTC providers’ change. Vex-ingly, turnover in long-stay residents typically results in gradual change in CMI over time. Thus, this degree of variation is remarkable unless affected by signifi-cant changes in RAI-MDS 2.0 coding practices.
Variations in CMI are important because the third quarter CMI determines the next fiscal year’s CMI and proportional allocation of LTC funding. The three month CMI calibration period was raised by five LTC providers in the context of limitations of the current PCBF model. All five providers thought a one quarter calibration period was inaccurately reflecting the underlying, and unobserved, CMI. A number of LTC providers expressed that prospective applica-tion of CMI based on one quarter’s data was leading to frustration with the PCBF model. Based on the period-to-period variability observed in LTC provid-er’s CMI values in Figure 5, the concerns of providers are not unfounded.
In addition to the above sentiments, one LTC provider discussed three potential outcomes related to CMI variability and the effects of calibration based solely on Q3. First, there is an explicit incentive for LTC providers to maximize coding effort in Q3. Second, the approach creates an explicit incentive to maximize the provision of rehabilitation during Q3 in order to increase CMI and funding. This latter possibility undermines the intent and credibility of the funding model and potentially over-provides services to some residents. Lastly, maximums achieved during Q3 may be an indicator that upcoding is occurring (discussed in more detail later).
One of the strengths of activity-based funding is the transparency and stability it provides (57). Highly variable CMIs undermine this objective.
Unmeasured Case-MixAlmost all providers indicated that the burden of care for some residents was not being measured by CMI or PCBF funding, representing unmeasured case-mix. Unmeasured case-mix is a problem because represents resident’s care needs beyond the ability of providers to control. As discussed above, potential conditions that are unmeasured are dementia, delirium, behaviors, pain and resident’s unmet social needs.
Determining the magnitude of unmeasured case-mix involves several parts. There is currently no method to reliably identify affected residents, thus the unmea-sured burden of caring for them is unknown. Due to the inability to clearly identify affected residents, the distributive impact of the disconnection between gaps in measurement, intensity of resident care needs and the funding provided to facilities is unknown. In other words, if the prevalence and intensity of affected
Recommendation 9AHS should broaden the CMI calibration period beyond one quarter to using the preceding three quarters (Q1-Q3).
Recommendation 10AHS should work with providers to minimize unwarranted variability in CMIs by:
a. Looking at resident level variability over time in rehabilitation and extensive services.
b. Contrasting the sum of rehabilitation minutes by provider with reported work-load statistics.

t h e a l B e r t a h e a lt h s e r v i C e s p C B f M o d e l f o r lt C : a r e v i e W a n d a n a ly s i s
2 6
residents is even across facilities, and these residents are not ‘cohorted,’ then the impact on PCBF alloca-tions is likely to be negligible.
Failing to meet provider expectations about case-mix measurement has resulted in expressly frustrated providers. All providers interviewed identified unmeasured case-mix as a current problem with the PCBF model.
Recommendation 11Immediately develop a short- and long-term plan for addressing unmeasured case-mix.
As part of the AHS plan to address unmeasured case-mix, AHS should determine which resident’s burden of care may not be reflected in the RAI-MDS 2.0, CMI or special program funding. Then, AHS needs to determine whether there are undiscovered cor-relates of residents with unmeasured case-mix in the RAI-MDS 2.0. If correlates of unmeasured case-mix already exist in the RAI-MDS 2.0, AHS can use them to determine whether there is even distribution across facilities and what the magnitude of the effect is. If the magnitude is significant, AHS can construct an overlay to CMIs to reflect the increased costs of caring for these residents.
If no correlates are found, AHS should determine whether additional data items are required to iden-tify affected residents (interRAI permits the use of additional data items). If this direction is followed, AHS should solicit input from experts in the field and pilot the collection of supplemental data items which can be used to identify affected residents. AHS can then use this information to determine whether the
magnitude of the unmeasured burden of care affects CMIs and determine whether the additional data items should supplement the collection of RAI-MDS 2.0 data and whether an overlay to CMIs should be constructed and implemented.
Unmeasured case-mix is an issue in all sectors of care, not just LTC, and is challenging to resolve since it requires resident assessment instruments that adapt to evolving models of care and characteristics of resi-dents admitted to LTC, evolving case-mix methods and ongoing data collection regarding resident’s costs. Since increasingly complex and frail residents will likely be residing in LTC in the future, the problem of unmeasured case-mix will not be a ‘one-off.’
Alberta LTC and the Healthcare SystemThe interaction between LTC and other healthcare sectors provides ancillary information regarding pro-vider’s case-mix. If provider’s case-mix is high (high CMI), we would expect a larger number of hospital-izations and ED visits (since the amount of intensive rehabilitation provided is negligible). Thus, we examine the relationship between LTC provider’s case-mix and rate of acute hospital utilization using data from 2011/12 and 2012/13 in order to understand the variability in provider’s CMI. Using bivariate analyses, the relationship between the average LTC providers’ CMI and inpatient admission rate was evaluated.
Figure 6 illustrates the rate of inpatient admissions and the average CMI per LTC site across the province’s five zones. Each dot in the scatterplot represents a pro-vider site and each site’s placement on the scatterplot is representative of their CMI and rate of inpatient admissions. The analysis reveals that CMI is inde-pendent of the rate of inpatient admissions. In other

U B C C e n t r e f o r h e a lt h s e r v i C e s a n d p o l i C y r e s e a r C h
2 7
Figure6.Rateofinpatientadmissionsper1,000residentdaysandaverageCMIperLTCfacility,byzone
Note:Thex-axesonthesefigureshavebeentruncatedat50inpatientadmissionsper1,000residentdaystobettershowthedistributionofthemajorityofLTCfacilties.OnefacilityisnotshownforEdmonton,twoarenotshownforNorth,andoneisnotshownforSouth.
0
5
6
4
3
2
1
8
7One acute care facility
LTC
pla
cem
ent
ratio
80
100
120
80
100
120
0 25 50
0 25 50 0 25
One LTC facility
One LTC facility
50
0 25 50 0 25 50
Calgary Central Edmonton
North SouthAve
rage
CM
IPe
rcen
t of
LTC
res
iden
tsA
vera
ge C
MI
Rate of inpatient admissions per 1,000 resident days
80
100
120
80
100
120
0 150 300
0 150 300 0 150 300
0 150 300 0 150 300
Calgary Central Edmonton
North SouthAve
rage
CM
I
Rate of emergency room visits per 1,000 resident days
South
North
Edmonton
Central
Calgary
90
92
94
96
98
100
102
Q8Q7Q6Q5Q4Q3Q2Q1
Perc
ent
chan
ge in
CM
I
Q8Q7Q6Q5Q4Q3Q2Q1-2.0
-1.5
-1.0
-0.5
0.0
0.5
1.0
1.5
2.0
2.5
South
North
Edmonton
Central
Calgary
0%
5%
10%
15%
20%
25%
30%
35%
40%
2009/10
2010/11
2011/12
2012/13
Behavioralproblems
RUG categories
Extensiveservices
Specialrehab
Specialcare
Impairedcognition
Clinicallycomplex
Reducedphysicalfunction
Behavioural problems 2%Extensive services 3%
Special rehab 3%
Specialcare 10%
Impairedcognition
12%
Clinicallycomplex
28%
Reducedphysicalfunction
38%
words, if a higher CMI was associated with higher admissions, there would be a positive relationship in the scatterplots, represented by a positively-sloped line across the scatterplots.
Using bivariate analyses, the relationship between the average CMI and visits to the emergency depart-ment was evaluated, stratified by zone. The CMI was not associated with the rate of visits to the emergency room. Figure 7 illustrates the rate of visits to the emer-gency room and the average CMI per LTC facility across the province’s five zones. Based on the analyses
of Figure 7, there is no relationship between a site’s CMI and the rate of ED visits. Being in the North zone did significantly increase the likelihood of an emer-gency room visit.
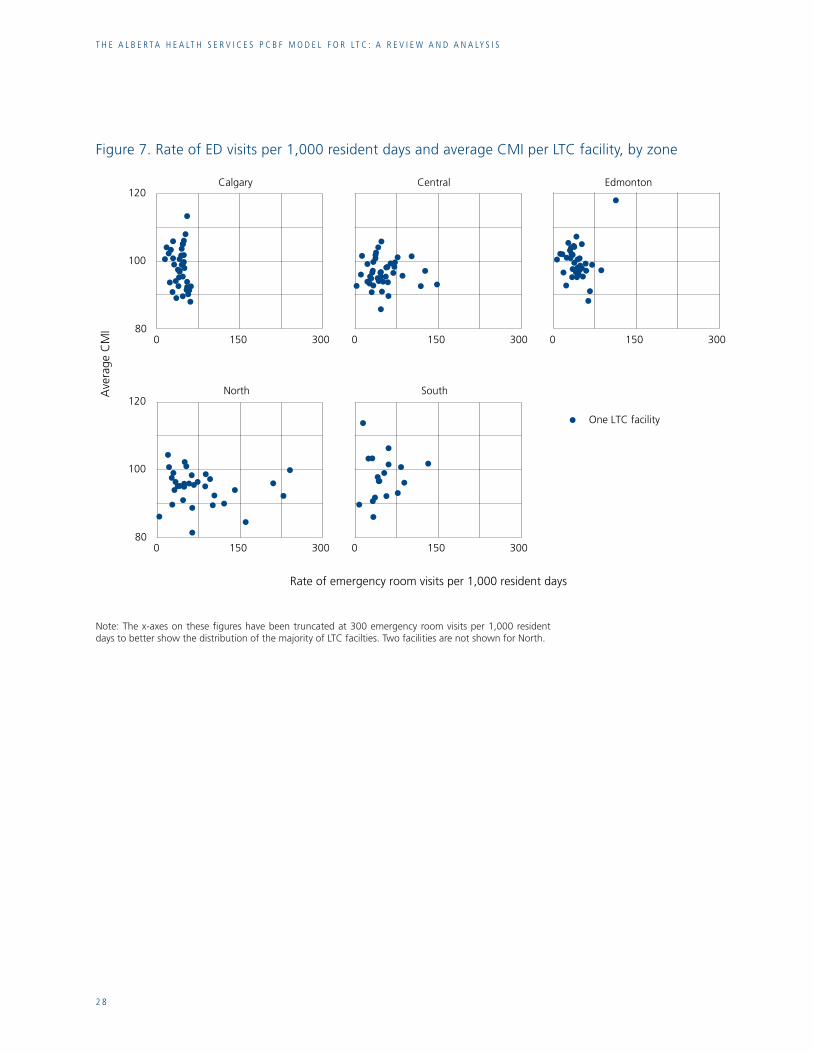
t h e a l B e r t a h e a lt h s e r v i C e s p C B f M o d e l f o r lt C : a r e v i e W a n d a n a ly s i s
2 8
Figure7.RateofEDvisitsper1,000residentdaysandaverageCMIperLTCfacility,byzone
0
5
6
4
3
2
1
8
7One acute care facility
LTC
pla
cem
ent
ratio
80
100
120
80
100
120
0 25 50
0 25 50 0 25
One LTC facility
One LTC facility
50
0 25 50 0 25 50
Calgary Central Edmonton
North SouthAve
rage
CM
IPe
rcen
t of
LTC
res
iden
tsA
vera
ge C
MI
Rate of inpatient admissions per 1,000 resident days
80
100
120
80
100
120
0 150 300
0 150 300 0 150 300
0 150 300 0 150 300
Calgary Central Edmonton
North SouthAve
rage
CM
I
Rate of emergency room visits per 1,000 resident days
South
North
Edmonton
Central
Calgary
90
92
94
96
98
100
102
Q8Q7Q6Q5Q4Q3Q2Q1
Perc
ent
chan
ge in
CM
I
Q8Q7Q6Q5Q4Q3Q2Q1-2.0
-1.5
-1.0
-0.5
0.0
0.5
1.0
1.5
2.0
2.5
South
North
Edmonton
Central
Calgary
0%
5%
10%
15%
20%
25%
30%
35%
40%
2009/10
2010/11
2011/12
2012/13
Behavioralproblems
RUG categories
Extensiveservices
Specialrehab
Specialcare
Impairedcognition
Clinicallycomplex
Reducedphysicalfunction
Behavioural problems 2%Extensive services 3%
Special rehab 3%
Specialcare 10%
Impairedcognition
12%
Clinicallycomplex
28%
Reducedphysicalfunction
38%
Note:Thex-axesonthesefigureshavebeentruncatedat300emergencyroomvisitsper1,000residentdaystobettershowthedistributionofthemajorityofLTCfacilties.TwofacilitiesarenotshownforNorth.

U B C C e n t r e f o r h e a lt h s e r v i C e s a n d p o l i C y r e s e a r C h
2 9
3: Data IntegrityThe PCBF model is a data-driven approach to allocat-ing LTC funds among providers, a process which is directed by the input data submitted by providers. Since data is crucial to the funding allocations, this report reviews the timeliness, completeness and accu-racy of RAI-MDS 2.0 data which is used to support the PCBF model.
Frequency of AssessmentInterRAI suggests six different triggers for collect-ing the RAI-MDS 2.0 assessments for long-term care patients. A number of these triggers are time-based, while others are patient-driven, such as a change in medical status, and one trigger is based on correcting previously submitted data. The list of triggers are (58): • Admission• Annually• Significant change in status• Significant correction of prior full assessment• Assessments every 90 days• Significant correction of prior 90-day assessment
InterRAI recommends that other data be collected periodically, including: • Re-admission (either with or without a missed
regular assessment)• Discharge• Update record (completed if administrative data
elements have changed)• Special project (collect supplemental data at the
request of the facility)
Alberta Health mandates the collection of the RAI-MDS 2.0 at admission, every 90 days and after any significant change in health status (59).
Qualitative assessment of providers in Alberta indi-cates that 90-day assessment submissions represent
a balance between documentation demands and current clinical status. Two LTC providers described that, for a number of clinically stable residents, 90-day assessments were excessive; however, this view was not universal. Other LTC providers interviewed indicated that the 90-day assessment schedule repre-sented a clinically appropriate guideline to assessment. A 90-day assessment of residents resonates with LTC operators in Alberta. There is an incentive for assessments for new residents and change of status assessments to be completed in a timely manner.
Recommendation 12Maintain the current frequency of RAI-MDS 2.0 assessment guidelines.
Timeliness of Reporting To align AHS funding with LTC activity there is a strong need for timely RAI-MDS 2.0 assessments. Absence of timely data will weaken the link between funding and underlying activity. All providers noted that they have directed resources into timely submis-sion of RAI-MDS 2.0 data.
Table 3 illustrates significant improvements in the number of RAI-MDS 2.0 submissions with valid assessment data; nonetheless, there are instances in which RAI-MDS 2.0 data is not complete (missing a 90-day assessment). Beds known to be occupied, but for which a RAI-MDS 2.0 assessment is not received in the 90 preceding days are assigned a low-valued RUG-III category and corresponding CMI. This strategy creates an incentive for the provider to submit data and is similar to that used in Ontario’s former Integrated Population-Based Allocation funding model.

t h e a l B e r t a h e a lt h s e r v i C e s p C B f M o d e l f o r lt C : a r e v i e W a n d a n a ly s i s
3 0
ReportingAccording to the CIHI RAI-MDS 2.0 manual, guide-lines for completing the assessment state “an accurate and comprehensive assessment requires that infor-mation about residents be gathered from multiple sources” (58). Sources which provide input into the assessment include patient records, all care providers and the resident’s physician and family. There is no specific recommendation about who should partici-pate in the assessments or who should ultimately be responsible for them so long as they are done accu-rately, though it is recommended that each provider develop their own policies (58).
CIHI recommends that if more than one person is participating in the assessment that an Assessment Coordinator be assigned who will ensure that the assessment is complete (58). There is no specific recommendation for use of an electronic versus a paper form, so long as each is filled out according to the definitions or coding conventions prescribed in the RAI-MDS 2.0 manual (58). On this point, a number of providers emphasize the importance of an IT infrastructure that can facilitate the collection and use of RAI-MDS 2.0. In their view, IT systems could reduce the amount of time and labor that col-lecting RAI-MDS 2.0 currently requires and facilitate analysis. While this is likely true, AHS has not been prescriptive in the type of software to use or charac-teristics that such a system should have, so this report provides no recommendations on this point.
A number of providers express concerns regarding the reliability of the RAI-MDS 2.0 data, with large observed inter-rater variations in assessments. In part, variability in RAI-MDS 2.0 data can be attributed to variability between LTC providers regarding which personnel have the responsibility for completing and
submitting the assessments. While the clinical team has input into the assessment, RAI-coordinators play a key role in ensuring completion and submission of the RAI-MDS 2.0 assessment. The approach of using RAI-coordinators appears to be dominant among larger LTC providers. A number of smaller provid-ers report having a less centralized structure, wherein there is no RAI-coordinator to assist with coordina-tion among team members regarding the completion and submission of the RAI-MDS 2.0 assessment. In the latter situation, the clinical team completes a hardcopy of the assessment form and a technician enters the completed form into an electronic interface for submission.
There does not appear to be a relevant evaluation of the accuracy of RAI-MDS 2.0 data for either approach to completing the assessment. In the former case, a number of LTC providers indicated that they rely heavily upon their RAI-coordinators for a number of key functions, including: • Resolving inconsistent data item interpretation
between clinical team members • Interpreting the RAI-MDS 2.0 instrument
guidelines• Ensuring data item accuracy• Maintaining timely and complete data RAI-MDS
2.0 submissions to AHS
In addition, RAI-coordinators play a large role in education and communication about RAI-MDS 2.0 to providers and staff of the facility by providing a central point of contact for all RAI-MDS 2.0 related ques-tions and concerns. In many cases, RAI-coordinators establish and communicate timelines for assessments, establish internal auditing processes and provide edu-cation sessions and other ongoing training to staff.

U B C C e n t r e f o r h e a lt h s e r v i C e s a n d p o l i C y r e s e a r C h
3 1
RAI-coordinators play an important role in ensuring accuracy, consistency, timeliness and education sup-porting the RAI-MDS 2.0 assessment.
Recommendation 13AHS should establish a provincial expert to resolve questions on interpreting or apply-ing the RAI-MDS 2.0 instrument with extra support targeted at smaller LTC providers that do not have a dedicated RAI-coordinator.
Consistent interpretation of the RAI-MDS 2.0 guidelines will result in reduced within-provider CMI variability unrelated to resident acuity or change in case-mix. Smaller providers do not have the scale to maintain a full-time RAI-coordinator.
Auditing and AccuracyA necessary component of ABF is the development of methods to assure data quality and to minimize the risk of fraudulent data submissions, such as upcod-ing (60)(61). Policies implemented by Medicare for prospective payment of SNF are designed to prevent, identify and recover funds based on fraud and upcod-ing. Currently, few provinces have comprehensive audit or monitoring systems, nor have provinces released policies regarding penalties for upcoding or other fraudulent data submissions to increase provider revenue.
The US has developed and implemented extensive processes to reduce the risk of upcoding across pro-spective payment in all healthcare sectors paid for by Medicare, including SNFs (62). Audits of administra-tive data are performed at regular intervals on random samplings of claims data.
The US is the only jurisdiction where the intentional or unintentional misreporting of data is considered a federal offense with facility and individual level penal-ties. Upcoding is actively prosecuted in the US, as it is considered to be fraud against the Medicare program (63). Penalties for institutions caught committing fraud can involve fines of up to $10,000 for each fraudulent claim and penalties for individuals include exclusion from future Medicare payment and, in extreme cases, imprisonment for up to ten years (63).
CMS hires contractors to identify, prevent, and reduce fraud for Medicare SNF payments. Medicare Administrative Contractors are responsible for paying providers and have the discretion to conduct tar-geted medical reviews of SNFs to deter and prevent improper payments (64). Infractions do not need to be intentional; mistakes in entering codes or miscod-ing an entry through lack of knowledge rather than for the predetermined purpose of fraud can still be prosecuted.
In the US, a 2012 Office of the Inspector General report based on an audit of SNFs conducted in 2009 questioned the accuracy of submitted RAI-MDS 2.0 data. The reviewers looked at the accuracy of MDS data as compared to patient medical records (65). The audit found that SNFs reported inaccurate informa-tion, unsupported or inconsistent with the medical record, on at least one RAI-MDS 2.0 item for 47% of claims (65).
The accuracy of RAI-MDS 2.0 data is not only a concern in the US. One study of the reliability of CCRS data found that, although the data has good reliability, one area of potential concern is the substantial increase in special rehabilitation in Ontario long-term care (11). This increase is under

t h e a l B e r t a h e a lt h s e r v i C e s p C B f M o d e l f o r lt C : a r e v i e W a n d a n a ly s i s
3 2
investigation by both CIHI and the Ontario Ministry of Health and Long-Term Care (MOHLTC) to deter-mine if it is reflective of a legitimate change in resident needs or a measurement error (11). The fact that this increase went from 5% in 2008/09 to 20% in 2011/12, coinciding with the introduction of case-mix-based funding in Ontario, is being pursued (11)(12).
AHS currently uses a two-pronged approach to main-tain the integrity of the RAI-MDS 2.0 data used for grouping and funding purposes. First, AHS employs a statistical process similar to control charts which looks for significant departures from historical or com-parative trend data. The exact processes and policies triggering further review are not clear. Second, when observed, AHS contacts the facility regarding changes in facility’s case-mix to determine whether poor data quality underlies the observed variance. If data quality is poor, it is addressed through corrections or resubmissions.
If the two-step process fails to resolve significant changes in case-mix, then AHS dispatches someone to the facility to review select resident charts to deter-mine the validity of the claims. In summer 2013 (May/June) it was determined that funding that was a result of over- or under-coding would be recovered by AHS and an appeals process for facilities was established.
Strong processes and policies are needed to maintain the integrity of the funding model for all participants.
Recommendation 14Continue to assign the lowest-valued RUG-III CMI for assessments that are overdue in order to create positive pressure to submit data on schedule and ensure that all LTC providers are aware of this rule.
Recommendation 15Formalize the processes and policies for iden-tifying and remediating erroneous or atypical resident data.
Recommendation 16Formalize the clinical audit process, including:
a. Specify the triggers of a clinical data audit.
b. Specify the auditors, their skills and background.
c. Specify the processes used to derive the number and type of resident’s charts subject to clinical audit.
Recommendation 17Formalize policies to mitigate up-coding, including:
a. Specify an acceptable error bound.
b. Specify penalties or remediating strate-gies for over-funding.
c. Publicly report findings from clinical data audits.

U B C C e n t r e f o r h e a lt h s e r v i C e s a n d p o l i C y r e s e a r C h
3 3
4: PCBF for LTC in Alberta
Evidence from AbroadSince 1997, SNFs in the US have been paid through PPS, a process that was phased-in over four years. The payment amount covers all parts of a Medicare Part A (legislatively defined) stay, including routine, ancillary and capital-related costs (66). The rates for SNFs are adjusted based on geographic differences in wage rates using the hospital wage index and patient case-mix (66).
US state Medicaid programs account for a significant portion of payments to SNFs and typically pay for residents who need care on a long-term basis. US state Medicaid payment programs often do not pay for resident’s rehabilitation services. As of July 2010, Med-icaid programs in 36 states used case-mix adjusted rates for SNFs but only 26 states use the RUG as the basis for case-mix adjustments (67).
Ontario is the only Canadian province other than Alberta that funds LTC through a form of ABF. While Ontario funds LTC through a mix of methods, the majority of the funding is delivered through the level of care per diem, though an institution may qualify for additional funding sources. The base level of care per diem has four components, including the NPC envelope, program and support services envelope, raw food envelope and other accommodation envelope (13). The CMI is applied only to the NPC envelope; it multiplies the base level of care per diem to derive a CMI-adjusted NPC funding amount. The NPC envelope accounts for about 60% of envelope funding in long-term care (68). Funding is delivered to provid-ers on a monthly basis (13). In 2010, the MOHLTC transitioned to a 34 group RUG-III model and during the phase-in, LTC providers have been subject to a case-mix freeze (69). Funding changes based on the new case-mix are being phased in for providers from April 2010 until March 2015 (13).
Provider FeedbackAs a critical component of this report, 16 interviews were conducted with key stakeholders in Alberta’s LTC sector. These interviews consisted of five repre-sentatives from AH or AHS and 11 providers (private, public and faith-based). The objectives of these inter-views were two-fold, to provide an opportunity for stakeholders to articulate strengths and weaknesses of the PCBF model and for the investigators to identify commonalities among stakeholders concerns.
To obtain detailed information from providers regard-ing their interpretation of the PCBF model, interviews were structured around five main topics that mirror the sections of this report: RAI-MDS 2.0, RUG-III, CMIs, data integrity and the PCBF funding model. From these interviews a number of common themes emerged. Some of the common themes are addressed by recommendations in the sections above, though the themes pertaining to the PCBF model are dis-cussed in detail below.
Only a portion of providers perceive that they are pre-pared to transition to the PCBF model. Nonetheless, there is consensus among LTC providers that align-ing LTC funding with clinical needs is an appropriate method for funding LTC in Alberta. In addition, all providers recognize the potential strengths inherent in ABF methods and understand how these methods are designed to improve equity in funding distribution among providers while providing much-sought after transparency.
Despite these broad endorsements of the PCBF approach, many providers identify concerns regard-ing specific aspects of the PCBF formula, namely how well PCBF allocates revenue to providers and how PCBF accounts for provider’s costs. On the revenue

t h e a l B e r t a h e a lt h s e r v i C e s p C B f M o d e l f o r lt C : a r e v i e W a n d a n a ly s i s
3 4
side, providers recognize that there are some RUG-III groups that remunerate at a higher rate than others. This has the potential to change provider’s behaviors; specific recommendations for assessing the quality of the RAI-MDS 2.0 data and the integrity of the RUGs and CMIs are provided in the above sections.
On the cost side, there are concerns among providers that the PCBF model is misaligned with the reality of delivering LTC in Alberta. Staffing costs are frequently cited by interviewees as an example of where PCBF is out of step with the realities of providing LTC. Several providers point out that they have a significant pro-portion of senior staff which are paid more than the provincial average prescribed in the PCBF model. This concern is explored in the report below.
In addition, there is a consensus among providers regarding a perceived lack of communication and transparency from AHS regarding the implementa-tion of PCBF. These criticisms take several forms. Various stakeholders question the intensity and dura-tion of communication efforts given the complexity and technical nature of the PCBF implementation. Providers also express that AHS is not forthcoming or transparent in their communications regarding model specifics and policies. The funding advice letter is cited as an example for poor communication; the timeliness of the funding advice, which is critical to providers budgeting, planning and staffing, is cited as a major shortcoming of the AHS communication strategy. Finally, providers described that more mean-ingful consultations and engagement with providers occurred during the initial implementation of PCBF but dropped sharply in the past two years. Providers report that opportunities to engage with AHS have since disappeared. As communication is a core aspect of the successful implementation of PCBF, these issues are discussed in additional detail below.
Implementation and StaffingWageRate
As noted above, staffing costs modeled in the PCBF are cited by a significant number of providers as an example of a failure in the model. The main element of this position is that the PCBF model is based on the average staff wage rate for each provider type. While the focus of this section is PCBF’s use of the average wage rate, the issue encompasses total compensation packages, which include wages, benefits and pensions.
A number of providers have a significant proportion of staff that are paid more than the provincial average due to their level of seniority. In other words, provid-ers cite that there are structural differences in costs between providers that are largely outside of their control. There is a basis for this stand: labor costs are unlikely to be variable in the short-term under negoti-ated labor contracts, though one provider reportedly secured a wage reduction for staff in order to maintain operations.
Two key issues for AHS emerge in response to wage rates: the degree to which AHS wishes to use PCBF as a lever for market-based reforms in LTC and how much AHS values staff continuity within LTC facili-ties. On the former point, applying the average wage rate as the basis for the PCBF allocations will produce winners and losers relative to each provider’s pre-vailing wage rates. Providers with higher fixed wage rates, often unionized with a collective agreement or remote location adjustments, will find the current policy inequitable since they cannot reduce compen-sation over the short-term. In the absence of a policy intervention, these providers will either become more cost-efficient by cutting front-line staff or find their business models unsustainable.

U B C C e n t r e f o r h e a lt h s e r v i C e s a n d p o l i C y r e s e a r C h
3 5
On the second point, staff tenure is associated with higher costs for providers. From the perspective of quality of care, long-term, stable workforces are reported to improve continuity of care with residents and thus care outcomes. Unfortunately, the literature provides little guidance describing how other juris-dictions have balanced the issue of staff tenure with ABF’s incentives for lowering costs. In Medicare’s PPS for post-acute care providers, including SNF care, the wage rate is not a negotiable component of the payment (though there is a minor adjustment for local input price differences) and the market adjusts for exits and entrants to the sector.
We are unable to observe what AHS views as the optimal balance of market forces to constrain cost growth and higher wage staff. It is likely that AHS wants to maintain equity of access and limit the prob-ability of providers failing in the short-term. If wage rates are outside of the control of providers then AHS should create options that provide some financial relief to affected providers.
Recommendation 18If AHS considers wage rates outside of the pro-vider’s ability to control in the short-term, then AHS should develop policy options for wage rate stratum effects, such as top-up or extend-ing no-loss provisions.
Recommendation 19Providers should partner with AHS to estimate the gap attributable to funding the average wage rate.
Recommendation 20If AHS considers wage rates outside of the provider’s ability to control in the short-term, but variable in the long term, they should tran-sition funding to the average wage rate over a multi-year period.
The magnitude of the effect of wage rates is unclear. A number of LTC providers affected by the average wage rate policy posit that the difference represents a meaningful amount of PCBF-allocated funding. The size of the gap is an empirical question for which data exists in order to estimate the amount of affected funding. LTC providers should provide a transparent
breakdown of their wage rates and seniority levels so that AHS can estimate the magnitude of the effect related to this policy and calibrate a meaningful response.
If AHS wants to apply pressure to providers to reduce cost growth, but over a longer period of time, AHS could transition PCBF to the average wage rate over a long period for affected providers. A longer transition period would allow providers the flexibility to adjust their skill mix and labor inputs.
Lastly, if AHS wants to enhance the role of the market and minimize the role of staff tenure and continuity of care provided to residents, then the current policy is sufficient. Keeping the average wage rate will create significant financial pressures for high wage provid-ers. These pressures will likely cause providers to seek reductions in costs by pursuing political solutions or closing their doors.
PaidHours
The ratio of nurses to residents has been shown to be associated with the quality of care residents receive

t h e a l B e r t a h e a lt h s e r v i C e s p C B f M o d e l f o r lt C : a r e v i e W a n d a n a ly s i s
3 6
in the US, with a higher ratio being associated with better quality care (70). After the introduction of PPS, SNFs in the US saw a reduction in registered nurse (RN) staffing and an increase in both licensed practi-cal nurse (LPN) and certified nursing assistant (CNA) staffing levels (44). Other US-based studies have documented lower total nurse staffing levels in states that use case-mix-based payment or a decrease in professional staffing after the introduction of prospec-tive payment (44). One author writes that this trend suggests that the RUG-III allocation of nursing time may not be adequate to meet resident needs (71).
AHS prescribes a fixed rate of 3.6 hours of care per patient per day. The 3.6 hours is higher than the number of care hours that other provinces fund. For example, Ontario averages 3.12 hours of care per LTC resident (70). In BC, 2.25 to 3.5 hours of care are funded depending on the LTC ownership-type (70). In Alberta, 3.6 hours is important for a number of reasons. First, the number is case-mix weighted and then used to create the overall size of the LTC funding allocation (with some exceptions). This figure is also used as a guide for allocating staff time at each LTC provider (there is flexibility as to which profession-als make up the staffing mix owing to some degree of substitutability as defined in the accountabilities). The care hours are an important number that all stake-holders understand and apply to their staffing models; however, a number of providers expressed some unease about not knowing the rationale behind the use of this number.
Recommendation 21Firmly establish a clinical rationale underlying the 3.6 care hours and communicate the ratio-nale to all providers and stakeholders.
GovernanceThe PCBF Steering Committee is responsible for most of the policy decisions regarding the PCBF model. The Steering Committee reports to the AHS executive body. While the Steering Committee is empowered to make most decisions regarding its mandate, decisions that have a significant budgetary impact are sent to the Executive Committee Operations sub-committee or the AHS executive for approval.
The PCBF Steering Committee is chaired by the Chief Financial Officer (CFO) of AHS and has clear Terms of Reference that describe the purpose and func-tions of the committee. The purpose of the Steering Committee is to guide implementation and opera-tion of the provincial PCBF allocations. Its members are drawn from Alberta Health (AH) and AHS and it employs a team-based model in order to improve decision-making and include partners in manage-ment. The members are drawn according to their functional roles in AH and AHS.
The Steering Committee executes its mandate through a number of functions described in the Terms of Reference and relies heavily upon teamwork among its members. “The ABF working group will develop and recommend the funding models, funding advice templates and implementation plans in close col-laboration with the development the development of measurement systems / adjustment factors (technical working group), financial accountabilities, and clinical accountabilities” (72). The Steering Committee meets monthly to review progress on its functions. The Steering Committee devolves responsibility for many technical functions to the PCBF Working Group and PCBF Team, which together report and detail their work to the Steering Committee.

U B C C e n t r e f o r h e a lt h s e r v i C e s a n d p o l i C y r e s e a r C h
3 7
The interviews with AHS staff revealed disparate opinions regarding the successful functioning of the working group. According to some interviews, the Steering Committee often gives very short deadlines to working group members and staff. As a result, shortcuts are sometimes taken to meet deadlines and incomplete analyses being presented at Steering Com-mittee meetings.
The interviews also revealed that the working group provided too much technical documentation and pre-meeting readings. As a result, Steering Commit-tee meetings tended to be less policy-driven and more technical in nature. One interview also concluded that there were no clear accountabilities of the working group, and that their performance in supporting the Steering Committee has not been evaluated.
The Steering Committee has both a policy and an operational role. The dual role of policy-making and operations highlights potential tensions between stra-tegic decision-making versus the managerial aspects of implementation and ongoing evaluation of PCBF. Highly technical work that the Steering Committee often caries out in preparation for policy decisions can be handled by working groups and then summarized for the Steering Committee.
Recommendation 22The Steering Committee should lead policy making for AHS on LTC funding and devolve operational support to working groups with clear accountabilities.
Recommendation 23Include provider representatives on the Steering Committee with a clear role that is formalized in the TOR.
Splitting policy and operations will allow each group to prioritize decision-making and effort on particular aspects of PCBF without it being detrimental to the implementation as a whole. Specific working groups will be able to target member’s expertise regarding each problem.
There is no provider representation on the Steering Committee. Providers are only represented at the working group level and often only to receive sum-mative information regarding Steering Committee decisions. As there are no providers on the committee there is no opportunity to hear their concerns first-hand. A number of providers were not aware of the governance structure of the PCBF.
Providing a meaningful role for providers and formalized processes for their participation on the Steering Committee will ensure that provider’s con-cerns will be heard at senior levels. In the medium to long-term, participatory-based decision-making will lead to decisions based on consensus that will reduce conflict and acrimony. The AHS executive team retains oversight over the Steering Committee; thus, widening participation on the Steering Committee should be accompanied with role clarity for all com-mittee members.

t h e a l B e r t a h e a lt h s e r v i C e s p C B f M o d e l f o r lt C : a r e v i e W a n d a n a ly s i s
3 8
Decisions that are arrived at through a deliberative process will give Steering Committee decisions a legitimacy that they currently lack. This process will contribute to the smoother functioning of PCBF and will give the Steering Committee important allies for the further expansion of ABF in Alberta.
There is no formal or informal process to evaluate past policies and decision-making. Periodic evaluation of past policies and decisions should be provided to the Steering Committee.
Recommendation 24Implement a formal process for periodic feed-back to the Steering Committee regarding the effectiveness of past policies.
CommunicationAll providers interviewed considered that communi-cation between AHS and LTC providers regarding the PCBF was an area that would benefit from signifi-cant improvement. In the original project plan for the implementation of PCBF, effective and timely communication was identified as a factor for suc-cessful implementation of the funding reform. An initial communication strategy was developed to help mitigate potential communication bottlenecks. AHS senior leadership is at the top of the list and has the most detailed development, with communication items designed to give high level overviews, a detailed description of the funding methodology, implemen-tation methodology, data collection and quality, a demonstration of funding using a site example, and general feedback.
Providers are also key targets of the communica-tion strategy with many of the same communication
objectives. While the communication strategy identi-fied explicitly that poor communication was a risk to PCBF implementation, no specific miscommunication scenarios were identified, nor were needs assessments conducted.
Stakeholder engagement is a reoccurring agenda item for the Steering Committee, which routinely holds meetings and gives presentations for the Alberta Continuing Care Association (ACCA), union repre-sentatives and providers. These presentations began in 2010 and continue to this point. In 2011 several full day information sessions were held, though attendance was limited to two representatives from each LTC site. Orientation sessions have been held for internal AHS staff and executives, Alberta Seniors and Community Services, ACCA and LTC providers (1). The ACCA and providers are represented at the PCBF-LTC working group and various sub-groups but not on the main Steering Committee (1). One interviewee indicated that provider participation on the working groups was mostly for AHS staff to deliver decision items to the providers, not to get their feedback on the implementation of PCBF.
Messaging regarding the PCBF has been mixed. In a number of instances, PCBF has been explained to pro-viders as being based on outputs rather than inputs, and that PCBF provides “transparent, predictable, stable funding consistent with the quantity, complex-ity and quality of the services needed by the client.” This messaging has led to frustrated and confused providers, who have also been told that it is an alloca-tion formula, a means of dividing up, in an equitable manner, an already established pot of funding. This has led to a number of providers who view com-munications as confusing or disingenuous. On another occasion, providers were given information

U B C C e n t r e f o r h e a lt h s e r v i C e s a n d p o l i C y r e s e a r C h
3 9
Recommendation 25Update communication plan with specific input from providers, including:
a. Formally evaluate the effectiveness of the communication plan on an ongoing basis.
b. Routine and targeted updates should be established for communication to each stakeholder.
on expected funding amounts per site, but were not given the inputs to be able to make, or adjust, the calculations themselves. This led to providers who did not know the scope of inputs that could affect their funding amounts. This was expressed by the ACCA to the Steering Committee on several occasions.
By 2012, the Steering Committee noted that dis-semination of information to providers through representation on the PCBF working group was not effective. The Steering Committee decided to estab-lish a quarterly newsletter summarizing changes to PCBF, communicating Steering Committee decisions and other related news. The newsletter is short and general. While feedback to the Steering Committee indicates that the newsletter is well received but items often need clarification, there is no information or evaluation of its effectiveness.
In 2012, the LTC plug and play model was developed by AHS to give providers a better idea of how the PCBF model would impact each site. The tool does not represent the complete funding model, however, but only about 85% of a site’s inputs. The tool was explicitly asked for by the ACCA and was not devel-oped through the initiative of the Steering Committee or working groups to address a specific communica-tion gap.
The Steering Committee has noted that internal com-munication also needs improvement. The committee noted that the Alberta Minister of Health had not been updated in over a year by the Steering Com-mittee. Steering Committee minutes note that the Minister was hearing concerns from providers about PCBF. Without information and communication being provided to the Minster from the Steering Com-mittee, the continued implementation of PCBF could be at risk.
There is no measurement of the effectiveness of the Steering Committee’s communication strategy. Nor has AHS conducted a needs assessment regarding the informational needs of providers. Overall, there appears to be a fundamental disconnection between the information the Steering Committee communi-cates to providers, and the information the providers want and need communicated to them. Since the relationship between AHS and providers is critical to ensure ongoing accessible, high quality and effective care during this time of transition, it is imperative that the communication problems be addressed.
Alberta LTC Quality Incentive FundingPay-for-performance (P4P) programs are often imple-mented in order to create incentives for providers to deliver high quality patient care. These programs have become prolific in the past several years despite weak evidence as to their overall effectiveness. In one review, 13 P4P initiatives in various US SNFs were identified in several different states and in only four instances was the impact of the P4P initiative evalu-ated (73). Modest to no improvement in SNF quality was found across the reviewed programs (73). A 2013 study of eight US state nursing home P4P programs

t h e a l B e r t a h e a lt h s e r v i C e s p C B f M o d e l f o r lt C : a r e v i e W a n d a n a ly s i s
4 0
found weak evidence to support the programs and inconsistent quality improvement (74).
Most of the research on the effects of ABF on quality of care in the long-term care sector has been con-ducted in the US on SNFs, though even this research is still limited (75). The introduction of PPS for funding SNFs in the US has had mixed results on the quality of care delivered to residents (76)(77)(78)(79)(80)(81)(44). Some US-based evidence suggests that competition between providers is associated with higher quality measures (82)(83)(84). Several studies found no change in re-hospitalisation rates for Medi-care residents, in addition no changes in emergency room visits or mortality were observed (85)(86)(77).
ABF for LTC has also been associated with a reduc-tion in rehabilitative services and with mixed evidence regarding changes in access for some resident types, with access improving for more dependent patients (87)(77)(88). Some studies found that the introduc-tion of ABF for SNFs resulted in a negative effect on professional staffing ratios between registered nurses and licensed practical nurses (77)(89)(81). In addition, some research has shown that prospec-tive funding has been associated with a reduction in
rehabilitative services provided to residents and with mixed evidence regarding changes in access to long-term care for some resident types (87)(77)(88).
Most of the residents in SNFs are short stay and the effect of ABF on long-stay residents has not been widely studied. Some research suggests that the intro-duction of ABF has had a negative effect on quality for long-stay residents in SNFs, particularly for specific conditions such as pressure sores and urinary tract infections (90).
Alberta has implemented its own P4P program in LTC. For 2011/12, AHS made a supplemental 0.2% funding available to LTC providers if they exceeded five quality metrics (1). These funds are allocated annually and are in addition to the overall PCBF amount. This funding is divided into four different buckets; the contents of each are described in Table 4.
Providers universally expressed positive sentiments regarding the explicit link between funding incentives and quality. Discussing the incentive further, inter-viewed providers expressed a range of details. One provider concluded that the 0.2% incentive funding was a sufficient amount to mobilize managerial
Table4.DistributionofqualityincentivefundingforAlbertaLTC
Distribution of incentive Indicator
35%ImplementationplanandprogressreportofmovingfromRAI-MDS2.0RAPstoCAPsorimplementationplanandprogressreportforqualityimprovementinitiativesbasedonRAI-MDS2.0qualityindicators
25%Submitanactionplanandprogressreportonmedicationreconciliationuponadmis-sionandstandardizedmedicationreviewprocesses
20%90-100%ofstaffimmunizedforinfluenza(10%ifrateisbetween75-80%andnoamountifvaccinationratesarebelow75%)
20%95-100%ofresidentsimmunizedforinfluenza(10%ifrateisbetween90-94%andnoamountifrateisbelow90%)

U B C C e n t r e f o r h e a lt h s e r v i C e s a n d p o l i C y r e s e a r C h
4 1
and front-line staff to improve their performance on quality metrics. Two providers expressed doubt regarding provider’s investment in effort in return for a paltry 0.2% potential return. In other words, for a number of providers, the 0.2% was considered to be too small of an incentive to motivate changes in behaviors. AHS’ communication strategy for P4P regarding the funding has been effective, as each provider interviewed was able to describe the program and its elements.
One provider commented that the indicator of resident immunization was beyond their control and thus may not be modifiable through the behavior of providers. This is a relevant point, as quality incen-tives should be linked to factors within the control of providers. This same provider expressed that larger quality incentives may direct resources towards measured areas at the expense of unmeasured areas, which could be a problem. Two providers expressed that the time lag between when the quality incentive was earned by providers and when the funding incen-tive was paid was too long. For the P4P funding to be effective, the funding should be proximally linked to when the activity occurred.
The evidence supporting the efficacy of paying for quality is fairly weak in the LTC sector. Evaluations of these policies in the post-acute care sector are mainly based in the US and may not be generalizable to the Canadian sector. In this gap in the evidence, since there appears to be broad support among providers for a quality-based incentive, there may be opportunities to experiment with policies linking funding with quality.
Recommendation 26If quality-based incentive funding is to be pursued, the policy should have the following components:
a. Quality measures should be relevant and within the control of providers to change.
b. Define and implement an evaluation plan to determine whether the incentive funding is effective at changing behav-iour and improving quality.
c. If evaluation shows P4P is effective then increase funding to 2-5%.
d. The P4P-linked funding should be paid to providers at the end of the period at which it was earned to reinforce the link between quality and funding.
SummaryImplementing a new funding model for LTC in Alberta is creating uncertainty and unease among providers. Transitioning to a new funding model is expected to be transformative and should not undermine AHS’s dual role of creating incentives for a well-managed LTC sector and being responsible financial managers.
To this end, many technical decisions made by AHS in its development of PCBF have a very solid foundation. For instance, the RAI-MDS 2.0 is largely a valid and reliable tool whose limitations are known, while the RUG-III method has proven robust in a number of settings. The stale data used as a basis for CMI can be addressed by AHS.

t h e a l B e r t a h e a lt h s e r v i C e s p C B f M o d e l f o r lt C : a r e v i e W a n d a n a ly s i s
4 2
This report does not advocate the discontinuation of the PCBF. Rather, AHS can take a number of steps to shore up the underlying methods and respond to provider’s criticisms.
The recommendations listed above are based, in large part, on addressing the specific concerns of AHS and providers regarding specific aspects of the PCBF funding model. AHS can make significant, and immediate, progress on PCBF implementation by addressing communication, education and change management. As is so often the case, the devil is in the details; some of the recommendations will involve the investment of time and resources by AHS.
Recommendation 27AHS should develop a response to this report that prioritizes the recommendations, outlines the AHS plan of action and share this report and their response with providers and other stakeholders.

U B C C e n t r e f o r h e a lt h s e r v i C e s a n d p o l i C y r e s e a r C h
4 3
5. Summary of Recommendations
RAI-MDS 2.0 and Data1. AHS should take an active role in addressing provider’s concerns regarding RAI-MDS 2.0
to measure dementia, behavioral problems, bariatric and needs of younger residents in the following ways:
a) Pursue research to examine the discriminate validity of RAI-MDS 2.0 for behavioral conditions and dementia. b) Explore adjustments to the funding model for bariatric and younger resident’s unmet social needs using targeted additional data collection.2. AHS should weigh the costs and benefits of implementing the MDS 3.0.3. AHS should pursue discussions with Dr. Debra Saliba to gain a thorough understanding of the
MDS 3.0.4. AHS should reduce hospital’s variation in propensity to discharge to LTC by standardizing care
processes for common conditions.5. AHS should assess the benefits of standardized patient assessments starting in the hospital,
across settings and over time.
RUG-III and CMI6. Align the number of RUG-III groups with the clinical services AHS wants residents to be
provided in LTC and reduce RUG-III to 34 groups.7. AHS should update the CMI to reflect current standards of care in Alberta.8. Give each provider retrospectively re-weighted activity data with revised CMI values for the
previous two years.9. AHS should broaden the CMI calibration period beyond one quarter to using the preceding
three quarters (Q1-Q3).10. AHS should work with providers to minimize unwarranted variability in CMIs by: a) Looking at resident level variability over time in rehabilitation and extensive services. b) Contrasting the sum of rehabilitation minutes by provider with reported workload statistics.

t h e a l B e r t a h e a lt h s e r v i C e s p C B f M o d e l f o r lt C : a r e v i e W a n d a n a ly s i s
4 4
Data Integrity11. Immediately develop a short- and long-term plan for addressing unmeasured case-mix.12. Maintain the current frequency of RAI-MDS 2.0 assessment guidelines. 13. AHS should establish a provincial expert to resolve questions on interpreting or applying the
RAI-MDS 2.0 instrument with extra support targeted at smaller LTC sites that do not have a dedicated RAI-coordinator.
14. Continue to assign the lowest-valued RUG-III CMI for assessments that are overdue in order to create positive pressure to submit data on schedule and ensure that all LTC providers are aware of this rule.
15. Formalize the processes and policies for identifying and remediating erroneous or atypical resident data.
16. Formalize the clinical audit process, including: a) Specify the triggers of a clinical data audit. b) Specify the auditors, their skills and background. c) Specify the processes used to derive the number and type of resident’s charts subject to clinical audit.17. Formalize policies to mitigate up-coding, including: a) Specify an acceptable error bound. b) Specify penalties or remediating strategies for over-funding. c) Publicly report findings from clinical data audits.

U B C C e n t r e f o r h e a lt h s e r v i C e s a n d p o l i C y r e s e a r C h
4 5
PCBF in Alberta18. If AHS considers wage rates outside of the provider’s ability to control in the short-term, then
AHS should develop policy options for wage rate stratum effects, such as top-up or extending no-loss provisions.
19. Providers should partner with AHS to estimate the gap attributable to funding the average wage rate.
20. If AHS considers wage rates outside of the provider’s ability to control in the short-term, but variable in the long term, they should transition funding to the average wage rate over a multi- year period.
21. Firmly establish a clinical rationale underlying the 3.6 care hours and communicate the ratio-nale to all providers and stakeholders.
22. The Steering Committee should lead policy making for AHS on LTC funding and devolve operational support to working groups with clear accountabilities.
23. Include provider representatives on the Steering Committee with a clear and participatory role that is formalized in the TOR.
24. Implement a formal process for periodic feedback to the Steering Committee regarding past policies.
25. Update communication plan with specific input from providers, including: a) Formally evaluate the effectiveness of the communication plan on an ongoing basis. b) Routine and targeted updates should be established for communication to each stakeholder.26. If quality-based incentive funding is to be pursued, the policy should have the following
components: a) Quality measures should be relevant and within the control of providers to change. b) Define and implement an evaluation plan to determine whether the incentive funding is effective at changing behavior and improving quality. c) If evaluation shows P4P is effective then increase funding to 2-5%. d) The P4P-linked funding should be paid to providers at the end of the period at which it was earned to reinforce the link between quality and funding.27. AHS should develop a response to this report that prioritizes the recommendations and out-
lines the AHS plan of action and rationale to address, or not address, each recommendation and share this report and their response with providers and other stakeholders.

t h e a l B e r t a h e a lt h s e r v i C e s p C B f M o d e l f o r lt C : a r e v i e W a n d a n a ly s i s
4 6
AcknowledgementsThis report could not have been conducted without the support of AHS. Mr. Gordon Kramer (AHS) provided his time to the investigators, compiled documentation, and thoughtfully responded to all queries. AHS staff Adam Crowe, Ryan Stevenson, and Lei Zheng also provided invaluable support with questions and analytics.
In addition, the following people provided contextual input into the crafting of the report. Without the support of these individuals and their organizations, this report would not have been possible.
Clara Ambard, Allen Gray Continuing Care CentreEllen Billay, Westview Health CentreGreer Black, Covenant HealthDuncan Campbell, AHSMike Conroy, AHSFrancine Drisner, Capital CarePatrick Dumelie, Covenant HealthDale Forbes, CarewestRizwan Gehlen, Park Place Seniors Living Inc.Tyler James, AHSIris Neumann, Capital Care Diane Page, CarewestJohn Pray, Covenant HealthDeborah Rhodes, AHSDavid Sawatsky, Carewest Alasdair Smith, Bethany Care SocietyLinda Stevenson, Capital CareAnne-Marie Visockas, AHS
Dawn Mooney of the UBC Centre for Health Services and Policy Research provided assistance with figures and report design.
Dr. Jason M. Sutherland is a Scholar of the Michael Smith Foundation for Health Research, Vancouver, BC.

U B C C e n t r e f o r h e a lt h s e r v i C e s a n d p o l i C y r e s e a r C h
4 7
1. Alberta Health Services. Patient/Care-Based Funding Long-Term Care User Summary. Edmonton; 2013.
2. Alberta Health Services. Health Plan and Business Plan 2013-2016. Edmonton: Alberta Health Services; 2013.
3. Government of Alberta. Continuing Care Strategy: Aging in the Right Place. Edmonton: Government of Alberta; 2008.
4. Wilson DM, Truman CD. Long-term-care residents: concerns identified by population and care trends. Canadian journal of public health = Revue canadienne de santé publique. 2004;95(5):382–6.
5. Mor V. A comprehensive clinical assessment tool to inform policy and practice: applica-tions of the minimum data set. Medical care. 2004 Apr;42(4 Suppl):III50–9.
6. Zhang NJ, Paek SC, Wan TTH. Reliability estimates of clinical measures between Minimum Data Set and Online Survey Certification and Reporting data of US nursing homes. Medical care. 2009 Apr;47(4):492–5.
7. Morris JN, Hawes C, Fries BE, Phillips CD, Mor V, Katz S, et al. Designing the national resident assessment instrument for nursing homes. The Gerontologist. 1990 Jun;30(3):293–307.
8. Hutchinson AM, Milke DL, Maisey S, Johnson C, Squires JE, Teare G, et al. The Resident Assessment Instrument-Minimum Data Set 2.0 quality indicators: a systematic review. BMC health services research. 2010 Jan;10:166.
9. Millbank Memorial Fund. Implementing the Resident Assessment Instrument: Case Studies of Policymaking for Long-Term Care in Eight Countries. 2003.
10. interRAI. interRAI Instruments Worldwide [Internet]. 2012. Available from: https://maps.google.com/maps/ms?msid=206338856302974256933.000484e78a45430a948ba&msa=0&ie=UTF8&t=m&ll=27.059126,11.25&spn=157.998803,358.59375&z=1&source=embed
11. Canadian Institute for Health Information. Data Quality Documentation, Continuing Care Reporting System, 2008-2009. Ottawa; 2011 p. 1–62.
12. Hirdes JP, Poss JW, Caldarelli H, Fries BE, Morris JN, Teare GF, et al. An evaluation of data quality in Canada’s Continuing Care Reporting System (CCRS): secondary analyses of Ontario data submitted between 1996 and 2011. BMC medical informatics and decision making. 2013 Jan;13(1):27.
13. Ontario Ministry of Health and Long-Term Care. LTCH Cash Flow Policy. Toronto; 2012.
14. Hawes C, Morris JN, Phillips CD, Mor V, Fries BE, Nonemaker S. Reliability estimates for the Minimum Data Set for nursing home resident assessment and care screening (MDS). The Gerontologist. 1995 Apr;35(2):172–8.
15. Hawes C, Morris JN, Phillips CD, Fries BE, Murphy K, Mor V. Development of the nursing home Resident Assessment Instrument in the USA. Age and ageing. 1997 Sep;26 Suppl 2:19–25.
References

t h e a l B e r t a h e a lt h s e r v i C e s p C B f M o d e l f o r lt C : a r e v i e W a n d a n a ly s i s
4 8
16. Hawes C, Mor V, Phillips CD, Fries BE, Morris JN, Steele-Friedlob E, et al. The OBRA-87 nursing home regulations and implementation of the Resident Assessment Instru-ment: effects on process quality. Journal of the American Geriatrics Society. 1997 Aug;45(8):977–85.
17. Achterberg W, Pot AM, van Campen C, Ribbe M. [Resident Assessment Instrument (RAI): a review of international research on the psychometric qualities and effects of implementa-tion in nursing homes]. Tijdschrift voor gerontologie en geriatrie. 1999 Dec;30(6):264–70.
18. Mor V, Intrator O, Fries BE, Phillips C, Teno J, Hiris J, et al. Changes in hospitalization associated with introducing the Resident Assessment Instrument. Journal of the American Geriatrics Society. 1997 Aug;45(8):1002–10.
19. Achterberg WP, van Campen C, Pot AM, Kerkstra A, Ribbe MW. Effects of the Resi-dent Assessment Instrument on the care process and health outcomes in nursing homes. A review of the literature. Scandinavian journal of rehabilitation medicine. 1999 Sep;31(3):131–7.
20. Sgadari A, Morris JN, Fries BE, Ljunggren G, Jónsson P V, DuPaquier JN, et al. Efforts to establish the reliability of the Resident Assessment Instrument. Age and ageing. 1997 Sep;26 Suppl 2:27–30.
21. Onder G, Carpenter I, Finne-Soveri H, Gindin J, Frijters D, Henrard JC, et al. Assessment of nursing home residents in Europe: the Services and Health for Elderly in Long TERm care (SHELTER) study. BMC health services research. 2012 Jan;12:5.
22. Mor V, Angelelli J, Jones R, Roy J, Moore T, Morris J. Inter-rater reliability of nursing home quality indicators in the U.S. BMC health services research. 2003 Nov 4;3(1):20.
23. Morris JN, Nonemaker S, Murphy K, Hawes C, Fries BE, Mor V, et al. A commitment to change: revision of HCFA’s RAI. Journal of the American Geriatrics Society. 1997 Aug;45(8):1011–6.
24. Poss JW, Jutan NM, Hirdes JP, Fries BE, Morris JN, Teare GF, et al. A review of evidence on the reliability and validity of Minimum Data Set data. Healthcare management forum / Canadian College of Health Service Executives = Forum gestion des soins de santé / Collège canadien des directeurs de services de santé. 2008 Jan;21(1):33–9.
25. Björkgren MA, Häkkinen U, Finne-Soveri UH, Fries BE. Validity and reliability of Resource Utilization Groups (RUG-III) in Finnish long-term care facilities. Scandinavian journal of public health. 1999 Sep;27(3):228–34.
26. Koehler M, Rabinowitz T, Hirdes J, Stones M, Carpenter GI, Fries BE, et al. Measuring depression in nursing home residents with the MDS and GDS: an observational psycho-metric study. BMC geriatrics. 2005 Jan;5:1.
27. Martin L, Poss JW, Hirdes JP, Jones RN, Stones MJ, Fries BE. Predictors of a new depression diagnosis among older adults admitted to complex continuing care: implications for the depression rating scale (DRS). Age and ageing. 2008 Jan 1;37(1):51–6.
28. Mor V, Intrator O, Unruh MA, Cai S. Temporal and Geographic variation in the validity and internal consistency of the Nursing Home Resident Assessment Minimum Data Set 2.0. BMC health services research. 2011 Jan;11:78.

U B C C e n t r e f o r h e a lt h s e r v i C e s a n d p o l i C y r e s e a r C h
4 9
29. Morris JN, Jones RN, Fries BE, Hirdes JP. Convergent validity of minimum data set-based performance quality indicators in postacute care settings. American journal of medical quality : the official journal of the American College of Medical Quality. 2004;19(6):242–7.
30. Shin JH, Scherer Y. Advantages and disadvantages of using MDS data in nursing research. Journal of gerontological nursing. 2009 Jan;35(1):7–17.
31. Snowden M, McCormick W, Russo J, Srebnik D, Comtois K, Bowen J, et al. Validity and responsiveness of the Minimum Data Set. Journal of the American Geriatrics Society. 1999 Aug;47(8):1000–4.
32. Hirdes JP, Ljunggren G, Morris JN, Frijters DHM, Finne Soveri H, Gray L, et al. Reliability of the interRAI suite of assessment instruments: a 12-country study of an integrated health information system. BMC health services research. 2008 Jan;8:277.
33. Centers for Medicare and Medicaid Services. MDS 3.0 for Nursing Homes and Swing Bed Providers [Internet]. 2012. Available from: http://www.cms.gov/Medicare/Quality-Initia-tives-Patient-Assessment-Instruments/NursingHomeQualityInits/NHQIMDS30.html
34. Pratt MJ, Edelen MO, Griffin A, Hascall T. ASSESSMENT TOOL : (April 2008).
35. CMSHHSgov. Introduction to MDS 3.0 by Deb Saliba. USA: CMSHHSgov YouTube; 2011.
36. Saliba D, Buchanan J. Development & Validation of a Revised Nursing Home Assessment Tool: MDS 3.0. RAND Health Corporation; 2008.
37. Hawes C, Vladeck BC, Morris JN, Phillips CD, Fredeking H. The RAI And The Politics Of Long-Term Care: The Convergence Of Science And Politics In U.S. Nursing Home Policy. Implementing the Resident Assessment Instrument: Case Studies of Policymaking for Long-Term Care in Eight Countries. Milbank Memorial Fund; 2009.
38. Gage B, Morley M, Smith L, Ingber MJ, Deutsch A, Kline T, et al. Post-Acute Care Payment Reform Demonstration: Final Report Volume 1 of 4. Centers for Medicare & Medicaid Services Center for Medicare & Medicaid Innovation; 2012.
39. Dubuc N, Hébert R, Desrosiers J, Buteau M, Trottier L. Disability-based classification system for older people in integrated long-term care services: the Iso-SMAF profiles. Archives of gerontology and geriatrics. 2006;42(2):191–206.
40. Tousignant M, Hébert R, Dubuc N, Simoneau F, Dieleman L. Application of a case-mix classification based on the functional autonomy of the residents for funding long-term care facilities. Age and ageing. 2003 Jan;32(1):60–6.
41. Demarche SMAF History [Internet]. 2013. Available from: http://www.demarchesmaf.com/index.php/a-propos/historique
42. Réjean H, Tourigny A, Gagnon M. Integrated service delivery to ensure persons’ functional autonomy. Réjean H, Tourigny A, Gagnon M, editors. EDISEM; 2005.
43. Hébert R, Durand PJ, Dubuc N, Tourigny A. PRISMA: a new model of integrated service delivery for the frail older people in Canada. International Journal of Integrated Care. 2003.
44. Feng Z, Grabowski DC, Intrator O, Zinn J, Mor V. Medicaid payment rates, case-mix reim-bursement, and nursing home staffing--1996-2004. Medical care. 2008 Jan;46(1):33–40.

t h e a l B e r t a h e a lt h s e r v i C e s p C B f M o d e l f o r lt C : a r e v i e W a n d a n a ly s i s
5 0
45. Fries BE, Schneider DP, Foley WJ, Gavazzi M, Burke R, Cornelius E. Refining a case-mix measure for nursing homes: Resource Utilization Groups (RUG-III). Medical care. 1994 Jul;32(7):668–85.
46. Clauser SB, Fries BE. Nursing home resident assessment and case-mix classification: cross-national perspectives. Health care financing review. 1992 Jan;13(4):135–55.
47. Butler PA, Schlenker RE. Case-mix reimbursement for nursing homes: objectives and achievements. The Milbank quarterly. 1989 Jan;67(1):103–36.
48. Weissert WG, Musliner MC. Case mix adjusted nursing-home reimbursement: a critical review of the evidence. The Milbank quarterly. 1992 Jan;70(3):455–90.
49. Carpenter GI, Ikegami N, Ljunggren G, Carrillo E, Fries E. RUG-III and Resource Alloca-tion: Comparing the Relationship of Direct Care Time with Patient Characteristics in Five Countries. Age and Ageing. 1997 Jan 1;26(suppl 2):61–5.
50. Kim E-K. [Resource use of the elderly in long-term care hospital using RUG-III]. Taehan Kanho Hakhoe chi. 2003 Apr;33(2):275–83.
51. Topinková E, Neuwirth J, Mellanová A, Stanková M, Haas T. [Case-mix classification in post-acute and long-term care. Validation of Resource Utilization Groups III (RUG-III) in the Czech Republic]. Casopís lékar̆ů c̆eských. 2000 Feb 2;139(2):42–8.
52. Centers for Medicare and Medicaid Services. Time Study (STRIVE) [Internet]. 2013. Avail-able from: http://www.cms.gov/Medicare/Medicare-Fee-for-Service-Payment/SNFPPS/TimeStudy.html
53. Centers for Medicare and Medicaid Services. FY 2011 RUG-IV Education & Training [Internet]. 2011. Available from: http://www.cms.gov/Medicare/Medicare-Fee-for-Service-Payment/SNFPPS/RUGIVEdu11.html
54. Sutherland JM, Crump RT, Repin N, Hellsten E. Paying for Hospital Services : A Hard Look. 2013.
55. Robert Wood Johnson Foundation. How does Medicare value-based purchasing work ? 2012 p. 1–2.
56. Canadian Institute for Health Information. How RUG-III (44 Group) Case Mix Index Values Are Calculated, 2011—CCRS Technical Document. 2011.
57. O’Reilly J, Busse R, Häkkinen U, Or Z, Street A, Wiley M. Paying for hospital care: the experience with implementing activity-based funding in five European countries. Health economics, policy, and law. 2012 Jan;7(1):73–101.
58. Morris JN, Hawes C, Mor V, Phillips C, Fries BE, Nonemaker S, et al. Resident Assessment Instrument (RAI) RAI-MDS 2.0 User’s Manual. Otawa: Canadian Institute for Health Information; 2012.
59. Alberta Health. Continuing Care Health Service Standards. Edmonton; 2013.
60. Ignatova I, Edwards D. Probe samples and the minimum sum method for medicare fraud investigations. Health Services and Outcomes Research Methodology. 2008 Jul 18;8(4):209–21.

U B C C e n t r e f o r h e a lt h s e r v i C e s a n d p o l i C y r e s e a r C h
5 1
61. Li J, Huang K-Y, Jin J, Shi J. A survey on statistical methods for health care fraud detection. Health care management science. 2008 Sep;11(3):275–87.
62. Steinbusch PJM, Oostenbrink JB, Zuurbier JJ, Schaepkens FJM. The risk of upcoding in casemix systems: a comparative study. Health policy (Amsterdam, Netherlands). 2007 May;81(2-3):289–99.
63. Harrington K, Allen A, Ruchala L. Restraining Medicare abuse: the case of upcoding. Research in Healthcare Financial Management. 2007;11(1):1–25.
64. Centers for Medicare and Medicaid Services. Medicare Fee-for-Service 2011 CERT Report. 2011.
65. Office of Inspector General. Inappropriate payments to skilled nursing facilities cost Medi-care more than a billion dollars in 2009. Department of Health and Human Services; 2012.
66. Centers for Medicare and Medicaid Services. Skilled Nursing Facility Prospective Payment System. 2012.
67. Proposal and rationale for a simplified Medicaid payment system for nursing homes in Washington State. Olympia WA: Dept. of Social & Health Services Aging and Disability Services Administration Management Services Division; 2007.
68. Tsui S, Walker J, Temple P, Yu K, Hoy C, Alshurafa M. Transitioning to a new Casemix grouper to fund long-term care homes in Ontario, Canada. BMC Health Services Research. 2011;11(Suppl 1):A25.
69. Ontario Ministry of Health and Long-Term Care. LTCH Level-of-Care Per Diem Funding Policy. Toronto; 2011.
70. Harrington C, Choiniere J, Goldmann M, Jacobsen FF, Lloyd L, McGregor M, et al. Nursing home staffing standards and staffing levels in six countries. Journal of nursing scholarship : an official publication of Sigma Theta Tau International Honor Society of Nursing / Sigma Theta Tau. 2012 Mar;44(1):88–98.
71. Mueller C. The RUG-III case mix classification system for long-term care nursing facilities: is it adequate for nurse staffing? The Journal of nursing administration. 2000 Nov;30(11):535–43.
72. Alberta Health Services. Continuing Care Funding Model / Funding Advice Working Group and Terms of Reference. 2010.
73. Briesacher BA, Field TS, Baril J, Gurwitz JH. Pay-for-performance in nursing homes. Health care financing review. 2009 Jan;30(3):1–13.
74. Werner RM, Konetzka RT, Polsky D. The Effect of Pay-for-Performance in Nursing Homes: Evidence from State Medicaid Programs. Health services research. 2013 Feb 10;1–22.
75. Angelelli J, Gifford D, Intrator O, Gozalo P. Access to postacute nursing home care before and after the BBA. Health Affairs. 2002;21(5):254–64.
76. Grabowski DC. Medicaid reimbursement and the quality of nursing home care. Journal of health economics. 2001 Jul;20(4):549–69.

t h e a l B e r t a h e a lt h s e r v i C e s p C B f M o d e l f o r lt C : a r e v i e W a n d a n a ly s i s
5 2
77. Grabowski DC. The economic implications of case-mix Medicaid reimbursement for nursing home care. Inquiry : a journal of medical care organization, provision and financ-ing. 2002 Jan;39(3):258–78.
78. Zhang NJ, Unruh L, Wan TTH. Has the Medicare prospective payment system led to increased nursing home efficiency? Health services research. 2008 Jun;43(3):1043–61.
79. Grabowski DC, Angelelli JJ, Mor V. Medicaid payment and risk-adjusted nursing home quality measures. Health affairs (Project Hope). 2004;23(5):243–52.
80. Harrington CA, Swan JH, Carrillo H. Nurse staffing levels and Medicaid reimbursement rates in nursing facilities. Health services research. 2007 Jun;42(3 Pt 1):1105–29.
81. White C. Medicare’s prospective payment system for skilled nursing facilities: effects on staffing and quality of care. Inquiry : a journal of medical care organization, provision and financing. 2005 Dec;42(4):351–66.
82. Castle NG, Engberg J, Liu D. Have Nursing Home Compare quality measure scores changed over time in response to competition? Quality & safety in health care. 2007 Jun;16(3):185–91.
83. Castle NG, Liu D, Engberg J. The association of Nursing Home Compare quality measures with market competition and occupancy rates. Journal for healthcare quality : official publi-cation of the National Association for Healthcare Quality. 2008 Apr;30(2):4–14.
84. Starkey KB, Weech-Maldonado R, Mor V. Market competition and quality of care in the nursing home industry. Journal of Health Care Finance. 2005 Jan;32(1):67–81.
85. Wodchis WP, Fries BE, Hirth RA. The effect of Medicare’s prospective payment system on discharge outcomes of skilled nursing facility residents. Inquiry : a journal of medical care organization, provision and financing. 41(4):418–34.
86. McCall N, Korb J, Petersons A, Moore S. Reforming Medicare payment: early effects of the 1997 Balanced Budget Act on postacute care. The Milbank quarterly. 2003 Jan;81(2):277–303, 172–3.
87. Chan L. The state-of-the-science: challenges in designing postacute care payment policy. Archives of physical medicine and rehabilitation. 2007 Nov;88(11):1522–5.
88. Murray PK, Love TE, Dawson N V, Thomas CL, Cebul RD. Rehabilitation services after the implementation of the nursing home prospective payment system: differences related to patient and nursing home characteristics. Medical care. 2005 Nov;43(11):1109–15.
89. Konetzka RT, Yi D, Norton EC, Kilpatrick KE. Effects of Medicare payment changes on nursing home staffing and deficiencies. Health services research. 2004 Jun;39(3):463–88.
90. Konetzka RT, Norton EC, Stearns SC. Medicare payment changes and nursing home quality: effects on long-stay residents. International journal of health care finance and eco-nomics. 2006 Sep;6(3):173–89.

U B C C e n t r e f o r h e a lt h s e r v i C e s a n d p o l i C y r e s e a r C h
5 3
Appendix A: 34 Group RUG-III 34
Source:http://www.interrai.org/welcome.html

UBC Centre for Health Services and Policy Research
the University of British Columbia
201-2206 east Mall
vancouver, B.C. Canada v6t 1Z3
tel: 604.822.4969fax: 604.822.5690email: [email protected]
www.chspr.ubc.ca
Advancing world-class health services and policy research, training and data resources on issues that matter to Canadians