Embed Size (px)
Citation preview

The Agricultural Product Space: Prospects for South Africa
By
Idsardi, E.F.*, van Schalkwyk H.D.
† and Viviers, W.
‡
Abstract
South Africa’s sluggish economic growth and limited structural transformation are at the core of
the country’s high levels of unemployment and poverty. Why some countries are able to grow and
others not has been the subject of much academic debate, with recent literature exploring the
relationship between growth and a country’s productive structure. Although the magnitude of the
role of agriculture in economic development is contentious within the context of an upper middle-
income country, like South Africa, the sector has unmistakably a contribution to make in the much
needed transformation and growth process. Therefore, this study analyses the structure of the agro-
complex through the application of the ‘product space’ framework. This methodology investigates
the product-level relatedness within the sector and arrives at a structure of an agricultural product
space network. This structure allows potential diversification pathways to be identified which can
form the basis of transformation within South Africa’s agro-complex.
Keywords: product space, South Africa, agro-complex, economic development
JEL codes: O13, O25, O55
* Senior lecturer, TRADE Research Niche Area, Potchefstroom Campus, North-West University, South Africa
Corresponding author: [email protected] †
Campus rector, Potchefstroom Campus, North-West University, South Africa ‡
Research leader, TRADE Research Niche Area, Potchefstroom Campus, North-West University, South Africa

1
1. Introduction
Agricultural production, and more specifically exports, will remain an important contributor
towards domestic growth and ultimately poverty alleviation in South Africa. The sector is the
backbone of the rural economy. Its contribution to employment and upstream- and downstream
economic activities is significant. There exists vast literature that illustrates the positive relationship
between agriculture and economic development (see Diao et al., 2010; Kjeldsen-Kragh, 2007;
Cypher and Dietz, 2004; Block and Timmer, 1994; Johnston and Mellor, 1976) as well as between
trade and poverty alleviation (see Nicita et al., 2011; Dollar & Kraay, 2002; Fisher, 2001; Barro,
2000). Agriculture’s role in economic development and growth is often overlooked in South Africa,
as its development agenda is dominated by land reform and is not focused on advancing its
production capabilities. Therefore, this study will analyse the sector’s potential development
pathways specifically from the perspective of the agricultural products produced.
It is evident that the persistent poverty and unemployment in South Africa will not be eliminated by
the past and current growth rates of less than three per cent. Hence, the National Planning
Commission (NPC, 2011) in its National Development Plan estimates that growth rates of at least
six per cent are needed. This additional growth in domestic production cannot be solely derived
from current economic activities. Therefore, some structural transformation is needed in order to
ensure a sustained additional increase in economic growth. Although the magnitude of the role of
agriculture in economic development is contentious in the context of an upper middle-income
country, like South Africa, the sector has unmistakably a contribution to make in this transformation
and growth process.
Many theories, from the work of Adam Smith to the model of endogenous growth, have tried to
develop a concept around the attributes of economic growth processes. Most of these growth
models focus on a country’s fundamentals (e.g. factor endowments, technology, and environment),
which determine a country’s productive structure and subsequently its generated wealth. However,
these models fail to explain why similar countries have different specialization patterns and levels
of product sophistication.
New theories of economic growth processes need to be applied to better understand the
development of the agricultural sector in South Africa. One such theory was recently developed by

2
Hausmann, Hwang and Rodrik (2005) which states that the wealth of a nation is determined by its
productive structure. This productive structure is defined by the set of products and services that a
nation can supply. The most important observation of the research underpinning their theory is that
what a country produces matters more for growth than how much value it extracts from this.
Furthermore, as not all products have an equal level of sophistication, the income of countries is
determined by its product variety and sophistication in the long run, and not by the traded value of
their exports (Hausmann et al., 2005).
Hausmann and Klinger (2007) expanded this theory by arguing that the productive structure of a
country is defined by the local availability of unique inputs or capabilities. They argue that these
capabilities can be perceived as being specific building blocks of production. Capabilities may
consist of tangible inputs, such as infrastructure and land, as well as intangible inputs, such as
institutions, norms, skills and knowledge (Hidalgo and Hausmann, 2009). For instance, the
production of oranges requires a certain type of soil, climatic conditions, labour skills, farming
equipment, food safety standards, distribution network, and port facilities. The exact set of
capabilities is unique to each product but the exchange of capabilities between products is possible.
Hausmann and Klinger (2007) thus argue that each country has a unique set of capabilities and each
product requires a specific combination of these capabilities.
This specific theory of economic growth and productive structure has been empirically tested by
using a combination of statistical network physics and development economics (Hidalgo, Klinger,
Barabási and Hausmann, 2007). This approach resulted in a network structure that connects
products, based on the probability that countries export them in tandem. This “product space”
assumes that similarities in capability requirements of products are expressed through co-exports
(Hidalgo et al., 2007).
The product space can be seen as an industrial map of where economic development occurs. In line
with the described theory, an important aspect of the economic development process is the process
by which countries diversify and upgrade their productive structures. The network shows explicitly
which products require similar capabilities to the ones that a country already produces (Hidalgo,
2009). The fact that countries tend to diversify towards products that are close by in the product
space was demonstrated empirically by Hidalgo et al. (2007).

3
The main objective of this study is to analyse the potential contribution of South Africa’s broader
agricultural sector, the so-called agro-complex, in the much needed economic transformation
process in order to generate higher levels of growth. This is done by analysing the structure of the
agro-complex within the context of the agricultural product space and determining its prospects for
diversification.
The next section provides some background on the performance and structure of South Africa’s
agro-complex. The third section will discuss the methodological framework for the product space
analysis. The fourth section will discuss the results and the final section will provide some
conclusions and recommendations for South Africa’s development agenda.
2. Performance and structure of South Africa’s agro-complex
2.1 Introduction
Although other economic sectors may play a more important role in economic growth, the
contribution of South Africa’s agro-complex should not be undermined. The contribution of
primary agriculture to the South African Gross Domestic Product (GDP) was 2.4 per cent in the
period from 2013 (IHS Global Insight, 2014). This direct contribution may not seem impressive, but
its strong forward linkages with the rest of the economy imply that approximately 60 per cent of
total output in primary agriculture is used as intermediate goods in other industries (Quantec, 2014).
This forward linkage is most significant with the wood, food- and beverage manufacturing sectors.
Furthermore, the total contribution of the agro-processing sector to the country’s GDP was 4.0 per
cent in 2013 (IHS Global Insight, 2014); adding food retailing, the total agro-food sector is likely to
contribute far more than 10 per cent to GDP.
Apart from this macro-economic perspective, the sector’s contribution to economic growth also has
a socio-economic dimension. Agriculture is relatively more labour intensive than other economic
sectors; primary agriculture absorbs 5.3 per cent of total employment to produce a smaller
percentage of GDP (IHS Global Insight, 2014). Adding employment of agro-processing activities
the total share of primary and secondary agriculture amounts to nine per cent which is larger than
the employment in the mining and construction sectors (IHS Global Insight, 2014). Arguably the
single most important contribution of the agricultural sector to the South African economy is the
adequate supply of food, which directly impacts on the welfare and productivity of its citizens.

4
South Africa’s agricultural sector is relatively export orientated and an important earner of foreign
currency. The export-output ratio of primary agricultural products was 30 per cent in 2013, which is
the third highest among South Africa’s economic sectors (Quantec, 2014). However, some
agricultural sub-sectors, such as citrus fruit, wine, deciduous fruit and leather manufacturing, have a
significantly larger share of their respective production exported.
2.2 Production and exports
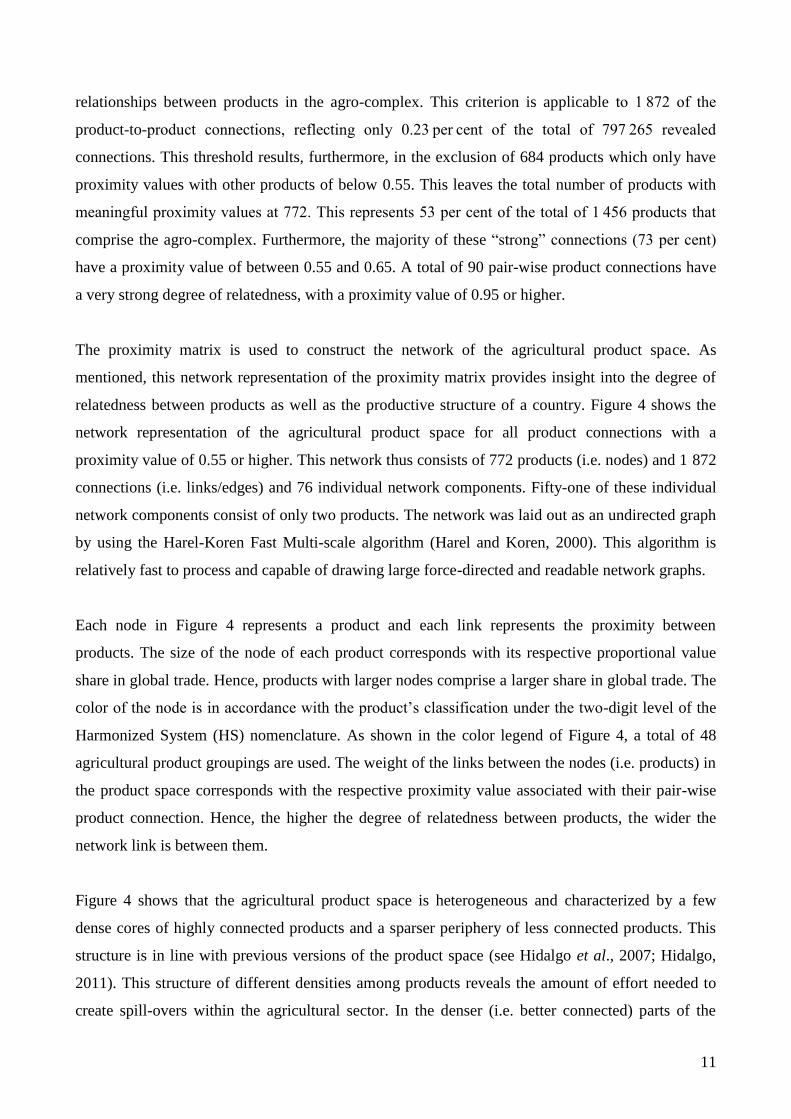
The long-term trends of total production in both primary and secondary agriculture (i.e. the agro
complex), reflected by the real value added, is shown in Figure 1. The real value of production
within the agro-complex increased 2.6 times from 1970, to reach a total value of R112 billion by
2013. Although this performance seems significant, most other broad economic sectors performed
better with regard to the real value added during the same period. For instance, total transport value
added increased 5.7 times and the value added by financial services increased five times since 1971.
However, the agro-complex did outperform the mining sector and construction sectors.
The annual average growth for primary and secondary agriculture was 2.7 and 2.5 per cent,
respectively over the depicted period. The contribution of secondary agriculture (i.e. agro-
processing) to total value added of the agro-complex did not experience a significant increase. In
1970, agro-processing contributed 58 per cent to total production of the agro-complex and by 2013
this share has only increased to 61 per cent. Hence, no significant structural changes have taken
place in South Africa’s agro-complex over time in terms of capturing more value from the
processing of primary agricultural products. Furthermore, the contribution of agriculture to
economic growth in South Africa has been marginal since 1993. Primary agriculture specifically,
only contributed 0.5 per cent to South Africa’s total economic growth from 1993 to 2012.
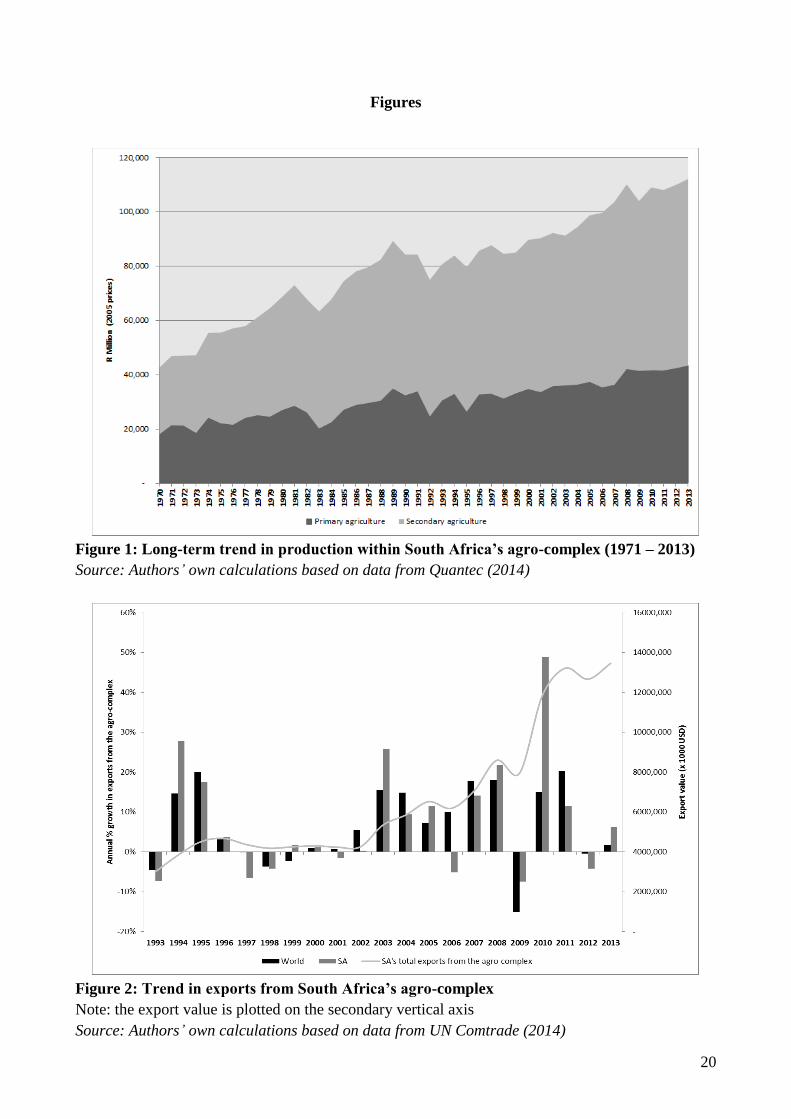
Another important performance indicator for the agro-complex is the growth trend of its exports. As
became evident from the previous section, the agro-complex is an important earner of foreign
currency. Whether this growth is sustained and has kept pace with global trends is a sound
benchmark for performance from an international perspective. The graph line Figure 2 shows the
trend in exports from South Africa’s agro-complex and the columns indicate the annual growth of
both the country’s and global exports in the period 1993 to 2013. It is evident for the figure that the
country showed stagnating growth in exports until 2002 (averaging three per cent annually) after
which exports showed a significant increase (averaging 12 per cent annually from 2002 to 2013).
Figure 2 shows furthermore that the trend in South Africa’s exports from the agro-complex

5
compares relatively well with the global trend. However, the growth-correlation coefficient of 0.72
between South Africa’s and global export growth reveals some potential for improvement.
2.3 Composition and diversification
The composition of South Africa’s agro-complex reveals that primary agricultural production is
dominated by the poultry, maize, cattle and fruit sub-sectors. Combined these contribute 53 per cent
to total primary production. Secondary agriculture (i.e. agro-processing) is dominated by food
processing and beverage manufacturing. Combined these activities contribute 77 per cent to total
production within agro-processing.
From a historical perspective, the most significant changes in the output-composition of crop
production over the last decades where a decrease in the contribution of cereal crops countered by
an increase in the contribution of fruit crops. With regard to animal production the most significant
structural change over the last decades was the significant increase in the contribution of poultry
production mainly at the expense of cattle production. Since 1961, the total output of South Africa’s
animal production has outperformed crop production with total growth rates of 150 and 344 per
cent respectively.
Figure 3 depicts the characteristics of South Africa’s productive structure in the agro-complex from
a product-level and cluster perspective. This figure shows the characterization of the country’s core
production competencies4 in terms of the product’s share in global trade (y-axis) per cluster, the
product’s share in South Africa’s exports (x-axis) per cluster, as well as the proportion they
represent in the total product spectrum of each of the five cluster (size of the bubble) within the
agro-complex.
This elaborate analysis reveals that South Africa has built most of its core production competencies
around primary agriculture. Hence, this cluster is thus relatively the most diversified as the country
embeds 20 per cent of all possible primary agricultural products within its productive structure. For
the other four clusters within the agro-complex, especially the agro-processing of non-food, South
Africa has a more concentrated (i.e. less diversified) set of core production competencies.
4 South Africa’s core competencies were identified by calculating the RTA index (see Section 3.2) for each product classified under the 2002
version of the Harmonized System (HS) nomenclature. Products with an RTA > 1 were classified as core competencies. The products were
further categorized into five clusters of the agro-complex, namely: primary agriculture, agro-processing of food, agro-processing of non-food,
forestry and agricultural inputs.

6
Furthermore, given the relative low share in global trade of the country’s existing core
competencies within these specific clusters; there is a likely potential for broadening production.
3. A network of relatedness
This section will briefly lay out the methodological framework for determining South Africa’s
position and prospects within the agricultural product space. This analytical framework consists of
three steps, namely: construction of the agricultural product space network, determining South
Africa’s position in the network and the identification of diversification opportunities.
3.1 Theoretical background
The theoretical underpinning of the product space has mainly been developed by Hausmann et al.
(2005) and Hausmann and Klinger (2007). Hausmann and Klinger (2007) argue that the ability of a
country to diversify into producing new goods depends on its current set of available capabilities
(see also Section 1). Thus, countries which have built a competence (i.e. comparative advantage) in
producing a certain good can use its corresponding set of capabilities in the production of new and
related products that are close to its current productive structure. This process of diversification to
nearby products also requires the development or acquisition of new capabilities. A drawback of the
product relatedness theory is that it does not explain how these new capabilities are attained but it
assumes that this is explained by institutional economics and endogenous growth models (i.e.
learning-by-doing). Klinger (2007) argues that FDI could also play an important role in this matter.
This resourced-based approach of diversification and growth, based on related resources and
capabilities, was thus further conceptualized by Hidalgo et al. (2007). They developed a measure
for the proximity between products and used this concept to map the relatedness of products in a
network visualization (i.e. the product space). In this network, products are depicted by nodes, and
their relatedness, by edges. The position of a country in this network, whether in the sparser or
denser parts, can predict the ease with which a country transforms itself economically. This process
of structural transformation is not an endogenous process, but is led by market- and policy
incentives. From the perspective of capabilities, products are not necessarily developed in sequence.
For example, the fact that a country is capable of effectively producing soybeans does not imply
that it is automatically an efficient producer of soybean oil. Hence, vertical linkages are as
important as horizontal linkages.

7
The relatedness of different products, measured by the proximity and reflected by similarities in
capabilities used in its production, can be caused by several possible factors:
i. the intensity of labor, land and capital (Leamer, 1984);
ii. the level of technological sophistication (Caballero and Jaffe, 1993);
iii. the inputs or outputs involved in a product’s value chain (Dietzenbacher and Lahr, 2001);
iv. necessary institutions (Rodrik, Subramanian and Trebbi, 2002); and
v. for primary agricultural products, the relatedness of products can also be attributed to
similarities in agro-ecological requirements.
3.2 Constructing the product space
As mentioned, the relatedness of products in the product space is based on the concept that similar
products require a similar set of requisite capabilities. This relatedness is measured by proximity,
reflecting the likelihood that countries have a comparative advantage in both goods. This measure is
developed using product-level data of exports. It is assumed that if a country has a comparative
advantage in a specific product, it must have the adequate endowments and capabilities to produce
that specific product. If two products require almost the same set of capabilities in their production
and marketing, it would be reflected by a higher probability of the country having a comparative
advantage in both those products.
The proximity measure used in the product space is the conditional probability that a given country
produces product A, given that it also produces product B (e.g. P{A|B}). The conditional
probability is not a symmetric measure, hence P{A|B} is not the same as P{B|A}. As the number of
exporters of product A decreases, the conditional probability of exporting another good becomes
closer to 1. This thus reflects the particularity of the country and not the similarity between
products. For instance, if South Africa is the only global producer of litchis, then all other goods
exported by South Africa, such as wool, will be closely related, when in fact they are quite
different. To counter this, the minimum pair-wise conditional probability must be used as an inverse
measure of distance in both directions in order to make it symmetric and more stringent (see
equation 1).
Min [P{A|B}, P{B|A}] (1)
The proximity measure must also be based on exports that are substantial and not just marginal.
This is assured by using the revealed comparative advantage index (RCA) of Balassa (1965) (see

8
equation 2). If this index is larger than 1, it implies that the share of a good in the country’s exports
is larger than the share of the country in global exports.
𝑅𝐶𝐴𝑐𝑝 =
𝑋𝑐𝑝
∑ 𝑋𝑐𝑝𝑐∑ 𝑋𝑐𝑝𝑝
∑ 𝑋𝑐𝑝𝑐,𝑝
⁄ (2)
Where Xcp represents the exports of country c in product p
This measure is then used to build a matrix that associates each country to the product in which it
has a comparative advantage. To counter annual variations in agricultural production, the RCA is
calculated for five years and set at 1 if a country has a RCA> 1 in three or more years. Hence, the
matrix Mcp can be defined as follows (Hausmann, Hidalgo, Bustos, Coscia, Chung, Jimenez,
Simoes and Yildrim, 2011):
𝑀𝑐𝑝 = {1 𝑖𝑓 𝑅𝐶𝐴𝑐𝑝 ≥ 1 𝑖𝑛 3 − 5 𝑦𝑟𝑠;
0 𝑜𝑡ℎ𝑒𝑟𝑤𝑖𝑠𝑒} (3)
This matrix thus summarises which country makes what. In order to mute short-term fluctuations in
agricultural trade patterns, the proximity matrix is made time-consistent by using data from the
period from 2006 to 2011 as a basis. Expanding this to the calculation of the proximity between
products, which is based in the likeliness of co-exports of good p and good p’, will get (Hausmann
et al., 2011):
∅𝑝𝑝′ =∑ 𝑀𝑐𝑝𝑀𝑐𝑝′𝑐
𝑚𝑎𝑥(∑ 𝑀𝑐𝑝 | ∑ 𝑀𝑐𝑝′𝑐𝑐 ) (4)
Equation 4 implies that if, for instance 25 countries export oranges, 18 countries export orange juice
and 15 export both products, the proximity value between oranges and grapes is 15/25 = 0.6. Hence,
the probability that a given country produces oranges, given that it also produces orange juice, and
vice versa, is 0.6. This value thus implies that 60 per cent of the countries that export oranges also
export orange juice. Furthermore, a proximity value of 0 indicates no relatedness, whereas a value
of 1 indicates a very high level of product relatedness. A proximity value of 0.55 is generally
assumed as a minimum and meaningful measure of the strength of relatedness between products
(see Hidalgo et al., 2007; Bayudan-Dacuycuy, 2012).

9
The revealed proximity value between every pair of products is used to construct a proximity
matrix. This matrix is then used for the network representation in order to study the structure and
dynamics of the product space. The visualization of the product space in this study is done by
importing the proximity matrix into NodeXL. NodeXL is an open source plug-in for Microsoft
Excel developed by the Social Media Research Foundation for the visualization and analysis of
complex networks. The proximity value is calculated based on trade date from 121 countries and
comprises 1 456 products5 grouped within the five clusters of the agro-complex (see also Section
2.3). The data is sourced from the UN Comtrade database.
3.3 Determining South Africa’s productive structure
The positioning of countries in the product space is traditionally done on the basis of their
respective RCA indices. This study diverts from this for the simple reason that the RCA only
accounts for exports and fails to take imports in account. Since the product space aims to analyse
the productive structure of a country, it is considered that the use of an alternative measure that
captures the domestic content of production is a more suitable option. Hence, this study will use the
index for Revealed Trade Advantage (RTA) as developed by Vollrath (1991). This index
simultaneously accounts for exports and imports at product-level and is regarded as an improved
reflection of the comparative advantage of local production and is thus an improved indicator for
positioning countries in the product space. Owing to data constraints, in terms of limited availability
of country-specific import data, it is not feasible to also use this index for the calculation of the
structure of the product space network.
The RTA index is expressed as follows:
𝑅𝑇𝐴𝑐𝑝 = 𝑅𝐶𝐴𝑐𝑝 − 𝑅𝑀𝐴𝑐𝑝 (5)
The RMAcp is the Revealed Comparative Import Advantage, the counterpart of the RCA, and is
expressed as follows:
𝑅𝑀𝐴𝑐𝑝 =
𝐼𝑐𝑝
∑ 𝐼𝑐𝑝𝑐∑ 𝐼𝑐𝑝𝑝
∑ 𝐼𝑐𝑝𝑐,𝑝
⁄ (6)
Where I is the import of product p by country c
5 An overview of these products is available from the authors.
10
3.3 Identifying diversification opportunities
The probability of a country producing a particular “new” product in the future depends on that
product’s proximity to its current production structure in the product space. A country-product level
indicator to measure this is distance, which reflects how “far” each product is located in relation to
a country’s current production (see Hausmann et al., 2011). The measurement of Distance reflects
the sum of the proximities connecting a “new” product p’ to all the products that country c is
currently not producing. This indicator is then normalised by dividing it by the sum of the
proximities of all the products connected to product p’. If a country produces most of the exports
connected to the product, the distance will be close to 0, otherwise the value will be close to 1.
Distance (or Dcp) is defined as:
𝐷𝑐𝑝′ = ∑ (1−𝑀𝑐𝑝′)∅𝑝𝑝′𝑝′
∑ ∅𝑝𝑝′𝑝′ (7)
Hausmann and Klinger (2006) show that this measure is a highly significant predictor of shifts in a
country’s productive structure in the product space.
4. The agricultural product space
4.1 Structure of the network
The calculation of the proximity matrix revealed a total of 797 265 connections between products
within the agro-complex, which represents 38 per cent of the maximum possible connections of
2 118 480. This relatively low rate of relatedness in the agro-complex is in line with findings of
previous applications of the product space (see Hidalgo et al., 2007; Bayudan-Dacuycuy, 2012).
The proximity matrix furthermore revealed that a total of 1 392 products in the agro-complex have a
degree of relatedness with at least one other product. This represents 96 per cent of the 1 456
products under investigation.
Analysis of the frequency and cumulative distribution of the proximity values between the 1 456
products reveals that most (39 per cent) of the pair-wise product proximities are larger than 0.1 and
smaller than or equal to 0.2. It is evident that most product connections have a relatively low degree
of relatedness, with 97 per cent of the proximity values being below 0.5. This study uses a
proximity value equal to or higher than 0.55 as the threshold for identifying meaningful
11
relationships between products in the agro-complex. This criterion is applicable to 1 872 of the
product-to-product connections, reflecting only 0.23 per cent of the total of 797 265 revealed
connections. This threshold results, furthermore, in the exclusion of 684 products which only have
proximity values with other products of below 0.55. This leaves the total number of products with
meaningful proximity values at 772. This represents 53 per cent of the total of 1 456 products that
comprise the agro-complex. Furthermore, the majority of these “strong” connections (73 per cent)
have a proximity value of between 0.55 and 0.65. A total of 90 pair-wise product connections have
a very strong degree of relatedness, with a proximity value of 0.95 or higher.
The proximity matrix is used to construct the network of the agricultural product space. As
mentioned, this network representation of the proximity matrix provides insight into the degree of
relatedness between products as well as the productive structure of a country. Figure 4 shows the
network representation of the agricultural product space for all product connections with a
proximity value of 0.55 or higher. This network thus consists of 772 products (i.e. nodes) and 1 872
connections (i.e. links/edges) and 76 individual network components. Fifty-one of these individual
network components consist of only two products. The network was laid out as an undirected graph
by using the Harel-Koren Fast Multi-scale algorithm (Harel and Koren, 2000). This algorithm is
relatively fast to process and capable of drawing large force-directed and readable network graphs.
Each node in Figure 4 represents a product and each link represents the proximity between
products. The size of the node of each product corresponds with its respective proportional value
share in global trade. Hence, products with larger nodes comprise a larger share in global trade. The
color of the node is in accordance with the product’s classification under the two-digit level of the
Harmonized System (HS) nomenclature. As shown in the color legend of Figure 4, a total of 48
agricultural product groupings are used. The weight of the links between the nodes (i.e. products) in
the product space corresponds with the respective proximity value associated with their pair-wise
product connection. Hence, the higher the degree of relatedness between products, the wider the
network link is between them.
Figure 4 shows that the agricultural product space is heterogeneous and characterized by a few
dense cores of highly connected products and a sparser periphery of less connected products. This
structure is in line with previous versions of the product space (see Hidalgo et al., 2007; Hidalgo,
2011). This structure of different densities among products reveals the amount of effort needed to
create spill-overs within the agricultural sector. In the denser (i.e. better connected) parts of the

12
agricultural product space, the transfer of a set of acquired capabilities and knowledge between
products is easier. In Section 3.1 it was discussed that countries tend to diversify to nearby products
(see also Hidalgo et al., 2007; Hausmann and Klinger, 2007). Hence, in the denser parts of the
network there are more nearby products, thus more opportunities to diversify. Four relatively dense
product groupings can be identified within the agricultural product space, namely: cotton, textiles,
meat and wood. To a lesser extent, wool and agricultural machinery can also be classified as
relatively dense product groupings.
Section 2.3 introduced the aggregation of the products within the agro-complex in five broad
clusters. Table 1 shows a summary of the characteristics of the five clusters’ positions in the
agricultural product space. It is evident from Table 1 that primary agricultural products have
relatively the lowest presence in the agricultural product space with a share of only 39 per cent of
all products classified within this cluster. Primary agriculture is characterized by numerous
individual network components (48) consisting of a relatively small number of products (a
maximum of 7). Furthermore, the density of the cluster (0.013) is moderate. This poor
connectedness may be attributed to the fact that the production of these specific products is very
location-specific and often subject to specific agro-climatic conditions.
Table 1 furthermore shows that processed food products have the second largest presence in the
agricultural product space, with a share of 32 per cent in the total number of nodes (i.e. products).
However, the share of products located in the product space in comparison to the total number of
products classified in this cluster is only 47 per cent. The degree of density (0.010) is also
comparatively low. Furthermore, this cluster has a significantly larger amount of individual
connected components. This lower degree of connections within this cluster points to relatively
limited potential for capability and knowledge spill-overs, compared to other clusters. The relatively
large heterogeneity in products (and, inter alia, in the underlying capabilities and knowledge) within
this cluster lies at the foundation of these network characteristics.
With regard to the agro-processing of non-food products, Table 1 reveals that this cluster has the
largest presence in the agricultural product space, with a share of 37 per cent. It is also evident from
the table that a relatively large share (69 per cent) of the products classified under this cluster also
features in the product space. The number of individual components within the agro-processing of
non-food cluster is moderate (22). Furthermore, the total number of links and the degree of density
are relatively high. This thus implies a comparatively high degree of connections within this

13
specific cluster. Hence, the potential for capability and knowledge spill-overs towards new ventures
is very high. The underlying rationale for these network characteristics is the relatively homogenous
product composition within this specific cluster, which is dominated by natural fibres and textiles.
Forestry products have a moderate presence in the agricultural product space, with a share of 14 per
cent (see Table 1). About half of the possible forestry products are included in the specified
network. Furthermore, the relatively high density (0.026) in this cluster reveals a good potential for
capability and knowledge spill-overs to new products within the forestry cluster. Similar to the
agro-processing of non-food cluster, this is also enhanced by the relatively low level of product
variety within the forestry cluster.
It is clear from Table 1 that the agricultural input cluster is the smallest of the five clusters.
Although a large number of agricultural inputs are located in the agricultural product space, the
level of connections is the lowest. The density within this cluster is only 0.0061. Hence, transferring
acquired capabilities and knowledge to new products will be more difficult. Similar to the primary
agriculture cluster, the variety of products in this cluster is relatively large, ranging from milking
machines to fertilizers.
It becomes evident from the analysis in Table 1 that the degree of homogeneity of the products
within a cluster greatly affects its potential for diversification. This provides some insights into
which clusters of the agro-complex the opportunities for diversification seem the highest in terms of
the number of linkages. However, further analysis of the strength of the relatedness between
products (i.e. the proximity value) is the highest in the agro-processing of non-food cluster followed
by primary agriculture and the least within the agricultural input cluster.
This section has provided some stylized facts on the general structure of the agricultural product
space and focused on inter-cluster relationships. The next section will specifically investigate the
position of South Africa in the network and elaborate further on input-output linkages (i.e. intra-
cluster relationships).
4.2 South Africa’s position
A country’s current position in the product space (i.e. its specialization) thus has important
implications for its future economic diversification and transformation. In order to determine South
Africa’s specialization (relative to the world) in specific products of the agro-complex, this study

14
applies the RTA index calculated for the period from 2009 to 2011 (see also Section 3.3). The level
of specialization (or competitiveness) for each of the 1 456 products included in the agricultural
product space is used to plot South Africa’s location in the agricultural product space. This will
reflect the country’s current productive structure in the agro-complex of the product space. Products
which are not traded by South Africa will not reveal any level of specialization. In order to provide
a holistic picture of South Africa’s agricultural production, a demarcation into four levels of product
specialization is made. These are:
i. RTA < 0: no revealed specialization in production (dependency on imports)
ii. 0 > RTA <1: low revealed specialization in production
iii. RTA > 1: high revealed specialization in production (i.e. core competencies)
iv. RTA > 0: overall productive structure.
Figure 5 shows the location of South Africa in the agricultural product space for products for which
the country has either a high or low level of specialization. In both panes of the figure, these
products are marked in red. Furthermore, to illustrate the variety, some of these products and
product groups are randomly highlighted in the figure. South Africa has a total of 70 products
located in the agricultural product space in which it has developed a relatively high level of
specialization (i.e. core competencies). This is proportionate to nine per cent of all products in the
agricultural product space. Furthermore, 102 products in which South Africa has a high level of
specialization are not included in the network. This is attributed to their relatively low level of
relatedness with other products, reflected by proximity values of below 0.55. Hence, their set of
capabilities and knowledge is comparatively unique, which makes the redeployment of these to
“new” products relatively difficult.
The left pane in the figure shows that about half of the products with a high level of specialization
are positioned in the sparser periphery of the agricultural product space. This implies a relatively
lower potential for diversification than the products located in the denser and central parts of the
network. For the production of these 70 products, South Africa has developed core competencies
(i.e. capabilities and knowledge) which underpin its level of specialization in these products. These
products comprise the best basis for diversification ventures as they have a set of well-developed,
embedded productive capabilities.
The right pane of Figure 5 provides an overview of the positioning of the 156 products in the
agricultural product space for which South Africa has a relatively low level of specialisation. This

15
represents 20 per cent of the total products included in the agricultural product space. It is evident
from the graph that these products have more variety and are scattered throughout the network.
Their potential for spurring further diversification opportunities is more limited as their embedded
productive knowledge is less developed then the other group of products.
Table 3 shows a brief comparison between South Africa’s products with a high level and a low
level of specialization within the agro-complex. It is evident from the table that South Africa will
gain from improving the competencies of the products with low levels of specialization. The
products in which South Africa has a relatively low level of specialization also present a relatively
lower potential for being a starting point for diversification ventures in the agricultural product
space. However, cognizance should be taken of these products as they will, in the process of
developing competencies, also open up new opportunities in the agricultural product space.
However, they should be regarded as a stimulus for “second round” diversification, after the
diversification options stemming from the products in which South Africa has a high level of
specialization are depleted.
Figure 3 already revealed the distribution of South Africa’s productive structure over the five
clusters of the agro-complex. It became evident that it has relatively the most core competencies in
primary agriculture; whereas its number of core competencies in the other clusters is remarkably
lower. This pattern holds important information for South Africa’s diversification opportunities in
the agro-complex. Firstly, a higher presence implies a higher variety of productive capabilities,
which positively affects the number of likely linkages to “new” products. Secondly, a low presence
implies a high level of unexploited potential, as the number of “new products” is relatively higher in
those clusters. The structure of, and the location in, the agricultural product space ultimately
determines which of these two options is more prevalent.
The connectedness between agricultural clusters in the product space reveals important information
about input–output relationships. The respective inter- and intra-cluster relatedness of South
Africa’s productive structure in the product space is shown in Table 3. This productive structure
comprises the 70 products with a RTA >1 (i.e. the core competencies). The table shows that the
amount of linkages within South Africa’s current productive structure of the agro-complex is
relatively limited: a total of 72 linkages for 70 products. Furthermore, it is evident from the table
that South Africa’s competencies within the agricultural product space are predominantly situated in
the primary agriculture and agro-processing of food clusters. This corresponds with the country’s

16
overall productive structure which is presented in Figure 3. Compared to the cluster structure of the
entire agricultural product space, South Africa’s position has proportionally less intra-cluster links
stemming from primary agriculture. However, its intra-cluster linkages originating from the agro-
processing of food and non-food are relatively higher than in the complete network. This thus
implies relatively strong input–output relationships for those clusters in South Africa
4.3 South Africa’s diversification opportunities
South Africa’s current productive structure determines its diversification pathways in the
agricultural product space. These pathways develop over time as a country develops new
capabilities by diversifying to new products. South Africa’s “first round” of diversification
opportunities comprises moving into the production of new products that are currently linked with
core competencies as its embedded productive capabilities have been fully developed. “Second
round” diversification will have to originate from products with a relative low level of
specialization as their productive capabilities still require further development.
To analyse how “far” a product is located from South Africa’s current productive structure, the
measure of Distance (see Section 3.3) is calculated for each product in the agricultural product
space. The value for Distance will be close to zero if South Africa produces most of the products
connected to the product. On the other hand, the value for Distance will be equal to one if South
Africa produced none of the products linked to the product.
The agricultural product space depicted in Figure 6 shows the Distance for all products in the agro-
complex that South Africa is not currently producing. The products that are relatively nearby South
Africa’s productive structure (marked in red) are coloured in green. More precisely, products with a
Distance value of equal to or lower than 0.5 are coloured light green and products with a Distance
value of between 0.5 and 1 are coloured dark green. All products that have no connection with
South Africa’s current productive structure, thus which are relatively “far” are coloured grey.
The left pane in Figure 6 shows the diversification opportunities based on the core competencies of
South Africa’s productive structure (i.e. products with A RTA > 1). These 70 products comprise
nine per cent of the products located in the network. The figure shows that a total of 19 “new”
products have a relatively short distance (<0.5) to South Africa’s core competencies. A further 23
“new” products have a slightly large distance (>0.5) and 18 products are already being produced at
a low level of specialization. Hence, the total number of “novel” diversification opportunities

17
derived from the country’s core competencies amount to 60. This implies an opportunity ratio of
0.60 per product and 83 per cent of the network that initially remains unexploited.
The right pane in Figure 6 reveals the diversification opportunities derived from South Africa’s
overall productive structure. This thus entails products in which the country has either a high or low
level of specialization. These products comprise 29 per cent of the products located in the
agricultural product space. The figure shows that 83 “new” products have a relatively short distance
to South Africa’s total productive structure and a further 134 are located at a relatively larger
distance. Hence, a total of 217 feasible diversification opportunities are derived from the country’s
total product structure. This implies an opportunity ratio of 0.96 and only 43 per cent of the
agricultural product space that initially remains unexploited.
The most attainable of South Africa’s diversification opportunities identified in the agricultural
product space are shown in Table 4. These top 25 opportunities originate from the country’s core
competencies and are so-called “low hanging fruits” in terms of transformation within the agro-
complex. Most of the opportunities (14) are located in the agro-processing of food cluster followed
by the primary agriculture (5). Not so surprising since South Africa’s core competencies are mainly
concentrated in those clusters.
5. Conclusions and recommendations
The agricultural product space provides a good reflection of the level of relatedness and clustering
within the agro-complex and provides a wide variety of potential diversification pathways.
Although a number of products with little prospects for diversification were excluded, the
remaining products represent a significant proportion of global trade. Section 4 provided some
interesting stylized facts of the agricultural product space in a global context. Hence, the position of
a country in the network will indicate more detailed perspectives for transformation. The relative
low interconnectedness of the network implies a relative low level of relatedness within the agro-
complex. This heterogeneity is not surprising due to the large variety of products within the agro-
complex; each embedding its unique set of capabilities. However, it does limit the amount of
diversification pathways in the network. Nevertheless, at cluster level some good potential for
horizontal diversification was revealed. Furthermore, a significant number of network communities
with a high degree of relatedness were also identified. Vertical linkages in terms of input-output
relationships have great potential for increasing local value adding; an important directive in

18
economic development. Hence, the remarkable large number of intra-cluster linkages in the
agricultural product space is a conducing condition.
About half of South Africa’s products with a high level of specialization are positioned in the
sparser periphery of the agricultural product space, which seems cumbersome for diversification as
the number of diversification pathways is generally more limited in those areas. However, the
starting point of diversification also has important implications for successful diversification. It is
envisaged that diversification ventures stemming from the country’s core competencies are more
likely to succeed. Those specific embedded capabilities and knowledge are well-developed which
makes the transfer to “new” and related products relatively easier. Cognizance should also be taken
of the products in which South Africa currently has a low level of specialization as they will, in the
process of developing competencies, also open up new opportunities in the agricultural product
space. However, they should be regarded as a stimulus for “second round” diversification after the
diversification options of core competencies have been depleted.
It became evident that not all of South Africa’s core competencies are located in the agricultural
product space due to the fact that they don’t show a sufficient degree of relatedness with other
products in the agro-complex. The relative high presence of core competencies from primary
agriculture and agro-processing of food implies less unexploited potential but a relative easier
transfer of capabilities to new products. The opposite is the case for the other three clusters.
South Africa’s current level of input-output relationships of its core competencies in the agricultural
product space is relatively limited, compared to the total number of these linkages identified in the
entire network. However, this thus provides ample opportunities to expand these and spur local
value adding.
As evident from the visualization of South Africa’s position in the agricultural product space, it was
estimated that the location of the country’s core competencies is predominantly in the less
connected sparser parts of the network. However, there are a number of exceptions. Rich countries
tend to be specialized in the denser parts of the product space. Hence, it is evident that South Africa
has to reach some convergence in this relationship by diversifying to new products with a higher
degree of centrality.
The overall number of identified diversification opportunities from both the core competencies (60)
and the overall product structure seems sound as it amounts up to 217 products. For the country’s

19
core competencies an average diversification opportunity ratio of 0.60 per product was revealed.
Furthermore, 83 per cent of the product space network that remains initially unexploited. Realising
all diversification opportunities stemming from the overall productive would potentially leave 43
per cent of the agricultural product space unexplored.
In this study it is argued by this study that the private sector should take the lead in exploiting
diversification opportunities within the agro-complex. Economic growth and development will
predominantly have to come from simply selling and producing more products. Although crucial for
socio-economic development, structural transformation and employment creation are secondary
imperatives that will not take place without the former.
Given the above, the main question that arises from the outcomes of this study is why South
African firms have not already exploited the identified diversification opportunities with favorable
demand conditions. Cirera, Marin and Markwald (2012) have analyzed the patterns of firm-level
diversification in Brazil. They confirm that firms tend to diversify to related products but that
diminishing first-mover advantages and market failures (i.e. uncertainties) are the main constraints.
Hence, business risks for South African firms have likely been too high to justify the pursuance of
these existing diversification opportunities. Hence, a concerted effort between public- and private
sector is needed to overcome these risks and enable “jumps” to the identified new products within
the agricultural product space.
20
Figures
Figure 1: Long-term trend in production within South Africa’s agro-complex (1971 – 2013)
Source: Authors’ own calculations based on data from Quantec (2014)
Figure 2: Trend in exports from South Africa’s agro-complex
Note: the export value is plotted on the secondary vertical axis
Source: Authors’ own calculations based on data from UN Comtrade (2014)

21
Figure 3: Characteristics of South Africa’s core competencies in the agro-complex
Note: bubble size proportional to the total product-spectrum in each cluster
Source: Authors’ own calculations (2014)

22
Figure 4: The agricultural product space (2007 – 2011)
Source: Authors’ own calculations (2014) using NodeXL
Proximity ≥ 0.55

23
Figure 5: South Africa’s productive structure in the agricultural product space (2007 – 2011)
Source: Authors’ own calculations (2014) using NodeXL
Figure 6: South Africa’s diversification opportunities in the agricultural product space
Source: Authors’ own calculations (2014) using NodeXL

24
Tables
Table 1: Network characteristics of the five clusters of the agro-complex
Primary
agriculture
Agro-
processing:
food
Agro-
processing:
non-food
Forestry Agricultural
inputs
Total products in cluster 221 522 413 222 78
Products present in the product
space 87 245 285 110 45
Share of total products in cluster 39% 47% 69% 50% 58%
Share in product space 11% 32% 37% 14% 6%
Links within cluster 50 298 1103 155 60
Connected components 48 59 22 16 14
Maximum products in a
connected component 7 110 239 75 24
Density of cluster 0.013 0.010 0.027 0.026 0.0061
Source: Authors’ own calculations (2014)
Table 2: Overview of South Africa’s productive structure in the agricultural product space
High level of specialization Low level of specialization
Total products in agricultural product space 70 156
Share in global agricultural trade (2009 – 2011) 6.6% 13.4%
Average number of linkages in the agricultural
product space 1.8 3.2
Average centrality 0.0014 0.0024
Source: Authors’ own calculations (2014)
Table 3: South Africa’s inter- and intra-cluster relationships in the product space
Agricultural
inputs
Primary
agriculture
Agro-
processing:
food
Agro-
processing:
non-food
Forestry
SA’s core competencies 3 22 25 13 7
Agricultural inputs NA 0% 0% 0% 0%
Primary Agriculture NA 74% 40% 17% 0%
Agro-processing: food NA 21% 50% 17% 0%
Agro-processing: non-food NA 5% 10% 67% 0%
Forestry NA 0% 0% 0% 100%
Total intra-cluster links in PS 0 10 10 4 0
Total links on PS 0 38 20 12 2
Intra-cluster links / total links
in product space NA 26% 50% 33% 0%
Source: Authors’ own calculations (2014)

25
Table 4: Top 25 diversification opportunities within South Africa’s agro-complex
HS
Code Product Agro-complex cluster
Distance
value
30410 Fish fillets & oth. fish meat, whether or not minced (excl. of
03.02), fres ... Agro-processing: food
0.00
30490 Fish meat other than fillets, frozen Agro-processing: food 0.00
50800 Coral & sim. mats.; shells of
molluscs/crustaceans/echinoderms & cuttle-bon ... Agro-processing: non-food
0.00
81010 Strawberries, fresh Primary agriculture 0.00
81190 Fruit & nuts, n.e.s., uncooked/cooked by steaming/boiling in
water, frozen, ... Agro-processing: food
0.00
90111 Coffee, not roasted, not decaffeinated Agro-processing: food 0.00
120600 Sunflower seeds, whether or not broken Primary agriculture 0.00
160411 Salmon, prepd./presvd., whole/in pieces (excl. minced) Agro-processing: food 0.00
170310 Cane molasses Agro-processing: food 0.00
200110 Cucumbers & gherkins, prepd./presvd. by vinegar/acetic
acid Agro-processing: food
0.00
200911 Orange juice, frozen, unfermented & not cont. added spirit,
whether or not ... Agro-processing: food
0.00
210111 Extracts, essences & concs. of coffee Agro-processing: food 0.00
230230 Bran, sharps & oth. residues, whether or not in the form of
pellets, derive ... Agro-processing: food
0.00
230800 Vegetable mats./waste/residues/by-prods., whether or not in
pellets, of a k ... Agro-processing: food
0.00
310560 Mineral/chem. fertilisers cont. the 2 fertilising elements
phosphorus & pot ... Agricultural inputs
0.00
320300 Colouring matter of veg./animal origin (incl. dyeing
extracts. excl. animal ... Agro-processing: non-food
0.00
430160 Raw furskins, of fox, whole, with/without head/tail/paws Agro-processing: non-food 0.00
450110 Natural cork, raw/simply prepd. Forestry 0.00
470421 Chemical wood pulp, sulphite, other than dissolving grades,
semi-bleached/b ... Forestry
0.00
510129 Wool, not carded/combed, degreased, not carbonised, other
than shorn Primary agriculture
0.00
80920 Cherries, fresh Primary agriculture 0.28
30379 Fish, n.e.s., frozen (excl. fillets/oth. fish meat of 03.04/livers
& roes) Agro-processing: food
0.34
30342 Yellowfin tunas (Thunnus albacares), frozen (excl.
fillets/oth. fish meat o ... Agro-processing: food
0.46
81320 Prunes, dried Agro-processing: food 0.50
91020 Saffron Primary agriculture 0.50
Source: Authors’ own calculations (2014)

26
References
Balassa, B., 1965. Trade Liberalization and Revealed Comparative Advantage. The Manchester
School of Economic and Social Studies, Vol. 33(1), P. 99-123.
Barro, R., 2000. Inequality and Growth in a Panel of Countries. Journal of Economic Growth, Vol.
5(1), P. 5 – 32.
Bayudan-Dacuycuy, C., 2012. The Philippine Export Portfolio in the Product Space: Potentials,
Possibilities and Policy Challenges. Economics Bulletin, Vol. 32(1), P. 59 – 66.
Block, S. and Timmer, P.C., 1994. Agriculture and Economic Growth: Conceptual Issues and the
Kenyan Experience. Consulting Assistance on Economic Reform (CAER) Discussion Paper No. 27.
Cambridge, MA: Harvard Institute for International Development.
Caballero, R. and Jaffe, A., 1993. How High are the Giant’s Shoulders: an Empirical Assessment of
Knowledge Spill-overs and Creative Destruction in a model of Economic Growth. Macro-Economic
Annual 1993, Vol. 8, National Bureau of Economic Research (NBER). Cambridge, MA: NBER.
Cirera, X., Marin, A. and Markwald, R., 2012. Firm Behaviour and the Introduction of New
Exports: Evidence from Brazil. Institute of Development Studies (IDS), Working Paper 390.
Brighton, GB: IDS.
Cypher, J.M. and Dietz, J.L., 2004. The Process of Economic Development. 3rd Ed. London, GB:
Routledge.
Diao, X., Hazell, P. and Thurlow, J., 2010. The Role of Agriculture in African Development. World
Development, Vol. 38(10), P. 1375 – 1383.
Dietzenbacher, E. and Lahr, M., 2001. Input-output Analysis: Frontiers and Extensions. NY, US:
Palgrave.
Dollar, D. and Kraay, A., 2002. Growth is Good for The Poor. Journal of Economic Growth, Vol.
25(2), P. 1 – 21.
Fischer, R., 2001. The Evolution of Inequality after Trade Liberalisation. Journal of Development
Economics, Vol. 66(2), P. 555 – 579.

27
Harel, D. and Koren, Y., 2000. A Fast Multi-Scale Method for Drawing Large Graphs. Rehovot,
IL: The Weizmann Institute of Science, Department of Computer Sciences and Applied
Mathematics.
Hausmann, R. and Klinger, B., 2006. Structural Transformation Patterns of Comparative
Advantage in the Product Space. CID Working Paper No. 128, Centre for International
Development (CID), Harvard University. Boston, MA: Harvard University.
Hausmann, R. and Klinger, B., 2007. The Structure of the Product Space and the Evolution of
Comparative Advantage. Centre for International Development (CID), Working Paper No. 146,
Harvard University. Boston, MA: Harvard University.
Hausmann, R., Hidalgo, C.A., Bustos, S., Coscia, M., Chung, S., Jimenez, J., Simoes, A. and
Yildrim, M.A., 2011. The Atlas of Economic Complexity: Mapping Paths to Prosperity [Internet].
Available from: http://atlas.media.mit.edu [Accessed: (n.d.)]. Cambridge, MA: Puritan Press.
Hausmann, R., Hwang, J. and Rodrik, D., 2005. What You Export Matters. NBER Working Paper
11905. Cambridge, MA: National Bureau of Economic Research.
Hidalgo, C.A., 2009. The Dynamics of Economic Complexity and the Product Space over a 42-year
period. CID Working Paper 189. Cambridge, MA: Harvard University, Center for International
Development.
Hidalgo, C.A., 2011. Discovering Southern and East Africa’s Industrial Opportunities. Economic
Paper Series 2011. Washington, DC: The German Marshall Fund of the United States (GMF).
Hidalgo, C.A. and Hausmann, R., 2009. The Building Blocks of Economic Complexity.
Proceedings of the National Academy of Sciences (PNAS), Vol. 106(26), P. 10570 – 10575.
Hidalgo, C.A., Klinger, B., Barabási, L. and Hausmann, R., 2007. The Product Space Conditions
the Development of Nations. Science, Vol. 317, P. 482 – 487.
IHS Global Insight, 2014. ReX Regional Explorer. Centurion, ZA.
Johnston, B. and Mellor, J., 1961. The Role of Agriculture in Economic Development. American
Economic Review, Vol. 51(4), P. 566 – 593.
Kjeldsen-Kragh, S., 2007. The Role of Agricultural Development in Economic Development: The
Lessons of History. Copenhagen, DK: Business School Press.

28
Klinger, B., 2007. Uncertainty in the Search for New Exports. Center for International Development
(CID), Working Paper 16. Cambridge, MA: Harvard University.
Leamer, E., 1984. Sources of Comparative Advantage: Theory and Evidence. Cambridge, MA: MIT
Press.
Nicita, A., Olarreaga, M. and Porto, G., 2011. Pro-poor Trade Policy in Sub-Saharan Africa.
Centre for Economic Policy Research (CEPR), Discussion Paper No. 8594. London, GB: CEPR.
NPC (National Planning Commission), 2011. National Development Plan 2030. Pretoria, ZA: NPC.
Quantec, 2014. EasyData: South African Standardised Industry Indicator Database [Internet].
Available from: http://www.easydata.co.za [Accessed: October, 2014]. Pretoria, ZA: Quantec
Research.
Rodrik, D., Subramanian, A. and Trebbi, F., 2002. Institutions Rule: The Primacy of Institutions
over Geography and Integration in Economic Development. NBER Working Paper No. 9305,
National Bureau of Economic Research (NBER). Cambridge, MA: NBER.
Vollrath, T.L., 1991. A Theoretical Evaluation of Alternative Trade Intensity Measures of Revealed
Comparative Advantage. Weltwirtschaftliches Archiv, Vol. 127(2).