Embed Size (px)
Citation preview
Prospects and challenges of agricultural trade between China and Latin America:
analysis of problems and opportunities from the Chinese perspective
Li Xiande
Institute of Agricultural Economics and Development, Chinese Academy of Agricultural Sciences
September 27-28, Rome, FAO
Contents
• Overview of agricultural trade between China and Latin America
• Major Challenges
• Trade opportunities
• Prospects of trade relation between China and Latin America
1. Overview of agricultural trade between China and LAC
• China’s Agriculture: Basic facts
• China’s total agricultural trade
• China’s agricultural trade with Latin America
1. Overview of agricultural trade between China and LAC
• China’s Agriculture: Basic facts
• China’s economic reform started from the agricultural sector and the countryside; Agriculture benefits greatly from high national GDP growth (around 10% in the past three decades).
• Tiny farm size (0.6 ha). High rural population rate, 53.4% in 2009 with 713 millions of rural population.
• In 2009, agriculture employs 38.1% of total labors, producing only 10.6% of total GDP (10.2% in 2010).…implying the agricultural labor productivity is very low compared to other sectors.
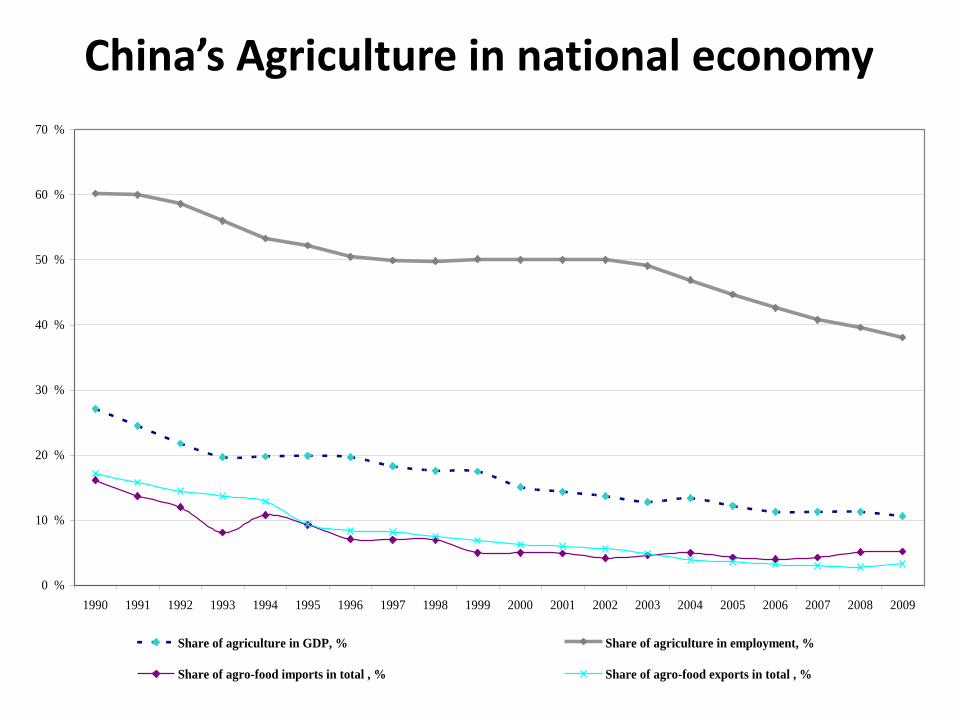
China’s Agriculture in national economy
0 %
10 %
20 %
30 %
40 %
50 %
60 %
70 %
1990 1991 1992 1993 1994 1995 1996 1997 1998 1999 2000 2001 2002 2003 2004 2005 2006 2007 2008 2009
Share of agriculture in GDP, % Share of agriculture in employment, %
Share of agro-food imports in total , % Share of agro-food exports in total , %
China’s Agriculture: Basic facts
• China’s agro-food trade accounts for only a very small part in the total merchandise trade, about 3% for agricultural export and 5% for agricultural import.
• Supply and demand relations: basic self-sufficiency for cereals, massive import of oilseeds, cotton and sugars, export of aquatic products and vegetables & fruits.
China total agricultural trade
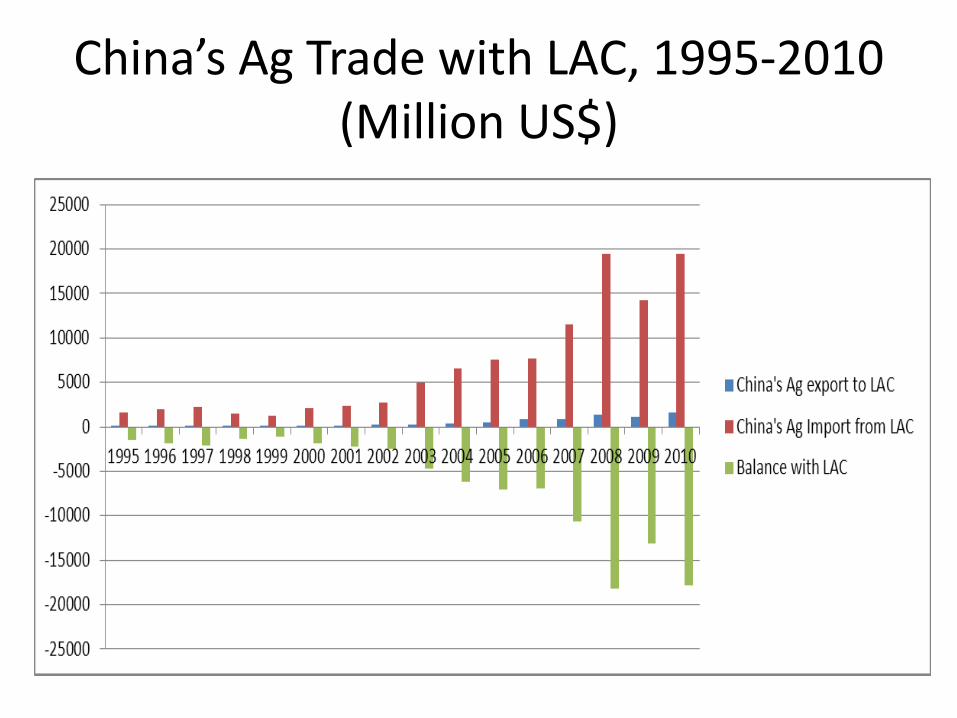
• From 2001 to 2010, China’s total agricultural trade increased from 27789 to 120787million US$, by 235%, but trade with LAC from 2583 to 21112 million US$, by 617% . Year 2004 was the turning point for China’s agricultural trade, from surplus status to deficit status, with 4.9 billion US$ deficit that year, the deficit increased to 23 billion US$ in 2010.
• --China’s total agricultural import increased by 408% (from 11814 to 71904 million US$), but by 611% with LAC (from 2401 to 19485 million US$).
• --China’s total agricultural export increased by 106% (from 15975 to 48883 million US$), but by 696% with LAC (from 181 to 1621 million US$).
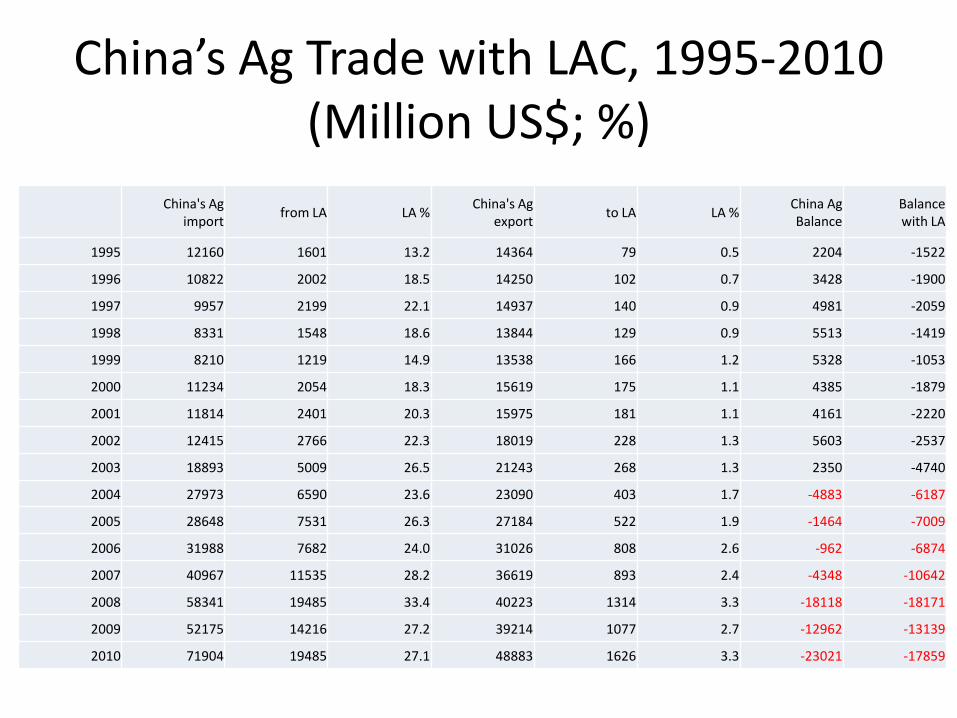
China’s Ag Trade with LAC, 1995-2010 (Million US$; %)
China's Ag
import from LA LA %
China's Ag export
to LA LA % China Ag Balance
Balance with LA
1995 12160 1601 13.2 14364 79 0.5 2204 -1522
1996 10822 2002 18.5 14250 102 0.7 3428 -1900
1997 9957 2199 22.1 14937 140 0.9 4981 -2059
1998 8331 1548 18.6 13844 129 0.9 5513 -1419
1999 8210 1219 14.9 13538 166 1.2 5328 -1053
2000 11234 2054 18.3 15619 175 1.1 4385 -1879
2001 11814 2401 20.3 15975 181 1.1 4161 -2220
2002 12415 2766 22.3 18019 228 1.3 5603 -2537
2003 18893 5009 26.5 21243 268 1.3 2350 -4740
2004 27973 6590 23.6 23090 403 1.7 -4883 -6187
2005 28648 7531 26.3 27184 522 1.9 -1464 -7009
2006 31988 7682 24.0 31026 808 2.6 -962 -6874
2007 40967 11535 28.2 36619 893 2.4 -4348 -10642
2008 58341 19485 33.4 40223 1314 3.3 -18118 -18171
2009 52175 14216 27.2 39214 1077 2.7 -12962 -13139
2010 71904 19485 27.1 48883 1626 3.3 -23021 -17859
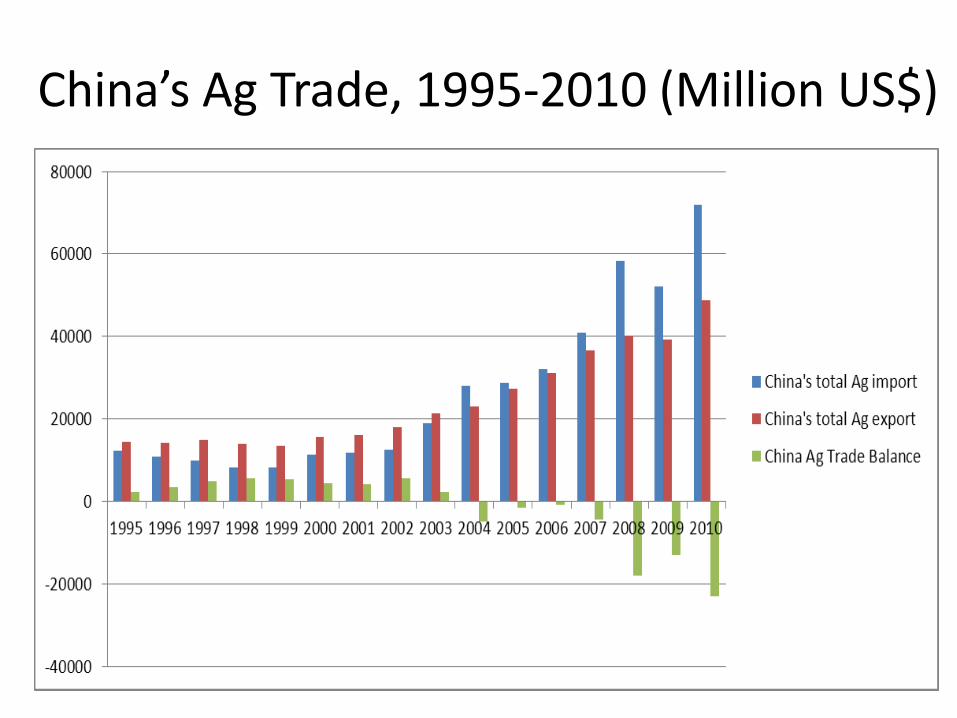
China’s Ag Trade, 1995-2010 (Million US$)
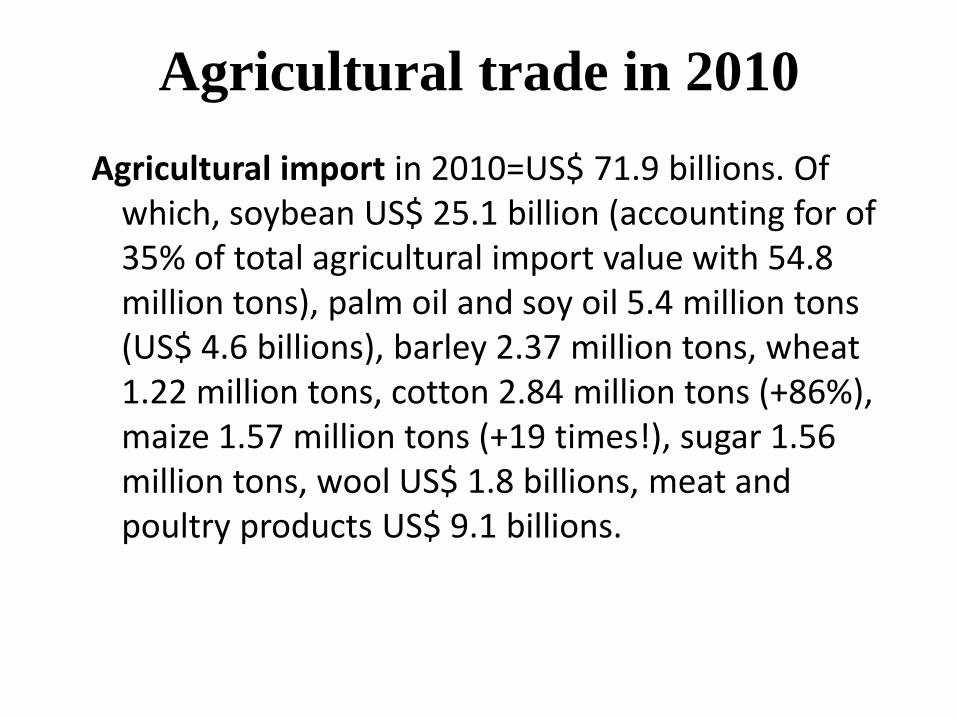
Agricultural trade in 2010
Agricultural import in 2010=US$ 71.9 billions. Of which, soybean US$ 25.1 billion (accounting for of 35% of total agricultural import value with 54.8 million tons), palm oil and soy oil 5.4 million tons (US$ 4.6 billions), barley 2.37 million tons, wheat 1.22 million tons, cotton 2.84 million tons (+86%), maize 1.57 million tons (+19 times!), sugar 1.56 million tons, wool US$ 1.8 billions, meat and poultry products US$ 9.1 billions.
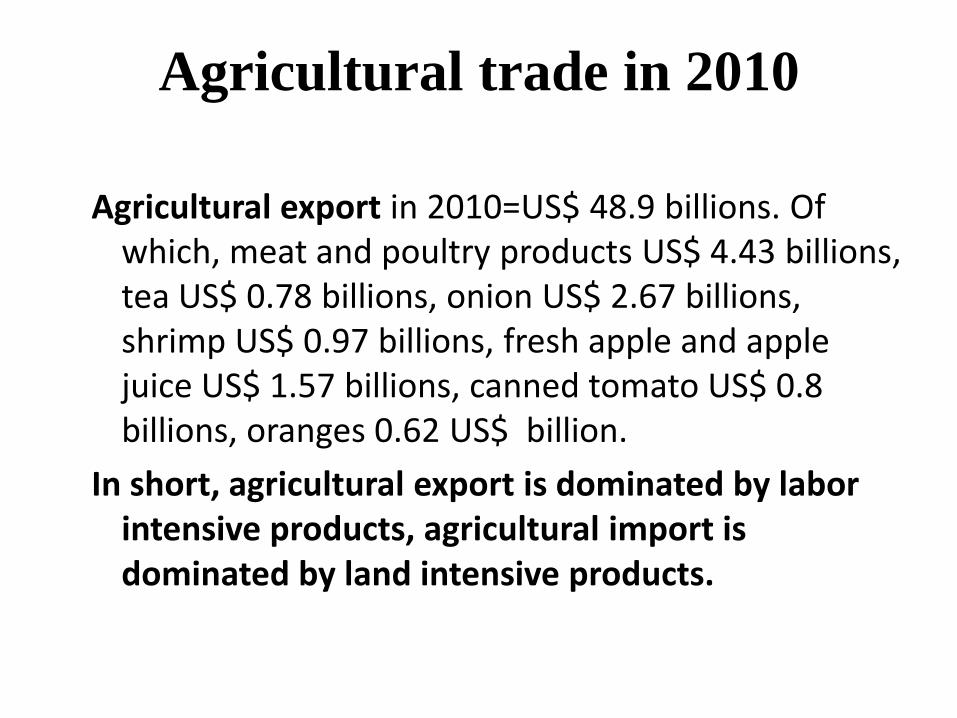
Agricultural trade in 2010
Agricultural export in 2010=US$ 48.9 billions. Of which, meat and poultry products US$ 4.43 billions, tea US$ 0.78 billions, onion US$ 2.67 billions, shrimp US$ 0.97 billions, fresh apple and apple juice US$ 1.57 billions, canned tomato US$ 0.8 billions, oranges 0.62 US$ billion.
In short, agricultural export is dominated by labor intensive products, agricultural import is dominated by land intensive products.
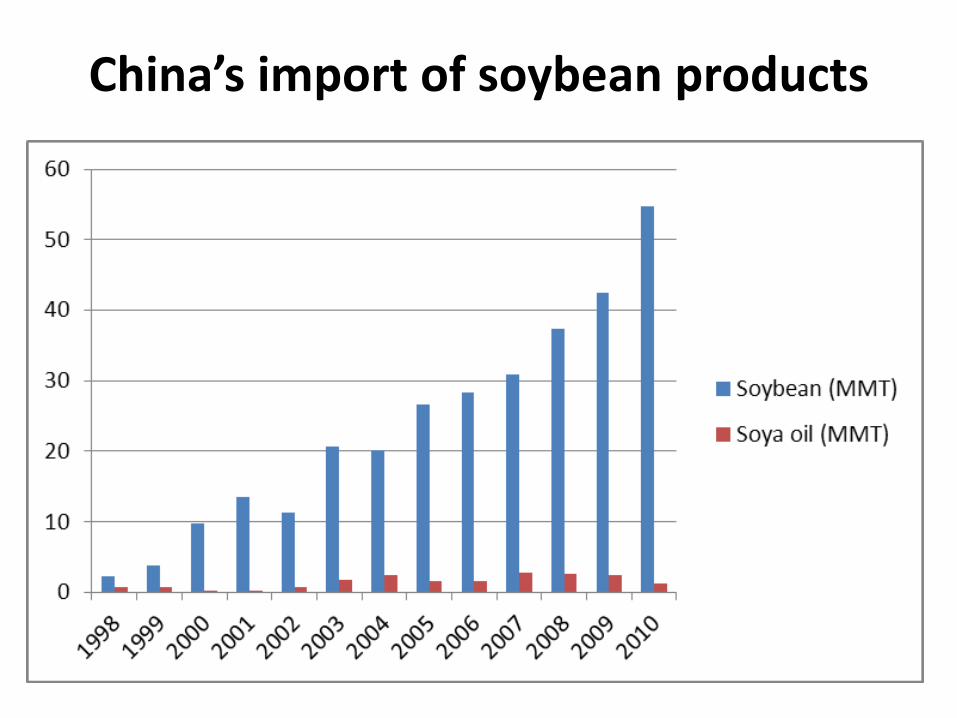
China’s import of soybean products
China’s Ag Trade with LAC, 1995-2010
(Million US$)
China’s agricultural trade with LAC
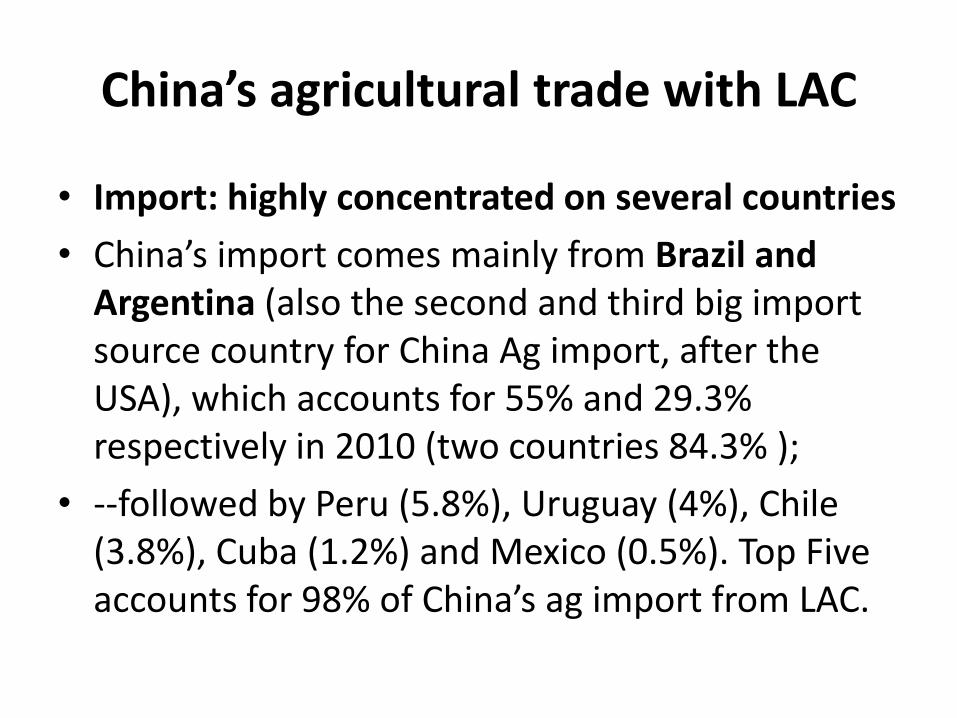
• Import: highly concentrated on several countries
• China’s import comes mainly from Brazil and Argentina (also the second and third big import source country for China Ag import, after the USA), which accounts for 55% and 29.3% respectively in 2010 (two countries 84.3% );
• --followed by Peru (5.8%), Uruguay (4%), Chile (3.8%), Cuba (1.2%) and Mexico (0.5%). Top Five accounts for 98% of China’s ag import from LAC.
China’s agricultural trade with LAC
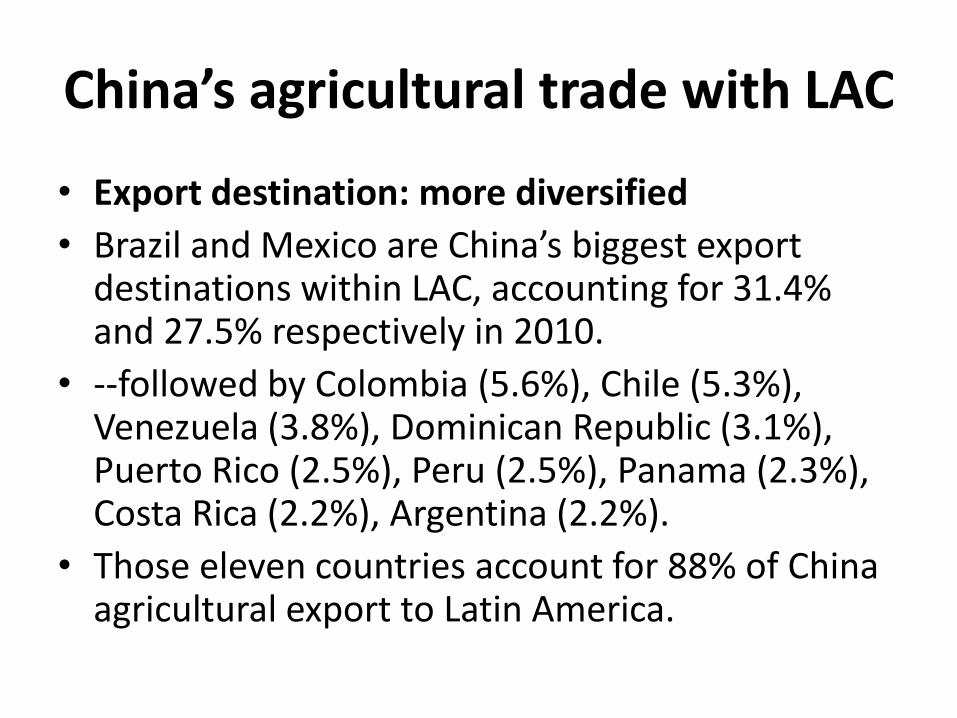
• Export destination: more diversified
• Brazil and Mexico are China’s biggest export destinations within LAC, accounting for 31.4% and 27.5% respectively in 2010.
• --followed by Colombia (5.6%), Chile (5.3%), Venezuela (3.8%), Dominican Republic (3.1%), Puerto Rico (2.5%), Peru (2.5%), Panama (2.3%), Costa Rica (2.2%), Argentina (2.2%).
• Those eleven countries account for 88% of China agricultural export to Latin America.
China’s agricultural trade with LAC
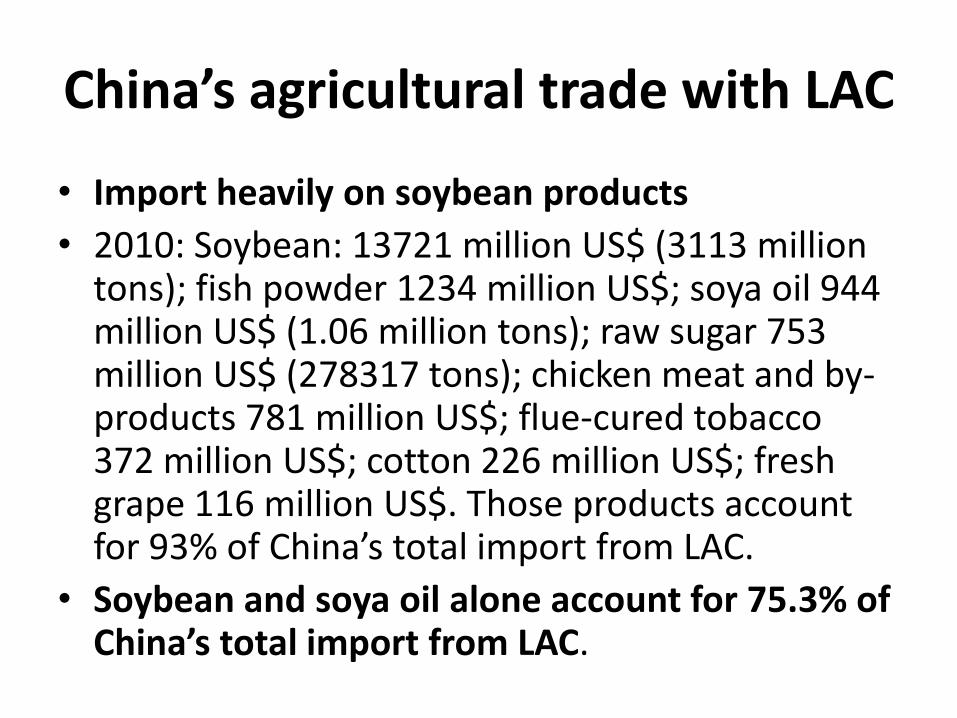
• Import heavily on soybean products
• 2010: Soybean: 13721 million US$ (3113 million tons); fish powder 1234 million US$; soya oil 944 million US$ (1.06 million tons); raw sugar 753 million US$ (278317 tons); chicken meat and by-products 781 million US$; flue-cured tobacco 372 million US$; cotton 226 million US$; fresh grape 116 million US$. Those products account for 93% of China’s total import from LAC.
• Soybean and soya oil alone account for 75.3% of China’s total import from LAC.
China’s agricultural trade with LAC
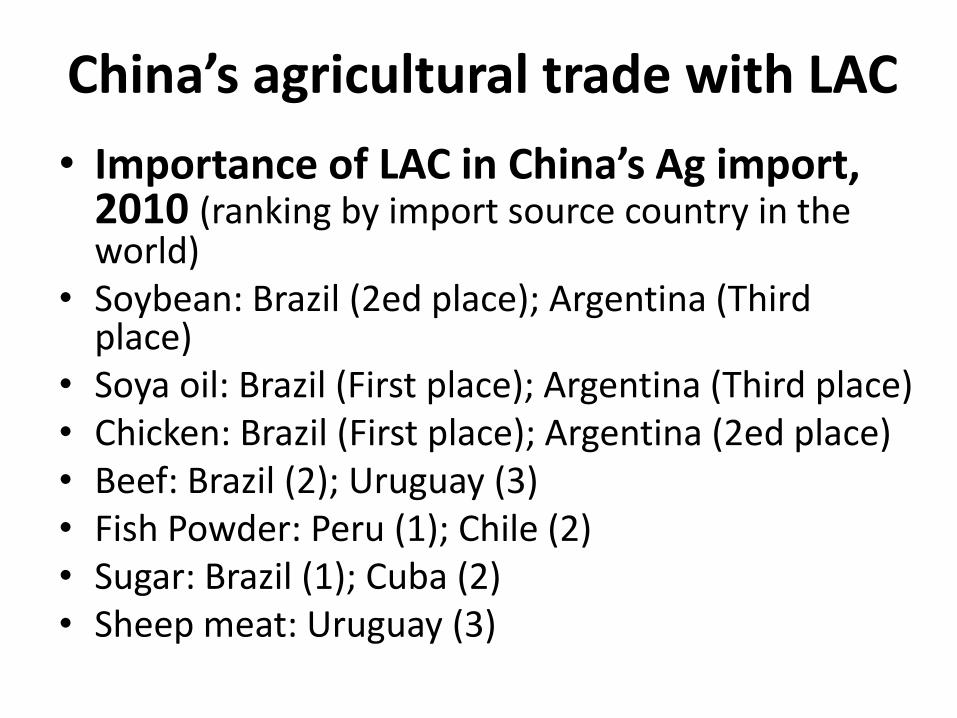
• Importance of LAC in China’s Ag import, 2010 (ranking by import source country in the world)
• Soybean: Brazil (2ed place); Argentina (Third place)
• Soya oil: Brazil (First place); Argentina (Third place) • Chicken: Brazil (First place); Argentina (2ed place) • Beef: Brazil (2); Uruguay (3) • Fish Powder: Peru (1); Chile (2) • Sugar: Brazil (1); Cuba (2) • Sheep meat: Uruguay (3)
China’s agricultural trade with LAC
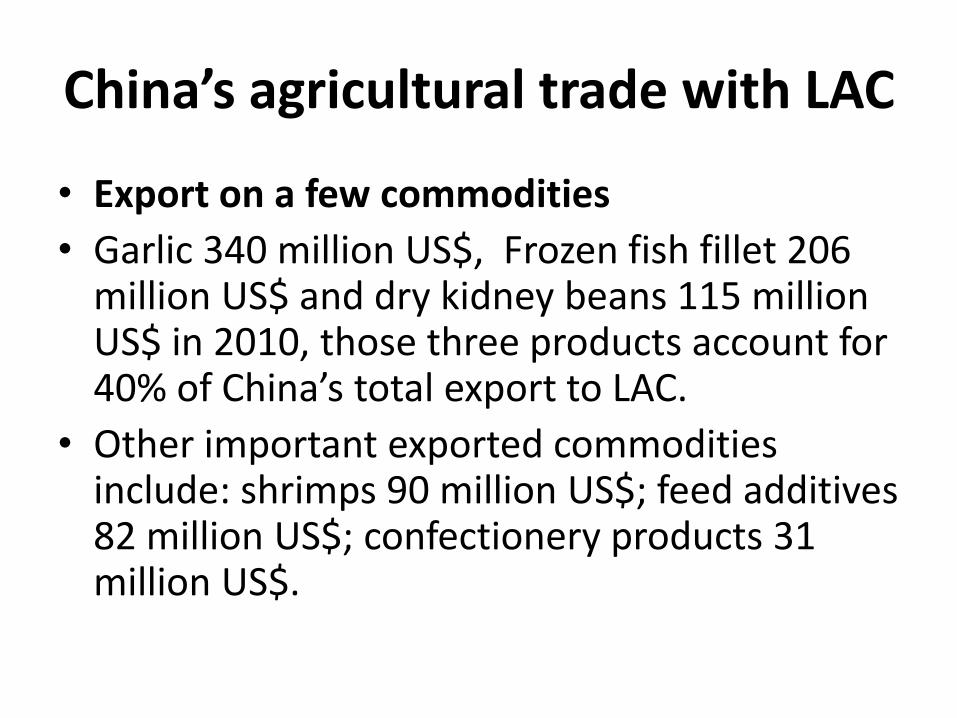
• Export on a few commodities
• Garlic 340 million US$, Frozen fish fillet 206 million US$ and dry kidney beans 115 million US$ in 2010, those three products account for 40% of China’s total export to LAC.
• Other important exported commodities include: shrimps 90 million US$; feed additives 82 million US$; confectionery products 31 million US$.
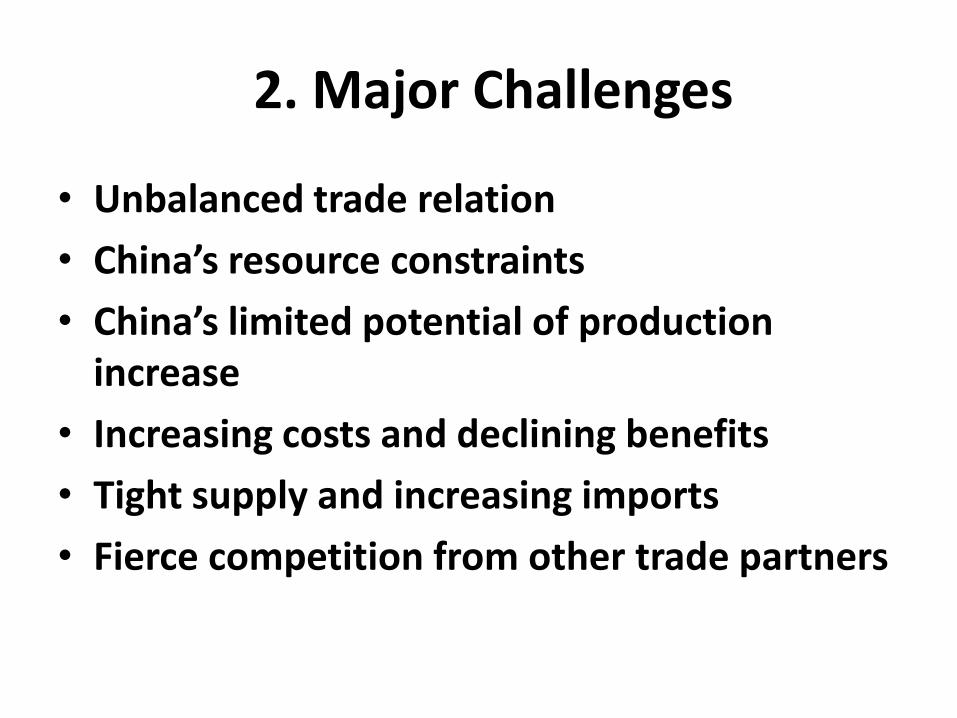
2. Major Challenges
• Unbalanced trade relation
• China’s resource constraints
• China’s limited potential of production increase
• Increasing costs and declining benefits
• Tight supply and increasing imports
• Fierce competition from other trade partners
Unbalanced trade relation • China’s agricultural import from LAC is much
higher than its export to LAC in recent years (12 to 15 times!). For example, in 2008, import from LAC is 19.5 billion US$ while export to LAC is only 1.3 billion US$, or 14.8 times higher; in 2010, import from LAC is 19.5 billion US$ while export to LAC is only 1.6 billion US$, or 12 times higher.
• China agricultural import from LAC accounts for about 30% of China’s total agricultural import, while export accounts for only about 3% in recent years (27.1% and 3.3% respectively in 2010; 33.4% and 3.3% in 2008).
Unbalanced trade relation
• …huge trade deficit
• China has deficit in the agricultural trade with LAC in the past two decades, from 1-2 billion US$ of deficit in the second half of 1990s to almost 18 billion US$ in 2010. Actually, China’s agricultural trade deficit with Latin America is almost at the same scale as China total agricultural trade deficit.
China’s resource constraints
• Water • Per capita water availability in China is only of ¼ of
world average. • Proportion of agriculture in total water utilization
drops from 70.2% in 1997 to 62% in 2008. • Annual shortage of water for agricultural irrigation:
30 billion cube meters (around 10% of current agricultural water utilization).
• Uneven distribution of water: major producing area in North China (65% of farmland), but with only about 20% of national total water resource.
China’s resource constraints
• Land • Per capita arable land in China is only 0.082 ha,
about 40% of world average (or 31% of LAC Average, 10% of Argentina, 26% of Brazil).
• Very strict farmland protection policy in China. “Red line” of arable land no less than 120 million ha, basic farmland no less than 104 million ha. Strictly control the utilization of arable land for non-agricultural purposes. Implement the management on the different utilizations of land.
• China uses 8% of world’s arable land to feed 20% of population (FAO, 2011. for data of year 2009).
China’s resource constraints
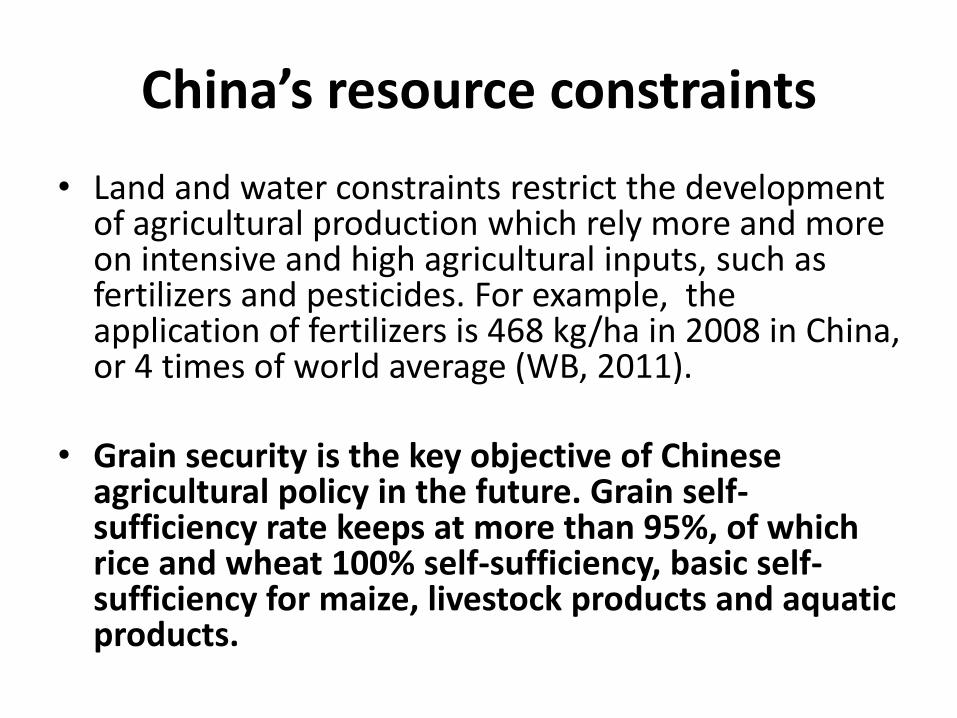
• Land and water constraints restrict the development of agricultural production which rely more and more on intensive and high agricultural inputs, such as fertilizers and pesticides. For example, the application of fertilizers is 468 kg/ha in 2008 in China, or 4 times of world average (WB, 2011).
• Grain security is the key objective of Chinese agricultural policy in the future. Grain self-sufficiency rate keeps at more than 95%, of which rice and wheat 100% self-sufficiency, basic self-sufficiency for maize, livestock products and aquatic products.
China’s limited potential of production increase
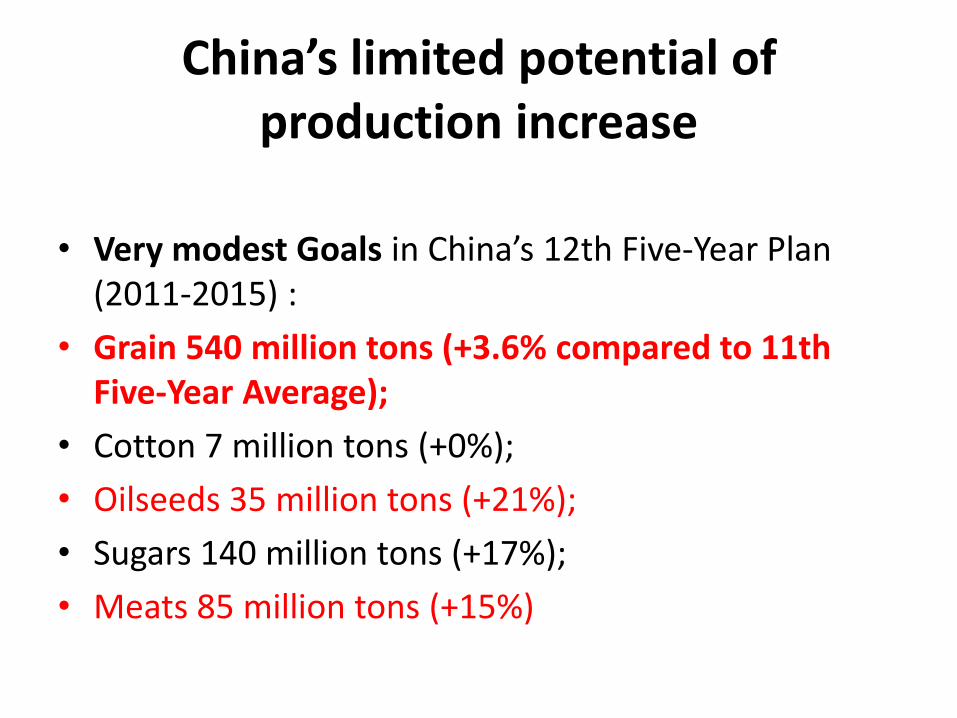
• Very modest Goals in China’s 12th Five-Year Plan (2011-2015) :
• Grain 540 million tons (+3.6% compared to 11th Five-Year Average);
• Cotton 7 million tons (+0%);
• Oilseeds 35 million tons (+21%);
• Sugars 140 million tons (+17%);
• Meats 85 million tons (+15%)
Increasing costs and declining benefits for grain production
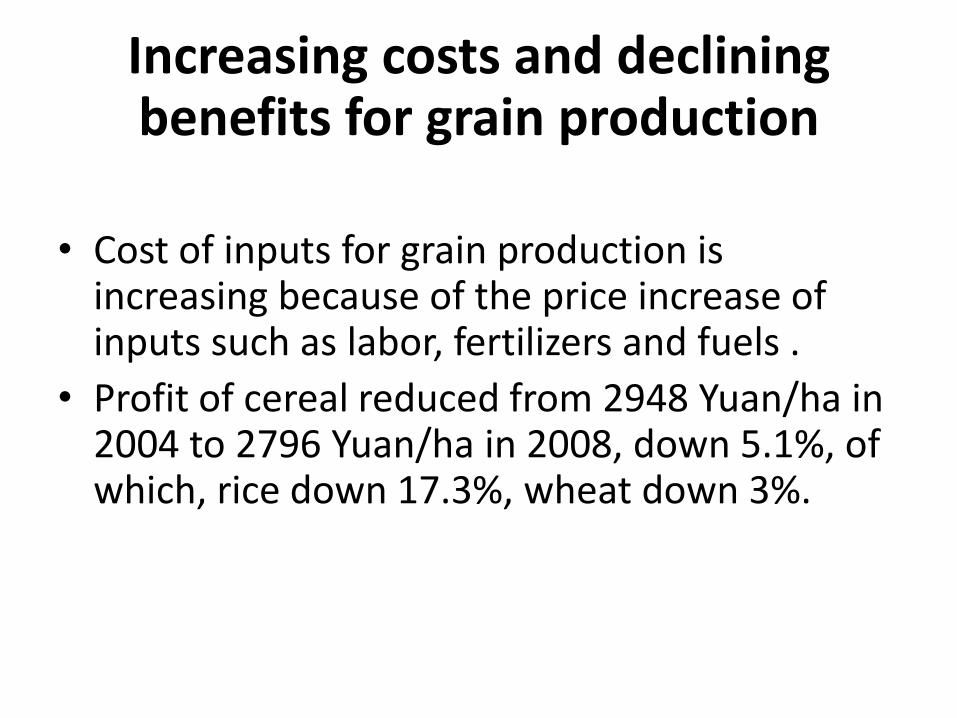
• Cost of inputs for grain production is increasing because of the price increase of inputs such as labor, fertilizers and fuels .
• Profit of cereal reduced from 2948 Yuan/ha in 2004 to 2796 Yuan/ha in 2008, down 5.1%, of which, rice down 17.3%, wheat down 3%.
Tight supply and increasing imports
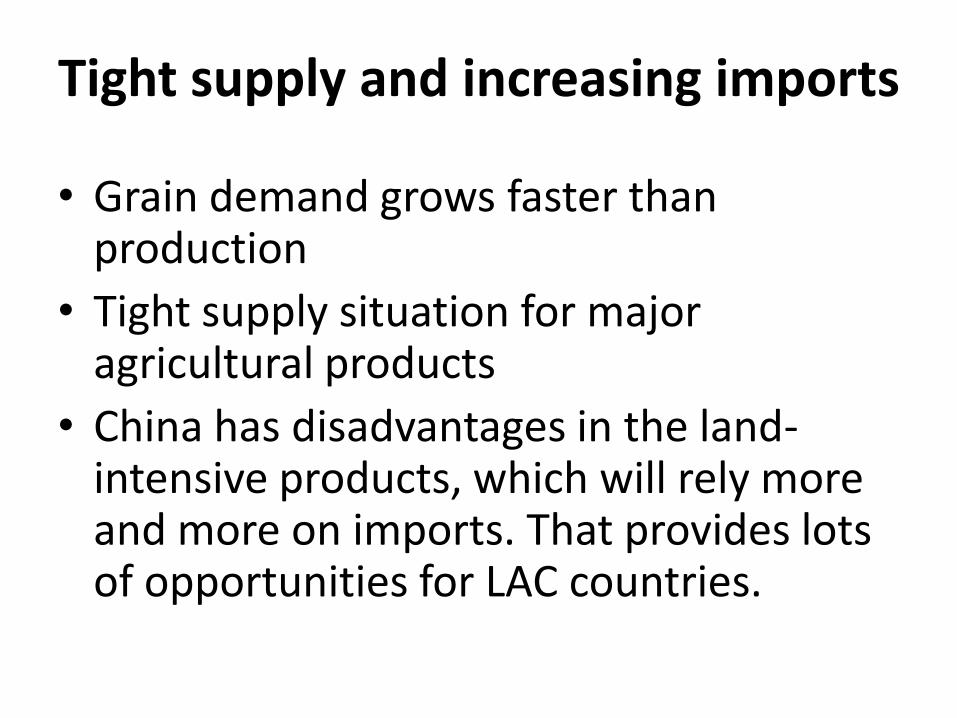
• Grain demand grows faster than production
• Tight supply situation for major agricultural products
• China has disadvantages in the land-intensive products, which will rely more and more on imports. That provides lots of opportunities for LAC countries.
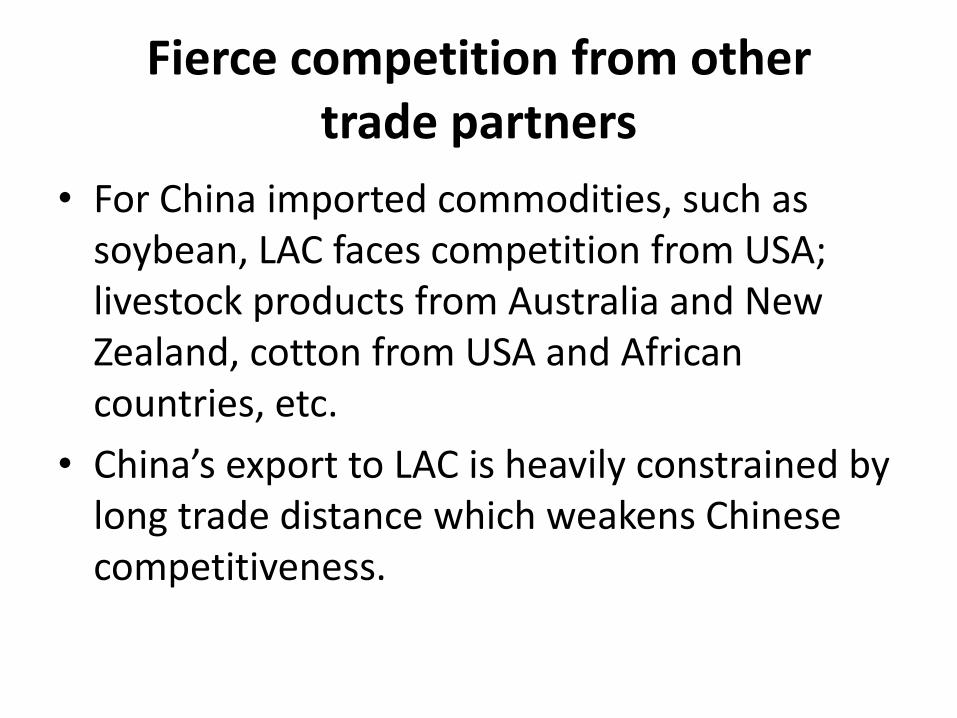
Fierce competition from other
trade partners • For China imported commodities, such as
soybean, LAC faces competition from USA; livestock products from Australia and New Zealand, cotton from USA and African countries, etc.
• China’s export to LAC is heavily constrained by long trade distance which weakens Chinese competitiveness.
3. Trade opportunities
• China’s high economic growth
• Increasing demand for agricultural products
• Changing consumption pattern
• Strong purchasing powers
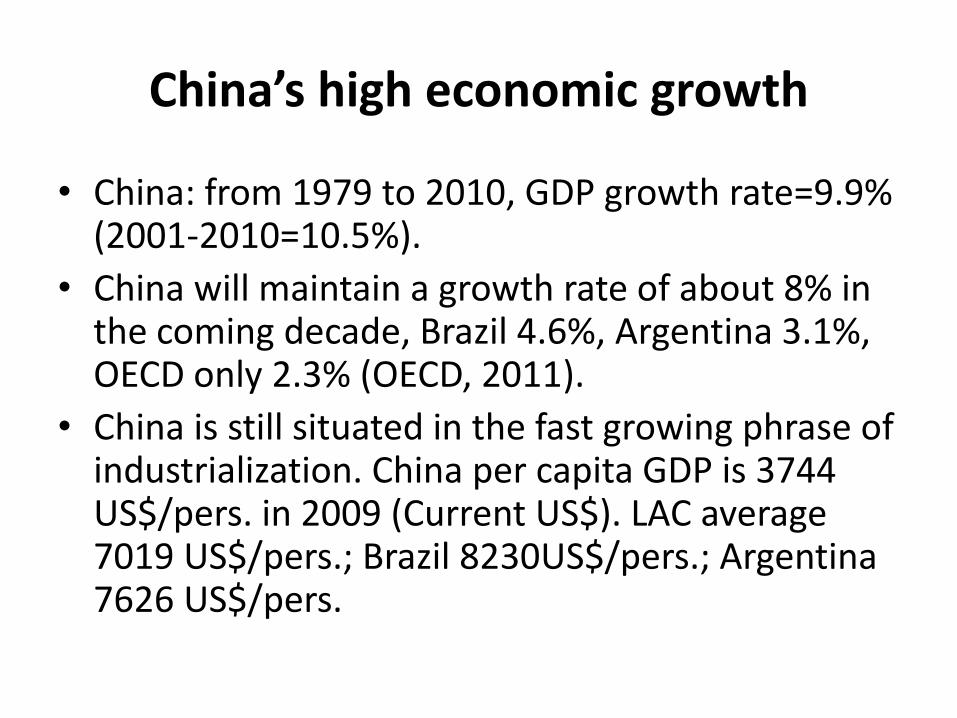
China’s high economic growth
• China: from 1979 to 2010, GDP growth rate=9.9%
(2001-2010=10.5%).
• China will maintain a growth rate of about 8% in the coming decade, Brazil 4.6%, Argentina 3.1%, OECD only 2.3% (OECD, 2011).
• China is still situated in the fast growing phrase of industrialization. China per capita GDP is 3744 US$/pers. in 2009 (Current US$). LAC average 7019 US$/pers.; Brazil 8230US$/pers.; Argentina 7626 US$/pers.
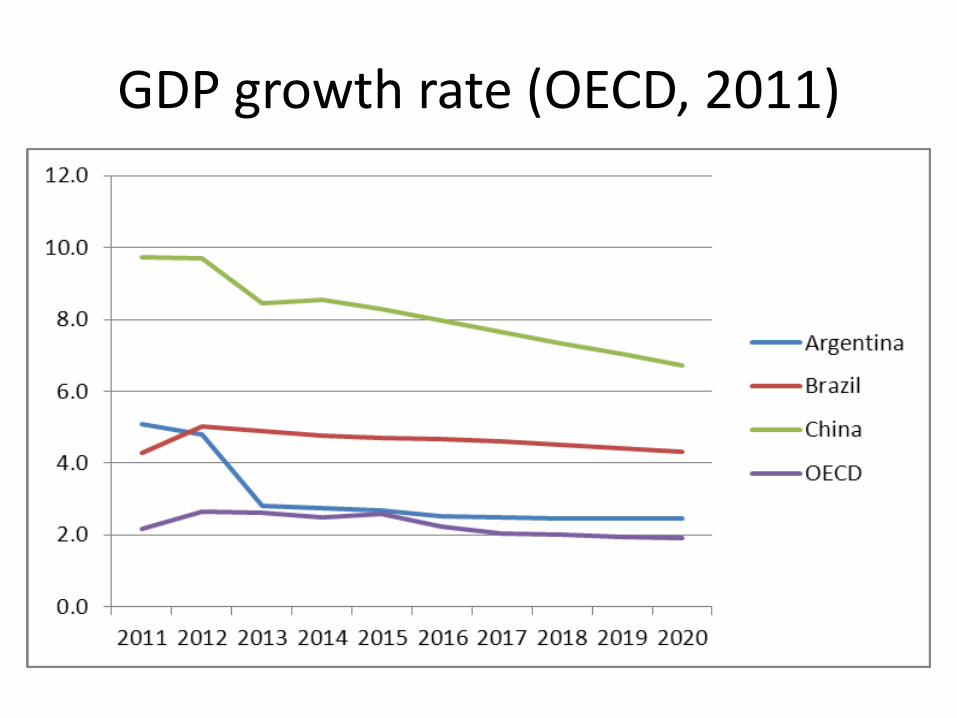
GDP growth rate (OECD, 2011)
Increasing demand for agricultural products
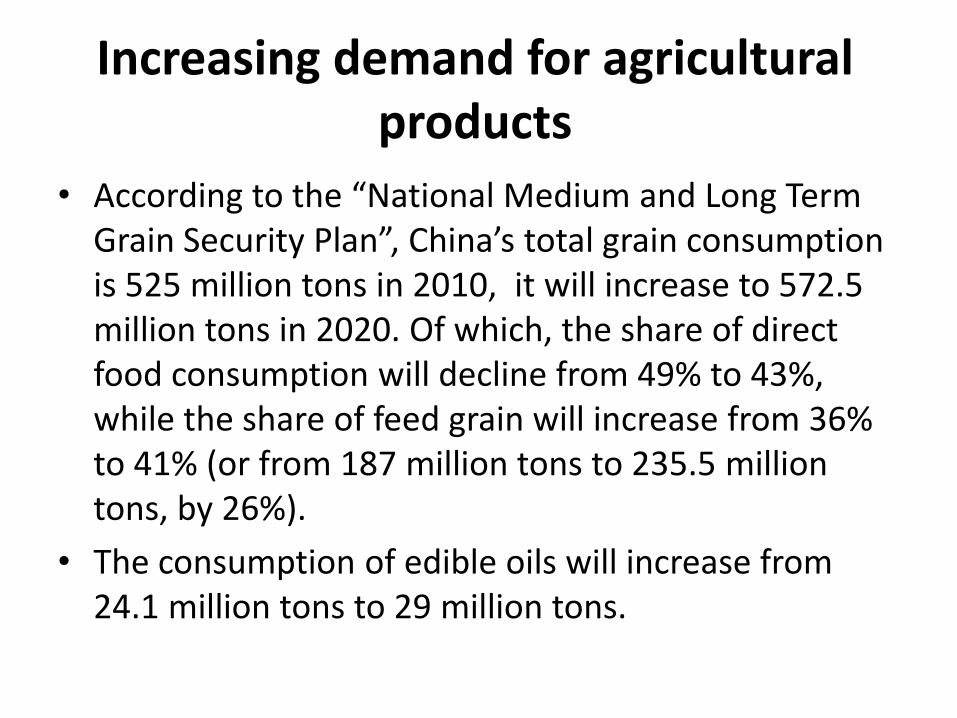
• According to the “National Medium and Long Term Grain Security Plan”, China’s total grain consumption is 525 million tons in 2010, it will increase to 572.5 million tons in 2020. Of which, the share of direct food consumption will decline from 49% to 43%, while the share of feed grain will increase from 36% to 41% (or from 187 million tons to 235.5 million tons, by 26%).
• The consumption of edible oils will increase from 24.1 million tons to 29 million tons.
Changing consumption pattern
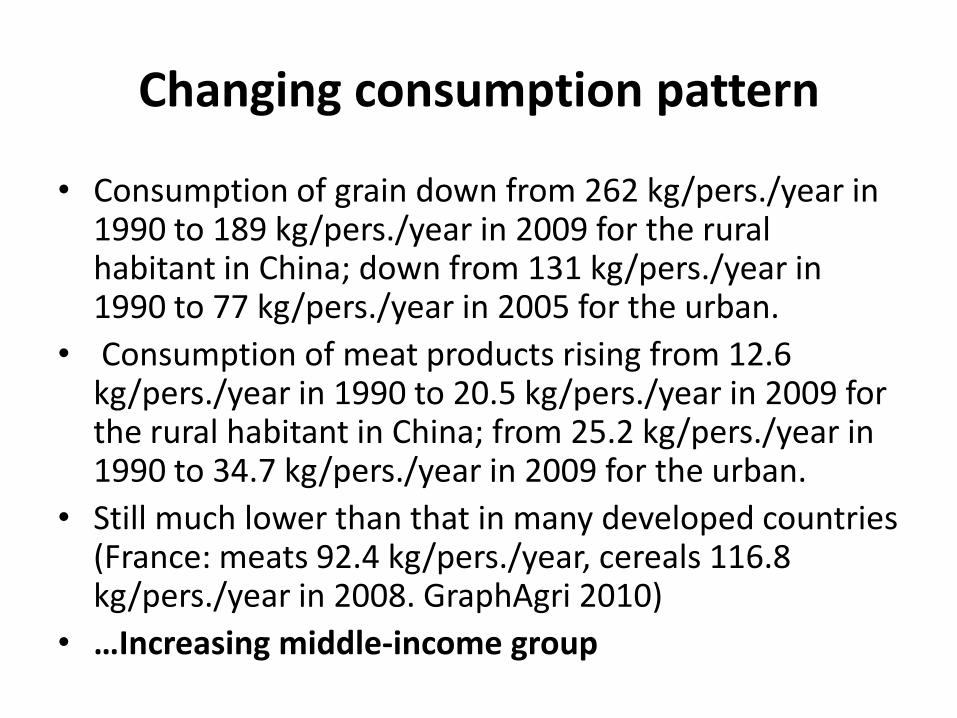
• Consumption of grain down from 262 kg/pers./year in
1990 to 189 kg/pers./year in 2009 for the rural habitant in China; down from 131 kg/pers./year in 1990 to 77 kg/pers./year in 2005 for the urban.
• Consumption of meat products rising from 12.6 kg/pers./year in 1990 to 20.5 kg/pers./year in 2009 for the rural habitant in China; from 25.2 kg/pers./year in 1990 to 34.7 kg/pers./year in 2009 for the urban.
• Still much lower than that in many developed countries (France: meats 92.4 kg/pers./year, cereals 116.8 kg/pers./year in 2008. GraphAgri 2010)
• …Increasing middle-income group
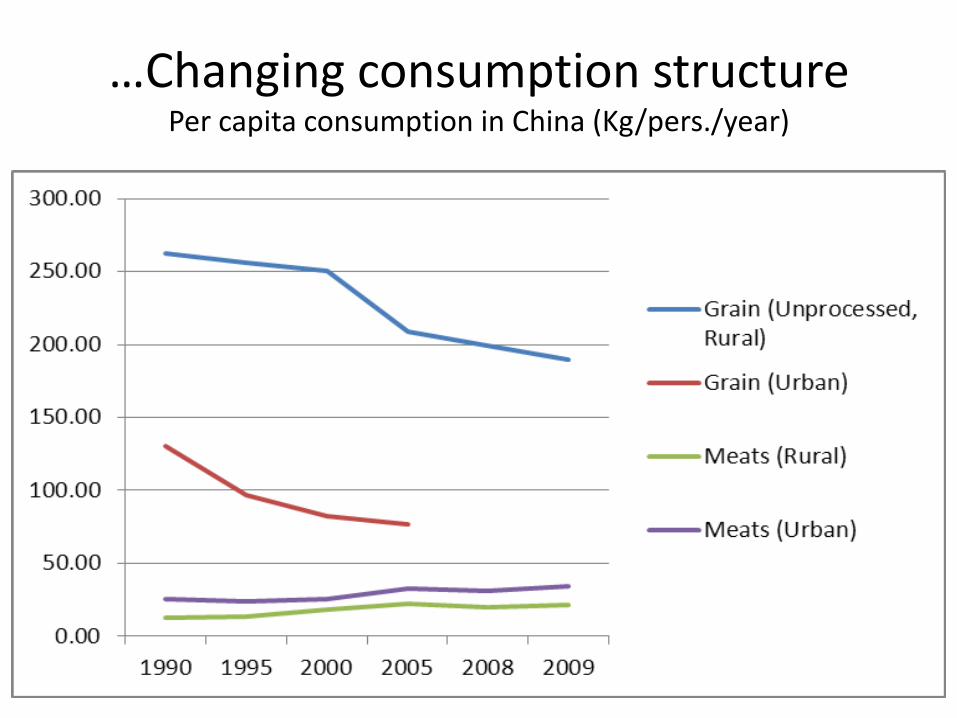
…Changing consumption structure Per capita consumption in China (Kg/pers./year)
Strong purchasing powers
• China’s foreign currency reserve ranks the first place in the world, with 2847 billion US$ in 2010.
• China’s total trade surplus= 183 billion US$
• Agricultural trade deficit is not a big issue in China
4. Prospects of trade relation
between China and Latin America
• Policy direction
• Increasing trade relationship with LAC
• Favorable trade environment
• More participation from government and enterprises
• More cooperation and exchanges
• From trade to direct investment in production and processing?
Policy direction
• Grain security
• …but not security for all ag products
• Strengthen governmental cooperation to establish long-term and stable agricultural cooperation with some major grain producing countries
• Implementing “go abroad” strategy with active participation from enterprises
• Regulate import-export.
• Biofuel policy:
Increasing trade relationship with LAC
• Resource endowments and complementarity between China and LAC determine the trade relation
• Increasing demand for agricultural products and import from China
• LAC is one of most important regions for China
Increasing trade relationship with LAC
• … the trade on cereal will be very limited.
• China’s grain security goals; Rice, wheat, maize subject to TRQ management; China’s domestic largely focused on grain production (R&D investment; expenditure in infrastructure; increasing direct and targeted subventions to farmers; minimum guaranteed price for rice and wheat; etc.)
Favorable trade environment
• Low import tariff, both from China and from
LAC. China’s import tariffs is only 15%.
• China has signed Free Trade Agreement with ) Chile (2006) , Peru (2009) and Costa Rica (2010).
• China has promulgated a policy document with LAC in November 2008: making effort to strengthen the cooperation with LAC in agriculture, trade and investment.
More participation from government
and enterprises • Currently, the Chinese agricultural import is
dominated by multinational foreign companies, especially for soybean, four multinational companies monopolize the import and crushing sector. There is a strong call for more active and effective participation from the government and domestic enterprises.
More exchanges and cooperation
• China has signed MOU with 12 LAC countries (Brazil, Chile, Argentina, Mexico, Peru, Cuba, Colombia, etc.); established Bilateral Agricultural Committee with 8 LAC countries…
• China has signed 4-party MOU with Venezuela with involvement of financial institutions.
• More exchanges at all levels, governmental, business, research institutions, as well as unofficial exchanges.
…cooperation areas
• Differentiated cooperation strategy with LAC individual country
• Agricultural Science and Technology
• --Training of agricultural technicians
• --establishing high-yield crop demonstration centers…
• Poverty reduction
• SSC programs on food security
• …
From trade to direct investment in
production and processing?
• Unbalanced trade will create conflicts
• In the future, possible for China to invest directly in agricultural production and agro-food processing in LAC (FDI in production; in crushing sector)?
• But need to confront: local land tenure system, individual national policies, etc.

Thank you for your attention