Embed Size (px)
Citation preview
The Agricultural Outlook: USDA’s Commodity Analysis Program and Current Market Prospects
Gerald A. BangeChairperson
World Agricultural Outlook BoardOffice of the Chief Economist
U.S. Department of Agriculture
Presented toJohn Deere Executives
Moline, IllinoisJuly 22, 2008
2
Topics for Discussion
• USDA’s Analytical Program• Commodity Situation and Outlook• Impact of Renewable Energy• Fuel vs. Food Debate• Prospects for World Agricultural Growth

3
USDA’s Economic Information System
Farm Service Agency
Joint Agricultural
Weather Facility
Foreign Agricultural
Service
Economic Research Service
National Agricultural
Statistics Service
ERS Situation and Outlook
Reports
Weekly Weatherand
Crop Bulletin
World Agricultural
Outlook BoardDomestic
Production and Stocks Estimates
World Agricultural Supply and
Demand EstimatesFAS
Commodity Circulars
Long-term Baseline
Projections
4
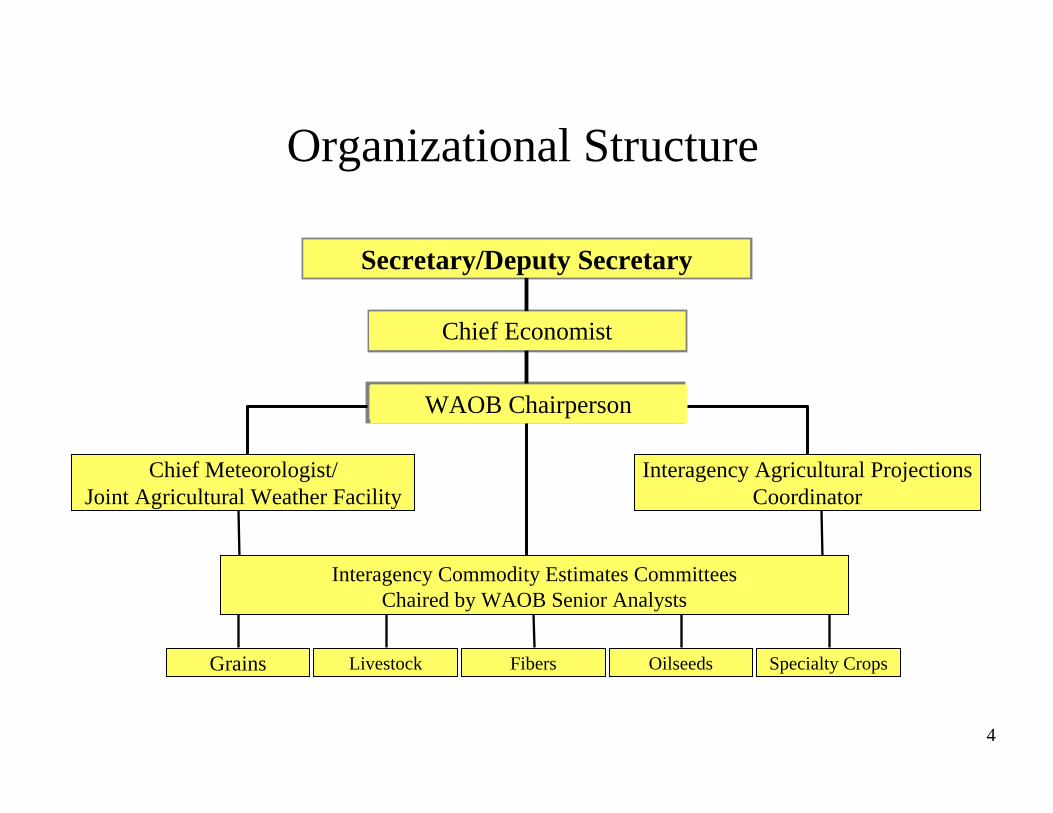
Interagency Agricultural Projections Coordinator
Chief Economist
Secretary/Deputy Secretary
Organizational Structure
WAOB Chairperson
Chief Meteorologist/Joint Agricultural Weather Facility
Grains OilseedsLivestock Fibers Specialty Crops
Interagency Commodity Estimates CommitteesChaired by WAOB Senior Analysts
5
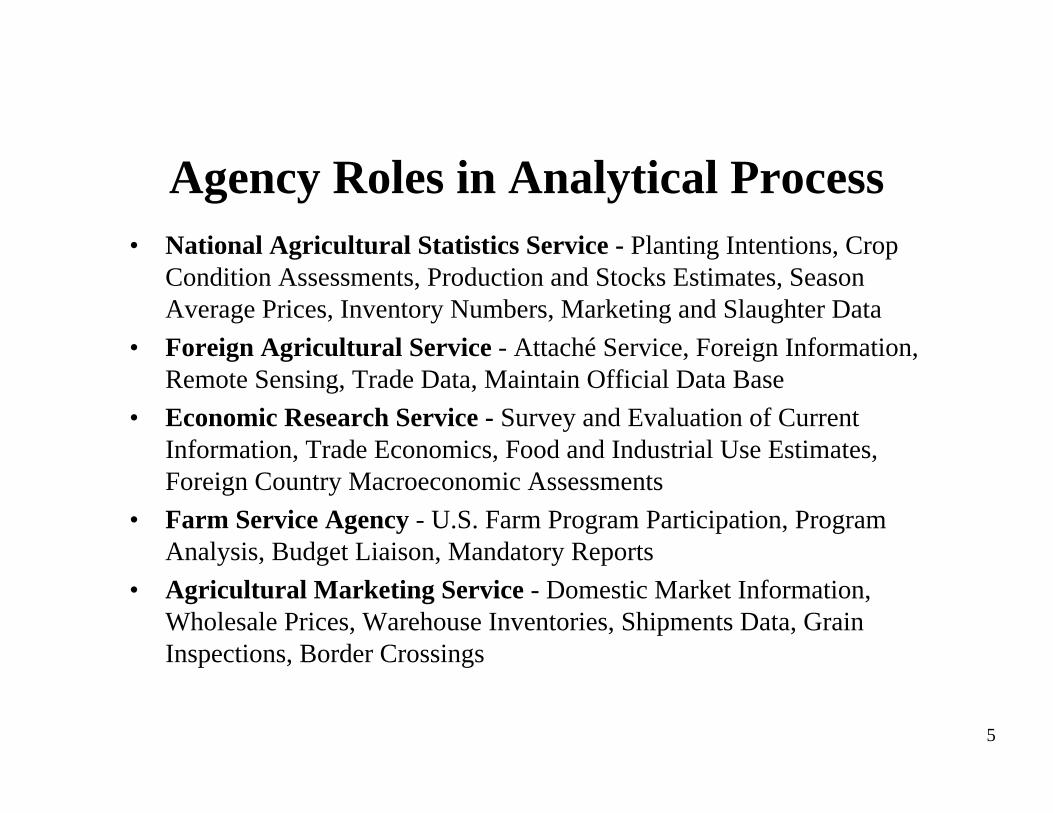
Agency Roles in Analytical Process• National Agricultural Statistics Service - Planting Intentions, Crop
Condition Assessments, Production and Stocks Estimates, Season Average Prices, Inventory Numbers, Marketing and Slaughter Data
• Foreign Agricultural Service - Attaché Service, Foreign Information, Remote Sensing, Trade Data, Maintain Official Data Base
• Economic Research Service - Survey and Evaluation of Current Information, Trade Economics, Food and Industrial Use Estimates,Foreign Country Macroeconomic Assessments
• Farm Service Agency - U.S. Farm Program Participation, Program Analysis, Budget Liaison, Mandatory Reports
• Agricultural Marketing Service - Domestic Market Information, Wholesale Prices, Warehouse Inventories, Shipments Data, Grain Inspections, Border Crossings
6
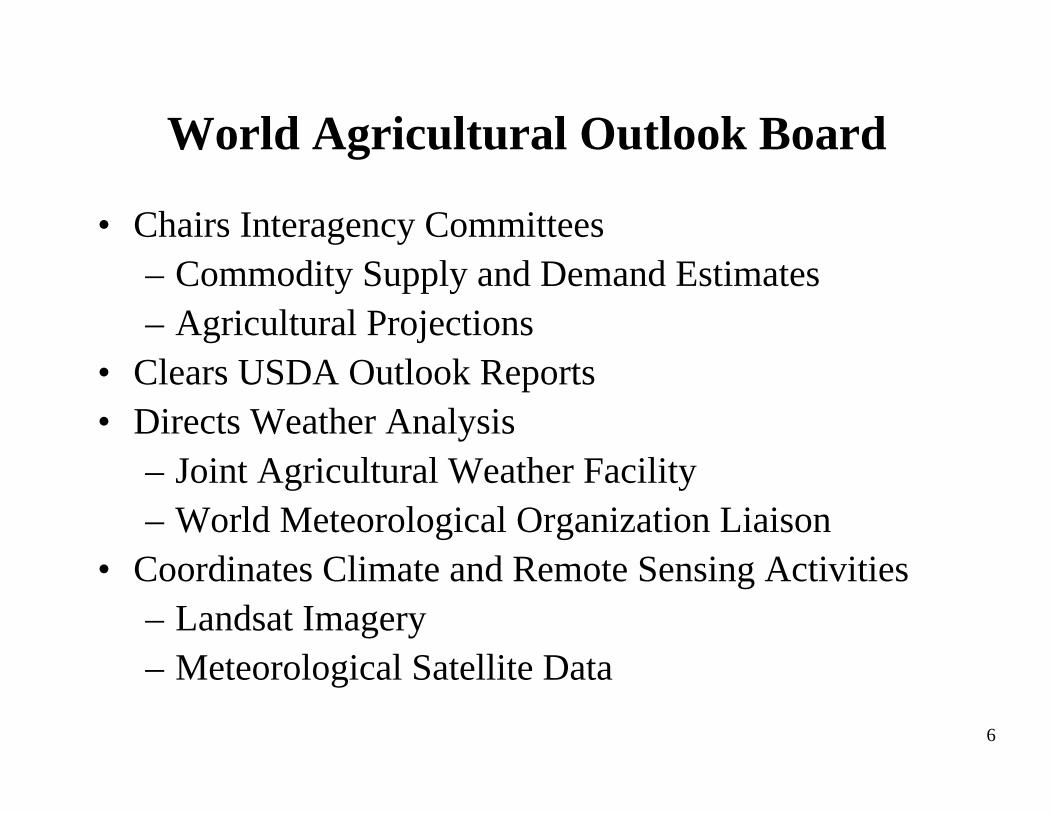
World Agricultural Outlook Board
• Chairs Interagency Committees– Commodity Supply and Demand Estimates– Agricultural Projections
• Clears USDA Outlook Reports• Directs Weather Analysis
– Joint Agricultural Weather Facility– World Meteorological Organization Liaison
• Coordinates Climate and Remote Sensing Activities– Landsat Imagery– Meteorological Satellite Data
7
Goals of USDA’s Analytical Program
• Objectivity– Provide unbiased information
• Reliability– Based on sound data and analysis
• Timeliness– Fast flow to users
8
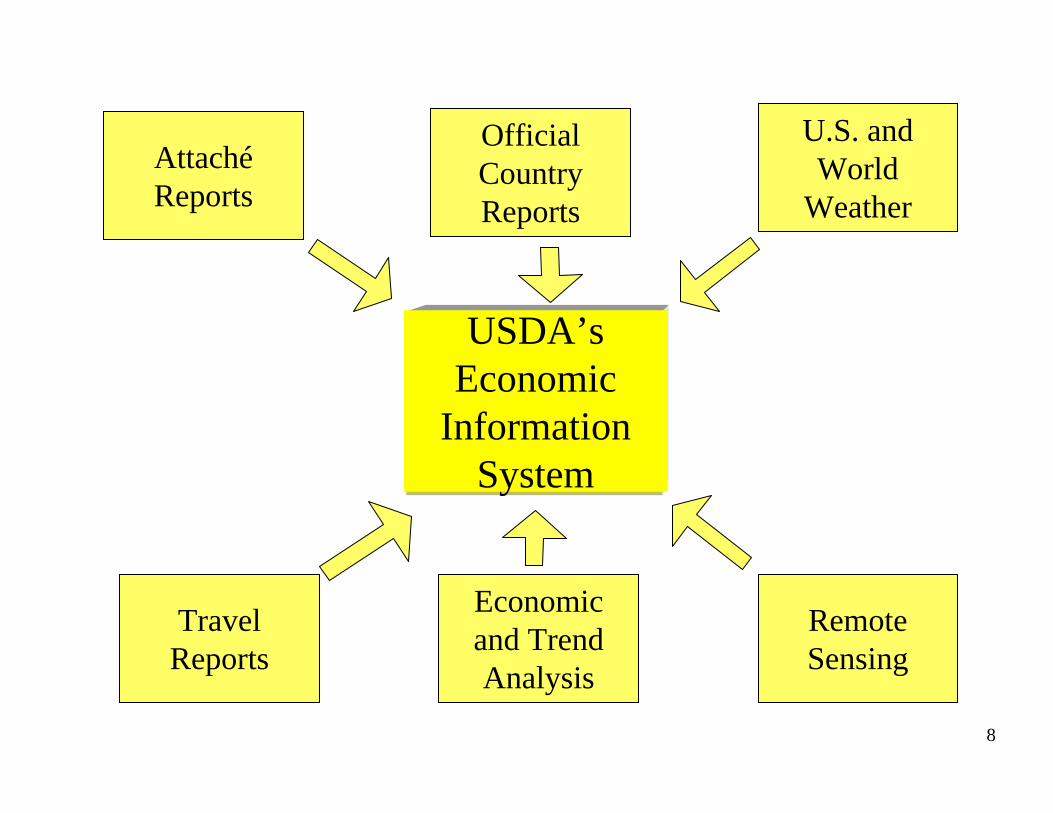
Economic and Trend Analysis
U.S. and World
Weather
Travel Reports
Remote Sensing
Official Country Reports
AttachéReports
USDA’s Economic
Information System
9
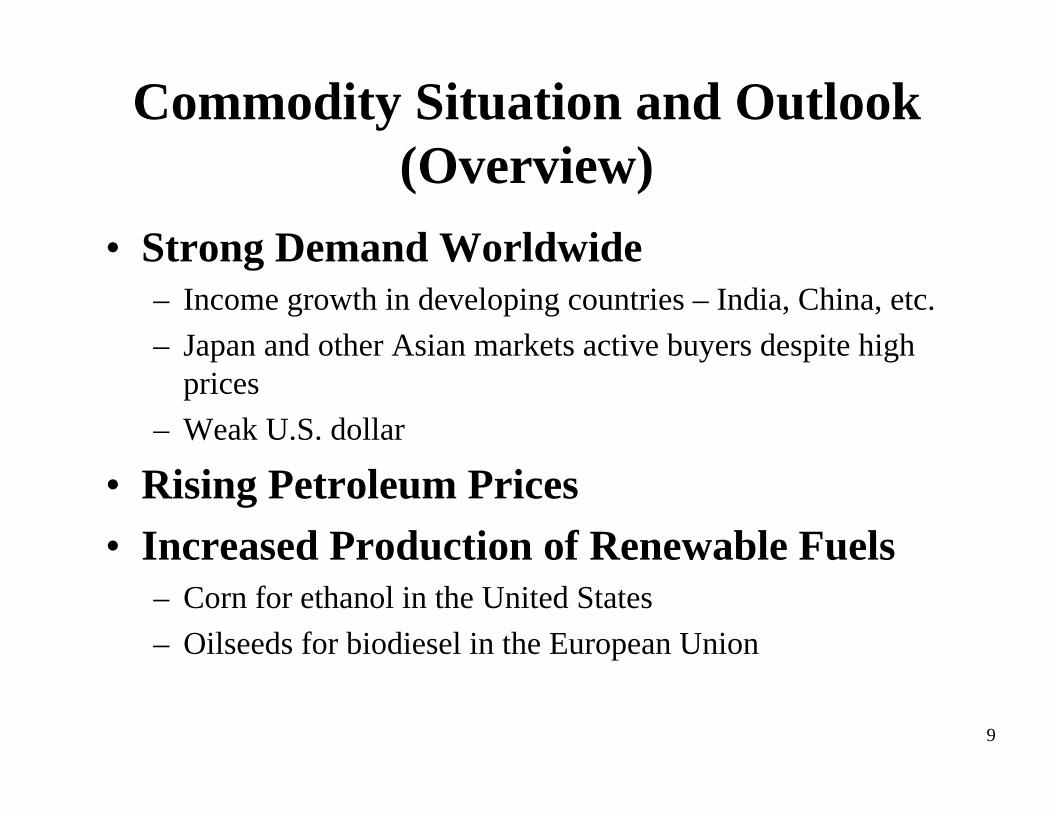
Commodity Situation and Outlook (Overview)
• Strong Demand Worldwide – Income growth in developing countries – India, China, etc.– Japan and other Asian markets active buyers despite high
prices– Weak U.S. dollar
• Rising Petroleum Prices • Increased Production of Renewable Fuels
– Corn for ethanol in the United States– Oilseeds for biodiesel in the European Union
10
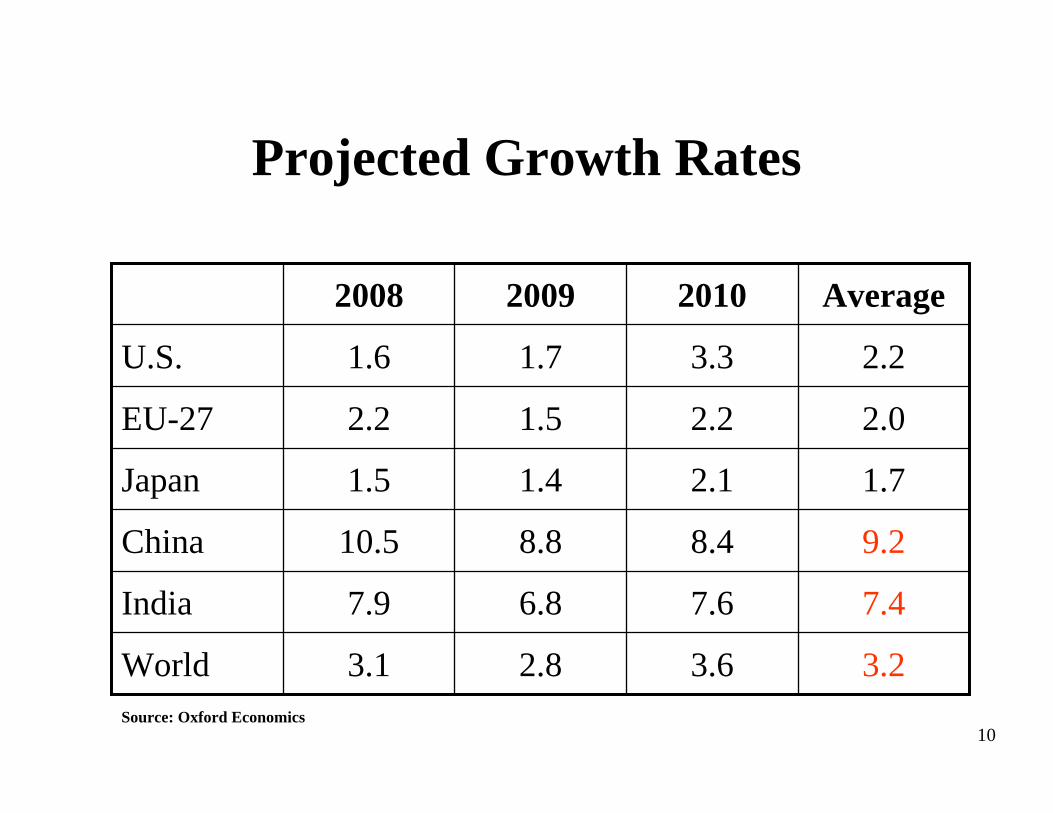
Projected Growth Rates
2.8
6.8
8.8
1.4
1.5
1.7
2009 Average20102008
3.23.63.1World
7.47.67.9India
9.28.410.5China
1.72.11.5Japan
2.02.22.2EU-27
2.23.31.6U.S.
Source: Oxford Economics
11
Overview(continued)
• Tight Grain and Soybean Stocks– U.S wheat stocks at 60-year low– World wheat stocks at 26-year low– Corn stocks forecast to decline sharply in 2008/09– U.S. soybean acres dropped sharply in 2007/08,
stocks reduced from record beginning levels as use exceeds production by 450+ million bushels
– South American soybean acres increased only modestly in 2007/08
– China imports of soybeans forecast record high
12
Overview(continued)
• World Wheat Consumption has exceeded Production in 7 of the last 8 years– Yields below trend in major exporting countries for the
past 2 years– Australia recorded 2 back-to-back crop failures – lost
more than one full year’s output– E.U. crops below par – U.S. yields below trend– Canadian crops below average
13
Overview(continued)
• Restrictions on World Exports– Ukraine, Russia, and Kazakhstan curtailed grain
exports– Argentina shut-off export registrations on corn and
wheat and raised taxes on soybean exports– Thailand, Vietnam, India, Egypt, Cambodia, and China
imposed various restraints on rice exports– Australian rice exportable supplies down sharply due to
drought
14
Overview(continued)
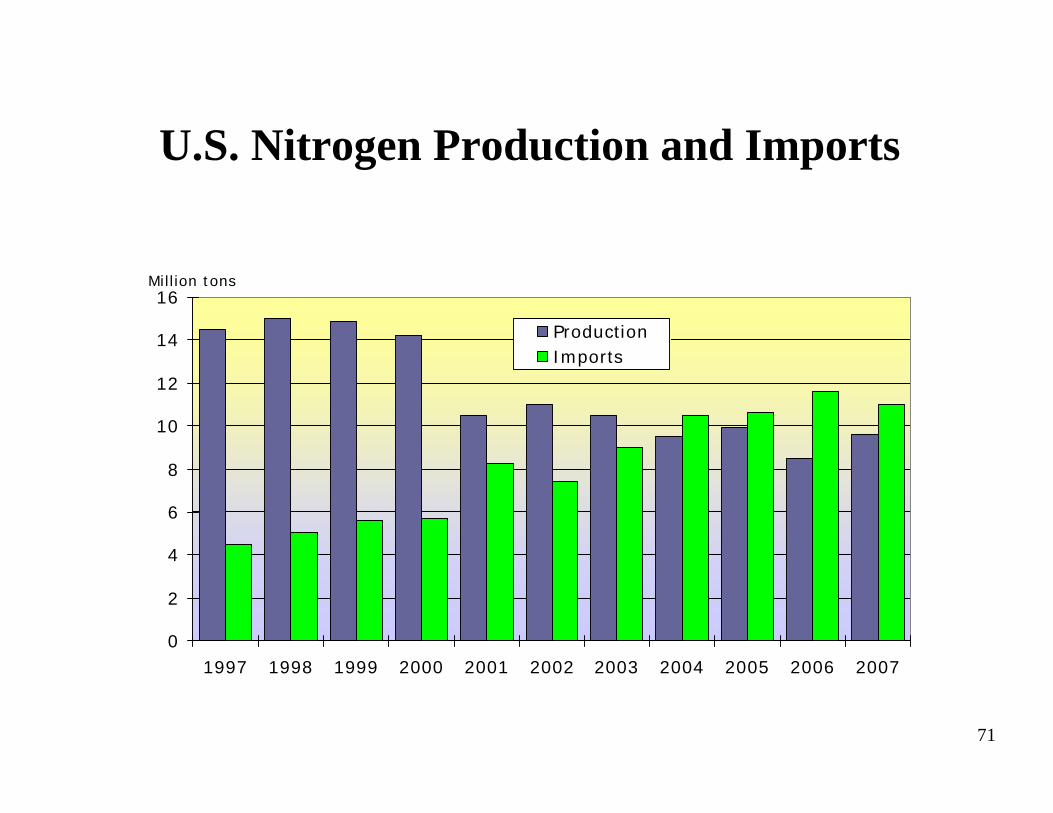
• Rising Input Costs– Fuel prices up sharply– Fertilizer prices at record highs
• Strong global demand with higher incomes, improved cultural practices and more cultivated area amid rising prices for agricultural commodities
• U.S. dependency on fertilizer imports is growing –domestic production accounts for less than half of nitrogen needs
– Feed prices rising
15
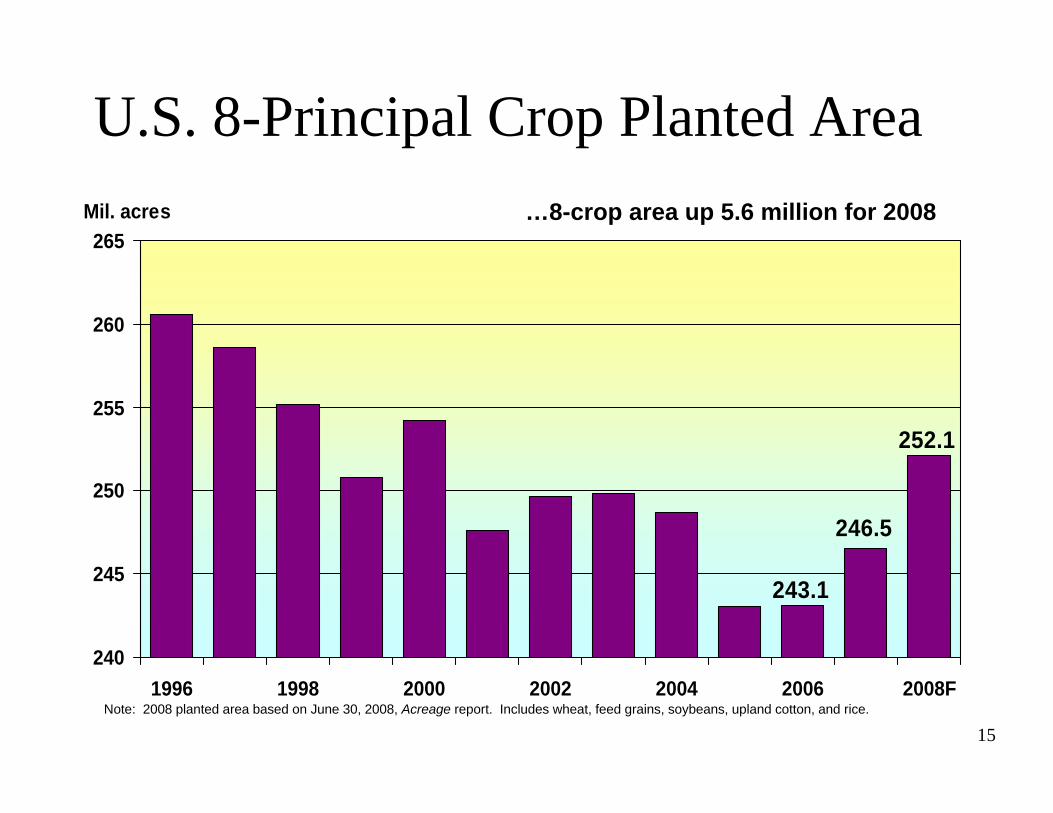
243.1
246.5
252.1
240
245
250
255
260
265
1996 1998 2000 2002 2004 2006 2008F
Mil. acres
Note: 2008 planted area based on June 30, 2008, Acreage report. Includes wheat, feed grains, soybeans, upland cotton, and rice.
U.S. 8-Principal Crop Planted Area…8-crop area up 5.6 million for 2008
16
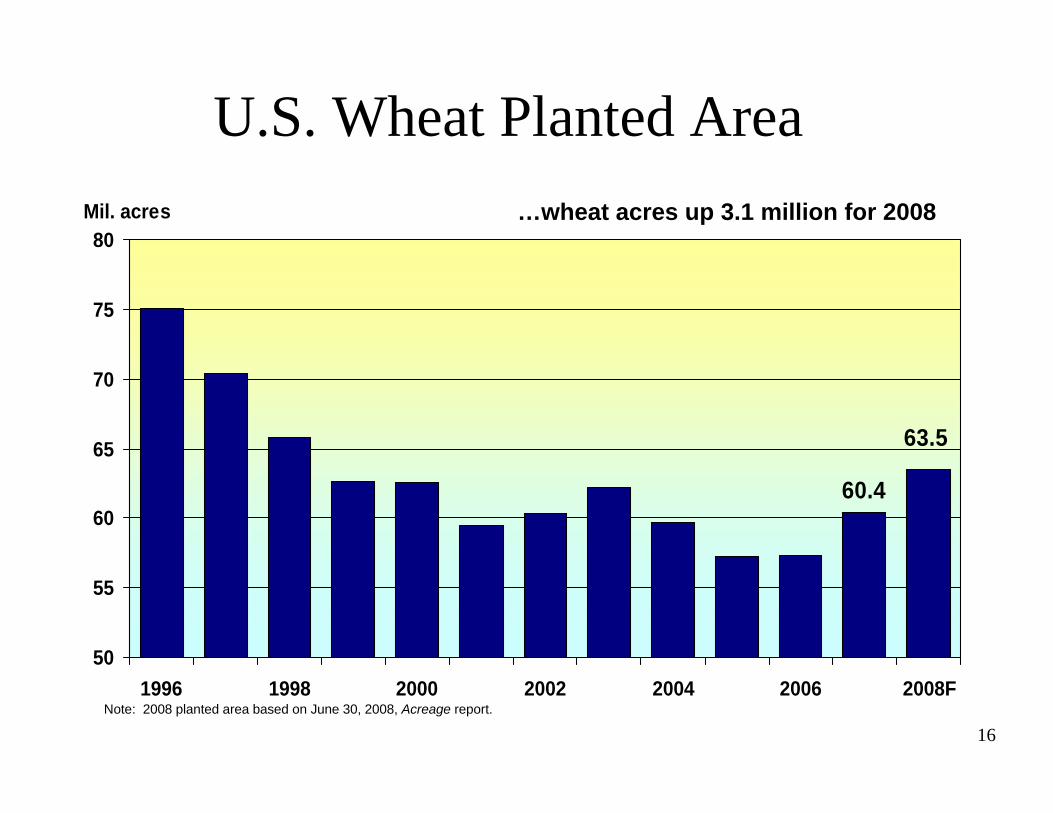
60.4
63.5
50
55
60
65
70
75
80
1996 1998 2000 2002 2004 2006 2008F
Mil. acres
Note: 2008 planted area based on June 30, 2008, Acreage report.
U.S. Wheat Planted Area…wheat acres up 3.1 million for 2008
17
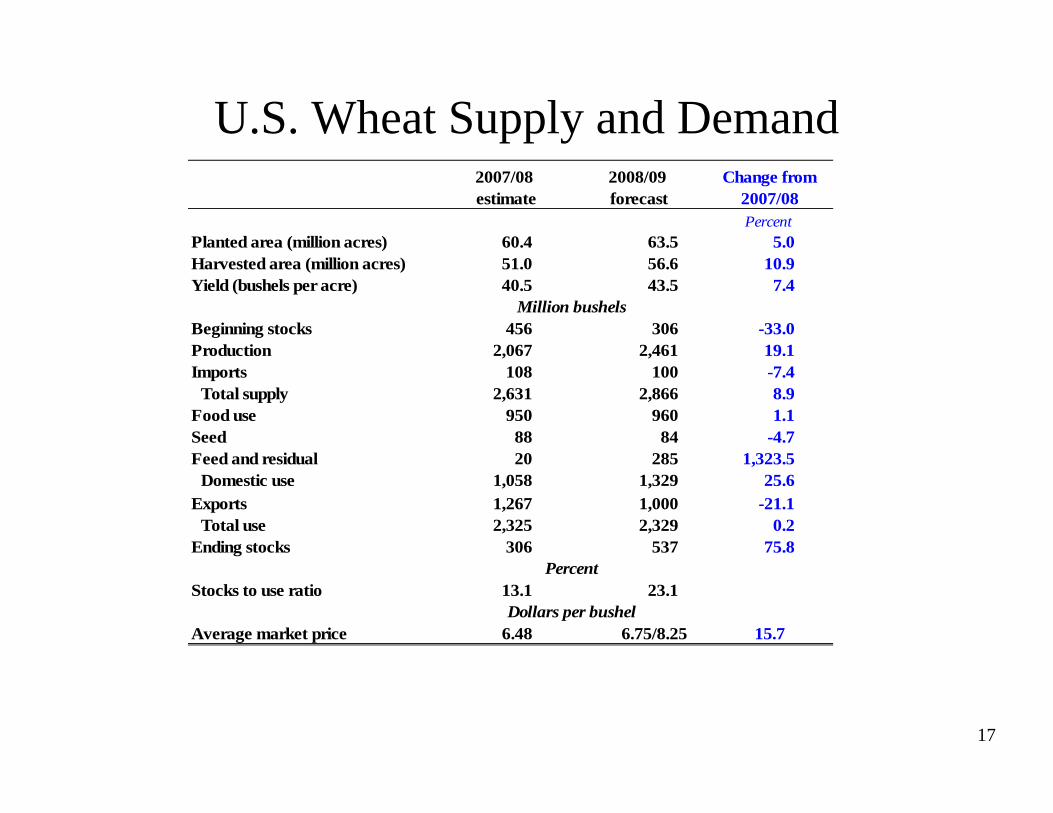
U.S. Wheat Supply and DemandChange from
2007/08Percent
Planted area (million acres) 60.4 63.5 5.0Harvested area (million acres) 51.0 56.6 10.9Yield (bushels per acre) 40.5 43.5 7.4
Million bushelsBeginning stocks 456 306 -33.0Production 2,067 2,461 19.1Imports 108 100 -7.4
Total supply 2,631 2,866 8.9Food use 950 960 1.1Seed 88 84 -4.7Feed and residual 20 285 1,323.5
Domestic use 1,058 1,329 25.6Exports 1,267 1,000 -21.1
Total use 2,325 2,329 0.2Ending stocks 306 537 75.8
PercentStocks to use ratio 13.1 23.1
Dollars per bushelAverage market price 6.48 6.75/8.25 15.7
2007/08 estimate
2008/09 forecast
Indicates an increase in the estimate or forecast from the previous month.Indicates a decrease in the estimate or forecast from the previous month.
18
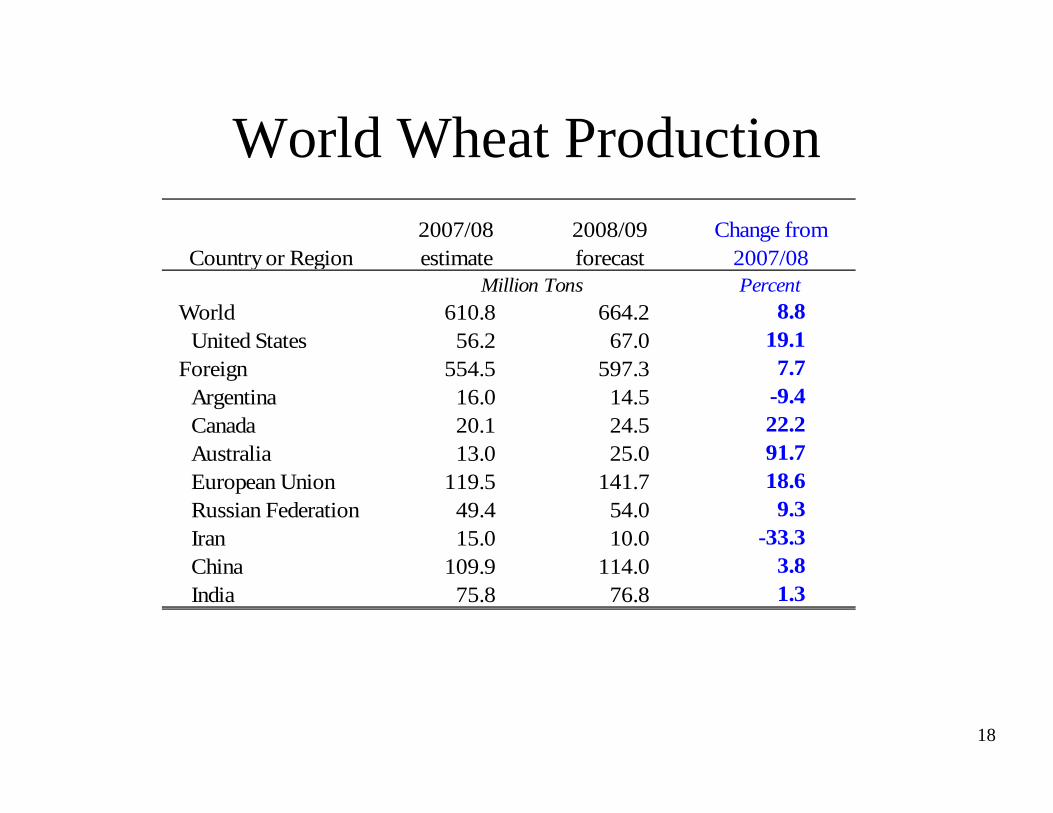
World Wheat Production
Country or Region2007/08 estimate
2008/09 forecast
Change from 2007/08
Million Tons PercentWorld 610.8 664.2 8.8
United States 56.2 67.0 19.1Foreign 554.5 597.3 7.7
Argentina 16.0 14.5 -9.4Canada 20.1 24.5 22.2Australia 13.0 25.0 91.7European Union 119.5 141.7 18.6Russian Federation 49.4 54.0 9.3Iran 15.0 10.0 -33.3China 109.9 114.0 3.8India 75.8 76.8 1.3
Indicates an increase in the estimate or forecast from the previous month.Indicates a decrease in the estimate or forecast from the previous month.
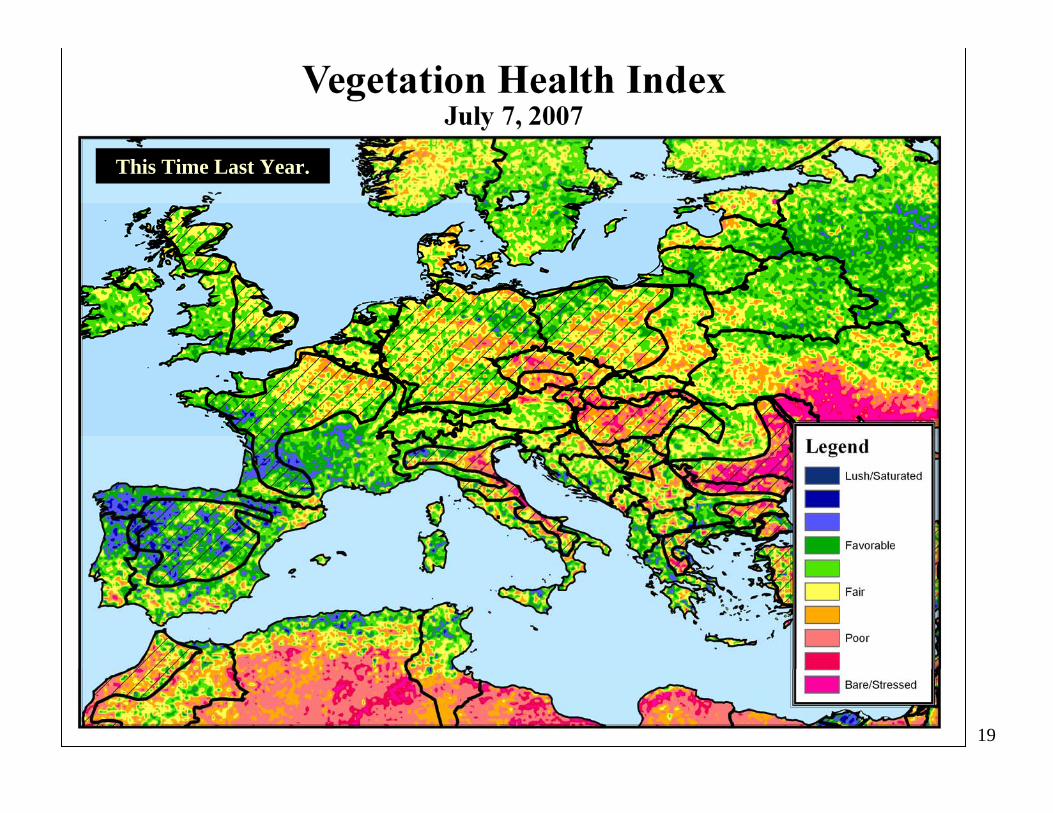
19
This Time Last Year.
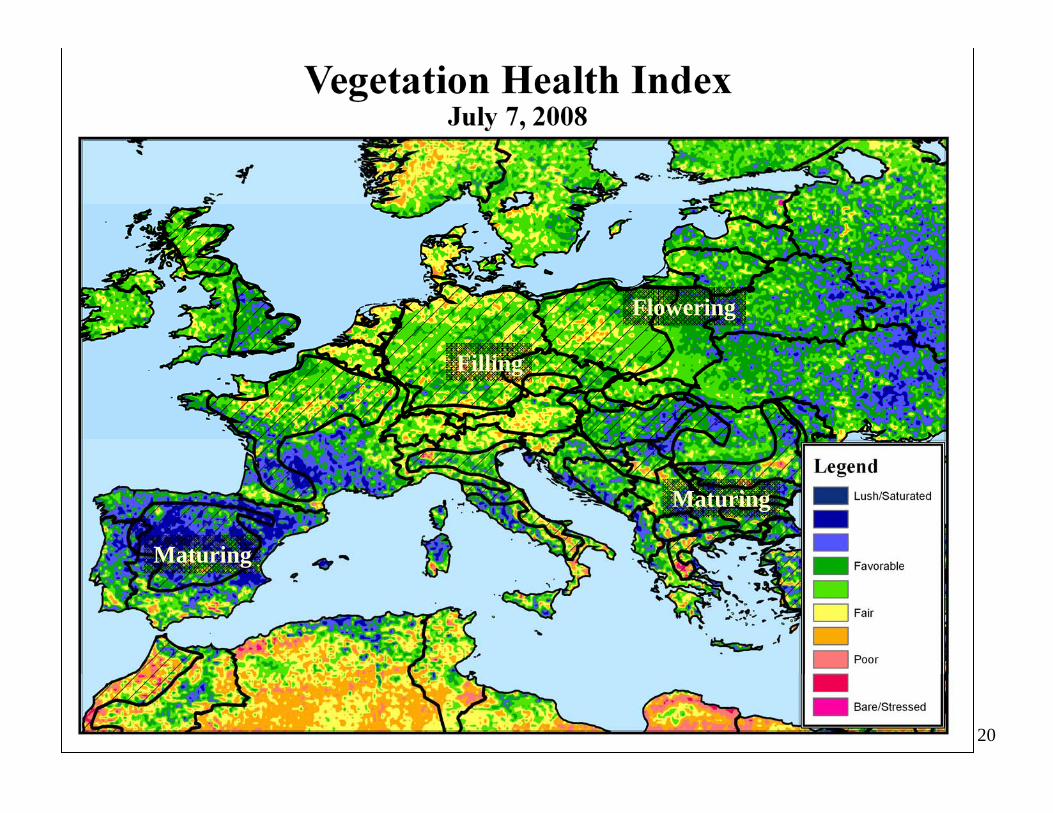
20
Filling
Maturing
Maturing
Flowering
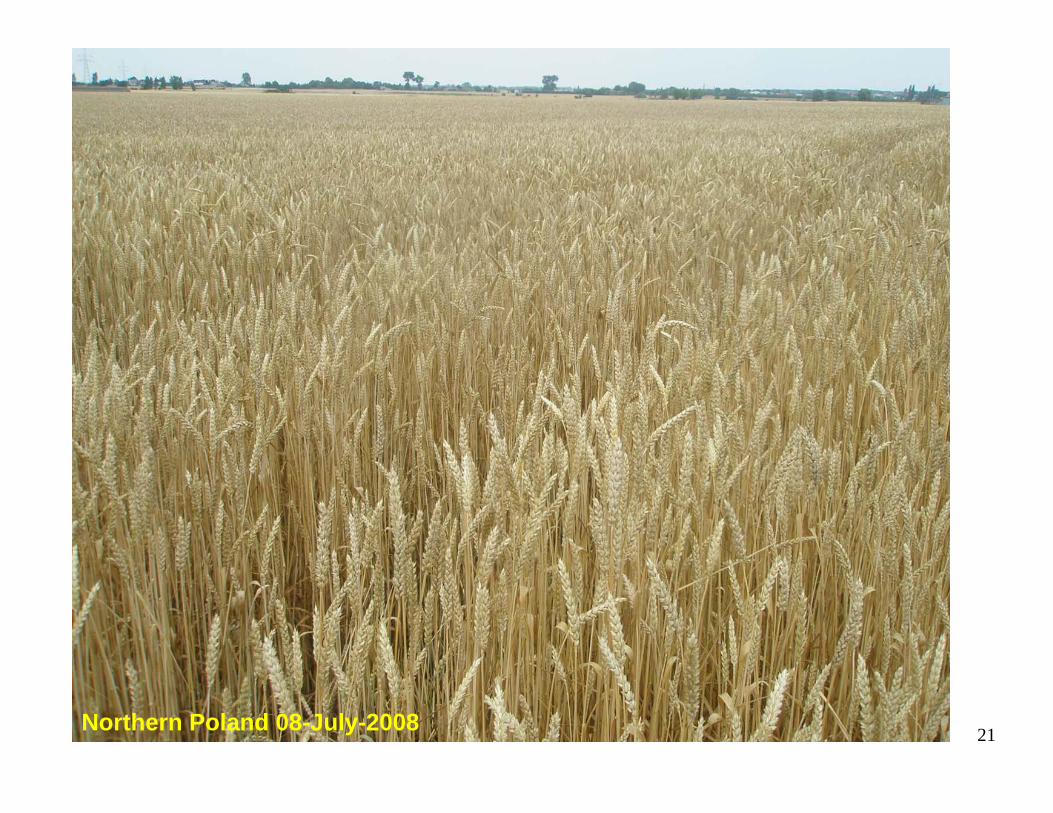
21Northern Poland 08-July-2008
22
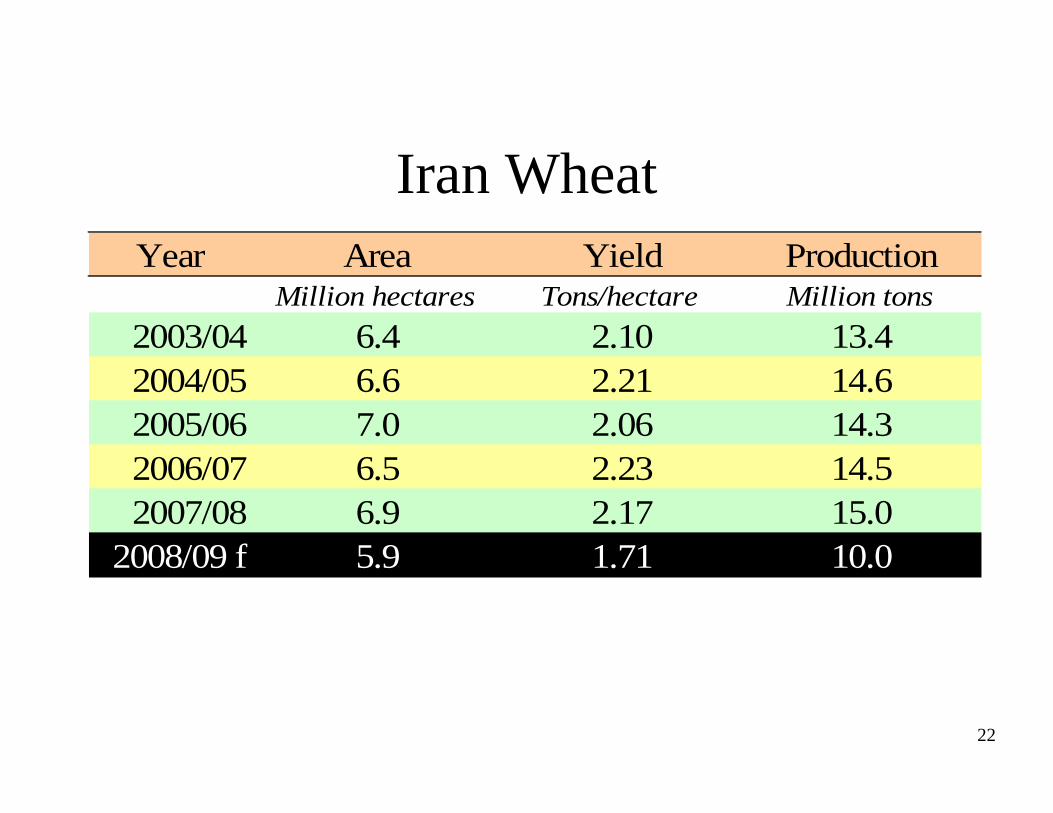
Iran WheatYear Area Yield Production
Million hectares Tons/hectare Million tons2003/04 6.4 2.10 13.42004/05 6.6 2.21 14.62005/06 7.0 2.06 14.32006/07 6.5 2.23 14.52007/08 6.9 2.17 15.0
2008/09 f 5.9 1.71 10.0
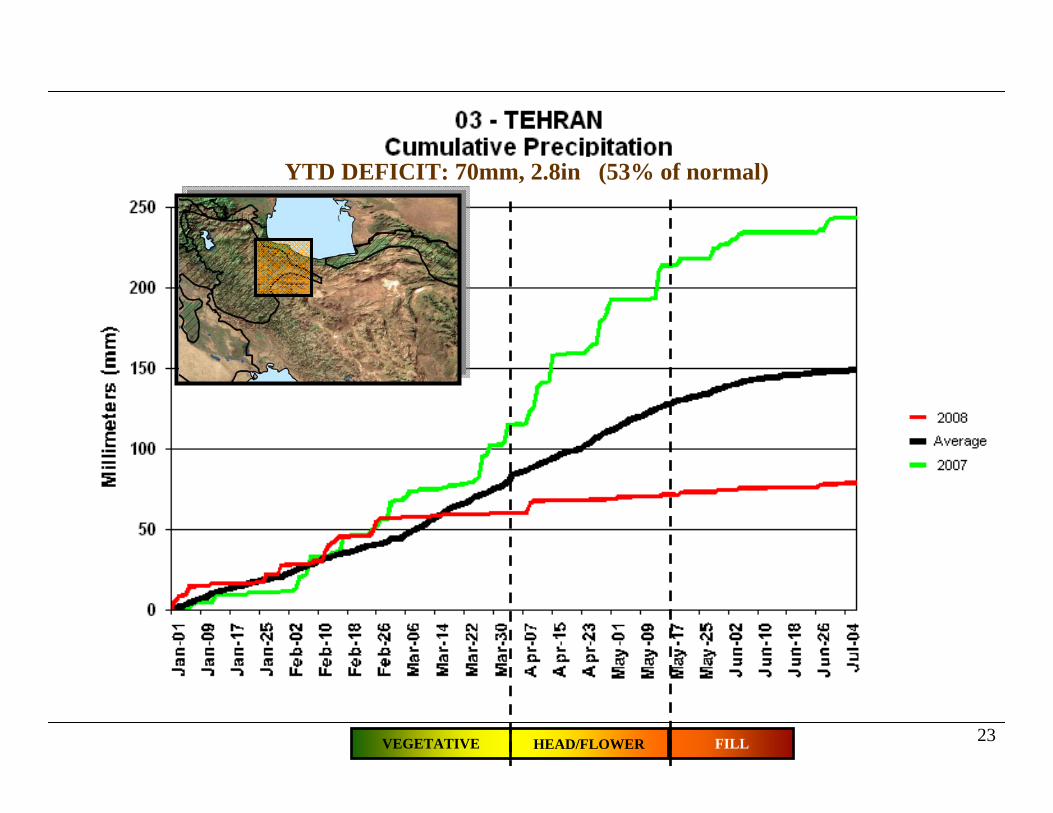
23FILLHEAD/FLOWERVEGETATIVE
YTD DEFICIT: 70mm, 2.8in (53% of normal)
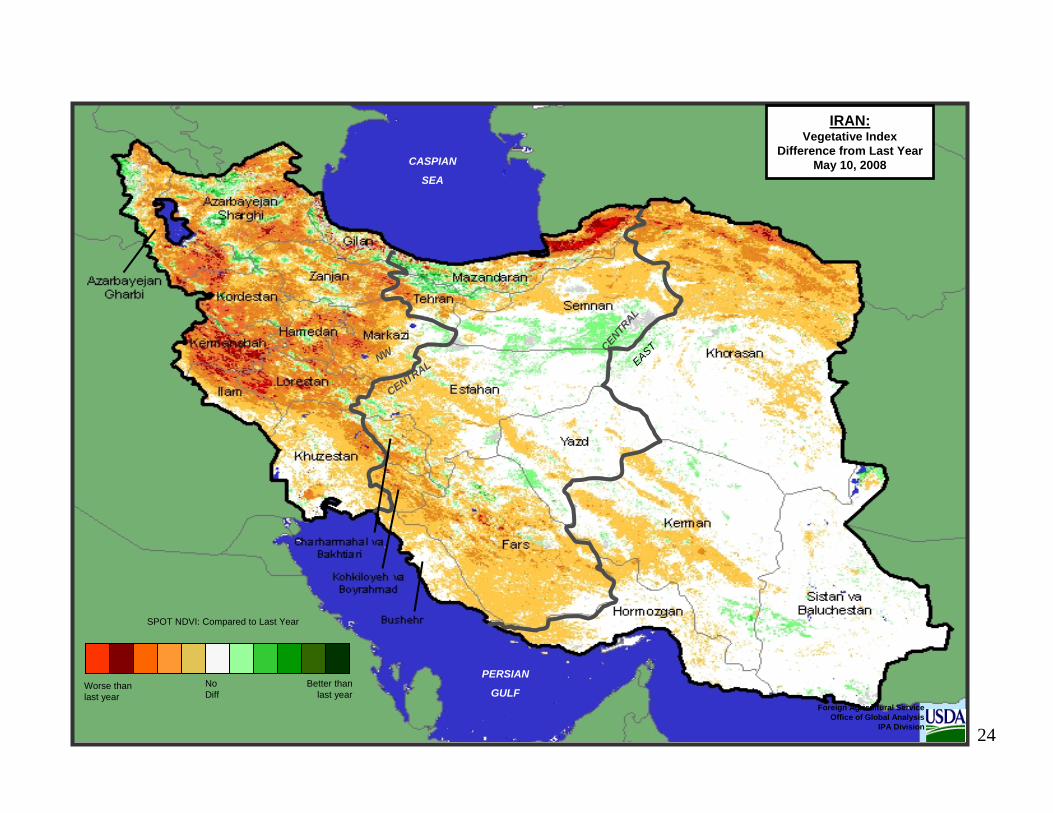
24
NW
CENTRAL
CENTRAL
EAST
CASPIAN
SEA
PERSIAN
GULF
IRAN:Vegetative Index
Difference from Last YearMay 10, 2008
SPOT NDVI: Compared to Last Year
Worse thanlast year
Better thanlast year
NoDiff
Foreign Agricultural ServiceOffice of Global Analysis
IPA Division
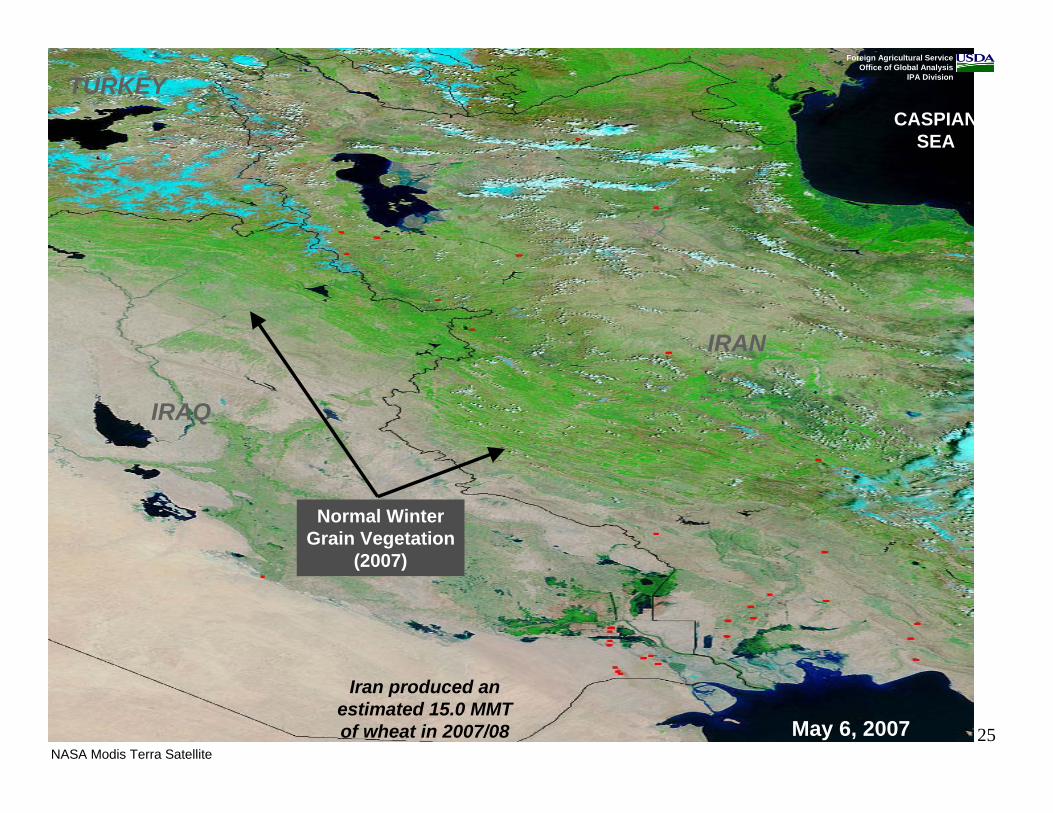
25May 6, 2007
IRAQ
IRAN
TURKEY
Normal WinterGrain Vegetation
(2007)
CASPIANSEA
Iran produced anestimated 15.0 MMTof wheat in 2007/08
NASA Modis Terra Satellite
Foreign Agricultural ServiceOffice of Global Analysis
IPA Division
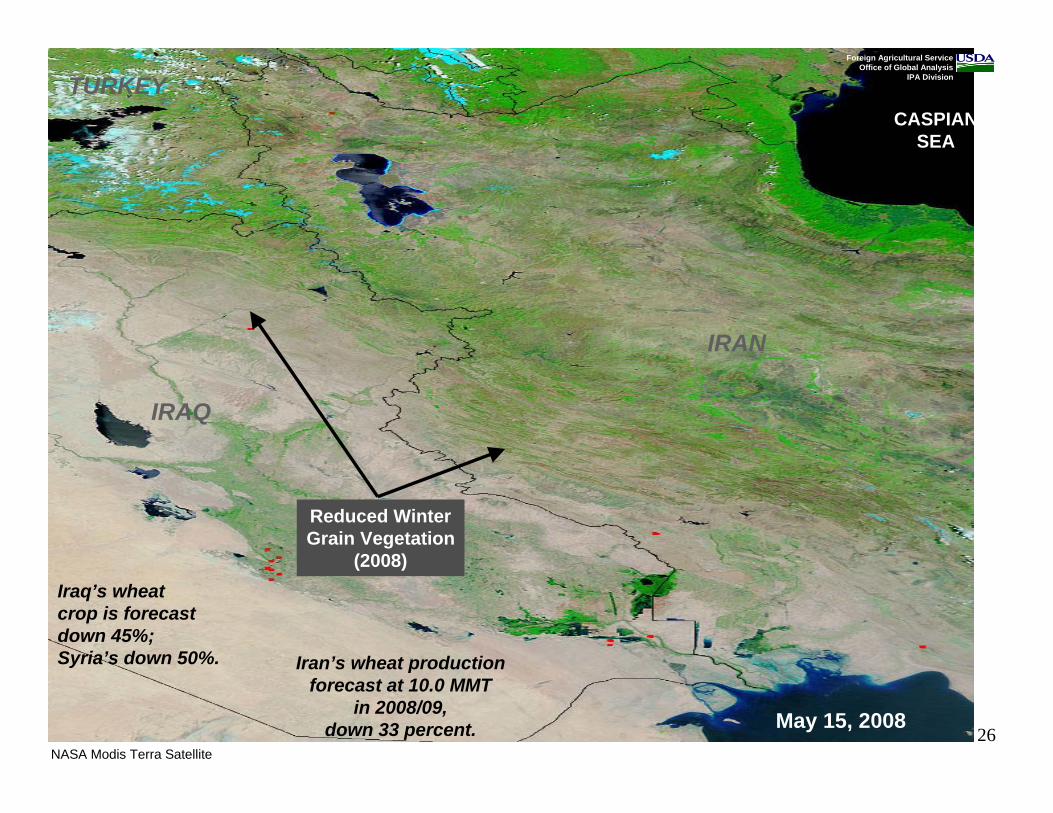
26May 15, 2008
IRAQ
IRAN
TURKEYCASPIAN
SEA
Reduced WinterGrain Vegetation
(2008)
Iran’s wheat productionforecast at 10.0 MMT
in 2008/09,down 33 percent.
Iraq’s wheat crop is forecast down 45%;Syria’s down 50%.
NASA Modis Terra Satellite
Foreign Agricultural ServiceOffice of Global Analysis
IPA Division
27
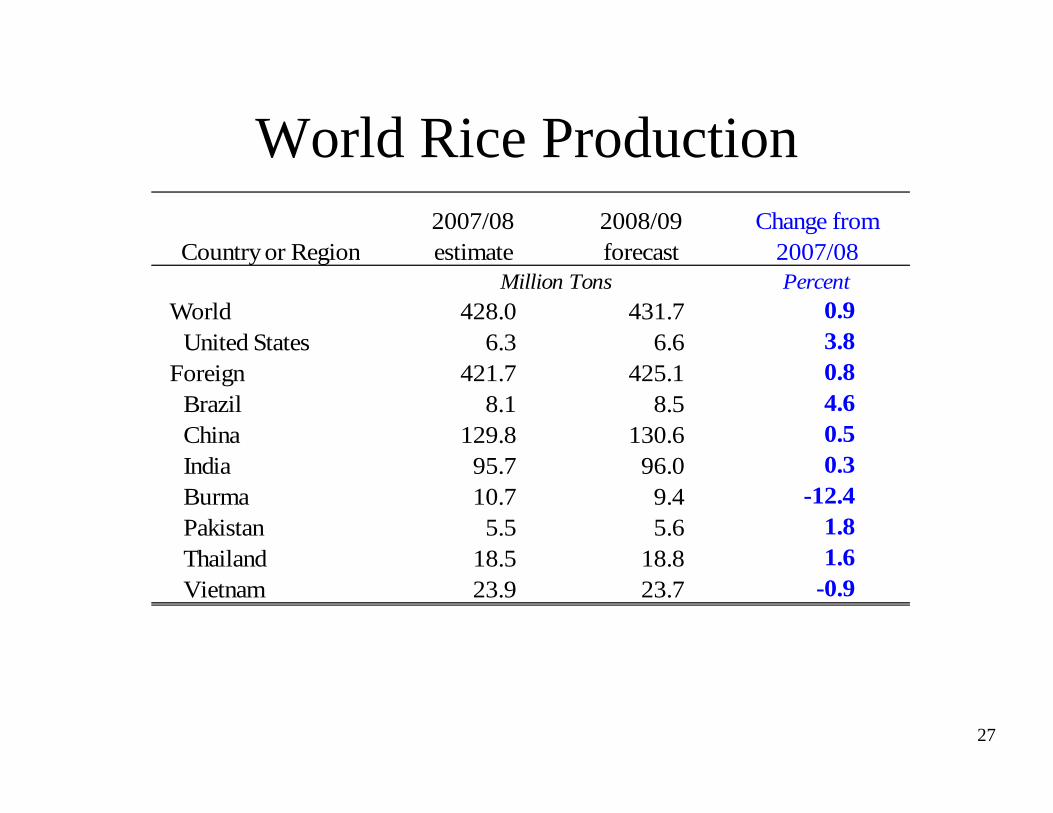
World Rice Production
Country or Region2007/08 estimate
2008/09 forecast
Change from 2007/08
Million Tons PercentWorld 428.0 431.7 0.9
United States 6.3 6.6 3.8Foreign 421.7 425.1 0.8
Brazil 8.1 8.5 4.6China 129.8 130.6 0.5India 95.7 96.0 0.3Burma 10.7 9.4 -12.4Pakistan 5.5 5.6 1.8Thailand 18.5 18.8 1.6Vietnam 23.9 23.7 -0.9
Indicates an increase in the estimate or forecast from the previous month.Indicates a decrease in the estimate or forecast from the previous month.
28
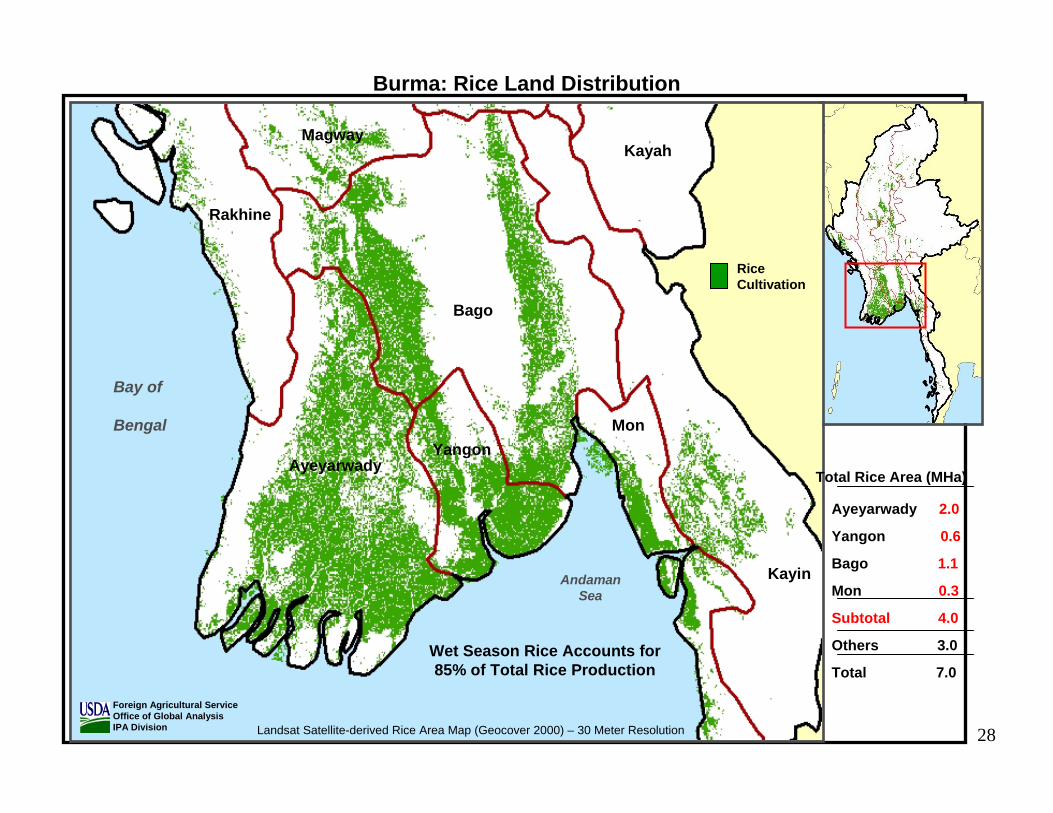
Burma: Rice Land Distribution
Landsat Satellite-derived Rice Area Map (Geocover 2000) – 30 Meter Resolution
Foreign Agricultural ServiceOffice of Global AnalysisIPA Division
Ayeyarwady 2.0
Yangon 0.6
Bago 1.1
Mon 0.3
Subtotal 4.0
Others 3.0
Total 7.0
Total Rice Area (MHa)
Wet Season Rice Accounts for85% of Total Rice Production
Bay of
Bengal
AndamanSea
Yangon
Bago
Mon
Ayeyarwady
Rakhine
Kayah
Kayin
Magway
RiceCultivation
29
30
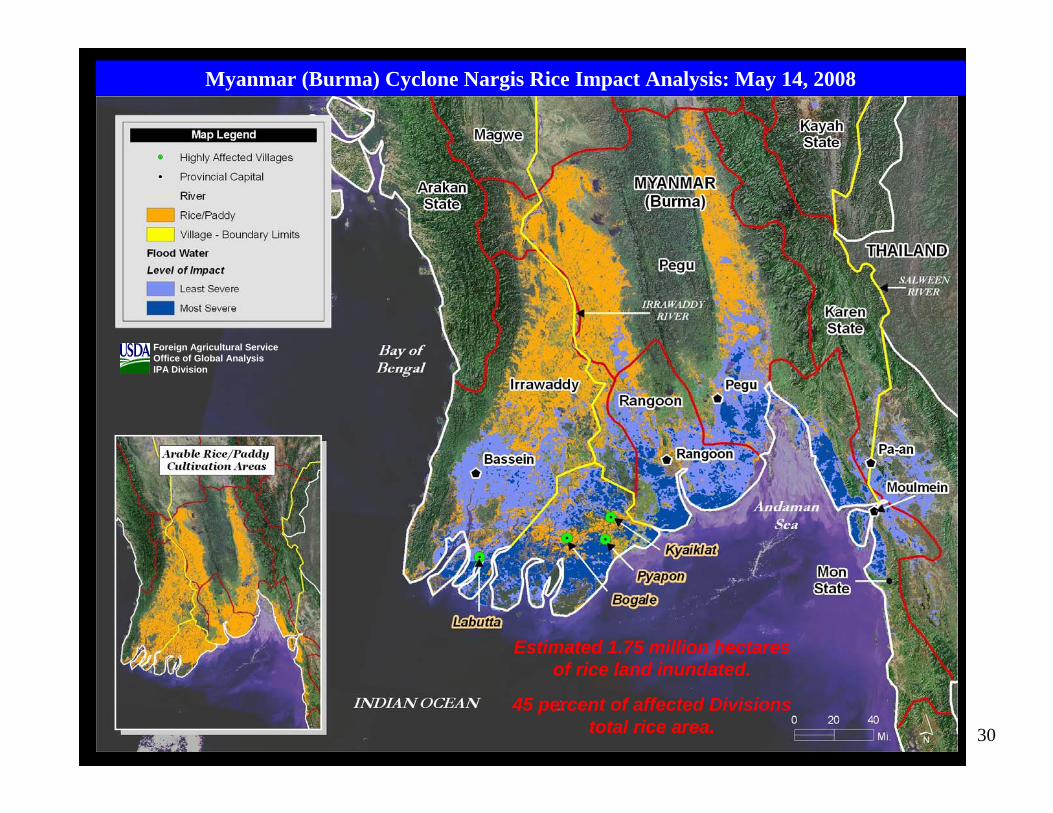
Foreign Agricultural ServiceOffice of Global AnalysisIPA Division
Estimated 1.75 million hectaresof rice land inundated.
45 percent of affected Divisionstotal rice area.
Myanmar (Burma) Cyclone Nargis Rice Impact Analysis: May 14, 2008
31
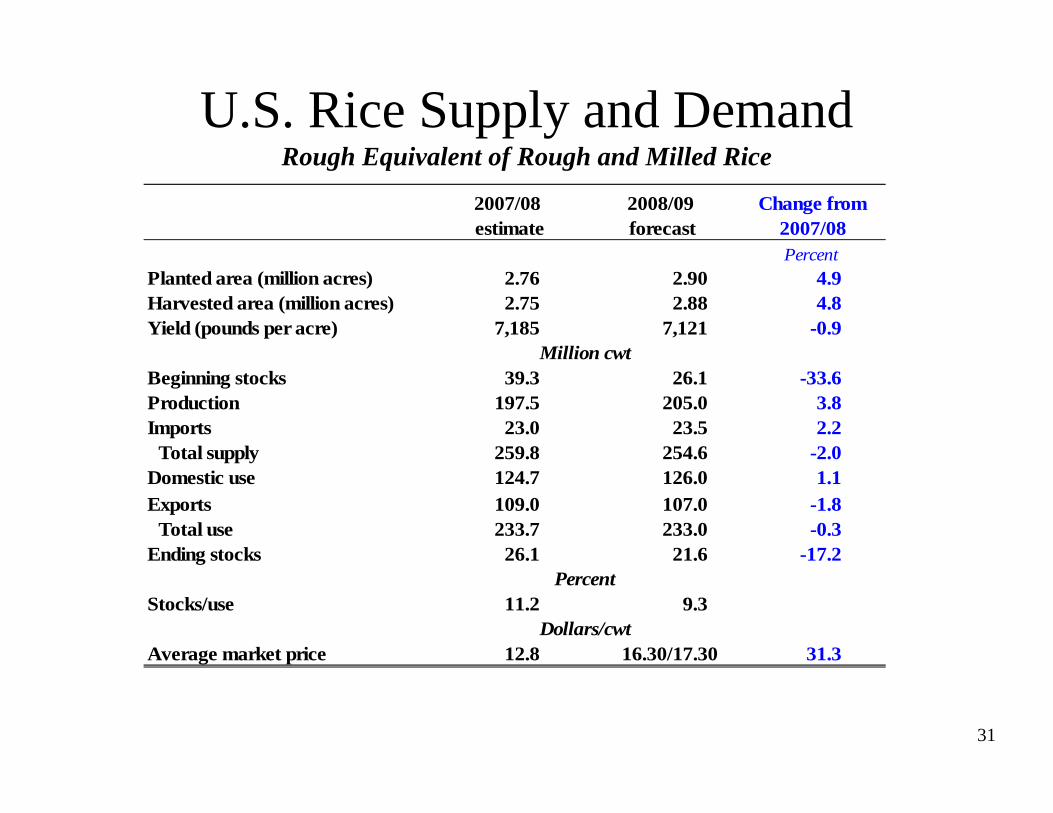
U.S. Rice Supply and DemandRough Equivalent of Rough and Milled Rice
Change from 2007/08Percent
Planted area (million acres) 2.76 2.90 4.9Harvested area (million acres) 2.75 2.88 4.8Yield (pounds per acre) 7,185 7,121 -0.9
Million cwtBeginning stocks 39.3 26.1 -33.6Production 197.5 205.0 3.8Imports 23.0 23.5 2.2
Total supply 259.8 254.6 -2.0Domestic use 124.7 126.0 1.1Exports 109.0 107.0 -1.8
Total use 233.7 233.0 -0.3Ending stocks 26.1 21.6 -17.2
PercentStocks/use 11.2 9.3
Dollars/cwtAverage market price 12.8 16.30/17.30 31.3
2007/08 estimate
2008/09 forecast
Indicates an increase in the estimate or forecast from the previous month.Indicates a decrease in the estimate or forecast from the previous month.
32
2007 Energy Act
• Mandates very ambitious renewable fuel standard (RFS), starting at 9.0 billion gals in 2008 and increasing to 36 billion gals by 2022. 1
• 15 billion gallons of the RFS will be corn-based ethanol starting in 2015.
• By 2016, all of the RFS increase must be met with cellulosic ethanol or other non-corn starch biofuels.
1 The 2005 Energy Act mandated 5.4 billion gals by 2008, rising to 7.5 billion by 2012.
33
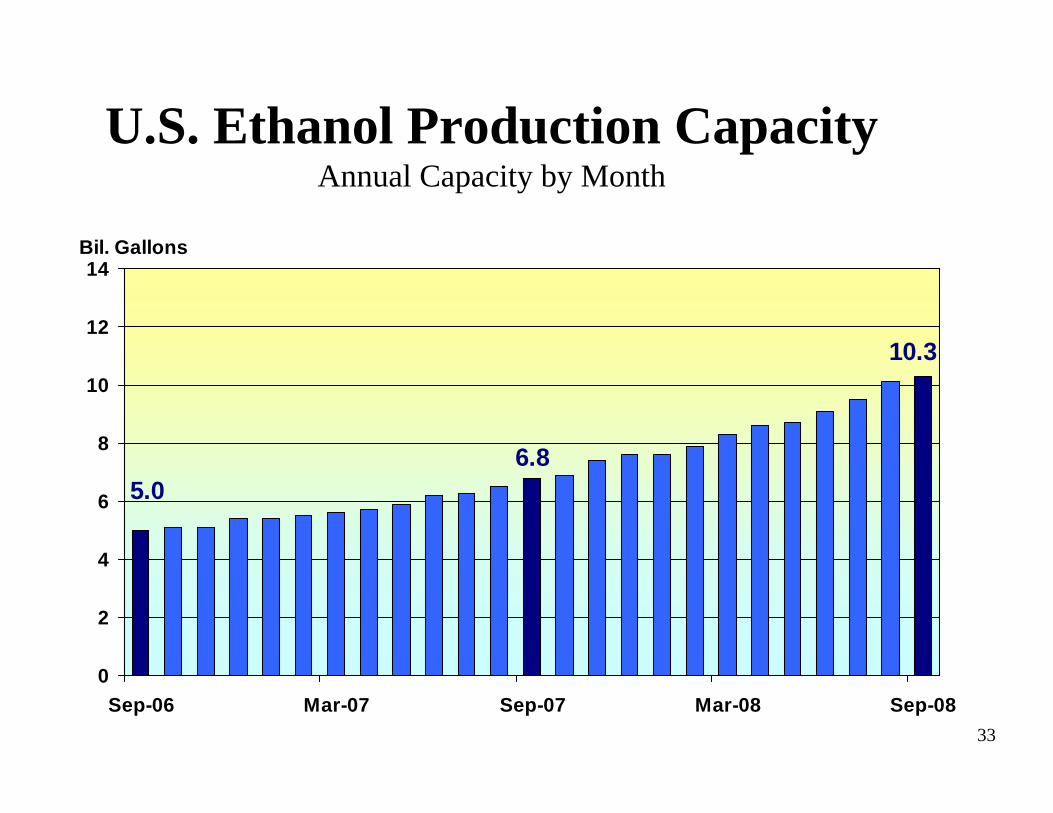
U.S. Ethanol Production CapacityAnnual Capacity by Month
6.8
10.3
5.0
0
2
4
6
8
10
12
14
Sep-06 Mar-07 Sep-07 Mar-08 Sep-08
Bil. Gallons
34
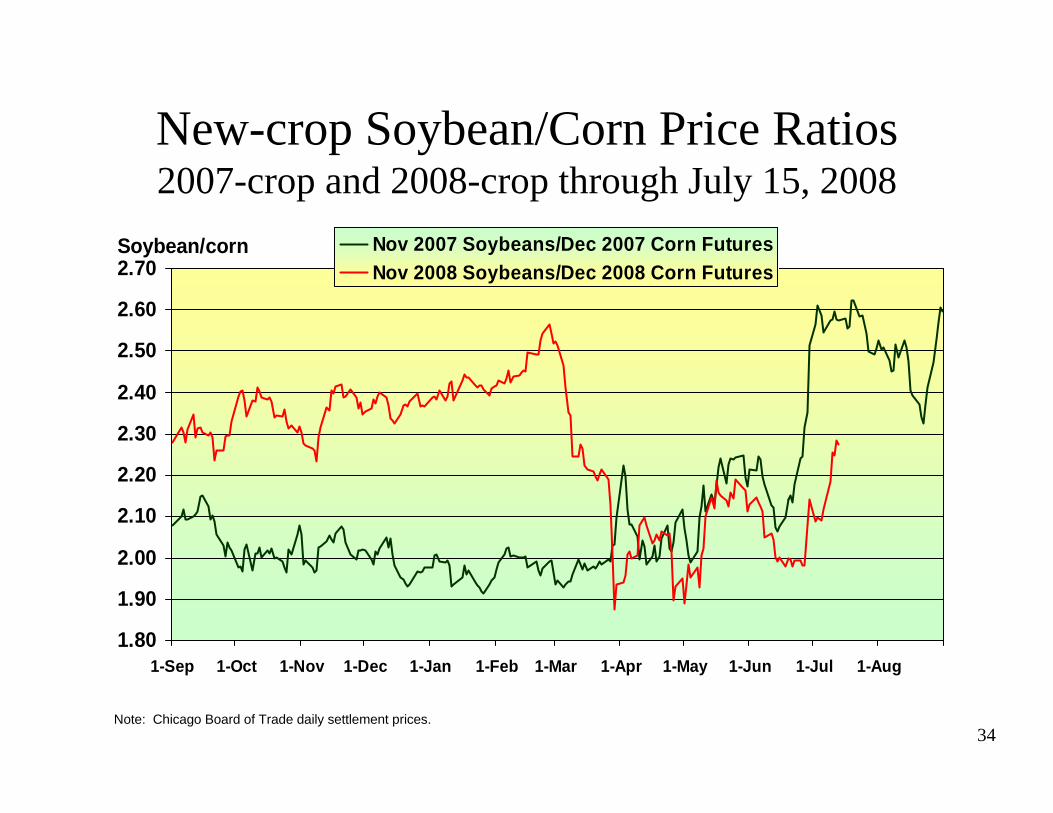
New-crop Soybean/Corn Price Ratios2007-crop and 2008-crop through July 15, 2008
1.80
1.90
2.00
2.10
2.20
2.30
2.40
2.50
2.60
2.70
1-Sep 1-Oct 1-Nov 1-Dec 1-Jan 1-Feb 1-Mar 1-Apr 1-May 1-Jun 1-Jul 1-Aug
Soybean/corn Nov 2007 Soybeans/Dec 2007 Corn FuturesNov 2008 Soybeans/Dec 2008 Corn Futures
Note: Chicago Board of Trade daily settlement prices.
35
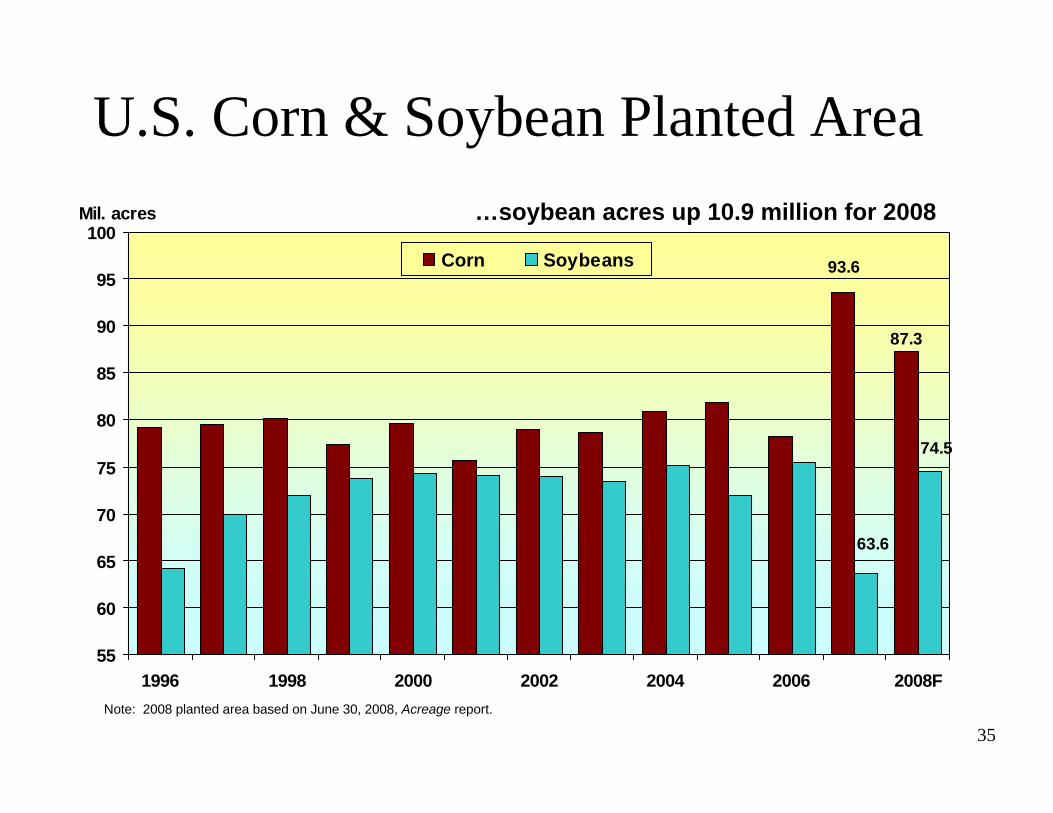
87.3
93.6
74.5
63.6
55
60
65
70
75
80
85
90
95
100
1996 1998 2000 2002 2004 2006 2008F
Mil. acres
Corn Soybeans
Note: 2008 planted area based on June 30, 2008, Acreage report.
U.S. Corn & Soybean Planted Area…soybean acres up 10.9 million for 2008
36
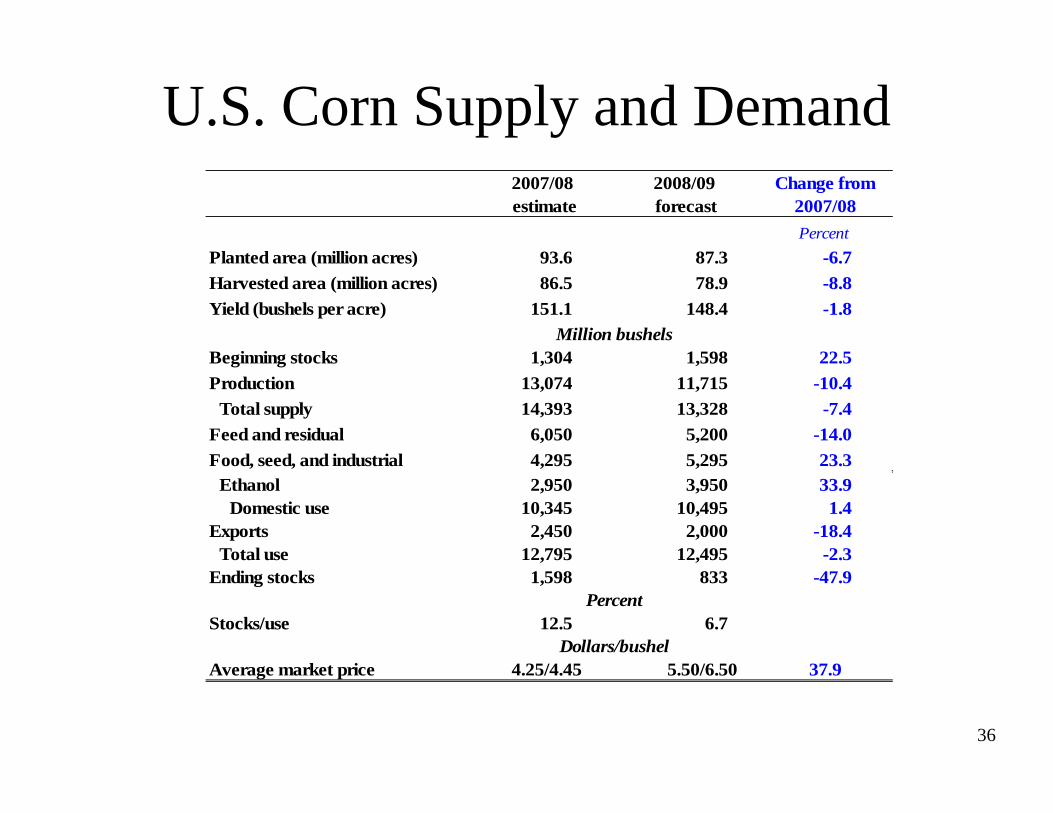
U.S. Corn Supply and DemandChange from
2007/08Percent
Planted area (million acres) 93.6 87.3 -6.7Harvested area (million acres) 86.5 78.9 -8.8Yield (bushels per acre) 151.1 148.4 -1.8
Million bushelsBeginning stocks 1,304 1,598 22.5Production 13,074 11,715 -10.4
Total supply 14,393 13,328 -7.4Feed and residual 6,050 5,200 -14.0Food, seed, and industrial 4,295 5,295 23.3
Ethanol 2,950 3,950 33.9Domestic use 10,345 10,495 1.4
Exports 2,450 2,000 -18.4Total use 12,795 12,495 -2.3
Ending stocks 1,598 833 -47.9Percent
Stocks/use 12.5 6.7Dollars/bushel
Average market price 4.25/4.45 5.50/6.50 37.9
2007/08 estimate
2008/09 forecast
Indicates an increase in the estimate or forecast from the previous month.Indicates a decrease in the estimate or forecast from the previous month.
37
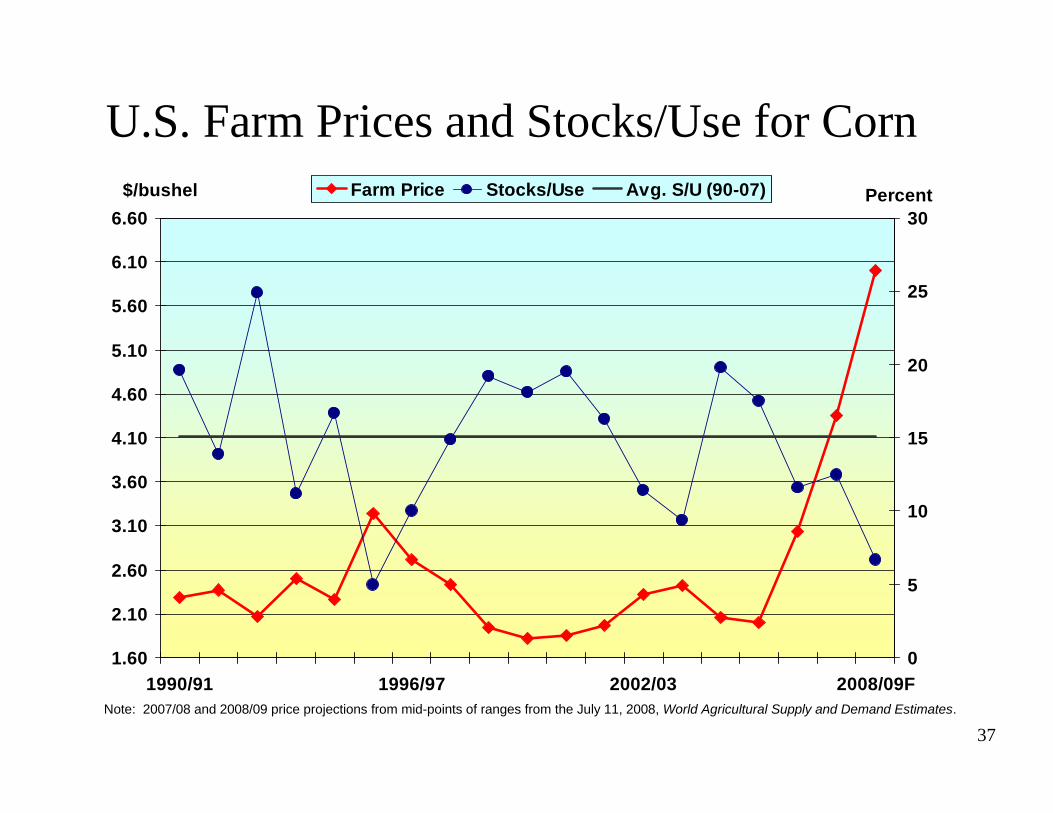
1.60
2.10
2.60
3.10
3.60
4.10
4.60
5.10
5.60
6.10
6.60
1990/91 1996/97 2002/03 2008/09F
$/bushel
0
5
10
15
20
25
30PercentFarm Price Stocks/Use Avg. S/U (90-07)
U.S. Farm Prices and Stocks/Use for Corn
Note: 2007/08 and 2008/09 price projections from mid-points of ranges from the July 11, 2008, World Agricultural Supply and Demand Estimates.
38
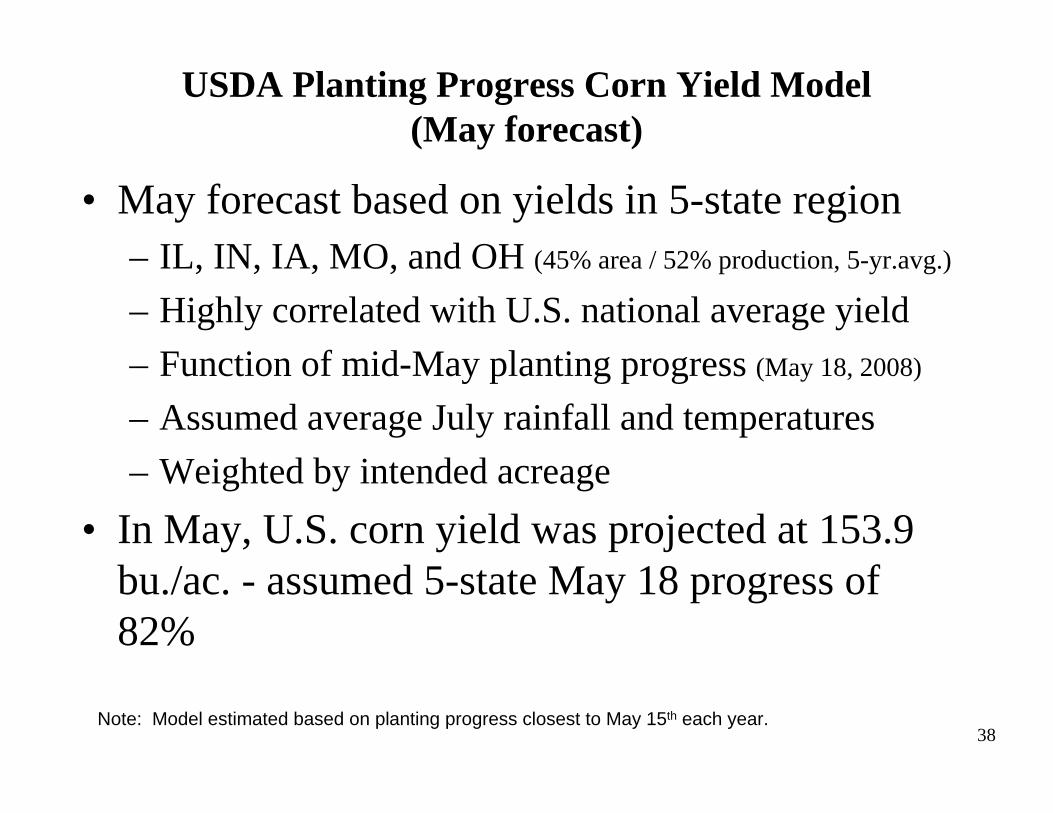
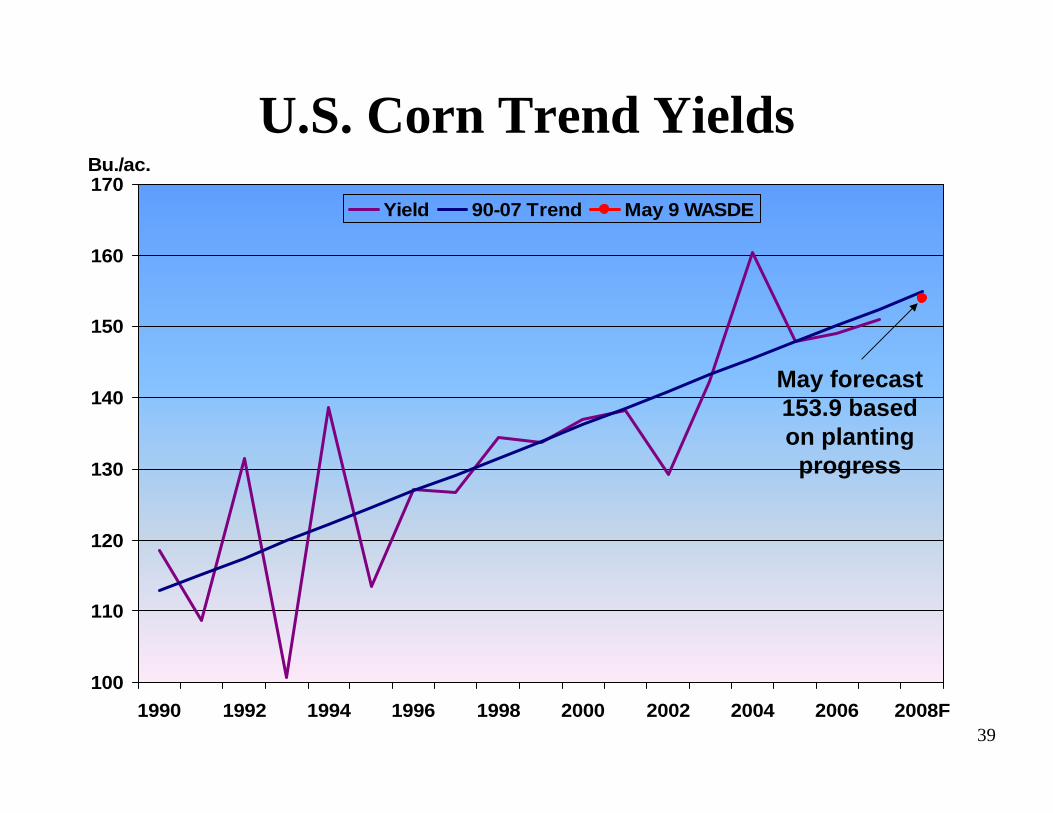
USDA Planting Progress Corn Yield Model(May forecast)
• May forecast based on yields in 5-state region– IL, IN, IA, MO, and OH (45% area / 52% production, 5-yr.avg.)
– Highly correlated with U.S. national average yield– Function of mid-May planting progress (May 18, 2008)
– Assumed average July rainfall and temperatures– Weighted by intended acreage
• In May, U.S. corn yield was projected at 153.9 bu./ac. - assumed 5-state May 18 progress of 82%
Note: Model estimated based on planting progress closest to May 15th each year.
39
U.S. Corn Trend Yields
100
110
120
130
140
150
160
170
1990 1992 1994 1996 1998 2000 2002 2004 2006 2008F
Bu./ac.
Yield 90-07 Trend May 9 WASDE
May forecast 153.9 based on planting progress
40
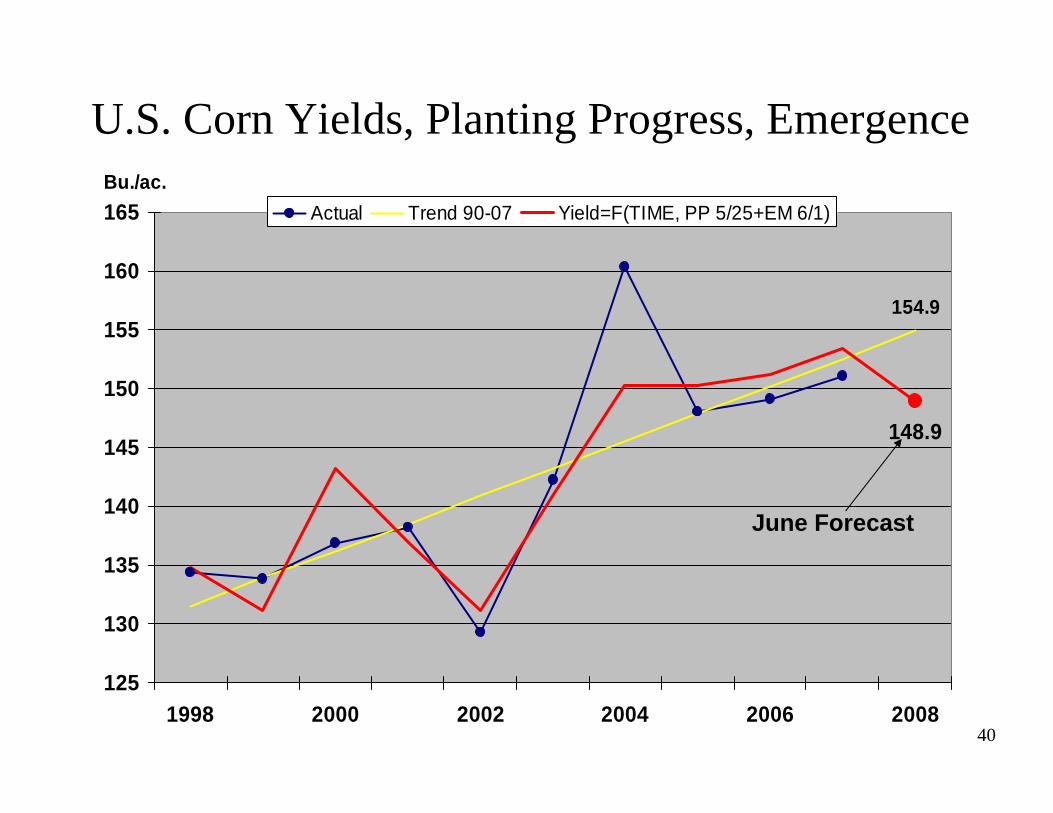
U.S. Corn Yields, Planting Progress, Emergence
154.9
148.9
125
130
135
140
145
150
155
160
165
1998 2000 2002 2004 2006 2008
Bu./ac.Actual Trend 90-07 Yield=F(TIME, PP 5/25+EM 6/1)
June Forecast
41
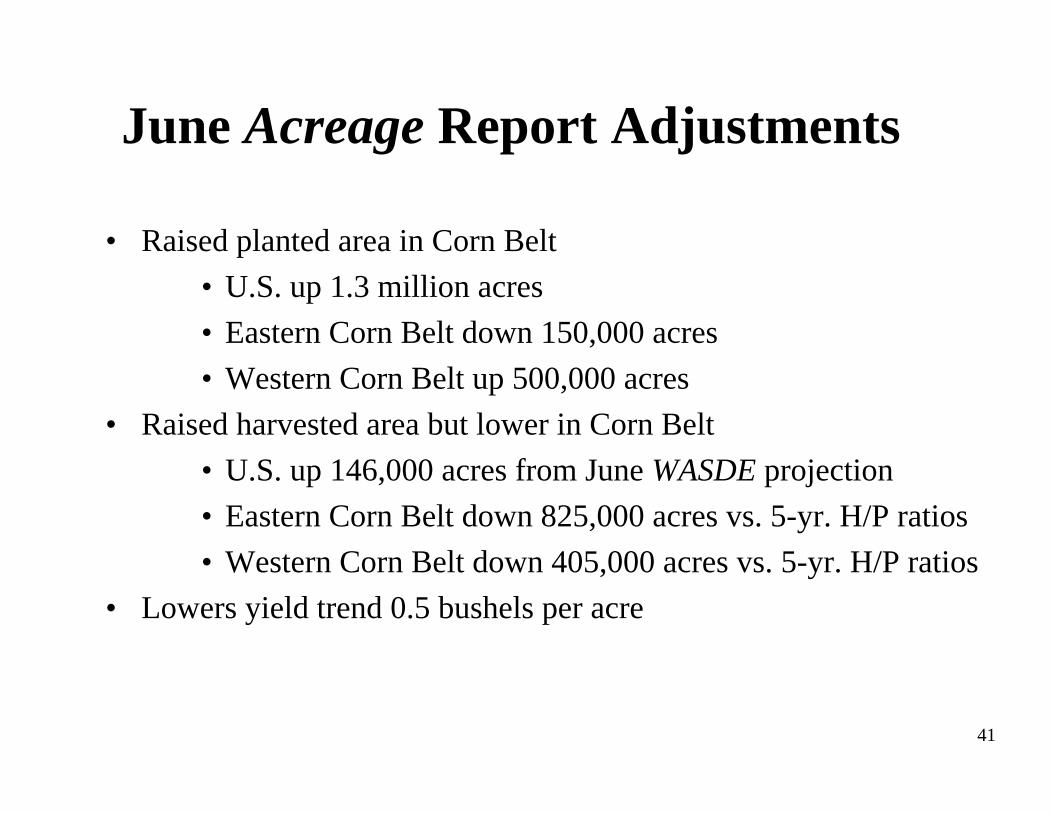
June Acreage Report Adjustments
• Raised planted area in Corn Belt• U.S. up 1.3 million acres• Eastern Corn Belt down 150,000 acres• Western Corn Belt up 500,000 acres
• Raised harvested area but lower in Corn Belt• U.S. up 146,000 acres from June WASDE projection• Eastern Corn Belt down 825,000 acres vs. 5-yr. H/P ratios• Western Corn Belt down 405,000 acres vs. 5-yr. H/P ratios
• Lowers yield trend 0.5 bushels per acre
42
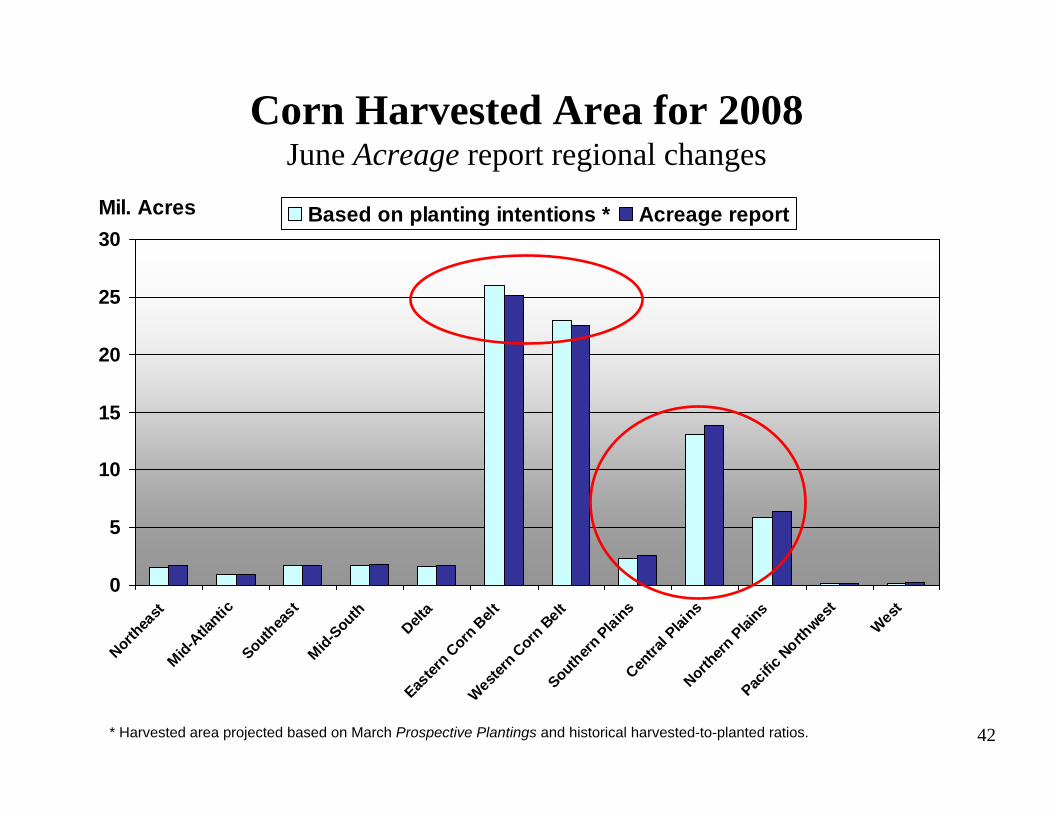
Corn Harvested Area for 2008June Acreage report regional changes
0
5
10
15
20
25
30
Northea
stMid-A
tlantic
Southea
stMid-S
outh
Delta
Easter
n Corn
Belt
Western
Corn
Belt
Southern
PlainsCen
tral P
lains
Northern
Plai
nsPac
ific N
orthwest
West
Mil. Acres Based on planting intentions * Acreage report
* Harvested area projected based on March Prospective Plantings and historical harvested-to-planted ratios.
43
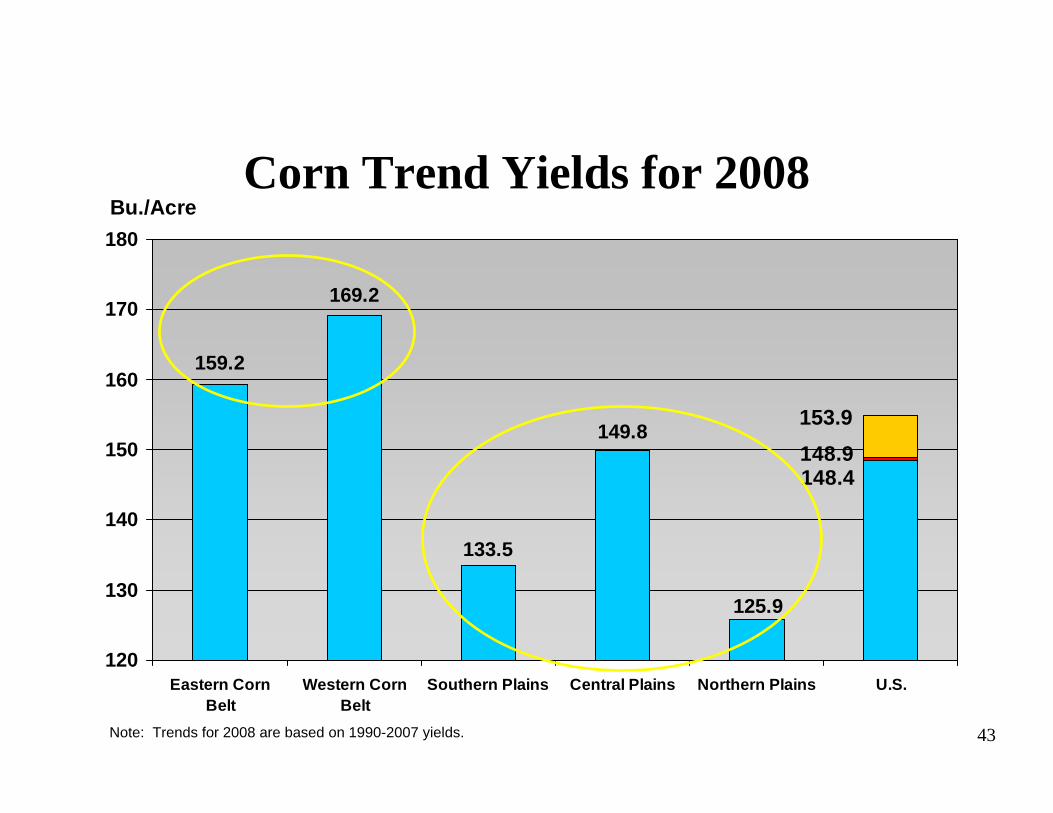
148.4
159.2
169.2
133.5
149.8
125.9
148.9
120
130
140
150
160
170
180
Eastern CornBelt
Western CornBelt
Southern Plains Central Plains Northern Plains U.S.
Bu./AcreCorn Trend Yields for 2008
153.9
Note: Trends for 2008 are based on 1990-2007 yields.
44
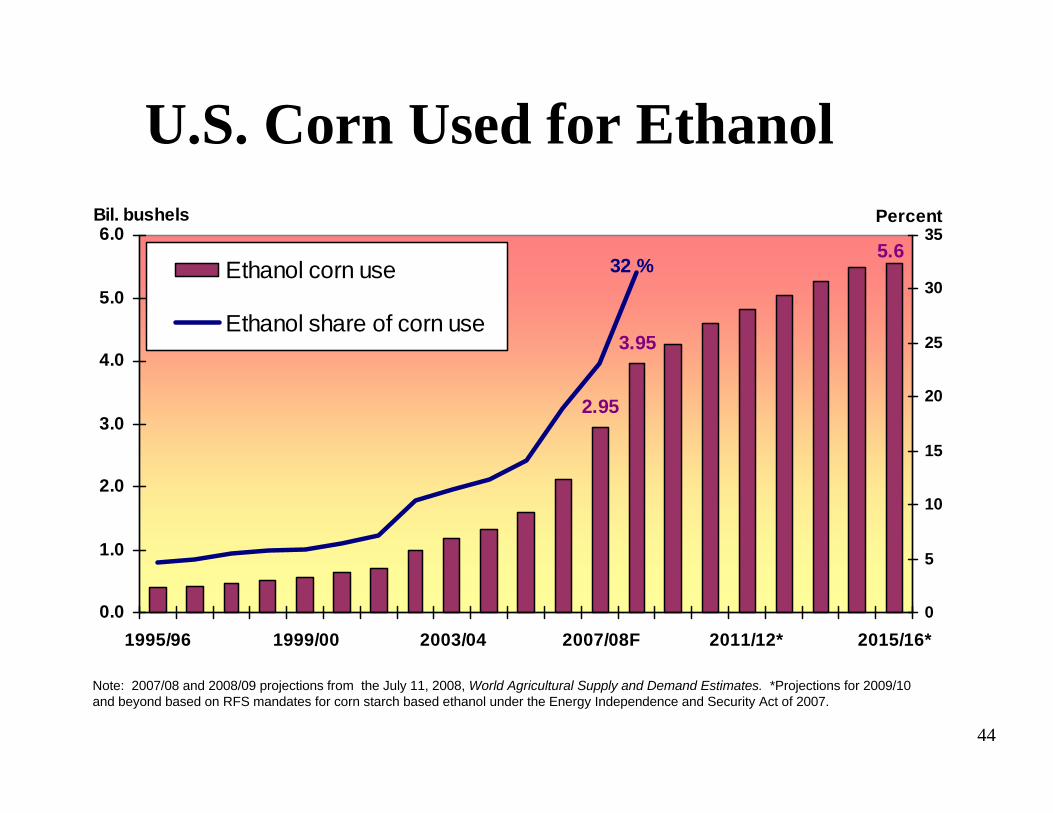
3.95
2.95
5.632 %
0.0
1.0
2.0
3.0
4.0
5.0
6.0
1995/96 1999/00 2003/04 2007/08F 2011/12* 2015/16*
Bil. bushels
0
5
10
15
20
25
30
35Percent
Ethanol corn use
Ethanol share of corn use
Note: 2007/08 and 2008/09 projections from the July 11, 2008, World Agricultural Supply and Demand Estimates. *Projections for 2009/10 and beyond based on RFS mandates for corn starch based ethanol under the Energy Independence and Security Act of 2007.
U.S. Corn Used for Ethanol
45
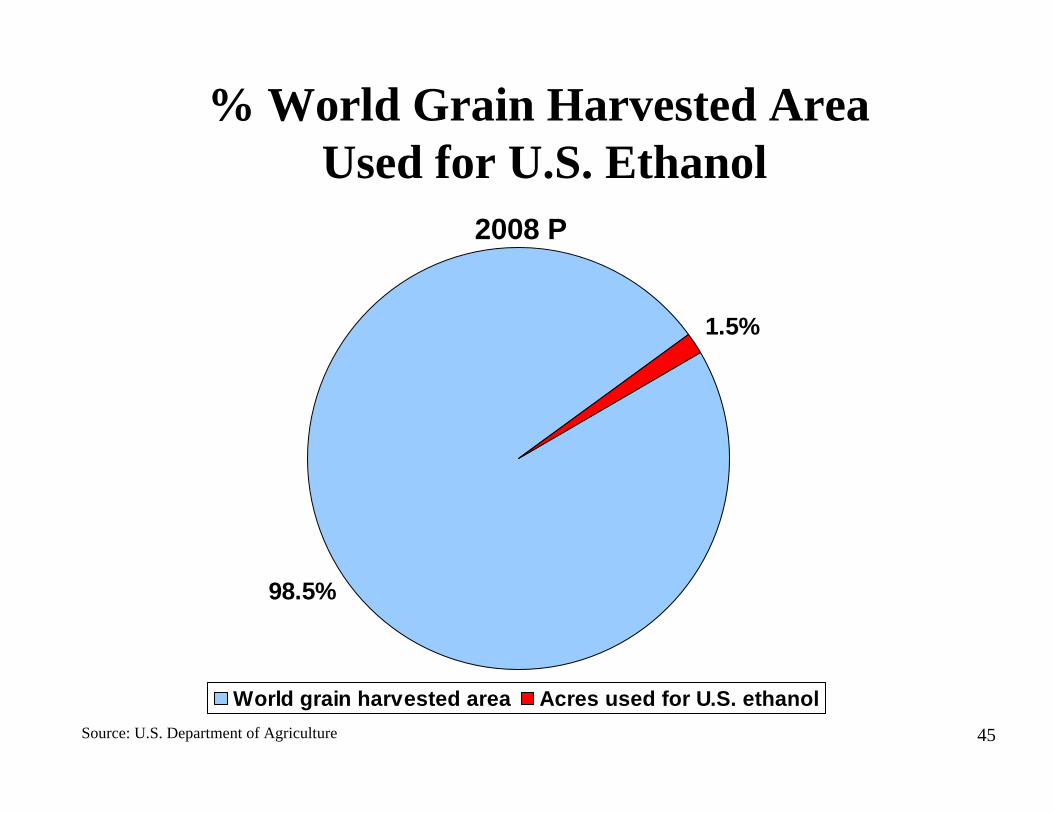
% World Grain Harvested AreaUsed for U.S. Ethanol
2008 P
98.5%
1.5%
World grain harvested area Acres used for U.S. ethanolSource: U.S. Department of Agriculture
46
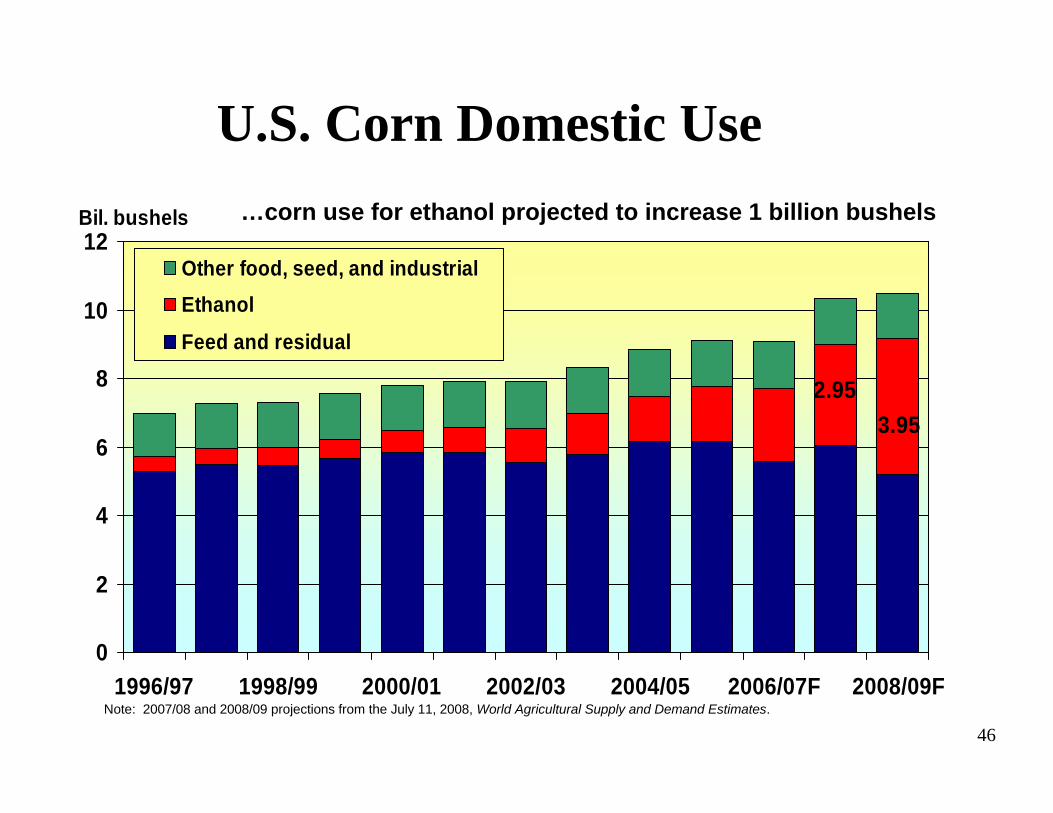
2.953.95
0
2
4
6
8
10
12
1996/97 1998/99 2000/01 2002/03 2004/05 2006/07F 2008/09F
Bil. bushels
Other food, seed, and industrialEthanol
Feed and residual
U.S. Corn Domestic Use
Note: 2007/08 and 2008/09 projections from the July 11, 2008, World Agricultural Supply and Demand Estimates.
…corn use for ethanol projected to increase 1 billion bushels
47
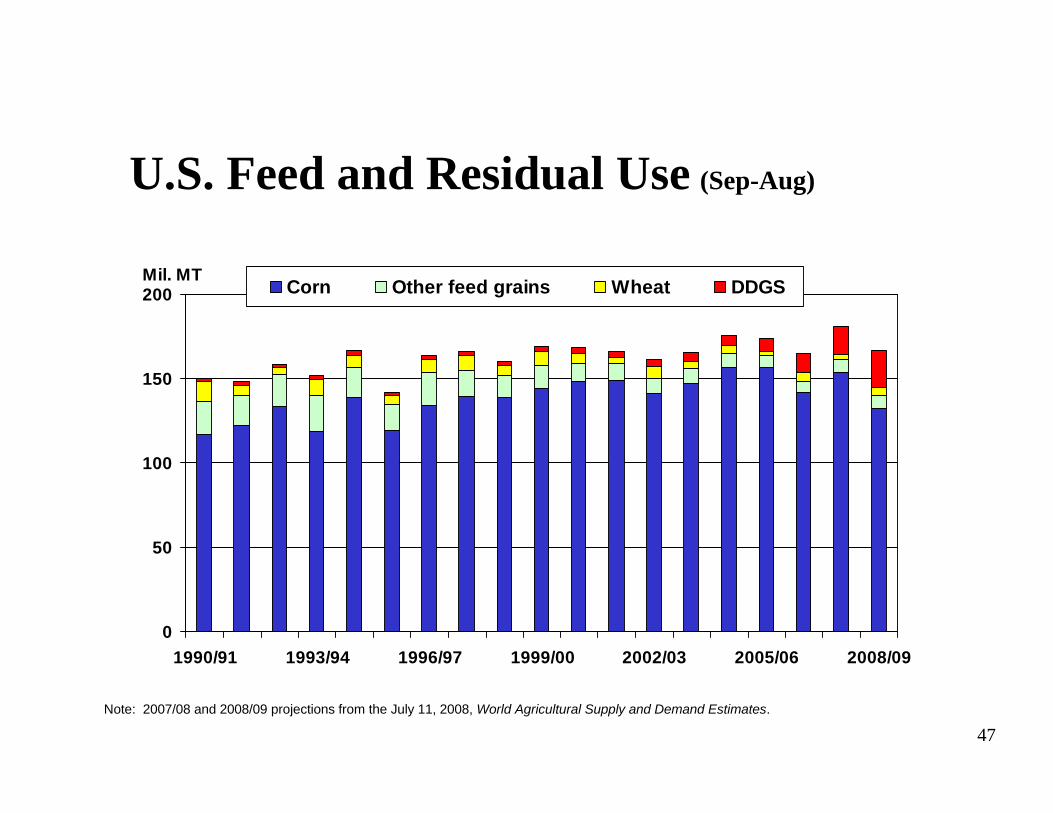
U.S. Feed and Residual Use (Sep-Aug)
0
50
100
150
200
1990/91 1993/94 1996/97 1999/00 2002/03 2005/06 2008/09
Mil. MT Corn Other feed grains Wheat DDGS
Note: 2007/08 and 2008/09 projections from the July 11, 2008, World Agricultural Supply and Demand Estimates.
48
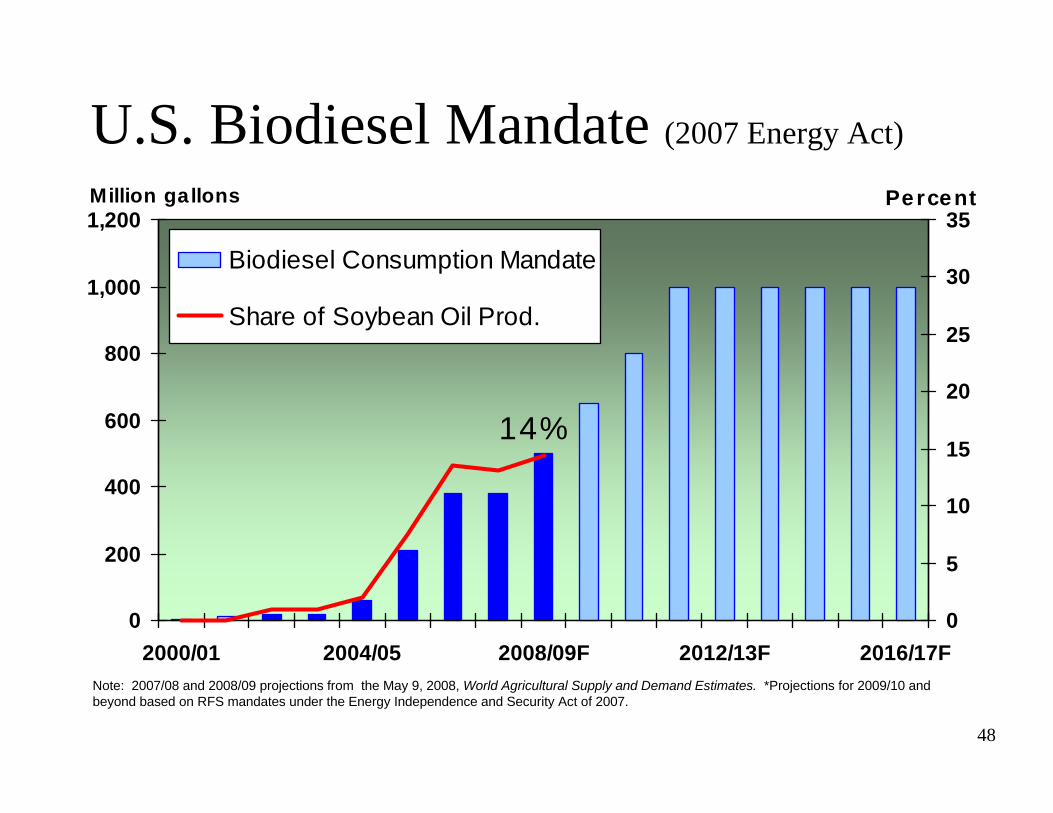
U.S. Biodiesel Mandate (2007 Energy Act)
0
200
400
600
800
1,000
1,200
2000/01 2004/05 2008/09F 2012/13F 2016/17F0
5
10
15
20
25
30
35
Biodiesel Consumption Mandate
Share of Soybean Oil Prod.
Million gallons Percent
14%
Note: 2007/08 and 2008/09 projections from the May 9, 2008, World Agricultural Supply and Demand Estimates. *Projections for 2009/10 and beyond based on RFS mandates under the Energy Independence and Security Act of 2007.
49
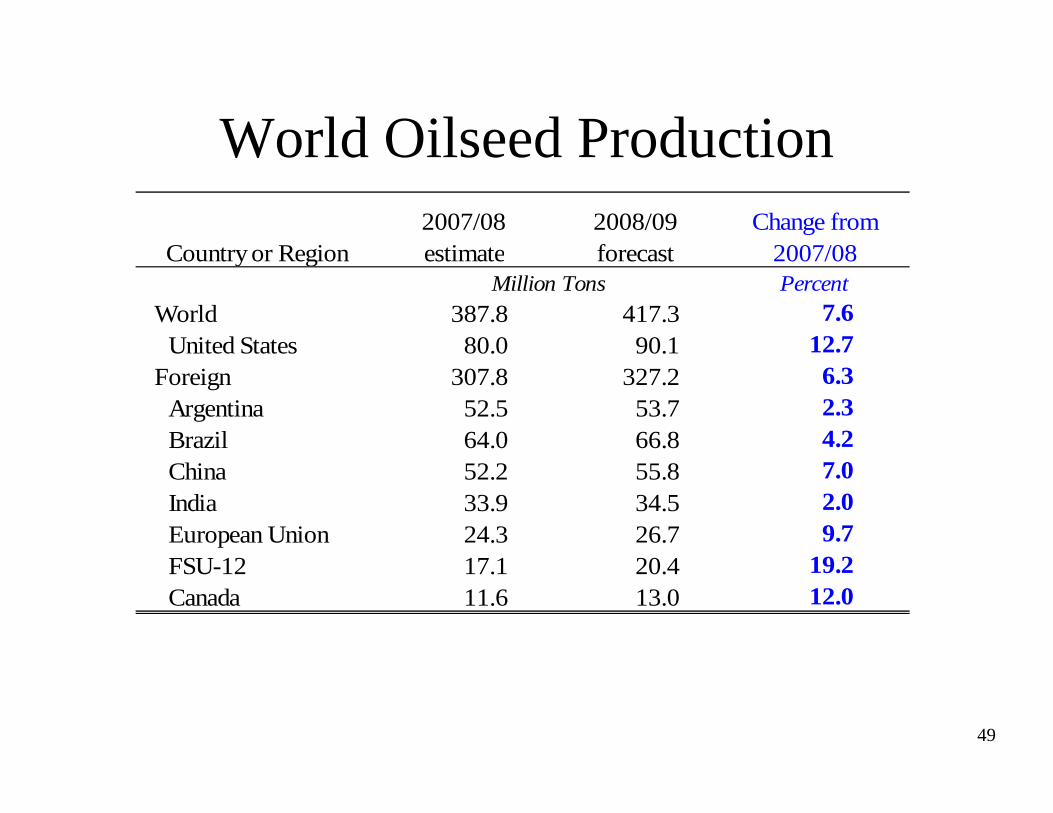
World Oilseed Production
Country or Region2007/08 estimate
2008/09 forecast
Change from 2007/08
Million Tons PercentWorld 387.8 417.3 7.6
United States 80.0 90.1 12.7Foreign 307.8 327.2 6.3
Argentina 52.5 53.7 2.3Brazil 64.0 66.8 4.2China 52.2 55.8 7.0India 33.9 34.5 2.0European Union 24.3 26.7 9.7FSU-12 17.1 20.4 19.2Canada 11.6 13.0 12.0
Indicates an increase in the estimate or forecast from the previous month.Indicates a decrease in the estimate or forecast from the previous month.
50
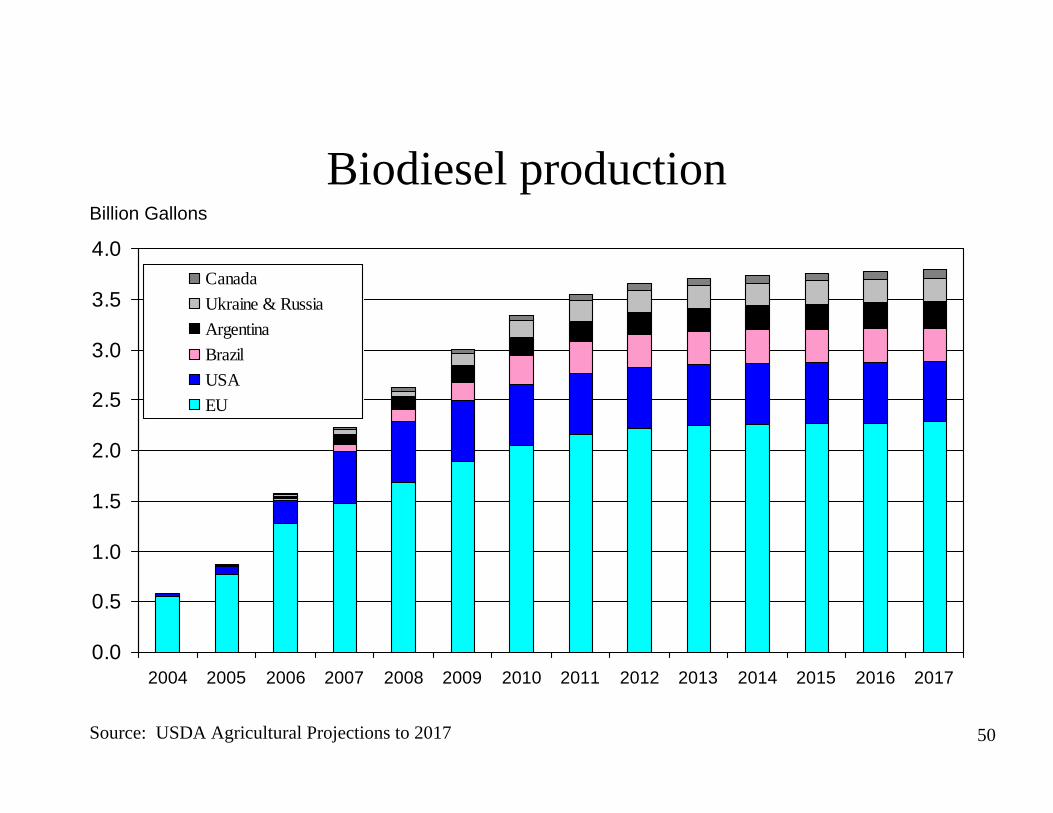
Biodiesel production
0.0
0.5
1.0
1.5
2.0
2.5
3.0
3.5
4.0
2004 2005 2006 2007 2008 2009 2010 2011 2012 2013 2014 2015 2016 2017
CanadaUkraine & RussiaArgentinaBrazilUSAEU
Billion Gallons
Source: USDA Agricultural Projections to 2017
51
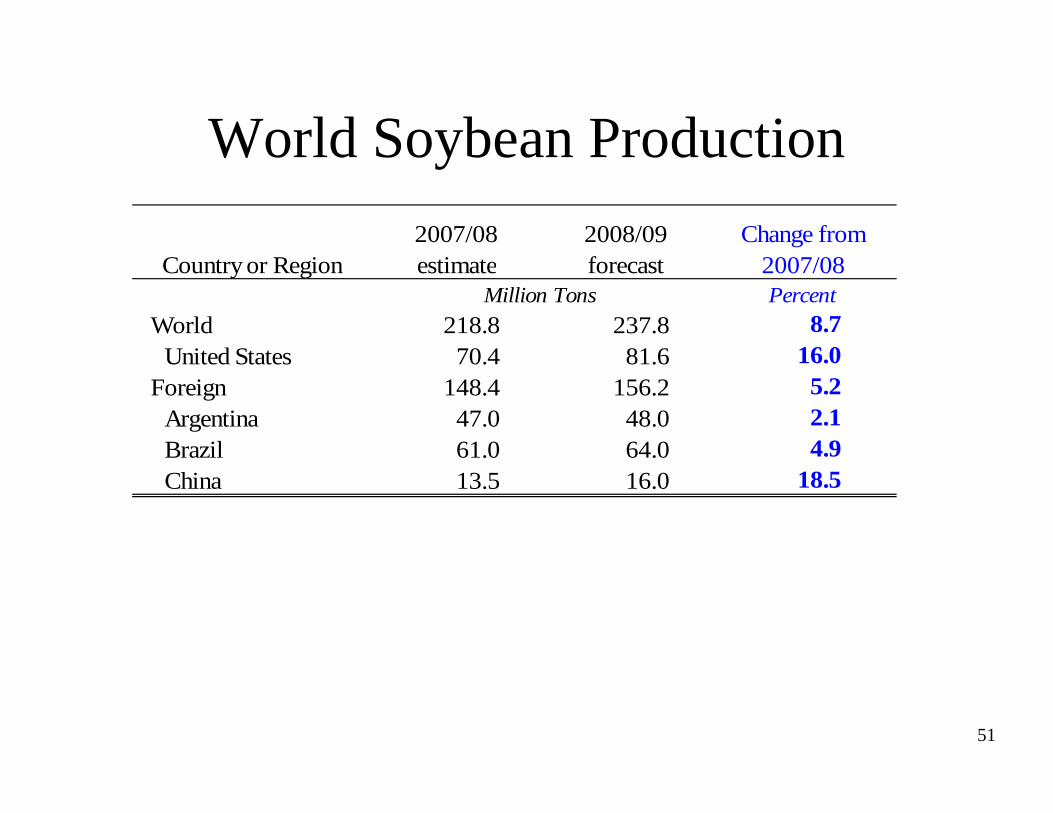
World Soybean Production
Country or Region2007/08 estimate
2008/09 forecast
Change from 2007/08
Million Tons PercentWorld 218.8 237.8 8.7
United States 70.4 81.6 16.0Foreign 148.4 156.2 5.2
Argentina 47.0 48.0 2.1Brazil 61.0 64.0 4.9China 13.5 16.0 18.5
Indicates an increase in the estimate or forecast from the previous month.Indicates a decrease in the estimate or forecast from the previous month.
52
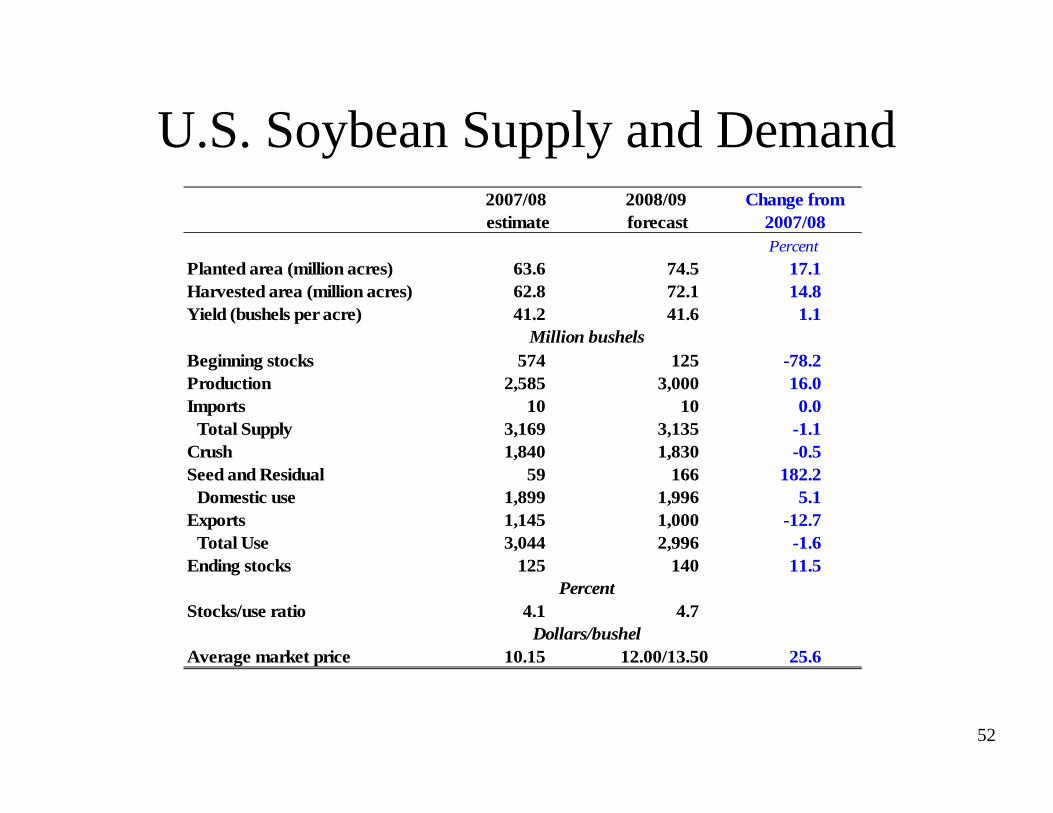
U.S. Soybean Supply and DemandChange from
2007/08Percent
Planted area (million acres) 63.6 74.5 17.1Harvested area (million acres) 62.8 72.1 14.8Yield (bushels per acre) 41.2 41.6 1.1
Million bushelsBeginning stocks 574 125 -78.2Production 2,585 3,000 16.0Imports 10 10 0.0
Total Supply 3,169 3,135 -1.1Crush 1,840 1,830 -0.5Seed and Residual 59 166 182.2
Domestic use 1,899 1,996 5.1Exports 1,145 1,000 -12.7
Total Use 3,044 2,996 -1.6Ending stocks 125 140 11.5
PercentStocks/use ratio 4.1 4.7
Dollars/bushelAverage market price 10.15 12.00/13.50 25.6
2007/08 estimate
2008/09 forecast
Indicates an increase in the estimate or forecast from the previous month.Indicates a decrease in the estimate or forecast from the previous month.
53
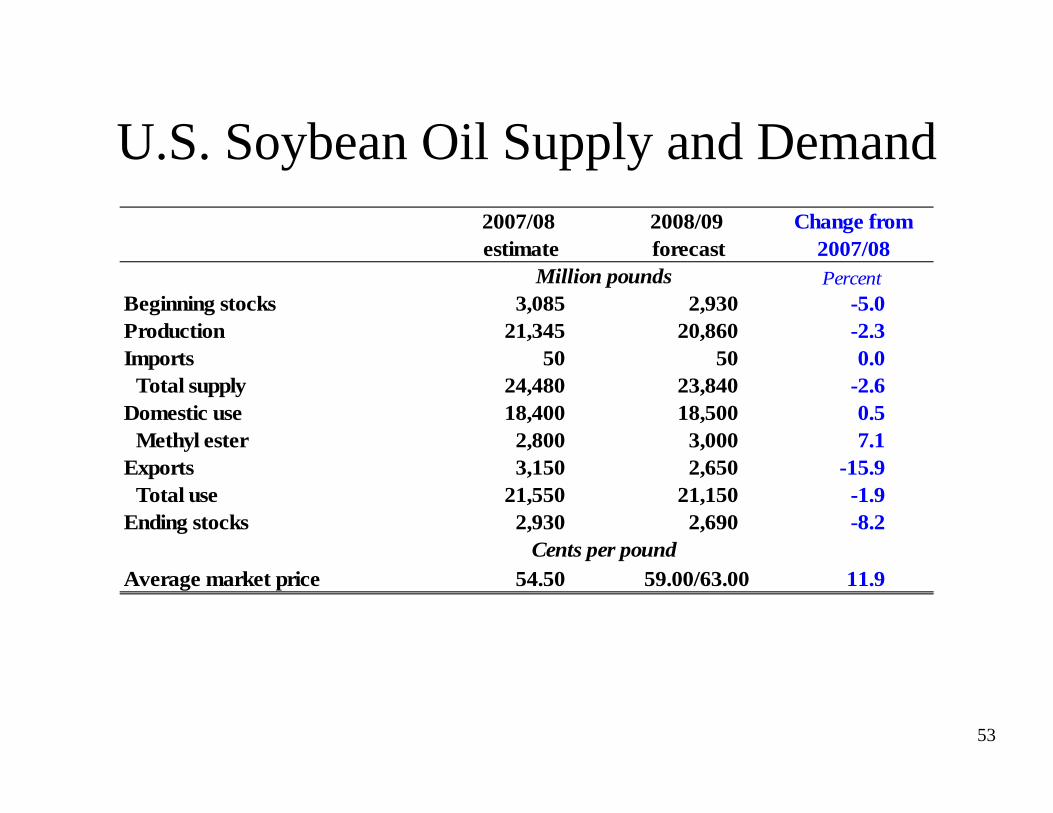
U.S. Soybean Oil Supply and DemandChange from
2007/08Million pounds Percent
Beginning stocks 3,085 2,930 -5.0Production 21,345 20,860 -2.3Imports 50 50 0.0
Total supply 24,480 23,840 -2.6Domestic use 18,400 18,500 0.5
Methyl ester 2,800 3,000 7.1Exports 3,150 2,650 -15.9
Total use 21,550 21,150 -1.9Ending stocks 2,930 2,690 -8.2
Cents per poundAverage market price 54.50 59.00/63.00 11.9
2007/08 estimate
2008/09 forecast
Indicates an increase in the estimate or forecast from the previous month.Indicates a decrease in the estimate or forecast from the previous month.
54
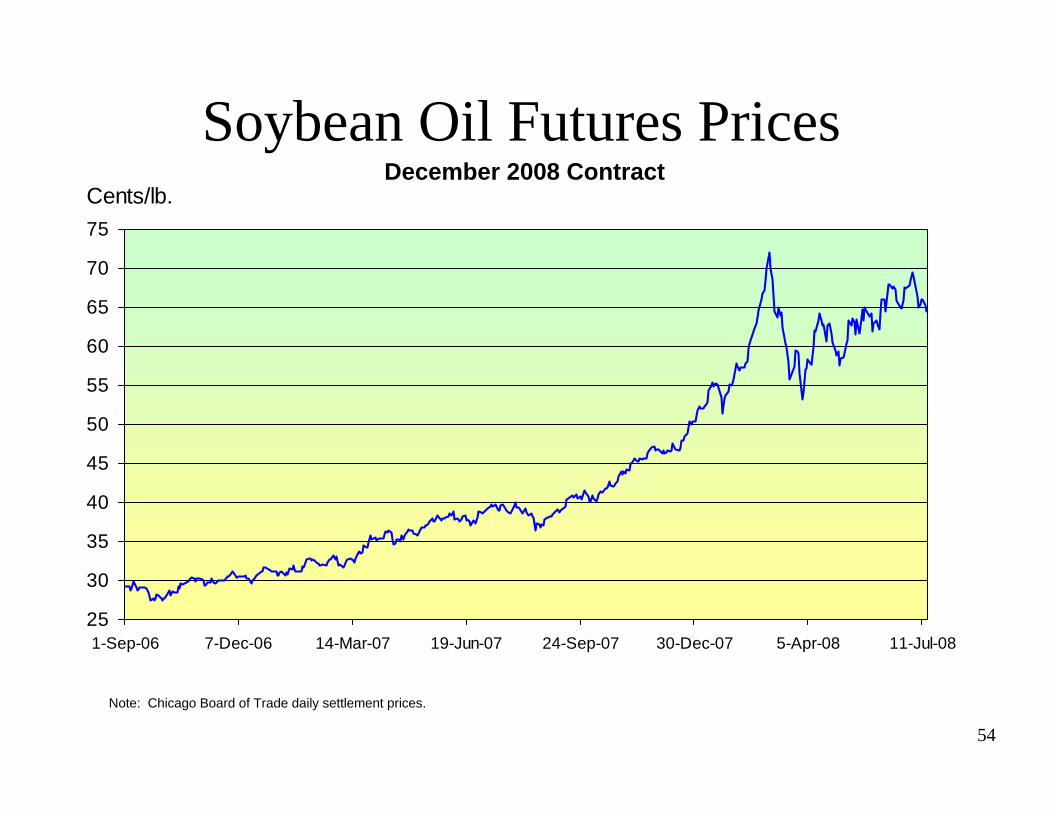
Soybean Oil Futures Prices
25
30
35
40
45
50
55
60
65
70
75
1-Sep-06 7-Dec-06 14-Mar-07 19-Jun-07 24-Sep-07 30-Dec-07 5-Apr-08 11-Jul-08
Cents/lb.
Note: Chicago Board of Trade daily settlement prices.
December 2008 Contract
55
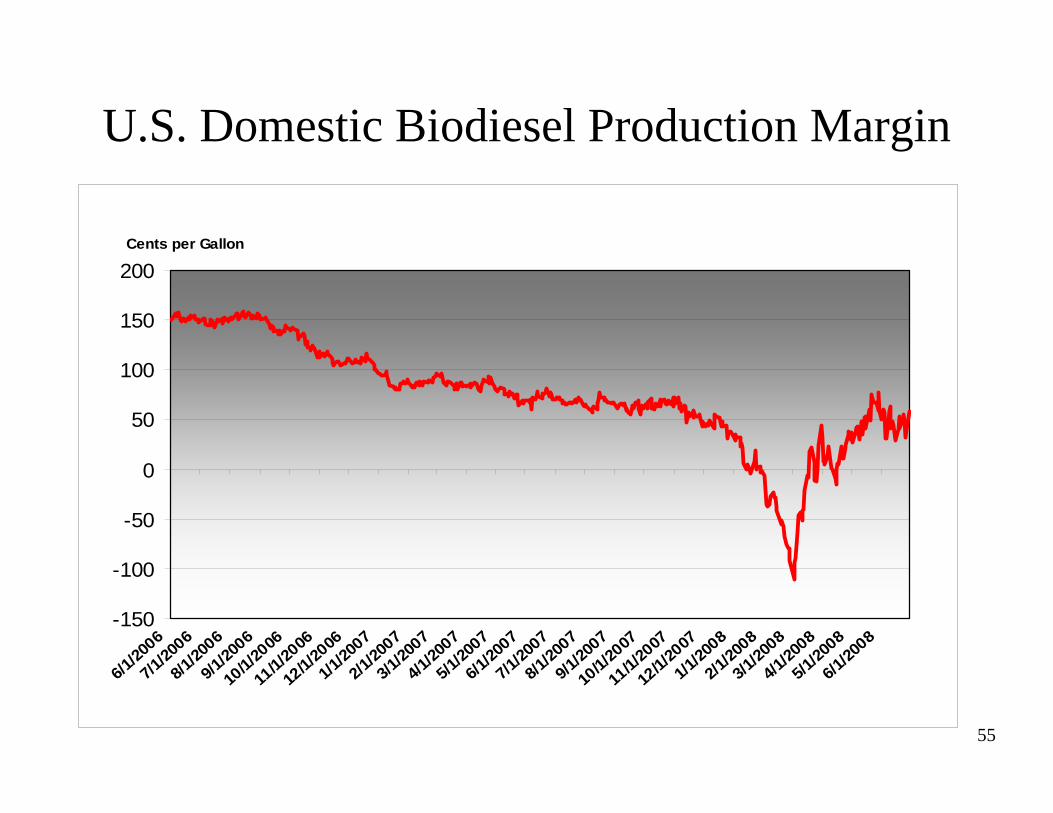
U.S. Domestic Biodiesel Production Margin
-150
-100
-50
0
50
100
150
200
6/1/20
06
7/1/20
06
8/1/20
06
9/1/20
06
10/1/
2006
11/1/
2006
12/1/
2006
1/1/20
07
2/1/20
07
3/1/20
07
4/1/20
07
5/1/20
07
6/1/20
07
7/1/20
07
8/1/20
07
9/1/20
07
10/1/
2007
11/1/
2007
12/1/
2007
1/1/20
08
2/1/20
08
3/1/20
08
4/1/20
08
5/1/20
08
6/1/20
08
Cents per Gallon
56
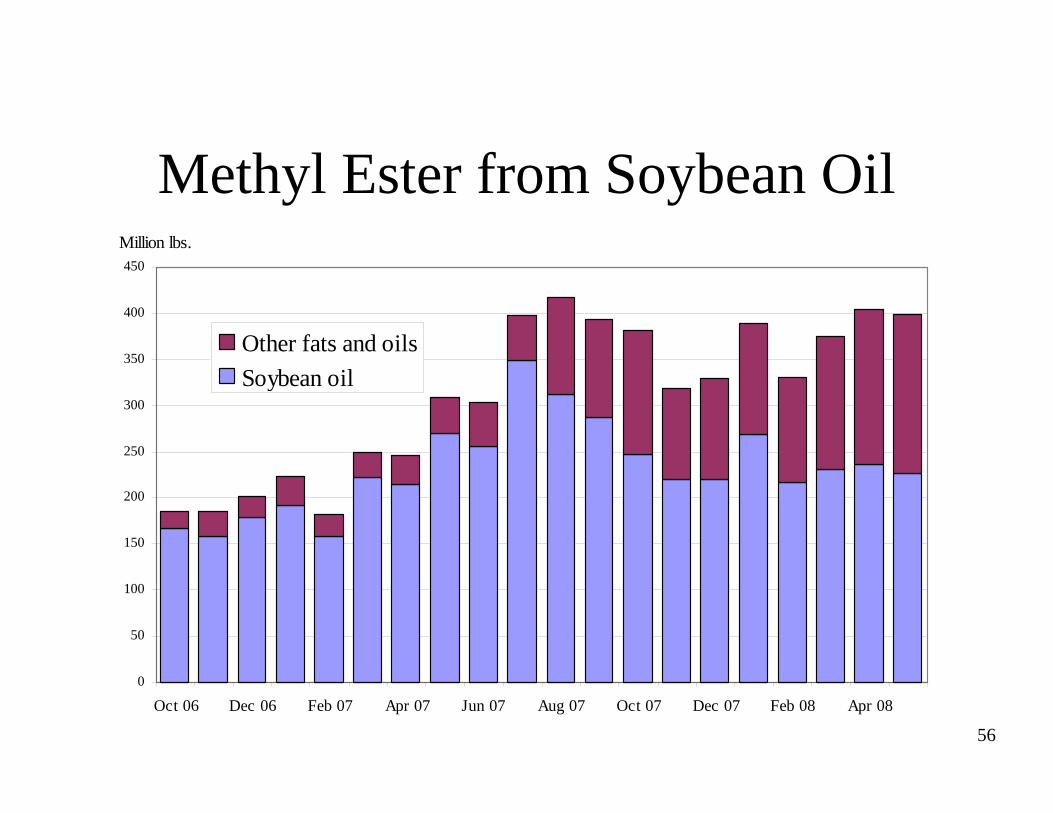
Methyl Ester from Soybean Oil
0
50
100
150
200
250
300
350
400
450
Oct 06 Dec 06 Feb 07 Apr 07 Jun 07 Aug 07 Oct 07 Dec 07 Feb 08 Apr 08
Other fats and oilsSoybean oil
Million lbs.
57
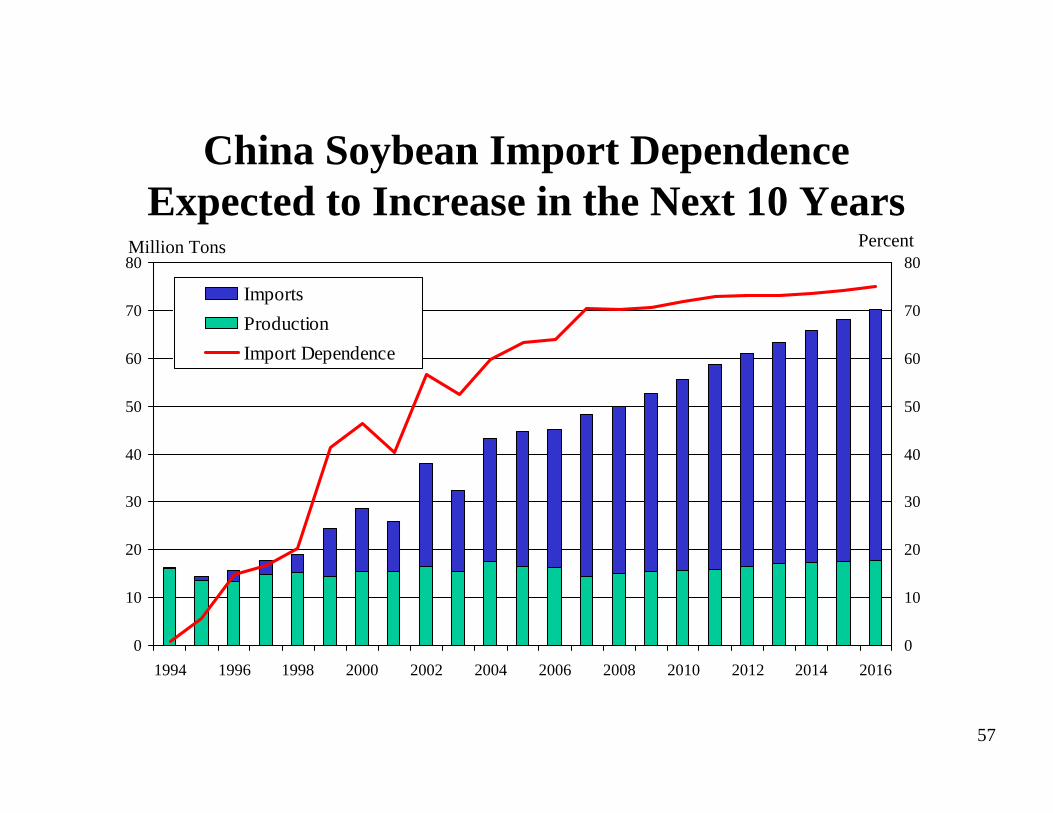
China Soybean Import Dependence Expected to Increase in the Next 10 Years
0
10
20
30
40
50
60
70
80
1994 1996 1998 2000 2002 2004 2006 2008 2010 2012 2014 20160
10
20
30
40
50
60
70
80
ImportsProductionImport Dependence
Million Tons Percent
58
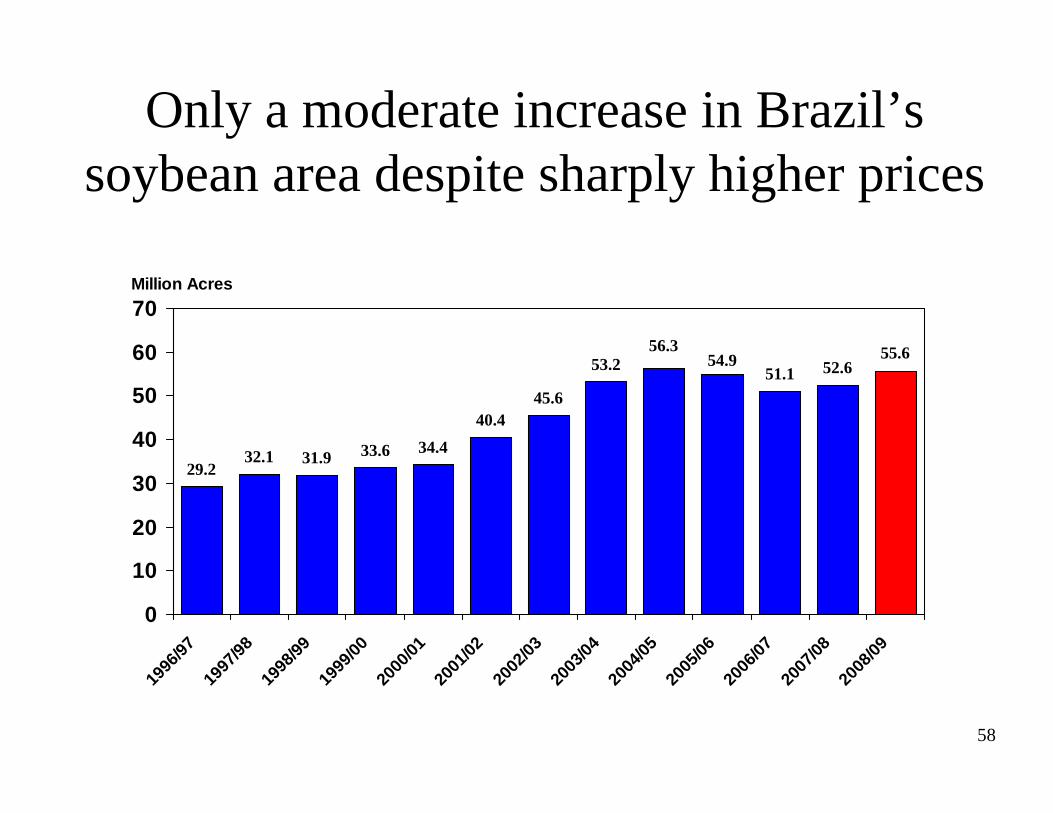
Only a moderate increase in Brazil’s soybean area despite sharply higher prices
29.232.1 31.9 33.6 34.4
40.445.6
53.2 51.1 52.654.956.3 55.6
0
10
20
30
40
50
60
70
1996
/9719
97/98
1998
/9919
99/00
2000
/0120
01/02
2002
/0320
03/04
2004
/0520
05/06
2006
/0720
07/08
2008
/09
Million Acres
59
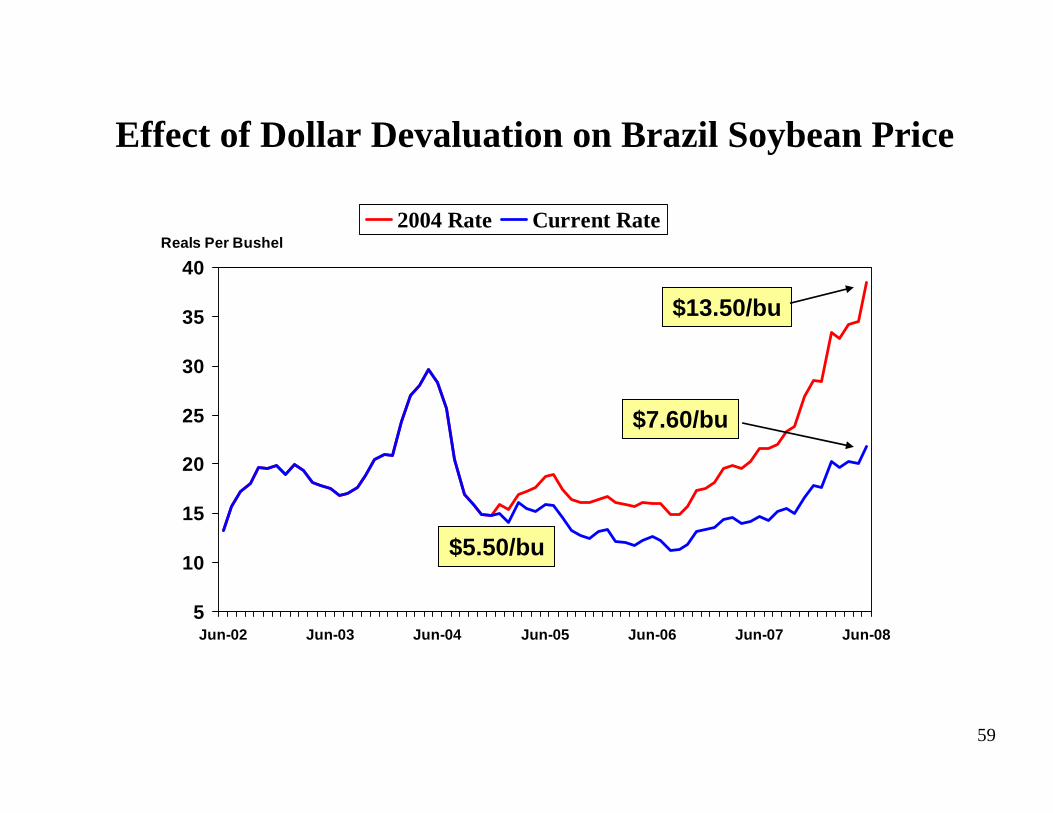
Effect of Dollar Devaluation on Brazil Soybean Price
5
10
15
20
25
30
35
40
Jun-02 Jun-03 Jun-04 Jun-05 Jun-06 Jun-07 Jun-08
Reals Per Bushel2004 Rate Current Rate
$13.50/bu
$7.60/bu
$5.50/bu
60
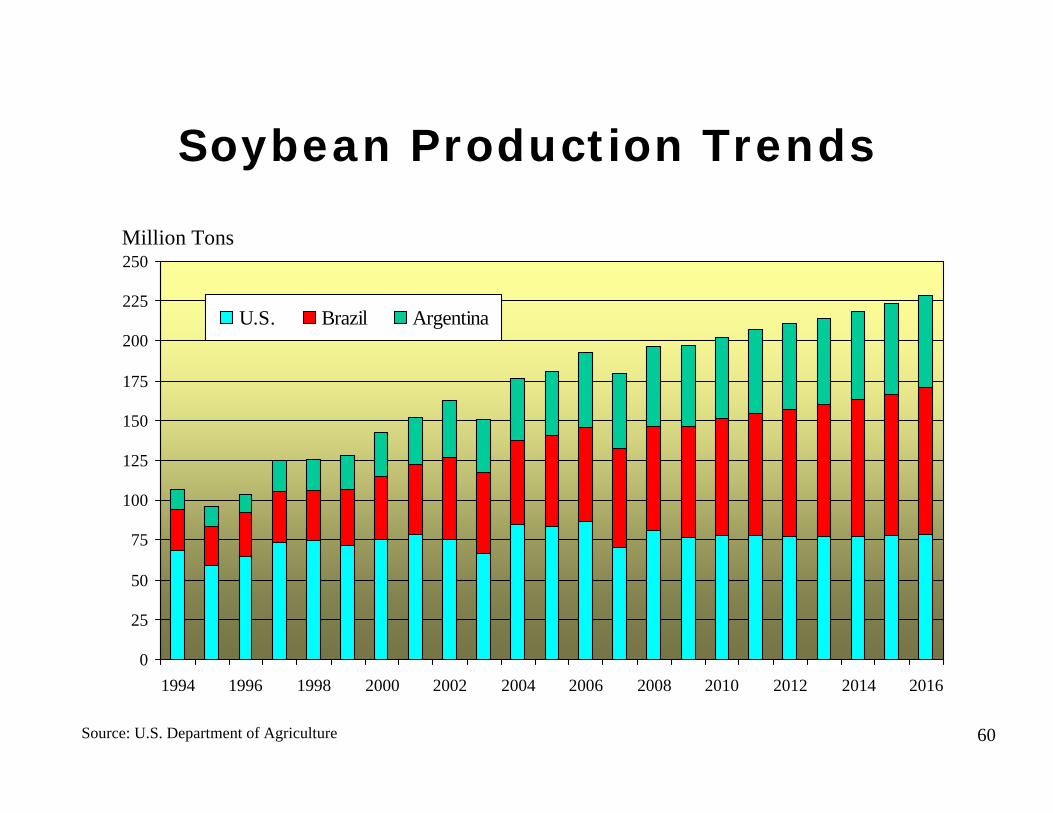
0
25
50
75
100
125
150
175
200
225
250
1994 1996 1998 2000 2002 2004 2006 2008 2010 2012 2014 2016
U.S. Brazil Argentina
Soybean Production Trends
Million Tons
Source: U.S. Department of Agriculture
61
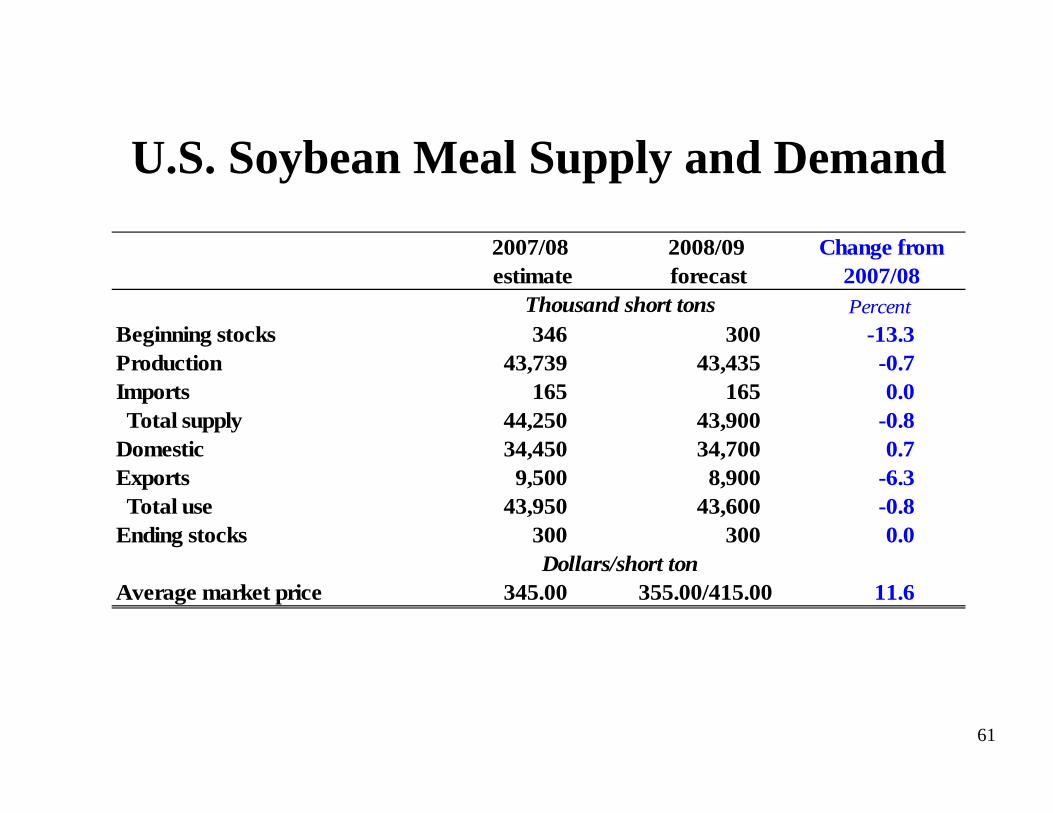
U.S. Soybean Meal Supply and Demand
Change from 2007/08
Thousand short tons PercentBeginning stocks 346 300 -13.3Production 43,739 43,435 -0.7Imports 165 165 0.0 Total supply 44,250 43,900 -0.8Domestic 34,450 34,700 0.7Exports 9,500 8,900 -6.3 Total use 43,950 43,600 -0.8Ending stocks 300 300 0.0
Dollars/short tonAverage market price 345.00 355.00/415.00 11.6
2007/08 estimate
2008/09 forecast
Indicates an increase in the estimate or forecast from the previous month.Indicates a decrease in the estimate or forecast from the previous month.
62
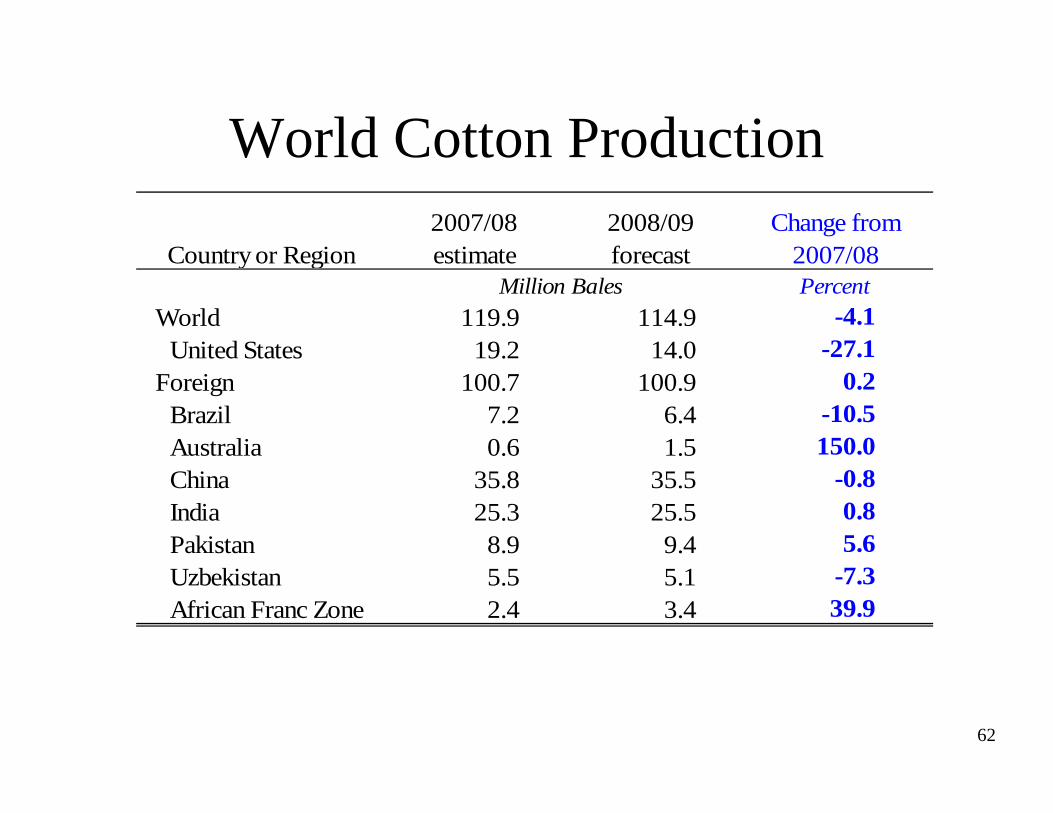
World Cotton Production
Country or Region2007/08 estimate
2008/09 forecast
Change from 2007/08
Million Bales PercentWorld 119.9 114.9 -4.1
United States 19.2 14.0 -27.1Foreign 100.7 100.9 0.2
Brazil 7.2 6.4 -10.5Australia 0.6 1.5 150.0China 35.8 35.5 -0.8India 25.3 25.5 0.8Pakistan 8.9 9.4 5.6Uzbekistan 5.5 5.1 -7.3African Franc Zone 2.4 3.4 39.9
Indicates an increase in the estimate or forecast from the previous month.Indicates a decrease in the estimate or forecast from the previous month.
63
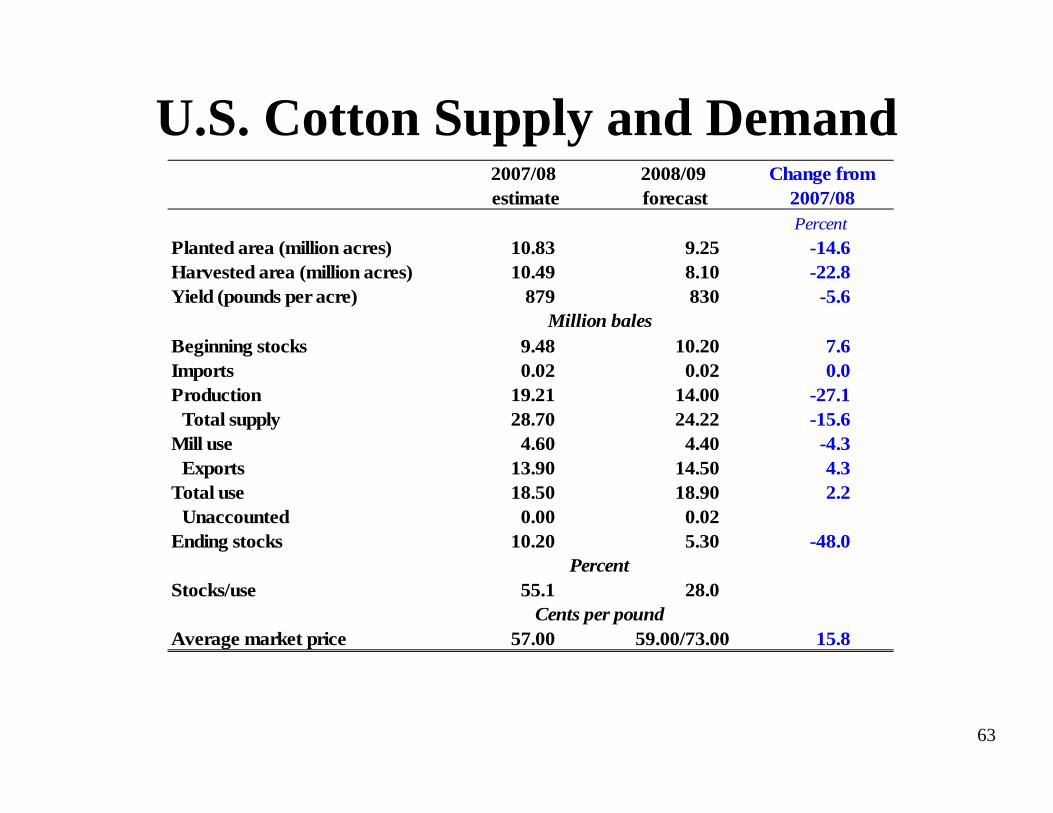
U.S. Cotton Supply and DemandChange from
2007/08Percent
Planted area (million acres) 10.83 9.25 -14.6Harvested area (million acres) 10.49 8.10 -22.8Yield (pounds per acre) 879 830 -5.6
Million balesBeginning stocks 9.48 10.20 7.6Imports 0.02 0.02 0.0Production 19.21 14.00 -27.1
Total supply 28.70 24.22 -15.6Mill use 4.60 4.40 -4.3
Exports 13.90 14.50 4.3Total use 18.50 18.90 2.2
Unaccounted 0.00 0.02Ending stocks 10.20 5.30 -48.0
PercentStocks/use 55.1 28.0
Cents per poundAverage market price 57.00 59.00/73.00 15.8
2007/08 estimate
2008/09 forecast
Indicates an increase in the estimate or forecast from the previous month.Indicates a decrease in the estimate or forecast from the previous month.
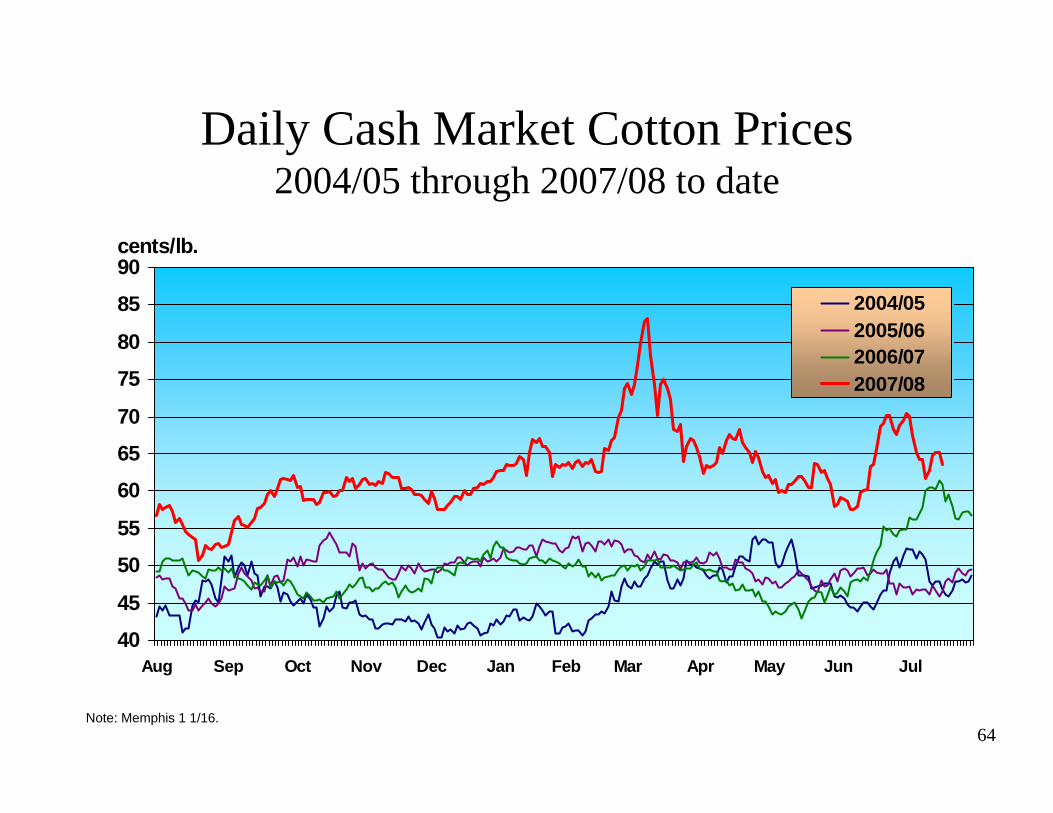
64Note: Memphis 1 1/16.
Daily Cash Market Cotton Prices2004/05 through 2007/08 to date
40
45
50
55
60
65
70
75
80
85
90
Aug Sep Oct Nov Dec Jan Feb Mar Apr May Jun Jul
cents/lb.
2004/052005/062006/072007/08
65
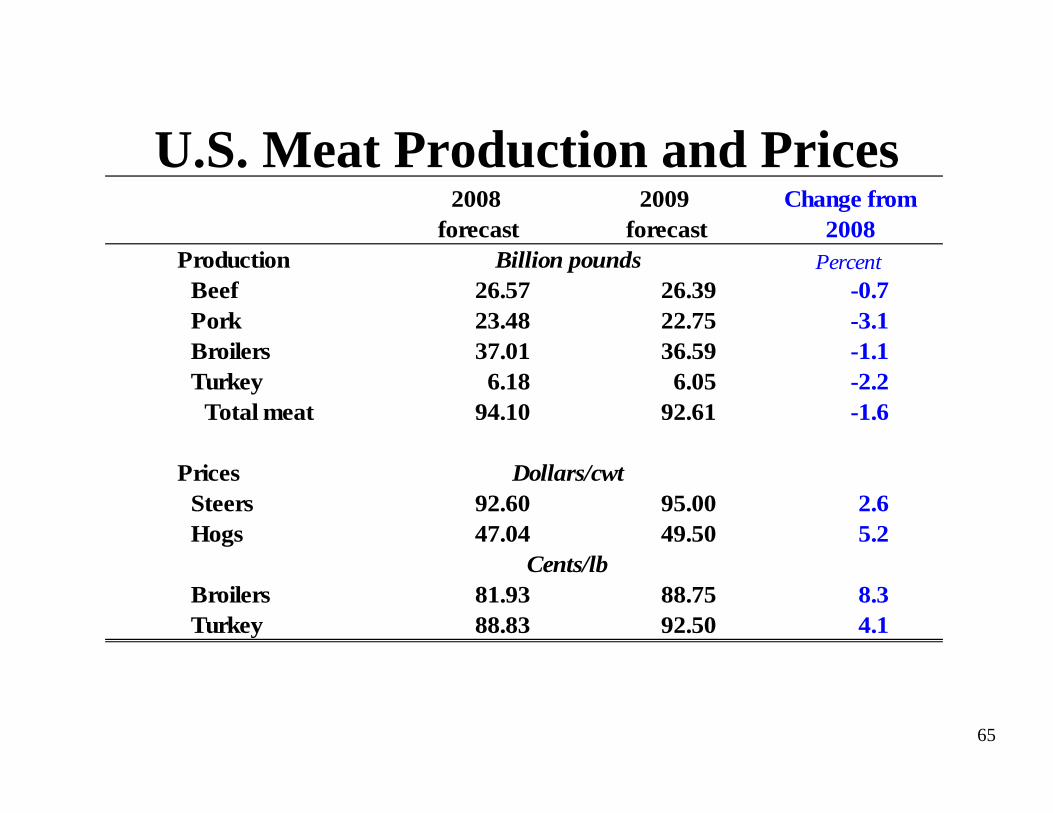
U.S. Meat Production and PricesChange from
2008Production Billion pounds Percent
Beef 26.57 26.39 -0.7Pork 23.48 22.75 -3.1Broilers 37.01 36.59 -1.1Turkey 6.18 6.05 -2.2
Total meat 94.10 92.61 -1.6
Prices Dollars/cwtSteers 92.60 95.00 2.6Hogs 47.04 49.50 5.2
Cents/lbBroilers 81.93 88.75 8.3Turkey 88.83 92.50 4.1
2008 forecast
2009 forecast
Indicates an increase in the estimate or forecast from the previous month.Indicates a decrease in the estimate or forecast from the previous month.
66
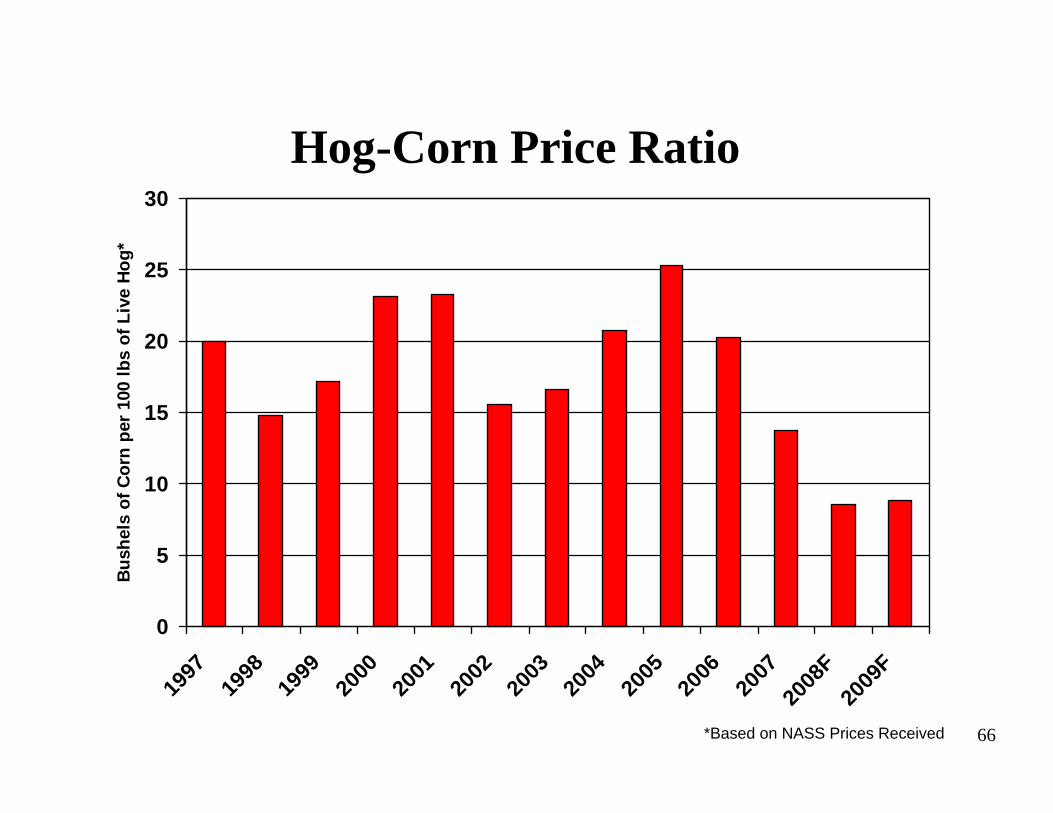
Hog-Corn Price Ratio
0
5
10
15
20
25
30
1997
1998
1999
2000
2001
2002
2003
2004
2005
2006
2007
2008
F20
09F
Bush
els
of C
orn
per 1
00 lb
s of
Liv
e Ho
g*
*Based on NASS Prices Received
67
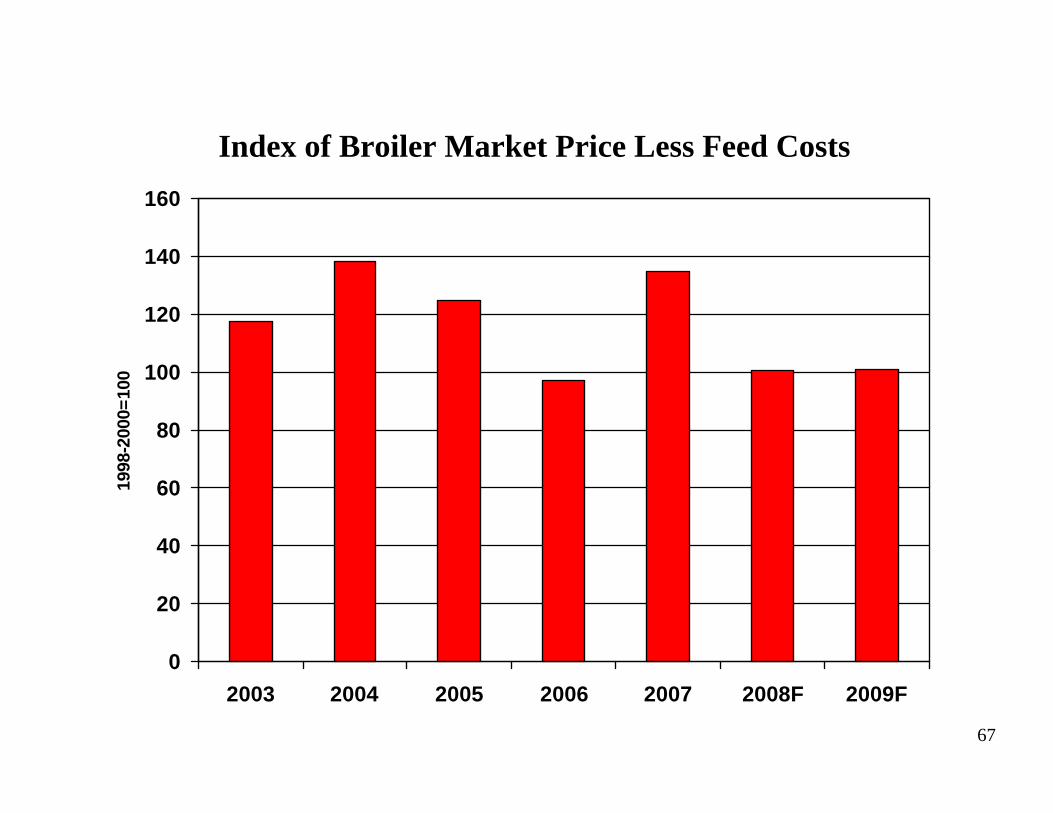
Index of Broiler Market Price Less Feed Costs
0
20
40
60
80
100
120
140
160
2003 2004 2005 2006 2007 2008F 2009F
1998
-200
0=10
0
68
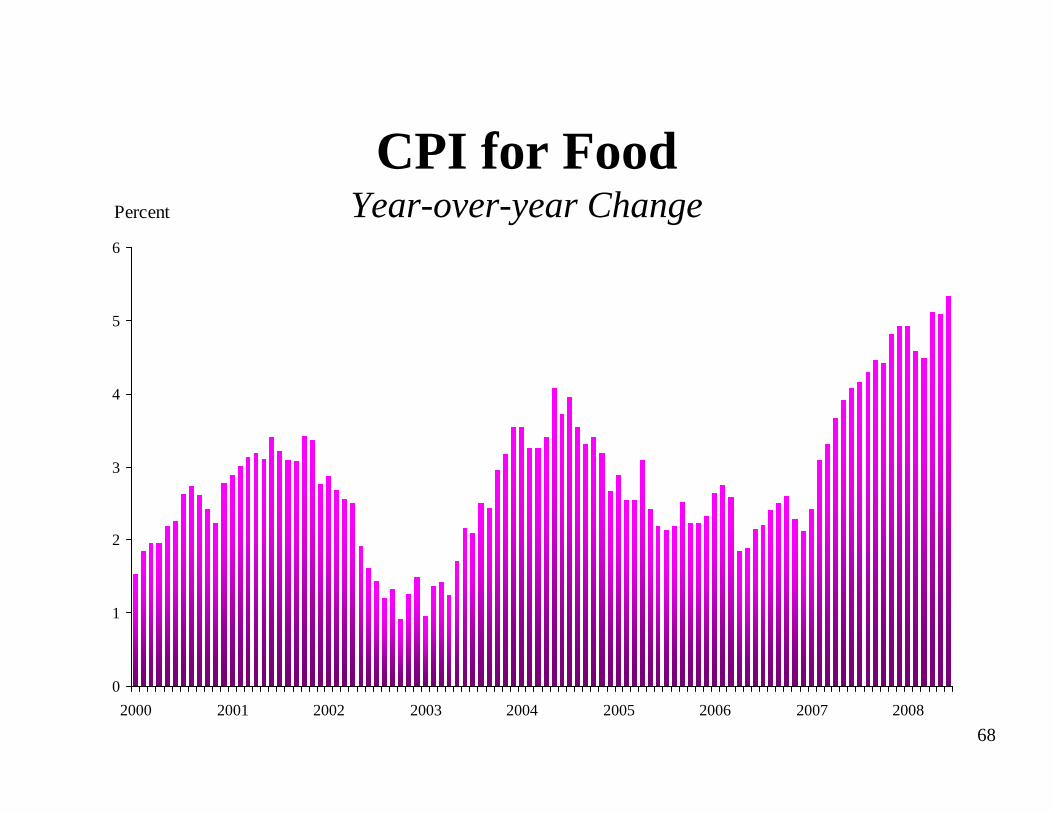
CPI for FoodYear-over-year Change
0
1
2
3
4
5
6
2000 2001 2002 2003 2004 2005 2006 2007 2008
Percent
69
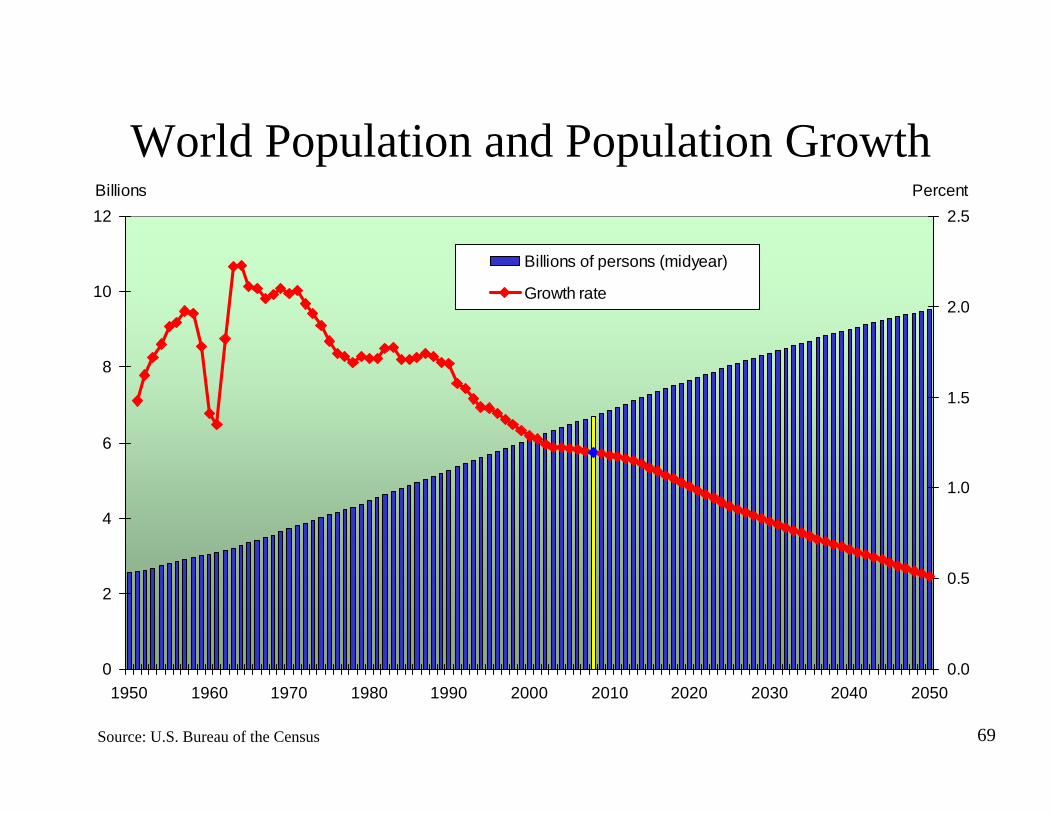
World Population and Population Growth
0
2
4
6
8
10
12
1950 1960 1970 1980 1990 2000 2010 2020 2030 2040 20500.0
0.5
1.0
1.5
2.0
2.5
Billions of persons (midyear)
Growth rate
Billions Percent
Source: U.S. Bureau of the Census
70
200
300
400
500
600
700
800
900
1,000
Jan04
Apr04
Jul04
Oct04
Jan05
Apr05
Jul05
Oct05
Jan06
Apr06
Jul06
Oct06
Jan07
Apr07
Jul07
Oct07
Dec07
Mar08
Jun08
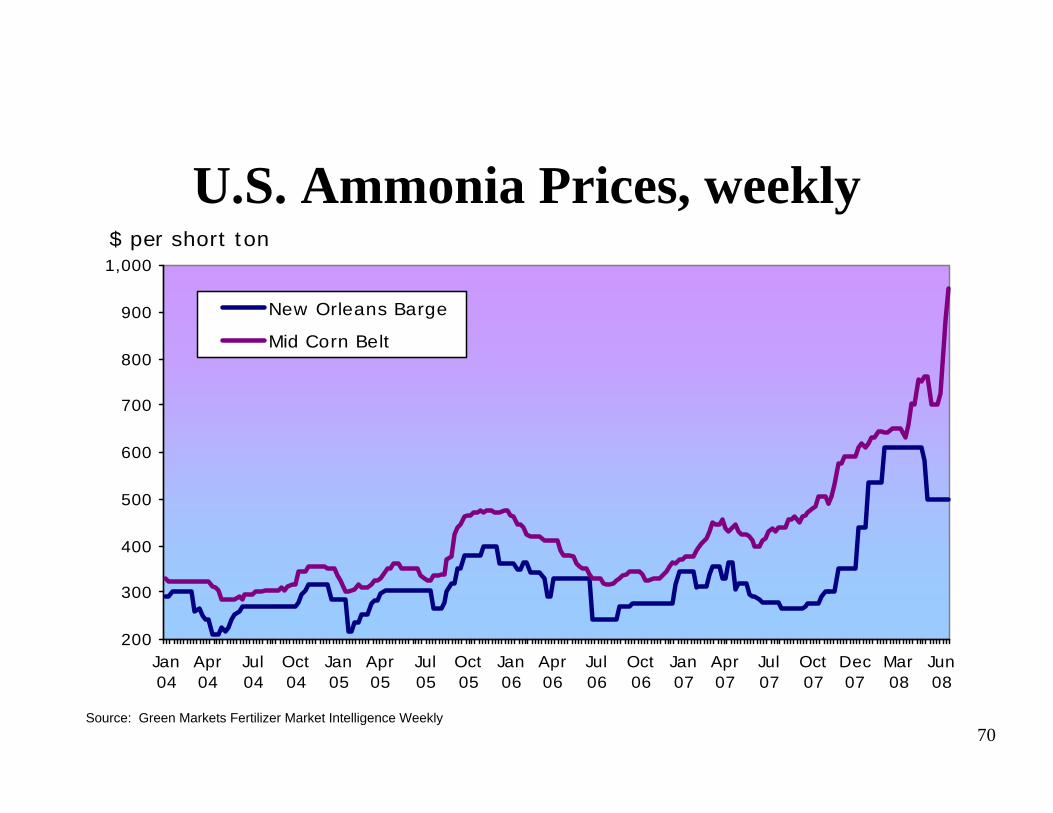
New Orleans Barge
Mid Corn Belt
$ per short ton
Source: Green Markets Fertilizer Market Intelligence Weekly
U.S. Ammonia Prices, weekly
71
U.S. Nitrogen Production and Imports
0
2
4
6
8
10
12
14
16
1997 1998 1999 2000 2001 2002 2003 2004 2005 2006 2007
ProductionImports
Million tons
72
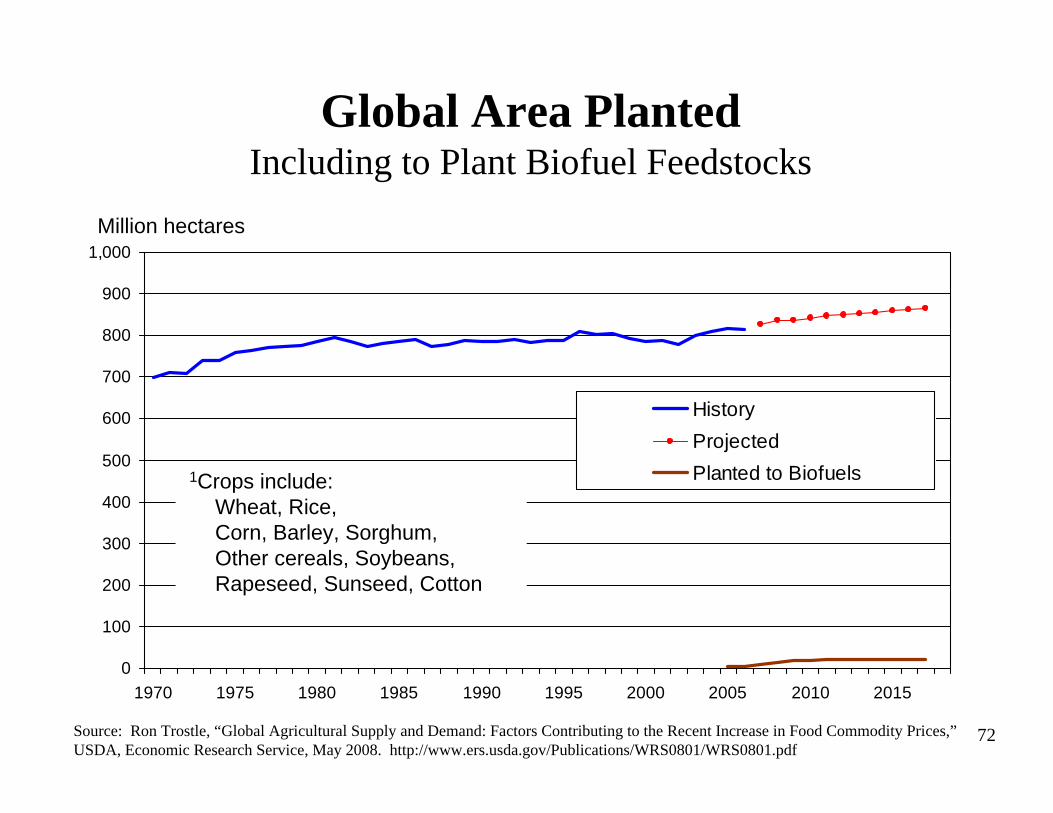
Global Area PlantedIncluding to Plant Biofuel Feedstocks
0
100
200
300
400
500
600
700
800
900
1,000
1970 1975 1980 1985 1990 1995 2000 2005 2010 2015
HistoryProjectedPlanted to Biofuels
Million hectares
1Crops include:Wheat, Rice, Corn, Barley, Sorghum, Other cereals, Soybeans,Rapeseed, Sunseed, Cotton
Source: Ron Trostle, “Global Agricultural Supply and Demand: Factors Contributing to the Recent Increase in Food Commodity Prices,”USDA, Economic Research Service, May 2008. http://www.ers.usda.gov/Publications/WRS0801/WRS0801.pdf
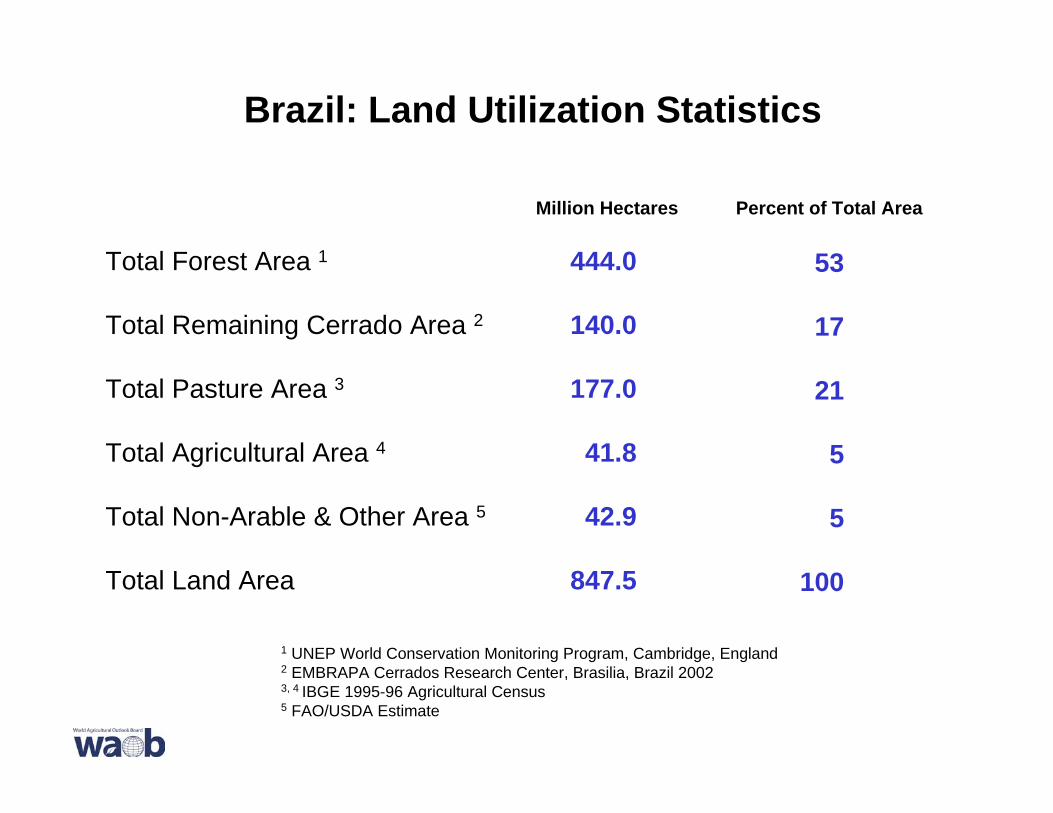
Brazil: Land Utilization Statistics
Total Forest Area 1
Total Remaining Cerrado Area 2
Total Pasture Area 3
Total Agricultural Area 4
Total Non-Arable & Other Area 5
Total Land Area
Million Hectares Percent of Total Area
1 UNEP World Conservation Monitoring Program, Cambridge, England2 EMBRAPA Cerrados Research Center, Brasilia, Brazil 20023, 4 IBGE 1995-96 Agricultural Census5 FAO/USDA Estimate
444.0
140.0
177.0
41.8
42.9
847.5
53
17
21
5
5
100
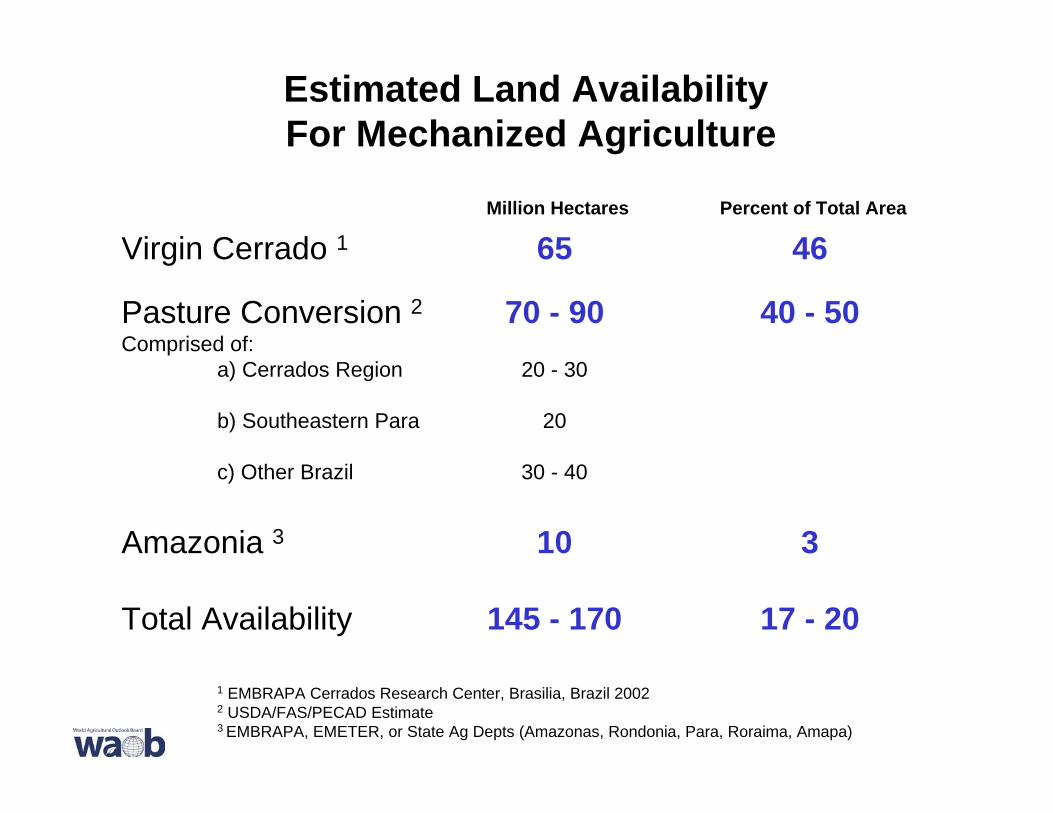
Estimated Land Availability For Mechanized Agriculture
Virgin Cerrado 1
Pasture Conversion 2Comprised of:
a) Cerrados Region
b) Southeastern Para
c) Other Brazil
Amazonia 3
Total Availability
Million Hectares
65
70 - 9020 - 30
20
30 - 40
10
145 - 170
Percent of Total Area
46
40 - 50
3
17 - 20
1 EMBRAPA Cerrados Research Center, Brasilia, Brazil 20022 USDA/FAS/PECAD Estimate3 EMBRAPA, EMETER, or State Ag Depts (Amazonas, Rondonia, Para, Roraima, Amapa)

Feb. 26-27,

End