Embed Size (px)
Citation preview
The Aged Care Workforce in
Australia White Paper
Prepared by Richard Baldwin, John Kelly, Daniel Sharp 1/7/2014
Circulated for
Comment until 30
July 2013
The Aged Care Workforce in Australia
Page | i
Invitation to comment on this paper
This paper is released by the Aged and Community Services Association of Australia to stimulate
discussion on the workforce issues confronting the aged care industry in Australia.
Comments are invited on the issues raised in the paper. Comments can be sent by
Completing the ‘comments’ portal on the ACSA website at
http://www.agedcare.org.au/contact-us
email to [email protected]
posting comments to
Adj Prof John G Kelly AM
Aged and Community Services Australia
Level One, 10 Thesiger Court
Deakin ACT 2600
Comments will be welcome until NN NNNNNNN 2014
This is the second draft which incorporates comments provided by members of the ACSA Workforce
Committee in early June 2014.
© Aged and Community Services Australia
The Aged Care Workforce in Australia
Page | ii
The Aged Care Workforce in Australia
Page | iii
Contents Contents ................................................................................................................................................. iii
List of tables ........................................................................................................................................ v
List of Figures ..................................................................................................................................... vi
Table of Abbreviations ...................................................................................................................... vii
Table of Definitions ........................................................................................................................... vii
Acknowledgements ........................................................................................................................... vii
Executive summary ................................................................................................................................. 1
The existing workforce ........................................................................................................................ 1
Conclusions on the existing workforce ............................................................................................... 2
Approaching the future ....................................................................................................................... 2
List of issues for discussion ................................................................................................................. 3
Recommendations .................................................................................................................................. 5
Introduction ............................................................................................................................................ 6
Purpose and scope of this paper ........................................................................................................ 6
The aged care workforce ........................................................................................................................ 7
Residential aged care workforce in 2012 ............................................................................................ 7
Community care workforce in 2012 ................................................................................................. 10
Migrant and indigenous aged care workforce .................................................................................. 13
Migrant workers in residential aged care ..................................................................................... 13
Community aged care staff with a migrant background .............................................................. 15
Residential aged care staff with indigenous backgrounds............................................................ 18
Community aged care staff with indigenous backgrounds ........................................................... 18
Staffing patterns ............................................................................................................................... 19
Employment and hours of work - residential care ....................................................................... 19
Employment and hours of work – community care ..................................................................... 20
Employment arrangements .............................................................................................................. 22
Employment arrangements - residential aged care ..................................................................... 22
Employment arrangements - Community aged care .................................................................... 22
Staffing qualification and training ..................................................................................................... 23
Residential aged care staff training .............................................................................................. 23
Community care workers training ................................................................................................ 23
The Aged Care Workforce in Australia
Page | iv
Recruitment ...................................................................................................................................... 24
Shortages ...................................................................................................................................... 24
Recruitment difficulty ................................................................................................................... 27
Retention .......................................................................................................................................... 27
Turnover rate -Residential aged care............................................................................................ 27
Turnover rate - Community care .................................................................................................. 29
Intention to leave - Residential aged care employees .................................................................. 30
Intention to leave - Community care staff .................................................................................... 30
Job satisfaction - residential aged care employees ...................................................................... 31
Job satisfaction - community care employees .............................................................................. 31
Conclusion in relation to the current aged care workforce .............................................................. 32
Approaching the future ......................................................................................................................... 34
Strategies to address workforce issues ............................................................................................ 34
Strategic objectives ........................................................................................................................... 35
Workforce Planning .......................................................................................................................... 36
Growth in the aged care industry ................................................................................................. 36
Workforce required by 2023 ......................................................................................................... 38
Education and training, skills development and career paths .......................................................... 40
Employment conditions and workplace culture ............................................................................... 41
Career paths/ job satisfaction/ job status ........................................................................................ 42
Residential care ............................................................................................................................. 42
Community care ............................................................................................................................ 43
Management competencies ............................................................................................................. 44
Use of technology ............................................................................................................................. 46
Work roles/ models of care/ recruitment ......................................................................................... 46
Appendix A – Snapshot of the Australian Aged Care System ............................................................... 50
Residential aged care in 2013 ........................................................................................................... 50
Community aged care in 2013 .......................................................................................................... 50
Home Care Packages ..................................................................................................................... 50
Home Support services ................................................................................................................. 50
Appendix B – Additional data tables ..................................................................................................... 51
References ............................................................................................................................................ 54
The Aged Care Workforce in Australia
Page | v
List of tables Table 1 Possible areas for strategic focus to address key objective towards aged care workforce
improvement .......................................................................................................................................... 3
Table 2 Direct care employees in RACF by occupation 2003, 2007, 2012 (FTE and percentage of
total): Australia ....................................................................................................................................... 8
Table 3 Median age of the residential direct care workforce, by occupation, all direct care employees
and recent hires: 2012 (number of years) .............................................................................................. 9
Table 4 Community care workforce 2012: Australia 2007 and 2012 estimated headcount ................ 10
Table 5 Full-time equivalent direct care employees in the community aged care workforce, by
occupation: 2007 and 2012 (estimated FTE and per cent) ................................................................... 11
Table 6 Country of birth of the residential direct care workforce (headcount), all direct care
employees and recent hires: 2007 and 2012 (per cent) ....................................................................... 13
Table 7 Aged care residents, preferred language (a) by state/territory: Australia, 30 June 2011 (per
cent) ...................................................................................................................................................... 14
Table 8 Employees in residential aged care who are migrants, speak a LOTE or from a CALD
background, by occupation, comparing responses from workers and all facilities: Australia 2012 (per
cent) ...................................................................................................................................................... 15
Table 9 Time spent in Australia for migrant residential direct care workers who speak a language
other than English, by occupation: 2012 (per cent) ............................................................................. 15
Table 10 Country of birth of the community direct care workforce (headcount), all direct care
employees and recent hires (employed < 12 months): Australia 2007 and 2012 (per cent) ............... 16
Table 11 CACP, EACH, and EACHD clients, by preferred language: Australia 30 June 2012 (per cent) 16
Table 12 Migrant community direct care workforce, by occupation, comparing worker and outlet
responses: 2012 (per cent) ................................................................................................................... 17
Table 13 Time spent in Australia of migrant community direct care workers who speak a language
other than English, by occupation: 2012 (per cent) ............................................................................. 17
Table 14 The Aboriginal and Torres Strait Islander residential direct care workforce, by occupation,
comparing facility and worker responses: 2012 (per cent) .................................................................. 18
Table 15 The Aboriginal and Torres Strait Islander community direct care workforce, by occupation,
comparing outlet and worker responses: 2012 (per cent) ................................................................... 19
Table 16 Form of employment of the direct residential aged care workforce, by occupation:
Australia, 2012 (per cent) ..................................................................................................................... 19
Table 17 Actual working hours and preferred working hours of direct care workers in the residential
aged care workforce, by occupation: 2012 (per cent) (Australia) ........................................................ 20
Table 18 Preferred change in working hours of the residential direct care workforce: 2003, 2007 and
2012 (per cent) ...................................................................................................................................... 20
Table 19 Form of employment of the community direct care workforce, by occupation: 2012 (per
cent) ...................................................................................................................................................... 21
Table 20 Actual working hours and preferred working hours of direct care workers in the community
direct care workforce, by occupation: 2012 (per cent) ........................................................................ 21
Table 21 Preferred change in working hours of the community direct care workforce: 2007 and 2012
(per cent) ............................................................................................................................................... 21
Table 22 Distribution of residential aged care facilities by the proportion of Personal Care Attendants
(PCAs) with Certificate-level qualifications: 2007 and 2012 (per cent) ................................................ 23
The Aged Care Workforce in Australia
Page | vi
Table 23 Distribution of community services by proportion of Community Care Workers (CCWs) with
relevant Certificate-level qualifications: 2007 and 2012 (per cent) ..................................................... 24
Table 24 Main reason for leaving prior aged care job of community direct care workers with previous
experience in sector, by occupation: Australia 2012 (per cent) ........................................................... 30
Table 25 Proportion of the community direct care workforce actively seeking work by occupation
and tenure in current job: 2012 (per cent) ........................................................................................... 31
Table 26 Possible areas for strategic focus to address key objective towards aged care workforce
improvement ........................................................................................................................................ 36
Table 27 Estimated number of additional direct care staff in residential and community aged care
required by 2023: Australia .................................................................................................................. 38
Table 28 Estimated number of additional staff over the decade to 2013: Australia ........................... 39
Table 29 Age distribution of the residential direct care workforce, all direct care employees and
recent hires; 2003, 2007 and 2012 (Australia) Headcount ................................................................... 51
Table 30 Post-school qualifications completed by the residential direct care workforce, by
occupation: 2012 (per cent) .................................................................................................................. 51
Table 31 Post-school qualifications completed by the community direct care workforce, by
occupation: 2012 (per cent) .................................................................................................................. 52
Table 32 Weeks required for residential facilities to fill most recent vacancy, by occupation: 2012
(per cent) ............................................................................................................................................... 52
Table 33 Tenure in current job of the residential direct care workforce, by occupation: 2012 (per
cent) ...................................................................................................................................................... 53
Table 34 Community direct care employees, tenure in current job, by occupation: Australia 2012 (per
cent) ...................................................................................................................................................... 53
List of Figures Figure 1 Direct residential aged care staff by occupation: Australia 2012 (Headcount) ........................ 7
Figure 2 Direct care residential aged care workforce by age group: Australia 2003, 2007, 2012 (%
headcount) .............................................................................................................................................. 9
Figure 3 Direct care residential aged care new hires (employed < 12 months) by age group: Australia,
2003, 2007, 2012 (% headcount) ............................................................................................................ 9
Figure 4 Community aged care direct care workforce, estimated headcount: Australia 2012 ............ 11
Figure 5 Community aged care workforce estimated FTE: Australia 2012........................................... 12
Figure 6 Community aged care workforce by age group: 2007 and 2012 (% headcount) ................... 12
Figure 7 Community aged care recent hires by age groups: 2007 and 2012 (% headcount) ............... 12
Figure 8 Weeks required for residential aged care facilities to fill vacancies, by occupation: Australia
2012 (per cent) ...................................................................................................................................... 26
Figure 9 Residential aged care employees’ tenure in current job; Australia 2012 (per cent) .............. 28
Figure 10 Community care direct care employees, tenure in current position: Australian, 2012, (per
cent) ...................................................................................................................................................... 29
Figure 11 Estimated number of residential aged care places required to 2013: Australia .................. 37
Figure 12 Aged Care workforce projection; Australia 2010- 2050 ....................................................... 38
The Aged Care Workforce in Australia
Page | vii
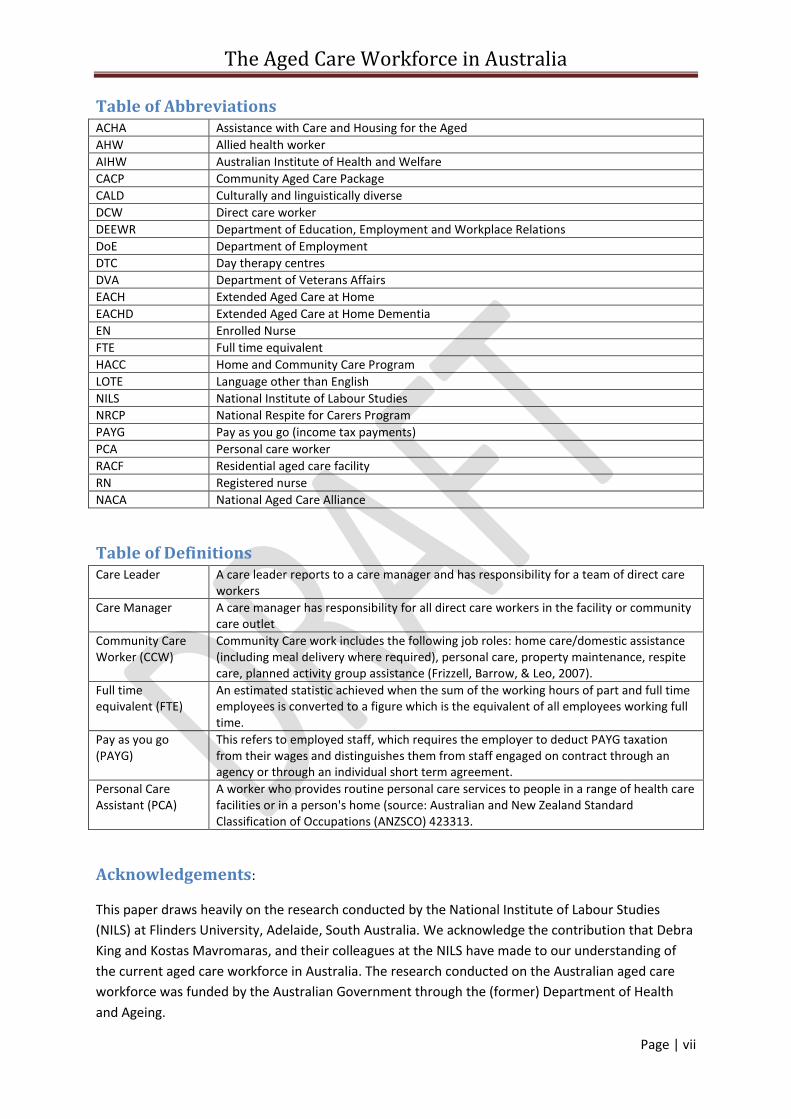
Table of Abbreviations ACHA Assistance with Care and Housing for the Aged
AHW Allied health worker
AIHW Australian Institute of Health and Welfare
CACP Community Aged Care Package
CALD Culturally and linguistically diverse
DCW Direct care worker
DEEWR Department of Education, Employment and Workplace Relations
DoE Department of Employment
DTC Day therapy centres
DVA Department of Veterans Affairs
EACH Extended Aged Care at Home
EACHD Extended Aged Care at Home Dementia
EN Enrolled Nurse
FTE Full time equivalent
HACC Home and Community Care Program
LOTE Language other than English
NILS National Institute of Labour Studies
NRCP National Respite for Carers Program
PAYG Pay as you go (income tax payments)
PCA Personal care worker
RACF Residential aged care facility
RN Registered nurse
NACA National Aged Care Alliance
Table of Definitions Care Leader A care leader reports to a care manager and has responsibility for a team of direct care
workers
Care Manager A care manager has responsibility for all direct care workers in the facility or community care outlet
Community Care Worker (CCW)
Community Care work includes the following job roles: home care/domestic assistance (including meal delivery where required), personal care, property maintenance, respite care, planned activity group assistance (Frizzell, Barrow, & Leo, 2007).
Full time equivalent (FTE)
An estimated statistic achieved when the sum of the working hours of part and full time employees is converted to a figure which is the equivalent of all employees working full time.
Pay as you go (PAYG)
This refers to employed staff, which requires the employer to deduct PAYG taxation from their wages and distinguishes them from staff engaged on contract through an agency or through an individual short term agreement.
Personal Care Assistant (PCA)
A worker who provides routine personal care services to people in a range of health care facilities or in a person's home (source: Australian and New Zealand Standard Classification of Occupations (ANZSCO) 423313.
Acknowledgements:
This paper draws heavily on the research conducted by the National Institute of Labour Studies
(NILS) at Flinders University, Adelaide, South Australia. We acknowledge the contribution that Debra
King and Kostas Mavromaras, and their colleagues at the NILS have made to our understanding of
the current aged care workforce in Australia. The research conducted on the Australian aged care
workforce was funded by the Australian Government through the (former) Department of Health
and Ageing.
Page | 1
Executive summary
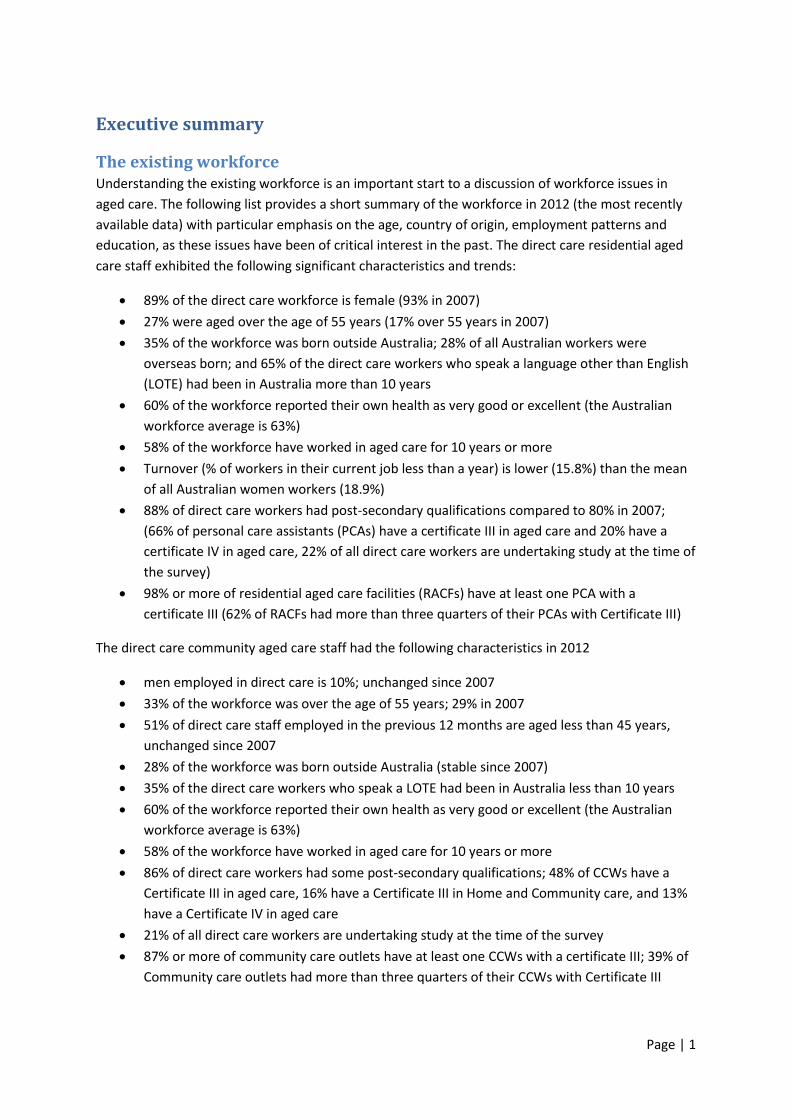
The existing workforce Understanding the existing workforce is an important start to a discussion of workforce issues in
aged care. The following list provides a short summary of the workforce in 2012 (the most recently
available data) with particular emphasis on the age, country of origin, employment patterns and
education, as these issues have been of critical interest in the past. The direct care residential aged
care staff exhibited the following significant characteristics and trends:
89% of the direct care workforce is female (93% in 2007)
27% were aged over the age of 55 years (17% over 55 years in 2007)
35% of the workforce was born outside Australia; 28% of all Australian workers were
overseas born; and 65% of the direct care workers who speak a language other than English
(LOTE) had been in Australia more than 10 years
60% of the workforce reported their own health as very good or excellent (the Australian
workforce average is 63%)
58% of the workforce have worked in aged care for 10 years or more
Turnover (% of workers in their current job less than a year) is lower (15.8%) than the mean
of all Australian women workers (18.9%)
88% of direct care workers had post-secondary qualifications compared to 80% in 2007;
(66% of personal care assistants (PCAs) have a certificate III in aged care and 20% have a
certificate IV in aged care, 22% of all direct care workers are undertaking study at the time of
the survey)
98% or more of residential aged care facilities (RACFs) have at least one PCA with a
certificate III (62% of RACFs had more than three quarters of their PCAs with Certificate III)
The direct care community aged care staff had the following characteristics in 2012
men employed in direct care is 10%; unchanged since 2007
33% of the workforce was over the age of 55 years; 29% in 2007
51% of direct care staff employed in the previous 12 months are aged less than 45 years,
unchanged since 2007
28% of the workforce was born outside Australia (stable since 2007)
35% of the direct care workers who speak a LOTE had been in Australia less than 10 years
60% of the workforce reported their own health as very good or excellent (the Australian
workforce average is 63%)
58% of the workforce have worked in aged care for 10 years or more
86% of direct care workers had some post-secondary qualifications; 48% of CCWs have a
Certificate III in aged care, 16% have a Certificate III in Home and Community care, and 13%
have a Certificate IV in aged care
21% of all direct care workers are undertaking study at the time of the survey
87% or more of community care outlets have at least one CCWs with a certificate III; 39% of
Community care outlets had more than three quarters of their CCWs with Certificate III
The Aged Care Workforce in Australia
Page | 2
29% of community care outlets has a quarter or more of CCWs with Certificate IV and for 5%
of all CCWs have a Certificate IV
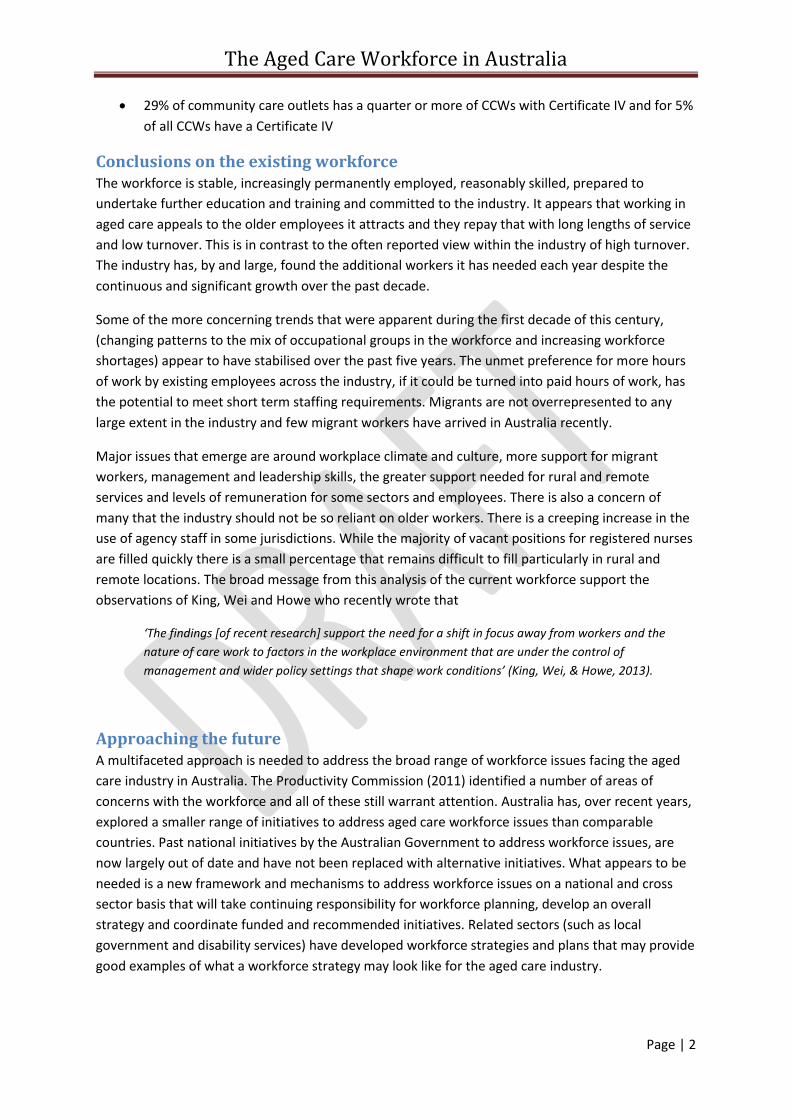
Conclusions on the existing workforce The workforce is stable, increasingly permanently employed, reasonably skilled, prepared to
undertake further education and training and committed to the industry. It appears that working in
aged care appeals to the older employees it attracts and they repay that with long lengths of service
and low turnover. This is in contrast to the often reported view within the industry of high turnover.
The industry has, by and large, found the additional workers it has needed each year despite the
continuous and significant growth over the past decade.
Some of the more concerning trends that were apparent during the first decade of this century,
(changing patterns to the mix of occupational groups in the workforce and increasing workforce
shortages) appear to have stabilised over the past five years. The unmet preference for more hours
of work by existing employees across the industry, if it could be turned into paid hours of work, has
the potential to meet short term staffing requirements. Migrants are not overrepresented to any
large extent in the industry and few migrant workers have arrived in Australia recently.
Major issues that emerge are around workplace climate and culture, more support for migrant
workers, management and leadership skills, the greater support needed for rural and remote
services and levels of remuneration for some sectors and employees. There is also a concern of
many that the industry should not be so reliant on older workers. There is a creeping increase in the
use of agency staff in some jurisdictions. While the majority of vacant positions for registered nurses
are filled quickly there is a small percentage that remains difficult to fill particularly in rural and
remote locations. The broad message from this analysis of the current workforce support the
observations of King, Wei and Howe who recently wrote that
‘The findings [of recent research] support the need for a shift in focus away from workers and the
nature of care work to factors in the workplace environment that are under the control of
management and wider policy settings that shape work conditions’ (King, Wei, & Howe, 2013).
Approaching the future A multifaceted approach is needed to address the broad range of workforce issues facing the aged
care industry in Australia. The Productivity Commission (2011) identified a number of areas of
concerns with the workforce and all of these still warrant attention. Australia has, over recent years,
explored a smaller range of initiatives to address aged care workforce issues than comparable
countries. Past national initiatives by the Australian Government to address workforce issues, are
now largely out of date and have not been replaced with alternative initiatives. What appears to be
needed is a new framework and mechanisms to address workforce issues on a national and cross
sector basis that will take continuing responsibility for workforce planning, develop an overall
strategy and coordinate funded and recommended initiatives. Related sectors (such as local
government and disability services) have developed workforce strategies and plans that may provide
good examples of what a workforce strategy may look like for the aged care industry.
The Aged Care Workforce in Australia
Page | 3
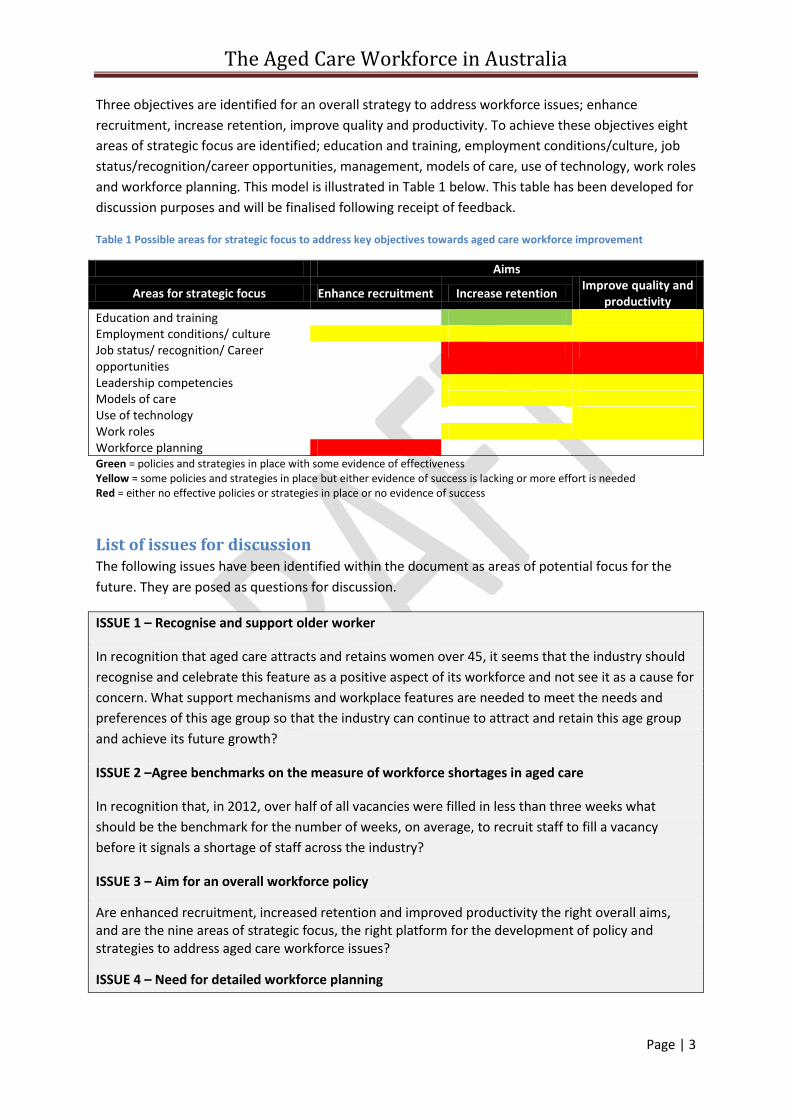
Three objectives are identified for an overall strategy to address workforce issues; enhance
recruitment, increase retention, improve quality and productivity. To achieve these objectives eight
areas of strategic focus are identified; education and training, employment conditions/culture, job
status/recognition/career opportunities, management, models of care, use of technology, work roles
and workforce planning. This model is illustrated in Table 1 below. This table has been developed for
discussion purposes and will be finalised following receipt of feedback.
Table 1 Possible areas for strategic focus to address key objectives towards aged care workforce improvement
Aims
Areas for strategic focus Enhance recruitment Increase retention Improve quality and
productivity Education and training Employment conditions/ culture Job status/ recognition/ Career opportunities
Leadership competencies Models of care Use of technology Work roles Workforce planning Green = policies and strategies in place with some evidence of effectiveness Yellow = some policies and strategies in place but either evidence of success is lacking or more effort is needed Red = either no effective policies or strategies in place or no evidence of success
List of issues for discussion The following issues have been identified within the document as areas of potential focus for the
future. They are posed as questions for discussion.
ISSUE 1 – Recognise and support older worker
In recognition that aged care attracts and retains women over 45, it seems that the industry should
recognise and celebrate this feature as a positive aspect of its workforce and not see it as a cause for
concern. What support mechanisms and workplace features are needed to meet the needs and
preferences of this age group so that the industry can continue to attract and retain this age group
and achieve its future growth?
ISSUE 2 –Agree benchmarks on the measure of workforce shortages in aged care
In recognition that, in 2012, over half of all vacancies were filled in less than three weeks what
should be the benchmark for the number of weeks, on average, to recruit staff to fill a vacancy
before it signals a shortage of staff across the industry?
ISSUE 3 – Aim for an overall workforce policy
Are enhanced recruitment, increased retention and improved productivity the right overall aims, and are the nine areas of strategic focus, the right platform for the development of policy and strategies to address aged care workforce issues?
ISSUE 4 – Need for detailed workforce planning
The Aged Care Workforce in Australia
Page | 4
How can the aged care industry, in association with government, best achieve detailed workforce
planning to estimate the number of workers needed in the short to medium future to assist in
developing recruitment strategies?
ISSUE 5 – How to secure additional staff to sustain industry growth
What mechanisms will be necessary, if any, to ensure that the industry can sustain the predicted
growth in workforce over the next decade?
What strategies are needed to ensure that the residential aged care sector can employ 17% more
additional staff each year in the future than it has over the recent past?
What strategies are needed to ensure that the community aged care sector can employ 7% more
additional staff each year in the future than has been recruited for the whole of the community aged
care and support services over the recent past?
Is there a need to attract more migrant workers with 457 visas to supplement workforce shortages
for specific locations?
ISSUE 6 – Improve the quality of education and training and investigate opportunities for career
pathway development
What is the best mechanism for increasing the quality of education and training programs for aged
care workers?
How care we develop career pathways that attract and retain aged care workers?
ISSUE 7 – Improve workplace culture and conditions
What industry wide mechanisms are available to improve remuneration and working conditions that
will increase job satisfaction for aged care workers and improve retention?
ISSUE 8 – Improve job satisfaction
How can we improve the understanding within the industry on the issue of job satisfaction and the
factors that influence it in order to increase retention and productivity (eg, pay, use of information
and communication technology, the impact of structural factors on job satisfaction such as the size
of facilities, the size of organisations, ownership status of service providers, balance between factors
that satisfy and those that dissatisfy).
ISSUE 9 – Improve management competencies in the aged care industry
What competencies should be targeted to improve those leadership and management practices that
have an impact on recruitment and retention?
ISSUE 10 – Improve information and community technology to enhance retention and productivity
What are the initiatives that are needed to improve the information and communication technology
capacity of the aged care sector to have a bearing on staff satisfaction, productivity, efficiency and
quality of care?
The Aged Care Workforce in Australia
Page | 5
How is knowledge about innovations in information technology disseminated across the aged care
system to assist all providers to adopt best practice?
Is there benefit in developing indicators of minimum standards in the adoption of best practice
information and communication technology to guide providers towards workforce reform?
Issue 11 – Improve mechanisms for developing changed models of care
What is the best mechanism to undertake large scale and more effective sector wide initiatives
examining work roles, cultural changes, services redesign and quality improvement rather than the
small scale localised projects of the recent past?
ISSUE 12– Preparing for future recruitment
If the skills required by the aged care industry in the future are different to those of the past what do
we need to do to identify what these skills are, who should have them and what changes need to be
made to recruitment strategies to prepare for the future?
Recommendations
If agreed, recommendations will be developed from the list of issues following the initial round of
discussions on the draft document.
The Aged Care Workforce in Australia
Page | 6
Introduction
Purpose and scope of this paper The purpose of this paper is to identify the range of issues that are facing the aged care industry in
Australia in relation to its current and future workforce. In commissioning this report, Aged and
Community Services Australia aims to stimulate debate towards a consensus on workforce issues
and to assist the industry and government to move towards a national framework that will provide a
platform for future workforce planning, policy and action. This paper does not set out to be a
workforce plan itself but to bring together the arguments towards the need for a national
comprehensive workforce plan to enable the industry to meet the demand for growth in the short to
medium term.
The scope of this paper is limited to the paid direct care staff in the residential aged care sector and
the community aged care sector in Australia. It does not set out to canvass all the issues facing
community aged support services provided under the HACC program and does not examine issues
related to volunteers and unpaid carers. Direct care workers are the object of concern as to their
supply and ability to deliver quality care. While acknowledging that the support and administrative
staff in both community and residential aged care provide an essential and valuable contribution to
the delivery of aged care, these staff have not been the subject of concern in relation to their supply
in recent years.
The paper is a synthesis of existing information and data; no original research was conducted to
compile it. This paper, in its current form, seeks responses rather than makes recommendations. A
final paper, including recommendations for policy, regulatory, funding and procedural responses,
will be developed by ACSA following receipt of responses to this paper.
The Aged Care Workforce in Australia
Page | 7
The aged care workforce This section describes the current aged care workforce and the recent trends in the workforce based
on the most contemporary information available at the time of the report. These trends, should they
continue, provide some guidance on the issues that the aged care industry needs to deal with in the
future, particularly over the coming decade of rapid expansion in both the community and
residential aged care sectors. The numbers and characteristics of residential aged care workers
reported in this section are taken from the report commissioned and published by the Australian
Government Department of Health and Ageing (King, Mavromaras, et al., 2013)1.
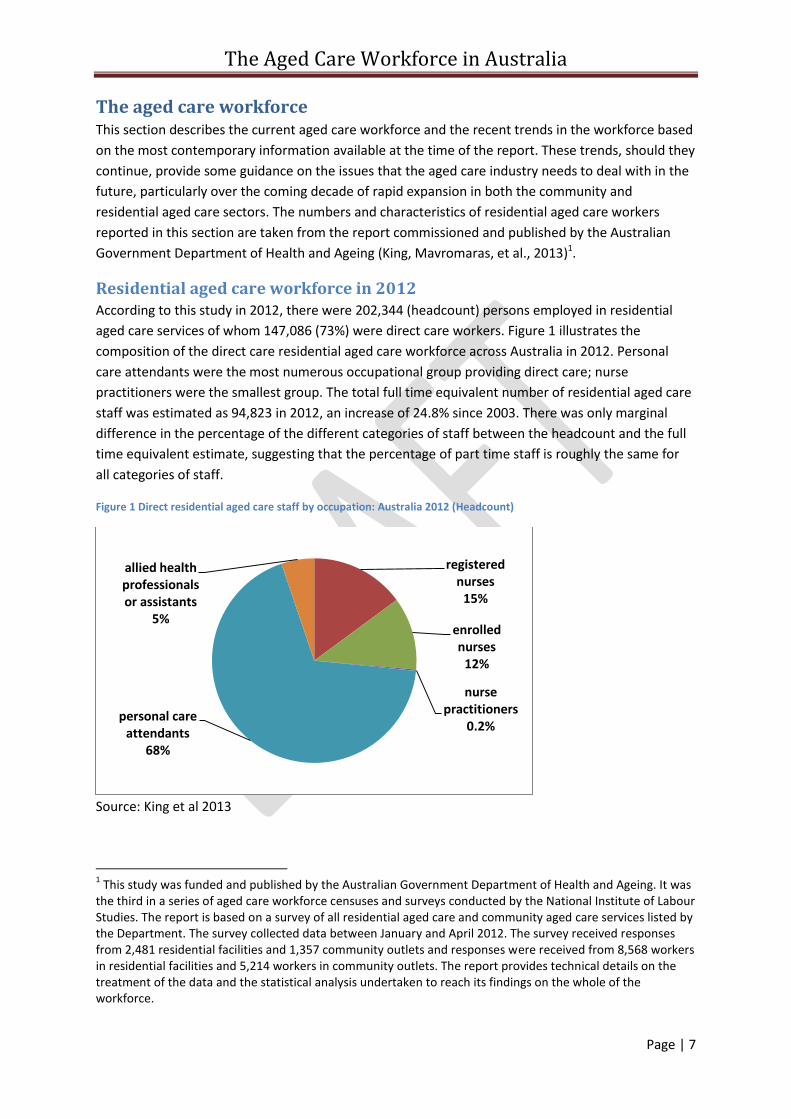
Residential aged care workforce in 2012 According to this study in 2012, there were 202,344 (headcount) persons employed in residential
aged care services of whom 147,086 (73%) were direct care workers. Figure 1 illustrates the
composition of the direct care residential aged care workforce across Australia in 2012. Personal
care attendants were the most numerous occupational group providing direct care; nurse
practitioners were the smallest group. The total full time equivalent number of residential aged care
staff was estimated as 94,823 in 2012, an increase of 24.8% since 2003. There was only marginal
difference in the percentage of the different categories of staff between the headcount and the full
time equivalent estimate, suggesting that the percentage of part time staff is roughly the same for
all categories of staff.
Figure 1 Direct residential aged care staff by occupation: Australia 2012 (Headcount)
Source: King et al 2013
1 This study was funded and published by the Australian Government Department of Health and Ageing. It was
the third in a series of aged care workforce censuses and surveys conducted by the National Institute of Labour Studies. The report is based on a survey of all residential aged care and community aged care services listed by the Department. The survey collected data between January and April 2012. The survey received responses from 2,481 residential facilities and 1,357 community outlets and responses were received from 8,568 workers in residential facilities and 5,214 workers in community outlets. The report provides technical details on the treatment of the data and the statistical analysis undertaken to reach its findings on the whole of the workforce.
registered nurses
15%
enrolled nurses
12%
nurse practitioners
0.2% personal care
attendants 68%
allied health professionals or assistants
5%
The Aged Care Workforce in Australia
Page | 8
King, Mavromaras and colleagues (2013) estimated the following profile of the residential care direct
care workforce in 2012 and the changes that occurred between 2003 and 2012. The proportion of:
men in direct care has increased from 7% in 2007 to 11% in 2012
permanent staff has increased 29% since 2003
registered nurses have declined by 6% since 2003
enrolled nurses have declined by 1.6% since 2003
personal care attendants has increased nearly 10%
the workforce
o aged over 55 years increase from 17% of all staff in 2003 to 27% of all staff in 2012
o born outside Australia increased from 25% on 2003, to 33% in 2007 and to 34% in
2012
o with certificate IV in aged care increased from 8% in 2003 to 20% in 2012.
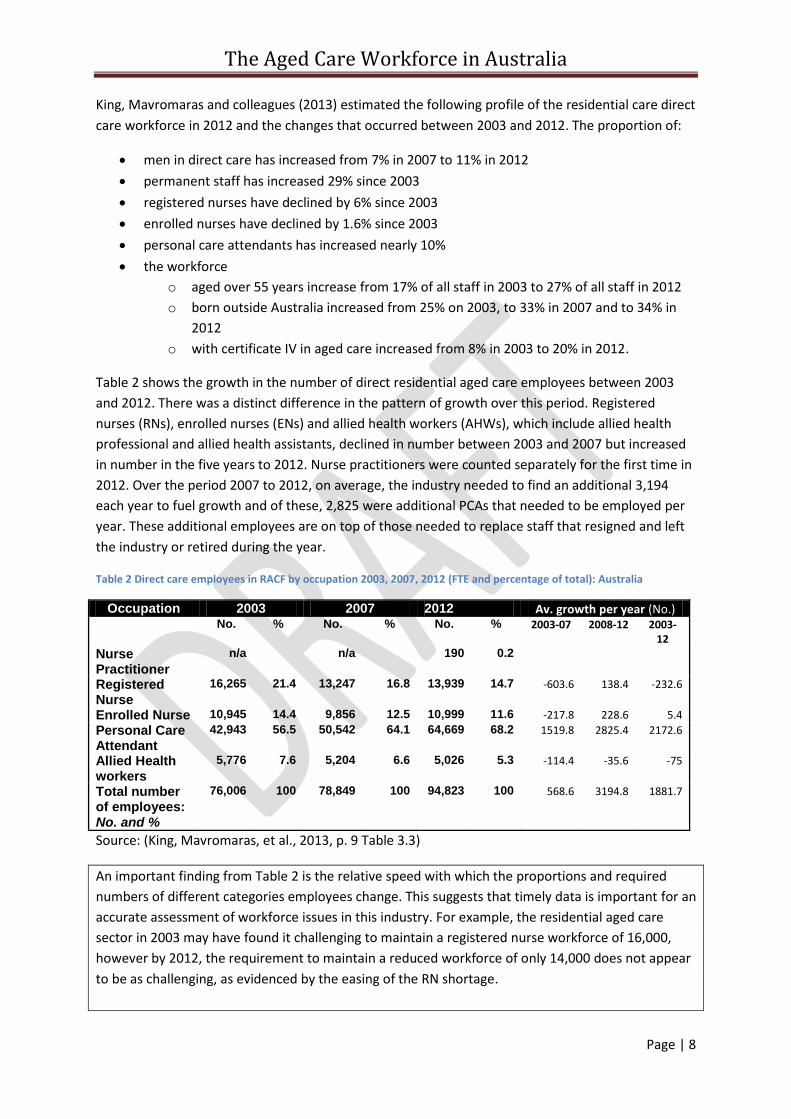
Table 2 shows the growth in the number of direct residential aged care employees between 2003
and 2012. There was a distinct difference in the pattern of growth over this period. Registered
nurses (RNs), enrolled nurses (ENs) and allied health workers (AHWs), which include allied health
professional and allied health assistants, declined in number between 2003 and 2007 but increased
in number in the five years to 2012. Nurse practitioners were counted separately for the first time in
2012. Over the period 2007 to 2012, on average, the industry needed to find an additional 3,194
each year to fuel growth and of these, 2,825 were additional PCAs that needed to be employed per
year. These additional employees are on top of those needed to replace staff that resigned and left
the industry or retired during the year.
Table 2 Direct care employees in RACF by occupation 2003, 2007, 2012 (FTE and percentage of total): Australia
Occupation 2003 2007 2012 Av. growth per year (No.) No. % No. % No. % 2003-07 2008-12 2003-
12
Nurse Practitioner
n/a n/a 190 0.2
Registered Nurse
16,265 21.4 13,247 16.8 13,939 14.7 -603.6 138.4 -232.6
Enrolled Nurse 10,945 14.4 9,856 12.5 10,999 11.6 -217.8 228.6 5.4
Personal Care Attendant
42,943 56.5 50,542 64.1 64,669 68.2 1519.8 2825.4 2172.6
Allied Health workers
5,776 7.6 5,204 6.6 5,026 5.3 -114.4 -35.6 -75
Total number of employees: No. and %
76,006 100 78,849 100 94,823 100 568.6 3194.8 1881.7
Source: (King, Mavromaras, et al., 2013, p. 9 Table 3.3)
An important finding from Table 2 is the relative speed with which the proportions and required
numbers of different categories employees change. This suggests that timely data is important for an
accurate assessment of workforce issues in this industry. For example, the residential aged care
sector in 2003 may have found it challenging to maintain a registered nurse workforce of 16,000,
however by 2012, the requirement to maintain a reduced workforce of only 14,000 does not appear
to be as challenging, as evidenced by the easing of the RN shortage.
The Aged Care Workforce in Australia
Page | 9
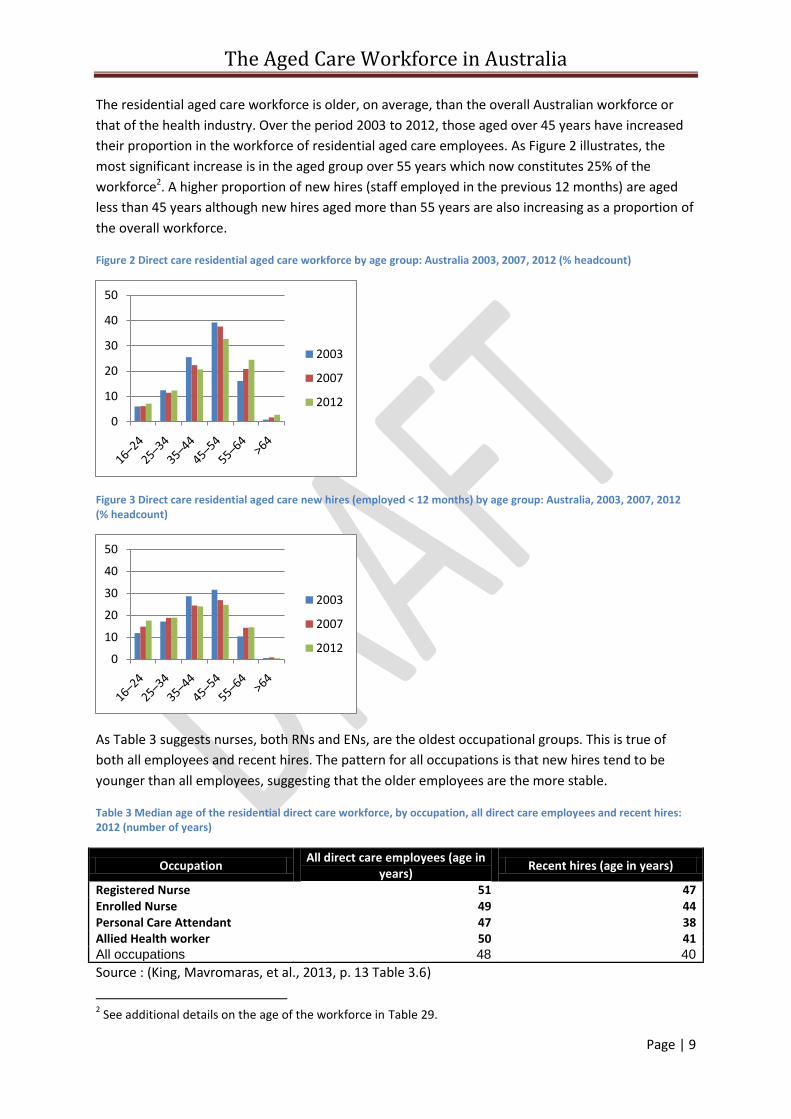
The residential aged care workforce is older, on average, than the overall Australian workforce or
that of the health industry. Over the period 2003 to 2012, those aged over 45 years have increased
their proportion in the workforce of residential aged care employees. As Figure 2 illustrates, the
most significant increase is in the aged group over 55 years which now constitutes 25% of the
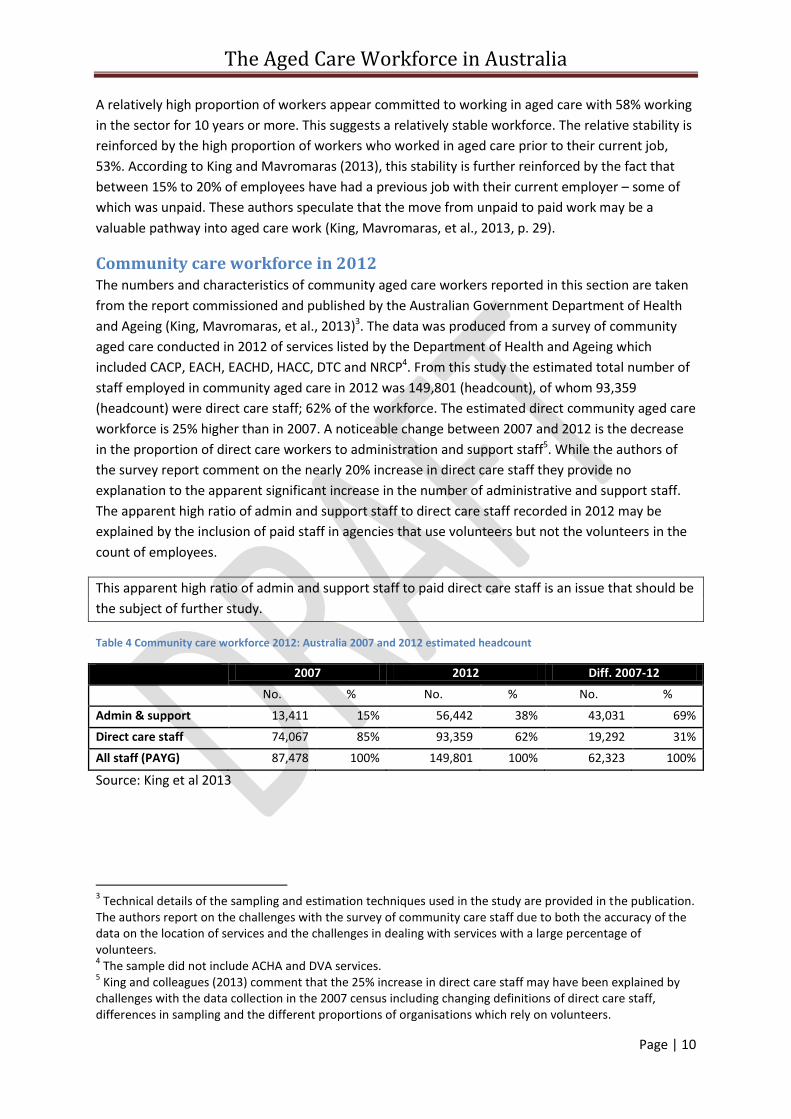
workforce2. A higher proportion of new hires (staff employed in the previous 12 months) are aged
less than 45 years although new hires aged more than 55 years are also increasing as a proportion of
the overall workforce.
Figure 2 Direct care residential aged care workforce by age group: Australia 2003, 2007, 2012 (% headcount)
Figure 3 Direct care residential aged care new hires (employed < 12 months) by age group: Australia, 2003, 2007, 2012 (% headcount)
As Table 3 suggests nurses, both RNs and ENs, are the oldest occupational groups. This is true of
both all employees and recent hires. The pattern for all occupations is that new hires tend to be
younger than all employees, suggesting that the older employees are the more stable.
Table 3 Median age of the residential direct care workforce, by occupation, all direct care employees and recent hires: 2012 (number of years)
Occupation All direct care employees (age in
years) Recent hires (age in years)
Registered Nurse 51 47 Enrolled Nurse 49 44 Personal Care Attendant 47 38 Allied Health worker 50 41 All occupations 48 40
Source : (King, Mavromaras, et al., 2013, p. 13 Table 3.6)
2 See additional details on the age of the workforce in Table 29.
0
10
20
30
40
50
2003
2007
2012
0
10
20
30
40
50
2003
2007
2012
The Aged Care Workforce in Australia
Page | 10
A relatively high proportion of workers appear committed to working in aged care with 58% working
in the sector for 10 years or more. This suggests a relatively stable workforce. The relative stability is
reinforced by the high proportion of workers who worked in aged care prior to their current job,
53%. According to King and Mavromaras (2013), this stability is further reinforced by the fact that
between 15% to 20% of employees have had a previous job with their current employer – some of
which was unpaid. These authors speculate that the move from unpaid to paid work may be a
valuable pathway into aged care work (King, Mavromaras, et al., 2013, p. 29).
Community care workforce in 2012 The numbers and characteristics of community aged care workers reported in this section are taken
from the report commissioned and published by the Australian Government Department of Health
and Ageing (King, Mavromaras, et al., 2013)3. The data was produced from a survey of community
aged care conducted in 2012 of services listed by the Department of Health and Ageing which
included CACP, EACH, EACHD, HACC, DTC and NRCP4. From this study the estimated total number of
staff employed in community aged care in 2012 was 149,801 (headcount), of whom 93,359
(headcount) were direct care staff; 62% of the workforce. The estimated direct community aged care
workforce is 25% higher than in 2007. A noticeable change between 2007 and 2012 is the decrease
in the proportion of direct care workers to administration and support staff5. While the authors of
the survey report comment on the nearly 20% increase in direct care staff they provide no
explanation to the apparent significant increase in the number of administrative and support staff.
The apparent high ratio of admin and support staff to direct care staff recorded in 2012 may be
explained by the inclusion of paid staff in agencies that use volunteers but not the volunteers in the
count of employees.
This apparent high ratio of admin and support staff to paid direct care staff is an issue that should be
the subject of further study.
Table 4 Community care workforce 2012: Australia 2007 and 2012 estimated headcount
2007 2012 Diff. 2007-12
No. % No. % No. %
Admin & support 13,411 15% 56,442 38% 43,031 69%
Direct care staff 74,067 85% 93,359 62% 19,292 31%
All staff (PAYG) 87,478 100% 149,801 100% 62,323 100%
Source: King et al 2013
3 Technical details of the sampling and estimation techniques used in the study are provided in the publication.
The authors report on the challenges with the survey of community care staff due to both the accuracy of the data on the location of services and the challenges in dealing with services with a large percentage of volunteers. 4 The sample did not include ACHA and DVA services.
5 King and colleagues (2013) comment that the 25% increase in direct care staff may have been explained by
challenges with the data collection in the 2007 census including changing definitions of direct care staff, differences in sampling and the different proportions of organisations which rely on volunteers.
The Aged Care Workforce in Australia
Page | 11
Table 5 shows the number and growth of full time equivalent staff employed in community aged
care between 2007 and 20126. As was seen in the growth of PCAs in the residential aged care
workforce (Table 2), the increase in the number of community care workers (CCW) accounted for
the majority of the growth in direct care staff in community aged care. RNs and NPs accounted for
only 6% of the growth, ENs 14% and AHW 15%.
In addition to the replacement of staff retiring and resigning from positions, the community aged
care sector was required to find 1,696 additional staff on average each year over this period to
satisfy growth in the sector. It appears to have achieved that reasonably successfully.
Table 5 Full-time equivalent direct care employees in the community aged care workforce, by occupation: 2007 and 2012 (estimated FTE and per cent)
Occupation 2007 2012 Growth in No.
Av. growth per year 07-12
% of total growth
No. % No. % No. No. %
Nurse Practitioner n/a 55 0.1 55 11 1%
Registered Nurse 6,079 13.2 6,544 12 465 93 5%
Enrolled Nurse 1,197 2.6 2,345 4.3 1,148 230 14%
Community Care Worker 35,832 77.8 41,394 75.9 5,562 1,112 66%
Allied Health workers 2,948 6.4 4,199 7.7 1,251 250 15%
Total number No. & % 46,056 100 54,537 100 8,481 1,696 100%
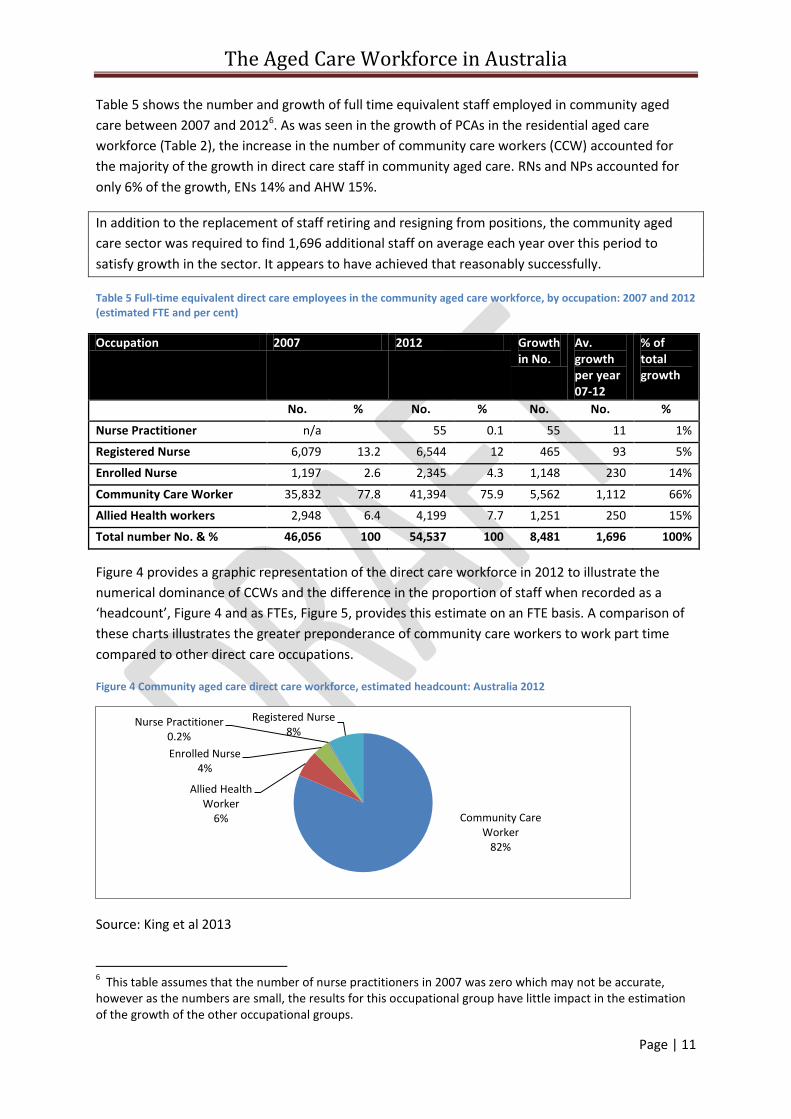
Figure 4 provides a graphic representation of the direct care workforce in 2012 to illustrate the
numerical dominance of CCWs and the difference in the proportion of staff when recorded as a
‘headcount’, Figure 4 and as FTEs, Figure 5, provides this estimate on an FTE basis. A comparison of
these charts illustrates the greater preponderance of community care workers to work part time
compared to other direct care occupations.
Figure 4 Community aged care direct care workforce, estimated headcount: Australia 2012
Source: King et al 2013
6 This table assumes that the number of nurse practitioners in 2007 was zero which may not be accurate,
however as the numbers are small, the results for this occupational group have little impact in the estimation of the growth of the other occupational groups.
Community Care Worker
82%
Allied Health Worker
6%
Enrolled Nurse 4%
Nurse Practitioner 0.2%
Registered Nurse 8%
The Aged Care Workforce in Australia
Page | 12
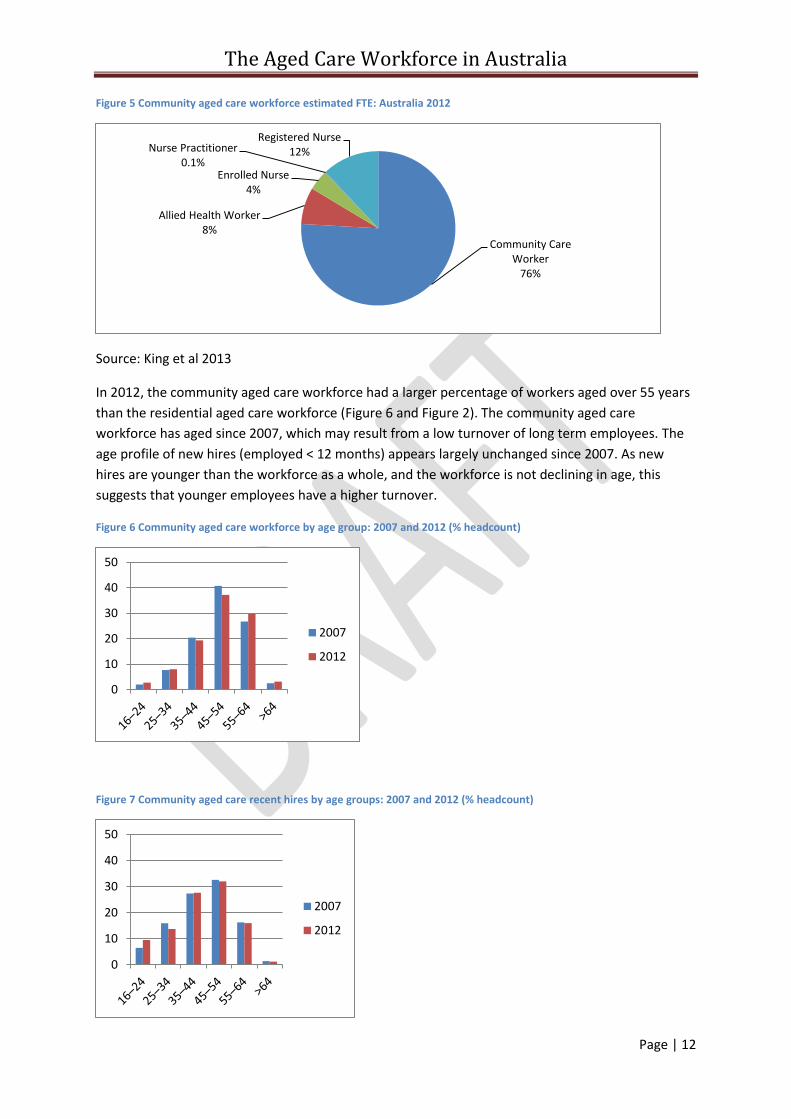
Figure 5 Community aged care workforce estimated FTE: Australia 2012
Source: King et al 2013
In 2012, the community aged care workforce had a larger percentage of workers aged over 55 years
than the residential aged care workforce (Figure 6 and Figure 2). The community aged care
workforce has aged since 2007, which may result from a low turnover of long term employees. The
age profile of new hires (employed < 12 months) appears largely unchanged since 2007. As new
hires are younger than the workforce as a whole, and the workforce is not declining in age, this
suggests that younger employees have a higher turnover.
Figure 6 Community aged care workforce by age group: 2007 and 2012 (% headcount)
Figure 7 Community aged care recent hires by age groups: 2007 and 2012 (% headcount)
Community Care Worker
76%
Allied Health Worker 8%
Enrolled Nurse 4%
Nurse Practitioner 0.1%
Registered Nurse 12%
0
10
20
30
40
50
2007
2012
0
10
20
30
40
50
2007
2012
The Aged Care Workforce in Australia
Page | 13
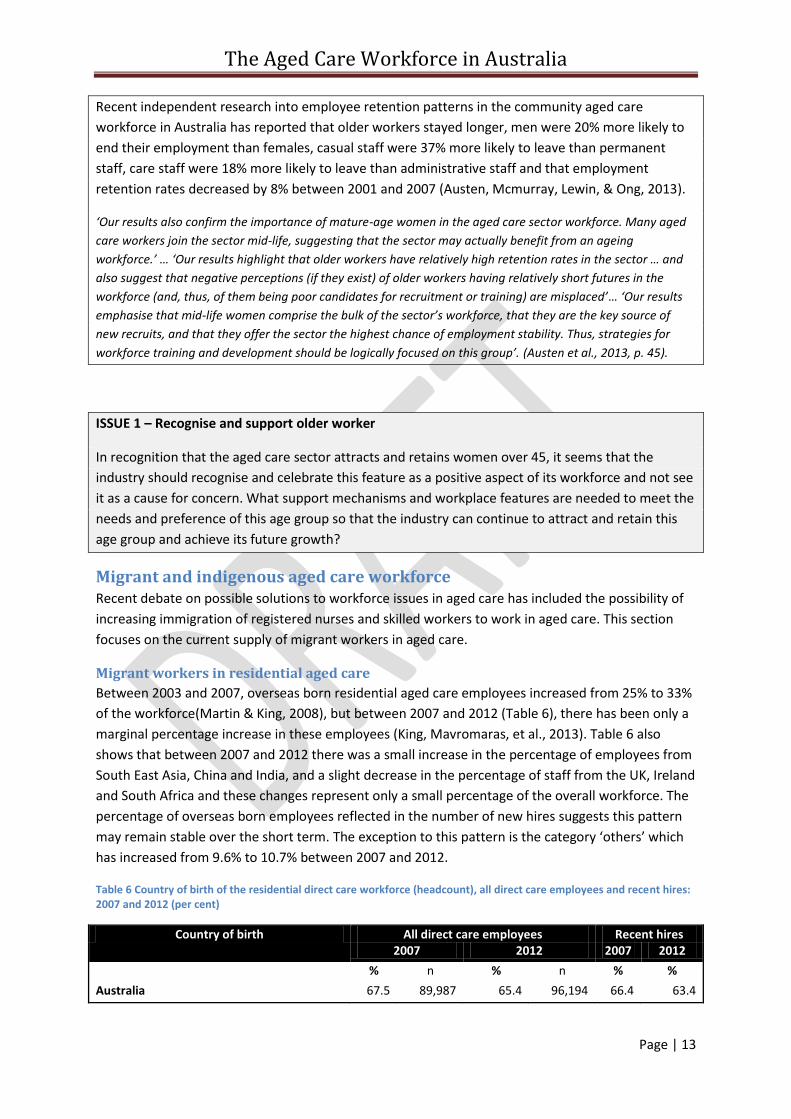
Recent independent research into employee retention patterns in the community aged care
workforce in Australia has reported that older workers stayed longer, men were 20% more likely to
end their employment than females, casual staff were 37% more likely to leave than permanent
staff, care staff were 18% more likely to leave than administrative staff and that employment
retention rates decreased by 8% between 2001 and 2007 (Austen, Mcmurray, Lewin, & Ong, 2013).
‘Our results also confirm the importance of mature-age women in the aged care sector workforce. Many aged
care workers join the sector mid-life, suggesting that the sector may actually benefit from an ageing
workforce.’ … ‘Our results highlight that older workers have relatively high retention rates in the sector … and
also suggest that negative perceptions (if they exist) of older workers having relatively short futures in the
workforce (and, thus, of them being poor candidates for recruitment or training) are misplaced’… ‘Our results
emphasise that mid-life women comprise the bulk of the sector’s workforce, that they are the key source of
new recruits, and that they offer the sector the highest chance of employment stability. Thus, strategies for
workforce training and development should be logically focused on this group’. (Austen et al., 2013, p. 45).
ISSUE 1 – Recognise and support older worker
In recognition that the aged care sector attracts and retains women over 45, it seems that the
industry should recognise and celebrate this feature as a positive aspect of its workforce and not see
it as a cause for concern. What support mechanisms and workplace features are needed to meet the
needs and preference of this age group so that the industry can continue to attract and retain this
age group and achieve its future growth?
Migrant and indigenous aged care workforce Recent debate on possible solutions to workforce issues in aged care has included the possibility of
increasing immigration of registered nurses and skilled workers to work in aged care. This section
focuses on the current supply of migrant workers in aged care.
Migrant workers in residential aged care
Between 2003 and 2007, overseas born residential aged care employees increased from 25% to 33%
of the workforce(Martin & King, 2008), but between 2007 and 2012 (Table 6), there has been only a
marginal percentage increase in these employees (King, Mavromaras, et al., 2013). Table 6 also
shows that between 2007 and 2012 there was a small increase in the percentage of employees from
South East Asia, China and India, and a slight decrease in the percentage of staff from the UK, Ireland
and South Africa and these changes represent only a small percentage of the overall workforce. The
percentage of overseas born employees reflected in the number of new hires suggests this pattern
may remain stable over the short term. The exception to this pattern is the category ‘others’ which
has increased from 9.6% to 10.7% between 2007 and 2012.
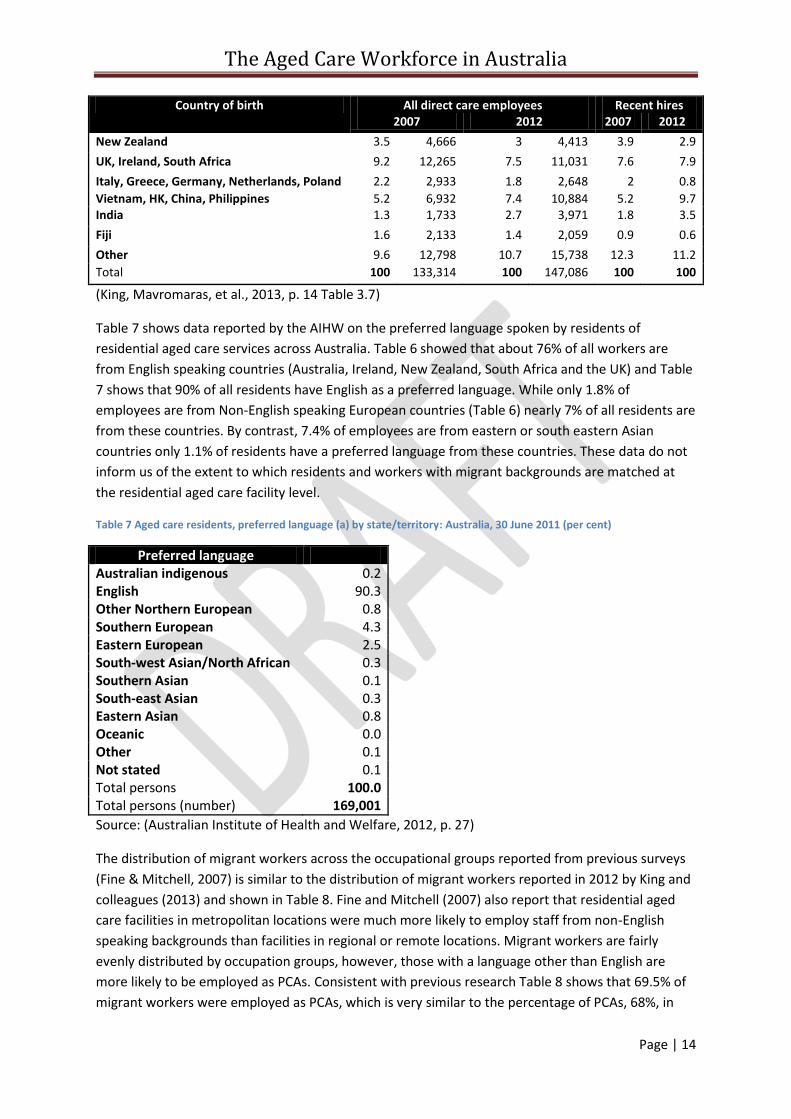
Table 6 Country of birth of the residential direct care workforce (headcount), all direct care employees and recent hires: 2007 and 2012 (per cent)
Country of birth All direct care employees Recent hires 2007 2012 2007 2012
% n % n % %
Australia 67.5 89,987 65.4 96,194 66.4 63.4
The Aged Care Workforce in Australia
Page | 14
Country of birth All direct care employees Recent hires 2007 2012 2007 2012
New Zealand 3.5 4,666 3 4,413 3.9 2.9
UK, Ireland, South Africa 9.2 12,265 7.5 11,031 7.6 7.9
Italy, Greece, Germany, Netherlands, Poland 2.2 2,933 1.8 2,648 2 0.8
Vietnam, HK, China, Philippines 5.2 6,932 7.4 10,884 5.2 9.7 India 1.3 1,733 2.7 3,971 1.8 3.5
Fiji 1.6 2,133 1.4 2,059 0.9 0.6
Other 9.6 12,798 10.7 15,738 12.3 11.2
Total 100 133,314 100 147,086 100 100
(King, Mavromaras, et al., 2013, p. 14 Table 3.7)
Table 7 shows data reported by the AIHW on the preferred language spoken by residents of
residential aged care services across Australia. Table 6 showed that about 76% of all workers are
from English speaking countries (Australia, Ireland, New Zealand, South Africa and the UK) and Table
7 shows that 90% of all residents have English as a preferred language. While only 1.8% of
employees are from Non-English speaking European countries (Table 6) nearly 7% of all residents are
from these countries. By contrast, 7.4% of employees are from eastern or south eastern Asian
countries only 1.1% of residents have a preferred language from these countries. These data do not
inform us of the extent to which residents and workers with migrant backgrounds are matched at
the residential aged care facility level.
Table 7 Aged care residents, preferred language (a) by state/territory: Australia, 30 June 2011 (per cent)
Preferred language Australian indigenous 0.2 English 90.3 Other Northern European 0.8 Southern European 4.3 Eastern European 2.5 South-west Asian/North African 0.3 Southern Asian 0.1 South-east Asian 0.3 Eastern Asian 0.8 Oceanic 0.0 Other 0.1 Not stated 0.1 Total persons 100.0 Total persons (number) 169,001
Source: (Australian Institute of Health and Welfare, 2012, p. 27)
The distribution of migrant workers across the occupational groups reported from previous surveys
(Fine & Mitchell, 2007) is similar to the distribution of migrant workers reported in 2012 by King and
colleagues (2013) and shown in Table 8. Fine and Mitchell (2007) also report that residential aged
care facilities in metropolitan locations were much more likely to employ staff from non-English
speaking backgrounds than facilities in regional or remote locations. Migrant workers are fairly
evenly distributed by occupation groups, however, those with a language other than English are
more likely to be employed as PCAs. Consistent with previous research Table 8 shows that 69.5% of
migrant workers were employed as PCAs, which is very similar to the percentage of PCAs, 68%, in
The Aged Care Workforce in Australia
Page | 15
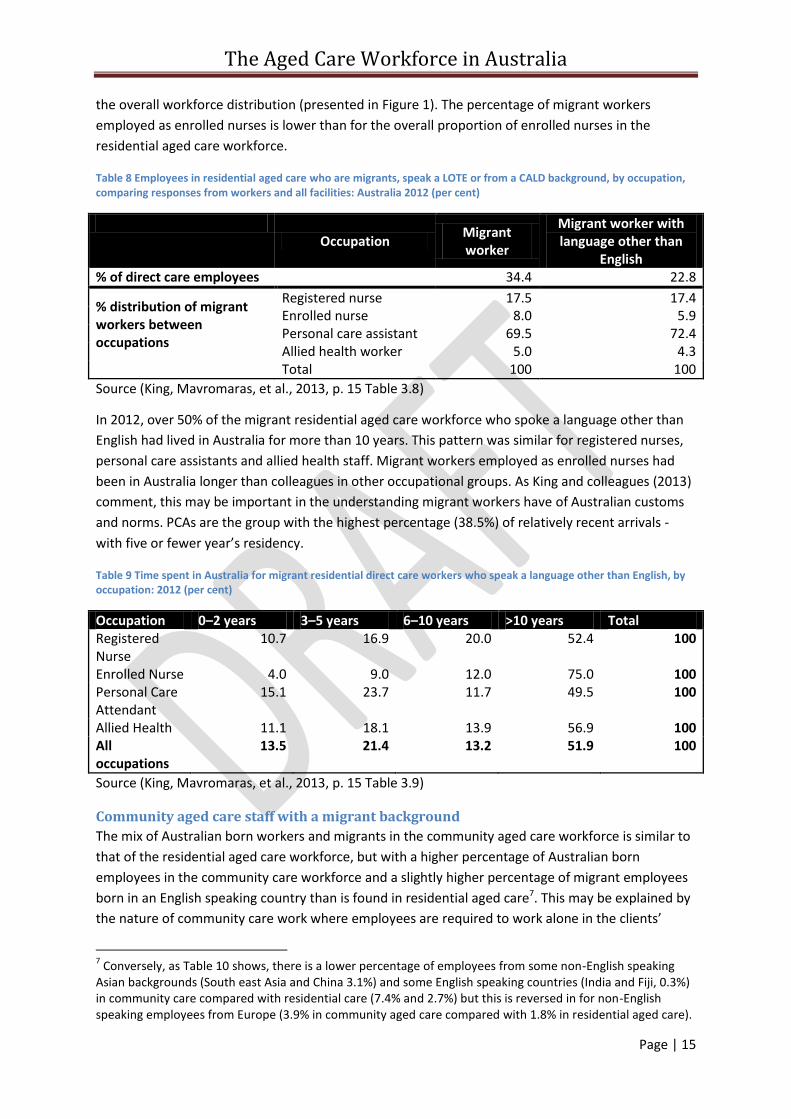
the overall workforce distribution (presented in Figure 1). The percentage of migrant workers
employed as enrolled nurses is lower than for the overall proportion of enrolled nurses in the
residential aged care workforce.
Table 8 Employees in residential aged care who are migrants, speak a LOTE or from a CALD background, by occupation, comparing responses from workers and all facilities: Australia 2012 (per cent)
Occupation
Migrant worker
Migrant worker with language other than
English % of direct care employees 34.4 22.8
% distribution of migrant workers between occupations
Registered nurse 17.5 17.4 Enrolled nurse 8.0 5.9 Personal care assistant 69.5 72.4 Allied health worker 5.0 4.3
Total 100 100
Source (King, Mavromaras, et al., 2013, p. 15 Table 3.8)
In 2012, over 50% of the migrant residential aged care workforce who spoke a language other than
English had lived in Australia for more than 10 years. This pattern was similar for registered nurses,
personal care assistants and allied health staff. Migrant workers employed as enrolled nurses had
been in Australia longer than colleagues in other occupational groups. As King and colleagues (2013)
comment, this may be important in the understanding migrant workers have of Australian customs
and norms. PCAs are the group with the highest percentage (38.5%) of relatively recent arrivals -
with five or fewer year’s residency.
Table 9 Time spent in Australia for migrant residential direct care workers who speak a language other than English, by occupation: 2012 (per cent)
Occupation 0–2 years 3–5 years 6–10 years >10 years Total Registered Nurse
10.7 16.9 20.0 52.4 100
Enrolled Nurse 4.0 9.0 12.0 75.0 100 Personal Care Attendant
15.1 23.7 11.7 49.5 100
Allied Health 11.1 18.1 13.9 56.9 100 All occupations
13.5 21.4 13.2 51.9 100
Source (King, Mavromaras, et al., 2013, p. 15 Table 3.9)
Community aged care staff with a migrant background
The mix of Australian born workers and migrants in the community aged care workforce is similar to
that of the residential aged care workforce, but with a higher percentage of Australian born
employees in the community care workforce and a slightly higher percentage of migrant employees
born in an English speaking country than is found in residential aged care7. This may be explained by
the nature of community care work where employees are required to work alone in the clients’
7 Conversely, as Table 10 shows, there is a lower percentage of employees from some non-English speaking
Asian backgrounds (South east Asia and China 3.1%) and some English speaking countries (India and Fiji, 0.3%) in community care compared with residential care (7.4% and 2.7%) but this is reversed in for non-English speaking employees from Europe (3.9% in community aged care compared with 1.8% in residential aged care).
The Aged Care Workforce in Australia
Page | 16
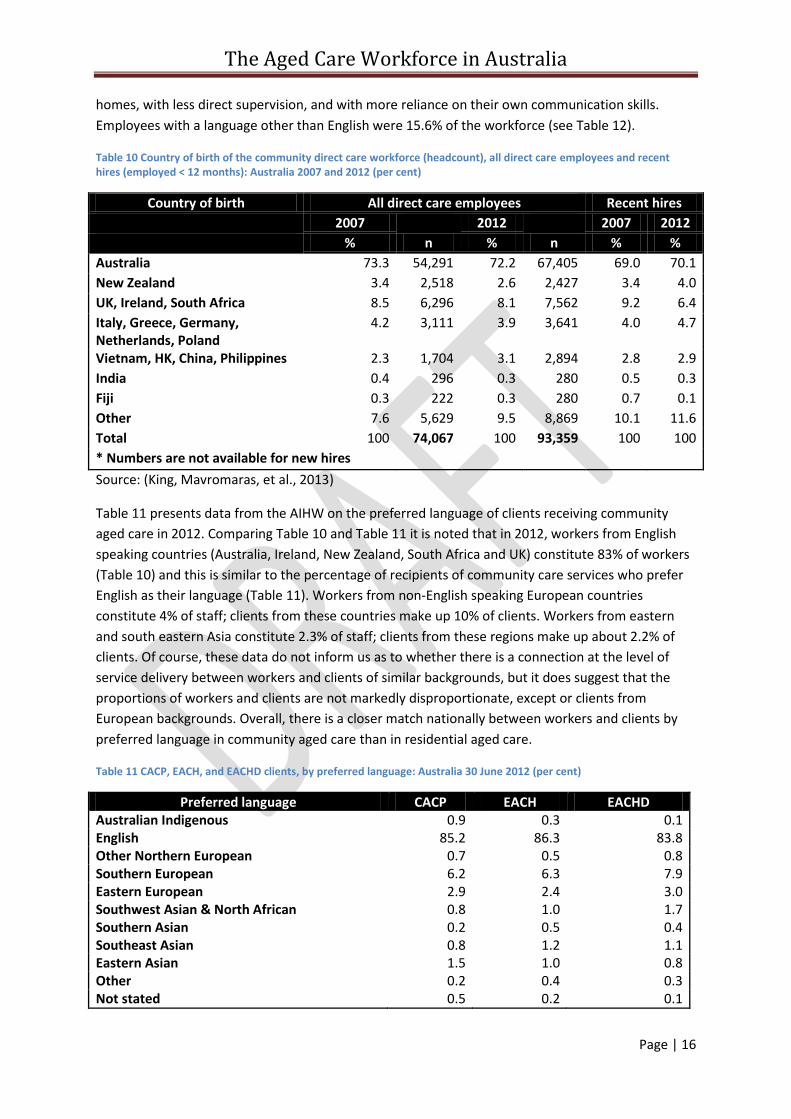
homes, with less direct supervision, and with more reliance on their own communication skills.
Employees with a language other than English were 15.6% of the workforce (see Table 12).
Table 10 Country of birth of the community direct care workforce (headcount), all direct care employees and recent hires (employed < 12 months): Australia 2007 and 2012 (per cent)
Country of birth All direct care employees Recent hires
2007 2012 2007 2012
% n % n % %
Australia 73.3 54,291 72.2 67,405 69.0 70.1
New Zealand 3.4 2,518 2.6 2,427 3.4 4.0
UK, Ireland, South Africa 8.5 6,296 8.1 7,562 9.2 6.4
Italy, Greece, Germany, Netherlands, Poland
4.2 3,111 3.9 3,641 4.0 4.7
Vietnam, HK, China, Philippines 2.3 1,704 3.1 2,894 2.8 2.9
India 0.4 296 0.3 280 0.5 0.3
Fiji 0.3 222 0.3 280 0.7 0.1
Other 7.6 5,629 9.5 8,869 10.1 11.6
Total 100 74,067 100 93,359 100 100
* Numbers are not available for new hires
Source: (King, Mavromaras, et al., 2013)
Table 11 presents data from the AIHW on the preferred language of clients receiving community
aged care in 2012. Comparing Table 10 and Table 11 it is noted that in 2012, workers from English
speaking countries (Australia, Ireland, New Zealand, South Africa and UK) constitute 83% of workers
(Table 10) and this is similar to the percentage of recipients of community care services who prefer
English as their language (Table 11). Workers from non-English speaking European countries
constitute 4% of staff; clients from these countries make up 10% of clients. Workers from eastern
and south eastern Asia constitute 2.3% of staff; clients from these regions make up about 2.2% of
clients. Of course, these data do not inform us as to whether there is a connection at the level of
service delivery between workers and clients of similar backgrounds, but it does suggest that the
proportions of workers and clients are not markedly disproportionate, except or clients from
European backgrounds. Overall, there is a closer match nationally between workers and clients by
preferred language in community aged care than in residential aged care.
Table 11 CACP, EACH, and EACHD clients, by preferred language: Australia 30 June 2012 (per cent)
Preferred language CACP EACH EACHD Australian Indigenous 0.9 0.3 0.1 English 85.2 86.3 83.8 Other Northern European 0.7 0.5 0.8 Southern European 6.2 6.3 7.9 Eastern European 2.9 2.4 3.0 Southwest Asian & North African 0.8 1.0 1.7 Southern Asian 0.2 0.5 0.4 Southeast Asian 0.8 1.2 1.1 Eastern Asian 1.5 1.0 0.8 Other 0.2 0.4 0.3 Not stated 0.5 0.2 0.1
The Aged Care Workforce in Australia
Page | 17
Preferred language CACP EACH EACHD Total (per cent) 100.0 100.0 100.0 Total clients (number) 42,892 7,757 3,383
Source: (Australian Institute of Health and Welfare, 2014, p. Table S1.13)
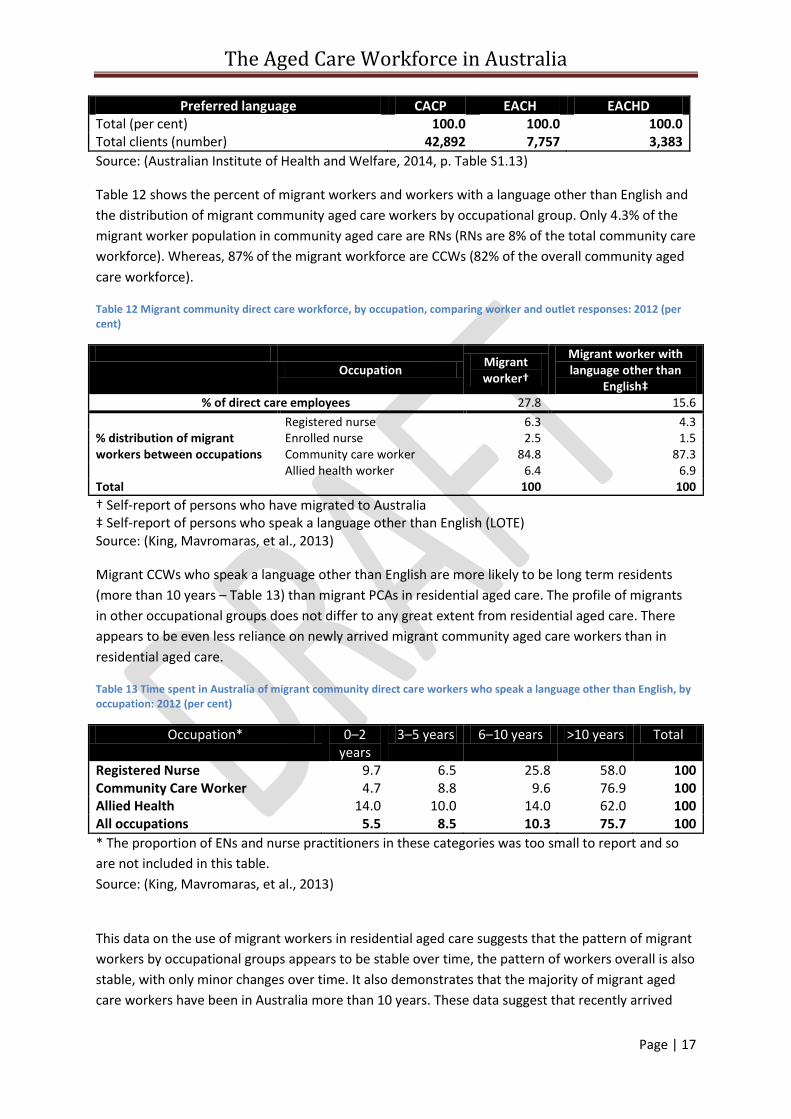
Table 12 shows the percent of migrant workers and workers with a language other than English and
the distribution of migrant community aged care workers by occupational group. Only 4.3% of the
migrant worker population in community aged care are RNs (RNs are 8% of the total community care
workforce). Whereas, 87% of the migrant workforce are CCWs (82% of the overall community aged
care workforce).
Table 12 Migrant community direct care workforce, by occupation, comparing worker and outlet responses: 2012 (per cent)
Occupation
Migrant worker†
Migrant worker with language other than
English‡ % of direct care employees 27.8 15.6
% distribution of migrant workers between occupations
Registered nurse 6.3 4.3 Enrolled nurse 2.5 1.5 Community care worker 84.8 87.3 Allied health worker 6.4 6.9
Total 100 100
† Self-report of persons who have migrated to Australia ‡ Self-report of persons who speak a language other than English (LOTE) Source: (King, Mavromaras, et al., 2013)
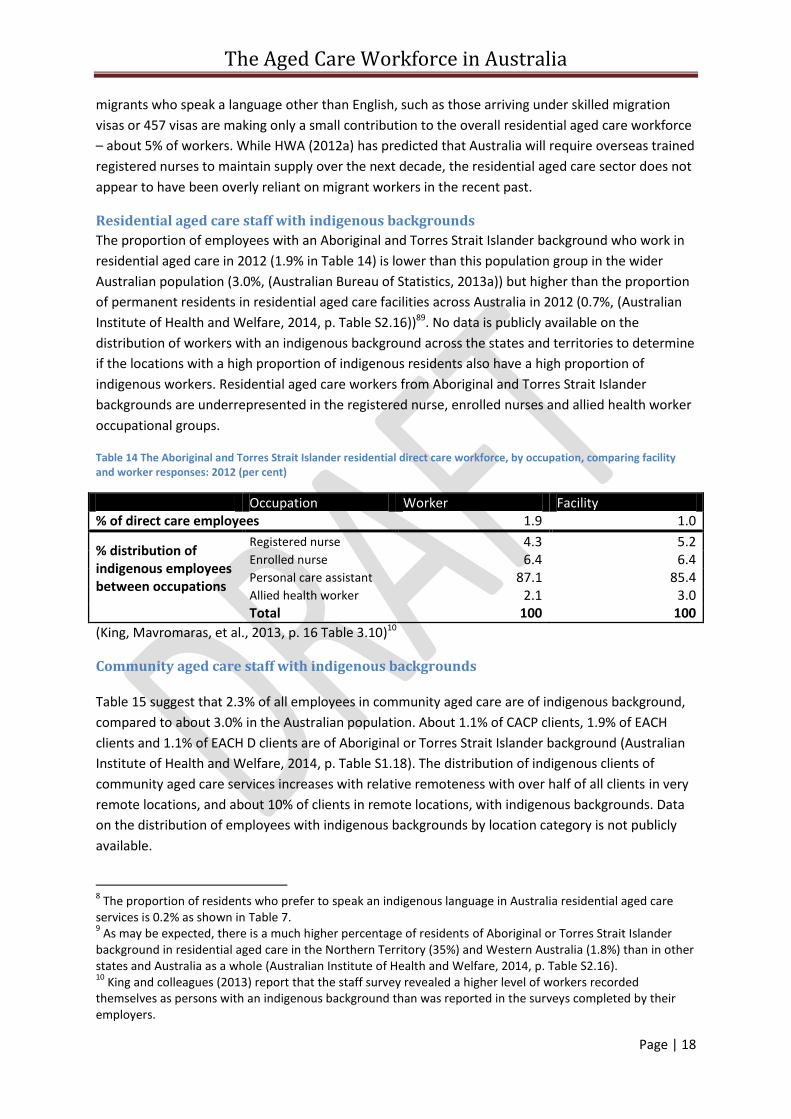
Migrant CCWs who speak a language other than English are more likely to be long term residents
(more than 10 years – Table 13) than migrant PCAs in residential aged care. The profile of migrants
in other occupational groups does not differ to any great extent from residential aged care. There
appears to be even less reliance on newly arrived migrant community aged care workers than in
residential aged care.
Table 13 Time spent in Australia of migrant community direct care workers who speak a language other than English, by occupation: 2012 (per cent)
Occupation* 0–2 years
3–5 years 6–10 years >10 years Total
Registered Nurse 9.7 6.5 25.8 58.0 100 Community Care Worker 4.7 8.8 9.6 76.9 100 Allied Health 14.0 10.0 14.0 62.0 100 All occupations 5.5 8.5 10.3 75.7 100
* The proportion of ENs and nurse practitioners in these categories was too small to report and so
are not included in this table.
Source: (King, Mavromaras, et al., 2013)
This data on the use of migrant workers in residential aged care suggests that the pattern of migrant
workers by occupational groups appears to be stable over time, the pattern of workers overall is also
stable, with only minor changes over time. It also demonstrates that the majority of migrant aged
care workers have been in Australia more than 10 years. These data suggest that recently arrived
The Aged Care Workforce in Australia
Page | 18
migrants who speak a language other than English, such as those arriving under skilled migration
visas or 457 visas are making only a small contribution to the overall residential aged care workforce
– about 5% of workers. While HWA (2012a) has predicted that Australia will require overseas trained
registered nurses to maintain supply over the next decade, the residential aged care sector does not
appear to have been overly reliant on migrant workers in the recent past.
Residential aged care staff with indigenous backgrounds
The proportion of employees with an Aboriginal and Torres Strait Islander background who work in
residential aged care in 2012 (1.9% in Table 14) is lower than this population group in the wider
Australian population (3.0%, (Australian Bureau of Statistics, 2013a)) but higher than the proportion
of permanent residents in residential aged care facilities across Australia in 2012 (0.7%, (Australian
Institute of Health and Welfare, 2014, p. Table S2.16))89. No data is publicly available on the
distribution of workers with an indigenous background across the states and territories to determine
if the locations with a high proportion of indigenous residents also have a high proportion of
indigenous workers. Residential aged care workers from Aboriginal and Torres Strait Islander
backgrounds are underrepresented in the registered nurse, enrolled nurses and allied health worker
occupational groups.
Table 14 The Aboriginal and Torres Strait Islander residential direct care workforce, by occupation, comparing facility and worker responses: 2012 (per cent)
Occupation Worker Facility % of direct care employees 1.9 1.0
% distribution of indigenous employees between occupations
Registered nurse 4.3 5.2 Enrolled nurse 6.4 6.4 Personal care assistant 87.1 85.4 Allied health worker 2.1 3.0
Total 100 100
(King, Mavromaras, et al., 2013, p. 16 Table 3.10)10
Community aged care staff with indigenous backgrounds
Table 15 suggest that 2.3% of all employees in community aged care are of indigenous background,
compared to about 3.0% in the Australian population. About 1.1% of CACP clients, 1.9% of EACH
clients and 1.1% of EACH D clients are of Aboriginal or Torres Strait Islander background (Australian
Institute of Health and Welfare, 2014, p. Table S1.18). The distribution of indigenous clients of
community aged care services increases with relative remoteness with over half of all clients in very
remote locations, and about 10% of clients in remote locations, with indigenous backgrounds. Data
on the distribution of employees with indigenous backgrounds by location category is not publicly
available.
8 The proportion of residents who prefer to speak an indigenous language in Australia residential aged care
services is 0.2% as shown in Table 7. 9 As may be expected, there is a much higher percentage of residents of Aboriginal or Torres Strait Islander
background in residential aged care in the Northern Territory (35%) and Western Australia (1.8%) than in other states and Australia as a whole (Australian Institute of Health and Welfare, 2014, p. Table S2.16). 10
King and colleagues (2013) report that the staff survey revealed a higher level of workers recorded themselves as persons with an indigenous background than was reported in the surveys completed by their employers.
The Aged Care Workforce in Australia
Page | 19
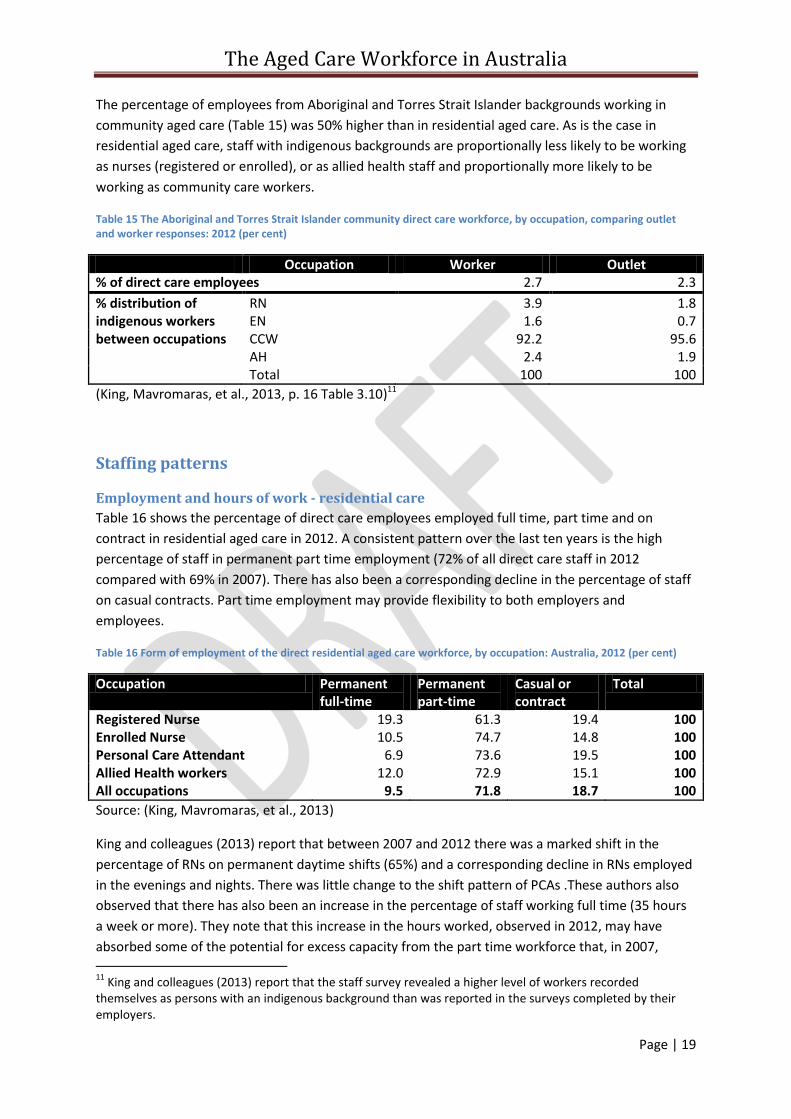
The percentage of employees from Aboriginal and Torres Strait Islander backgrounds working in
community aged care (Table 15) was 50% higher than in residential aged care. As is the case in
residential aged care, staff with indigenous backgrounds are proportionally less likely to be working
as nurses (registered or enrolled), or as allied health staff and proportionally more likely to be
working as community care workers.
Table 15 The Aboriginal and Torres Strait Islander community direct care workforce, by occupation, comparing outlet and worker responses: 2012 (per cent)
Occupation Worker Outlet % of direct care employees 2.7 2.3
% distribution of indigenous workers between occupations
RN 3.9 1.8 EN 1.6 0.7 CCW 92.2 95.6 AH 2.4 1.9
Total 100 100
(King, Mavromaras, et al., 2013, p. 16 Table 3.10)11
Staffing patterns
Employment and hours of work - residential care
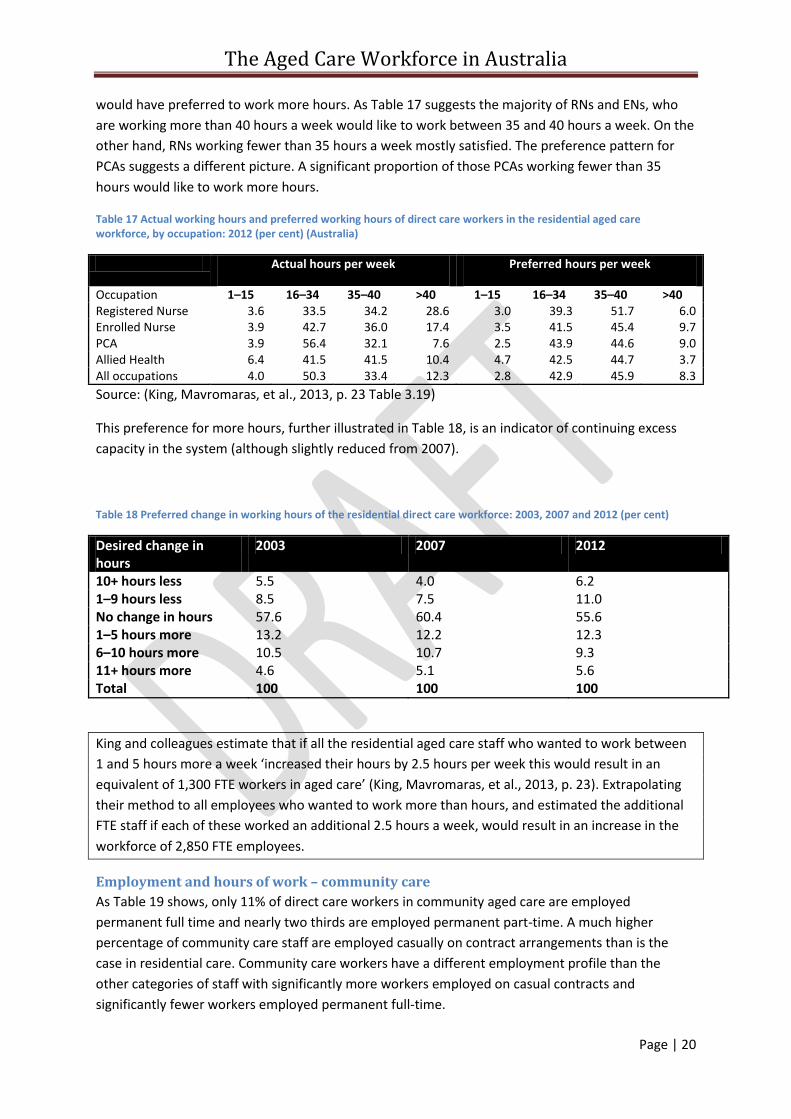
Table 16 shows the percentage of direct care employees employed full time, part time and on
contract in residential aged care in 2012. A consistent pattern over the last ten years is the high
percentage of staff in permanent part time employment (72% of all direct care staff in 2012
compared with 69% in 2007). There has also been a corresponding decline in the percentage of staff
on casual contracts. Part time employment may provide flexibility to both employers and
employees.
Table 16 Form of employment of the direct residential aged care workforce, by occupation: Australia, 2012 (per cent)
Occupation Permanent full-time
Permanent part-time
Casual or contract
Total
Registered Nurse 19.3 61.3 19.4 100 Enrolled Nurse 10.5 74.7 14.8 100 Personal Care Attendant 6.9 73.6 19.5 100 Allied Health workers 12.0 72.9 15.1 100 All occupations 9.5 71.8 18.7 100
Source: (King, Mavromaras, et al., 2013)
King and colleagues (2013) report that between 2007 and 2012 there was a marked shift in the
percentage of RNs on permanent daytime shifts (65%) and a corresponding decline in RNs employed
in the evenings and nights. There was little change to the shift pattern of PCAs .These authors also
observed that there has also been an increase in the percentage of staff working full time (35 hours
a week or more). They note that this increase in the hours worked, observed in 2012, may have
absorbed some of the potential for excess capacity from the part time workforce that, in 2007, 11
King and colleagues (2013) report that the staff survey revealed a higher level of workers recorded themselves as persons with an indigenous background than was reported in the surveys completed by their employers.
The Aged Care Workforce in Australia
Page | 20
would have preferred to work more hours. As Table 17 suggests the majority of RNs and ENs, who
are working more than 40 hours a week would like to work between 35 and 40 hours a week. On the
other hand, RNs working fewer than 35 hours a week mostly satisfied. The preference pattern for
PCAs suggests a different picture. A significant proportion of those PCAs working fewer than 35
hours would like to work more hours.
Table 17 Actual working hours and preferred working hours of direct care workers in the residential aged care workforce, by occupation: 2012 (per cent) (Australia)
Actual hours per week Preferred hours per week
Occupation 1–15 16–34 35–40 >40 1–15 16–34 35–40 >40 Registered Nurse 3.6 33.5 34.2 28.6 3.0 39.3 51.7 6.0 Enrolled Nurse 3.9 42.7 36.0 17.4 3.5 41.5 45.4 9.7 PCA 3.9 56.4 32.1 7.6 2.5 43.9 44.6 9.0 Allied Health 6.4 41.5 41.5 10.4 4.7 42.5 44.7 3.7 All occupations 4.0 50.3 33.4 12.3 2.8 42.9 45.9 8.3
Source: (King, Mavromaras, et al., 2013, p. 23 Table 3.19)
This preference for more hours, further illustrated in Table 18, is an indicator of continuing excess
capacity in the system (although slightly reduced from 2007).
Table 18 Preferred change in working hours of the residential direct care workforce: 2003, 2007 and 2012 (per cent)
Desired change in hours
2003 2007 2012
10+ hours less 5.5 4.0 6.2 1–9 hours less 8.5 7.5 11.0 No change in hours 57.6 60.4 55.6 1–5 hours more 13.2 12.2 12.3 6–10 hours more 10.5 10.7 9.3 11+ hours more 4.6 5.1 5.6 Total 100 100 100
King and colleagues estimate that if all the residential aged care staff who wanted to work between
1 and 5 hours more a week ‘increased their hours by 2.5 hours per week this would result in an
equivalent of 1,300 FTE workers in aged care’ (King, Mavromaras, et al., 2013, p. 23). Extrapolating
their method to all employees who wanted to work more than hours, and estimated the additional
FTE staff if each of these worked an additional 2.5 hours a week, would result in an increase in the
workforce of 2,850 FTE employees.
Employment and hours of work – community care
As Table 19 shows, only 11% of direct care workers in community aged care are employed
permanent full time and nearly two thirds are employed permanent part-time. A much higher
percentage of community care staff are employed casually on contract arrangements than is the
case in residential care. Community care workers have a different employment profile than the
other categories of staff with significantly more workers employed on casual contracts and
significantly fewer workers employed permanent full-time.
The Aged Care Workforce in Australia
Page | 21
Table 19 Form of employment of the community direct care workforce, by occupation: 2012 (per cent)
Occupation Permanent full-time
Permanent part-time
Casual or Contract
Total
Registered Nurse 32.6 53.3 14.2 100 Enrolled Nurse 17.0 67.2 15.8 100 Community Care Worker 6.7 62.9 30.4 100 Allied Health 27.4 60.0 12.5 100 All occupations 10.6 62.1 27.3 100
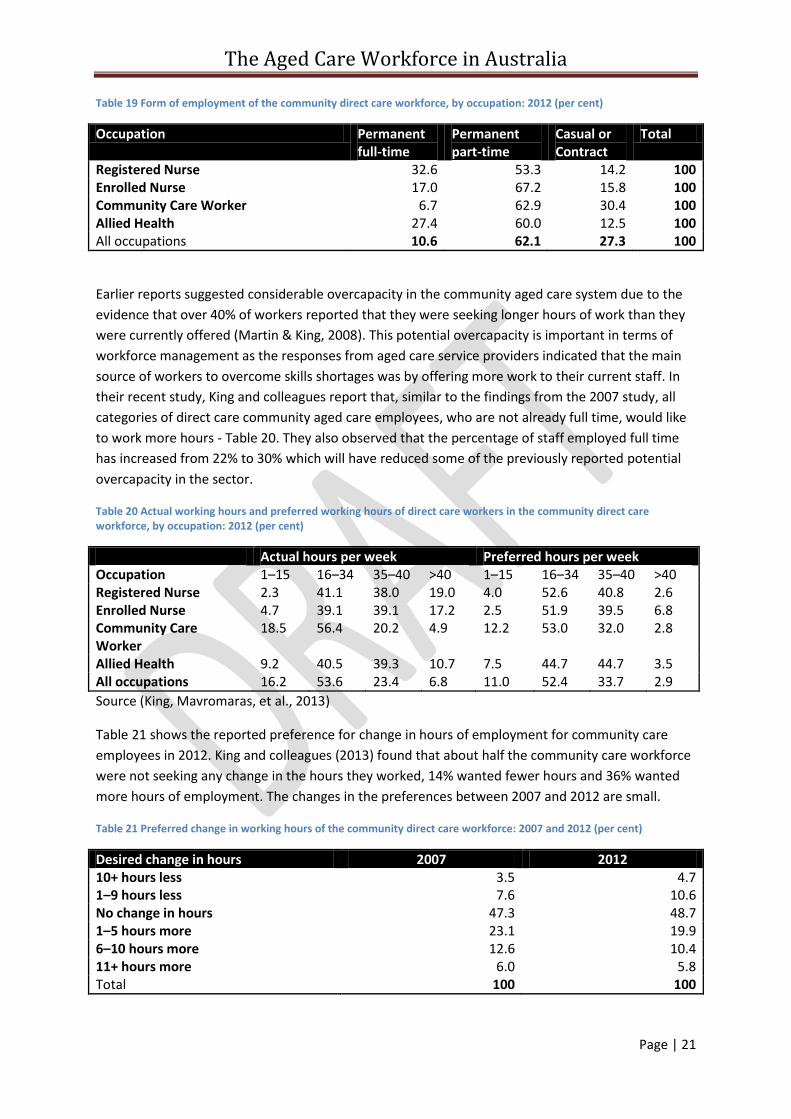
Earlier reports suggested considerable overcapacity in the community aged care system due to the
evidence that over 40% of workers reported that they were seeking longer hours of work than they
were currently offered (Martin & King, 2008). This potential overcapacity is important in terms of
workforce management as the responses from aged care service providers indicated that the main
source of workers to overcome skills shortages was by offering more work to their current staff. In
their recent study, King and colleagues report that, similar to the findings from the 2007 study, all
categories of direct care community aged care employees, who are not already full time, would like
to work more hours - Table 20. They also observed that the percentage of staff employed full time
has increased from 22% to 30% which will have reduced some of the previously reported potential
overcapacity in the sector.
Table 20 Actual working hours and preferred working hours of direct care workers in the community direct care workforce, by occupation: 2012 (per cent)
Actual hours per week Preferred hours per week Occupation 1–15 16–34 35–40 >40 1–15 16–34 35–40 >40 Registered Nurse 2.3 41.1 38.0 19.0 4.0 52.6 40.8 2.6 Enrolled Nurse 4.7 39.1 39.1 17.2 2.5 51.9 39.5 6.8 Community Care Worker
18.5 56.4 20.2 4.9 12.2 53.0 32.0 2.8
Allied Health 9.2 40.5 39.3 10.7 7.5 44.7 44.7 3.5 All occupations 16.2 53.6 23.4 6.8 11.0 52.4 33.7 2.9
Source (King, Mavromaras, et al., 2013)
Table 21 shows the reported preference for change in hours of employment for community care
employees in 2012. King and colleagues (2013) found that about half the community care workforce
were not seeking any change in the hours they worked, 14% wanted fewer hours and 36% wanted
more hours of employment. The changes in the preferences between 2007 and 2012 are small.
Table 21 Preferred change in working hours of the community direct care workforce: 2007 and 2012 (per cent)
Desired change in hours 2007 2012 10+ hours less 3.5 4.7 1–9 hours less 7.6 10.6 No change in hours 47.3 48.7 1–5 hours more 23.1 19.9 6–10 hours more 12.6 10.4 11+ hours more 6.0 5.8 Total 100 100
The Aged Care Workforce in Australia
Page | 22
The same method that King and colleagues used to estimate the potential additional hours for
residential aged care staff has been applied to community aged care employees. If all those who
wanted to work an additional 1 to 5 hours a week worked an additional 2.5 hours a week, this would
increase the workforce by 1,330. If all the employees who wanted to work more hours were granted
an additional 2.5 hours a week, this would be the equivalent of an additional 2,407 FTE community
care employees.
Employment arrangements
Employment arrangements - residential aged care
About three quarters of all residential aged care staff are employed under enterprise agreements
and a further 23% are employed under an award, leaving only a small percentage employed by
contract or individual agreement (King, Mavromaras, et al., 2013). Contractors provided through an
agency was the most common arrangement used for employing staff other than through an
employment arrangement. In the recent survey, over half of all facilities reported that they used
agency staff in the two weeks prior to the survey and they were much more likely to use agencies for
RNs or PCAs than for other categories of staff. There were regional differences in the use of agency
staff. About 30% of facilities in ACT, NSW, Victoria, and WA used agency staff for RNs while over 45%
of facilities in Tasmania and South Australia used agency staff in 2012.
The relative use of agencies did not alter much between the RNs and PCAs. However, the variation
over time between the states shows marked differences in patterns of use. A smaller proportion of
ACT facilities used agency staff in 2012 compared to previous years, while in NSW, Victoria,
Queensland and Tasmania the proportion of facilities using agency staff went up and for NT, SA and
WA, it remained the same.
Employment arrangements - Community aged care
Similar to residential aged care, the most common form of establishing employment conditions was
through enterprise agreements (59% of employees) followed by awards (35% of employees). The
rest (6%) were employed on contract or individual agreement. By contrast to residential aged care,
only 11% of community aged care services had used an agency to secure staff in the fortnight prior
to the 2012 survey.
Community care services increased their use of agencies to secure CCWs and RNs between 2007 and
2012 but the reason for this is not clear. In 2012, 8% of community care services used an agency to
employ RNs (compared to 2.2% in 2007) and 21% of community care services used agencies for
CCWs in 2012 (up from 12% in 2007). Like residential aged care, the use of agencies differed
between the states and territories. The states and territories that increased their use of agencies for
residential aged care also tended to increase their use of agencies for community care workers and a
similar mirroring was noticed for those jurisdictions that decreased their use of agency staff.
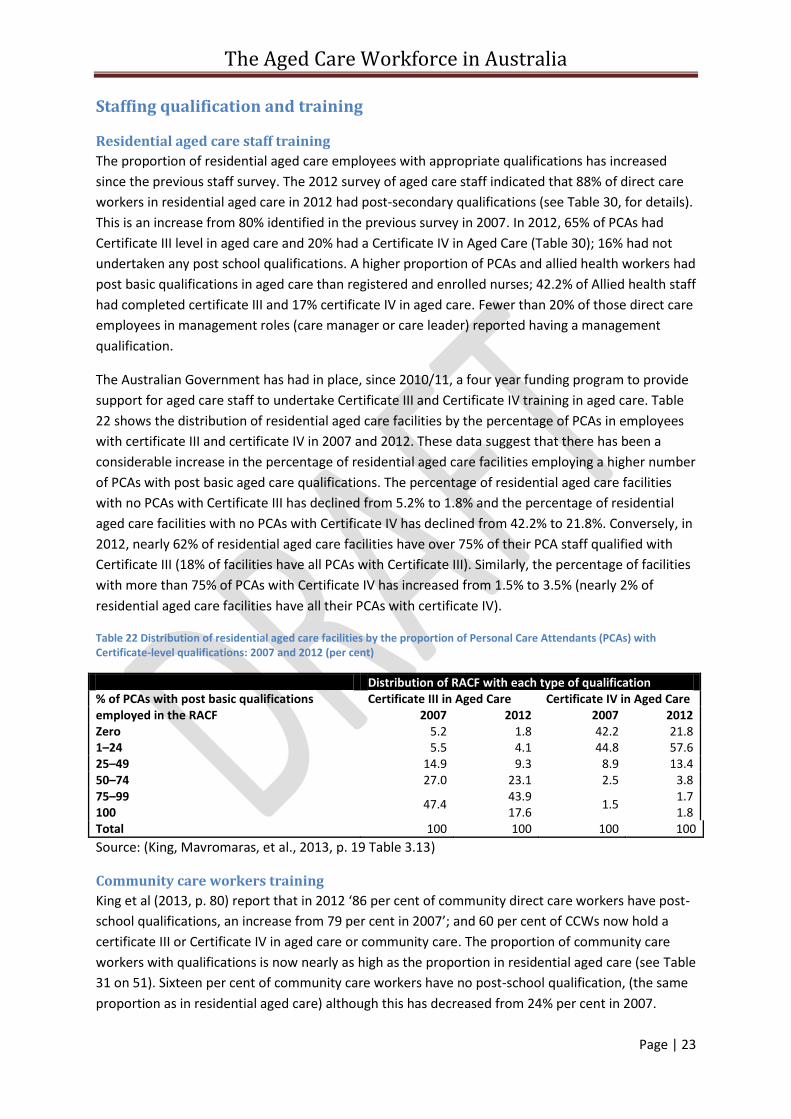
The Aged Care Workforce in Australia
Page | 23
Staffing qualification and training
Residential aged care staff training
The proportion of residential aged care employees with appropriate qualifications has increased
since the previous staff survey. The 2012 survey of aged care staff indicated that 88% of direct care
workers in residential aged care in 2012 had post-secondary qualifications (see Table 30, for details).
This is an increase from 80% identified in the previous survey in 2007. In 2012, 65% of PCAs had
Certificate III level in aged care and 20% had a Certificate IV in Aged Care (Table 30); 16% had not
undertaken any post school qualifications. A higher proportion of PCAs and allied health workers had
post basic qualifications in aged care than registered and enrolled nurses; 42.2% of Allied health staff
had completed certificate III and 17% certificate IV in aged care. Fewer than 20% of those direct care
employees in management roles (care manager or care leader) reported having a management
qualification.
The Australian Government has had in place, since 2010/11, a four year funding program to provide
support for aged care staff to undertake Certificate III and Certificate IV training in aged care. Table
22 shows the distribution of residential aged care facilities by the percentage of PCAs in employees
with certificate III and certificate IV in 2007 and 2012. These data suggest that there has been a
considerable increase in the percentage of residential aged care facilities employing a higher number
of PCAs with post basic aged care qualifications. The percentage of residential aged care facilities
with no PCAs with Certificate III has declined from 5.2% to 1.8% and the percentage of residential
aged care facilities with no PCAs with Certificate IV has declined from 42.2% to 21.8%. Conversely, in
2012, nearly 62% of residential aged care facilities have over 75% of their PCA staff qualified with
Certificate III (18% of facilities have all PCAs with Certificate III). Similarly, the percentage of facilities
with more than 75% of PCAs with Certificate IV has increased from 1.5% to 3.5% (nearly 2% of
residential aged care facilities have all their PCAs with certificate IV).
Table 22 Distribution of residential aged care facilities by the proportion of Personal Care Attendants (PCAs) with Certificate-level qualifications: 2007 and 2012 (per cent)
Distribution of RACF with each type of qualification % of PCAs with post basic qualifications employed in the RACF
Certificate III in Aged Care Certificate IV in Aged Care 2007 2012 2007 2012
Zero 5.2 1.8 42.2 21.8 1–24 5.5 4.1 44.8 57.6 25–49 14.9 9.3 8.9 13.4 50–74 27.0 23.1 2.5 3.8 75–99
47.4 43.9
1.5 1.7
100 17.6 1.8 Total 100 100 100 100
Source: (King, Mavromaras, et al., 2013, p. 19 Table 3.13)
Community care workers training
King et al (2013, p. 80) report that in 2012 ‘86 per cent of community direct care workers have post-
school qualifications, an increase from 79 per cent in 2007’; and 60 per cent of CCWs now hold a
certificate III or Certificate IV in aged care or community care. The proportion of community care
workers with qualifications is now nearly as high as the proportion in residential aged care (see Table
31 on 51). Sixteen per cent of community care workers have no post-school qualification, (the same
proportion as in residential aged care) although this has decreased from 24% per cent in 2007.
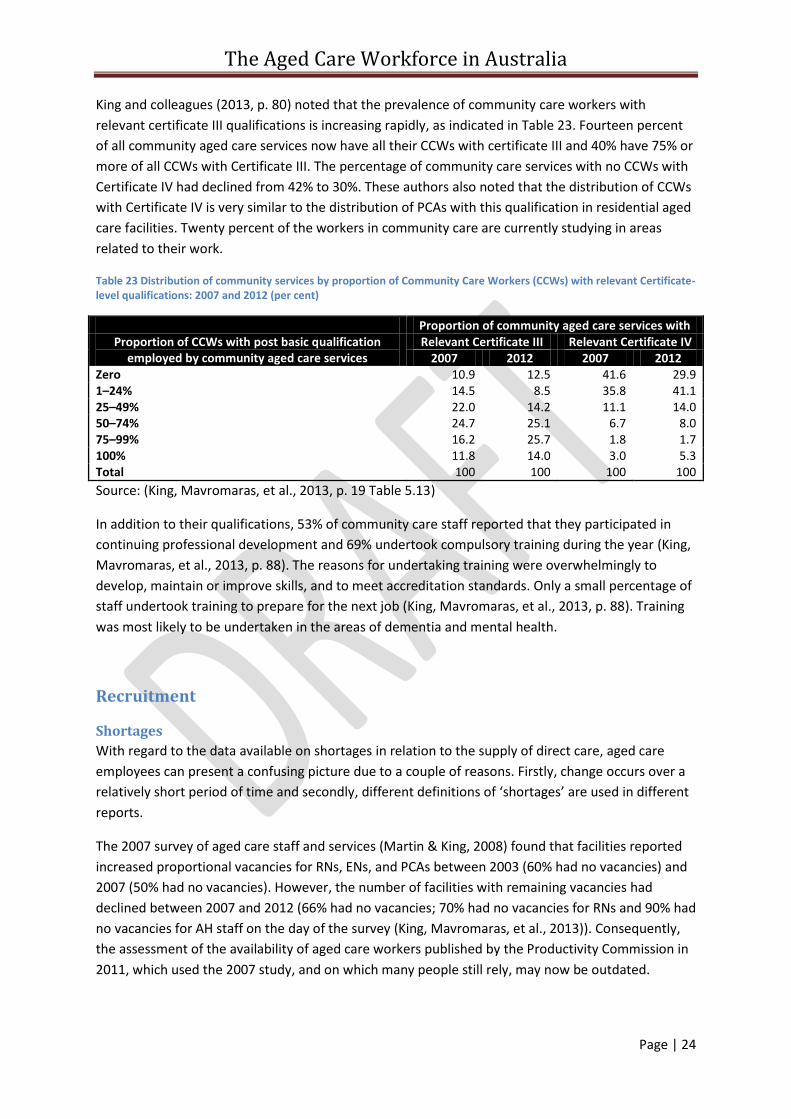
The Aged Care Workforce in Australia
Page | 24
King and colleagues (2013, p. 80) noted that the prevalence of community care workers with
relevant certificate III qualifications is increasing rapidly, as indicated in Table 23. Fourteen percent
of all community aged care services now have all their CCWs with certificate III and 40% have 75% or
more of all CCWs with Certificate III. The percentage of community care services with no CCWs with
Certificate IV had declined from 42% to 30%. These authors also noted that the distribution of CCWs
with Certificate IV is very similar to the distribution of PCAs with this qualification in residential aged
care facilities. Twenty percent of the workers in community care are currently studying in areas
related to their work.
Table 23 Distribution of community services by proportion of Community Care Workers (CCWs) with relevant Certificate-level qualifications: 2007 and 2012 (per cent)
Proportion of community aged care services with Proportion of CCWs with post basic qualification
employed by community aged care services Relevant Certificate III Relevant Certificate IV
2007 2012 2007 2012 Zero 10.9 12.5 41.6 29.9 1–24% 14.5 8.5 35.8 41.1 25–49% 22.0 14.2 11.1 14.0 50–74% 24.7 25.1 6.7 8.0 75–99% 16.2 25.7 1.8 1.7 100% 11.8 14.0 3.0 5.3 Total 100 100 100 100
Source: (King, Mavromaras, et al., 2013, p. 19 Table 5.13)
In addition to their qualifications, 53% of community care staff reported that they participated in
continuing professional development and 69% undertook compulsory training during the year (King,
Mavromaras, et al., 2013, p. 88). The reasons for undertaking training were overwhelmingly to
develop, maintain or improve skills, and to meet accreditation standards. Only a small percentage of
staff undertook training to prepare for the next job (King, Mavromaras, et al., 2013, p. 88). Training
was most likely to be undertaken in the areas of dementia and mental health.
Recruitment
Shortages
With regard to the data available on shortages in relation to the supply of direct care, aged care
employees can present a confusing picture due to a couple of reasons. Firstly, change occurs over a
relatively short period of time and secondly, different definitions of ‘shortages’ are used in different
reports.
The 2007 survey of aged care staff and services (Martin & King, 2008) found that facilities reported
increased proportional vacancies for RNs, ENs, and PCAs between 2003 (60% had no vacancies) and
2007 (50% had no vacancies). However, the number of facilities with remaining vacancies had
declined between 2007 and 2012 (66% had no vacancies; 70% had no vacancies for RNs and 90% had
no vacancies for AH staff on the day of the survey (King, Mavromaras, et al., 2013)). Consequently,
the assessment of the availability of aged care workers published by the Productivity Commission in
2011, which used the 2007 study, and on which many people still rely, may now be outdated.
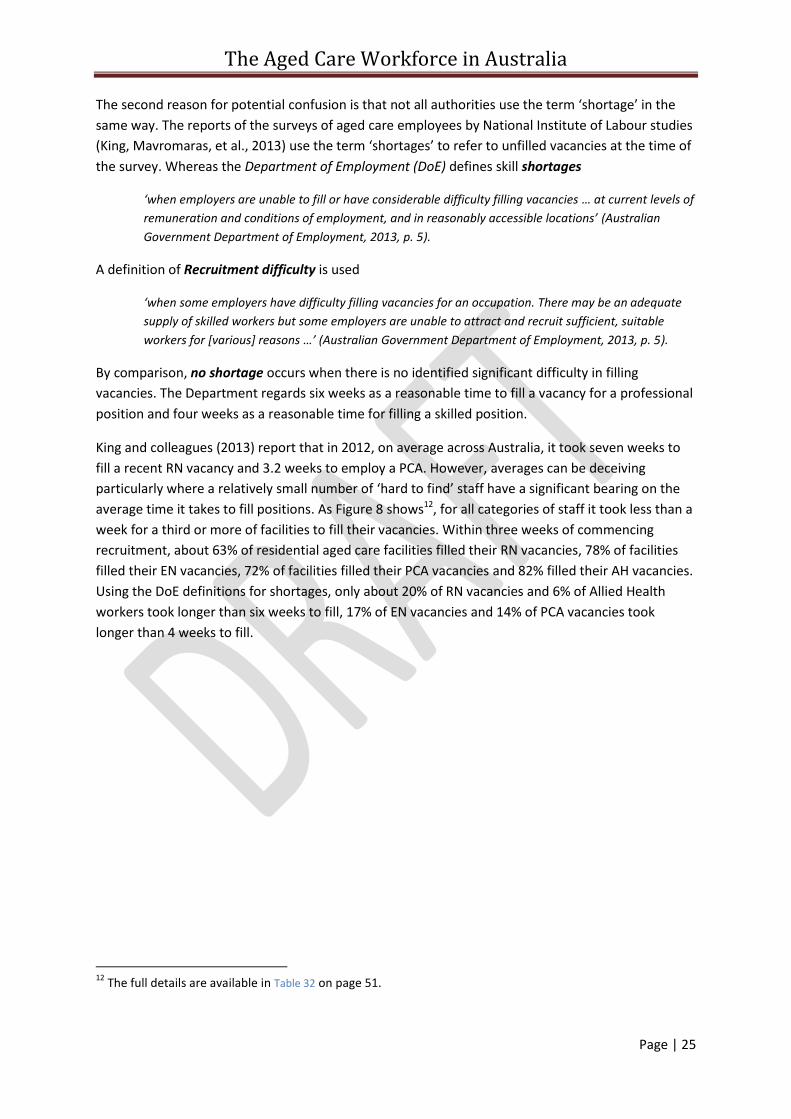
The Aged Care Workforce in Australia
Page | 25
The second reason for potential confusion is that not all authorities use the term ‘shortage’ in the
same way. The reports of the surveys of aged care employees by National Institute of Labour studies
(King, Mavromaras, et al., 2013) use the term ‘shortages’ to refer to unfilled vacancies at the time of
the survey. Whereas the Department of Employment (DoE) defines skill shortages
‘when employers are unable to fill or have considerable difficulty filling vacancies … at current levels of
remuneration and conditions of employment, and in reasonably accessible locations’ (Australian
Government Department of Employment, 2013, p. 5).
A definition of Recruitment difficulty is used
‘when some employers have difficulty filling vacancies for an occupation. There may be an adequate
supply of skilled workers but some employers are unable to attract and recruit sufficient, suitable
workers for [various] reasons …’ (Australian Government Department of Employment, 2013, p. 5).
By comparison, no shortage occurs when there is no identified significant difficulty in filling
vacancies. The Department regards six weeks as a reasonable time to fill a vacancy for a professional
position and four weeks as a reasonable time for filling a skilled position.
King and colleagues (2013) report that in 2012, on average across Australia, it took seven weeks to
fill a recent RN vacancy and 3.2 weeks to employ a PCA. However, averages can be deceiving
particularly where a relatively small number of ‘hard to find’ staff have a significant bearing on the
average time it takes to fill positions. As Figure 8 shows12, for all categories of staff it took less than a
week for a third or more of facilities to fill their vacancies. Within three weeks of commencing
recruitment, about 63% of residential aged care facilities filled their RN vacancies, 78% of facilities
filled their EN vacancies, 72% of facilities filled their PCA vacancies and 82% filled their AH vacancies.
Using the DoE definitions for shortages, only about 20% of RN vacancies and 6% of Allied Health
workers took longer than six weeks to fill, 17% of EN vacancies and 14% of PCA vacancies took
longer than 4 weeks to fill.
12
The full details are available in Table 32 on page 51.
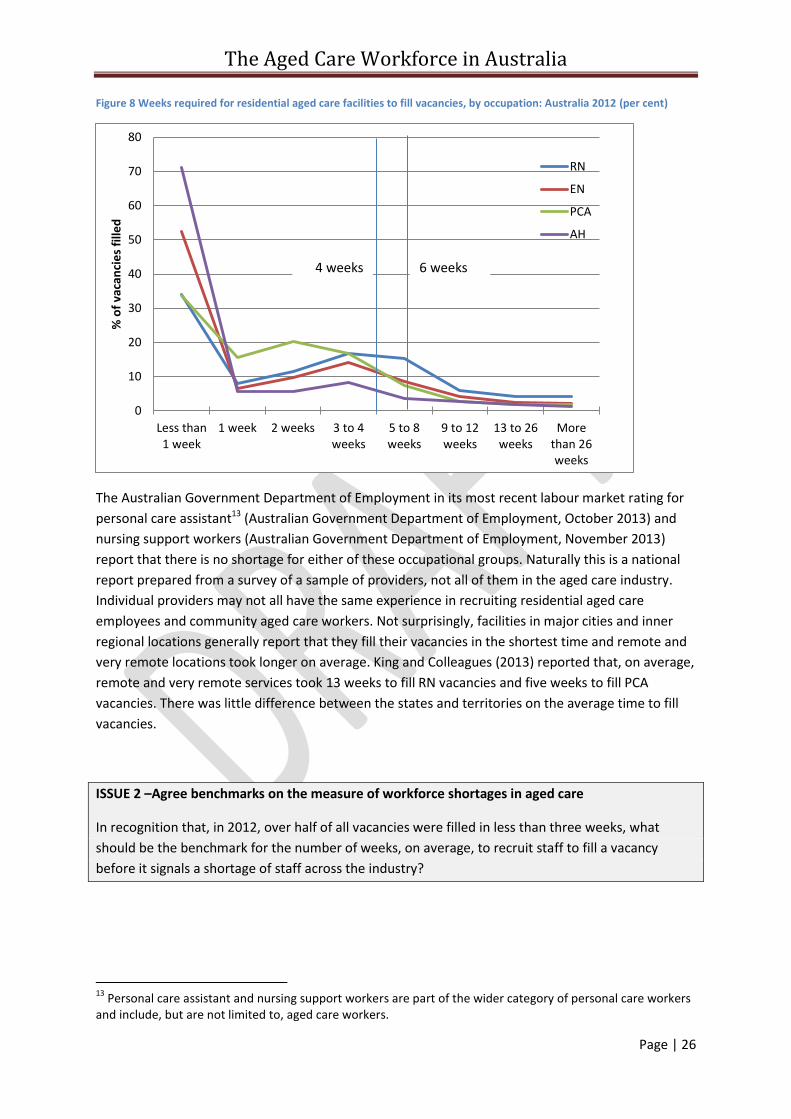
The Aged Care Workforce in Australia
Page | 26
Figure 8 Weeks required for residential aged care facilities to fill vacancies, by occupation: Australia 2012 (per cent)
The Australian Government Department of Employment in its most recent labour market rating for
personal care assistant13 (Australian Government Department of Employment, October 2013) and
nursing support workers (Australian Government Department of Employment, November 2013)
report that there is no shortage for either of these occupational groups. Naturally this is a national
report prepared from a survey of a sample of providers, not all of them in the aged care industry.
Individual providers may not all have the same experience in recruiting residential aged care
employees and community aged care workers. Not surprisingly, facilities in major cities and inner
regional locations generally report that they fill their vacancies in the shortest time and remote and
very remote locations took longer on average. King and Colleagues (2013) reported that, on average,
remote and very remote services took 13 weeks to fill RN vacancies and five weeks to fill PCA
vacancies. There was little difference between the states and territories on the average time to fill
vacancies.
ISSUE 2 –Agree benchmarks on the measure of workforce shortages in aged care
In recognition that, in 2012, over half of all vacancies were filled in less than three weeks, what
should be the benchmark for the number of weeks, on average, to recruit staff to fill a vacancy
before it signals a shortage of staff across the industry?
13
Personal care assistant and nursing support workers are part of the wider category of personal care workers and include, but are not limited to, aged care workers.
0
10
20
30
40
50
60
70
80
Less than1 week
1 week 2 weeks 3 to 4weeks
5 to 8weeks
9 to 12weeks
13 to 26weeks
Morethan 26weeks
% o
f va
can
cie
s fi
lled
RN
EN
PCA
AH
4 weeks 6 weeks
The Aged Care Workforce in Australia
Page | 27
Recruitment difficulty
Other indicators of staff shortages are the number of applicants for each position and the number of
suitable applicants. In 2011, DEEWR (2012) reported that the residential aged care industry had low
competition for registered nurse vacancies with an average of 4.1 applicants per vacancy and 1.8
suitable applicants per vacancy. For PCWs, there were 5 applicants for every vacancy and 1.6
suitable applicants per vacancy. The three most common reasons (all reported by about a third of
facilities) for shortage of staff at that time were:
lack of staff with specialist knowledge
geographical location of the facility
the slowness of recruitment.
This study found that the most common reasons for applicants to be unsuitable for registered nurse
positions in residential aged care positions were:
Insufficient experience (55 per cent);
Insufficient qualifications (33 per cent);
Poor attitude or lacked work readiness skills (14 per cent);
Limited interest in the job (10 per cent); and
Inability to work independently (8 per cent).
About 16% of facilities claimed that the cost of staff was too high for them to employ the staff they
wanted and about 20% claimed the lack of adequate training was the reason for staff shortages.
In response to vacancies, facilities reported that they used multiple actions to find suitable staff. The
most common actions were to offer more hours to existing staff (about 64% of all facilities) and to
use agency staff (53%). The next most common were training; ‘on the job training’ (43%) and
‘external training’ (23%) – presumably to increase the skills of existing staff and, in this way, fill skills
shortages. Only 15% of facilities increased wages and 16% employed staff on short term contracts.
Only 2% used overseas recruitment as a response to staff shortages. Facilities were not asked to
indicate the success of these mechanisms but presumably used those responses that they believed
proved most effective for them.
Retention
Turnover rate -Residential aged care
The Productivity Commission (2011, p. 357) were of the view, based on their assessment of the
findings of Martin and King (2008) ‘that the sector overall has a high turnover rate, with around one
in four personal carers having spent less than a year with their current employer. Turnover in
residential aged care is one third higher than for the health care and social assistance industry and
slightly higher than for the economy in general.’ However, prior to the global financial crisis, in 2008,
23.4% of all Australian women were in their current jobs for less than one year (Australian Bureau
for Statistics, 2008), similar to the figure quoted by the Productivity Commission for the aged care
industry.
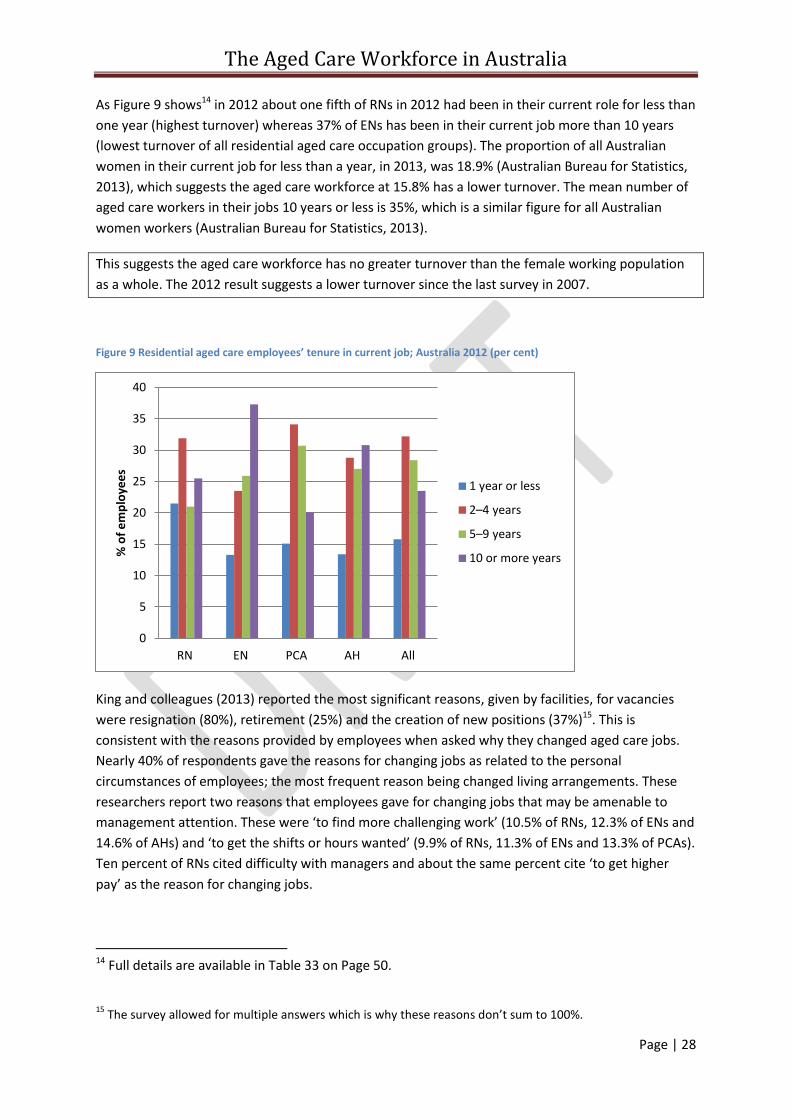
The Aged Care Workforce in Australia
Page | 28
As Figure 9 shows14 in 2012 about one fifth of RNs in 2012 had been in their current role for less than
one year (highest turnover) whereas 37% of ENs has been in their current job more than 10 years
(lowest turnover of all residential aged care occupation groups). The proportion of all Australian
women in their current job for less than a year, in 2013, was 18.9% (Australian Bureau for Statistics,
2013), which suggests the aged care workforce at 15.8% has a lower turnover. The mean number of
aged care workers in their jobs 10 years or less is 35%, which is a similar figure for all Australian
women workers (Australian Bureau for Statistics, 2013).
This suggests the aged care workforce has no greater turnover than the female working population
as a whole. The 2012 result suggests a lower turnover since the last survey in 2007.
Figure 9 Residential aged care employees’ tenure in current job; Australia 2012 (per cent)
King and colleagues (2013) reported the most significant reasons, given by facilities, for vacancies
were resignation (80%), retirement (25%) and the creation of new positions (37%)15. This is
consistent with the reasons provided by employees when asked why they changed aged care jobs.
Nearly 40% of respondents gave the reasons for changing jobs as related to the personal
circumstances of employees; the most frequent reason being changed living arrangements. These
researchers report two reasons that employees gave for changing jobs that may be amenable to
management attention. These were ‘to find more challenging work’ (10.5% of RNs, 12.3% of ENs and
14.6% of AHs) and ‘to get the shifts or hours wanted’ (9.9% of RNs, 11.3% of ENs and 13.3% of PCAs).
Ten percent of RNs cited difficulty with managers and about the same percent cite ‘to get higher
pay’ as the reason for changing jobs.
14 Full details are available in Table 33 on Page 50.
15
The survey allowed for multiple answers which is why these reasons don’t sum to 100%.
0
5
10
15
20
25
30
35
40
RN EN PCA AH All
% o
f e
mp
loye
es
1 year or less
2–4 years
5–9 years
10 or more years
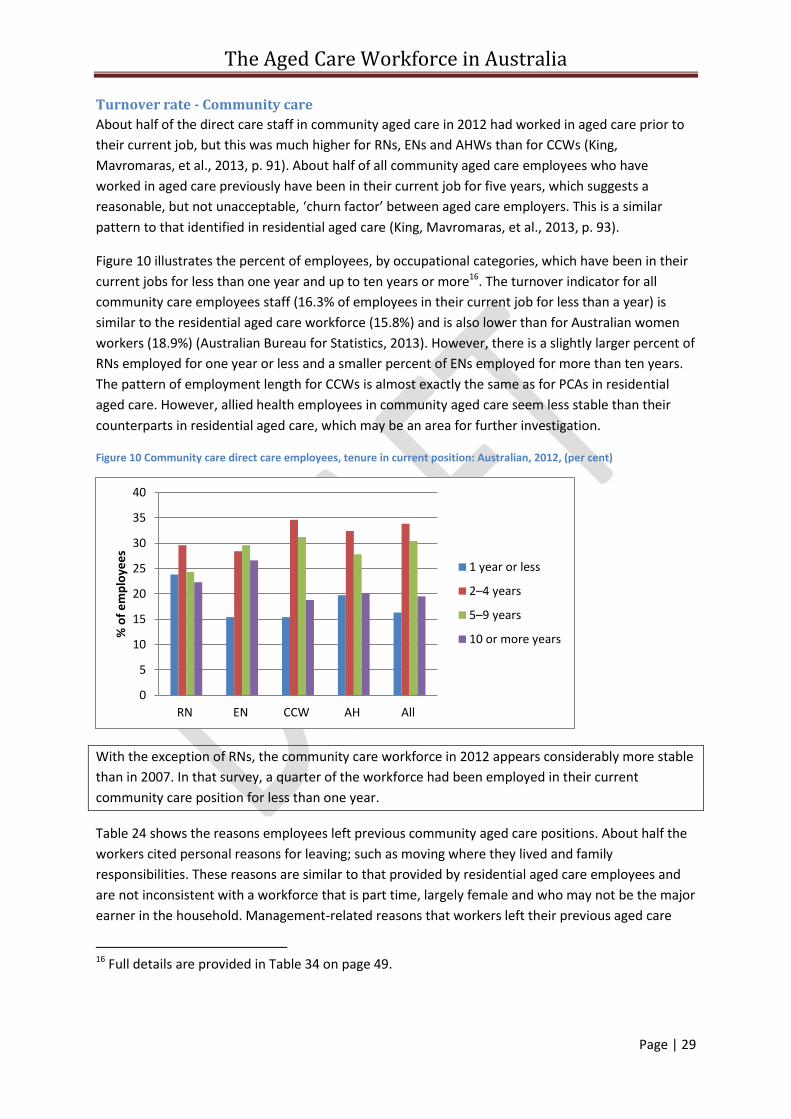
The Aged Care Workforce in Australia
Page | 29
Turnover rate - Community care
About half of the direct care staff in community aged care in 2012 had worked in aged care prior to
their current job, but this was much higher for RNs, ENs and AHWs than for CCWs (King,
Mavromaras, et al., 2013, p. 91). About half of all community aged care employees who have
worked in aged care previously have been in their current job for five years, which suggests a
reasonable, but not unacceptable, ‘churn factor’ between aged care employers. This is a similar
pattern to that identified in residential aged care (King, Mavromaras, et al., 2013, p. 93).
Figure 10 illustrates the percent of employees, by occupational categories, which have been in their
current jobs for less than one year and up to ten years or more16. The turnover indicator for all
community care employees staff (16.3% of employees in their current job for less than a year) is
similar to the residential aged care workforce (15.8%) and is also lower than for Australian women
workers (18.9%) (Australian Bureau for Statistics, 2013). However, there is a slightly larger percent of
RNs employed for one year or less and a smaller percent of ENs employed for more than ten years.
The pattern of employment length for CCWs is almost exactly the same as for PCAs in residential
aged care. However, allied health employees in community aged care seem less stable than their
counterparts in residential aged care, which may be an area for further investigation.
Figure 10 Community care direct care employees, tenure in current position: Australian, 2012, (per cent)
With the exception of RNs, the community care workforce in 2012 appears considerably more stable
than in 2007. In that survey, a quarter of the workforce had been employed in their current
community care position for less than one year.
Table 24 shows the reasons employees left previous community aged care positions. About half the
workers cited personal reasons for leaving; such as moving where they lived and family
responsibilities. These reasons are similar to that provided by residential aged care employees and
are not inconsistent with a workforce that is part time, largely female and who may not be the major
earner in the household. Management-related reasons that workers left their previous aged care
16 Full details are provided in Table 34 on page 49.
0
5
10
15
20
25
30
35
40
RN EN CCW AH All
% o
f e
mp
loye
es
1 year or less
2–4 years
5–9 years
10 or more years
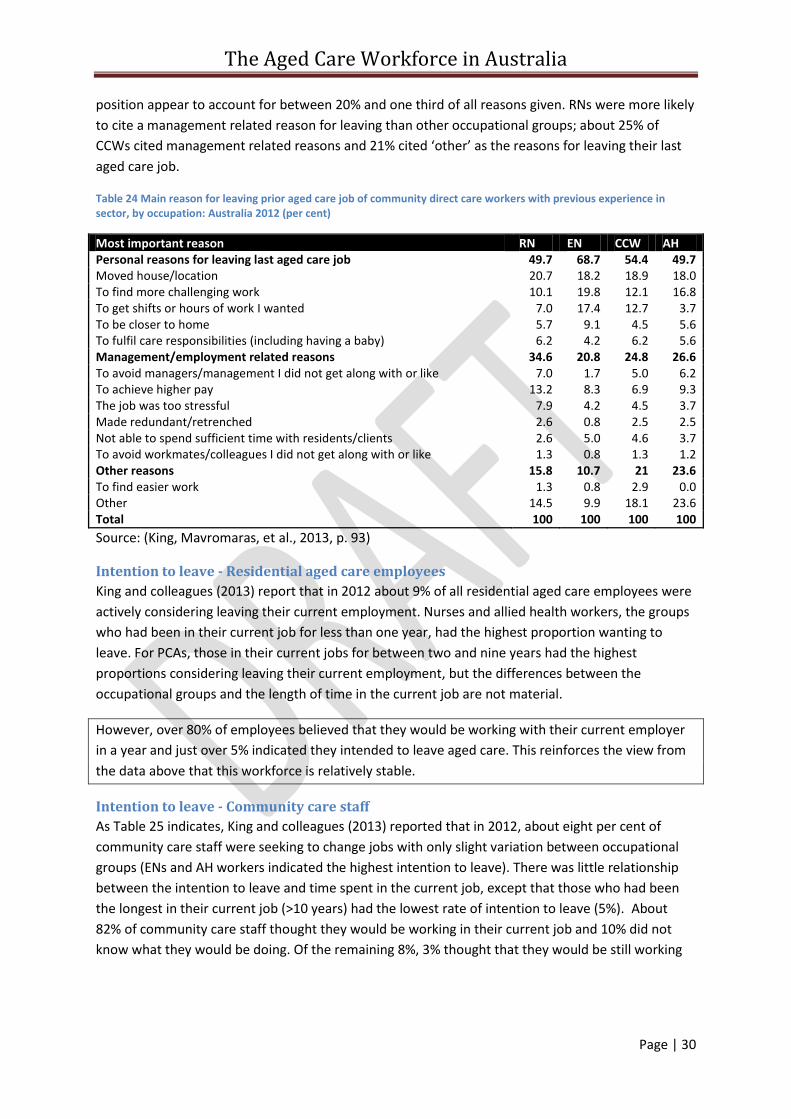
The Aged Care Workforce in Australia
Page | 30
position appear to account for between 20% and one third of all reasons given. RNs were more likely
to cite a management related reason for leaving than other occupational groups; about 25% of
CCWs cited management related reasons and 21% cited ‘other’ as the reasons for leaving their last
aged care job.
Table 24 Main reason for leaving prior aged care job of community direct care workers with previous experience in sector, by occupation: Australia 2012 (per cent)
Most important reason RN EN CCW AH Personal reasons for leaving last aged care job 49.7 68.7 54.4 49.7 Moved house/location 20.7 18.2 18.9 18.0 To find more challenging work 10.1 19.8 12.1 16.8 To get shifts or hours of work I wanted 7.0 17.4 12.7 3.7 To be closer to home 5.7 9.1 4.5 5.6 To fulfil care responsibilities (including having a baby) 6.2 4.2 6.2 5.6 Management/employment related reasons 34.6 20.8 24.8 26.6 To avoid managers/management I did not get along with or like 7.0 1.7 5.0 6.2 To achieve higher pay 13.2 8.3 6.9 9.3 The job was too stressful 7.9 4.2 4.5 3.7 Made redundant/retrenched 2.6 0.8 2.5 2.5 Not able to spend sufficient time with residents/clients 2.6 5.0 4.6 3.7 To avoid workmates/colleagues I did not get along with or like 1.3 0.8 1.3 1.2 Other reasons 15.8 10.7 21 23.6 To find easier work 1.3 0.8 2.9 0.0 Other 14.5 9.9 18.1 23.6 Total 100 100 100 100
Source: (King, Mavromaras, et al., 2013, p. 93)
Intention to leave - Residential aged care employees
King and colleagues (2013) report that in 2012 about 9% of all residential aged care employees were
actively considering leaving their current employment. Nurses and allied health workers, the groups
who had been in their current job for less than one year, had the highest proportion wanting to
leave. For PCAs, those in their current jobs for between two and nine years had the highest
proportions considering leaving their current employment, but the differences between the
occupational groups and the length of time in the current job are not material.
However, over 80% of employees believed that they would be working with their current employer
in a year and just over 5% indicated they intended to leave aged care. This reinforces the view from
the data above that this workforce is relatively stable.
Intention to leave - Community care staff
As Table 25 indicates, King and colleagues (2013) reported that in 2012, about eight per cent of
community care staff were seeking to change jobs with only slight variation between occupational
groups (ENs and AH workers indicated the highest intention to leave). There was little relationship
between the intention to leave and time spent in the current job, except that those who had been
the longest in their current job (>10 years) had the lowest rate of intention to leave (5%). About
82% of community care staff thought they would be working in their current job and 10% did not
know what they would be doing. Of the remaining 8%, 3% thought that they would be still working
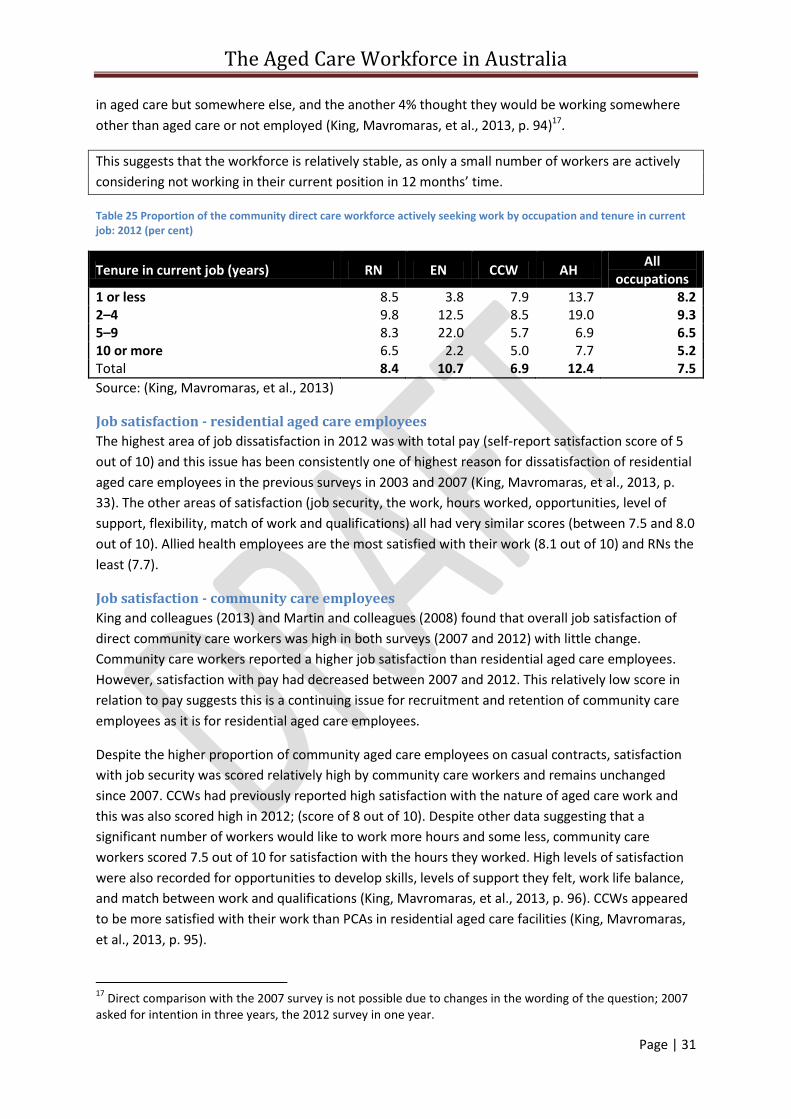
The Aged Care Workforce in Australia
Page | 31
in aged care but somewhere else, and the another 4% thought they would be working somewhere
other than aged care or not employed (King, Mavromaras, et al., 2013, p. 94)17.
This suggests that the workforce is relatively stable, as only a small number of workers are actively
considering not working in their current position in 12 months’ time.
Table 25 Proportion of the community direct care workforce actively seeking work by occupation and tenure in current job: 2012 (per cent)
Tenure in current job (years) RN EN CCW AH All
occupations 1 or less 8.5 3.8 7.9 13.7 8.2 2–4 9.8 12.5 8.5 19.0 9.3 5–9 8.3 22.0 5.7 6.9 6.5 10 or more 6.5 2.2 5.0 7.7 5.2 Total 8.4 10.7 6.9 12.4 7.5
Source: (King, Mavromaras, et al., 2013)
Job satisfaction - residential aged care employees
The highest area of job dissatisfaction in 2012 was with total pay (self-report satisfaction score of 5
out of 10) and this issue has been consistently one of highest reason for dissatisfaction of residential
aged care employees in the previous surveys in 2003 and 2007 (King, Mavromaras, et al., 2013, p.
33). The other areas of satisfaction (job security, the work, hours worked, opportunities, level of
support, flexibility, match of work and qualifications) all had very similar scores (between 7.5 and 8.0
out of 10). Allied health employees are the most satisfied with their work (8.1 out of 10) and RNs the
least (7.7).
Job satisfaction - community care employees
King and colleagues (2013) and Martin and colleagues (2008) found that overall job satisfaction of
direct community care workers was high in both surveys (2007 and 2012) with little change.
Community care workers reported a higher job satisfaction than residential aged care employees.
However, satisfaction with pay had decreased between 2007 and 2012. This relatively low score in
relation to pay suggests this is a continuing issue for recruitment and retention of community care
employees as it is for residential aged care employees.
Despite the higher proportion of community aged care employees on casual contracts, satisfaction
with job security was scored relatively high by community care workers and remains unchanged
since 2007. CCWs had previously reported high satisfaction with the nature of aged care work and
this was also scored high in 2012; (score of 8 out of 10). Despite other data suggesting that a
significant number of workers would like to work more hours and some less, community care
workers scored 7.5 out of 10 for satisfaction with the hours they worked. High levels of satisfaction
were also recorded for opportunities to develop skills, levels of support they felt, work life balance,
and match between work and qualifications (King, Mavromaras, et al., 2013, p. 96). CCWs appeared
to be more satisfied with their work than PCAs in residential aged care facilities (King, Mavromaras,
et al., 2013, p. 95).
17
Direct comparison with the 2007 survey is not possible due to changes in the wording of the question; 2007 asked for intention in three years, the 2012 survey in one year.
The Aged Care Workforce in Australia
Page | 32
These findings are consistent with other research in this area. Radford, Shacklock, & Bradley (2013)
found that perceived supervisor support, on-the-job embeddedness and area of employment, were
identified as predictors of both intention to stay and to leave, although the strength of the
relationship differed. Community care workers were more likely to stay and reported more
supervisor support than residential aged care workers.
Conclusion in relation to the current aged care workforce Workforce issues remain a challenge for the aged care industry. However, an assessment of the
most recent data paints a picture of a workforce that is stable, skilled, prepared to undertake further
education and training and committed to the industry. The workforce remains predominately part
time, female and older than is found in other industries in Australia. It appears that working in aged
care appeals to the older employees it attracts and they repay that with long lengths of service and
low turnover. This is in contrast to the often reported view within the industry of high turnover, for
example as expressed by the National Aged Care Alliance (2012, p. 5).
Although there has been continuous and significant growth over the past decade the industry has,
by and large, found the additional workers it has needed each year. The increase in the proportion of
qualified staff suggest that the system has responded by equipping these additional staff with the
skills they need to undertake their jobs, although there are continuing issues related to the quality
and availability of the training. Some of the more concerning trends that were apparent during the
first decade of this century, (changing patterns to the mix of occupational groups in the workforce
and increasing workforce shortages), appear to have stabilised over the past five years. Over recent
years, employers have responded to the preferences of workers by increasing the percentage of
workers offered permanent employment and more hours of work as a first response to meeting skill
shortages. The unmet preference for more hours of work by existing employees across the industry,
if it could be turned into paid hours of work, has the potential to meet short term staffing
requirements. The proportion of migrant workers in the aged care workforce in 2012 (35% for
residential aged care and 28% for community aged care) compares with 28% of the overall
population in Australia born overseas (Australian Bureau of Statistics, 2013b). There are few migrant
workers who arrived in Australia recently.
There remain a number of areas of concern with the aged care workforce. Major issues that emerge
are around workplace climate and culture, more support for migrant workers, management and
leadership skills, the greater support needed for rural and remote services and levels of
remuneration for some sectors and employees. There is also a concern of many that the industry
should not be so reliant on older workers. Some areas of dissatisfaction are intrinsic to the nature of
the work but some others may be improved by the actions of management. There is a creeping
increase in the use of agency staff in some jurisdictions and staff shortages, particularly for
registered nurses, persist in rural and remote locations. While the majority of vacant positions for
registered nurses are filled quickly, there is a small percentage that remains difficult to fill. This
review of the current workforce support the observations of King, Wei and Howe who wrote that
‘The findings [of recent research] support the need for a shift in focus away from workers and the
nature of care work to factors in the workplace environment that are under the control of
management and wider policy settings that shape work conditions’ (King, Wei, et al., 2013, p. 301)
The Aged Care Workforce in Australia
Page | 33
The next section focuses on future challenges and identifies a number of areas for focus to prepare
the industry to face in the short and medium term future.
The Aged Care Workforce in Australia
Page | 34
Approaching the future
Strategies to address workforce issues Both the community aged care and the residential aged care sectors face a period of change and
expansion over the coming decade. This will require the industry to identify strategic initiatives that
will assist it to meet these challenges. Addressing issues in isolation, promoting small scale projects
and disseminated responsibility for addressing workforce issues is unlikely to achieve success.
Hussein and Manthorpe (2005) in a review of strategies used by a range of countries, identified a
broad set of strategies to address workforce shortages. Chomik and MacLennan (2014), in analysing
the 2011 report of the OECD, claimed that Australia was considering a more limited number of
measures to address workforce challenges than other countries and that Australia’s policy approach
and frameworks ‘appear not to be developing in a coherent or coordinated fashion’ (Chomik &
MacLennan, 2014, p. 12). Although the former Australian Government’s reform initiatives, Living
Longer Living Better, included a workforce component, it identified only five elements of focus;
higher wages, improved career structures, enhanced training and education opportunities, improved
career development and workforce planning, and better work practices. By comparison, the OECD
report identified a larger range of initiatives that are being addressed across comparable countries
to Australia. As the former government’s initiative is now not being implemented as envisaged,
there are gaps in the aged care workforce policy framework and a new approach may be guided by
the OECD framework. The elements of the OECD framework are incorporated in the possible areas
of strategic focus listed in Table 26 below.
The Productivity Commission PC (2011, p. 358) appeared to support the multi-faceted approach
recommended by the OECD and concluded that action in one area of workforce challenges ‘will not
be sufficient to set the industry on a sustainable path’. They recommended (p347) that ‘a
comprehensive aged care workforce strategy needs to be independently developed to identify and
address ongoing and future workforce issues’ (Productivity Commission, 2011, p. 347) and should
include
paying fair and competitive wages, (page 359) and ensuring that increased payments to
providers for higher wages actually is spent for this purpose (p. 362)
ensuring that the pricing of services (recommended by the proposed Australian Aged Care
Commission) takes into account appropriate staffing levels, skills mix and remuneration
arrangements
improving access to education, training and professional development, particularly for those
in remote locations
developing well-articulated career paths, ‘better management’ and exploring ‘innovations in
governance’ (PC p. 359)
extending scopes of practice
reducing regulatory burdens
reducing the regulatory burdens and costs associated with employing aged care workers
from overseas
More recently, the NACA (National Aged Care Alliance, 2012) recommended the following strategic
initiatives to address workforce issues:
The Aged Care Workforce in Australia
Page | 35
pay fair and competitive wages
better designed jobs so that (predominantly) part-time workers are more productive
improve the coordination, targeting and quality of training
establish a Ministerial Taskforce to develop a comprehensive workforce strategy with a
particular focus on the following areas:
o career pathways
o the use of technology
o universal workplace policies (e.g., no-lift policies)
o entitlements portability
o promoting a learning culture
o quality management
o career pathways
o overseas recruitment.
Past national initiatives by the Australian Government to address workforce issues such as the
National Aged Care Workforce Strategy between 2005-2010 and the Living Longer Living Better
reforms announced in 2012 are now largely out of date and have not been replaced with an
alternative. What appears to be needed is a new national framework to address workforce issues on
a national and cross sector basis that will take continuing responsibility for workforce planning,
develop an overall strategy and coordinate funded and recommended initiatives. ACSA, in its
comments to the Productivity Commission on the National Aged Care Workforce Strategy stated
that:
While [the National Aged Care Workforce Strategy] is a useful document, it is out of date and only addresses
direct residential aged care staff. It fails to plan for community care, allied health and ancillary workers. This
document should be updated and made more inclusive of all health care professionals that work in the industry
as a matter of urgency. It should capture the myriad of strategies that are required to address these
multifaceted problems in a practical way within a broad environmental analysis (Aged and Community Services
Association, 2010)
Strategic objectives There appear to be three broad strategic aims for addressing aged care workforce challenges;
enhancing recruitment, increasing retention and improving quality and productivity. A number of
areas of strategic focus that could be developed to help achieve these aims have been identified, in
the discussion above, from the literature, industry and government reports, and these are
summarised in Table 26. As this table illustrates, individual areas of strategic focus may address
more than one aim. The colour coding of the boxes in this table has been determined by the authors
based on their review of the available evidence and is open to debate and discussion. This
assessment provides an overall framework for the possible strategies addressed in the sections
below.
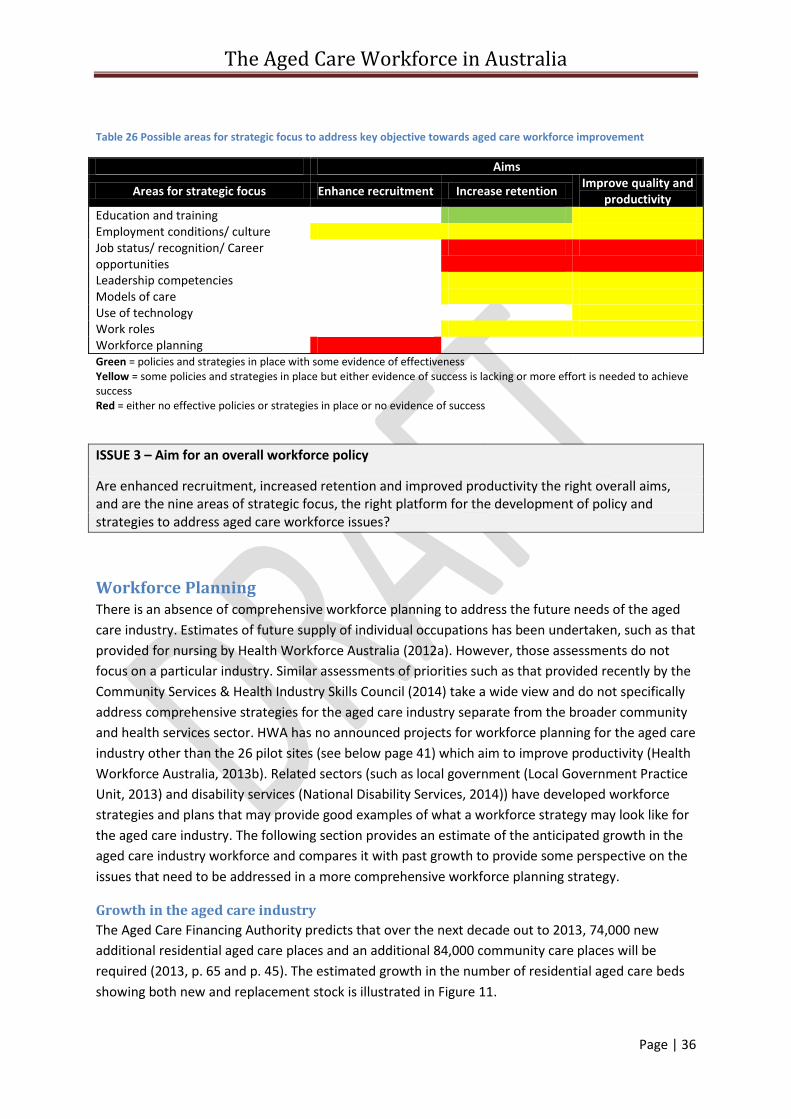
The Aged Care Workforce in Australia
Page | 36
Table 26 Possible areas for strategic focus to address key objective towards aged care workforce improvement
Aims
Areas for strategic focus Enhance recruitment Increase retention Improve quality and
productivity Education and training Employment conditions/ culture Job status/ recognition/ Career opportunities
Leadership competencies Models of care Use of technology Work roles Workforce planning Green = policies and strategies in place with some evidence of effectiveness Yellow = some policies and strategies in place but either evidence of success is lacking or more effort is needed to achieve success Red = either no effective policies or strategies in place or no evidence of success
ISSUE 3 – Aim for an overall workforce policy
Are enhanced recruitment, increased retention and improved productivity the right overall aims, and are the nine areas of strategic focus, the right platform for the development of policy and strategies to address aged care workforce issues?
Workforce Planning There is an absence of comprehensive workforce planning to address the future needs of the aged
care industry. Estimates of future supply of individual occupations has been undertaken, such as that
provided for nursing by Health Workforce Australia (2012a). However, those assessments do not
focus on a particular industry. Similar assessments of priorities such as that provided recently by the
Community Services & Health Industry Skills Council (2014) take a wide view and do not specifically
address comprehensive strategies for the aged care industry separate from the broader community
and health services sector. HWA has no announced projects for workforce planning for the aged care
industry other than the 26 pilot sites (see below page 41) which aim to improve productivity (Health
Workforce Australia, 2013b). Related sectors (such as local government (Local Government Practice
Unit, 2013) and disability services (National Disability Services, 2014)) have developed workforce
strategies and plans that may provide good examples of what a workforce strategy may look like for
the aged care industry. The following section provides an estimate of the anticipated growth in the
aged care industry workforce and compares it with past growth to provide some perspective on the
issues that need to be addressed in a more comprehensive workforce planning strategy.
Growth in the aged care industry
The Aged Care Financing Authority predicts that over the next decade out to 2013, 74,000 new
additional residential aged care places and an additional 84,000 community care places will be
required (2013, p. 65 and p. 45). The estimated growth in the number of residential aged care beds
showing both new and replacement stock is illustrated in Figure 11.
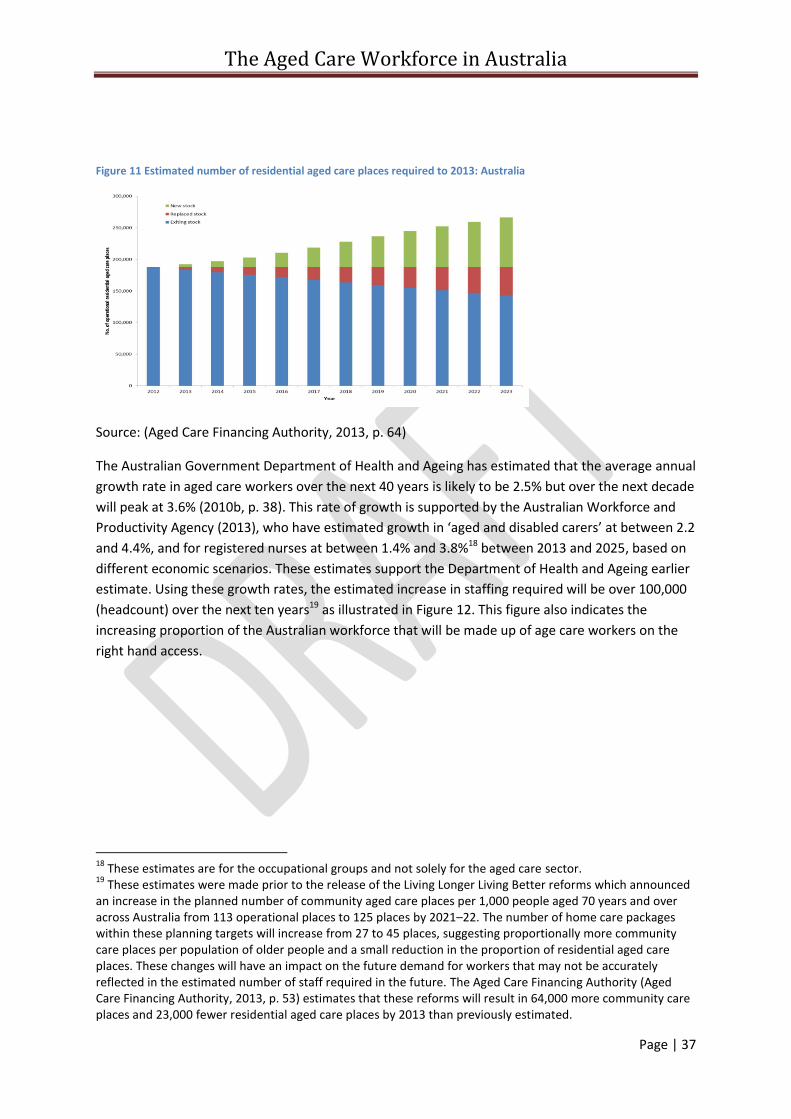
The Aged Care Workforce in Australia
Page | 37
Figure 11 Estimated number of residential aged care places required to 2013: Australia
Source: (Aged Care Financing Authority, 2013, p. 64)
The Australian Government Department of Health and Ageing has estimated that the average annual
growth rate in aged care workers over the next 40 years is likely to be 2.5% but over the next decade
will peak at 3.6% (2010b, p. 38). This rate of growth is supported by the Australian Workforce and
Productivity Agency (2013), who have estimated growth in ‘aged and disabled carers’ at between 2.2
and 4.4%, and for registered nurses at between 1.4% and 3.8%18 between 2013 and 2025, based on
different economic scenarios. These estimates support the Department of Health and Ageing earlier
estimate. Using these growth rates, the estimated increase in staffing required will be over 100,000
(headcount) over the next ten years19 as illustrated in Figure 12. This figure also indicates the
increasing proportion of the Australian workforce that will be made up of age care workers on the
right hand access.
18
These estimates are for the occupational groups and not solely for the aged care sector. 19
These estimates were made prior to the release of the Living Longer Living Better reforms which announced an increase in the planned number of community aged care places per 1,000 people aged 70 years and over across Australia from 113 operational places to 125 places by 2021–22. The number of home care packages within these planning targets will increase from 27 to 45 places, suggesting proportionally more community care places per population of older people and a small reduction in the proportion of residential aged care places. These changes will have an impact on the future demand for workers that may not be accurately reflected in the estimated number of staff required in the future. The Aged Care Financing Authority (Aged Care Financing Authority, 2013, p. 53) estimates that these reforms will result in 64,000 more community care places and 23,000 fewer residential aged care places by 2013 than previously estimated.
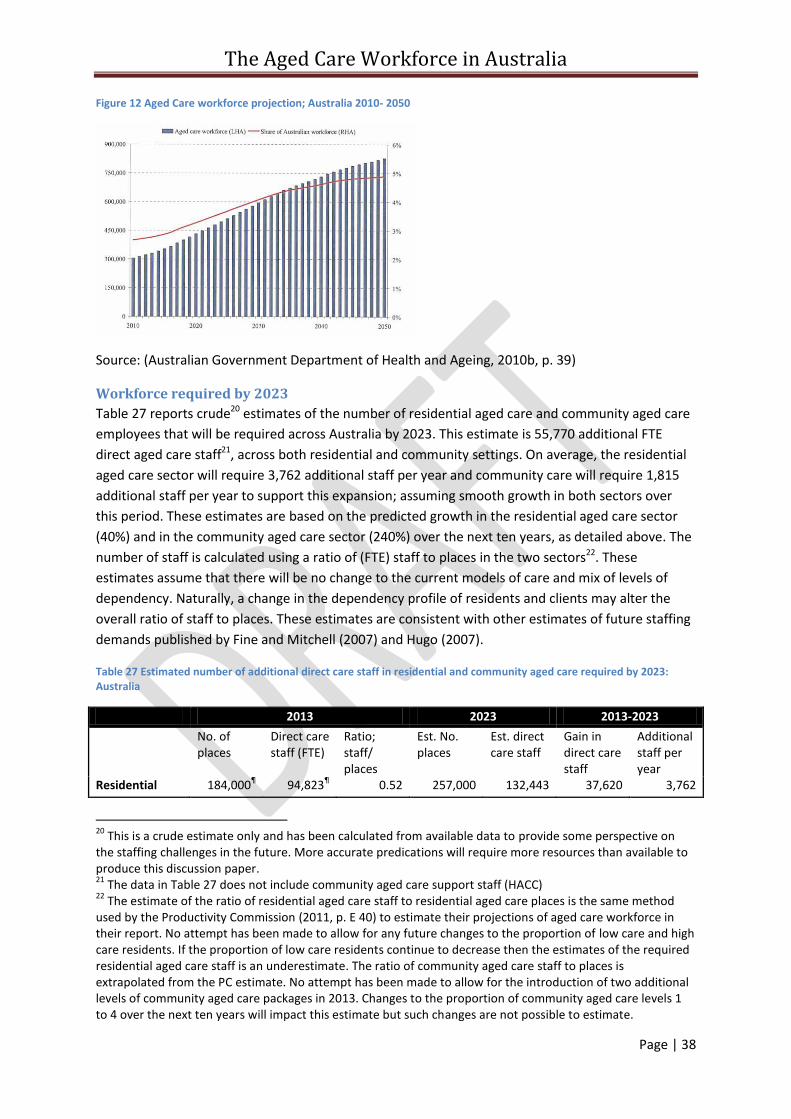
The Aged Care Workforce in Australia
Page | 38
Figure 12 Aged Care workforce projection; Australia 2010- 2050
Source: (Australian Government Department of Health and Ageing, 2010b, p. 39)
Workforce required by 2023
Table 27 reports crude20 estimates of the number of residential aged care and community aged care
employees that will be required across Australia by 2023. This estimate is 55,770 additional FTE
direct aged care staff21, across both residential and community settings. On average, the residential
aged care sector will require 3,762 additional staff per year and community care will require 1,815
additional staff per year to support this expansion; assuming smooth growth in both sectors over
this period. These estimates are based on the predicted growth in the residential aged care sector
(40%) and in the community aged care sector (240%) over the next ten years, as detailed above. The
number of staff is calculated using a ratio of (FTE) staff to places in the two sectors22. These
estimates assume that there will be no change to the current models of care and mix of levels of
dependency. Naturally, a change in the dependency profile of residents and clients may alter the
overall ratio of staff to places. These estimates are consistent with other estimates of future staffing
demands published by Fine and Mitchell (2007) and Hugo (2007).
Table 27 Estimated number of additional direct care staff in residential and community aged care required by 2023: Australia
2013 2023 2013-2023
No. of places
Direct care staff (FTE)
Ratio; staff/ places
Est. No. places
Est. direct care staff
Gain in direct care staff
Additional staff per year
Residential 184,000¶ 94,823
¶ 0.52 257,000 132,443 37,620 3,762
20
This is a crude estimate only and has been calculated from available data to provide some perspective on the staffing challenges in the future. More accurate predications will require more resources than available to produce this discussion paper. 21
The data in Table 27 does not include community aged care support staff (HACC) 22
The estimate of the ratio of residential aged care staff to residential aged care places is the same method used by the Productivity Commission (2011, p. E 40) to estimate their projections of aged care workforce in their report. No attempt has been made to allow for any future changes to the proportion of low care and high care residents. If the proportion of low care residents continue to decrease then the estimates of the required residential aged care staff is an underestimate. The ratio of community aged care staff to places is extrapolated from the PC estimate. No attempt has been made to allow for the introduction of two additional levels of community aged care packages in 2013. Changes to the proportion of community aged care levels 1 to 4 over the next ten years will impact this estimate but such changes are not possible to estimate.
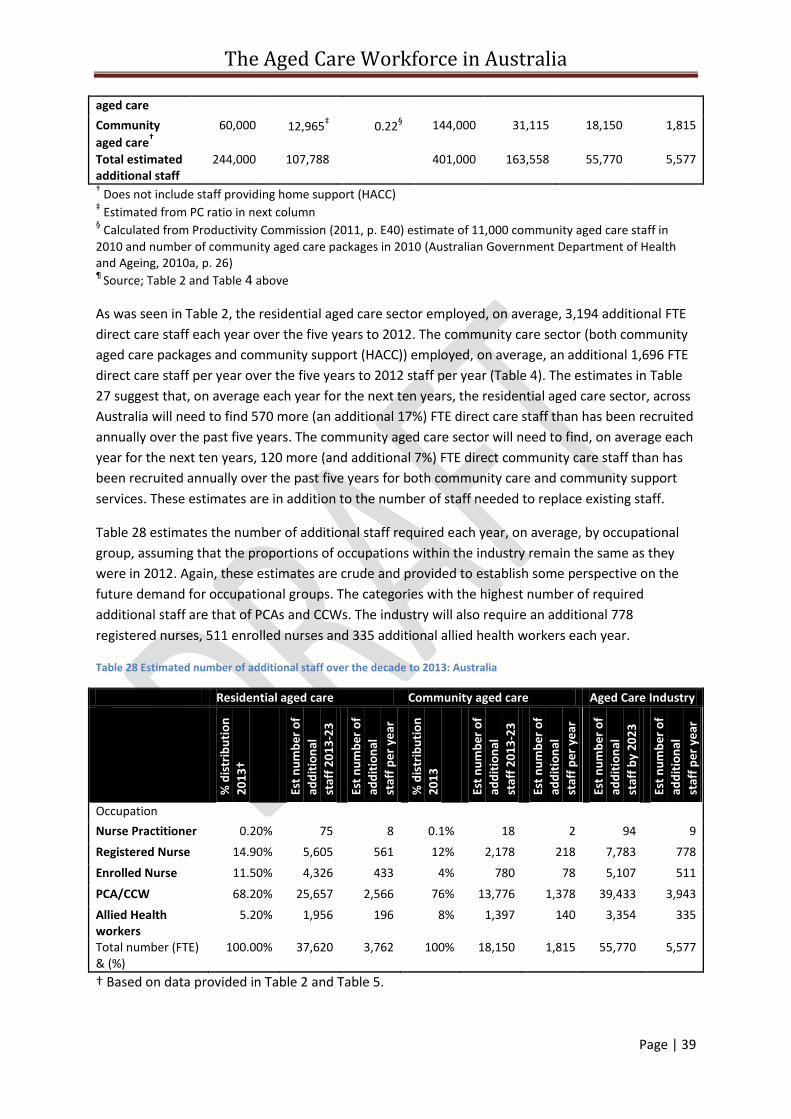
The Aged Care Workforce in Australia
Page | 39
aged care
Community
aged care†
60,000 12,965‡ 0.22
§ 144,000 31,115 18,150 1,815
Total estimated additional staff
244,000 107,788 401,000 163,558 55,770 5,577
† Does not include staff providing home support (HACC)
‡ Estimated from PC ratio in next column
§ Calculated from Productivity Commission (2011, p. E40) estimate of 11,000 community aged care staff in
2010 and number of community aged care packages in 2010 (Australian Government Department of Health and Ageing, 2010a, p. 26) ¶
Source; Table 2 and Table 4 above
As was seen in Table 2, the residential aged care sector employed, on average, 3,194 additional FTE
direct care staff each year over the five years to 2012. The community care sector (both community
aged care packages and community support (HACC)) employed, on average, an additional 1,696 FTE
direct care staff per year over the five years to 2012 staff per year (Table 4). The estimates in Table
27 suggest that, on average each year for the next ten years, the residential aged care sector, across
Australia will need to find 570 more (an additional 17%) FTE direct care staff than has been recruited
annually over the past five years. The community aged care sector will need to find, on average each
year for the next ten years, 120 more (and additional 7%) FTE direct community care staff than has
been recruited annually over the past five years for both community care and community support
services. These estimates are in addition to the number of staff needed to replace existing staff.
Table 28 estimates the number of additional staff required each year, on average, by occupational
group, assuming that the proportions of occupations within the industry remain the same as they
were in 2012. Again, these estimates are crude and provided to establish some perspective on the
future demand for occupational groups. The categories with the highest number of required
additional staff are that of PCAs and CCWs. The industry will also require an additional 778
registered nurses, 511 enrolled nurses and 335 additional allied health workers each year.
Table 28 Estimated number of additional staff over the decade to 2013: Australia
Residential aged care Community aged care Aged Care Industry
% d
istr
ibu
tio
n
20
13†
Est
nu
mb
er o
f
add
itio
nal
staf
f 2
01
3-2
3
Est
nu
mb
er o
f
add
itio
nal
staf
f p
er
year
20
13
-23
%
dis
trib
uti
on
20
13
Est
nu
mb
er o
f
add
itio
nal
staf
f 2
01
3-2
3
Est
nu
mb
er o
f
add
itio
nal
staf
f p
er
year
20
13
-23
Es
t n
um
ber
of
add
itio
nal
staf
f b
y 2
02
3
Est
nu
mb
er o
f
add
itio
nal
staf
f p
er
year
20
13
-23
Occupation
Nurse Practitioner 0.20% 75 8 0.1% 18 2 94 9
Registered Nurse 14.90% 5,605 561 12% 2,178 218 7,783 778
Enrolled Nurse 11.50% 4,326 433 4% 780 78 5,107 511
PCA/CCW 68.20% 25,657 2,566 76% 13,776 1,378 39,433 3,943
Allied Health workers
5.20% 1,956 196 8% 1,397 140 3,354 335
Total number (FTE) & (%)
100.00% 37,620 3,762 100% 18,150 1,815 55,770 5,577
† Based on data provided in Table 2 and Table 5.
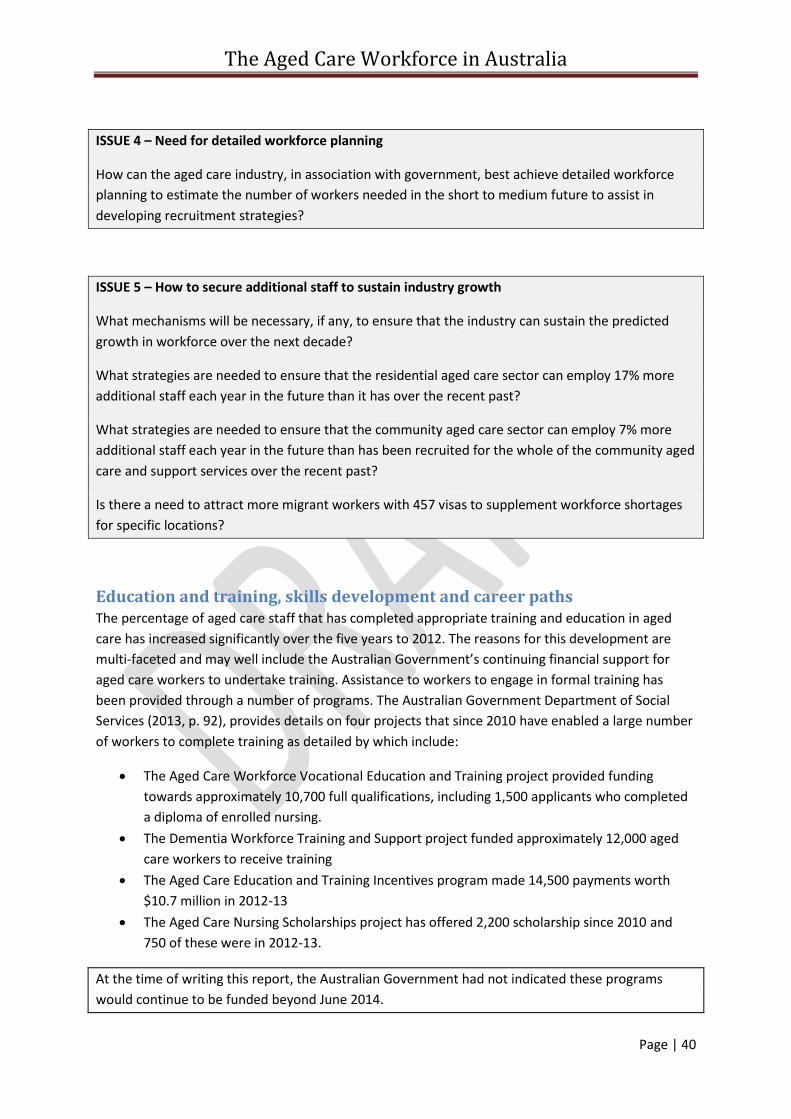
The Aged Care Workforce in Australia
Page | 40
ISSUE 4 – Need for detailed workforce planning
How can the aged care industry, in association with government, best achieve detailed workforce
planning to estimate the number of workers needed in the short to medium future to assist in
developing recruitment strategies?
ISSUE 5 – How to secure additional staff to sustain industry growth
What mechanisms will be necessary, if any, to ensure that the industry can sustain the predicted
growth in workforce over the next decade?
What strategies are needed to ensure that the residential aged care sector can employ 17% more
additional staff each year in the future than it has over the recent past?
What strategies are needed to ensure that the community aged care sector can employ 7% more
additional staff each year in the future than has been recruited for the whole of the community aged
care and support services over the recent past?
Is there a need to attract more migrant workers with 457 visas to supplement workforce shortages
for specific locations?
Education and training, skills development and career paths The percentage of aged care staff that has completed appropriate training and education in aged
care has increased significantly over the five years to 2012. The reasons for this development are
multi-faceted and may well include the Australian Government’s continuing financial support for
aged care workers to undertake training. Assistance to workers to engage in formal training has
been provided through a number of programs. The Australian Government Department of Social
Services (2013, p. 92), provides details on four projects that since 2010 have enabled a large number
of workers to complete training as detailed by which include:
The Aged Care Workforce Vocational Education and Training project provided funding
towards approximately 10,700 full qualifications, including 1,500 applicants who completed
a diploma of enrolled nursing.
The Dementia Workforce Training and Support project funded approximately 12,000 aged
care workers to receive training
The Aged Care Education and Training Incentives program made 14,500 payments worth
$10.7 million in 2012-13
The Aged Care Nursing Scholarships project has offered 2,200 scholarship since 2010 and
750 of these were in 2012-13.
At the time of writing this report, the Australian Government had not indicated these programs
would continue to be funded beyond June 2014.
The Aged Care Workforce in Australia
Page | 41
Despite the substantial government funding support for education and training, there has been
consistent criticisms of the quality of some aged care training programs that have been raised by
the Productivity Commission (2011) and the Department of Employment (November 2013). The
Australian Skills Quality Authority (2013, p. i) in a review of training for aged care workers came to
the conclusion that ‘many training programs are too short and provide insufficient time to enable
the proper development of all of the competency and skills that people should be gaining from the
training; and the workplace requirements for skills development and assessment are not clear
enough’. They recommended that (inter alia) minimum work placement hours and units of
competency be mandated, the principles of assessment be revised and the standards of assessment
be increased, benchmarks be developed for a range of indicators related to training.
In recognition of the expected expansion of the industry and its workforce, the continuation of
quality education and training program is essential for the maintenance of quality care.
While registered nurses have been identified by King et al (2013) as having a career pathway that
commenced in acute care, the same recognition has not been made for community care workers
and personal care attendants.
ISSUE 6 – Improve the quality of education and training and investigate opportunities for career
pathway development
What is the best mechanism for increasing the quality of education and training programs for aged
care workers?
How can we develop career pathways that attract and retain aged care workers?
Employment conditions and workplace culture A number of factors related to employment conditions that may improve recruitment, retention and
productivity emerge from this review of workforce issues. These factors included remuneration, job
security, training and development, mechanisms by which employees and employers can negotiate
part time hours worked, job status and recognition, and developing career prospects.
The Aged Care Financing Authority (2013, p. 59) estimates that registered nurses in aged care are
paid between $125 (DoHA estimate) and $208 (Australian Nursing Federation estimate) a week less
than those working in acute care. However in practice, this may be less for workers in not-for-profit
services who benefit from salary packaging. Lower levels of wages and salaries are the factors that
aged care workers cite as the most significant cause of dissatisfaction with work in the sector (see
page 30). This applies to both residential aged care and community aged care workers, and this
response has been consistently recorded on surveys over the past ten years. The Productivity
Commission (2011, p. 365) argued that an increase in the level of remuneration for aged care
workers will have a flow on effect by increasing the retention of workers, and result in higher quality
care. The Commission noted, however, that higher wage costs will need to be funded from higher
government subsidies, increased consumer co-payments or greater productivity.
The Aged Care Workforce in Australia
Page | 42
King, Wei and Howe (2013) report that, of employees surveyed in 2007, those employed on a casual
basis had a higher score for intention to leave than permanent employees. These authors report that
an increase in two points on the satisfaction scale would see a reduction in intention to leave’ by
10%. While the majority of persons who change jobs may do so for reasons other than lack of
satisfaction, a focus on those issues which cause satisfaction may improve worker retention. Austen
and colleagues (2013, p. 45) argue that ‘it is reasonable to assume that the lack of job security and
lack of leave entitlements inherent in a casual contracts will diminish the attractiveness of the sector
and make staying in the sector a less appealing and feasible alternative’.
What is not clear from the data that is available is the degree to which dissatisfaction with
employment conditions is related to the structural characteristics of providers. As most of the data is
aggregated, what is not clear is the extent to which ownership status (for-profit, not-for-profit or
government owned), size of service, size of employer or location, is a factor in influencing
satisfaction with employment (King & Martin, 2009). One factor identified for strategic focus will be
the cultural issues associated with the merging of the HACC program with the aged care program as
they have different historical development and cultural norms (Baldwin, 2013). Another limitation
with the data (King, Mavromaras, et al., 2013; Martin & King, 2008) is that it tends to be collected
from people who have stayed in employment and fails to capture the views of those who have
already left due to dissatisfaction.
Lack of respect for workers and recognition of their skills have emerged from the data as important
factors related to satisfaction and intention to leave. This is particularly the case for PCAs who,
although they are increasingly likely to have completed qualifications, are often deemed to be
‘unqualified’23. Migrant workers also have expressed a lack of recognition from workers and
management to their contribution to providing care for ethic specific clients and residents.
Another factor advocated by King, Wei and Howe (2013) that will increase satisfaction is to recognise
employees who experience ‘job lock’; that is, those who feel that they are locked into their job
because of their financial dependants, location (rural areas with few work alternative) or ethnicity. A
focus on the issues that will increase the satisfaction of these employees may not alter retention
rates but may improve on productivity.
ISSUE 7 – Improve workplace culture and conditions
What industry wide mechanisms are available to improve remuneration and working conditions that
will increase job satisfaction for aged care workers and improve retention?
Career paths/ job satisfaction/ job status
Residential care
Except for RNs, there is no clear pathway into aged care for residential aged care workers based on
the responses to questions related to previous employment in the 2012 survey of aged care workers.
Most RNs have a background in the acute care sector before entering aged care but it is not clear
23
This, of course, needs to be balanced with the findings that some education providers have been found to be lacking in the quality of their courses (see 45)
The Aged Care Workforce in Australia
Page | 43
what the decision making process is to move to aged care. Only about 10% of employees in the
residential aged care workforce entered aged care work as their first paid employment (King,
Mavromaras, et al., 2013, p. 27). Having entered aged care, a high percentage of employees appear
to stay a long time in the sector. In 2012, over 70% of RNs and ENs, 65% of allied health staff and
50% of PCAs had worked in aged care for more than 10 years; half of the RNs and ENs had worked in
the sector for more than 20 years. The shorter length of time working in aged care for PCAs may
reflect their older age at which they commenced working in aged care.
Aged care workers are often highly committed to their care recipients and job satisfaction may be
generated by the nature of the work itself and the capacity they feel to being able to carry out the
work effectively. The results of the questions on job satisfaction suggest that residential aged care
employees feel confident in their own skills to do the work, are able to use their skills and are
provided with training. They also feel like they receive the respect they deserve although PCAs felt
less satisfied with this aspect of their work than other workers (King, Mavromaras, et al., 2013, p.
36). The major area of frustration with the work is not having sufficient time to spend with each care
recipient.
An emerging issue in aged care is the importance of team work both in enhancing the work
satisfaction of individual workers but also in improving quality of care in relation to the increasing
range of skills needed to care for more complex residents with higher dependency needs. However,
there is little emphasis on these aspects of work in past workforce initiatives. Harley, Allen and
Sargent (2007) in an Australian study identified the importance of introducing the concept of high
performance work teams into residential aged care and found good results. More recently, Jeon
(2014) has highlighted the need for multidisciplinary teamwork to appropriately care for residents
with complex care needs and that a workforce that provides multidisciplinary support to nurses may
well result in better quality of care and job satisfaction for aged care workers.
A notable absence in the research data is the relationship between structural factors and job
satisfaction. Job satisfaction may be influenced by a lack of career opportunities that are not
available to staff in small facilities or in small organisations. Similarly, small organisations may
struggle to find the resources to allow staff to undertake professional development activities. There
are also the differences in the quality of the relationship between management and staff that can be
witnessed in small and large organisations. In small organisations, staff may find it difficult to avoid
contact with managers with which they do not feel comfortable. On the other hand, staff may feel
that managers are remote and out of touch in large organisations. Some researchers have called for
a comparative study of job satisfaction between for-profit and not-for-profit aged care providers in
Australia (Jackson, Mannix, & Daly, 2003).
Community care
King and colleagues (2013) report that there is no clear pathway into community aged care for
community care workers and allied health staff. RNs and ENs appear to have worked previously in
other health or social care areas before moving into community care. Community aged care is the
first job for only a small percentage of workers in all occupational groups. The background of CCWs
is diverse but is characterised by working environments that do not require qualifications (King,
Mavromaras, et al., 2013, p. 90).
The Aged Care Workforce in Australia
Page | 44
Nearly half (46%) of the community care workforce consists of staff who have been working in the
industry for more than ten years. Registered nurses have the longest experience in the industry with
67% of them having worked in aged care for more than 10 years. About 43% of community care
workers have been working in aged care for ten years or more, which may be accounted for by their
late age of entry compared with the other occupational groups. King and colleagues (2013) conclude
from their 2012 survey that once staff enter aged care, many of them stay for a long time, providing
a profile of an industry with a relatively stable workforce. This continues a similar profile they
reported from the 2007 survey (Martin & King, 2008).
A reliable predictor of intentions to stay or leave a workplace is overall job satisfaction. Job
satisfaction may overcome other negative factors such as poor pay. Community aged care
employees recorded higher job satisfaction scores than did residential aged care employees in the
recent survey and this was also true in 2007 (King, Mavromaras, et al., 2013, p. 95). Community care
employees were particularly satisfied with work life balance, teamwork, and the work itself. They
were most dissatisfied with their wages, job security, the hours they worked and opportunities to
develop their skills.
ISSUE 8 – Improve job satisfaction
How can we improve the understanding within the industry on the issue of job satisfaction and the
factors that influence it in order to increase retention and productivity (eg, pay, use of information
and communication technology, the impact of structural factors on job satisfaction such as the size
of facilities, the size of organisations, ownership status of service providers, balance between factors
that satisfy and those that dissatisfy).
Management competencies Management skills are repeatedly referred to as an area for improvement. However, those reporting
on ‘management skills’ generally fail to be specific as about specific skills. For example, the
Productivity Commission (2011, p. 358) in its final report into Caring for Older Australians made the
following comments in relation to management skills within the industry’.
‘During its industry visits it met with a number of providers and their staff who said they had minimal
turnover and virtually no use of agency staff. When questioned, both providers and staff attributed
this to good management practices. The variability of management within the aged care sector is an
important determinant of the attractiveness of individual service providers as places of employment —
it is also fundamental to ensuring the sustainability of the industry as a whole, since high turnover
rates reduce continuity of care for care recipients and the overall efficiency of labour and make it even
more difficult to meet the demographic and skills challenges.’
The Commission failed to be specific about the particular competencies or skills in management
which they had in mind when they recommended that ‘management skills’ needed improvement
through more assistance for workers to attend courses in management.
Improvement in leadership and management was identified as a major objective of the National
Aged Care Workforce Strategy developed by the Department of Health and Ageing (2005). This
objective was that ‘leadership and management within the residential aged care workforce support
competent, effective and innovative teams’. Again, such broad statements provide little to guide
The Aged Care Workforce in Australia
Page | 45
those with responsibility for developing programs in ‘leadership and management’ as to the
competencies towards which they should be aiming.
Similarly, in a small study examining the impact of reform on aged care nursing in Australia,
Venturato, Kellett and Windsor (2007, p. 11) concluded that ‘research supports a role for sensitive
and proactive nursing management during periods of industry reform as a retention strategy for
qualified nursing personnel’. However, they did not explore the competencies that would be
required to deliver ‘sensitive and proactive nursing management’. HWA has also made broad
recommendations on leadership capacity (Health Workforce Australia, 2012a) but without specific
detail. A project sponsored by the Australian Government in 2013 developed a draft for an Aged
Care Leadership Capability Framework, which was designed to specifically meet the needs for
leadership and management development in the aged care industry (Australian Government
Department of Industry, 2013).
The most recent survey of aged care workers (King, Mavromaras, et al., 2013) found that avoidance
of managers was the fourth most frequent reason given by residential aged care staff to leave their
previous aged care position, but was lower in community aged care. This response was balanced by
others that indicated the relationship between workers and managers in residential and community
aged care are relatively good despite the fact that a number of the reasons that impacted work
satisfaction scores were amenable to management influence. The survey results also suggested that
there was a relatively low level of management qualifications amongst those who supervise direct
care staff; Care Managers (20% had Certificate III or IV in management) and Care Leaders (6.5% had
Certificate III or IV in management), (King, Mavromaras, et al., 2013) with a similar result for
community aged care.
‘Management skills’ can be interpreted to include a wide range of competencies that cover the
spectrum of leadership and management. These competencies would most likely include financial
management, people management (staff, clients, residents, visitors and key stakeholders), mastery
of emotional intelligence and resilience, planning, organising and coordinating resources, services
and functions, and understanding, measuring, monitoring and guiding quality of care and quality of
life outcomes for residents and clients. What is missing from these recommendations and
observations cited above (and in many other reports and papers) are the specifics as to the
management skills and competencies perceived as lacking in the aged care industry. For example, it
may be that some aged care industry managers are very good at financial management but poor at
people management; others may excel at measuring and improving quality of care but fail in
organising and coordinating services and resources. The reverse of these examples are also likely to
be true. Leadership and management are complex issues and roles and what is needed is a more
nuanced discussion of the skills gaps among managers that, when filled, will result in improved
recruitment, retention and productivity.
ISSUE 9 – Improve management competencies in the aged care industry
What competencies should be targeted to improve those leadership and management practices that
have an impact on recruitment and retention?
The Aged Care Workforce in Australia
Page | 46
Use of technology The Productivity Commission (2011, p. 374) were of the view that the introduction of improved
information and communication technology will have an impact on both quality and productivity
within the aged care sector. Quality would be improved through the reduction in errors, for example
in medication administration, and more immediate access to information, particularly for
community care staff. Productivity could be improved through the reduction in the regulatory
reporting burden, the reduction in duplication of record keeping and a reduction in the time taken to
record care details. This is particularly useful for recording compliance with quality indicators.
However, the introduction of information and communication technology has implications for the
training and skilling of staff, the motivation of staff to master new systems, the leadership of
managers in introducing changes, the capacity of services and providers to invest in systems and to
manage the cost of their continuing support. Furthermore, investment in technology and the staff
skills to go with it is not a one off event. Technological innovation in aged care has been continuously
developing for the last two decades in both residential and community aged care, yet despite these
developments there is still the identified need for more development and workplace reform related
to this factor. There were a number of small scale projects funded by Health Workforce Australia
between 2011 and 2014 (see below) that focused on the use of information technology, however it
is not clear from the final report of these projects how the learnings from these demonstration
projects will be generalised to the wider industry. Moreover, the place of technological innovation in
addressing workforce issues is often written about in vague terms that suggest a lack of specificity in
the industry and what needs to be done from a strategic viewpoint to improve workforce issues.
ISSUE 10– Improve information and community technology to enhance retention and productivity
What are the initiatives that are needed to improve the information and communication technology
capacity of the aged care sector to have a bearing on staff satisfaction, productivity, efficiency and
quality of care?
How is knowledge about innovations in information technology disseminated across the aged care
system to assist all providers to adopt best practice?
Is there benefit in developing indicators of minimum standards in the adoption of best practice
information and communication technology to guide providers towards workforce reform?
Work roles/ models of care/ recruitment Work roles and models of care in aged care continue to change, while at the same time the basics of
providing care and assistance for the frail and disabled aged remain constant. The Queensland
Health and Community Services Workforce Council recently identified two simultaneous trends
across aged care; a move towards more integrated service delivery and an increased emphasis on
prevention and early intervention. The Community Services and Health Industry Skills Council, (2014)
identified new roles for aged care workers as including lifestyle coordinator, care coordinators and
The Aged Care Workforce in Australia
Page | 47
facilitators (although they provided no quantification on the extent of these new roles). The pursuit
of improved quality in aged care also generates changes in work roles and models of care.
In an initiative to improve the skills of aged care workers Health Workforce Australia sponsored 17
demonstration projects between January 2010 and January 2012 and a further 26 projects between
2013 to 2015 to trial individual workforce reform initiatives (Health Workforce Australia, 2013a). The
final report to the first round of projects (Health Workforce Australia, 2012b) identified a number of
findings from the demonstration studies and made a series of recommendations. The demonstration
programs were small local initiatives and these resulted in a number of positive experiences for the
project teams and the development of a competency framework. They also identified a number of
challenges to workforce and quality improvements such as industrial barriers to change,
inadequacies in information technology, a need to increase management competencies and improve
workplace culture. The ‘recommendations’ from the first round of projects focus on the identified
challenges and the further work that is needed to address these challenges, rather than practical
findings that can be applied to workforce solutions. They also recommended a shift away from the
funding of small pilots and single workforce change to a whole of workforce approach (Health
Workforce Australia, 2012b, pp. 5-6).
The second round of projects focused on four areas; safe medication management in the
community, planned health care in residential care, prevention of functional decline in the
community and complex care coordination in the community. A final evaluation report on these
projects is yet to be released. While these projects address important issues in relation to quality of
care, broadening of work roles and increase in productivity, they are essential small local projects
with no clear pathway for the generalizability of the findings across the sector or mechanisms for the
applications of the findings nationally. There is also the potential for duplication in effort from the
initiatives being funded by other programs such as those through the Community Services and
Health Industry Skills Council and the Aged Care Service Improvement and Healthy Ageing Grants
Fund offered through the Australian Government Department of Social Services.
Changing models of care and consumer profiles may have an impact on future recruitment by
requiring changes to the selection criteria for aged care staff. There are a number of indicators of the
need to for employers to review skills of new staff. The indicators include the introduction of person
centred care to all of community aged care services, its expansion into residential aged care and the
increased acuity of both community aged care clients and residential aged care residents. A focus on
medication management and increased use of technology in both community and residential care
suggests that employers will be expecting future employees to have broader skills than has been the
case in the past.
This need for a more highly skilled workforce in the future will have multiple impacts. It will increase
the challenges of recruiting suitably qualified staff, increase and/or change the need for additional
education and training, and will require nurses in residential aged care to have greater technical
skills to manage a higher percentage of residents with higher palliative care needs. In recent years,
the percentage of registered nurses in the residential aged care sector has declined from 21.4% in
2003 to 14.7% in 2012 (King, Mavromaras, et al., 2013, p. 10). This decline may need to be revisited
in the near future if the increase in acuity and morbidity of residential aged care residents continues
to increase.
The Aged Care Workforce in Australia
Page | 48
Issue 11– Improve mechanisms for developing changed models of care
What is the best mechanism to undertake large scale and more effective sector wide initiatives
examining work roles, cultural changes, services redesign and quality improvement rather than the
small scale localised projects of the recent past?
ISSUE 12– Preparing for future recruitment
If the skills required by the aged care industry in the future are different to those of the past, what
do we need to do to identify what these skills are, who should have them and what changes need to
be made to recruitment strategies to prepare for the future?
The Aged Care Workforce in Australia
Page | 49
OPTIONS
Which issues are addressed by this option?
What are the preferred options?
Recommendations
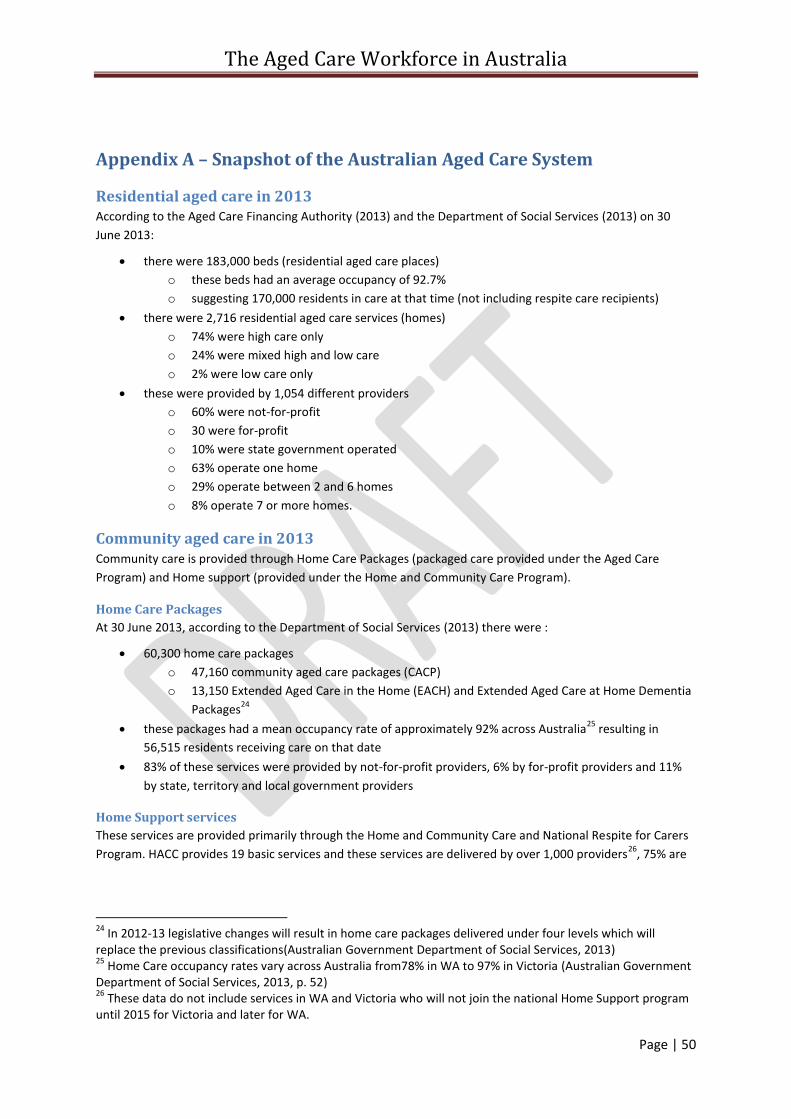
The Aged Care Workforce in Australia
Page | 50
Appendix A – Snapshot of the Australian Aged Care System
Residential aged care in 2013 According to the Aged Care Financing Authority (2013) and the Department of Social Services (2013) on 30
June 2013:
there were 183,000 beds (residential aged care places)
o these beds had an average occupancy of 92.7%
o suggesting 170,000 residents in care at that time (not including respite care recipients)
there were 2,716 residential aged care services (homes)
o 74% were high care only
o 24% were mixed high and low care
o 2% were low care only
these were provided by 1,054 different providers
o 60% were not-for-profit
o 30 were for-profit
o 10% were state government operated
o 63% operate one home
o 29% operate between 2 and 6 homes
o 8% operate 7 or more homes.
Community aged care in 2013 Community care is provided through Home Care Packages (packaged care provided under the Aged Care
Program) and Home support (provided under the Home and Community Care Program).
Home Care Packages
At 30 June 2013, according to the Department of Social Services (2013) there were :
60,300 home care packages
o 47,160 community aged care packages (CACP)
o 13,150 Extended Aged Care in the Home (EACH) and Extended Aged Care at Home Dementia
Packages24
these packages had a mean occupancy rate of approximately 92% across Australia25
resulting in
56,515 residents receiving care on that date
83% of these services were provided by not-for-profit providers, 6% by for-profit providers and 11%
by state, territory and local government providers
Home Support services
These services are provided primarily through the Home and Community Care and National Respite for Carers
Program. HACC provides 19 basic services and these services are delivered by over 1,000 providers26
, 75% are
24
In 2012-13 legislative changes will result in home care packages delivered under four levels which will replace the previous classifications(Australian Government Department of Social Services, 2013) 25
Home Care occupancy rates vary across Australia from78% in WA to 97% in Victoria (Australian Government Department of Social Services, 2013, p. 52) 26
These data do not include services in WA and Victoria who will not join the national Home Support program until 2015 for Victoria and later for WA.
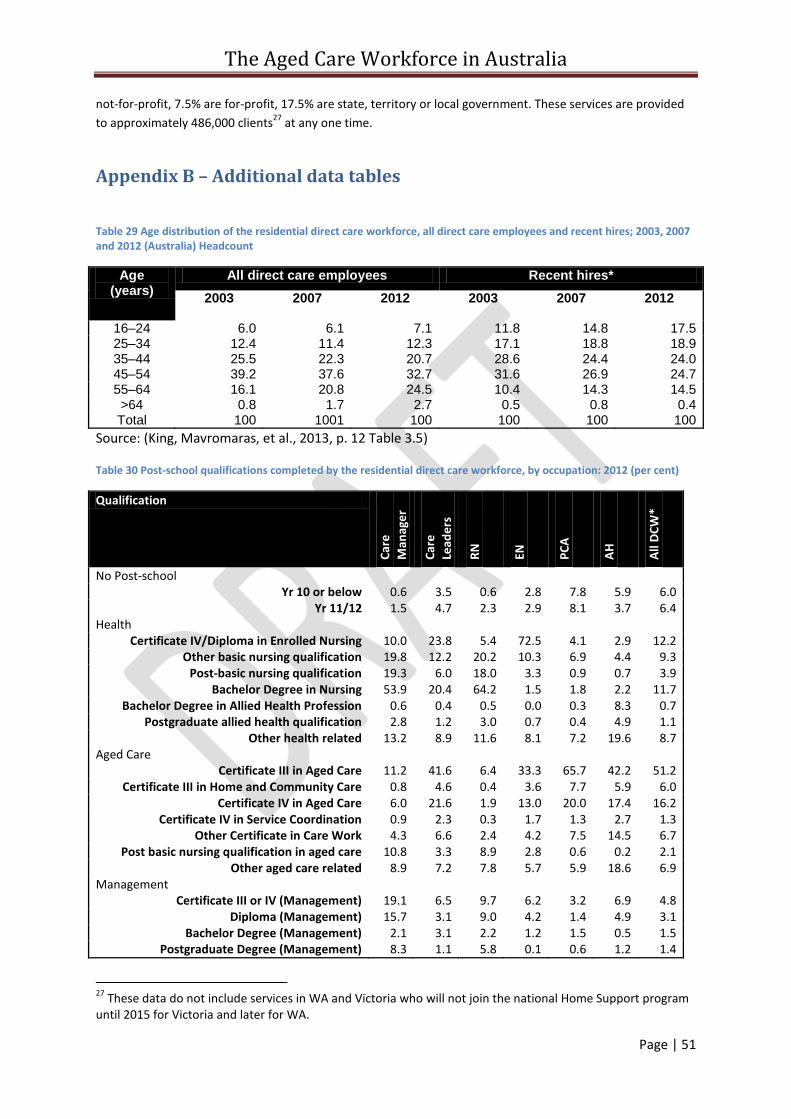
The Aged Care Workforce in Australia
Page | 51
not-for-profit, 7.5% are for-profit, 17.5% are state, territory or local government. These services are provided
to approximately 486,000 clients27
at any one time.
Appendix B – Additional data tables
Table 29 Age distribution of the residential direct care workforce, all direct care employees and recent hires; 2003, 2007 and 2012 (Australia) Headcount
Age (years)
All direct care employees Recent hires*
2003 2007 2012 2003 2007 2012
16–24 6.0 6.1 7.1 11.8 14.8 17.5 25–34 12.4 11.4 12.3 17.1 18.8 18.9 35–44 25.5 22.3 20.7 28.6 24.4 24.0 45–54 39.2 37.6 32.7 31.6 26.9 24.7 55–64 16.1 20.8 24.5 10.4 14.3 14.5 >64 0.8 1.7 2.7 0.5 0.8 0.4 Total 100 1001 100 100 100 100
Source: (King, Mavromaras, et al., 2013, p. 12 Table 3.5)
Table 30 Post-school qualifications completed by the residential direct care workforce, by occupation: 2012 (per cent)
Qualification
Car
e
Man
age
r
Car
e
Lead
ers
RN
EN
PC
A
AH
All
DC
W*
No Post-school Yr 10 or below 0.6 3.5 0.6 2.8 7.8 5.9 6.0
Yr 11/12 1.5 4.7 2.3 2.9 8.1 3.7 6.4 Health
Certificate IV/Diploma in Enrolled Nursing 10.0 23.8 5.4 72.5 4.1 2.9 12.2 Other basic nursing qualification 19.8 12.2 20.2 10.3 6.9 4.4 9.3
Post-basic nursing qualification 19.3 6.0 18.0 3.3 0.9 0.7 3.9 Bachelor Degree in Nursing 53.9 20.4 64.2 1.5 1.8 2.2 11.7
Bachelor Degree in Allied Health Profession 0.6 0.4 0.5 0.0 0.3 8.3 0.7 Postgraduate allied health qualification 2.8 1.2 3.0 0.7 0.4 4.9 1.1
Other health related 13.2 8.9 11.6 8.1 7.2 19.6 8.7 Aged Care
Certificate III in Aged Care 11.2 41.6 6.4 33.3 65.7 42.2 51.2 Certificate III in Home and Community Care 0.8 4.6 0.4 3.6 7.7 5.9 6.0
Certificate IV in Aged Care 6.0 21.6 1.9 13.0 20.0 17.4 16.2 Certificate IV in Service Coordination 0.9 2.3 0.3 1.7 1.3 2.7 1.3
Other Certificate in Care Work 4.3 6.6 2.4 4.2 7.5 14.5 6.7 Post basic nursing qualification in aged care 10.8 3.3 8.9 2.8 0.6 0.2 2.1
Other aged care related 8.9 7.2 7.8 5.7 5.9 18.6 6.9 Management
Certificate III or IV (Management) 19.1 6.5 9.7 6.2 3.2 6.9 4.8 Diploma (Management) 15.7 3.1 9.0 4.2 1.4 4.9 3.1
Bachelor Degree (Management) 2.1 3.1 2.2 1.2 1.5 0.5 1.5 Postgraduate Degree (Management) 8.3 1.1 5.8 0.1 0.6 1.2 1.4
27
These data do not include services in WA and Victoria who will not join the national Home Support program until 2015 for Victoria and later for WA.
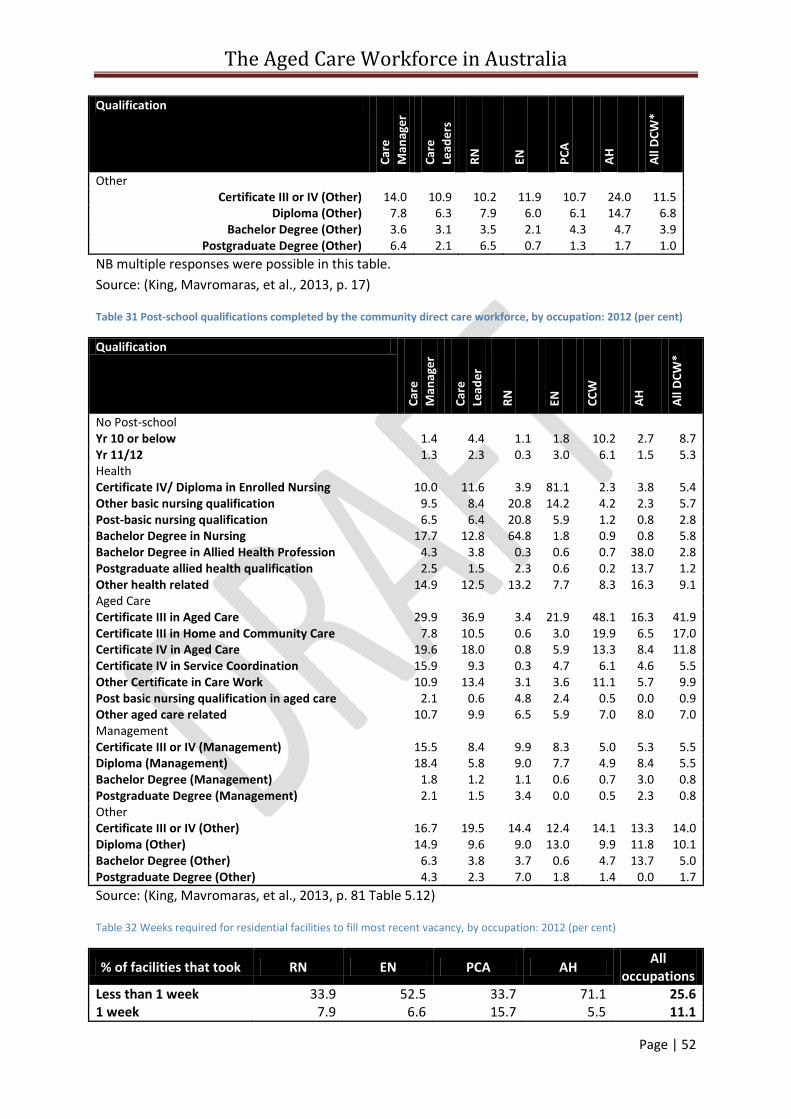
The Aged Care Workforce in Australia
Page | 52
Qualification
Car
e
Man
age
r
Car
e
Lead
ers
RN
EN
PC
A
AH
All
DC
W*
Other Certificate III or IV (Other) 14.0 10.9 10.2 11.9 10.7 24.0 11.5
Diploma (Other) 7.8 6.3 7.9 6.0 6.1 14.7 6.8 Bachelor Degree (Other) 3.6 3.1 3.5 2.1 4.3 4.7 3.9
Postgraduate Degree (Other) 6.4 2.1 6.5 0.7 1.3 1.7 1.0
NB multiple responses were possible in this table.
Source: (King, Mavromaras, et al., 2013, p. 17)
Table 31 Post-school qualifications completed by the community direct care workforce, by occupation: 2012 (per cent)
Qualification
Car
e
Man
age
r
Car
e
Lead
er
RN
EN
CC
W
AH
All
DC
W*
No Post-school Yr 10 or below 1.4 4.4 1.1 1.8 10.2 2.7 8.7 Yr 11/12 1.3 2.3 0.3 3.0 6.1 1.5 5.3 Health Certificate IV/ Diploma in Enrolled Nursing 10.0 11.6 3.9 81.1 2.3 3.8 5.4 Other basic nursing qualification 9.5 8.4 20.8 14.2 4.2 2.3 5.7 Post-basic nursing qualification 6.5 6.4 20.8 5.9 1.2 0.8 2.8 Bachelor Degree in Nursing 17.7 12.8 64.8 1.8 0.9 0.8 5.8 Bachelor Degree in Allied Health Profession 4.3 3.8 0.3 0.6 0.7 38.0 2.8 Postgraduate allied health qualification 2.5 1.5 2.3 0.6 0.2 13.7 1.2 Other health related 14.9 12.5 13.2 7.7 8.3 16.3 9.1 Aged Care Certificate III in Aged Care 29.9 36.9 3.4 21.9 48.1 16.3 41.9 Certificate III in Home and Community Care 7.8 10.5 0.6 3.0 19.9 6.5 17.0 Certificate IV in Aged Care 19.6 18.0 0.8 5.9 13.3 8.4 11.8 Certificate IV in Service Coordination 15.9 9.3 0.3 4.7 6.1 4.6 5.5 Other Certificate in Care Work 10.9 13.4 3.1 3.6 11.1 5.7 9.9 Post basic nursing qualification in aged care 2.1 0.6 4.8 2.4 0.5 0.0 0.9 Other aged care related 10.7 9.9 6.5 5.9 7.0 8.0 7.0 Management Certificate III or IV (Management) 15.5 8.4 9.9 8.3 5.0 5.3 5.5 Diploma (Management) 18.4 5.8 9.0 7.7 4.9 8.4 5.5 Bachelor Degree (Management) 1.8 1.2 1.1 0.6 0.7 3.0 0.8 Postgraduate Degree (Management) 2.1 1.5 3.4 0.0 0.5 2.3 0.8 Other Certificate III or IV (Other) 16.7 19.5 14.4 12.4 14.1 13.3 14.0 Diploma (Other) 14.9 9.6 9.0 13.0 9.9 11.8 10.1 Bachelor Degree (Other) 6.3 3.8 3.7 0.6 4.7 13.7 5.0 Postgraduate Degree (Other) 4.3 2.3 7.0 1.8 1.4 0.0 1.7
Source: (King, Mavromaras, et al., 2013, p. 81 Table 5.12)
Table 32 Weeks required for residential facilities to fill most recent vacancy, by occupation: 2012 (per cent)
% of facilities that took RN EN PCA AH All
occupations Less than 1 week 33.9 52.5 33.7 71.1 25.6 1 week 7.9 6.6 15.7 5.5 11.1
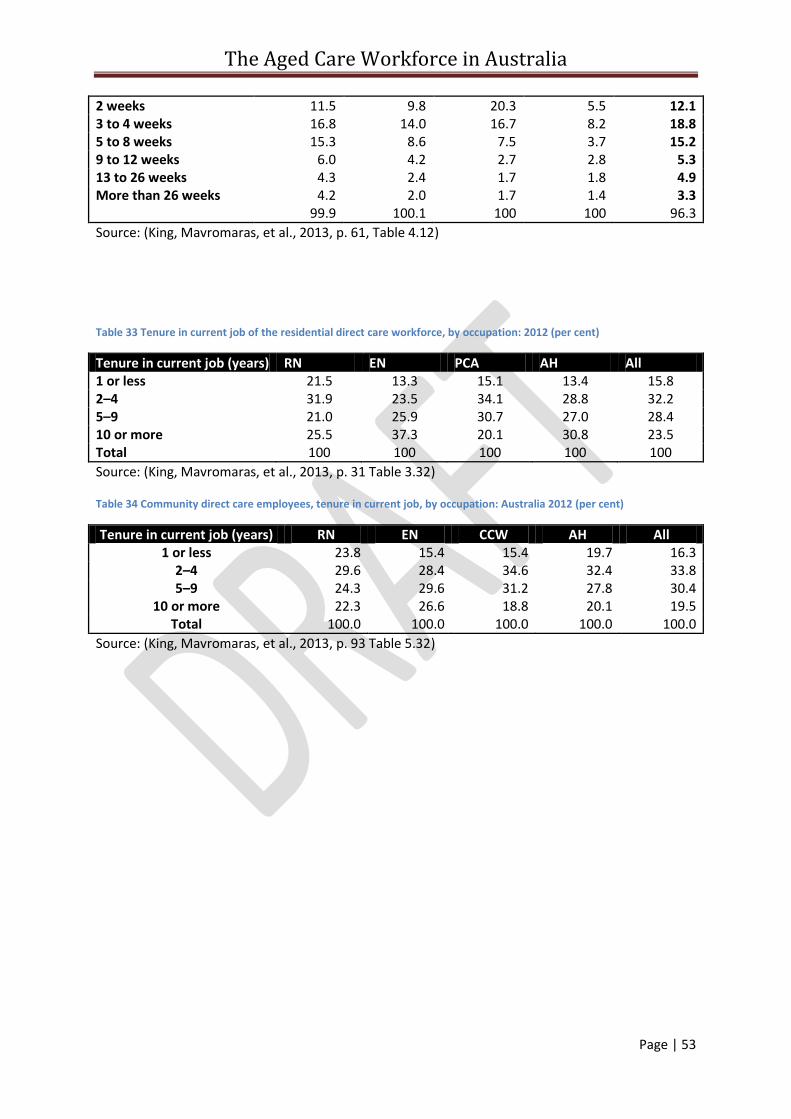
The Aged Care Workforce in Australia
Page | 53
2 weeks 11.5 9.8 20.3 5.5 12.1 3 to 4 weeks 16.8 14.0 16.7 8.2 18.8 5 to 8 weeks 15.3 8.6 7.5 3.7 15.2 9 to 12 weeks 6.0 4.2 2.7 2.8 5.3 13 to 26 weeks 4.3 2.4 1.7 1.8 4.9 More than 26 weeks 4.2 2.0 1.7 1.4 3.3 99.9 100.1 100 100 96.3
Source: (King, Mavromaras, et al., 2013, p. 61, Table 4.12)
Table 33 Tenure in current job of the residential direct care workforce, by occupation: 2012 (per cent)
Tenure in current job (years) RN EN PCA AH All 1 or less 21.5 13.3 15.1 13.4 15.8 2–4 31.9 23.5 34.1 28.8 32.2 5–9 21.0 25.9 30.7 27.0 28.4 10 or more 25.5 37.3 20.1 30.8 23.5 Total 100 100 100 100 100
Source: (King, Mavromaras, et al., 2013, p. 31 Table 3.32)
Table 34 Community direct care employees, tenure in current job, by occupation: Australia 2012 (per cent)
Tenure in current job (years) RN EN CCW AH All 1 or less 23.8 15.4 15.4 19.7 16.3
2–4 29.6 28.4 34.6 32.4 33.8 5–9 24.3 29.6 31.2 27.8 30.4
10 or more 22.3 26.6 18.8 20.1 19.5 Total 100.0 100.0 100.0 100.0 100.0
Source: (King, Mavromaras, et al., 2013, p. 93 Table 5.32)
The Aged Care Workforce in Australia
Page | 54
References Aged and Community Services Association. (2010). ACSA’s Submission to the Productivity
Commission Inquiry Into Caring for Older Australians. Canberra: Aged and Community Services Association.
Aged Care Financing Authority. (2013). Inaugural Report on the funding and financing of the Aged Care Sector. Canberra: Australian Government Department of Health and Ageing.
Austen, S., Mcmurray, C., Lewin, G., & Ong, R. (2013). Retaining workers in an ageing population: Insights from a representative aged and community care organisation. Australasian Journal on Ageing, 32(1), 41-46. doi: 10.1111/j.1741-6612.2012.00599.x
Australian Bureau for Statistics. (2008). Labour Mobility, Australia, Feb 2008 62090DO001_200802. Canberra: ABS Retrieved from http://www.abs.gov.au/AUSSTATS/[email protected]/DetailsPage/6209.0Feb%202008?OpenDocument.
Australian Bureau for Statistics. (2013). Labour Mobility, Australia, February 2013 62090DO001_201302 Canberra: ABS Retrieved from http://www.abs.gov.au/AUSSTATS/[email protected]/DetailsPage/6209.0February%202013?OpenDocument.
Australian Bureau of Statistics. (2013a). 3238.0.55.001 - Estimates of Aboriginal and Torres Strait Islander Australians, June 2011. Canberra: ABS Retrieved from http://www.abs.gov.au/ausstats/[email protected]/latestProducts/3238.0.55.001Media%20Release1June%202011.
Australian Bureau of Statistics. (2013b). 3412.0 - Migration, Australia, 2011-12 and 2012-13. Canberra: ABS Retrieved from http://www.abs.gov.au/ausstats/[email protected]/Lookup/3412.0Chapter12011-12%20and%202012-13.
Australian Government Department of Education Employment and Workplace Relations. (2012). Profile of the Aged Care Workforce Aged Care Sector Forum Central Coast-Hunter Region February 2012. Canberra.
Australian Government Department of Employment. (2013). Skill shortage research methodology. Canberra: DoE.
Australian Government Department of Employment. (November 2013). Labour Market Rating ANZSCO 4233-12 Nursing Support Worker, Australia Canberra: Department of Employment.
Australian Government Department of Employment. (October 2013). Labour market rating ANZSCO 4233-13 Personal Care Assistant, Australia. Canberra: DoE.
Australian Government Department of Health and Ageing. (2010a). Report on the operations of the Aged Care Act 1997 1 July 2009 to 30 June 2010. Canberra: DoHA.
Australian Government Department of Health and Ageing. (2010b). Submission to the Productivity Commission inquiry into Caring for Older Australians. Canberra: DoHA.
Australian Government Department of Industry, I., Climate Change, Science, Research and Tertiary Education,. (2013). Australian Aged Care Leadership Capability Framework For all leaders in Aged Care Draft for Review: September 2013. Canberra: Department of Industry, Innovation, Climate Change, Science, Research and Tertiary Education.
Australian Government Department of Social Services. (2013). Report on the Operation of the Aged Care Act 1997 2012-13 Canberra: DoSS.
Australian Government Departmernt of Health and Ageing. (2005). National Aged Care Workforce Strategy. Canberra: DoHA.
Australian Institute of Health and Welfare. (2012). Residential aged care in Australia 2010–11: a statistical overview. Aged care statistics series no. 36. Cat. no. AGE 68. Canberra.
Australian Institute of Health and Welfare. (2014). Residential and community aged care supplementary data. Retrieved 22 April, 2014, from http://www.aihw.gov.au/aged-care/residential-and-community-2011-12/data/
The Aged Care Workforce in Australia
Page | 55
Australian Skills Quality Authority. (2013). Training for aged and community care in Australia: A national strategic review of registered training organisations offering aged and community care sector training. Canberra: Australian Skills Quality Authority.
Australian Workforce and Productivity Agency. (2013). Industry snapshot 2013: Health care and social assistance. Canberra: AWPA.
Baldwin, R. (2013). Building a resilient and sustainable workforce in aged care. Contemporary Nurse, 45(1).
Chomik, R., & MacLennan, M. (2014). Aged care in Australia: Part II – Industry and practice - CEPAR research brief 2014/02. Kensington, NSW: ARC Centre of Excellence in Population Ageing Research (CEPAR).
Community Services and Health Industry Skills Council. (2014). Environmental Scan 2014 agenda for change. Canberra: Community Services & Health Industry Skills Council,.
Fine, M. D., & Mitchell, A. (2007). Immigration and the aged care workforce in Australia: Meeting the deficit. Australasian Journal on Ageing, 26(4), 157-161. doi: 10.1111/j.1741-6612.2007.00259.x
Frizzell, J., Barrow, D., & Leo, M. D. (2007). Community Care Worker Human Resources Kit. Melbourne: Victorian Government Department of Human Services.
Harley, B., Allen, B. C., & Sargent, L. D. (2007). High Performance Work Systems and Employee Experience of Work in the Service Sector: The Case of Aged Care. British Journal of Industrial Relations, 45(3), 607-633. doi: 10.1111/j.1467-8543.2007.00630.x
Health Workforce Australia. (2012a). Health Workforce 2025 - Doctors, Nurses and Midwives - Volume 1. Adelaide: HWA.
Health Workforce Australia. (2012b). Workforce Innovation: Caring for Older People program – Final Report. Adelaide: HWA.
Health Workforce Australia. (2013a). The National Health Workforce Innovation and Reform Strategic Framework for Action 2011–2015: Implementation Progress Report July 2012 – June 2013. Adelaide: HWA.
Health Workforce Australia. (2013b). Work Plan 2013-214. Adelaide: HWA. Hugo, G. (2007). Contextualising the 'Crisis in Aged Care' in Australia : A Demographic Perspective.
Australian Journal of Social Issues (Australian Council of Social Service), 42(2), 169-182. Hussein, S., & Manthorpe, J. (2005). An International Review of Long-Term Care Workforce Policies
and Shortages. Journal of Aging and Social Policy, 17(4), 75-94. Jackson, D., Mannix, J., & Daly, J. (2003). Nursing staff shortages: issues in Australian residential aged
care. Australian Journal of Advanced Nursing, 21(1), 42-45. Jeon, Y.-H. (2014). Breaking down professional barriers in aged care. Australian Ageing Agenda,
February 11. King, D., & Martin, B. (2009). Caring for Profit? The impact of for-profit providers on the quality of
employment in paid care. In D. King & G. Meagher (Eds.), Paid care in Australia politics, profites, proactices. Sydney: Sydney University Press.
King, D., Mavromaras, K., He, B., Healy, J., Macaitis, K., Moskos, M., . . . Wei, Z. (2013). The Aged Care Workforce 2012 Final Report. Canberra: DoHA.
King, D., Wei, Z., & Howe, A. (2013). Work Satisfaction and Intention to Leave Among Direct Care Workers in Community and Residential Aged Care in Australia. Journal of Aging & Social Policy, 25(4), 301-319. doi: 10.1080/08959420.2013.816166
Local Government Practice Unit. (2013). Future-Proofing Local Government: National Workforce Strategy 2013–2020. Melbourne: Local Government Managers Australia (LGMA).
Martin, B., & King, D. (2008). Who Cares for Older Australians? A Picture of the Residential and Community based Aged Care Workforce, 2007. National Institute of Labour Studies: Flinders University, South Australia.
National Aged Care Alliance. (2012). Aged Care Reform Series - Workforce. Adelaide: NACA.
The Aged Care Workforce in Australia
Page | 56
National Disability Services. (2014). Forming a national disability workforce strategy; National Disability Services (NDS) discussion paper. Canberra: National Disability Services.
Productivity Commission. (2011). Caring for Older Australians, Report No. 53, Final Inquiry Report. Canberra: PC.
Radford, K., Shacklock, K., & Bradley, G. (2013). Personal care workers in Australian aged care: retention and turnover intentions. Journal of Nursing Management, n/a-n/a. doi: 10.1111/jonm.12172
Venturato, L., Kellett, U., & Windsor, C. (2007). Nurses’ experiences of practice and political reform in long-term aged care in Australia: implications for the retention of nursing personnel. Journal of Nursing Management, 15(1), 4-11. doi: 10.1111/j.1365-2934.2006.00610.x