Embed Size (px)
DESCRIPTION
The Adult Education Survey Eurociett/UNI Europa Joint Conference 4th December 2008, Bruxelles. Sadiq Kwesi Boateng European Commission Eurostat, Unit F4 Education. Contact persons at Eurostat : [email protected] , [email protected]. Methodology. - PowerPoint PPT Presentation
Citation preview
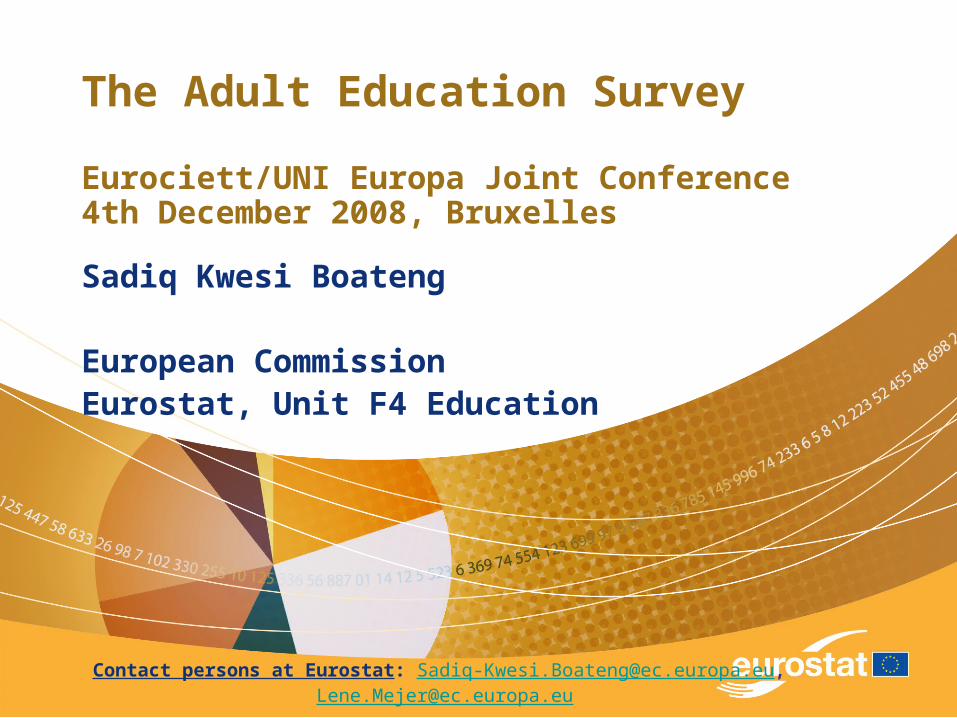
The Adult Education Survey
Eurociett/UNI Europa Joint Conference 4th December 2008, Bruxelles
Sadiq Kwesi Boateng
European CommissionEurostat, Unit F4 Education
Contact persons at Eurostat: [email protected], [email protected]
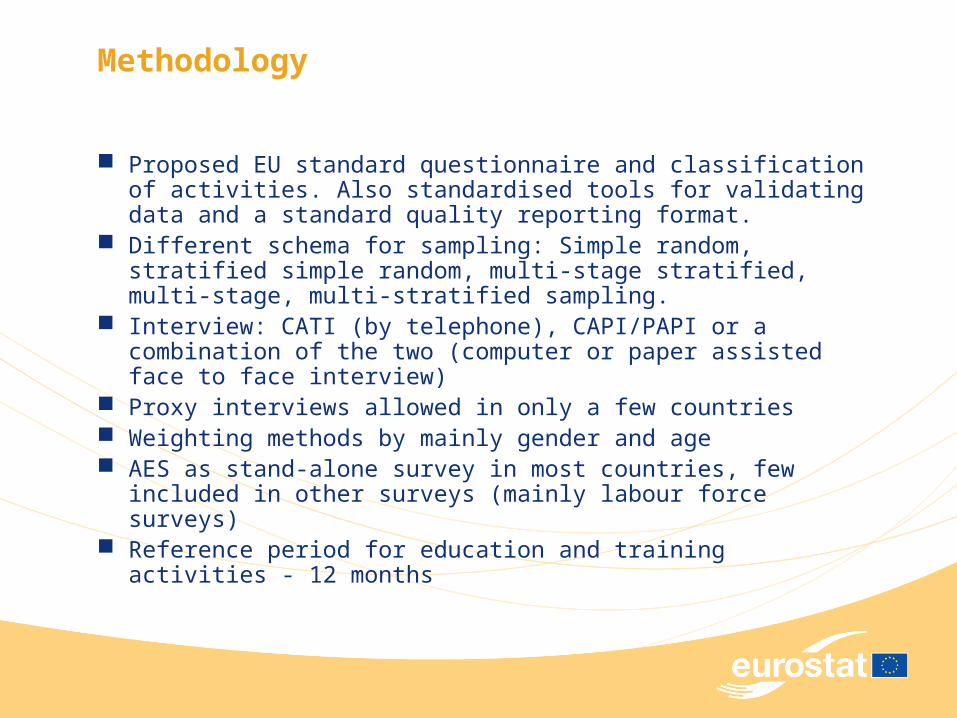
Methodology
Proposed EU standard questionnaire and classification of activities. Also standardised tools for validating data and a standard quality reporting format.
Different schema for sampling: Simple random, stratified simple random, multi-stage stratified, multi-stage, multi-stratified sampling.
Interview: CATI (by telephone), CAPI/PAPI or a combination of the two (computer or paper assisted face to face interview)
Proxy interviews allowed in only a few countries Weighting methods by mainly gender and age AES as stand-alone survey in most countries, few included in
other surveys (mainly labour force surveys) Reference period for education and training activities - 12
months
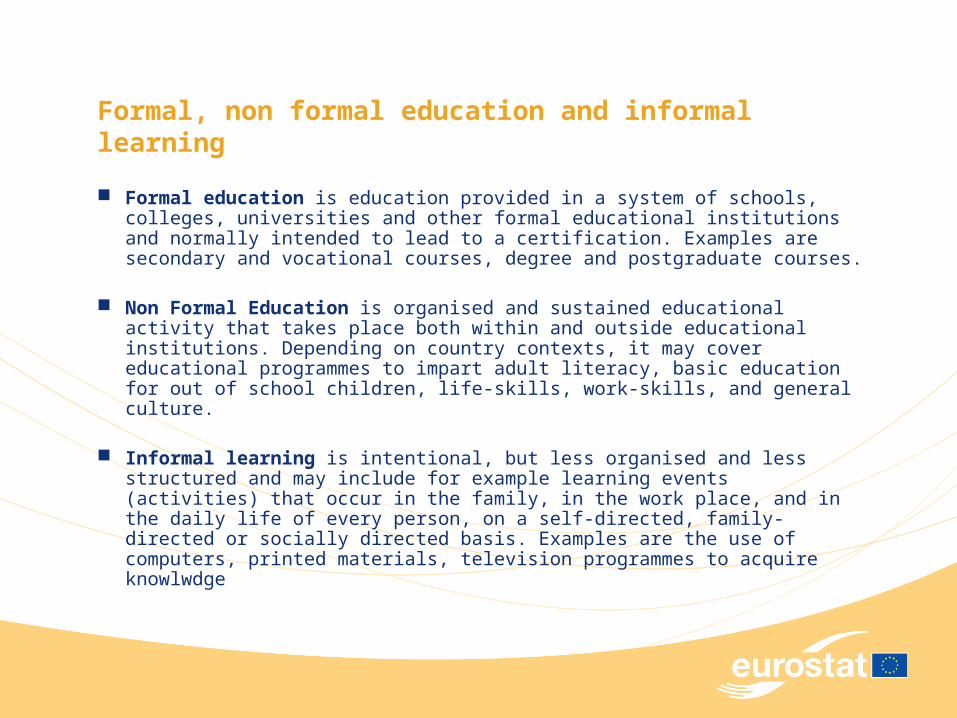
Formal, non formal education and informal learning
Formal education is education provided in a system of schools, colleges, universities and other formal educational institutions and normally intended to lead to a certification. Examples are secondary and vocational courses, degree and postgraduate courses.
Non Formal Education is organised and sustained educational activity that takes place both within and outside educational institutions. Depending on country contexts, it may cover educational programmes to impart adult literacy, basic education for out of school children, life-skills, work-skills, and general culture.
Informal learning is intentional, but less organised and less structured and may include for example learning events (activities) that occur in the family, in the work place, and in the daily life of every person, on a self-directed, family-directed or socially directed basis. Examples are the use of computers, printed materials, television programmes to acquire knowlwdge
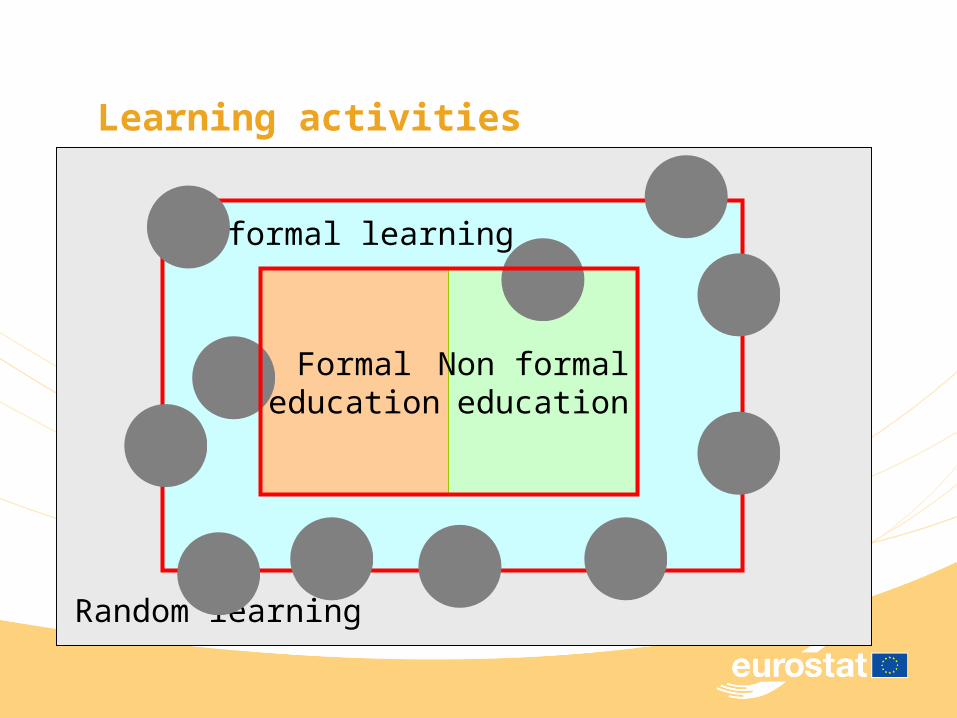
Learning activities
Formaleducation
Non formal education
Informal learning
Random learning
Adult Education Survey - results-
Data can be found on Eurostat’s website:
http://ec.europa.eu/eurostat
-> switch to ‘data’ mode and click on the following headings:
-> Education and Training -> Training -> Adult education survey
Data are provisional for France and Slovakia The slides on Language skills and ICT skills are not
published yet (forthcoming) and should therefore not be used for further quotation.
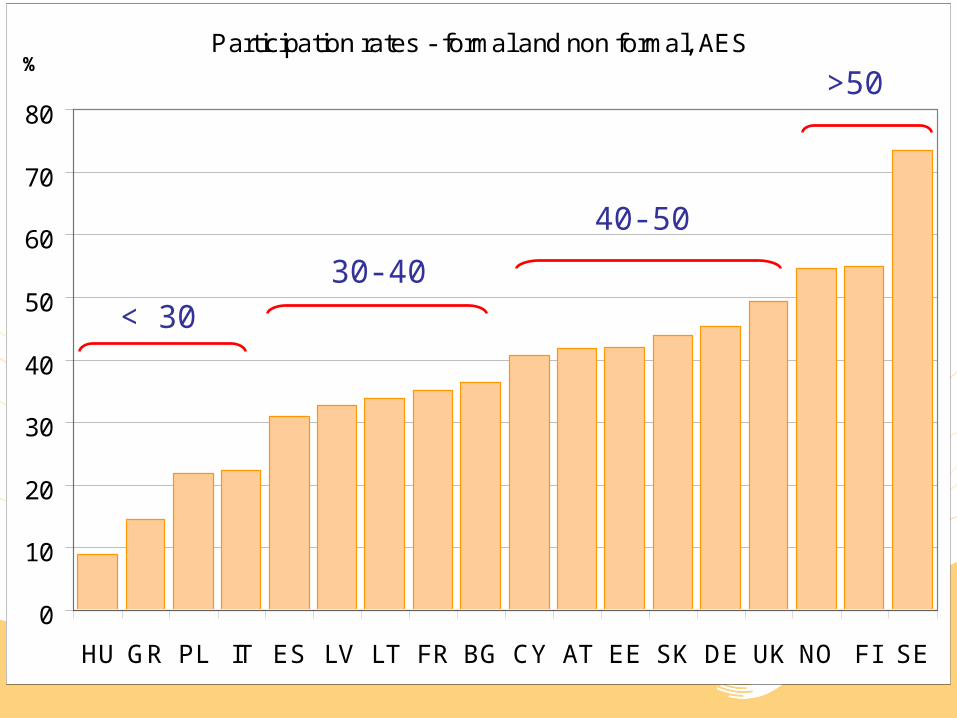
Participation rates - formal and non formal, AES
0
10
20
30
40
50
60
70
80
HU GR PL IT ES LV LT FR BG CY AT EE SK DE UK NO FI SE
%
< 30
30-40
40-50
>50
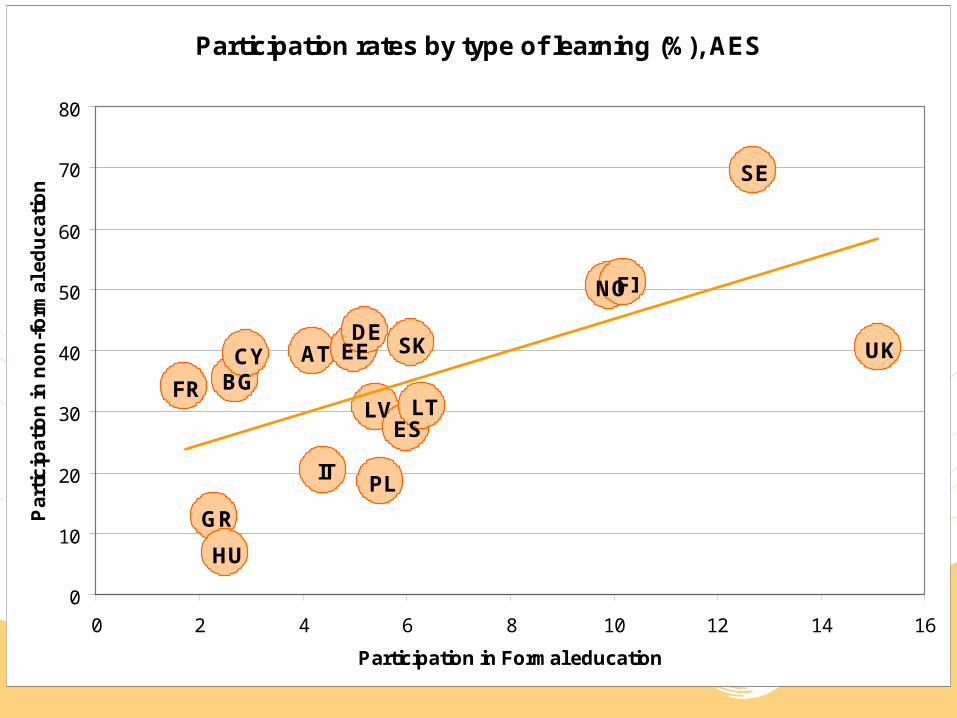
Participation rates by type of learning (%), AES
UK
SE
FINO
LT
SK
ES
PL
LV
DEEE
IT
ATCYBG
HU
GR
FR
0
10
20
30
40
50
60
70
80
0 2 4 6 8 10 12 14 16
Participation in Formal education
Pa
rtic
ipa
tio
n in
no
n-f
orm
al e
du
ca
tio
n
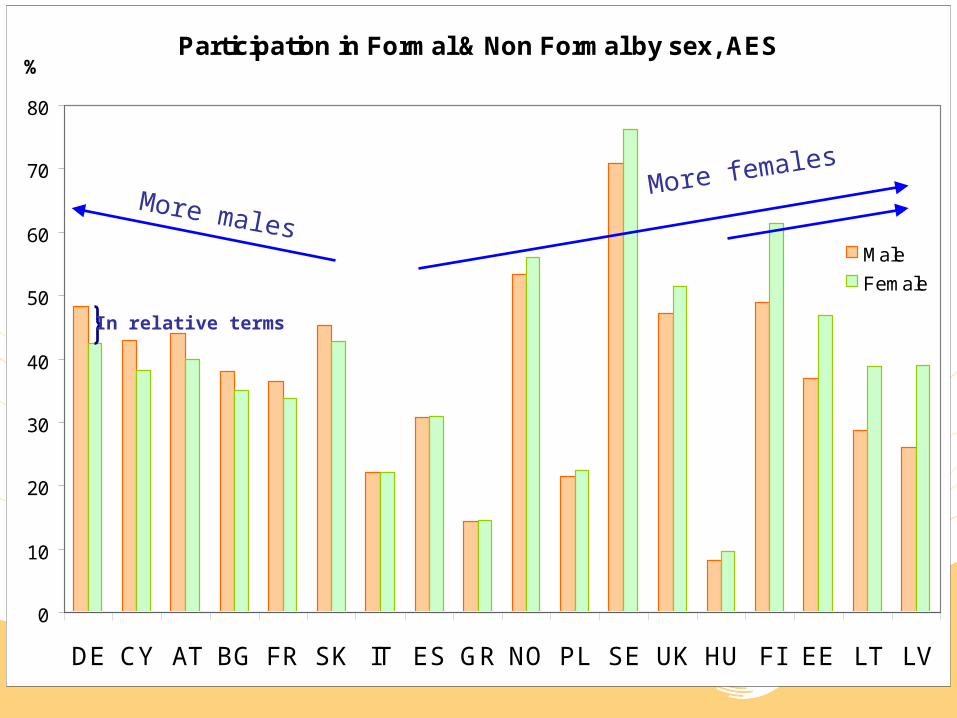
Participation in Formal & Non Formal by sex, AES
0
10
20
30
40
50
60
70
80
DE CY AT BG FR SK IT ES GR NO PL SE UK HU FI EE LT LV
%
Male
Female
More females
In relative terms
More males
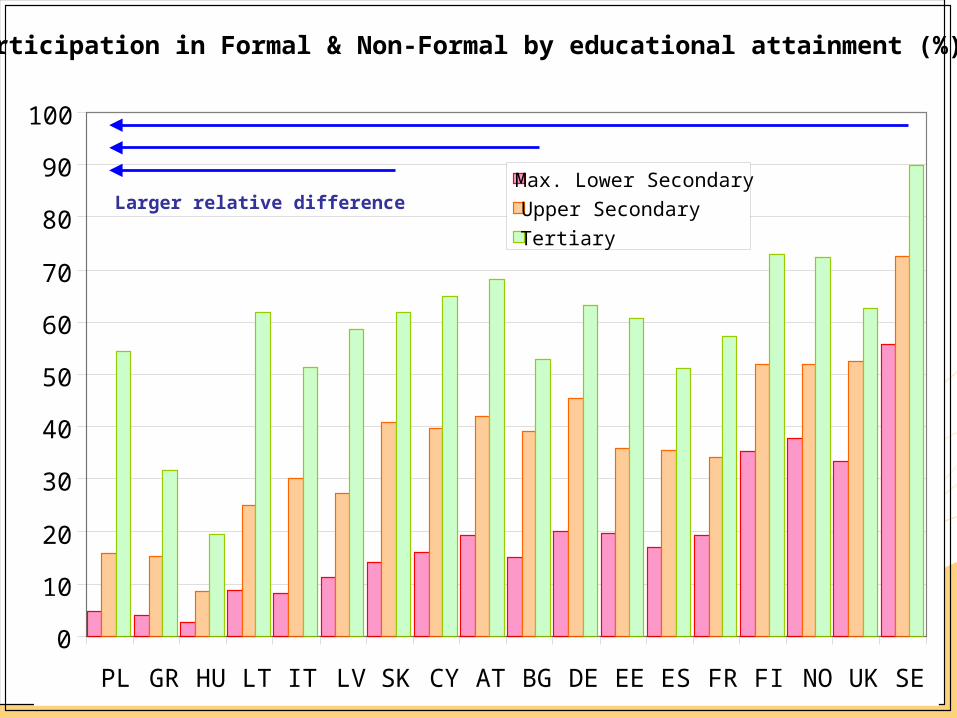
Participation in Formal & Non-Formal by educational attainment (%), AES
0
10
20
30
40
50
60
70
80
90
100
Max. Lower Secondary
Upper Secondary
Tertiary
Larger relative difference
PL GR HU LT IT LV SK CY AT BG DE EE ES FR FI NO UK SE
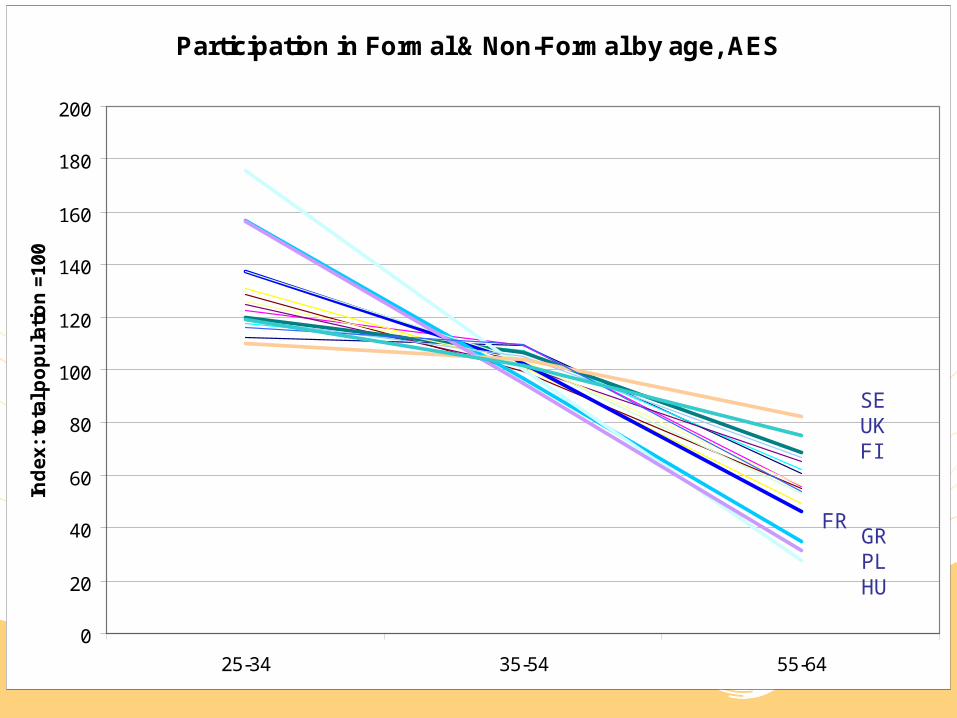
Participation in Formal & Non-Formal by age, AES
0
20
40
60
80
100
120
140
160
180
200
25-34 35-54 55-64
Ind
ex
: to
tal p
op
ula
tio
n =
10
0
GRPLHU
SEUKFI
FR
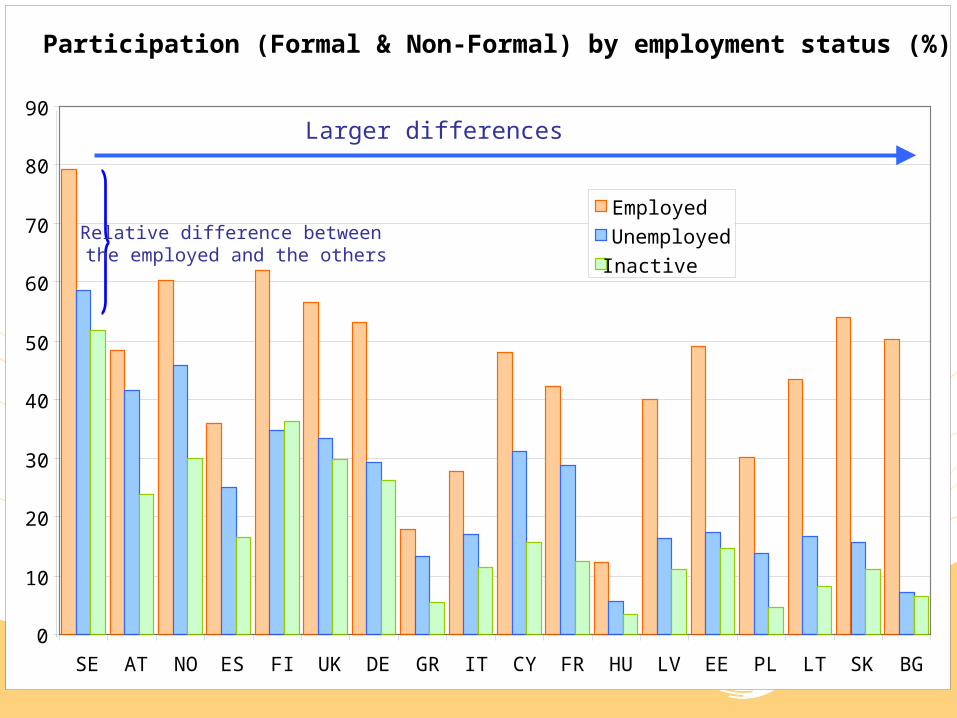
Participation (Formal & Non-Formal) by employment status (%)
0
10
20
30
40
50
60
70
80
90
SE AT NO ES FI UK DE GR IT CY FR HU LV EE PL LT SK BG
Employed
Unemployed
Inactive
Relative difference between the employed and the others
Larger differences
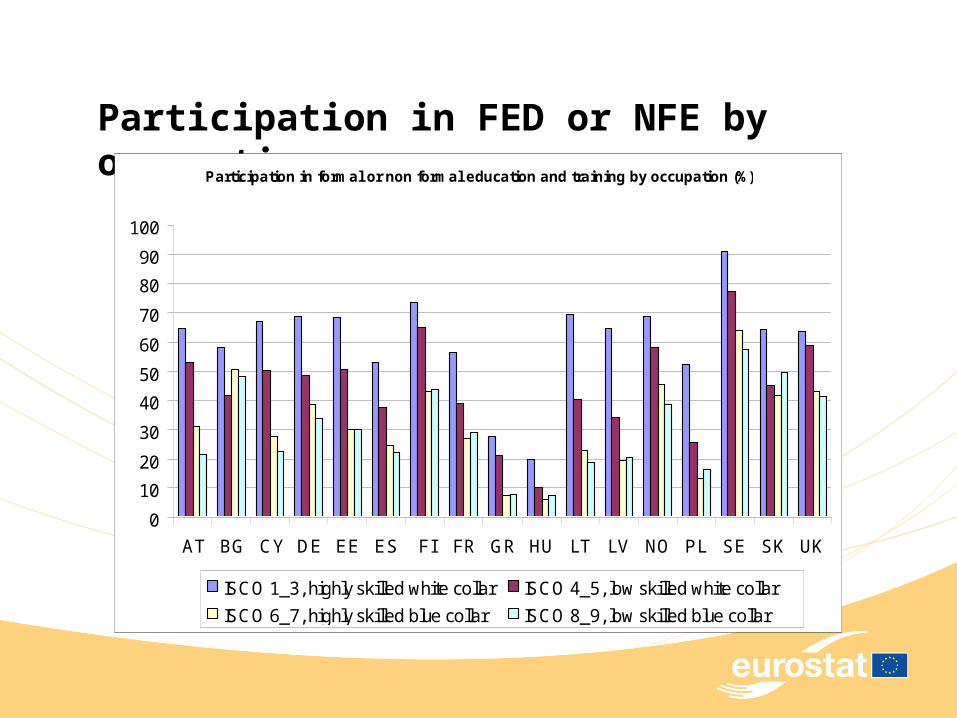
Participation in FED or NFE by occupationParticipation in formal or non formal education and training by occupation (%)
0
10
20
30
40
50
60
70
80
90
100
AT BG CY DE EE ES FI FR GR HU LT LV NO PL SE SK UK
ISCO 1_3, highly skilled white collar ISCO 4_5, low skilled white collar
ISCO 6_7, highly skilled blue collar ISCO 8_9, low skilled blue collar
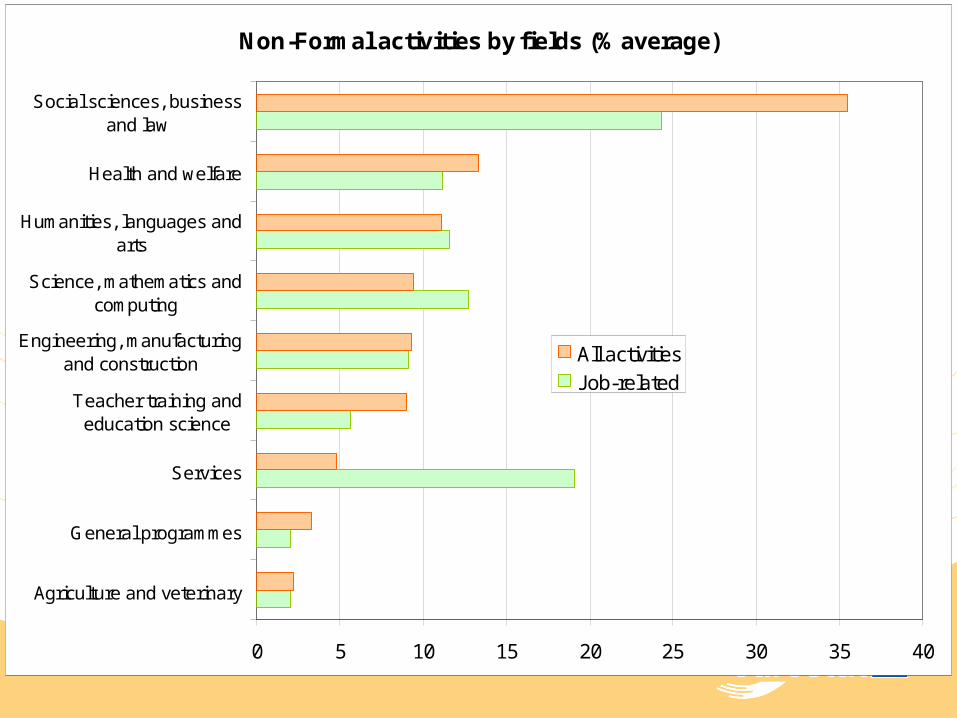
Non-Formal activities by fields (% average)
0 5 10 15 20 25 30 35 40
Agriculture and veterinary
General programmes
Services
Teacher training andeducation science
Engineering, manufacturingand construction
Science, mathematics andcomputing
Humanities, languages andarts
Health and welfare
Social sciences, businessand law
All activities
Job-related
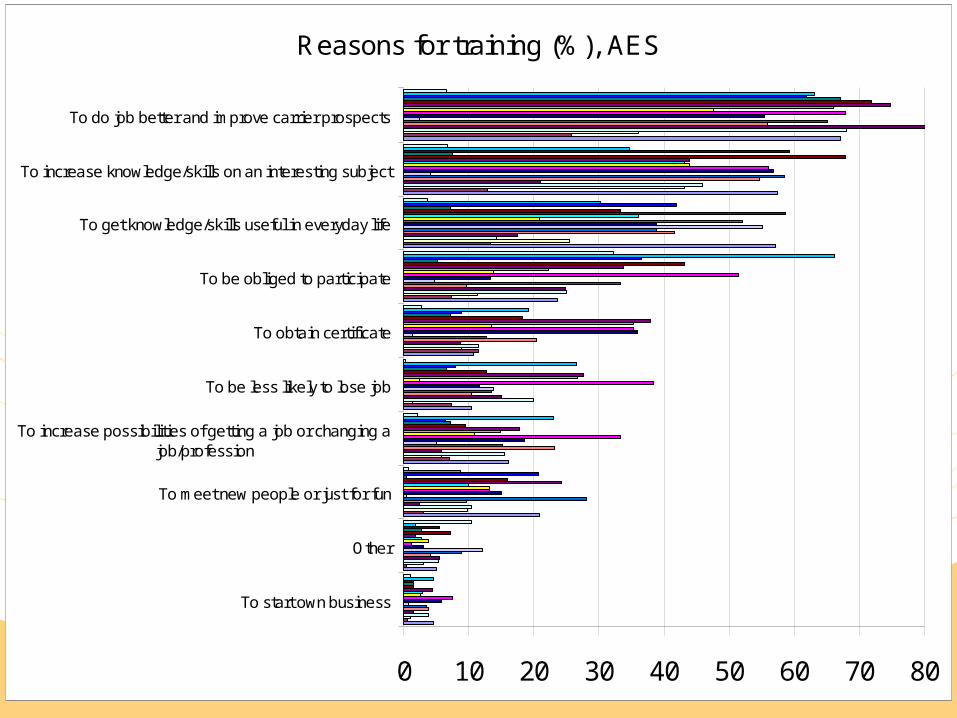
Reasons for training (%), AES
0 10 20 30 40 50 60 70 80
To start own business
Other
To meet new people or just for fun
To increase possibilities of getting a job or changing ajob/profession
To be less likely to lose job
To obtain certificate
To be obliged to participate
To get knowledge/skills useful in everyday life
To increase knowledge/skills on an interesting subject
To do job better and improve carrier prospects
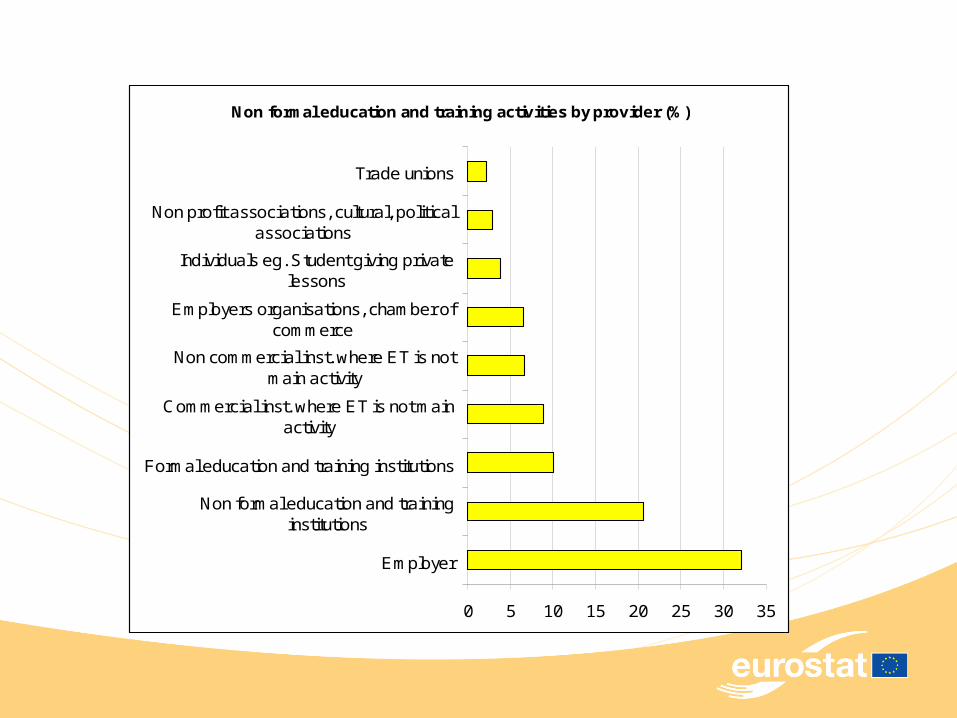
Non formal education and training activities by provider (%)
0 5 10 15 20 25 30 35
Employer
Non formal education and traininginstitutions
Formal education and training institutions
Commercial inst. where ET is not mainactivity
Non commercial inst. where ET is notmain activity
Employers organisations, chamber ofcommerce
Individuals eg. Student giving privatelessons
Non profit associations, cultural, politicalassociations
Trade unions
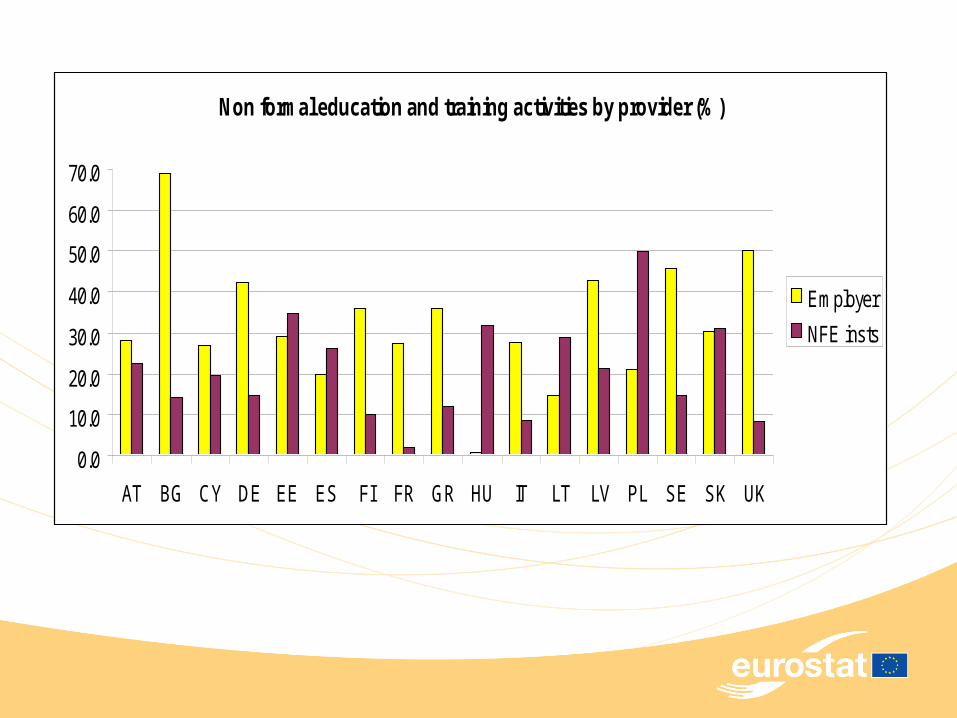
Non formal education and training activities by provider (%)
0.0
10.0
20.0
30.0
40.0
50.0
60.0
70.0
AT BG CY DE EE ES FI FR GR HU IT LT LV PL SE SK UK
Employer
NFE insts
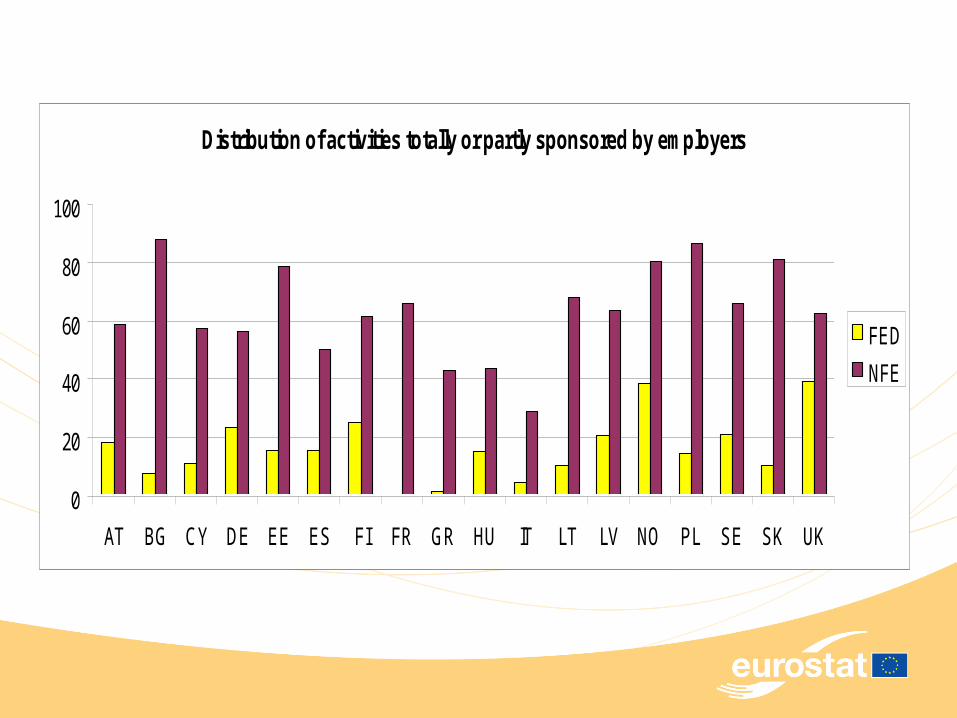
Distribution of activities totally or partly sponsored by employers
0
20
40
60
80
100
AT BG CY DE EE ES FI FR GR HU IT LT LV NO PL SE SK UK
FED
NFE
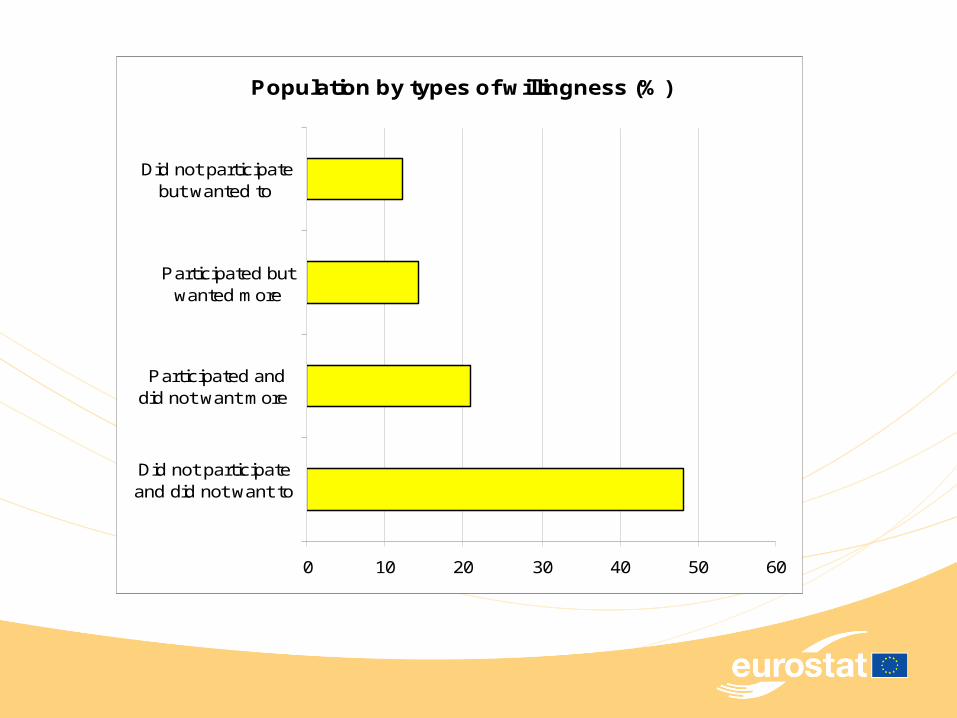
Population by types of willingness (%)
0 10 20 30 40 50 60
Did not participateand did not want to
Participated anddid not want more
Participated butwanted more
Did not participatebut wanted to
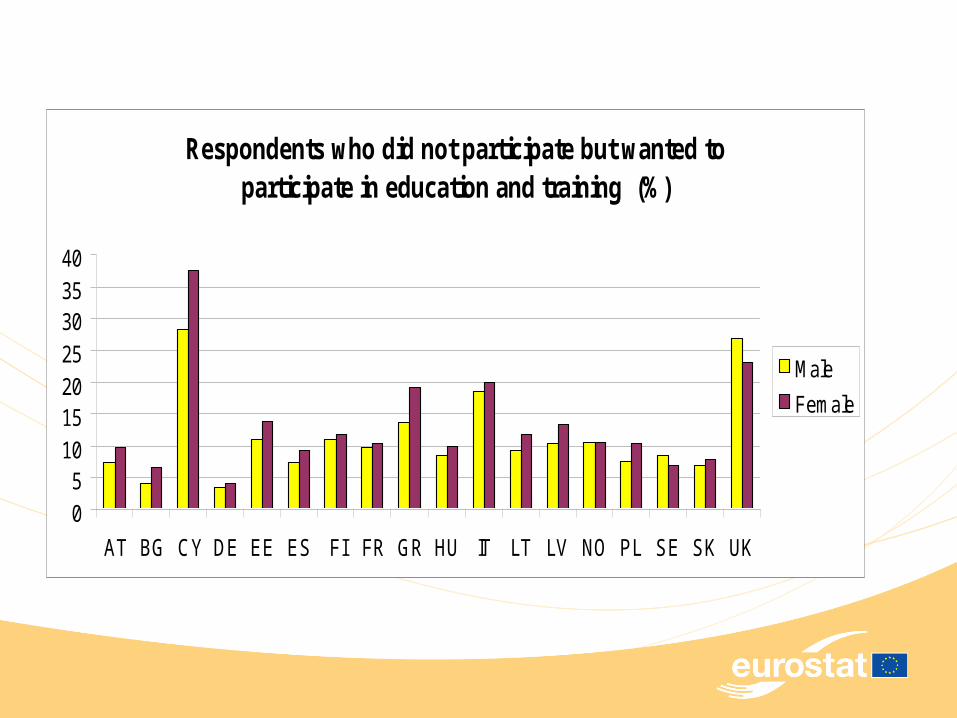
Respondents who did not participate but wanted to participate in education and training (%)
05
10152025303540
AT BG CY DE EE ES FI FR GR HU IT LT LV NO PL SE SK UK
Male
Female
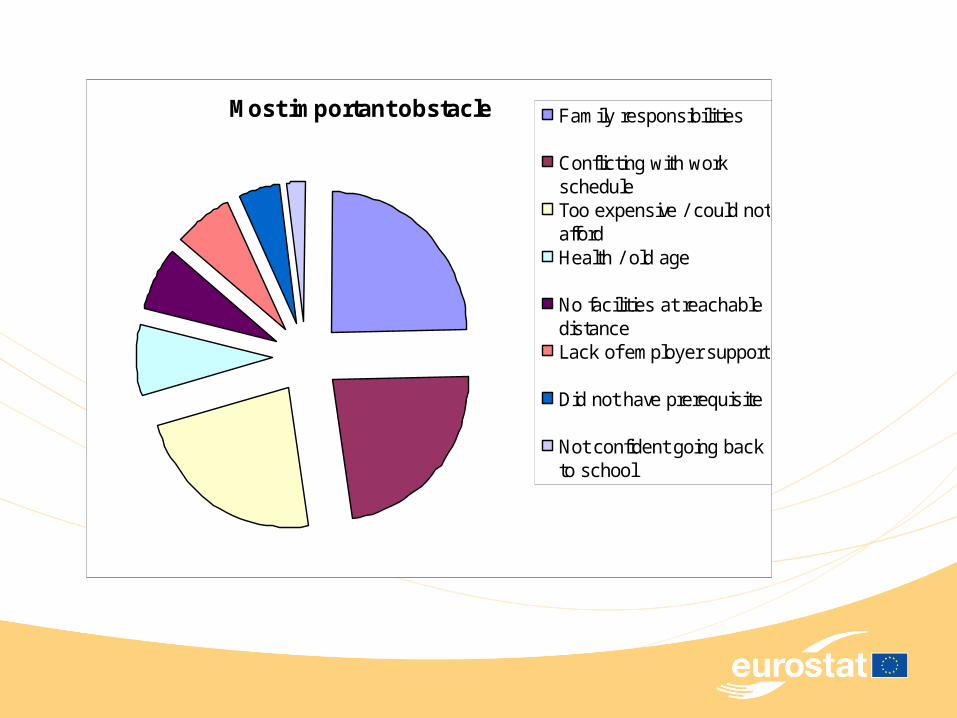
Most important obstacle Family responsibilities
Conflicting with workscheduleToo expensive / could notaffordHealth / old age
No facilities at reachabledistanceLack of employer support
Did not have prerequisite
Not confident going backto school
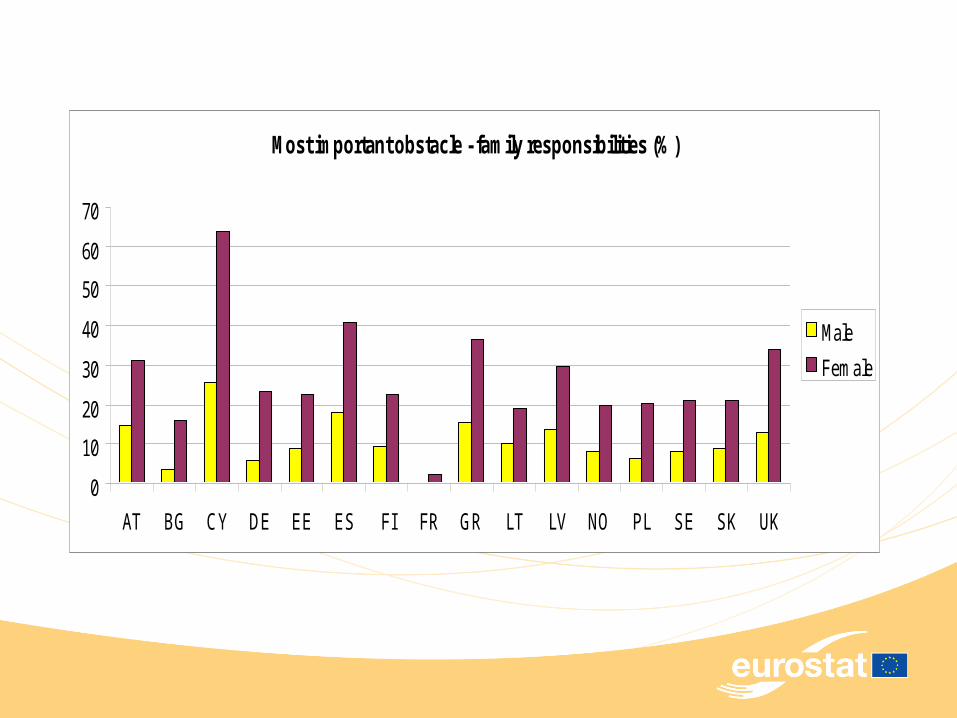
Most important obstacle - family responsibilities (%)
0
10
20
30
40
50
60
70
AT BG CY DE EE ES FI FR GR LT LV NO PL SE SK UK
Male
Female
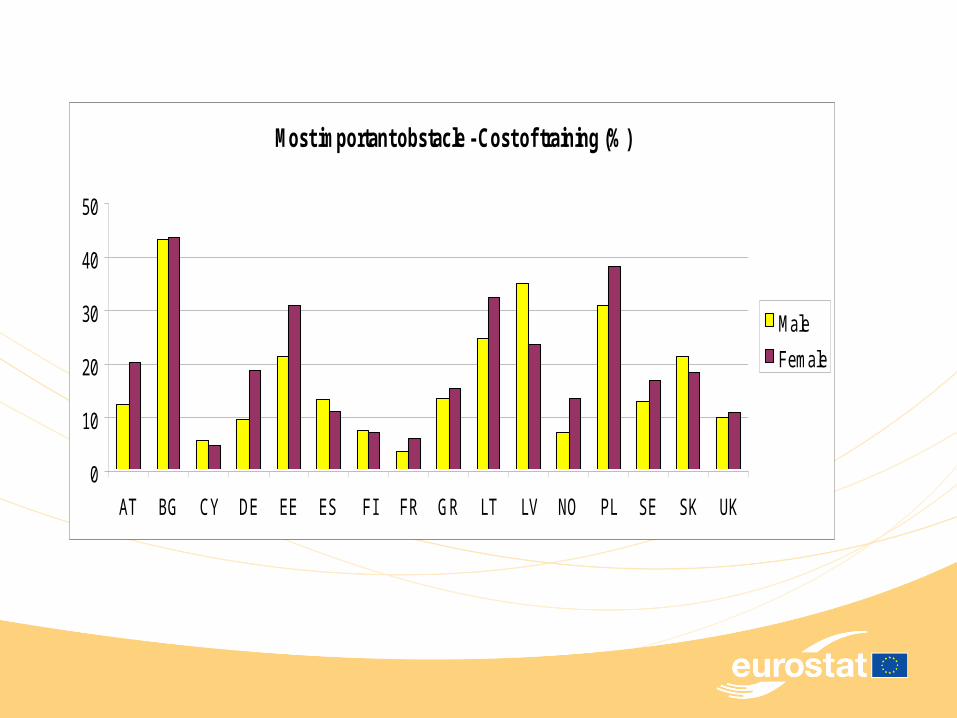
Most important obstacle - Cost of training (%)
0
10
20
30
40
50
AT BG CY DE EE ES FI FR GR LT LV NO PL SE SK UK
Male
Female
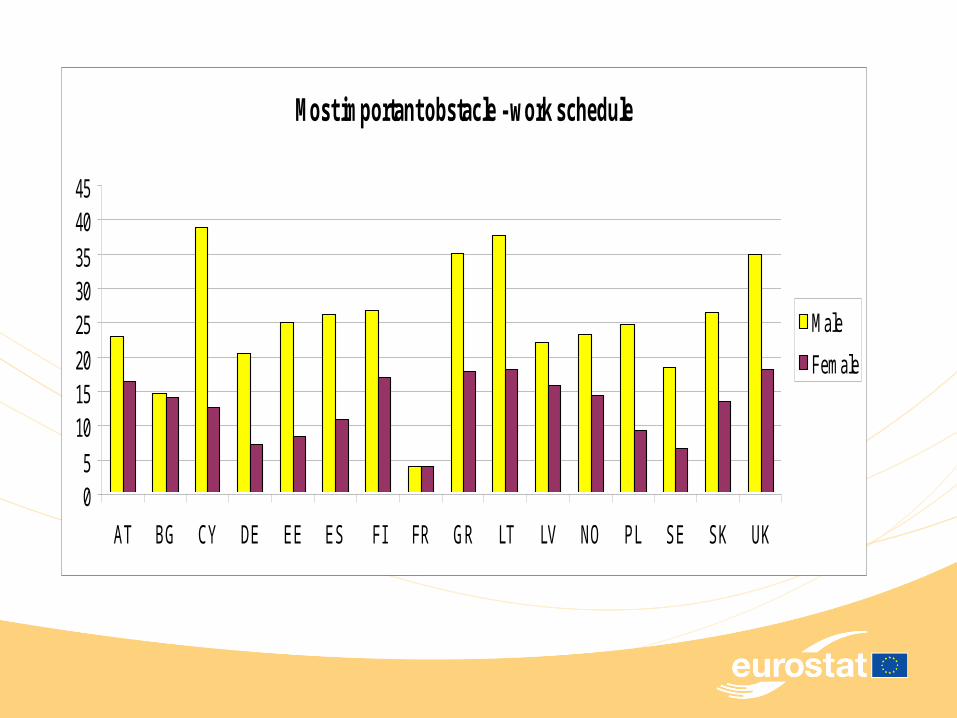
Most important obstacle - work schedule
05
1015202530354045
AT BG CY DE EE ES FI FR GR LT LV NO PL SE SK UK
Male
Female
Further work
Publication of remaining results of pilot AES including– More countries– More indicators– Micro-data for research purposes, first countries
beginnijng of 2009, - all by the end of 2009. Preparation of the next AES surveys to take place in
2011 or 2012. Preparation of a Commission Regulation. Funding
secured. Methodological improvements, - further harmonisation.
- Thank you very much for your attention -